 Hongjian Fan
 Lu Xue
 Hao Ma5
- 1Land Engineering Technology Transformation Center, Shaanxi Provincial Land Engineering Construction Group Co., Ltd., Xi’an, China
- 2Land Engineering Technology Innovation Center, Ministry of Natural Resources, Shaanxi Provincial Land Engineering Construction Group Co., Ltd., Xi’an, China
- 3Institute of Land Engineering and Technology, Shaanxi Provincial Land Engineering Construction Group Co., Ltd., Xi’an, China
- 4College of Life Science, Yulin University, Yulin, China
- 5School of Electronic Information, Xijing University, Xi’an, China
Introduction: The study aims to evaluate the impact of climatological factors on rice yield and methane emissions in Southern Shaanxi’s rice cultivation areas, with the goal of informing effective Climate-Smart Agriculture (CSA) strategies.
Methods: A three-year longitudinal analysis (2017-2019) was conducted, examining the correlation between rice productivity and weather conditions within the agricultural ecosystem. Data on rice yields and methane emissions were collected and analyzed to determine patterns and trends.
Results: Significant correlations were identified between rice yield and weather conditions, with favorable weather for rice growth correlating with higher methane emissions. Methane emissions were particularly high during the vegetative and reproductive stages of rice growth, peaking 60 to 90 days after transplanting. Average emissions for this period were 245.2±80.1 kg CH4 ha-1 in 2017, 274.2±93.9 kg CH4 ha-1 in 2018, and 339.6±50.3 kg CH4 ha-1 in 2019. Total cumulative methane emissions over the entire rice cultivation period were 635.0±177.2 kg CH4 ha-1 in 2017, 661.2±239.2 kg CH4 ha-1 in 2018, and 679.4±205.4 kg CH4 ha-1 in 2019, with no statistically significant interannual differences.
Discussion: The findings highlight the need to balance the goals of reducing greenhouse gas emissions for climate change mitigation with the enhancement of rice yield within CSA practices. The organic link between rice productivity and methane emissions under varying weather conditions suggests that an integrated approach to CSA is essential, considering climate adaptability, productivity, and greenhouse gas reduction. The study’s results contribute to a deeper scientific understanding of local agricultural ecosystems and provide a basis for developing management techniques for CSA.
Conclusion: An integrated approach to CSA that takes into account the interplay between rice yield, methane emissions, and climatological factors is crucial for achieving sustainable agricultural practices in Southern Shaanxi. The study’s insights can guide the development of strategies that enhance both rice productivity and environmental sustainability.
1 Introduction
With the extensive application of sub-surface drip irrigation, Xinjiang has become China’s largest producer of high-quality cotton (Ren et al., 2021; Ding et al., 2023). According to statistics, in 2021, the cotton planting area in Xinjiang was 2.5061 million hectares, with a production of 5.129 million tons, accounting for 82.76 and 89.50% of the national total, respectively. The unique climatic environment of Xinjiang is conducive to the growth and high-quality, high-yield production of cotton (Feng et al., 2017; Zhou et al., 2024). However, water scarcity limits the sustainable production of cotton. Moreover, climate change exacerbates the pressure on the Earth’s available water resources. The Fifth Assessment Report by the Intergovernmental Panel on Climate Change (IPCC) indicates that from 2003 to 2012, the global average surface temperature rose by 0.78°C compared to the period from 1850 to 1900, and it is projected to increase by 4.8°C by 2,100. Precipitation in arid regions may decrease, while it may increase in humid areas. In the northwest region of China, by the end of the 21st century (2081–2,100), under extreme conditions, the average temperature may change by 1.5–2.0°C, and the average precipitation may change by 10 to 20%. The warming may lead to an increase in crop evapotranspiration, resulting in a 70–90% increase in irrigation water demand (Tanasijevic et al., 2014; Saadi et al., 2015; Li et al., 2020). Climate change directly affects cotton yield by damaging morphological development and plant growth, which is undoubtedly a double blow to the sustainable production of cotton in Xinjiang (Chen and Dong, 2016; Khalid et al., 2023). Therefore, measures should be taken to mitigate the impact of climate change on agricultural production, such as selecting the optimal planting time for crops (Bisbis et al., 2018) and formulating irrigation strategies to ensure improved water productivity (Kang et al., 2017).
Considering the complexity of the agricultural ecosystem and the limitations of field experiments, using crop growth models to simulate crop growth processes and yields is an important approach to addressing the impacts of climate change and human activities and achieving water-saving and increased agricultural production (Zou et al., 2020; Surendran et al., 2021). Crop growth models are quantitative and dynamic mechanistic models that integrate knowledge and research results from disciplines such as crop physiology, ecology, agricultural meteorology, and soil science to describe crop production. They have been widely used in predicting crop production potential and guiding agricultural irrigation, fertilization, and cultivation management practices (Zinkernagel et al., 2020). The AquaCrop model, developed by the Food and Agriculture Organization (FAO) of the United Nations, is a water-driven crop growth model specifically designed for arid and semi-arid regions in developing countries in Africa and Asia (Kim and Kaluarachchi, 2015; Foster et al., 2017). It transforms water productivity into biomass and then into yield through the harvest index, with advantages such as fewer input parameters, a wide range of applications, and high accuracy (Kim and Kaluarachchi, 2015; Foster et al., 2017; Zinkernagel et al., 2020). Previously, scholars have applied the AquaCrop model to crops such as wheat (Andarzian et al., 2011; Jin et al., 2014), barley (Araya et al., 2010), quinoa (Abrha et al., 2012), soybeans (Khoshravesh et al., 2013), corn (Abedinpour et al., 2012), cotton (Linker et al., 2016), and sugar beets (Stricevic et al., 2011), conducting research on crop growth, development, biomass, and yield under different irrigation systems (Greaves and Wang, 2016), irrigation methods (Geerts et al., 2010), and covering methods (Sandhu and Irmak, 2019). However, there are few reports on how to optimize irrigation strategies and adjust planting dates to improve the sustainability and profitability of cotton production under limited available water resources. Although the AquaCrop model has been localized in arid and semi-arid regions and has made certain progress in verification and application, there is less research on the growth and yield of cotton in arid regions, such as southern Xinjiang, and its response to climate change. Therefore, this study takes the cotton under mulch drip irrigation in the oasis area as the research object, localizes the parameters of the AquaCrop model, verifies the applicability of the model in simulating the growth and yield of cotton under mulch drip irrigation, simulates the impact of different irrigation and planting dates on the accumulation of cotton biomass and yield based on 30 years of meteorological data from 1988 to 2017, and analyzes the stability and sustainability of cotton yield. The aim is to provide a basis for optimizing irrigation strategies and adjusting planting dates to improve the sustainability and profitability of cotton production under limited water resources.
2 Materials and methods
2.1 Experimental area overview
The experimental area is located in Aksu City, near the confluence of the three main sources of the Tarim River (Aksu River, Yarkand River, and Hotan River) in the plain desert oasis, which belongs to a typical inland extremely arid climate. The multi-year average precipitation is 50 mm, the annual evaporation is 2,218 mm, the annual average sunshine duration is 2,950 h, the frost-free period averages 207 days, and the annual average temperature is 11.3°C, making it a typical irrigated agricultural area.
2.2 Field experiments
Starting from the cotton bud stage, the irrigation frequency was determined using meteorological information, and irrigation was conducted when the difference between the evapotranspiration and precipitation reached 30 mm (Conaty et al., 2015). Currently, the irrigation quota for cotton under mulch drip irrigation in southern Xinjiang is around 30 mm, with slight variations across different regions, but the difference is not significant. Based on this, three irrigation quotas for cotton under mulch drip irrigation were set, namely T1: 30 × 0.8 = 24 mm, T2: 30 × 1.0 = 30 mm, T3: 30 × 1.2 = 36 mm, as shown in Table 1. Each treatment was replicated three times, totaling nine plots.

Table 1. Cotton irrigation scheduling in 2017 and 2018.
The cotton sowing date in 2017 was April 3, and all cotton was harvested by October 1. In 2018, the sowing date was April 15, and all cotton was harvested by October 12. The cotton variety was “Xin Lu Zhong 46,” and the experimental plot area was 154 square meters. The planting pattern was 1 film, 2 rows, and 6 rows, with row spacing of 10 cm + 66 cm + 10 cm + 66 cm + 10 cm, and plant spacing of 10 cm, as shown in Figure 1. The drip tape specification was φ16, with a drip head spacing of 20 cm and a rated flow of 3.0 L·h−1, at a pressure of 0.1 MPa. Fertilization, pesticide spraying, and other agronomic practices were implemented according to local conventional practices.
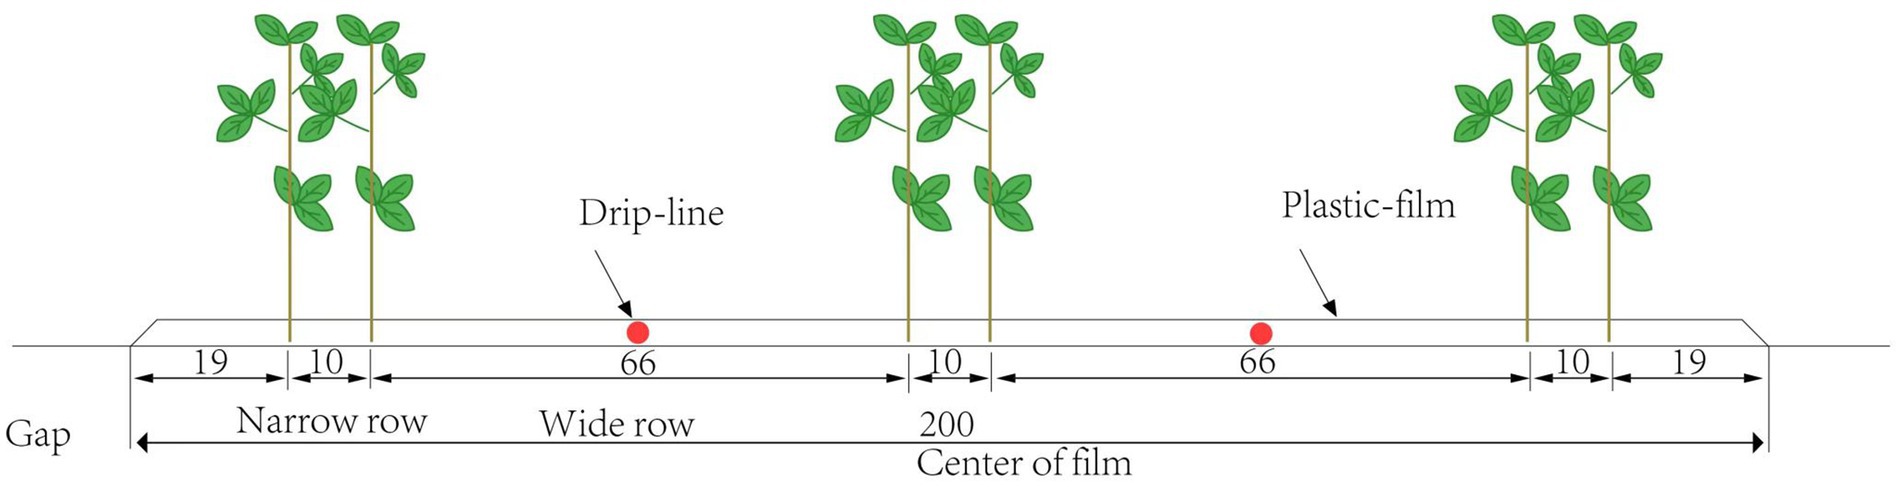
Figure 1. Schematic diagram of cotton planting pattern (unit: cm).
2.3 AquaCrop model and scenario simulation
2.3.1 Model principle
The AquaCrop model is composed of meteorological, soil, crop, and management modules, which can simulate biomass and yield based on the amount of water lost from the canopy through transpiration under controlled environmental conditions (Stricevic et al., 2011). Seed cotton yield (Y, t·hm−2) is shown in Equation 1:
Where B is the biomass at harvest (t·hm−2), and HI is the harvest index (%), which is the percentage of seed cotton yield to the aboveground dry biomass.
The total biomass for the entire growth season is the water productivity (WP*, g·m−2) multiplied by the ratio of daily average transpiration (Tr, mm) to the reference crop evapotranspiration (ET0, mm), as shown in Equations 2 and 3:
Where KS is the soil water stress coefficient that integrates the effects of waterlogging, stomatal closure, and early senescence; CC* is the canopy cover percentage considering the effects of canopy shading and air movement; KCTr,x is the crop coefficient for maximum plant transpiration; ET0 is the reference crop evapotranspiration, calculated using the FAO Penman–Monteith method; WP* is the crop water productivity adjusted for atmospheric CO2 concentration and climate, which is the crop water productivity divided by the crop evapotranspiration under standard evapotranspiration conditions.
2.3.2 Model database
2.3.2.1 Meteorological data
Meteorological data were continuously measured by a standard automatic weather station (Hobo, United States) located near the experimental site, recording data every 10 min. The meteorological data for the 2017 and 2018 experimental periods are shown in Figure 2.
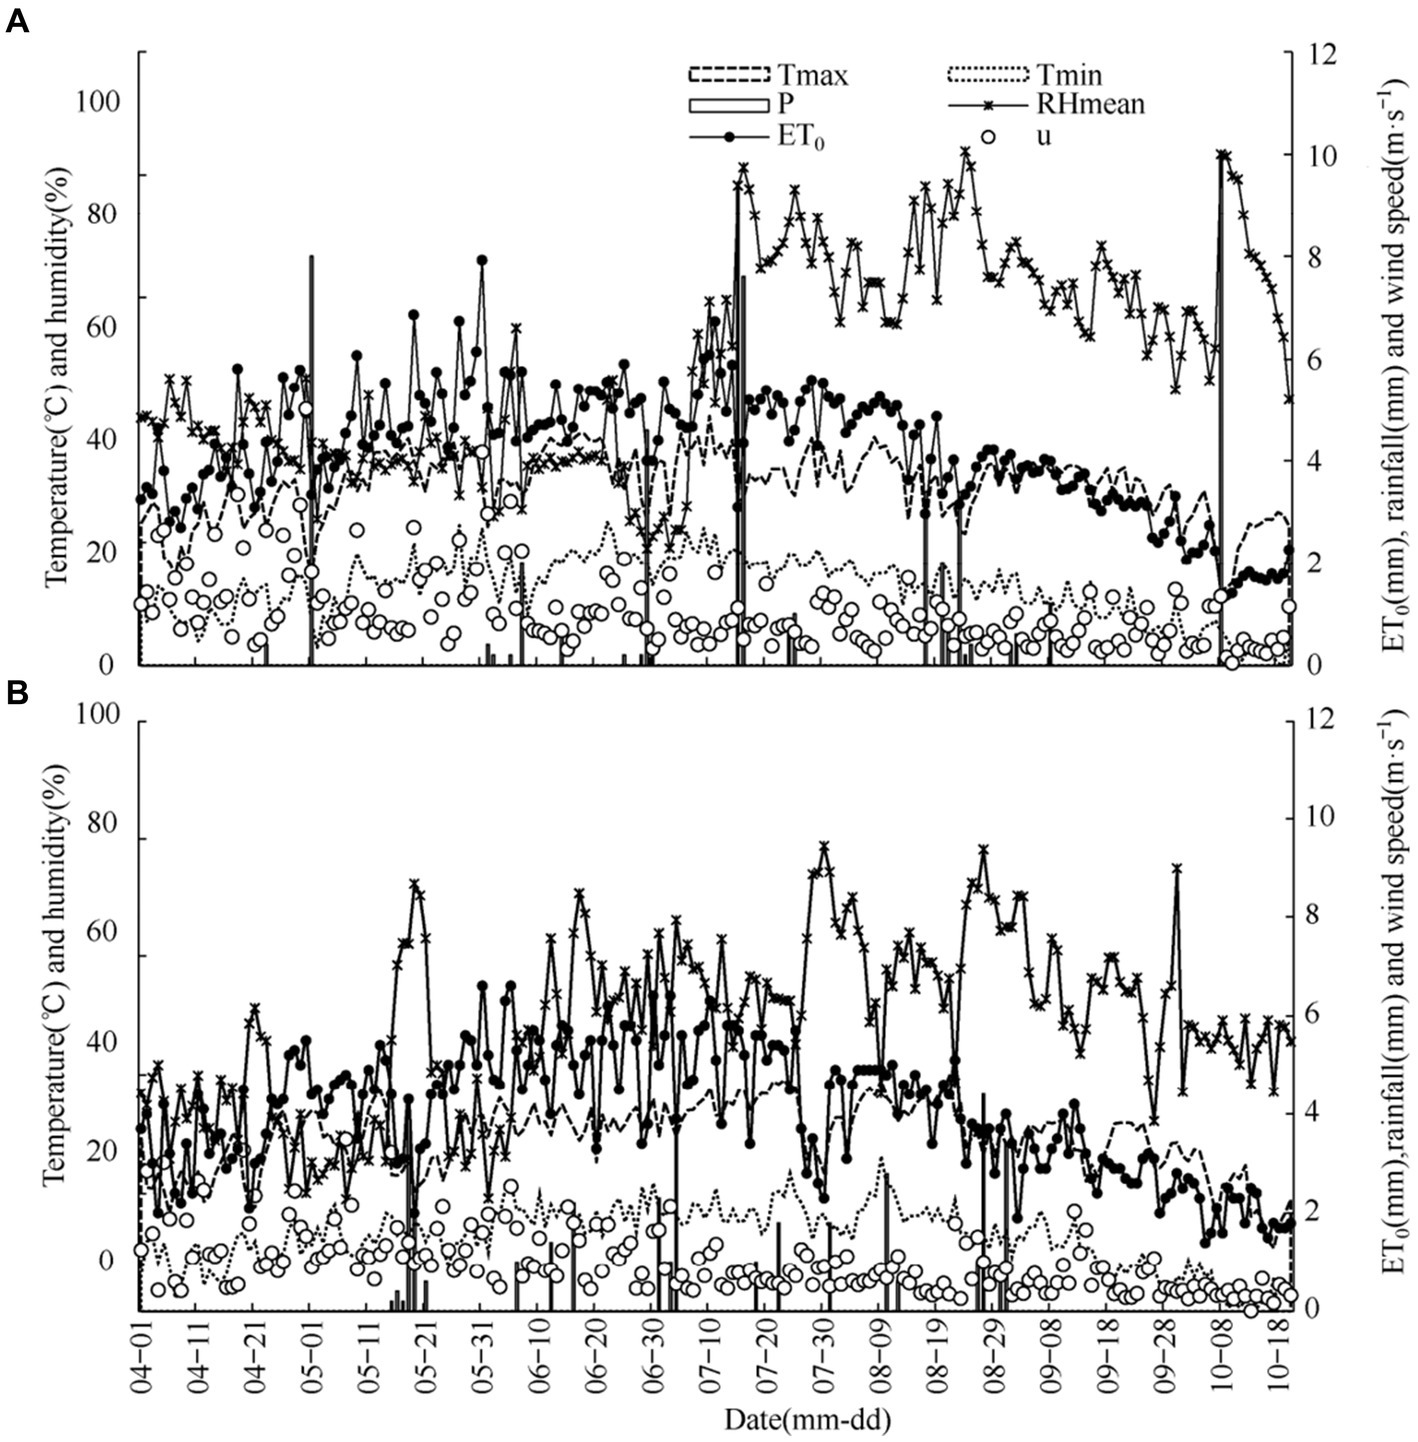
Figure 2. Daily change process of meteorological data in cotton growing season in 2017 (A) and 2018 (B).
2.3.2.2 Soil data
Table 2 shows the soil physical property data obtained from soil samples taken before cotton sowing, as determined by the Key Laboratory of Crop Water and Regulation, Ministry of Agriculture and Rural Affairs, and input into the AquaCrop model to generate a soil data file.
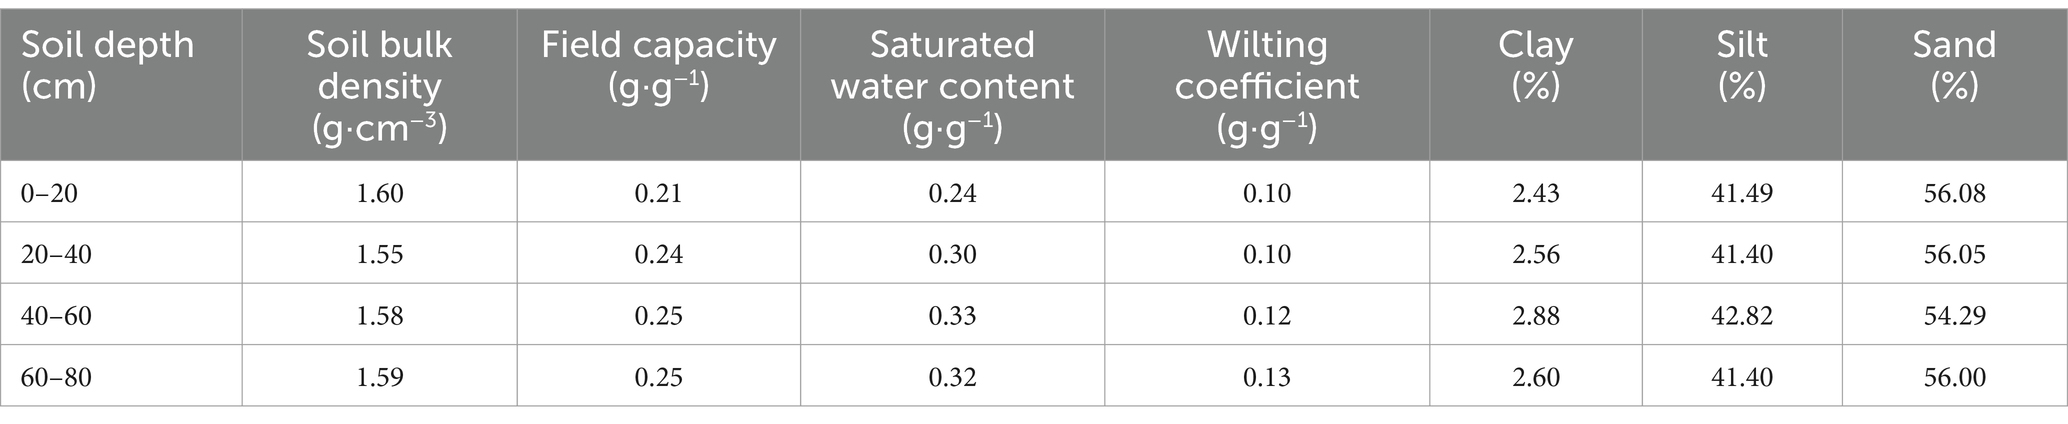
Table 2. Daily change process of meteorological data in cotton growing season in 2017(a) and 2018(b).
2.3.2.3 Field management data
Management data include irrigation plans and field management. Irrigation data are based on actual irrigation times and quotas (Table 1) to establish an irrigation parameter database. Field management data for weed control, pest management, fertilization, and covering are created using local cotton field management practices to create a field management database.
2.3.3 Model evaluation
The outputs of the AquaCrop model are evaluated using the root mean square error (RMSE), normalized root mean square error (NRMSE), synergy index (d), and relative error (RE), as shown in Equations 4–7:
Where Pi is the predicted value, Oi is the measured value, is the average of the measured values, and n is the number of samples. The smaller the NRMSE, the higher the simulation accuracy; NRMSE <10% indicates excellent simulation effect; 10% < NRMSE <20% indicates good simulation effect; 20% < NRMSE <30% indicates reasonable simulation effect; NRMSE >30% indicates poor simulation effect. The smaller the RE, the higher the simulation accuracy. The closer d is to 1, the higher the model’s accuracy.
2.3.4 Scenario simulation
Based on the cotton irrigation quota of 30 mm and the sowing date at the beginning of April in the southern Xinjiang oasis, with slight variations across different regions, six irrigation levels were set: 18 mm (TS1), 24 mm (TS2), 30 mm (TS3), 36 mm (TS4), 45 mm (TS5), and 54 mm (TS6) for a total of six irrigation quotas. Five planting date treatments were set as March 23 (D1), April 3 (D2), April 13 (D3), April 23 (D4), and May 3 (D5), as detailed in Table 3.
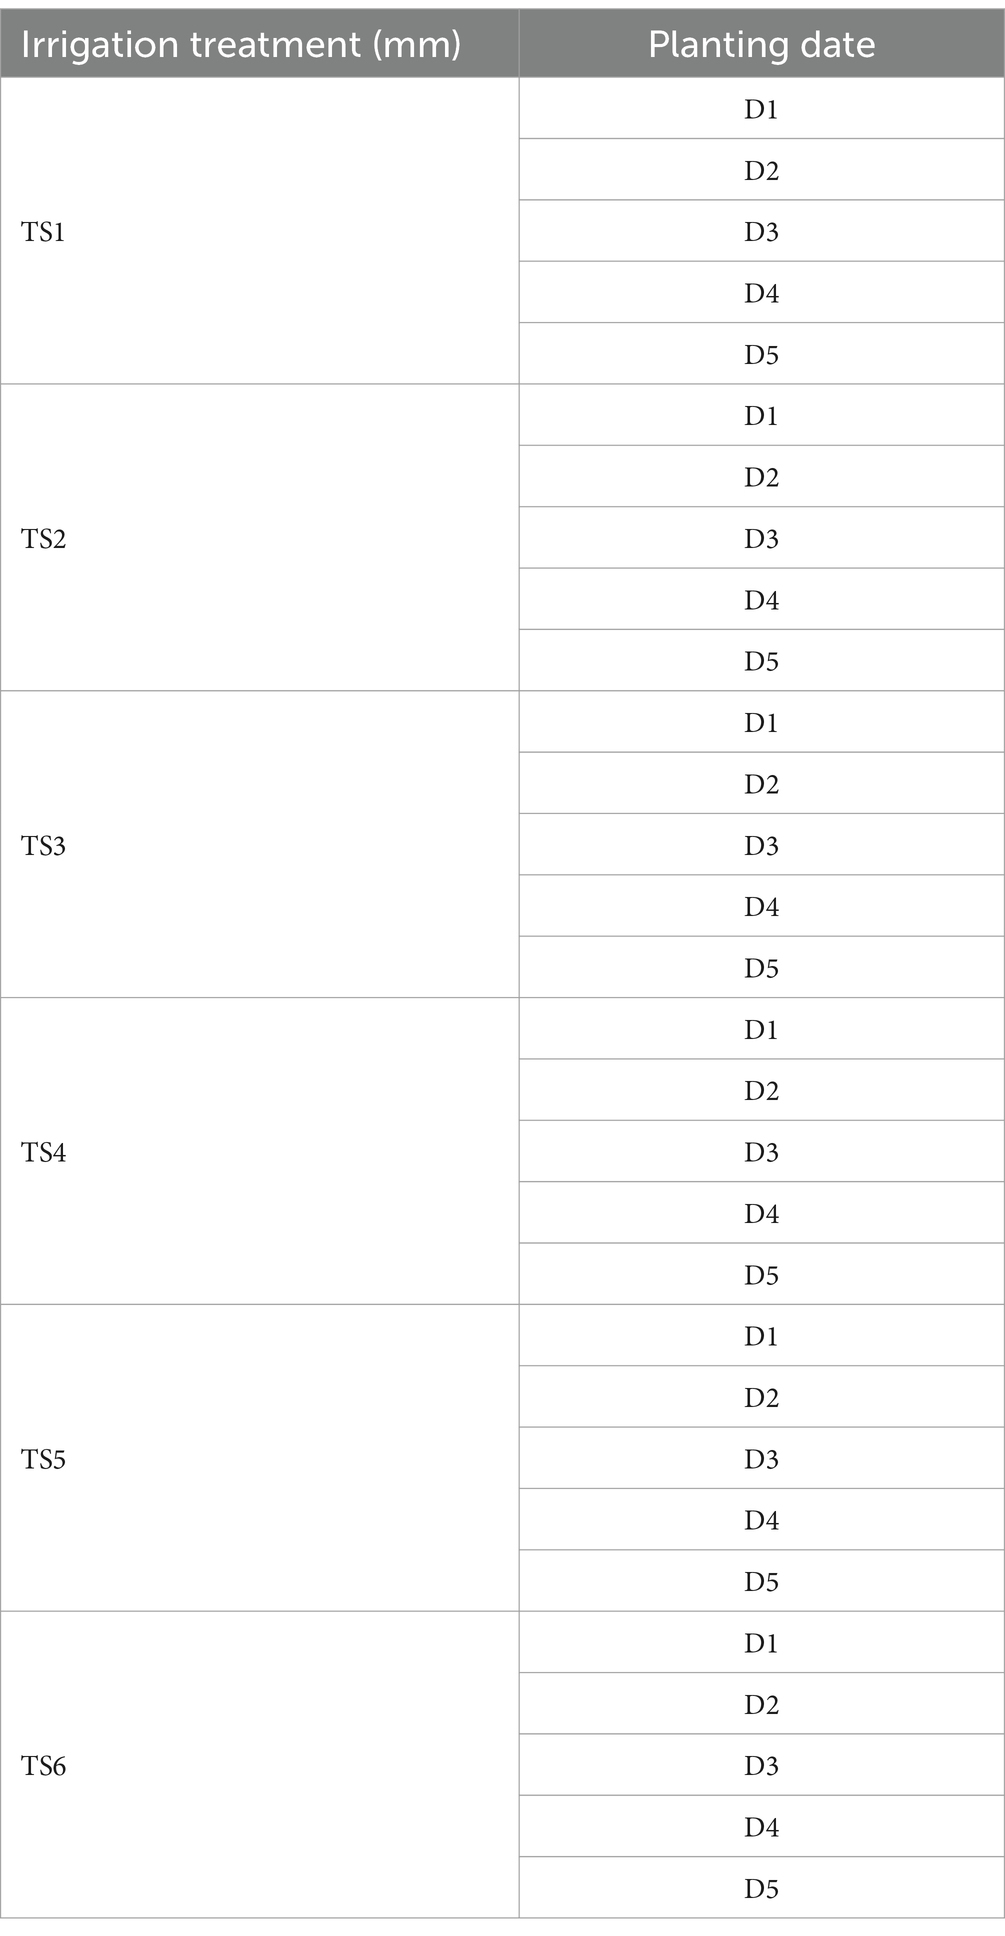
Table 3. Simulation scenarios set in AquaCrop model.
2.4 Evaluation of yield sustainability
Using the meteorological data from 1988 to 2017 (sourced from the China Meteorological Administration), the AquaCrop model was used to simulate the yield of cotton under different irrigation and sowing scenarios. The sustainability of cotton production was evaluated using the Sustainability Index (SYI), with higher values indicating better sustainability; the stability of yield was represented by the coefficient of variation (CV), with higher CV values indicating lower stability. Equations 8 and 9 are as follows:
Where Ymean is the average yield (t·hm−2), S is the standard deviation of yield, and Ymax is the maximum yield (t·hm−2).
3 Results
3.1 AquaCrop model cotton parameter tuning results
Based on the calibration procedure by Vanuytrecht et al. (2014), the AquaCrop crop growth model outputs for canopy cover, aboveground biomass, soil moisture, cotton yield, and evapotranspiration (ET) were calibrated using the 2018 field trial data. The 2017 field trial data were used for validation. The statistical error indicators (Table 4) were used to select the parameter corresponding to the smallest error as the crop parameter for this variety. The results are shown in Table 5. It can be seen from the table that, compared with the recommended parameter values in the model, all parameter values for the Xin Lu Zhong 46 cotton variety were adjusted to some extent, except for the “upper limit temperature.” As shown in Table 4, the simulation accuracy for canopy cover, aboveground biomass, and soil moisture in 2018 was relatively high, with the NRMSE for each treatment being less than 15%, and both d and R2 approaching 1. For the simulation of cotton yield and ET, the NRMSE was less than 10%, R2 approached 1, and the d value was relatively low. The table also shows that, compared with the 2017 field trial data, the AquaCrop model overestimated the canopy cover rate, aboveground biomass, and soil moisture, with an average RE of 10.15, 8.80, and 0.45%, respectively, while it underestimated the actual transpiration and yield of cotton for each treatment, with an average RE of −7.46% and −1.18%. The comprehensive analysis indicates that the AquaCrop model can accurately simulate the canopy cover, aboveground biomass, and seed cotton yield of cotton.
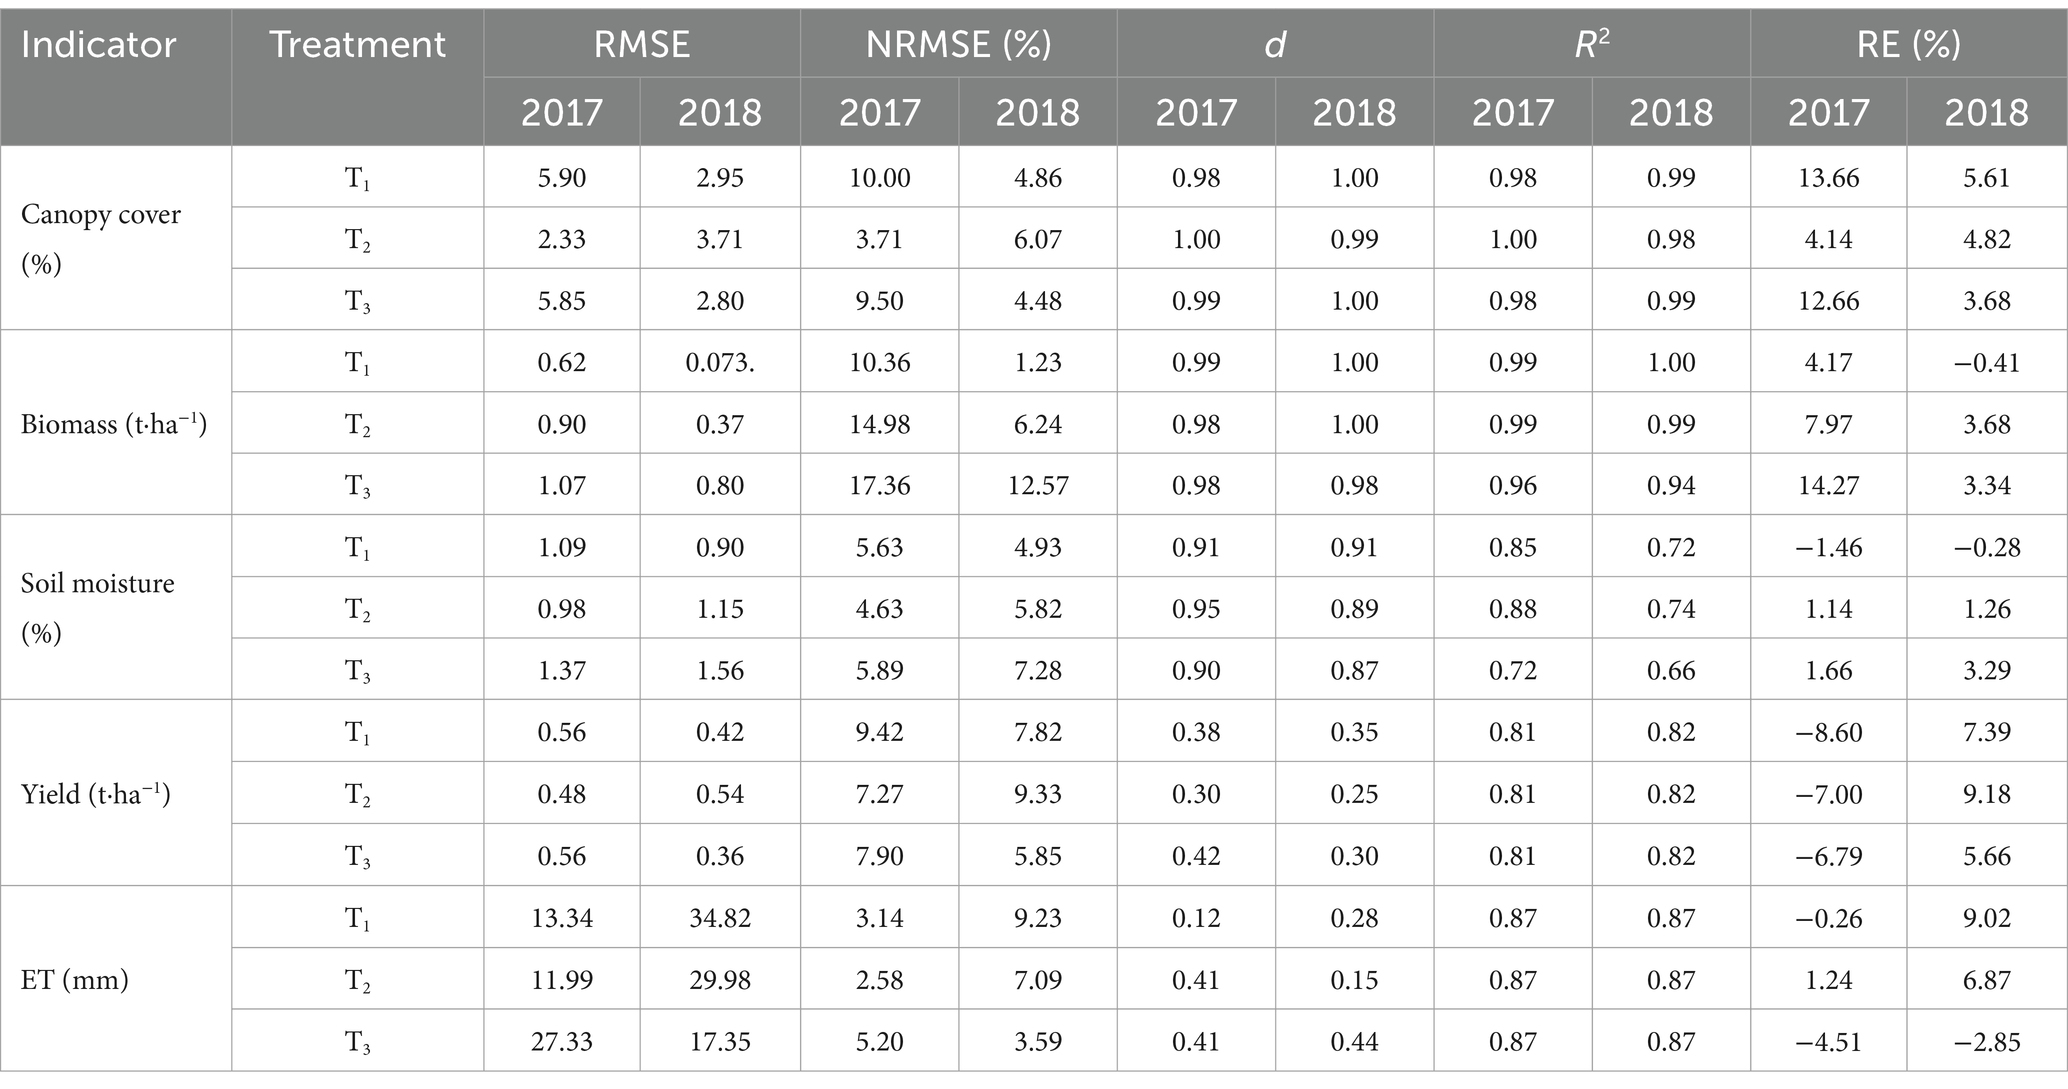
Table 4. Calibration and validation of AquaCrop model.
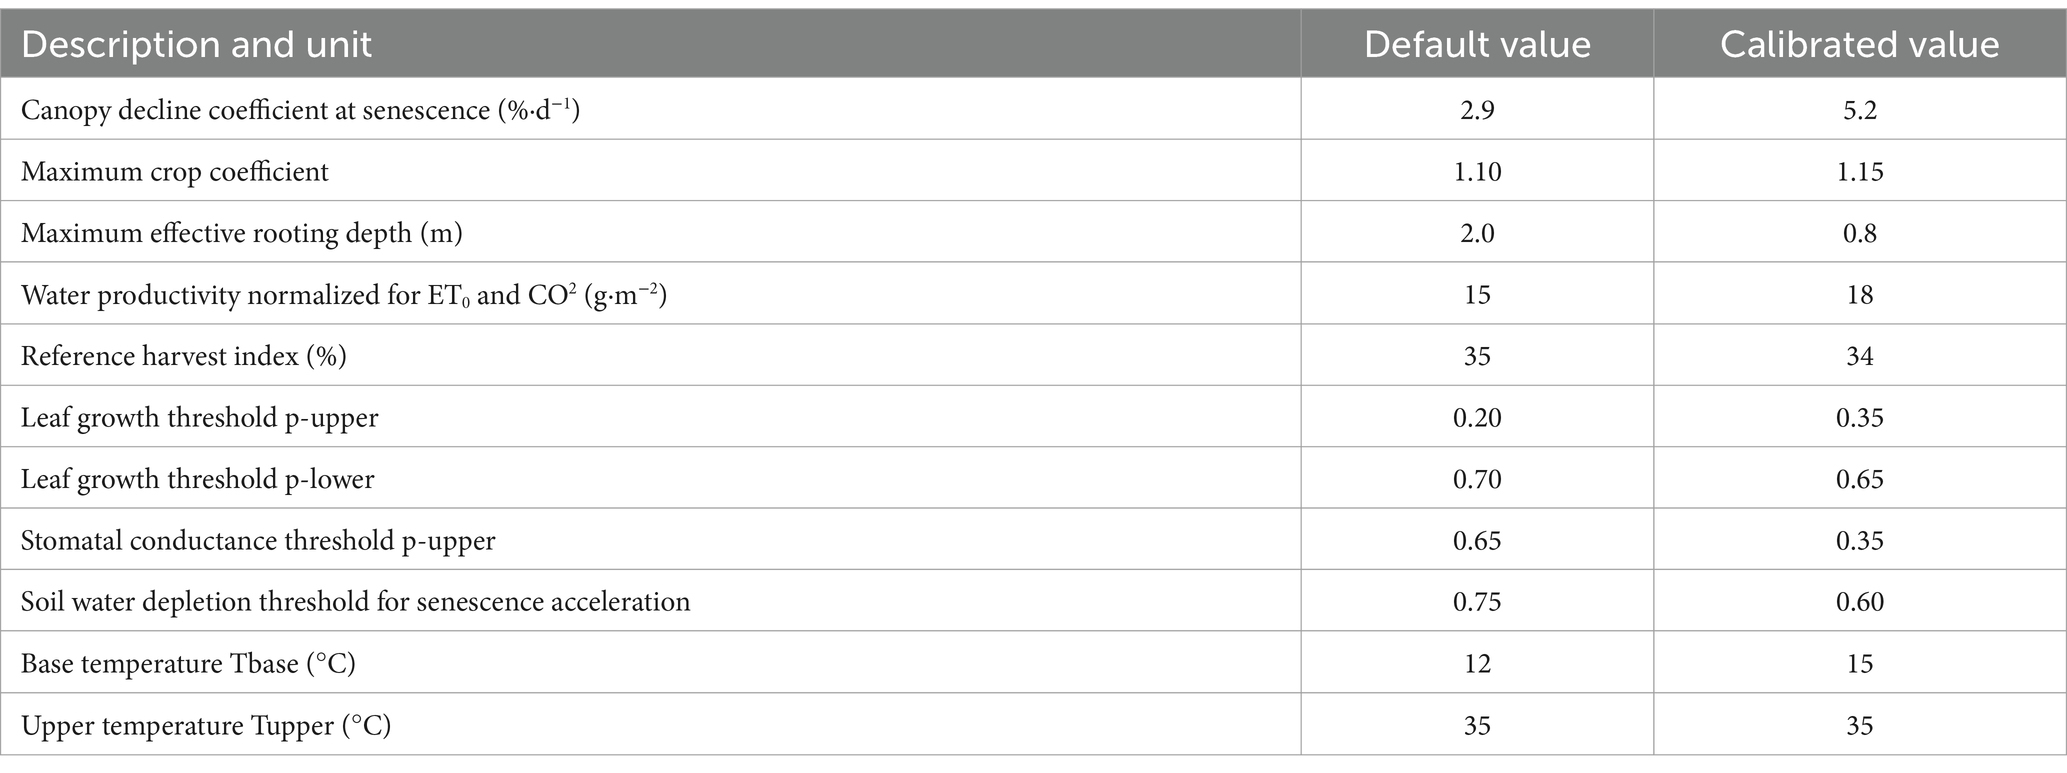
Table 5. Crop parameters of AquaCrop model.
3.2 Simulation results of cotton biomass and yield under different irrigation and planting scenarios
Using the meteorological data from 1988 to 2017 and based on the AquaCrop model, the effects of irrigation and planting dates on the aboveground biomass and yield of cotton in the oasis area were simulated (Figure 3). Figure 3A shows that when the planting date is the same, cotton yield increases with the increase in the irrigation quota. The cotton yield for treatments TS2-TS6 increased by 18.7, 34.6, 45.9, 51.9, and 52.3%, respectively, compared to treatment TS1. For planting dates D1–D3, treatments TS5 and TS6 significantly outperformed TS1–TS4, while for dates D4 and D5, treatments TS4–TS6 significantly outperformed TS1–TS3, but there was no significant difference between treatments TS4–TS6. Figure 3A also shows that under the same irrigation quota, cotton yield changes regularly with the delay in planting dates. The yield for treatments TS1 and TS2 increased with delayed planting dates, with D4 and D5 significantly outperforming D1 and D2. For treatments TS3–TS6, cotton yield first increased and then decreased with delayed planting dates, with TS5–TS6 treatments reaching peak yields at D2, significantly outperforming D5, while TS3–TS4 treatments reached peak yields at D4 and D3, respectively.
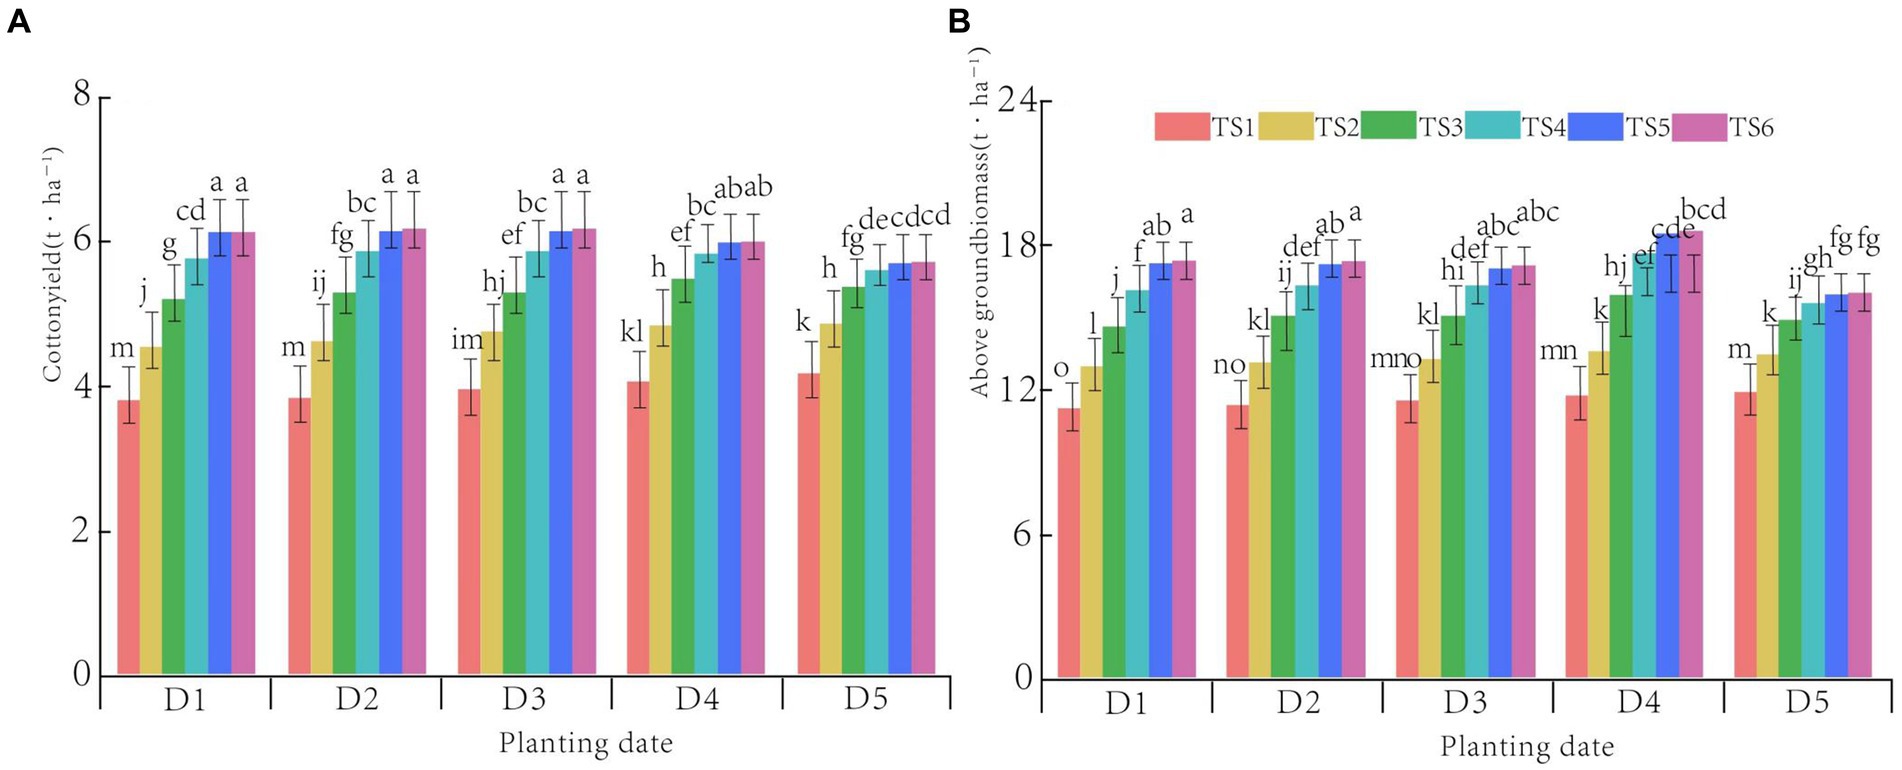
Figure 3. Comparison of simulation results of cotton yield and aboveground biomass at different sowing dates using different irrigation systems simulated by the AquaCrop model (Average value in 1988−2017). (A) Cotton yield under different scenarios; (B) Aboveground biomass under different scenarios. Lowercase indicates the significance difference among treatments at the 0.05 level. The short line represents the standard error.
Figure 3B shows that when the planting date is the same, the trend of change in cotton biomass with the increase in irrigation quota is consistent with that of yield. That is, under the same planting date, as the irrigation quota increases, cotton biomass tends to increase. The biomass for treatments TS2–TS6 increased by 15.4, 29.5, 39.6, 45.8, and 16.7%, respectively, compared to TS1, with TS5–TS6 treatments significantly outperforming TS1–TS3. Figure 3B also shows that the biomass for TS1 increased with delayed planting dates, with D4 and D5 significantly outperforming D1; for TS2–TS4, as the planting date was delayed, the biomass first increased and then decreased, with D4 significantly outperforming D1 under TS2–TS3 irrigation, while under TS4 irrigation, D5 was significantly lower than D1; for TS5–TS6, the biomass decreased with delayed planting dates, with D1–D3 significantly outperforming D4. Overall, a higher irrigation quota is beneficial for the formation of cotton biomass and yield, while the response to different irrigation quotas varies with planting dates.
3.3 Evaluation of sustainability and stability of simulated cotton yield under different scenarios
The interannual variability, stability, and sustainability of cotton yield from 1988 to 2017 are shown in Figures 4, 5. It can be seen from the figures that the amplitude of interannual variability in cotton yield (Figures 4A–E) decreases with the increase in irrigation quota. Treatments TS5 and TS6 had higher stability, with an average variation coefficient (CV) of 4.6 and 4.8%, respectively, which is a reduction of 55.0 and 56.6% compared to treatment TS1. The sustainability of cotton production also increased with the increase in irrigation quota, with the average Sustainability Index (SYI) for treatments TS4–TS6 being greater than 0.8, indicating good sustainability. It can also be seen that the interannual stability of cotton yield increases with delayed planting dates, with an average CV of 5.94% for treatment D5, which is a reduction of 7.1% compared to D1. The impact of different planting dates on the sustainability of cotton production is relatively small, with the average SYI for treatments TS1–TS6 being greater than 0.8. The comprehensive analysis shows that the planting date has a smaller impact on the stability and sustainability of cotton production, while the impact of irrigation is greater.
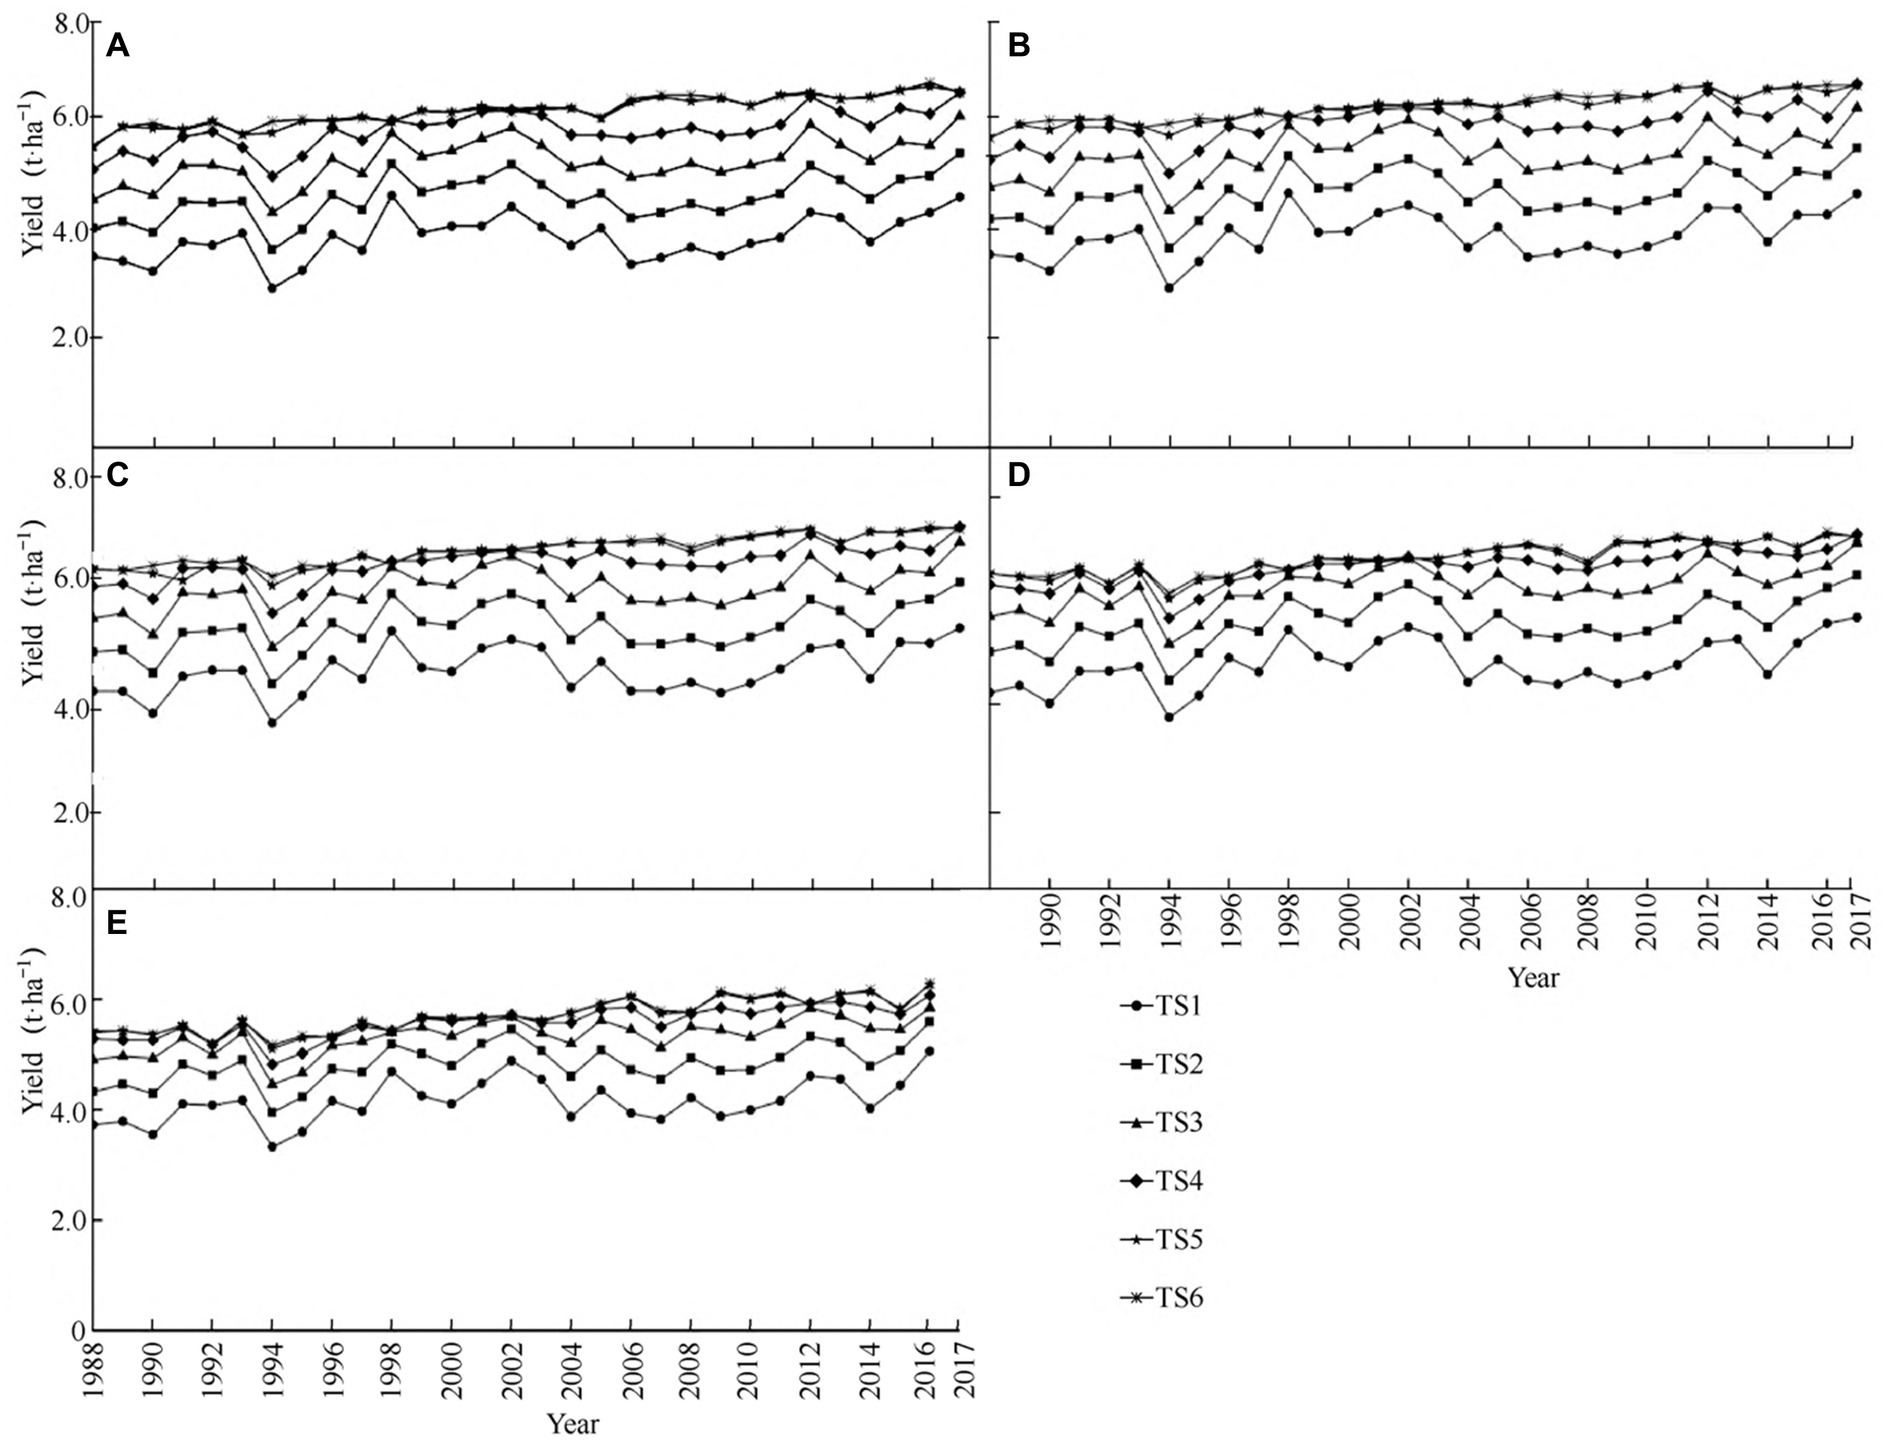
Figure 4. Comparison of annual change in cotton yield under different scenarios from 1988 to 2017. (A) Scenario TS1; (B) Scenario TS2; (C) Scenario TS3; (D) Scenario TS4; (E) Scenario TS5. Note: The standard error is represented by the short line in each graph.
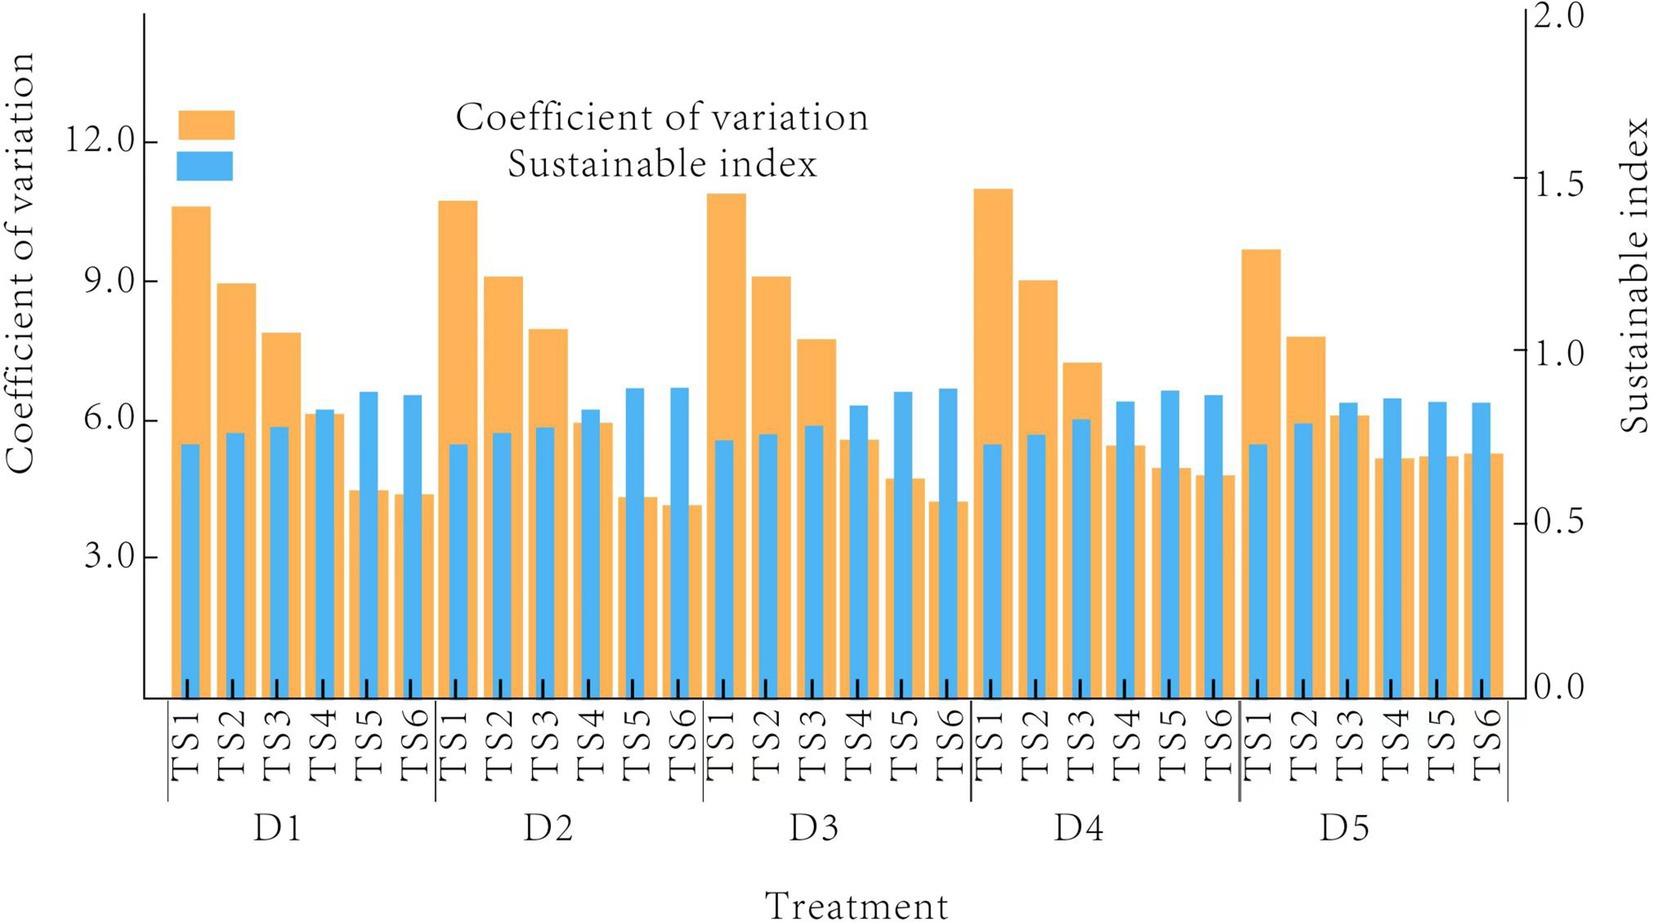
Figure 5. Comparison on variation coefficient and sustainable index of annual cotton yield in different scenarios from 1988 to 2017.
3.4 Model performance evaluation
Table 6 presents the results of our AquaCrop model simulations against field measurements obtained from the 2017 and 2018 growing seasons. Each entry in the table reflects the average values derived from three replicate plots for each irrigation treatment and planting date combination.
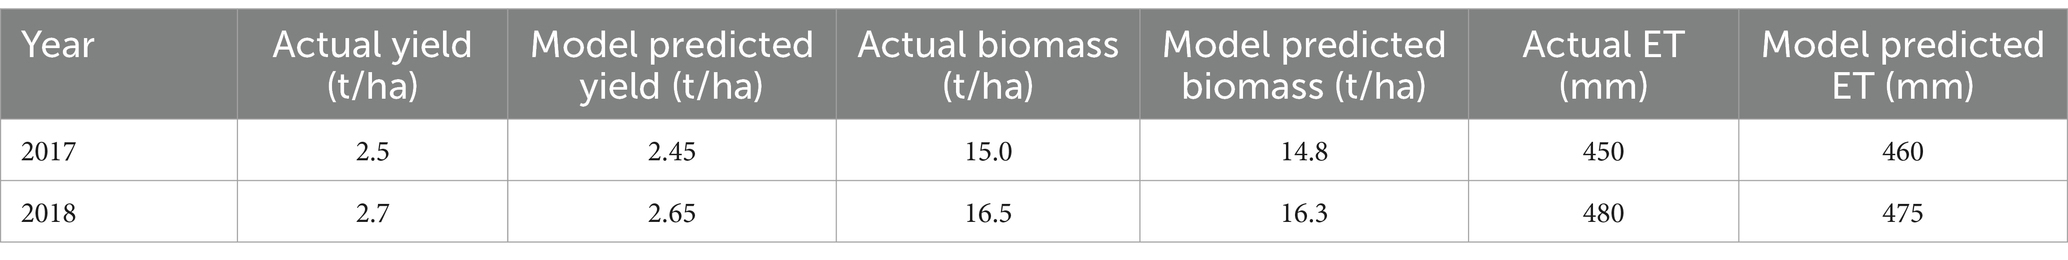
Table 6. Comparison of actual and model-predicted cotton yield, biomass, and evapotranspiration.
4 Discussion
Predicting yield is increasingly important for optimizing irrigation and improving the sustainability and profitability of production under limited available water resources (Angella et al., 2016). To understand the impact of climate change on the yield of oasis cotton under different irrigation and planting dates, this study calibrated and validated the crop and irrigation parameters in the AquaCrop model using 2 years of data from 2017 to 2018. The simulation results were statistically analyzed using RE, NRMSE, d, and R2 to test the accuracy and precision of the model (Wang et al., 2020). The results show that the AquaCrop model can effectively simulate the biomass and yield of cotton under different irrigation and planting dates, with NRMSE for each treatment being less than 20%, and both d and R2 approaching 1. The RE for ET and seed cotton yield prediction were −4.5 to 1.2% and −8.6% to −6.8%, respectively. The comprehensive analysis indicates that although the AquaCrop model underestimated ET and cotton yield, and overestimated canopy cover, aboveground biomass, and soil moisture, it proved the accuracy of the model for scenario analysis calibration and validation, consistent with the findings of Voloudakis et al. (2015) and Li et al. (2019).
Crop production is directly dependent on climate conditions, which determine the sources and productivity of agricultural activities (Ahmadi et al., 2021). This study used climate data from 1988 to 2017 to simulate 30 years of cotton production under 30 scenarios. The results show that the planting date has a smaller impact on the stability and sustainability of cotton production, but the stability and sustainability increase with the increase in irrigation quota, indicating that increasing the irrigation quota can effectively mitigate the impact of climate change on crop yield (Niu et al., 2016). The simulation shows that cotton biomass and seed cotton yield increase with the increase in irrigation quota. There was no significant difference in the biomass and seed cotton yield between treatments TS5 and TS6, which is close to the results obtained by Tan et al. (2018), who concluded that the suitable irrigation quota for cotton under mulch drip irrigation in southern Xinjiang is 406–462 mm. The difference may be due to different climates, soil textures, and irrigation water quality, suggesting that too much or too little irrigation is not conducive to high cotton yield, while an appropriate amount of irrigation is more beneficial for increasing cotton yield. This is because appropriate moisture is beneficial for the accumulation of aboveground biomass, while excessive irrigation causes leaching of fertilizers, leading to low fertilizer absorption and utilization efficiency, affecting the nutritional and reproductive growth of cotton, and thus reducing cotton yield (Read et al., 2006; Dong et al., 2010).
Choosing the appropriate planting date can improve water use and is an economically feasible, simple, and effective strategy to reduce the impact of climate change (Srivastava et al., 2022). The simulation shows that planting at the end of March and the beginning of April under conditions TS5–TS6 is beneficial for the formation of cotton biomass and yield. This is because late planting delays the cotton growth cycle, and the lower temperatures in the later stages are not conducive to boll development. At the same time, a larger irrigation quota leads to cotton being green and late-maturing, making it difficult to form effective yield. In water-scarce areas, it is possible to irrigate appropriately during the critical water demand period of cotton to avoid affecting the later yield formation of cotton. Under conditions TS1–TS2, planting at the end of April and the beginning of May is more conducive to the formation of cotton biomass and yield. Although late planting delays the cotton growth cycle, the higher soil temperature can meet the good emergence and rapid growth of cotton in the early stage, while the lower irrigation quota advances the cotton growth period, promotes early maturity of cotton, increases the proportion of flowers before frost, and is beneficial for ensuring yield.
Upon reviewing the Table 6, it is evident that the model predictions closely mirror the actual field measurements, with discrepancies generally within acceptable margins. For instance, the model-predicted yields slightly underestimated the actual yields, which may be attributed to the model’s conservative approach to simulating crop response to water stress. The slight overestimation of evapotranspiration by the model could be indicative of its sensitivity to microclimatic variations that are not fully captured by standard meteorological data. Nonetheless, the overall trend and magnitude of the model predictions are consistent with observed values, validating the model’s utility for strategic planning in cotton production under similar environmental conditions. The minor discrepancies between actual and predicted data also highlight areas for further refinement of the model, such as incorporating more localized microclimate data or considering the impact of other abiotic and biotic factors on crop growth and water use.
At present, the common planting dates in the southern Xinjiang region are from mid-March to mid-April, with slight differences across various regions due to climate influences. Planting at the end of April and the beginning of May is a strategy to cope with future climate change and water scarcity (Braunack et al., 2012), but later planting dates may not conform to actual production. Further research should be conducted in the future to explore the mitigation effects of delayed planting under early-maturing varieties and cultivation models on water scarcity and production stability and sustainability under climate change.
5 Conclusion
The AquaCrop model can accurately simulate cotton canopy cover, aboveground biomass, and seed cotton yield. The stability and sustainability of cotton production are less affected by planting dates and increase with the increase in irrigation quotas. When planting dates are the same, cotton aboveground biomass and yield increase with the increase in irrigation quotas. An irrigation quota of 495 mm can achieve higher irrigation water efficiency and ensure that cotton yield is not significantly reduced. For regions with abundant water resources, planting can be considered at the end of March and the beginning of April, while for water-scarce regions, planting at the end of April to the beginning of May can achieve higher yields, but the use of early-maturing varieties and corresponding cultivation models should be considered.
Data availability statement
The original contributions presented in the study are included in the article/supplementary material, further inquiries can be directed to the corresponding author.
Author contributions
HF: Conceptualization, Data curation, Formal analysis, Funding acquisition, Writing – original draft, Writing – review & editing. LX: Investigation, Methodology, Project administration, Resources, Writing – original draft, Writing – review & editing. HM: Conceptualization, Data curation, Formal analysis, Funding acquisition, Writing – original draft, Writing – review & editing.
Funding
The author(s) declare that financial support was received for the research, authorship, and/or publication of this article. This research was funded by the Postdoctoral Research Funding Program of Shaanxi Province (2023BSHEDZZ238), the High-level Talents Scientific Research Start-up Fund Project of Yulin University (2023GK13), the “New Star of Science and Technology” Talent Program of Yulin (CXY-2022-137), the Natural Science Research Project of the Education Department in Shaanxi Province of China (22JK0636).
Conflict of interest
Hongjian Fan was employed by Shaanxi Provincial Land Engineering Construction Group Co., Ltd.
The remaining authors declare that the research was conducted in the absence of any commercial or financial relationships that could be construed as a potential conflict of interest.
Publisher’s note
All claims expressed in this article are solely those of the authors and do not necessarily represent those of their affiliated organizations, or those of the publisher, the editors and the reviewers. Any product that may be evaluated in this article, or claim that may be made by its manufacturer, is not guaranteed or endorsed by the publisher.
References
Abedinpour, M., Sarangi, A., Rajput, T. B. S., Singh, M., Pathak, H., and Ahmad, T. (2012). Performance evaluation of AquaCrop model for maize crop in a semi-arid environment. Agric. Water Manag. 110, 55–66. doi: 10.1016/j.agwat.2012.04.001
Abrha, B., Delbecque, N., Raes, D., Tsegay, A., Todorovic, M., Heng, L., et al. (2012). Sowing strategies for barley (Hordeum vulgare L.) based on modelled yield response to water with AquaCrop. Exp. Agric. 48, 252–271. doi: 10.1017/S0014479711001190
Ahmadi, M., Etedali, H. R., and Elbeltagi, A. (2021). Evaluation of the effect of climate change on maize water footprint under RCPs scenarios in Qazvin plain, Iran. Agric. Water Manag. 254:106969. doi: 10.1016/j.agwat.2021.106969
Andarzian, B., Bannayan, M., Steduto, P., Mazraeh, H., Barati, M. E., Barati, M. A., et al. (2011). Validation and testing of the AquaCrop model under full and deficit irrigated wheat production in Iran. Agric. Water Manag. 100, 1–8. doi: 10.1016/j.agwat.2011.08.023
Angella, G., García Vila, M., López, J. M., Barraza, G., Salgado, R., Prieto Angueira, S., et al. (2016). Quantifying yield and water productivity gaps in an irrigation district under rotational delivery schedule. Irrig. Sci. 34, 71–83. doi: 10.1007/s00271-015-0486-0
Araya, A., Habtu, S., Hadgu, K. M., Kebede, A., and Dejene, T. (2010). Test of AquaCrop model in simulating biomass and yield of water deficient and irrigated barley (Hordeum vulgare). Agric. Water Manag. 97, 1838–1846. doi: 10.1016/j.agwat.2010.06.021
Bisbis, M. B., Gruda, N., and Blanke, M. (2018). Potential impacts of climate change on vegetable production and product quality – a review. J. Clean. Prod. 170, 1602–1620. doi: 10.1016/j.jclepro.2017.09.224
Braunack, M. V., Bange, M. P., and Johnston, D. B. (2012). Can planting date and cultivar selection improve resource use efficiency of cotton systems? Field Crop Res. 137, 1–11. doi: 10.1016/j.fcr.2012.08.018
Chen, Y., and Dong, H. (2016). Mechanisms and regulation of senescence and maturity performance in cotton. Field Crop Res. 189, 1–9. doi: 10.1016/j.fcr.2016.02.003
Conaty, W. C., Mahan, J. R., Neilsen, J. E., Tan, D. K. Y., Yeates, S. J., and Sutton, B. G. (2015). The relationship between cotton canopy temperature and yield, fibre quality and water-use efficiency. Field Crop Res. 183, 329–341. doi: 10.1016/j.fcr.2015.08.010
Ding, B., Cao, H., Zhang, J., Bai, Y., He, Z., Guo, S., et al. (2023). Biofertilizer application improved cotton growth, nitrogen use efficiency, and yield in saline water drip-irrigated cotton fields in Xinjiang, China. Ind. Crops Prod. 205:117553. doi: 10.1016/j.indcrop.2023.117553
Dong, H., Kong, X., Li, W., Tang, W., and Zhang, D. (2010). Effects of plant density and nitrogen and potassium fertilization on cotton yield and uptake of major nutrients in two fields with varying fertility. Field Crop Res. 119, 106–113. doi: 10.1016/j.fcr.2010.06.019
Feng, L., Dai, J., Tian, L., Zhang, H., Li, W., and Dong, H. (2017). Review of the technology for high-yielding and efficient cotton cultivation in the northwest inland cotton-growing region of China. Field Crop Res. 208, 18–26. doi: 10.1016/j.fcr.2017.03.008
Foster, T., Brozović, N., Butler, A. P., Neale, C. M. U., Raes, D., Steduto, P., et al. (2017). AquaCrop-OS: an open source version of FAO’s crop water productivity model. Agric. Water Manag. 181, 18–22. doi: 10.1016/j.agwat.2016.11.015
Geerts, S., Raes, D., and Garcia, M. (2010). Using AquaCrop to derive deficit irrigation schedules. Agric. Water Manag. 98, 213–216. doi: 10.1016/j.agwat.2010.07.003
Greaves, G. E., and Wang, Y.-M. (2016). Assessment of FAO AquaCrop model for simulating maize growth and productivity under deficit irrigation in a tropical environment. Water 8:557. doi: 10.3390/w8120557
Jin, X., Feng, H., Zhu, X., Li, Z., Song, S., Song, X., et al. (2014). Assessment of the AquaCrop model for use in simulation of irrigated winter wheat canopy cover, biomass, and grain yield in the North China plain. PLoS One 9:e86938. doi: 10.1371/journal.pone.0086938
Kang, S., Hao, X., Du, T., Tong, L., Su, X., Lu, H., et al. (2017). Improving agricultural water productivity to ensure food security in China under changing environment: from research to practice. Agric. Water Manag. 179, 5–17. doi: 10.1016/j.agwat.2016.05.007
Khalid, N., Aqeel, M., Noman, A., and Fatima Rizvi, Z. (2023). Impact of plastic mulching as a major source of microplastics in agroecosystems. J. Hazard. Mater. 445:130455. doi: 10.1016/j.jhazmat.2022.130455
Khoshravesh, M., Mostafazadeh-Fard, B., Heidarpour, M., and Kiani, A.-R. (2013). AquaCrop model simulation under different irrigation water and nitrogen strategies. Water Sci. Technol. 67, 232–238. doi: 10.2166/wst.2012.564
Kim, D., and Kaluarachchi, J. (2015). Validating FAO AquaCrop using Landsat images and regional crop information. Agric. Water Manag. 149, 143–155. doi: 10.1016/j.agwat.2014.10.013
Li, Z., Fang, G., Chen, Y., Duan, W., and Mukanov, Y. (2020). Agricultural water demands in Central Asia under 1.5°C and 2.0°C global warming. Agric. Water Manag. 231:106020. doi: 10.1016/j.agwat.2020.106020
Li, F., Yu, D., and Zhao, Y. (2019). Irrigation scheduling optimization for cotton based on the AquaCrop model. Water Resour. Manag. 33, 39–55. doi: 10.1007/s11269-018-2087-1
Linker, R., Ioslovich, I., Sylaios, G., Plauborg, F., and Battilani, A. (2016). Optimal model-based deficit irrigation scheduling using AquaCrop: a simulation study with cotton, potato and tomato. Agric. Water Manag. 163, 236–243. doi: 10.1016/j.agwat.2015.09.011
Niu, G., Li, Y. P., Huang, G. H., Liu, J., and Fan, Y. R. (2016). Crop planning and water resource allocation for sustainable development of an irrigation region in China under multiple uncertainties. Agric. Water Manag. 166, 53–69. doi: 10.1016/j.agwat.2015.12.011
Read, J. J., Reddy, K. R., and Jenkins, J. N. (2006). Yield and fiber quality of upland cotton as influenced by nitrogen and potassium nutrition. Eur. J. Agron. 24, 282–290. doi: 10.1016/j.eja.2005.10.004
Ren, F., Yang, G., Li, W., He, X., Gao, Y., Tian, L., et al. (2021). Yield-compatible salinity level for growing cotton (Gossypium hirsutum L.) under mulched drip irrigation using saline water. Agric. Water Manag. 250:106859. doi: 10.1016/j.agwat.2021.106859
Saadi, S., Todorovic, M., Tanasijevic, L., Pereira, L. S., Pizzigalli, C., and Lionello, P. (2015). Climate change and Mediterranean agriculture: impacts on winter wheat and tomato crop evapotranspiration, irrigation requirements and yield. Agric. Water Manag. 147, 103–115. doi: 10.1016/j.agwat.2014.05.008
Sandhu, R., and Irmak, S. (2019). Assessment of AquaCrop model in simulating maize canopy cover, soil-water, evapotranspiration, yield, and water productivity for different planting dates and densities under irrigated and rainfed conditions. Agric. Water Manag. 224:105753. doi: 10.1016/j.agwat.2019.105753
Srivastava, R. K., Mequanint, F., Chakraborty, A., Panda, R. K., and Halder, D. (2022). Augmentation of maize yield by strategic adaptation to cope with climate change for a future period in eastern India. J. Clean. Prod. 339:130599. doi: 10.1016/j.jclepro.2022.130599
Stricevic, R., Cosic, M., Djurovic, N., Pejic, B., and Maksimovic, L. (2011). Assessment of the FAO AquaCrop model in the simulation of rainfed and supplementally irrigated maize, sugar beet and sunflower. Agric. Water Manag. 98, 1615–1621. doi: 10.1016/j.agwat.2011.05.011
Surendran, U., Raja, P., Jayakumar, M., and Subramoniam, S. R. (2021). Use of efficient water saving techniques for production of rice in India under climate change scenario: a critical review. J. Clean. Prod. 309:127272. doi: 10.1016/j.jclepro.2021.127272
Tan, S., Wang, Q., Zhang, J., Chen, Y., Shan, Y., and Xu, D. (2018). Performance of AquaCrop model for cotton growth simulation under film-mulched drip irrigation in southern Xinjiang, China. Agric. Water Manag. 196, 99–113. doi: 10.1016/j.agwat.2017.11.001
Tanasijevic, L., Todorovic, M., Pereira, L. S., Pizzigalli, C., and Lionello, P. (2014). Impacts of climate change on olive crop evapotranspiration and irrigation requirements in the Mediterranean region. Agric. Water Manag. 144, 54–68. doi: 10.1016/j.agwat.2014.05.019
Vanuytrecht, E., Raes, D., Steduto, P., Hsiao, T. C., Fereres, E., Heng, L. K., et al. (2014). AquaCrop: FAO’s crop water productivity and yield response model. Environ. Model Softw. 62, 351–360. doi: 10.1016/j.envsoft.2014.08.005
Voloudakis, D., Karamanos, A., Economou, G., Kalivas, D., Vahamidis, P., Kotoulas, V., et al. (2015). Prediction of climate change impacts on cotton yields in Greece under eight climatic models using the AquaCrop crop simulation model and discriminant function analysis. Agric. Water Manag. 147, 116–128. doi: 10.1016/j.agwat.2014.07.028
Wang, X., Wang, H., Si, Z., Gao, Y., and Duan, A. (2020). Modelling responses of cotton growth and yield to pre-planting soil moisture with the CROPGRO-cotton model for a mulched drip irrigation system in the Tarim Basin. Agric. Water Manag. 241:106378. doi: 10.1016/j.agwat.2020.106378
Zhou, Y., Li, F., Xin, Q., Li, Y., and Lin, Z. (2024). Historical variability of cotton yield and response to climate and agronomic management in Xinjiang, China. Sci. Total Environ. 912:169327. doi: 10.1016/j.scitotenv.2023.169327
Zinkernagel, J., Maestre-Valero, J., Seresti, S. Y., and Intrigliolo, D. S. (2020). New technologies and practical approaches to improve irrigation management of open field vegetable crops. Agric. Water Manag. 242:106404. doi: 10.1016/j.agwat.2020.106404
Keywords: AquaCrop model, irrigation quota, planting date, predicting yield, climate change
Citation: Fan H, Xue L and Ma H (2024) Optimization of planting date and irrigation strategy for sustainable cotton production. Front. Sustain. Food Syst. 8:1431339. doi: 10.3389/fsufs.2024.1431339
Edited by:
Aliza Pradhan, National Institute of Abiotic Stress Management (ICAR), IndiaReviewed by:
Dibakar Roy, National Bureau of Soil Survey and Land Use Planning (ICAR), IndiaSusanta Jena, Indian Institute of Water Management (ICAR), India
Copyright © 2024 Fan, Xue and Ma. This is an open-access article distributed under the terms of the Creative Commons Attribution License (CC BY). The use, distribution or reproduction in other forums is permitted, provided the original author(s) and the copyright owner(s) are credited and that the original publication in this journal is cited, in accordance with accepted academic practice. No use, distribution or reproduction is permitted which does not comply with these terms.
*Correspondence: Hongjian Fan, MjAxODIwODI4QHN0dW1haWwubnd1LmVkdS5jbg==