 V. Osorio
 J. Pabón
 R. Medina
- National Coffee Research Center, Cenicafé. Km 4 Chinchiná—Manizales, Caldas, Colombia
Changes in the different stages of fruit processing are becoming a differentiating factor in coffee quality. Currently, generating delays in the processing of the fruit, that is, reserve, is a practice that can modify the sensory profile of the beverage. In this study, the fruit was reserved in three stages of maturity, two temperatures (15° and 20°C) and at two timepoints (24 and 48 h), establishing its chemical composition and sensory characteristics using analytical techniques such as liquid and gas chromatography. The state of maturity 1 showed an effect on malic and quinic acids due to the interaction of temperature and reserve time, while stage of maturity 3 showed an effect on glucose and fructose. The state of maturity 2 showed an effect of the reserve time on the same compounds of states 1 and 3, in addition to the content of defective beans and sucrose. The sensory quality expressed as the total SCA (Specialty Coffee Association) score and the attributes did not show treatments effect, the reserve of the fruit under the evaluated conditions presents an effect on the descriptors of the flavor. Extending the fruit reserve time from 24 to 48 h showed an increase in the groups of flavor descriptors associated with fruit and red fruits from 33.33 to 66.66% and from 34.04 to 65.95%. This implies that the constituent parts of the fruit such as the exocarp and mesocarp interact with the bean, leading to changes in the chemical composition and the improvement of the qualitative complexity of the sensory quality. This is a consequence of the increase in the frequency of the flavor descriptors of the fruit and red fruit category.
1 Introduction
The coffee grain is highly complex since its chemical composition shows high variability (Ribeiro et al., 2017). The compounds in the grain react during the different processing stages, generating diversity and sensory complexity in the final product (Clarke and Vitzthum, 2001). The volatile profiles and sensory qualities of roasted coffee largely depend on the chemical composition of the aroma precursors present in the grains before roasting (de Melo Pereira et al., 2019; Franca et al., 2005b; Gonzalez-Rios et al., 2007a), since proteins, carbohydrates and chlorogenic acids in green coffee give rise to compounds such as pyrroles, thiophenes, oxazoles, thiazoles and pyrazines (Franca et al., 2005a). Then, the sensory attributes perceived in the drink are directly linked to its chemical composition, which corresponds to different qualities of the beverage (De Melo et al., 2016; Iamanaka et al., 2014; Sunarharum et al., 2014).
Coffee beans are contained in the fruit and depending on the characteristics of the origin and the production system, they can be processed using three methods: dry, semidry and wet (de Melo Pereira et al., 2019; Wei et al., 2015; Ribeiro et al., 2017; Clarke and Vitzthum, 2001; Clifford, 1985; Wintgens, 2008). With the aim of differentiating, producers make intermediate variations in each of these processes. The development of the flavor of the coffee beverage begins in the crop in which the precursors are formed in the seed as the fruits develop and the complexity of the flavors develops further throughout the postharvest process (Gonzalez-Rios et al., 2007b; Sunarharum et al., 2014). Postharvesting is a process that generates significant impacts on the aroma and with adequate controls on the parameters of the process, the wet method produces fewer defective beans and is able to preserve the intrinsic qualities of the beans, producing coffees with a superior aroma compared to the dry method (Amorim et al., 2009; Wei et al., 2015).
The wet process for obtaining dry parchment coffee (dpc) is based on the immediate pulping of the fruits after harvest to avoid possible fermentations that cause damage to the quality of the bean. With the aim of taking advantage of the changes in the exocarp to influence the aroma of coffee and flavor, the coffee fruit is stored under different conditions, using, among others, plastic bags and hermetic containers with an injection of carbon dioxide, generating the category of coffees that in this study are called “reserved” due to the long time before processing. Caixeta et al. (2013), verified the changes due to the permanence of the skin and the mucilage, indicating that the quality of the bean was not affected until the seventh day after harvest. For their part, Yusianto and Nugroho (2014), stored fruits in plastic bags and immersed them in water for up to 7 days, defining storage times of a maximum of 2 days for the first while for the second, with or without water replacement, not exceeding 5 days. They found that storing coffee beans submerged in water with daily change can improve sensory quality. Peñuela-Martínez et al. (2018), modified the pulping times and the fermentation methods, controlling the pH and temperature of the coffee mass during the process. The experiment included two waiting times (6 and 12 h) before pulping and different fermentation times (24 and 48 h). The best quality was obtained from the treatment of 12 h of waiting and 24 h of fermentation. The impact of the processing delay on the formation of mold, ochratoxin A and the quality of the coffee was evaluated by Velmourougane et al. (2011), who recommended that the time elapsed between harvest and processing should be minimized, since once the fruits are detached, they are susceptible to microbial attack. Similarly, they determined that the fruits should be stored in perforated bags under shade to avoid the fermentation of the fruits inside the bags due to the high temperature.
The different steps of wet processing that imply a time of permanence of the bean with the pericarp promote changes in the chemical composition of coffee that influence the final quality of the beverage. This research evaluated the coffee fruit’s chemical and sensory characteristics at three stages of maturity. It was subjected to four conditions of reserve with different temperatures and times. Differences were identified that could be used to determine the optimum reserve level at which the bean conserves its characteristics and provides positive changes in sensory quality. The above contributes to the knowledge of the optimal processes that achieve the maximum expression of the sensory attributes of coffee and advance toward consistency in the processing.
2 Materials and methods
2.1 Coffee fruits
Coffee fruits of the Coffea arabica L species, Castillo® variety, from Chinchiná, Caldas, Colombia, were collected with the method of retention of passes (Sanz-Uribe et al., 2018), which ensured the maximum concentration of mature coffee. Eight units of 400 kg of fruits each were processed, which were classified hydraulically to eliminate low-quality fruits and were classified into three degrees of maturity associated with changes in red color during ripening. The first state was associated with the red–orange color (EM1) with an average value of the chromatic coordinate of the CIEL color scale * a * b, of a *: 25.16; the second state was associated with the crimson color (EM2) with a value of *: 17.55; and the third state was associated with the red wine color (EM3) with a value of *: 8.09. The chromatic coordinate a * refers to the average obtained for the 8 experimental units per state of maturity.
To determine the effect of two temperatures and two reserve times of the coffee fruit for each of the three stages of maturity, a completely randomized experimental design with a 3*2*2 factorial arrangement was evaluated. The experimental units were formed by state of maturity (80 kg) and divided into 4 units of 20 kg that were stored in woven polypropylene bags (tow) that are used at the farm level, and then they were randomly assigned to the treatments with storage temperatures of 15°C and 20°C and storage times of 24 and 48 h. In this way, 12 treatments were configured (SM: state of maturity; T: temperature; t: reserve time): SM1T15t24, SM1T15t48, SM1T20t24, SM1T20t48, SM2T15t24, SM2T15t48, SM2T20t24, SM2T20t48, SM3T15t24, SM3T20t48 (Figure 1). During the time defined in the treatments, the internal temperature of the fruits was taken every 2 h; for this, a stainless-steel probe thermometer was used with precision: ± 0.3°C. The external conditions of the storage rooms were controlled by air conditioners and dehumidifiers and monitored by a digital thermohygrometer.
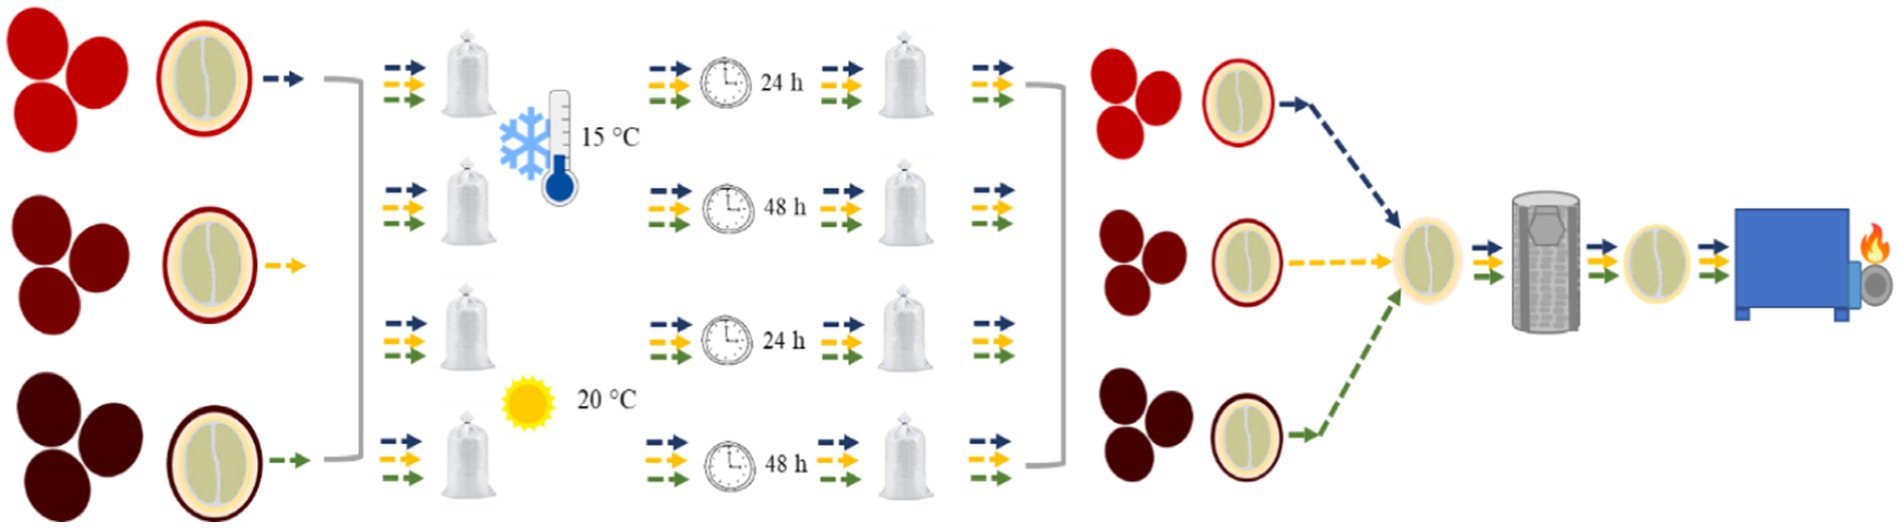
Figure 1. Methodology of the reserve treatments of the coffee fruit.
After the fruit reserve time, the samples from the 12 treatments were processed wet in the following way: the exocarp was eliminated by means of a 2,500 horizontal pulper with circular sieve (JM Estrada, Colombia); later, the mucilage was eliminated by mechanical demucilagination, ending with mechanical drying at a temperature of 40°C until the bean reached a moisture content between 10 and 11.5%.
2.2 High efficiency liquid chromatography HPLC
The coffee beans were cryogenically ground using a Retsch ZM 200 ultracentrifuge mill. The ground samples were stored at −80°C in a Thermo Scientific brand freezer until chemical analyses were performed. Organic acids, alkaloids and sugars were obtained from the extraction of ground green coffee with type I water, the first were extracted at 90°C for 5 min, the second with boiling reflux for 30 min and the third at 80°C for 30 min, after centrifugation and filtration (0.22 μm). The quantification of sugars used an Alliance 2,690 HPLC coupled to a 2,414 refractive index detector with a Sugar Pack I column (Waters, 6.5 × 300 mm, 10 μm) at 85°C and a water flow of 0.5 mL/min. The organic acids and alkaloids were determined using Waters 600E HPLC equipment coupled to a diode array detector (DAD-996) with a Hi-Plex H column (Agilent, 7.7 × 300 mm, 8 μm) at a temperature of 50°C and a flow rate of 0.5 mL/min with acidified water (0.01 M H 2 SO 4) and detection at 210 nm for organic acids. For the alkaloids, a Symmetry C18 column (Waters, 4.6 mm x 250 mm, 100 Å, 5 μm) was used at 35°C with a flow of 1.0 mL/min using a mixture of water, methanol and acetic acid. (59: 40: 1 v/v/v) and detection at 273 nm. The identification of the compounds was carried out by comparing the retention times of the analytes of interest with the standards (Sigma-Aldrich), and the quantification was carried out by creating a calibration curve of each reference standard.
2.3 Gas chromatography
The constitution of the free fatty acids present in the lipid fraction of bean coffee was determined by gas chromatography coupled to a mass detector (HP-8860 - MSD 6890) using the AOAC 969.33 reference method. Conditions: Injector temperature: 300°C, injection mode: split (70.1), detector temperature: 300°C, injection volume: 0.2 uL; ionization voltage: 70 ev. The free fatty acids were esterified with boron trifluoride in 20% methanol, followed by two extractions with hexane. The separation of the compounds was carried out with the use of an HP-MS column (5% phenylmethylsiloxane 30 × 250 μm x 0.25 μm) with a temperature ramp of 20°C/min from 90°C to 260°C and a constant helium flow of 1.2 mL/min. The structural verification of the fatty acids present was carried out from the mass spectra of the samples and their comparison with databases (NIST2017).
2.4 Total chlorogenic acids, total lipids and total crude protein
The total content of chlorogenic acids was determined in a Beckman spectrophotometer (DU-650) using wavelengths of 265, 328 and 380 nm after extraction with methanol and purification with Carrez reagents. The lipid fraction was established by Soxhlet extraction according to the AOAC 945.16 reference method. The determination of total crude protein was carried out based on the principle of Dumas 990.03 of AOAC Official Method 990.03 (2006), through complete combustion with oxygen supply, destroying organic matter at high temperatures and generating carbon and nitrogen gases, which were quantified by an IR detection cell and a thermal conductivity cell. The protein value was obtained by multiplying the percentage of elemental nitrogen by a factor of 6.25.
2.5 Physical and sensory quality
The physical quality included the determination of the moisture content, the percentage of loss, the content of defective beans such as brocaded beans, black beans and vinegars and the percentage of healthy beans (Colombian Institute of Technical Standards and Certification, 2021). The sensory quality was evaluated by 5 certified Q-Grader tasters following the SCA (Specialty Coffee Association, 2003) protocol. This methodology includes the beverage preparation procedure: degree and roasting times (55–65 Agtron/SCA, 8–12 min), quantity of coffee, type of grinding, temperature and quality of the water and analysis temperatures. Ten sensory attributes were recorded: fragrance/aroma, flavor, aftertaste, acidity, body, balance, uniformity, clean cup, sweetness, tasting score, defects and total score. Additionally, in the flavor attribute, the main sensory descriptors were defined by the coffee tasters in a discretionary manner.
2.6 Statistical analysis
SAS 9.4 statistical software was used and the average and standard error by maturity stage, temperature and storage time were obtained. For each stage of maturity, an analysis of variance was performed with the response variables, corresponding to a completely randomized experimental design model in a 3*2*2 factorial arrangement with a significance level of α = 0.05. When the analysis of variance showed the effect of the treatments (p value <0.05), Duncan’s multiple comparison test (α = 0.05) was performed on the treatments to identify the effect of temperatures and/or the times of reservation of the fruit.
3 Results
3.1 Temperature
The internal temperature of the mass of coffee fruits exhibited a positive linear trend over time that was more evident in the treatments associated with the state of maturity SM3. The greatest differences between the state of maturity SM1 and SM3 (7.14°C) were generated at a temperature of 15°C and 48 h of reserve. The treatments with a reserve temperature of 15°C began with approximately the same temperature of 23.92°C. The temperature of the treatment of the state of maturity SM1 at 24 h presented an average temperature of 21.82°C, while SM3 present an average temperature of 24.44°C. These same stages of maturity at 48 h had values of 30.88°C and 38.02°C, which implies increases of 9.06 and 13.58 degrees, respectively.
In the treatments associated with a temperature of 20°C, the differences between states SM1 and SM3 at hours 24 and 48 are equal with a value of 2.58°C. The highest average temperature values were found in the treatments associated with the state of maturity SM3 and the maximum values in the final hour of the treatments with storage of 48 h. The minimum values were found in greater proportion at hours 14 and 16 of storage and these hours coincide with the lowest environmental temperatures given by sunrise.
3.2 Physical quality
The analysis of variance showed no effect for physical variables such as percentage of black and vinegars beans, brocaded and healthy beans. The average moisture content of the samples was 11.31%, with minimum and maximum values of 10.95 and 11.61%, respectively. These values were reflected in the water activity value with an average value of 0.61. The defective beans content was an average of 5.79%. The analysis of variance showed the effect of the reserve time on the percentage of defective beans in the SM2 state of maturity (p-value: 0.0042). The treatments with a reserve time of 24 h had an average value of 4.42% (B), which increased after 48 h to a value of 6.80% (A). The maximum value of defective beans of 7.38% was observed in treatment SM3T15t48, and the maximum value of brocaded beans of 4.66% was observed in treatment SM3T20t48. In this same treatment, the lowest value of healthy bean was 71.32%.
3.3 Organic acids
The analysis of variance did not show effects of temperature, reserve time or their interaction on the concentrations of acetic, lactic and succinic acid (Figure 2). Acetic acid presented the same average value for the treatments associated with storage temperatures of 15°C and 20°C of 2.64 (g/kg), while it presented a decrease from 2.72 to 2.56 (g/kg) after 24 to 48 h of fruit reserve. Lactic acid had an average value of the treatments of 0.30 (g/kg), presenting increases in the treatments associated with more advanced stages of maturity, going from an average value of 0.28 (g/kg) for the state maturity SM1 at an average value of 0.31 (g/kg) for the state of maturity SM3. Succinic acid had an average value of 1.46 g/kg in treatments and for treatments associated with a 24-h reserve time, it had an average value of 1.43 and 1.49 g/kg for 48 h. Citric, oxalic, quinic and malic acids showed an effect in the analysis of variance, the first two due to the reserve time in the state of maturity SM2 (p-value: 0.0069–0.0006), while the last two due to the interaction of temperature and reserve time in the state of maturity SM1 (p-value: 0.0282–0.0122). The state of maturity SM3 did not show changes in the concentrations of organic acids when the fruit was reserved under different temperature and time conditions. In the SM2 stage of maturity, citric acid increased and oxalic acid decreased as the reserve time increased from 24 to 48 h, while in the SM1 stage of maturity, malic acid decreased at 15°C and then increased in the temperature of 20°C when increasing the reserve of the fruit in 1 day, this same behavior is observed for quinic acid in this same state of maturity (Figure 3).
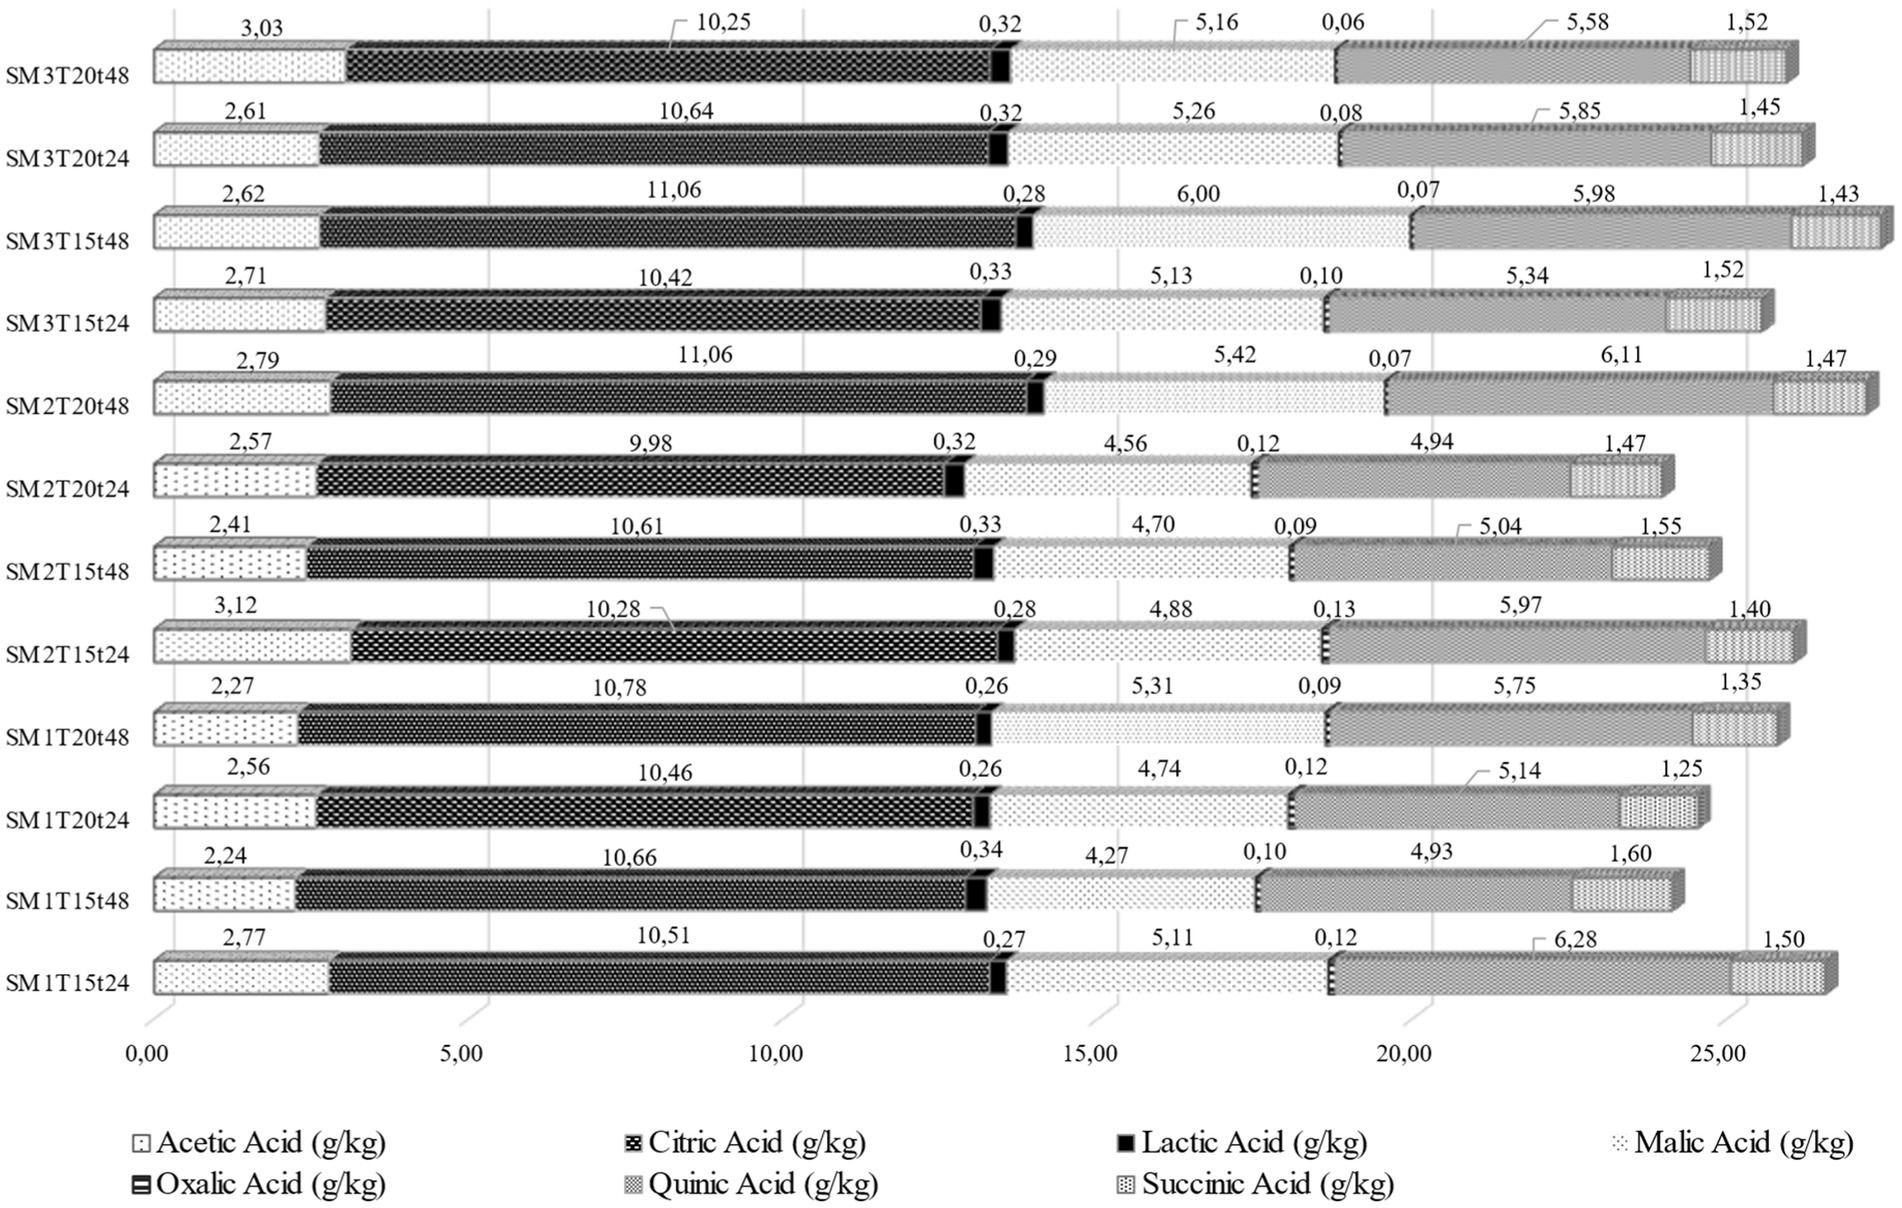
Figure 2. Average organic acid content of coffee beans with fruit reserve in different stages of maturity.
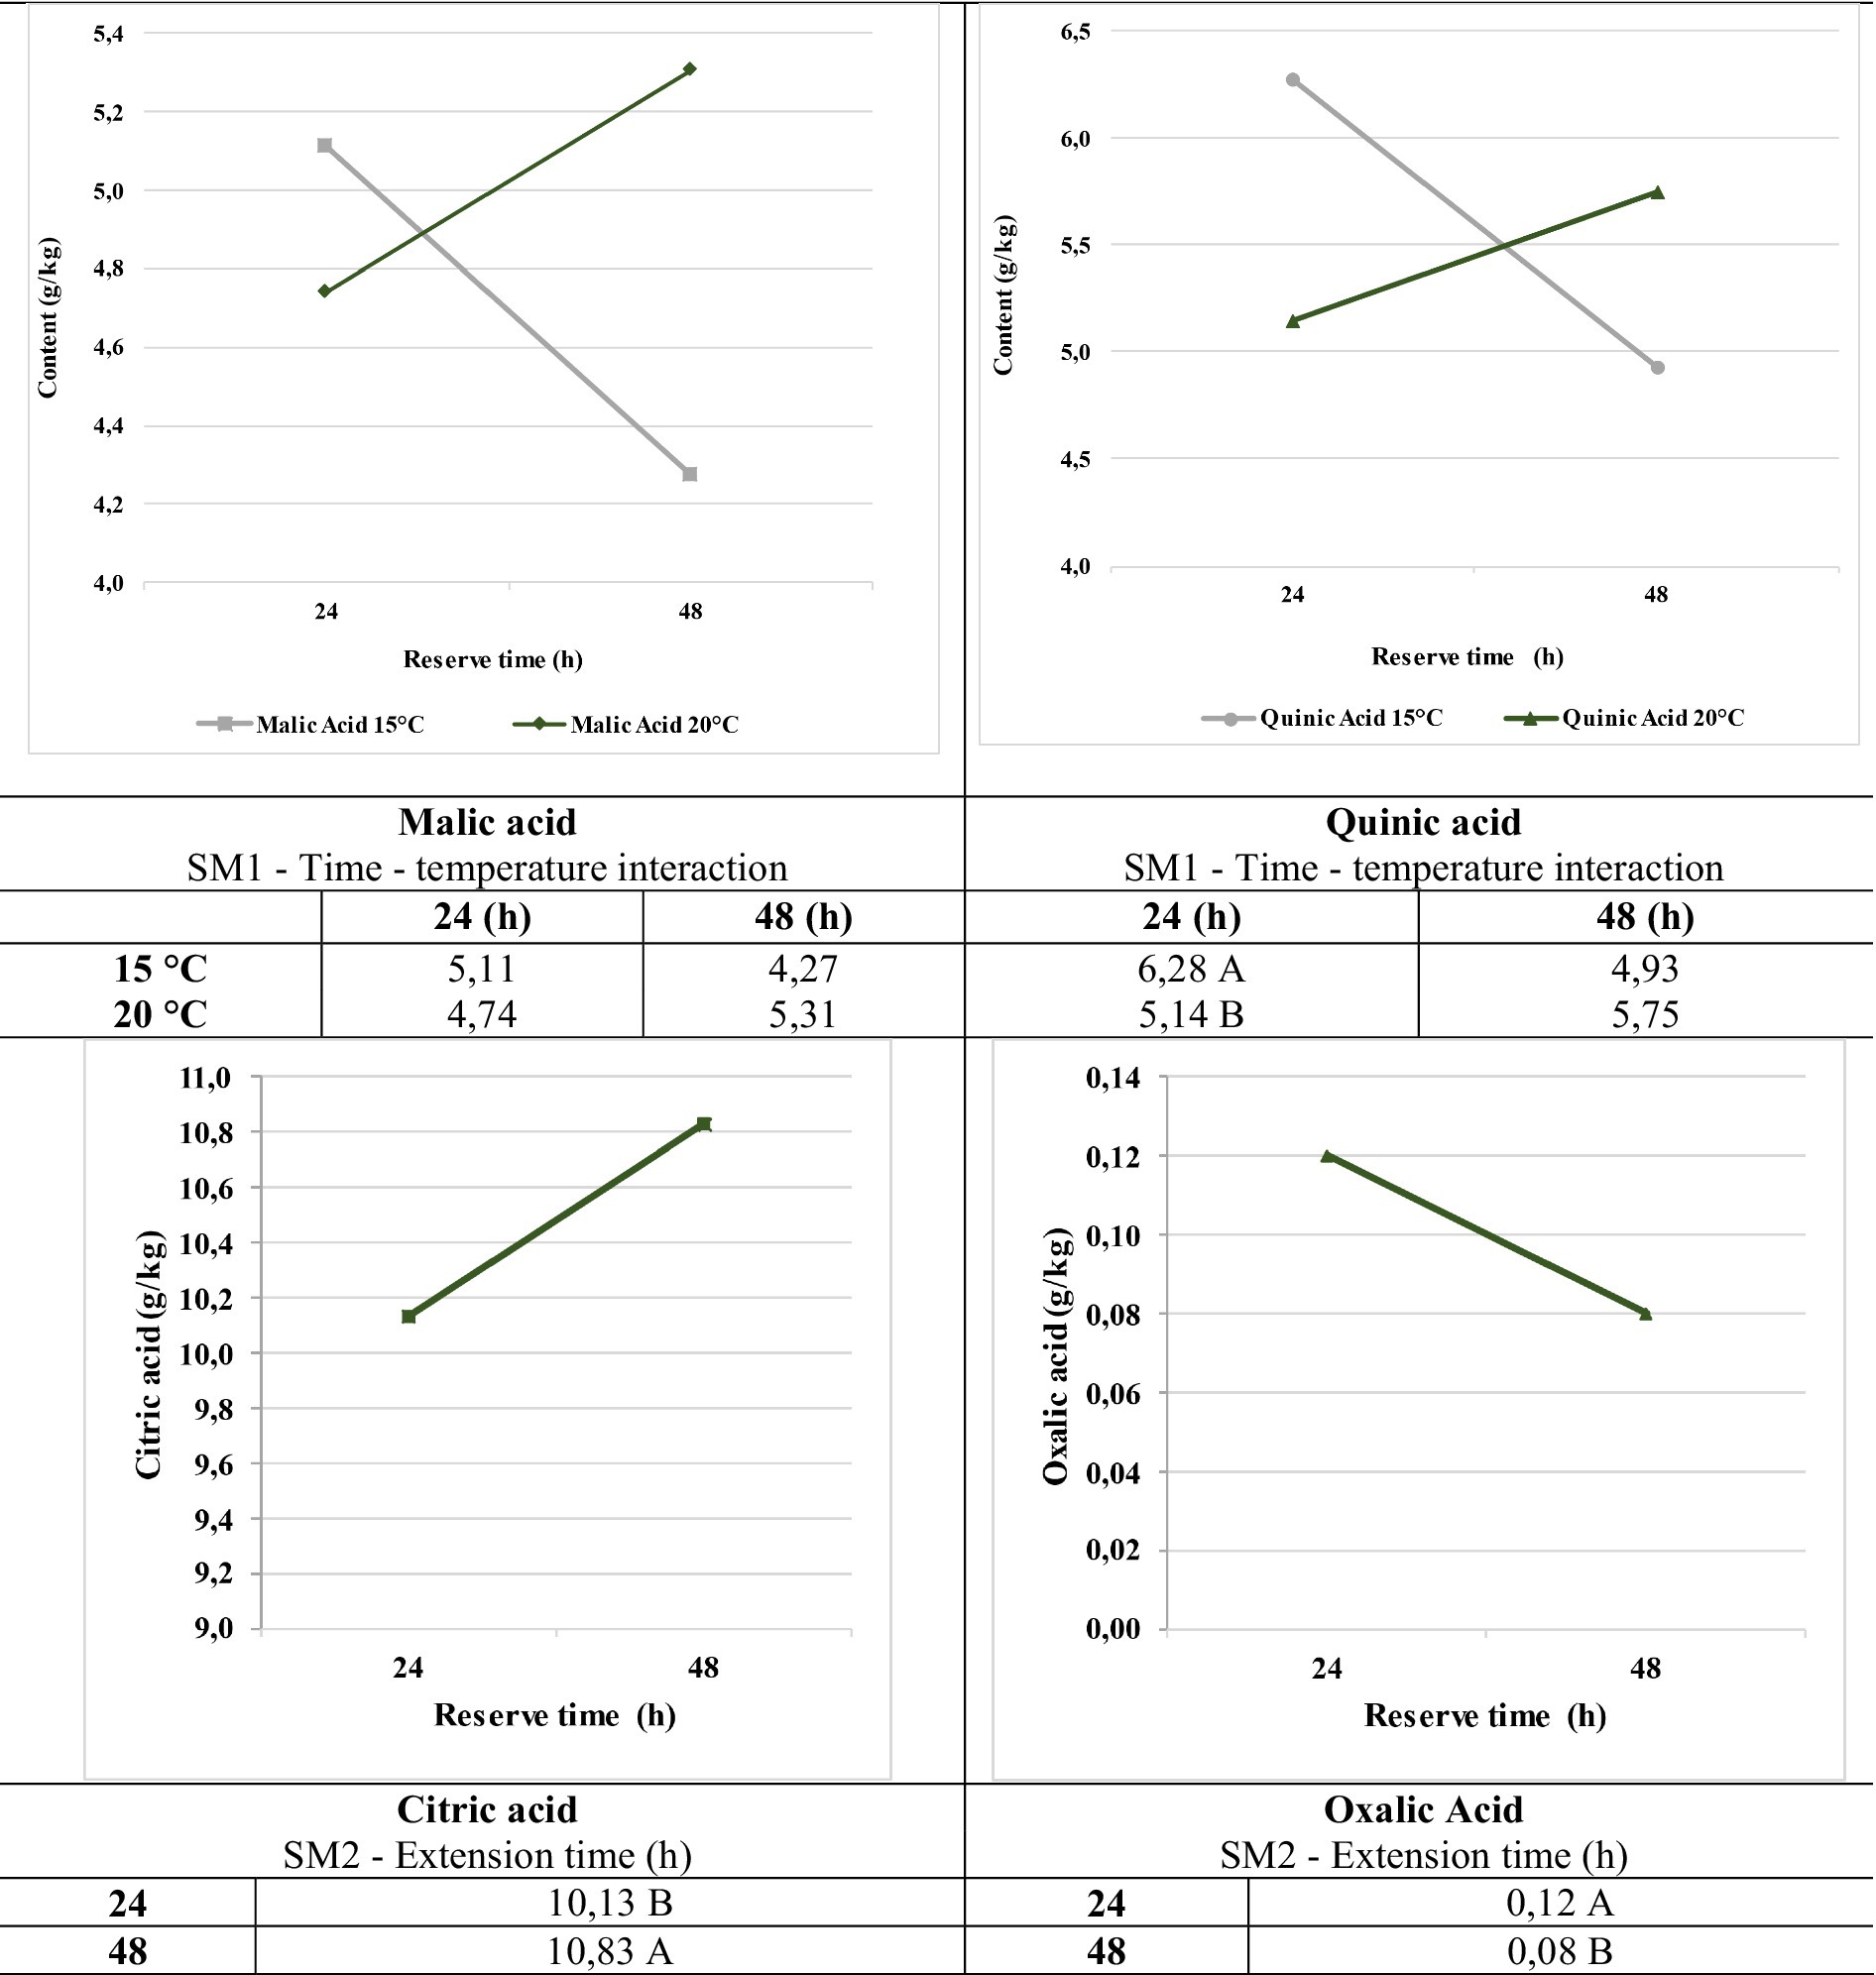
Figure 3. Effect of the reserve conditions of the fruit on organic acids Uncommon letters imply difference of averages according to Duncan’s test at 5%.
3.4 Sugars
The analysis of variance showed the effect of the reserve temperature for fructose and glucose in the SM1 state of maturity (p-value: 0.0014, 0.0077) and the effect of the reserve time in the SM2 state for fructose, glucose and sucrose (p-value: 0.0002, 0.0030, 0.0062). Sucrose did not show an effect of temperature, reserve time or their interaction in the treatments associated with the maturity stages SM1 and SM3 (Figure 4). Sucrose in the treatments associated with SM1 presented an average value of 88.80 g/kg, and in this same state of maturity in the 24-h reserve time, an average value of 89.01 g/kg was observed, which decreased in reserve time 48 at a value of 88.60 g/kg. This same behavior is observed in the state of maturity SM3, where the average is 86.04 g/kg, but when estimating these average values in the treatments with 24 and 48 h of reserve, they decrease from 87.25 to 84.83 g/kg. The effect of the temperature and reserve time interaction (p-value: fructose 0.0304 – glucose 0.0299) was observed in the treatments associated with the state of maturity SM3 (Figure 4).
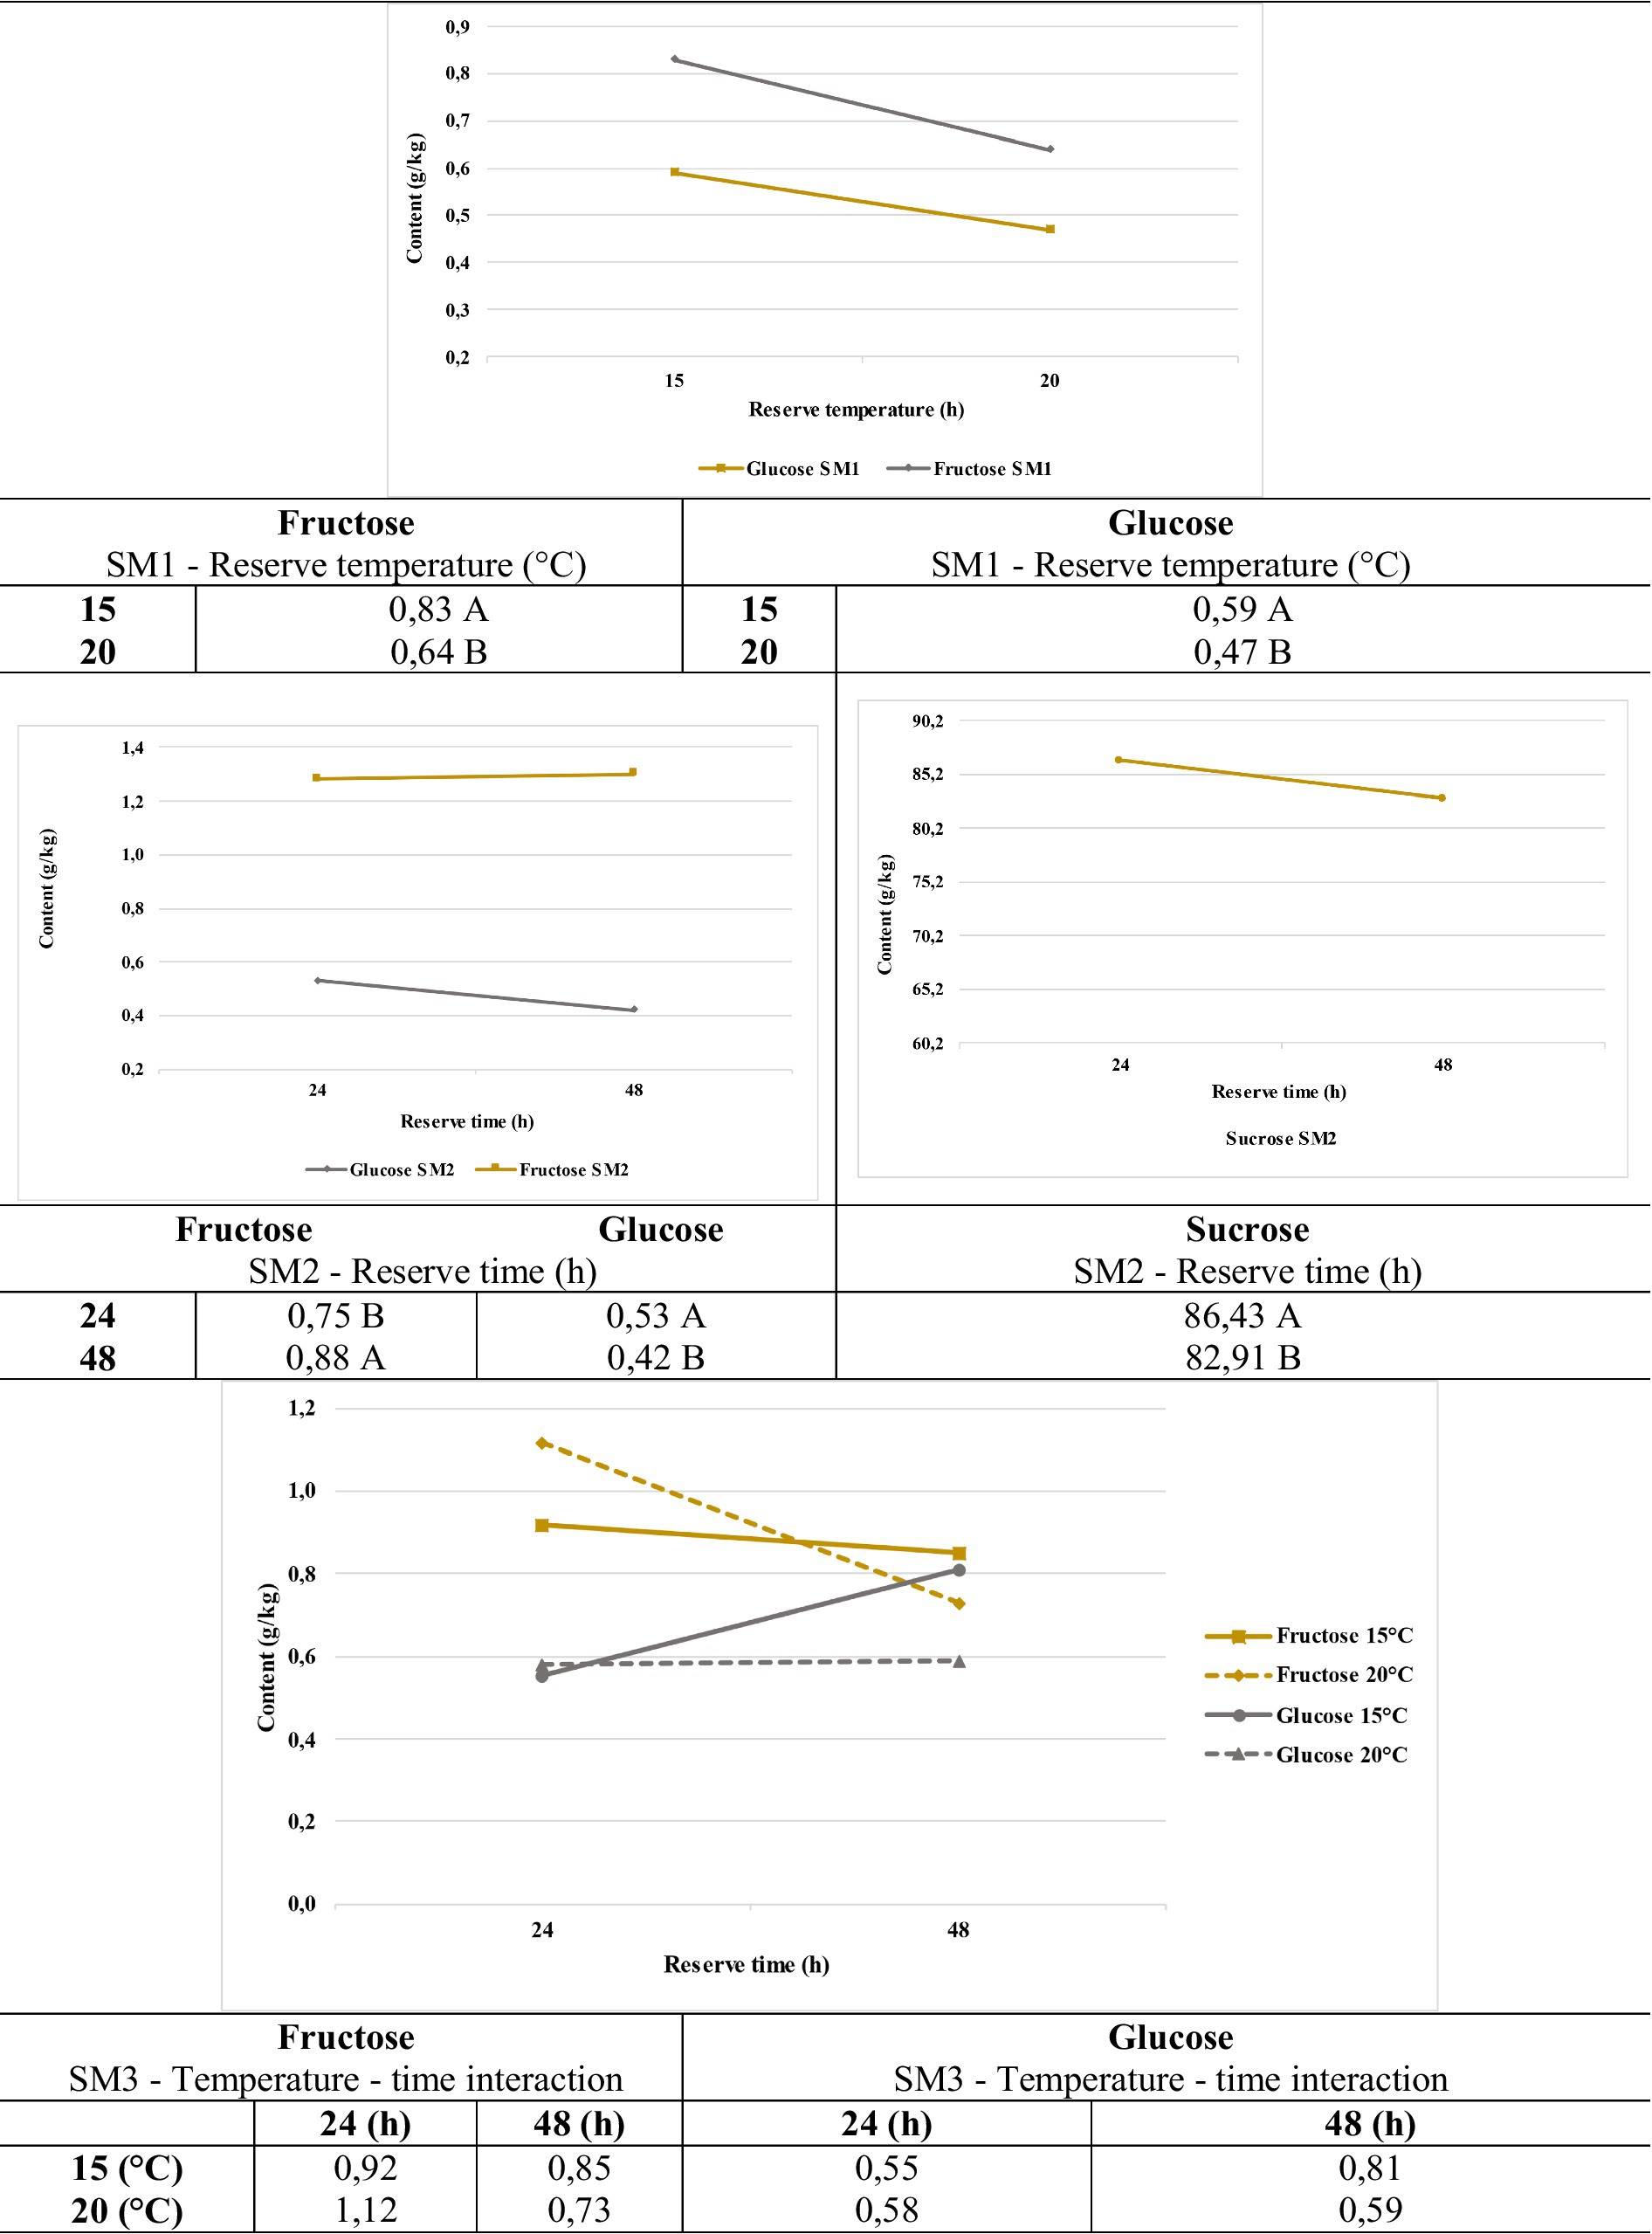
Figure 4. Effect of the reserve of the fruit on the sugars of the coffee in different stages of maturity according to the Duncan test at 5%.
3.5 Total lipids and free fatty acids
The analysis of variance did not show the effect of treatments on the total lipids and the composition of the different free fatty acids of the coffee bean. The average lipid content was 10.56%, the minimum average value was 10.26%, and the maximum was 11.09% in the SM1T15t48 and SM1T15t24 treatments (Table 1). When associating the treatments by state of maturity, a decrease in lipids is observed as the degree of maturation increases, which is how the treatments with SM1 presented average values of 10.64% and SM2 and SM3 10.55 and 10.48%. Palmitic acid presented a general average value of 41.26% and presented a similar behavior to total lipids, as its concentration decreased with increasing maturity, with values of 41.74, 41.13 and 40.83% for treatments associated with states SM1, SM2 and SM3. Linoleic acid presented an average value of 34.03% and, unlike the two previous compounds, presented increases associated with more advanced stages of maturity, which is how the treatments with states SM1, SM2 and SM3 presented average values of 33.64, 34.03 and 34.44%, respectively. Oleic acid presented average values of 10.45%, while stearic acid presented 9.58% with a minimum average of 9.25% in the SM3T20t24 treatment and a maximum average of 9.79% in the SM1T15t48 treatment. The general average value of arachidic acid was 4.69%, with a minimum average of 4.51% in the SM1T15t48 treatment and a maximum of 4.85% in the treatment with the same state of maturity and temperature but with reserve time 24 h.
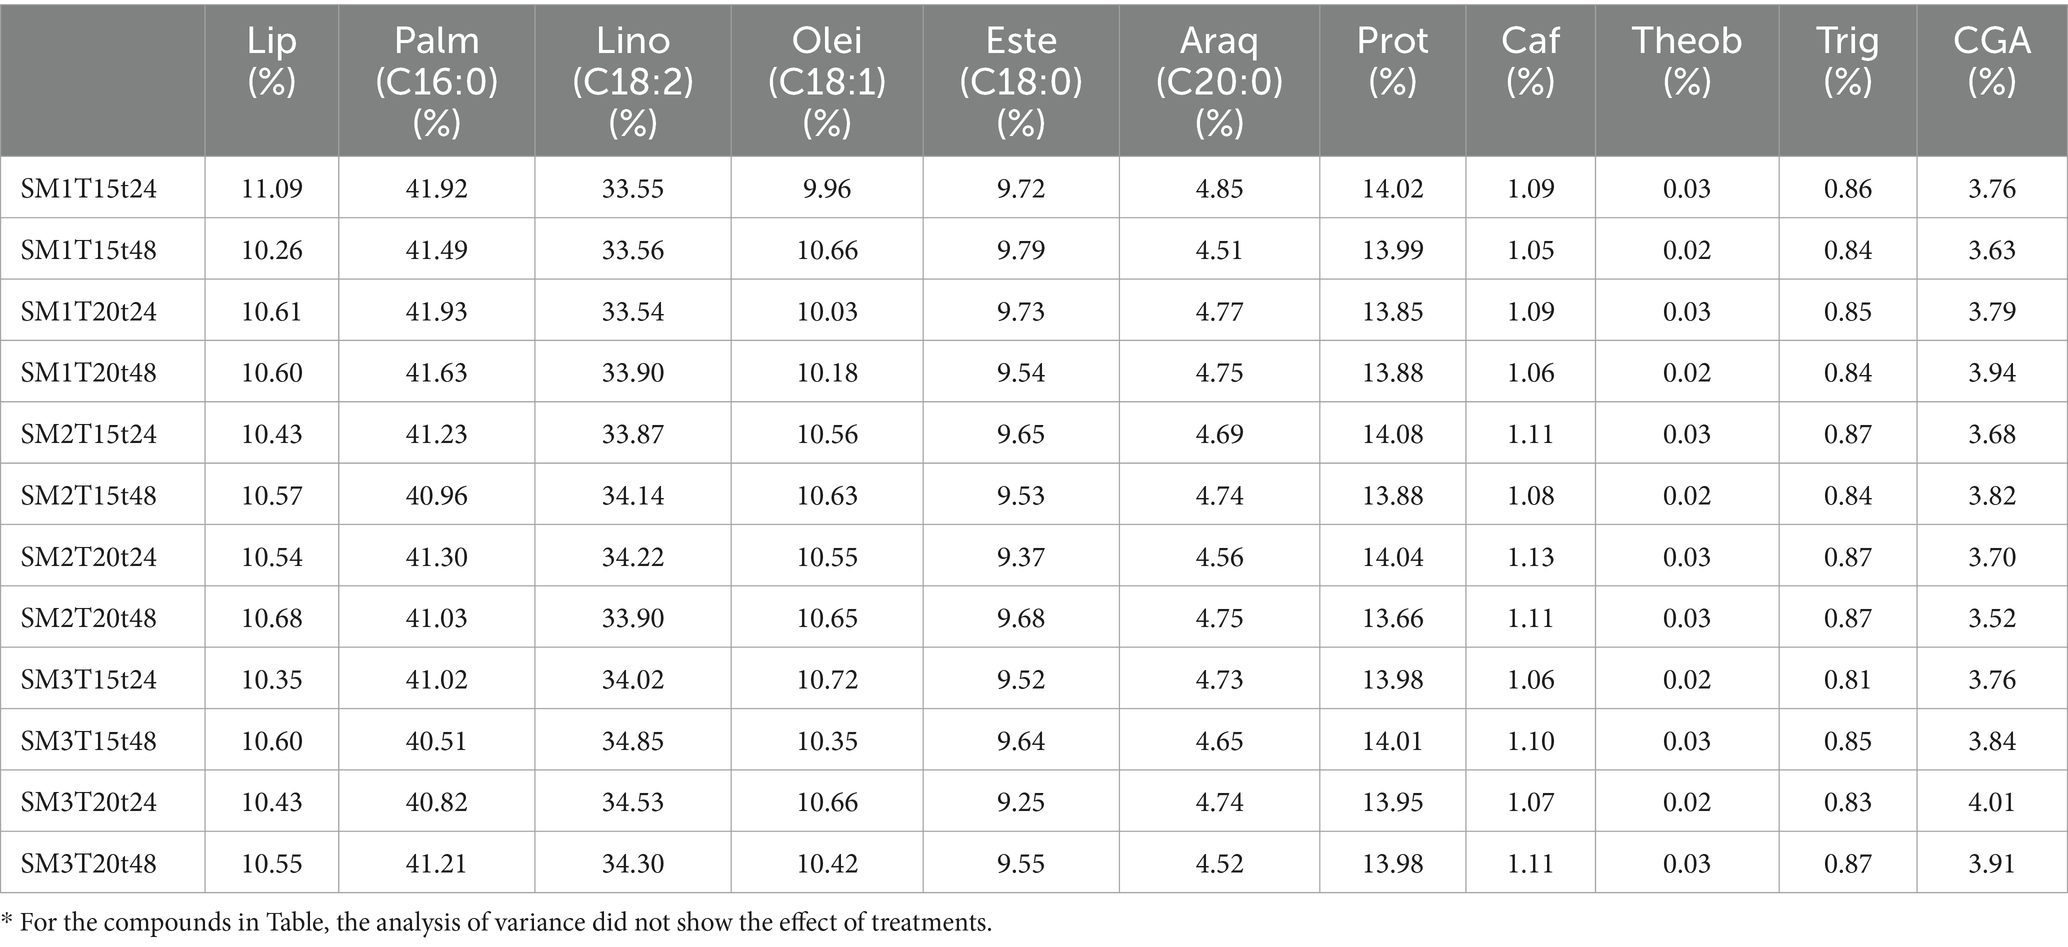
Table 1. Average contents of lipids, free fatty acids, protein, alkaloids and total chlorogenic acids in coffee at different stages of maturity and under different reserve conditions.
3.6 Total crude protein, alkaloids and total chlorogenic acids
The total crude protein, caffeine, theobromine and trigonelline did not show an effect of the reserve treatments of the fruit before wet processing. Protein had an average general value of 13.94% with a minimum average value of 13.66% and a maximum of 14.08% in the SM2T20t48 and SM2T15t24 treatments (Table 1). Caffeine presented an average value of 1.09%, a value that remained constant in the averages of the treatments associated with reserve times of 24 and 48 h. This same behavior is observed with theobromine and trigonelline but with average values of 0.03 and 0.85%, respectively. The average content of total chlorogenic acids in the treatments was 3.78%, and these contents did not show an effect of treatments in the analysis of variance. The highest contents were found in the treatments associated with the state of maturity, SM3 with a value of 3.88% and the lowest contents were found in the state of maturity SM2, with a value of 3.68%. The contents of the treatments with reservation times of 24 and 48 h are the same, with a value of 3.78%.
3.7 Sensory quality
The analysis of variance of the sensory quality expressed as the total SCA score and the attributes evaluated under this methodology did not show any treatment effect. The sensory quality based on the SCA cupping protocol required the individual evaluation of attributes and the total score was the summation. Scores lower than 80 points implied the presence of sensory defects. Ninety-six samples were evaluated, associated with 12 treatments with 8 experimental units of which 12.5% had defects. These defects are represented mostly (75%) by the ferment defect. The treatments with the highest frequency of sensory defects were those associated with a reservation time of 48 h with 75% and those of 24 h with 25%, which may indicate that longer reservation times lead to a greater probability of appearance of sensory defects in the coffee bean. The averages of the total SCA scores for the treatments were SM1T15t24: 82.56, SM1T15t48: 83.42, SM1T20t24: 82.34, SM1T20t48: 83.83, SM2T15t24: 83.31, SM2T15t48: 83.06, SM2T20t24: 81.89, SM2T20t48: 83.03, SM3T15t24: 81.82, SM3T15t48: 83.45, SM3T20t24: 83.23 and SM3T20t48: 84.32. The maximum mean values of 85.33 and 85.58 were found in the SM2T15t48 and SM3T20t24 treatments, while the minimum values of 80.00 and 80.17 were found in the SM1T15t24 and SM2T15t48 treatments.
The fragrance/aroma attribute presented a general average of 7.74, with average values by maturity stage of 7.77, 7.72 and 7.74 for SM1, SM2 and SM3, respectively, while the average for this attribute in the treatments associated with the reserve temperatures of 15°C and 20°C presented the same value of 7.74. With the increase in the reserve time, this average value increased from 7.68 to 7.81 when going from 24 h to 48 h storage. Increases over time were also observed for the flavor and acidity attributes, with the first increasing from 7.45 to 7.62 and the second increasing from 7.52 to 7.70. The fragrance/aroma presented a minimum average value of 7.59 and a maximum of 7.91 in treatments SM2T20t24 and SM1T20t48, and the flavor presented a minimum average value of 7.36 and a maximum of 7.83 in treatments SM3T15t24 and SM3T20t48. In these same treatments, the minimum and maximum sensory acidity were 7.36 and 7.81, respectively.
In this study, the tasters identified 421 sensory descriptors of flavor that were classified into eight categories: caramel-sweet, fruit, chocolate, nuts, red fruits, spices, citrus and floral with percentages of frequency of 35.35, 15.15, 12.87, 12.62, 11.86, 7.57, 3.03 and 1.51%, respectively. The frequency of descriptors of the caramel-sweet group decreased in the treatments associated with the different stages of maturity, going from 39.28, 35.00 and 25.71% in SM1, SM2 and SM3, respectively. This same behavior is observed in the descriptors associated with fruit trees, decreasing from 45.00% in the associated treatments SM1 to 28.33% in SM2 and 26.67% in SM3. The groups of nuts and fruit trees increased their frequency from 46.00 to 54.00% and from 46.66 to 53.33% by increasing the temperature of the process from 15 to 20°C, while the fruits reds decreased from 61.70 to 38.29%. The increase in the reservation time from 24 to 48 h showed a decrease in the frequency of descriptors of the candy-sweet and chocolate groups with a reduction of values from 53.57 to 46.42% and from 58.82% to 41.17, respectively. An opposite behavior was observed the descriptors of the fruit and red fruit groups, as their values increased from 33.33 to 66.66% and from 34.04 to 65.95%, respectively (Figure 5). Based on the chi-square test, at a significance level of 5%, there was not enough statistical evidence to conclude that the distribution of the proportion of samples classified in each of the descriptor categories is different by state of maturity. (p value: 0.56) and reserve temperature (p value: 0.44). Regarding the reserve time, the distribution of the proportion of samples differs in the fruit, red fruit and dried fruit categories, since with a greater reserve time (p value <0.05), a greater number of samples were in the first two categories, but a smaller proportion in the third.
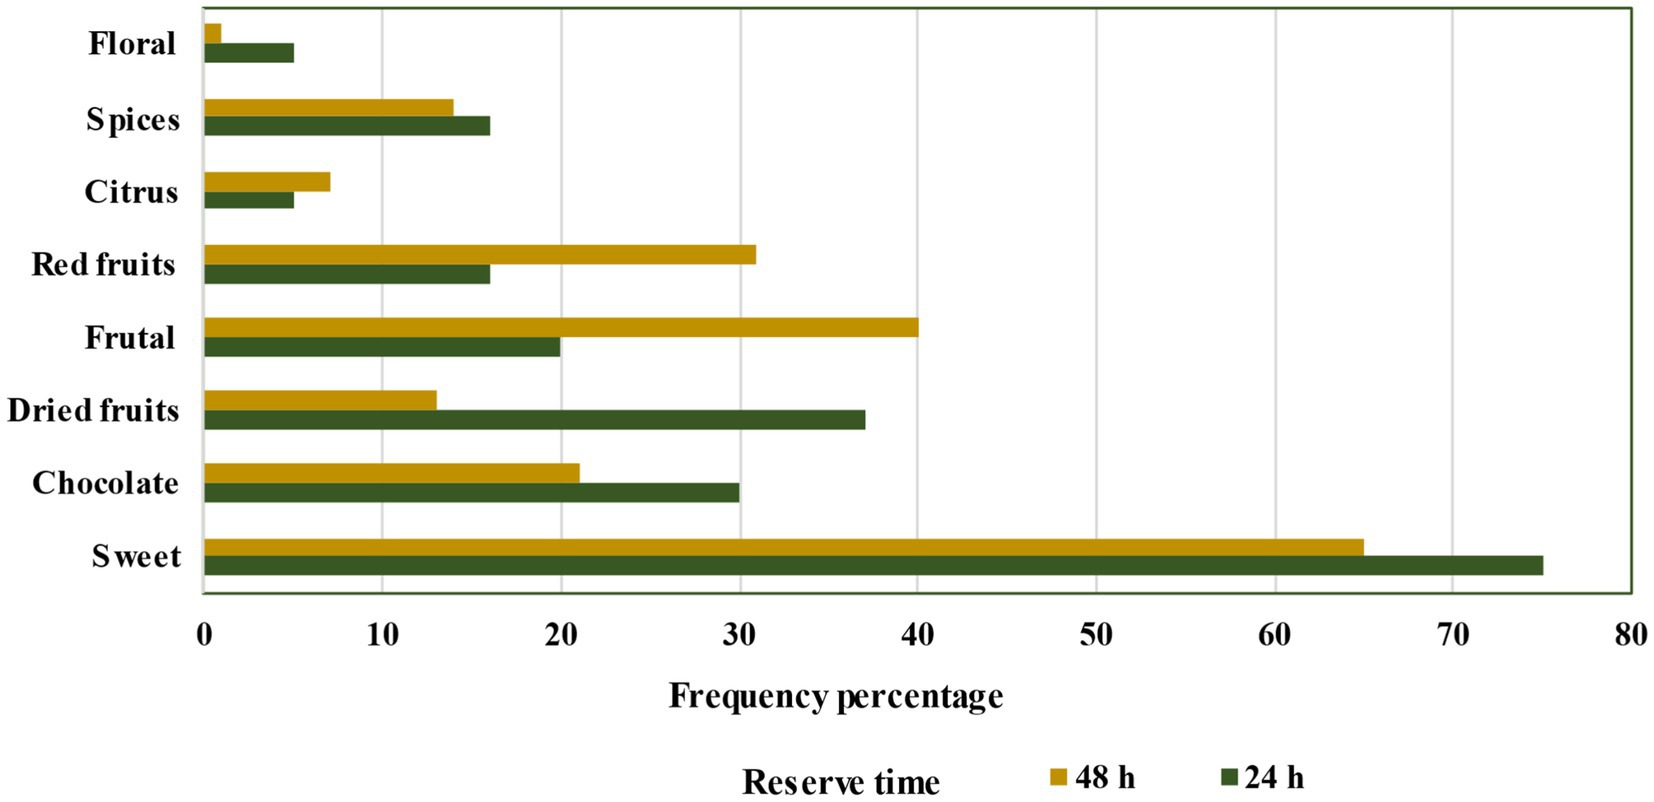
Figure 5. Effect of reserve time on sensory flavor descriptors.
3.8 Regression analysis
For the variables evaluated, both physical quality, sensory quality and chemical composition, a regression analysis was carried out whose statistical approach allows identifying relationships between them. This stepwise regression is the iterative construction of a model that involves the automatic selection of variables independent of each other. Through a series of tests (F tests, t tests), a set of independent variables is found that significantly influence the dependent variable, which for this case was defined as the sensory quality expressed in the total SCA score. The methodology implemented in this analysis is a bidirectional or successive step linear regression, made up of a combination of forward and backward methods, which as a result of 40 initial variables, finally found that those that influence the total SCA score are 8 (Figure 6): Percentage of healthy bean (Almsan) + Acidity sensory attribute (Acidity) + Glucose (Gluc) + Residual taste sensory attribute (Flavors) + Protein (Prot) + Caffeine (Caffei) + Quinic acid (Acqui) + Percentage of black beans and vinegars (Pnyv). To verify the relationships between the variables previously defined by their influence on sensory quality, a matrix of Pearson’s correlation coefficients was made. This coefficient determines the linear dependence between two quantitative random variables If the value is calculated with a positive sign, there is a positive correlation and the opposite for a negative correlation. The residual flavor had a positive relationship with the acidity attribute (0.97) and the protein content had a negative correlation with the percentage of healthy beans (−0.68).
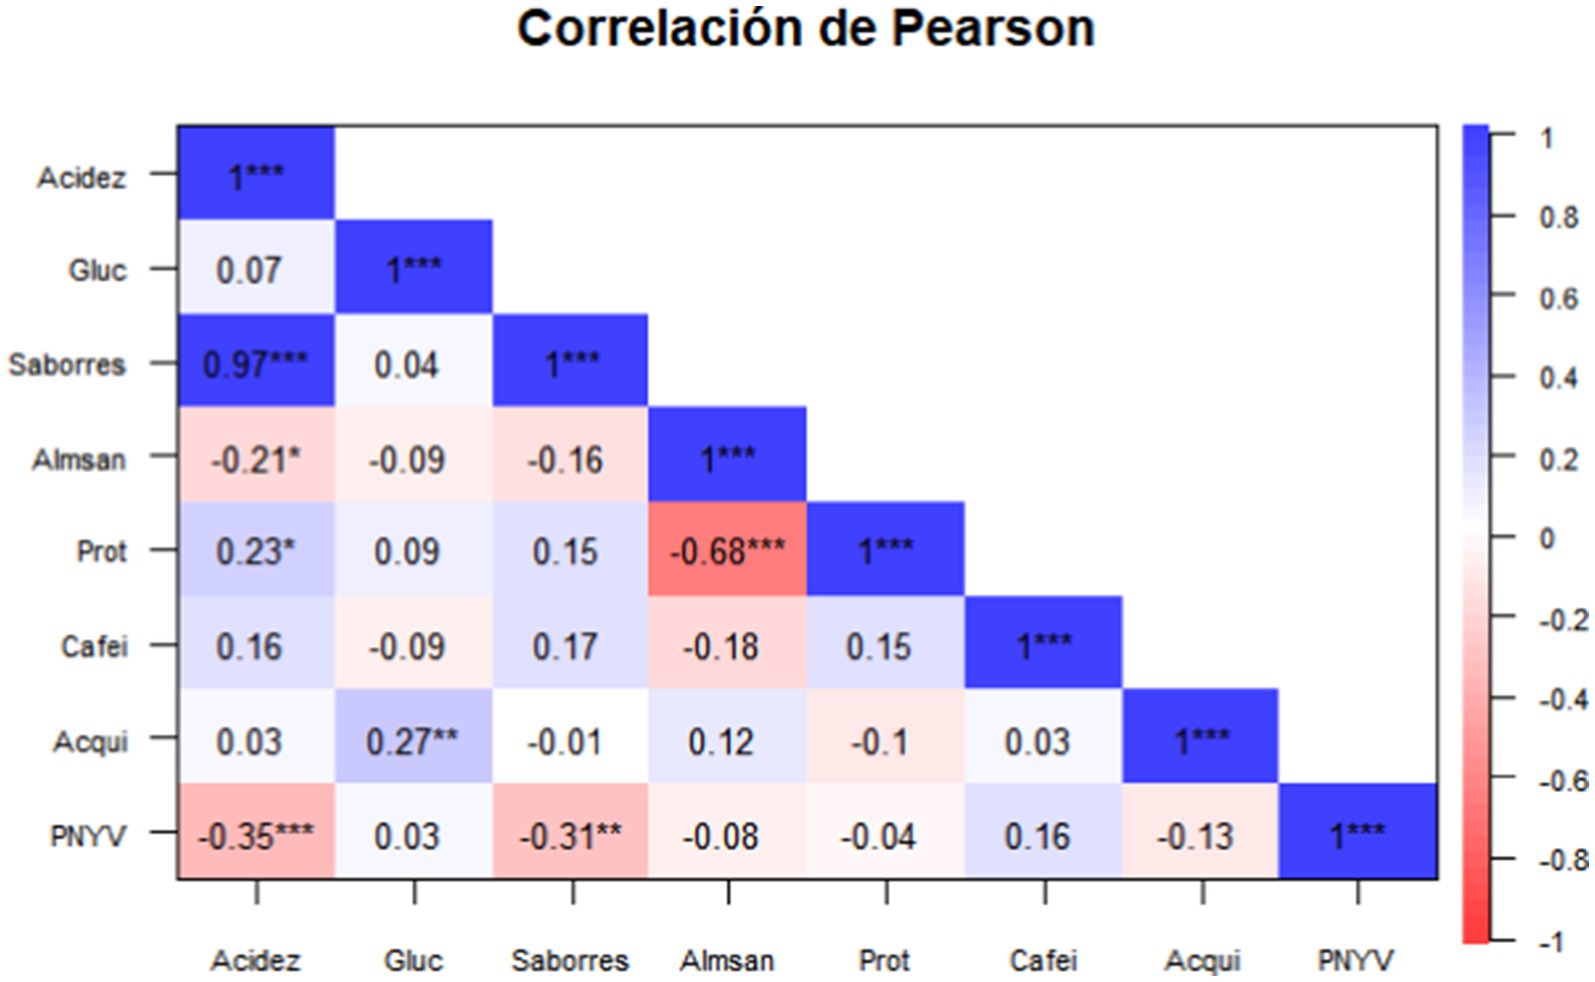
Figure 6. Heatmap of coffee quality variables in fruits with different reserve conditions.
4 Discussion
The increase in the temperature of the coffee mass can be explained by the exothermic process generated by microbial growth. Yusianto and Nugroho (2014) reported temperature increases of up to 44°C in the storage of Arabica coffee cherries in plastic bags. These same authors found that the storage of the fresh fruit for 1 day did not generate significant changes, but after 2 days, the external color of the fruit turned brown and the third day black color and this was associated with the fermentation processes of the exocarp. Similarly, López et al. (1990) reported that the temperature increased from 23°C to 26°C when coffee beans were stored in expanded polystyrene boxes for 24, 50, 69 and 138 h. The change in the red color of the coffee fruit to brown and black is explained mainly due to the role of the enzymes peroxidase and polyphenoloxidase (Takahama, 2004).
The maximum percentage of black beans and vinegars was found in the SM2 state of maturity with a temperature of 20°C and a maximum reservation time of 48 h, which can be due to what was reported by Ikumi et al. (2017), who mention differences in color between the coffee beans of freshly processed and soaked fruits, attributing it to the effect of the leaching of the color pigments from the outer layer of the coffee fruit. Yusianto and Nugroho (2014) reported an increase in the value of defects as coffee fruit is stored in plastic bags. Additionally, Vargas et al. (2005) showed a negative correlation between the number of black beans and those attacked by insects with the quality of the flavor.
Thirty-eight organic acids have been identified and quantified in roasted coffee, with citric, malic and quinic acids being the most prominent in green coffee (Yeager et al., 2021). Citric, quinic, malic and acetic acids were confirmed as major acids in the green coffee beans, with average values of 10.56, 5.58, 5.05 and 2.64 (g/kg), respectively. Bruyn et al. (2017) reported a decrease in the citric acid content when they compared the type of processing by wet and dry routes, also reported that mucilage changes are reflected in the endosperm, where they found high concentrations of microbial metabolites. During the reserve in the exocarp and mesocarp diverse reactions are generated such as hydrolysis, fermentations and oxidations that affect the composition of the different organic acids, which configures a source of change in the coffee bean, which in addition responds to external conditions.
Changes in sugar composition can be explained by the response of the beans to anoxia generated by the pericarp and the conditions of the reserve (oxygen restricted). These conditions can cause germination, which in turn leads to consumption of other carbohydrates, which is even more intense during the reserve. Coffee beans under reserve conditions continuously consume and modify carbohydrates through glycolysis, which causes changes in the concentration of sugars in the endosperm. Ikumi et al. (2017) indicated that there were no significant differences in the sucrose content of green coffee beans stored under water for 10 days and of fresh processed coffee. They reported the sucrose content in a range between 5.67 ± 0.31 and 6.60 ± 1.31%, showing that the sucrose content for Arabica coffee is in the range of 5.1–9.4%. Bruyn et al. (2017) reported a reduction in the sucrose content in coffee beans as the drying time passed, processed by wet and dry methods, going from contents of 8.9 and 8.1% to values of 7.1% and 5 8% in wet and dry processed coffee, respectively. The decrease also was attributed to the slow aeration that occurs in the storage process, when Bruyn et al. (2017) determined the concentrations of monosaccharides and sucrose in coffee obtained by the dry route and stacked for 6 days before starting the drying. Caixeta et al. (2013) stored coffee fruits for up to seven days and did not observe significant differences in the content of total sugars, reducing and non-reducing, with average values for the total of 9.04 and 0.27%, associating the non-significant results to the lower residence times of the mucilage and the peel with the bean in comparison with other types of processing of the fruit.
The analysis of variance did not show the effect of treatments on the total lipids, composition of the different free fatty acids of the coffee bean, total crude protein, caffeine, theobromine, trigonelline and total chlorogenic acids. The behavior of caffeine and trigonelline agrees with that indicated by Ikumi et al., 2017, who found that there are no significant differences in these compounds for coffee fruits stored under water and freshly processed fruits. They reported caffeine contents ranging from 1.04 ± 0.4 to 1.13 ± 0.61% and trigonelline contents of 0.88 ± 0.27 and 1.15 ± 0.20%. Wet processed coffee has a higher chlorogenic acid content than dry or semidry processed coffee (Yusianto and Nugroho, 2014). Chlorogenic acid is an important phenolic compound in enzymatic browning reactions, which can affect the taste of coffee and are influenced by the responses of plants to environmental stress conditions (Farah et al., 2006; Yusianto and Nugroho, 2014). However, the contents for the reserve treatments evaluated did not generate changes in the total content of chlorogenic acids, the foregoing agrees with that reported by Ikumi et al. (2017), who did not observe significant differences between samples of coffee fruits submerged for 7 and 10 days with daily water change and without water change and freshly processed coffee cherries.
The fruit reserve is a stage that can generate positive and negative changes in the sensory quality of coffee. This research did not generate changes in the quality expressed as total SCA score, but it did generate changes in the positive sensory descriptors of flavor in the treatments with longer reserve time. Yusianto and Nugroho (2014), report that the storage of coffee cherries in plastic bags before pulping can only be for a maximum of 2 days, since longer times will degrade the physical properties and the complementary flavor, additional time caused a decrease in aroma; otherwise storage in water, with daily change, did not induce a decrease for up to 7 days in the fragrance and aroma of coffee. Ikumi et al. (2017) determined, in terms of flavor and the general assessment of the coffee beverage, that the one obtained from freshly processed fruits yielded the best score, while that obtained from fruits submerged for 10 days without water had the lowest score. Similarly, López et al. (1990) reported that the intensity of the sensory defect associated with overfermented flavor increased as the waiting time increased, reporting a stinker defect after 140 h of storage. This is contrary to what was reported by Caixeta et al. (2013), where the evaluations of the quality of coffee stored for up to 7 days showed similar results to the control. On the other hand, Velmourougane et al. (2011) determined that the delays in the coffee fruit process had a negative effect on the general sensory quality and this depended on the type of processing. Coffee has a higher incidence of mold, indicating that the mucilage secreted from the fruit during prolonged storage acts as an excellent medium for microbial growth. Brioschi et al. (2021) evaluated cherry coffee packed in sterile plastic bags under vacuum for 24, 48, 72, 96 and 120 h and at three controlled temperatures, 18°C, 28°C and 38°C. For the combination of 38°C and 120 h of waiting, they obtained the highest average total score of 85.15 points.
Yusianto and Nugroho (2014) reported that the longer the coffee fruit is stored in plastic bags, the lower the flavor value, acidity, and total flavor score. On the other hand, storing the fruit in water without changing or changing the water every day does not decrease flavor, acidity, and overall flavor value (Ikumi et al., 2017). They did not observe significant differences concerning the body and acidity concerning storing samples recently processed and stored in water. Yusianto and Nugroho (2014) report that the floral and spicy flavor character predominates in coffee stored for less than 4 days; after this time, herbal flavors are detected, and flavor defects are detected after 7 days. The storage times of fruit in plastic bags generate positive changes in shorter storage times, for this investigation, 48 h. The distribution of the samples differed in the sensory descriptors in the categories of fruit, red fruits, and dried fruits; a more significant number of samples were in the first two categories, but a smaller proportion was in the third.
5 Conclusion
This research evaluated three different stages of maturity and subjected them to 4 reserve conditions with the same packaging. The above implied changes from the chemical composition of the bean that varied according to the degree of maturity, but the change of the same compound at the same temperature, time or interaction of both is not recurrent; for this reason, the changes evidenced depend on the conditions at hand those that are subjected to the fruits and their differences in the composition of the stages of maturity. Unlike other authors who report that long soaking conditions of the fruits and long times elapsed between harvest and processing have no effect on the biochemical compounds but on the different sensory attributes, the conditions evaluated in this research determine changes in organic acids and sugars but not in sensory quality expressed as a total SCA score. The reserve of coffee fruit for up to 48 h at the temperatures and degrees of maturity of the fruit evaluated did not generate changes in the attributes of the coffee, but did generate changes in the sensory profile of the beverage, which allowed a discrimination of the quality of the coffee with this type of reserve. At this stage, it is important to ensure the integrity of the fruit before being placed in the reserve, since the hydraulic classifications used to eliminate low-quality fruits, the elimination of deteriorated fruits and the reduction of the initial temperature avoid undesirable fermentations and the growth of molds that can have a negative effect on quality.
Data availability statement
The original contributions presented in the study are included in the article/supplementary material, further inquiries can be directed to the corresponding author.
Author contributions
VO: Conceptualization, Data curation, Formal analysis, Investigation, Methodology, Project administration, Writing – original draft. JP: Data curation, Investigation, Writing – review & editing. RM: Data curation, Formal analysis, Methodology, Writing – review & editing.
Funding
The author(s) declare that financial support was received for the research, authorship, and/or publication of this article. This work was supported by National Coffee Research Center (Cenicafé) (Crossref Funder ID 100019597).
Acknowledgments
The authors gratefully acknowledge Dr. Hernando Duque and Dr. Álvaro Gaitán of Cenicafé; the colleagues Claudia Gallego, Luz Fanny Echeverri, Paola Calderón, Wilson Vargas, Víctor Castañeda, Carlos Gonzalo Mejía, José Farid López, John Félix Trejos, Esther Cecilia Montoya and Rubén Medina.
Conflict of interest
The authors declare that the research was conducted in the absence of any commercial or financial relationships that could be construed as a potential conflict of interest.
Publisher’s note
All claims expressed in this article are solely those of the authors and do not necessarily represent those of their affiliated organizations, or those of the publisher, the editors and the reviewers. Any product that may be evaluated in this article, or claim that may be made by its manufacturer, is not guaranteed or endorsed by the publisher.
References
Amorim, A. C. L., Hovell, A. M. C., Pinto, A. C., Eberlin, M. N., Arruda, N. P., Pereira, E. J., et al. (2009). Green and roasted Arabica coffees differentiated by ripeness, process and cup quality via electrospray ionization mass spectrometry fingerprinting. J Brazilian Chem Soci. 20, 313–321. doi: 10.1590/S0103-50532009000200017
AOAC Official Method 945.16 (2005). Soxhlet extraction with petroleum ether in Official Methods of Analysis of AOAC International. 18th Edn. Gaithersburg, MD: AOAC International.
AOAC Official method 969.33 (2000). Fatty acids in oils and fats. Preparation of methyl esters boron trifluoride method of AOAC International. 15th Edn. Gaithersburg, MD: AOAC International.
AOAC Official Method 990.03 (2006). Protein (Crude) in Animal Feed, Combustion Method, in Official Methods of Analysis of AOAC International. 18th Edn. Gaithersburg, MD: AOAC International.
Brioschi, D., Guarconi, R. C., de Cassia Soares da Silva, M., Reis Veloso, T. G., Megumi Kasuya, M. C., da Silva Oliveira, E. C., et al. (2021). Microbial fermentation affects sensorial, chemical, and microbial profile of coffee under carbonic maceration. Food Chem. 342:128296. doi: 10.1016/j.foodchem.2020.128296
Bruyn, F. D., Zhang, S. J., Pothakos, V., Torres, J., Lambot, C., Moroni, A. V., et al. (2017). Exploring the impacts of postharvest processing on the microbiota and metabolite profiles during green coffee bean production. Appl. Environ. Microbiol. 83, e02398–e02316. doi: 10.1128/AEM.02398-16
Caixeta, I. F., Mendes Guimarães, R., and Malta, M. R. (2013). Quality of coffee seeds after retardment of post-harvest processing. Coffee Sci. 8, 249–255. doi: 10.25186/cs.v8i3.425
Clarke, R. J., and Vitzthum, O. G. (2001). “Technology III: instant coffee” in Coffee: Recent developments. eds. R. Clarke and O. G. Vitzthum (Hoboken, NJ: John Wiley & Sons, Ltd.), 125–139.
Clifford, M. N. (1985). “Chemical and physical aspects of green coffee and coffee products” in Coffee: Botany, biochemistry and production of beans and beverage. eds. M. N. Clifford and K. C. Willson (New York, NY: Springer US), 305–374.
Colombian Institute of Technical Standards and Certification (2021). NTC 2324: Green coffee. Olfactory and visual examination and determination of foreign matter and defects. Available at: https://tienda.icontec.org/gp-cafe-verde-examen-olfativo-y-visual-y-determinacion-de-materia-extrana-y-defectos-ntc2324-2021.html (Accessed December 10, 2023).
de Melo Pereira, G. V., de Carvalho Neto, D. P., Magalhães Júnior, A. I., Vásquez, Z. S., Medeiros, A. B. P., Vandenberghe, L. P. S., et al. (2019). Exploring the impacts of postharvest processing on the aroma formation of coffee beans – a review. En Food Chem. 272, 441–452. doi: 10.1016/j.foodchem.2018.08.061
De Melo, G. V., Soccol, V. T., and Soccol, C. R. (2016). Current state of research on cocoa and coffee fermentations. Food Sci. 7, 50–57. doi: 10.1016/j.cofs.2015.11.001
Farah, A., Monteiro, M. C., Calado, V., Franca, A. S., and Trugo, L. C. (2006). Correlation between cup quality and chemical attributes of Brazilian coffee. Food Chem. 98, 373–380. doi: 10.1016/j.foodchem.2005.07.032
Franca, A. S., Oliveira, L. S., Mendonca, J. C. F., and Silva, X. (2005a). Physical and chemical attributes of defective crude and roasted coffee beans. Food Chem. 90, 89–94. doi: 10.1016/j.foodchem.2004.03.028
Franca, A. S., Oliveira, L. S., Mendonca, J. C. F., Silva, X., Dias, R. C. E., Benassi, M. D. T., et al. (2005b). Discrimination between Arabica and Robusta coffees using Hydrosoluble compounds: is the efficiency of the parameters dependent on the roast degree? Food Chem. 1, 127–139. doi: 10.3390/beverages1030127
Gonzalez-Rios, O., Suarez-Quiroz, M. L., Boulanger, R., Barel, M., Guyot, B., Guiraud, J.-P., et al. (2007a). Impact of “ecological” post-harvest processing on coffee aroma: II Roasted coffee. Food Comp. Anal. 20, 297–307. doi: 10.1016/j.jfca.2006.12.004
Gonzalez-Rios, O., Suarez-Quiroz, M. L., Boulanger, R., Barel, M., Guyot, B., Guiraud, J.-P., et al. (2007b). Impact of “ecological” post-harvest processing on the volatile fraction of coffee beans: I Green coffee. Food Comp. Anal. 20, 289–296. doi: 10.1016/j.jfca.2006.07.009
Iamanaka, B. T., Teixeira, A. A., Teixeira, A. R. R., Vicente, E., Frisvad, J. C., Taniwaki, M. H., et al. (2014). Potential of volatile compounds produced by fungi to influence sensory quality of coffee beverage. Food Res. Int. 64, 166–170. doi: 10.1016/j.foodres.2014.06.017
Ikumi, P. W., Koskei, R. K., Njoroge, D. M., and Kathurima, C. W. (2017). Effect of soaking coffee (Coffea arabica) cherries on biochemical composition and cup quality of coffee brew. IOSR J. Environ. Sci. Toxicol. Food Technol. 11, 14–18. doi: 10.9790/2402-1106021418
López, C. I., Bautista, E., Moreno, E., and Dentan, E. (1990). Factors related to the formation of'overfermented coffee beans' during the wet processing method and storage of coffee. In 13th International scientific colloquium on coffee, Paipa (Colombia). (pp. 373–384). Association Scientifique Internationale du Café
Peñuela-Martínez, A. E., Zapata-Zapata, A. D., and Durango-Restrepo, D. L. (2018). Performance of different fermentation methods and the effect on quality coffee (Coffea arabica L). Coffee Sci. 13, 465–476.
Ribeiro, L. S., Miguel, M. G. D. C. P., Evangelista, S. R., Martins, P. M. M., van Mullem, J., Belizario, M. H., et al. (2017). Behavior of yeast inoculated during semi-dry coffee fermentation and the effect on chemical and sensorial properties of the final beverage. Food Res. Int. 92, 26–32. doi: 10.1016/j.foodres.2016.12.011
Sanz-Uribe, J. R., Oliveros-Tascón, C. E., Duque Orrego, H., Mejía, C. G., Benavides Machado, P., and Medina-Rivera, R. (2018). Retención de pases: Una opción para mejorar la productividad de la mano de obra en la cosecha de café. Avances Técnicos Cenicafé 488, 1–8. doi: 10.38141/10779/0488
Specialty Coffee Association (2003). Cupping Protocols. Available at: https://sca.coffee/research/protocols-best-practices (Accessed December 10, 2023).
Sunarharum, W. B., Williams, D. J., and Smyth, H. E. (2014). Complexity of coffee flavor: a compositional and sensory perspective. Food Res. Int. 62, 315–325. doi: 10.1016/j.foodres.2014.02.030
Takahama, U. (2004). Oxidation of vacuolar and apoplastic phenolic substrates by peroxidase: physiological significance of the oxidation reactions. Phytochem. Rev. 3, 207–219. doi: 10.1023/B:PHYT.0000047805.08470.e3
Vargas, E. A., Silva, F. B., Santos, E. A., Souza, S. M. C., Souza, S. E., Correa, T. B. S., et al. (2005). Influence of coffee processing and defects on the incidence and occurrence of Ochratoxin A. 20th International Conference on Coffee Science, 410–417.
Velmourougane, K., Bhat, R., Gopinandhan, T. N., and Panneerselvam, P. (2011). Impact of delay in processing on mold development, ochratoxin-a and cup quality in arabica and robusta coffee. World J. Microbiol. Biotechnol. 27, 1809–1816. doi: 10.1007/s11274-010-0639-5
Wei, L., Wai Cheong, M., Curran, P., Yu, B., and Quan Liu, S. (2015). Coffee fermentation and flavor – an intricate and delicate relationship. Food Chem. 185, 182–191. doi: 10.1016/j.foodchem.2015.03.124
Wintgens, J. (2008). Coffee: Growing, processing, sustainable production. Weinheim: Wiley-VCH Verlag GmbH.
Yeager, S. E., Batali, M. E., Guinard, J.-X., and Ristenpart, W. D. (2021). Acids in coffee: a review of sensory measurements and meta-analysis of chemical composition. Crit. Rev. Food Sci. Nutr. 63, 1010–1036. doi: 10.1080/10408398.2021.1957767
Keywords: coffee fruit, quality, maturity, sugars, organic acids
Citation: Osorio V, Pabón J and Medina R (2024) Impact of fruit reserve conditions from harvest to processing on the chemical composition and quality of coffee. Front. Sustain. Food Syst. 8:1425599. doi: 10.3389/fsufs.2024.1425599
Edited by:
Miroslava Rakocevic, State University of Northern Rio de Janeiro, BrazilReviewed by:
Nicolás Oscar Soto-Cruz, TecNM-Instituto Tecnológico de Durango, MexicoWillian Dos Santos Gomes, Federal University of Espirito Santo, Brazil
Copyright © 2024 Osorio, Pabón and Medina. This is an open-access article distributed under the terms of the Creative Commons Attribution License (CC BY). The use, distribution or reproduction in other forums is permitted, provided the original author(s) and the copyright owner(s) are credited and that the original publication in this journal is cited, in accordance with accepted academic practice. No use, distribution or reproduction is permitted which does not comply with these terms.
*Correspondence: V. Osorio, dmFsZW50aW5hLm9zb3Jpb0BjYWZlZGVjb2xvbWJpYS5jb20=