 Muhammad Irshad Ahmad
 Qiong Shen
 Ying Zhang3
 Abdul Rehman
 Hengyun Ma
- 1School of Politics and Public Administration, Zhengzhou University, Zhengzhou, China
- 2Business School, Zhengzhou University, Zhengzhou, China
- 3College of Economics and Management, Henan Agricultural University, Zhengzhou, China
Gaining a comprehensive understanding of the carbon emissions cycle in the atmosphere resulting from agricultural activities is crucial for assessing its influence on environmental quality. This study used panel datasets covering the period from 1990–2022 to investigate the influence of wheat and rice production on environmental quality in the six mega agricultural provinces of China namely Anhui, Hebei, Hubei, Henan, Jiangsu, and Sichuan. Study employed several econometric approaches such as Cross-Sectional Dependency tests, unit root and cointegration tests, Panel Mean Group Autoregressive Distributed Lag (PMG-ARDL), Panel Quantile (PQ) and Panel Least Square (PLS) regression analysis for the robustness of the findings. The empirical findings of PMG-ARDL model reveal that rice production positively increases CO2 emissions in the long run. The variables fertilizers usage, agricultural water consumption and agricultural credit also have positive impact on CO2 emission in the long run. Further, short-term results reveal that all the concerned variables positively contribute to increase the CO2 emissions. The PQR results illustrate that rice and wheat production, fertilizer consumption, agricultural water usage, agricultural credit and agricultural GDP have positive and significant impact on CO2 emission across the quantiles. Additionally, PLS outcomes show positive and significant association between wheat productivity, agricultural credit, fertilizer and agricultural GDP on CO2 emissions. The Dumitrescu and Hurlin (D–H) panel causality show unidirectional association among: carbon emission → pesticides use, carbon emission → temperature, and carbon emission → agricultural GDP. A significant bidirectional causal association was found between: carbon emission ↔ rice production, carbon emission ↔ wheat production, carbon emission ↔ fertilizers use, carbon emission ↔ agricultural water use, and carbon emission ↔ agricultural credit. These findings contribute to the understanding of the drivers of CO2 emissions in agriculture and provide valuable insights for policymakers aiming to mitigate environmental impacts while promoting sustainable agriculture, resilience, financial support to encourage green technology and implement robust monitoring mechanisms to protect quality of environment and agricultural sustainability.
Graphical Abstract.
1 Introduction
Agriculture supports the increasing food needs and offers sustenance to billions of people worldwide. Conversely, the transition from traditional to modern farming has led to a higher need for fossil fuel consumption due to land practices and the use of modern technology in agriculture (Dagar et al., 2020; Khan et al., 2021). As a consequence, agriculture accounts for around 30% of global greenhouse gas emissions (Maraseni et al., 2018; Fox et al., 2019), and has resulted a rise in global temperature by 1.1°C in the previous decade (Nathaniel, 2021). From 1961 to 2013, global GDP expanded by 8.1% per year (Shuai et al., 2018), and this expansion boosted CO2 emissions in the atmosphere by 30%, with human activities accounting for 50% of this rise during the previous decades (Picano et al., 2022). Thus, one of the sustainable objectives is to reduce carbon emissions and provide a better living environment for present and future generations by 2030 (Rehman et al., 2019; Murshed and Alam, 2021).
China is the most populated country, accounting for one-fourth of global grain output and feeding one-fifth of the world’s population (FAOSTAT, 2020; World Bank, 2020). Since 1970, this country has seen an annual agricultural growth rate of 4.6% (Yang et al., 2022; Li et al., 2023). Rice and wheat are major crops that helped to strengthen the country’s economy and address food security concerns. Rice and wheat crops are grown on almost 29.5 and 23.5 million hectares in the entire country, respectively (Statista, 2023). By 2050, the world population will reach 9.8 billion, with rice output increasing by 30% (Cheng et al., 2015; FAO, 2016). China produces 55% of its agricultural output by using advanced farming techniques that enhance the use of fossil fuels, water, fertilizers and pesticides (Ullah et al., 2021). According to FAOSTAT (2020), more than 49% of greenhouse gas emissions in China were expected to be caused by modern agricultural operations between 1993 and 2007, which was greater than the world average of 16.7%. Similarly, China absorbed more than 65% of agricultural freshwater resources, with a water usage efficiency of 32% (which is almost comparable to 70% of world agricultural water consumption) (FAO, 2016; Li et al., 2021). On the other side, fertilizer usage has grown and is anticipated to raise more in the future (Tewatia and Chanda, 2017; Sharma et al., 2021). According to statistics, China’s overall chemical fertilizer output ascended by 70.37 million tons, with the country using 59.12 million tons of this agricultural fertilizer in 2013. According to the investigation, globally, rice and wheat crops utilized more than 31% of total fertilizer when compared to other crops (Erenstein et al., 2022). Rice farming produces 9.9 tons of carbon emissions per hectare, which is double that of wheat and maize crops (Cheng et al., 2015). This study considered datasets from six mega wheat and rice producing provinces in China: Henan, Anhui, Hubei, Jiangsu, Sichuan and Hebei (Figure 1A). Figure 1B represents the trends in CO2 emissions from 1990 to 2022 in these provinces, and highlights the spatial and temporal trends in rice and wheat production and their associated carbon emissions, demonstrating how agricultural practices impact carbon output over time in study provinces. The annual rice production shows consistency across the regions, with slight variations indicating regional changes in rice output. Notably, wheat production appears to increase slightly over the last three decades, with some regions like Henan showing significant production increases. There is a noticeable increase in carbon emissions over the last three decades, particularly in regions such as Hebei, Henan, and Jiangsu, suggesting a correlation between agricultural activities and increased carbon emissions. Alarmingly, China’s agriculture industry has grown per capita carbon emissions from 3 to 7.20 metric tons during the previous two decades (Xu and Lin, 2017; Banerjee and Murshed, 2020). The increased use of agricultural inputs to boost agricultural output is having a negative influence on environmental quality (Aiello et al., 2018; World Bank, 2020). Global CO2 emissions reached out 36.8 billion tons in 2023, with China leading by 11.0 Gt emissions, surpassing the United States, the European Union, India and Brazil during the previous three decades (Mele and Magazzino, 2020; Zhu and Huo, 2022; Global Carbon Emissions, 2023). In China, the farming sector generates 7% of total carbon emissions (Environmental Protection Agency [EPA], 2022). The use of contemporary methods has resulted in a number of environmental and agricultural production challenges, including soil degradation, a fall in the water table and climate change.
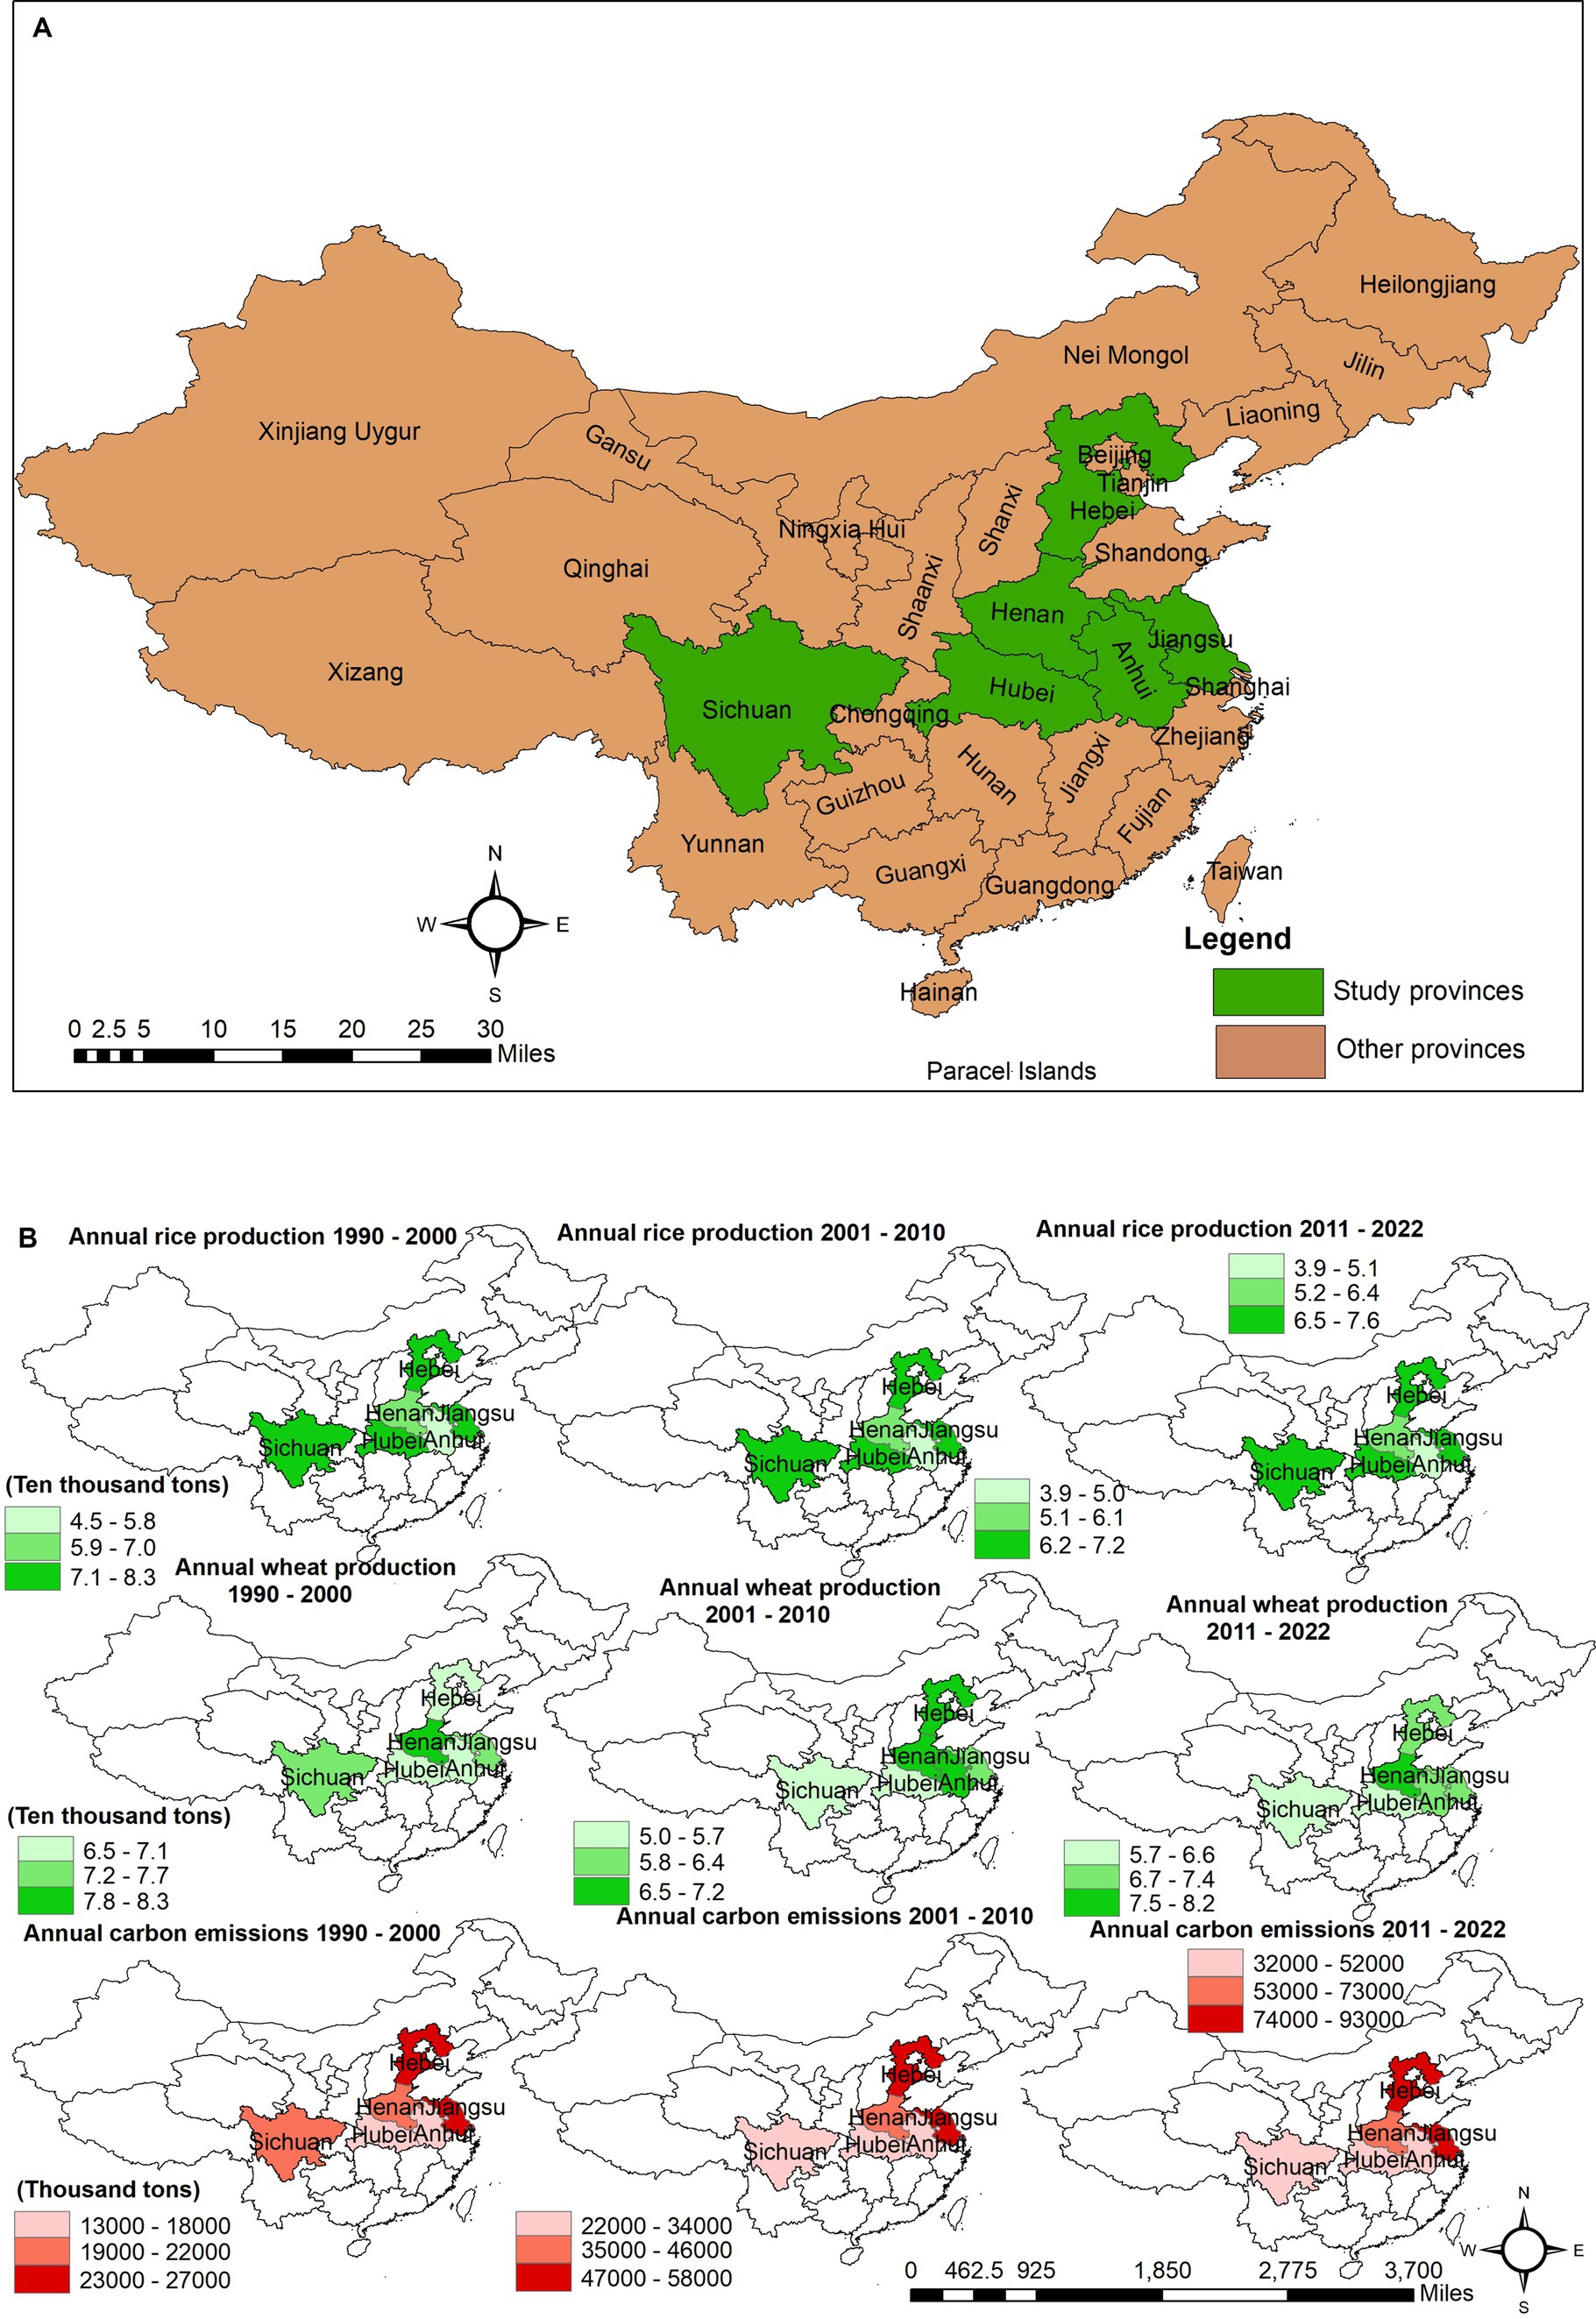
Figure 1. (A) Map of study provinces in China. (B) Trends in rice, wheat production and CO2 emissions from 1990 to 2022. (Source: China Agricultural Statistical Yearbook).
Recent studies highlight significant climate change trends in China since 1950, with surface air temperatures rising faster than the global average and significantly impacting water resources, agriculture, ecosystems, and human health (Sun et al., 2022). China has experienced a decrease in cold days and nights and an increase in warm days and nights, with more pronounced warming in minimum temperatures than maximum temperatures from 1960 to 2011 (Shen et al., 2017). Such changes emphasize the growing influence of anthropogenic factors, particularly greenhouse gas emissions, on China’s climate patterns. Therefore, to address these issues Intergovernmental Panel on Climate Change (IPCC) stressed to reduce carbon emissions to limit global temperature by 1.5°C (Masson-Delmotte et al., 2018). Moreover, Food and Agricultural Organization (FAO) is also focused to reduce agricultural carbon emissions by 80 to 88% through structural changes in agricultural practices and a transition in the energy mix from non-renewable sources to renewable one (Reynolds and Wenzlau, 2012). As China is highest emitter of greenhouses gasses in the world, therefore, Chinese government also declared its commitment during the 75th United Nations General Assembly to implement robust policies to reduce carbon emissions by 2030 and achieve carbon neutrality by 2060 (Zhu and Huo, 2022). Therefore, Ministry of Agriculture and Rural Affairs of China issued technical guidelines for green agricultural growth 2018–2030 through technical invention to promote eco-friendly farming practices to reduce agricultural carbon emissions in the country (Shen et al., 2020). As a result, agricultural chemical fertilizers consumption declined in the country from 70.37 million tons to 52.51 million over the past decade (Li et al., 2021). China had a continuous rise in carbon emissions from 1996 to 2016, as reported by Zhang et al. (2019). However, the volume of these emissions decreased by 49.6%, falling from 0.127 kg per yuan in 1996 to 0.064 kg per yuan in 2016, according to Huang et al. (2019). In addition, various measures have been devised to decrease carbon emissions from rice production. These include the implementation of intermittent irrigation technology (Dong et al., 2018), the utilization of slow release fertilizers (Hillier et al., 2009), the adoption of straw returning techniques to enhance soil fertility (Zhang et al., 2019), and the optimal use of pesticides through the application of biological control methods, which has resulted in reduced carbon emissions and increased rice production (Fan et al., 2020).
Previous studies have examined carbon emissions, energy consumption, economic growth, renewable energy use and total agricultural output. However, this study distinguishes itself from previous research by focusing on specific behaviours. It addresses a gap in the existing literature by analyzing the agricultural production of two major crops, rice and wheat. These crops are cultivated using modern technology and require significant amounts of fertilizers and pesticides, which contribute to the increase in carbon emissions. Multiple studies have examined the impact of agricultural inputs on agricultural productivity, such as those conducted by Kuriachen et al. (2022), Chandio et al. (2023a), Onyeneke et al. (2024), Gul et al. (2022), and others. However, there is a lack of literature regarding the impact of agricultural inputs consumption on carbon emissions. The studies, including Koondhar et al. (2021a), examined the effects of different levels of fertilizer usage on cereal crop output. They discovered both positive and negative correlations between agricultural carbon emissions and cereal crop yields. However, our analysis differs in many aspects, including the choice of crops, the kind of data used, and the inclusion of several factors such as pesticide and fertilizer use, agricultural water usage, agricultural credit, climate change, and the influence of agricultural GDP on carbon emissions. This research aims to address the existing knowledge gap by examining the effects of the growing usage of fertilizers, pesticides, and agricultural water use on carbon emissions during the production of wheat and rice crops. Prior research has examined the extent of irrigated land and its impact on agricultural production, as shown by studies conducted by Zhang et al. (2022), Pickson et al. (2021), and Zhai et al. (2017). Additionally, the relationship between water energy consumption, water energy management and carbon emissions has been explored in studies conducted by Wang et al. (2020) and Anser et al. (2020). Nevertheless, the relationship between the amount of water used in agriculture and the release of carbon emissions has not yet been thoroughly investigated. Thus, this research addresses the existing deficiencies by considering the influence of agricultural water usage on carbon emissions. Previous study has examined the total influence of GDP on carbon emissions. Nevertheless, including agricultural GDP into our analysis enhances our knowledge of the intricate relationship between the rise of agricultural GDP and its influence on carbon emissions. Various studies have examined the influence of carbon emissions on climate change. However, there is a dearth of data to evaluate the effect of climate change on carbon emissions.
The significance of this study extends beyond its academic contributions. Its findings have practical implications for policymakers, agricultural planners, and environmental regulators. The positive association between rice production and CO2 emissions. For example, the results suggest that sustainable rice farming practices are crucial for reducing carbon footprints. The study insights into the role of fertilizers, agricultural water usage, and agricultural credit in driving emissions underscore the need for integrated resource management policies that promote efficiency and sustainability. Moreover, the study analysis of the impact of temperature on carbon emissions provides valuable information for developing climate adaptation strategies. Understanding the intricate relationship between climate change and agricultural emissions can help in formulating policies that mitigate adverse environmental impacts while supporting agricultural productivity. By highlighting the importance of adaptive agricultural approaches, this study contributes to the broader discourse on environmental sustainability and food security. It provides evidence-based recommendations that can help balance the dual goals of increasing agricultural output and reducing environmental harm. This is particularly relevant in the context of global efforts to address climate change and ensure sustainable development. Overall, this study enriches the literature by offering detailed, region-specific insights into the environmental impacts of agricultural practices and provides practical guidance for policymakers aimed at achieving sustainable agricultural development.
The subsequent sections of the article are structured in the following manner: Section 2 summarizes the current body of literature and theoretical framework. Section 3 details the techniques and materials used in the research. Section 4 examines the outcomes of the study. Finally, Section 5 gives closing comments and recommends the policy implications.
2 Existing literature
The existing literature represents multifaceted relationship between our selected variables and CO2 emissions. The environmental consequences of carbon emissions have been extensively studied in relation to economic growth and industrial structure (Walheer, 2018; Wang and Zhang, 2021). However, the correlation between agricultural production and carbon emissions from this sector remains uncertain. Hence, the study objective is to enhance comprehension of this correlation by a comprehensive analysis of current scholarly works on agriculture and carbon emissions, with the purpose of pinpointing the disparities between our study and previous investigations.
Numerous studies have looked at the processes of ecological integrity, but the correlation between agricultural output and carbon emissions has received less attention in their studies. Valin et al. (2013) found a correlation between feed for livestock, crop productivity, and greenhouse gas emissions. They also anticipated that by 2050, reducing yield gaps in developing countries might lead to an 8% drop in agricultural-related greenhouse gas emissions. In a study conducted by Dufour et al. (2009), an analysis of greenhouse gasses data revealed a negative correlation between climate change and agricultural productivity. The researchers discovered that a 100% increase in gas emissions led to a significant loss of 22.26% in farming production. According to Reynolds et al. (2015), there is a strong and statistically significant interaction among agricultural production and carbon emissions across Africa and South Asia, with agricultural yield having a negative impact on carbon emissions. In a study conducted by Zhang et al. (2017), it was shown that burning agricultural residuals leads to an increase in carbon emissions and has a negative influence on the environment’s quality. Edoja et al. (2016) established a direct correlation between agricultural productivity and carbon emissions, indicating that as agricultural production increases, carbon emissions decrease. Nwaka et al. (2020) proposed that the influence of global warming on agricultural production is less significant compared to the yield response to carbon dioxide fertilization. Furthermore, Rehman et al. (2019) quantified the influence of agricultural production on carbon emissions in Pakistan. They discovered a positive long-term effect on carbon emissions related to factors such as crop area, energy consumption, per capita income, fertilizer use, and water availability. Durba and Tripti (2021) found that rice cultivation resulted in more carbon emissions compared to wheat production. This was attributed to the increased use of fertilizers and higher water usage. In a study conducted by Zhang et al. (2017), the researchers investigated the carbon emissions associated with rice production. They discovered that fertilization accounted for 8 to 49% of the carbon emissions, straw burning contributed 0 to 70%, machine energy consumption ranged from 6 to 40%, and irrigation energy consumption varied from 0 to 44%. Similarly, Jin et al. (2023) determined that increased use of energy, fossil fuels, and agricultural inputs significantly contribute to the main source of greenhouse gas emissions in wheat production. However, they conducted an investigation of their influence on carbon emissions.
Several scholars used different model estimations to investigate the impact of desired variables. For instance, Rahim et al. (2024) employed Autoregressive Distributed Lag (ARDL) model to investigate fertilization techniques on wheat cultivation and estimate the short-term and long-term impact of CO2 emissions in Pakistan, and found significant impacts of technological developments, energy consumption and agricultural land allocation on wheat production. They suggested that technology improvement and optimal use of energy to manage agricultural practices and increasing labor practices can reduce carbon emissions and increases wheat production. Similarly, Chandio et al. (2023b) applied ARDL model and found the negative impact of carbon emission on grain crop production in China. Their results suggested that by increasing the area allocated to grain crops and increasing the fertilizer usage have positive impact on grain crops production in both short and long terms. A study of Demirhan (2020) show the impact of temperature and carbon emission on global wheat production through application of ARDL model, and found the temperature differences and carbon emissions have insignificant impact on global wheat production in the short-term effects, while their lagged short-term effects have significant impact on wheat production. He suggested that the interventions to counteract climate change on wheat production may not be apparent, however, the increase in temperature significantly reduces the wheat production and increase in CO2 emissions positively affect wheat yield in the long run. Therefore, prioritizing the resources for adaptive practices in wheat production to mitigate the long-term impact of temperature anomalies is crucial, despite the moderating effect of increasing carbon emissions levels on the decline in wheat yield. Koondhar et al. (2021b) investigated the direct correlation between agricultural carbon emissions and cereal crop productivity in Pakistan. The researchers discovered the diverse effects of energy and fertilizer usage on cereal crop yield.
Our study differs from the aforementioned studies as it addresses the gaps by specifically focusing on two major crops, wheat and rice. Additionally, we include a wide range of significant variables such as pesticide consumption, fertilizer usage, agricultural water consumption, agricultural credit, climate change (measured by temperature), and the impact of agricultural economic growth (measured by agricultural GDP) on carbon emissions. However, there is a growing trend in economic growth towards the use of renewable energy as a substitute for fossil fuels. This shift aims to decrease agricultural carbon emissions, which now account for about one fourth to one third of total world emissions to ensure the long-term viability of the agricultural sector (Huang et al., 2019; Zhang et al., 2019).
2.1 Theoretical framework
Prior to delving into the investigation, it is essential to understand the interaction between carbon emissions and farming activities. The mid-20th century saw a significant growth in agricultural output, primarily to the modernization of the farming industry. This was achieved by enhancing productivity via the improved use of agricultural inputs and modifications in the cultivation process. The rapid development of contemporary technology has led to a surge in the need for fossil fuels in the agricultural sector, therefore resulting in heightened carbon emissions in the Earth’s atmosphere. These practices exert significant strain on agricultural productivity and environmental well-being, both in the short and long term, due to environmental issues, loss of soil fertility, and high agricultural water usage (Reay et al., 2012). According to Zhang et al. (2018), farmers tend to exhibit rational behaviors and emphasize increasing the use of agricultural inputs to improve agricultural production, frequently disregarding the larger issues of the environment and human health. Furthermore, the increasing need for food is motivating farmers to embrace sophisticated technology that often relies on fossil fuels, leading to a significant surge in carbon emissions (Lin and Xu, 2018; Aguilera et al., 2019; Zhang et al., 2019; Shabani and Shahnazi 2019; Ntiamoah et al., 2022; Pathak and Fagodiya 2022). Furthermore, farmers are incentivized with financial assistance to enhance the output of agriculture. Consequently, producers exceed the recommended threshold of optimum levels by intensifying the use of fertilizers and pesticides. Likewise, the need for water for irrigation grows, leading to increased energy use and carbon emissions. These specific farming techniques are causing a rise in carbon emissions and have been identified as a significant source of environmental degradation (Bakhsh et al., 2017).
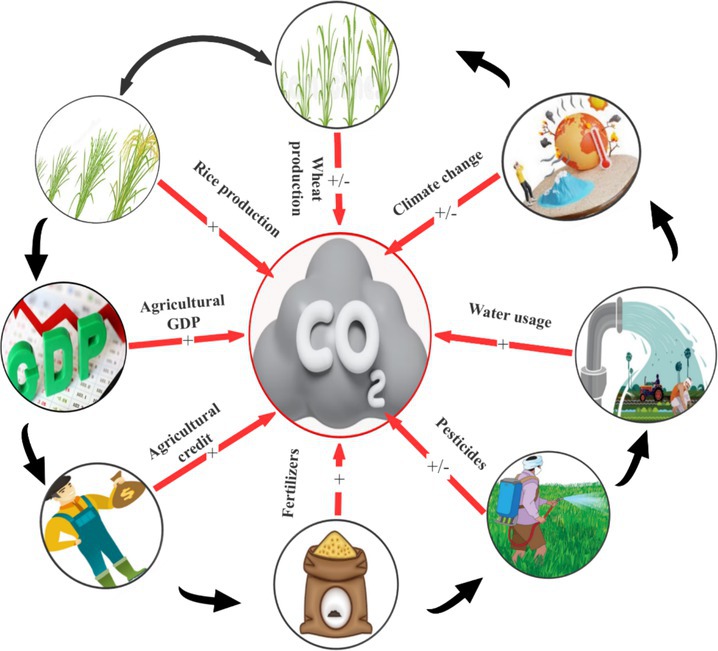
Modern agriculture utilizes advanced agricultural techniques to increase output by extensively using fertilizers, pesticides, water, and financial assistance to farmers. Moreover, these activities have a detrimental effect on climate change and contribute to the rise of carbon emissions in the atmosphere. Figure 2 illustrates a cyclical system of carbon emissions resulting from the farming techniques involved in rice and wheat cultivation. In order to keep up with the increasing need for food, farmers often use excessive amounts of fertilizers, pesticides, and irrigation. The practice is done by adopting advanced agricultural technology, which in turn increases the use of fossil fuels. The manufacture of fertilizers and pesticides itself adds to carbon emissions, since companies require a substantial amount of energy and release carbon dioxide throughout the manufacturing process. In addition, the widespread usage of fertilizers, pesticides, and water, which subsequently evaporates into the atmosphere, greatly contributes to carbon emissions. While this practice may enhance agricultural yield in the short term, it ultimately has detrimental effects on the environment and human health in the long term. These techniques actually decrease soil fertility, lower the water table, and raise production costs, which eventually lead to a rise in carbon emissions and negative effects on the environment, such as climate change, changes in rainfall patterns, severe temperatures, and floods (Ahmad et al., 2024). These unpredictable fluctuations in climate exacerbate the negative impact on agricultural productivity and decrease crop yields. Examining these intricate connections, it can be said that farming practices have broader ramifications for both the sustainability of the environment and the security of food. Gaining a comprehensive understanding of these factors is crucial in developing successful approaches to reduce carbon emissions, improve agricultural output, and guarantee sustainable food availability in the future.
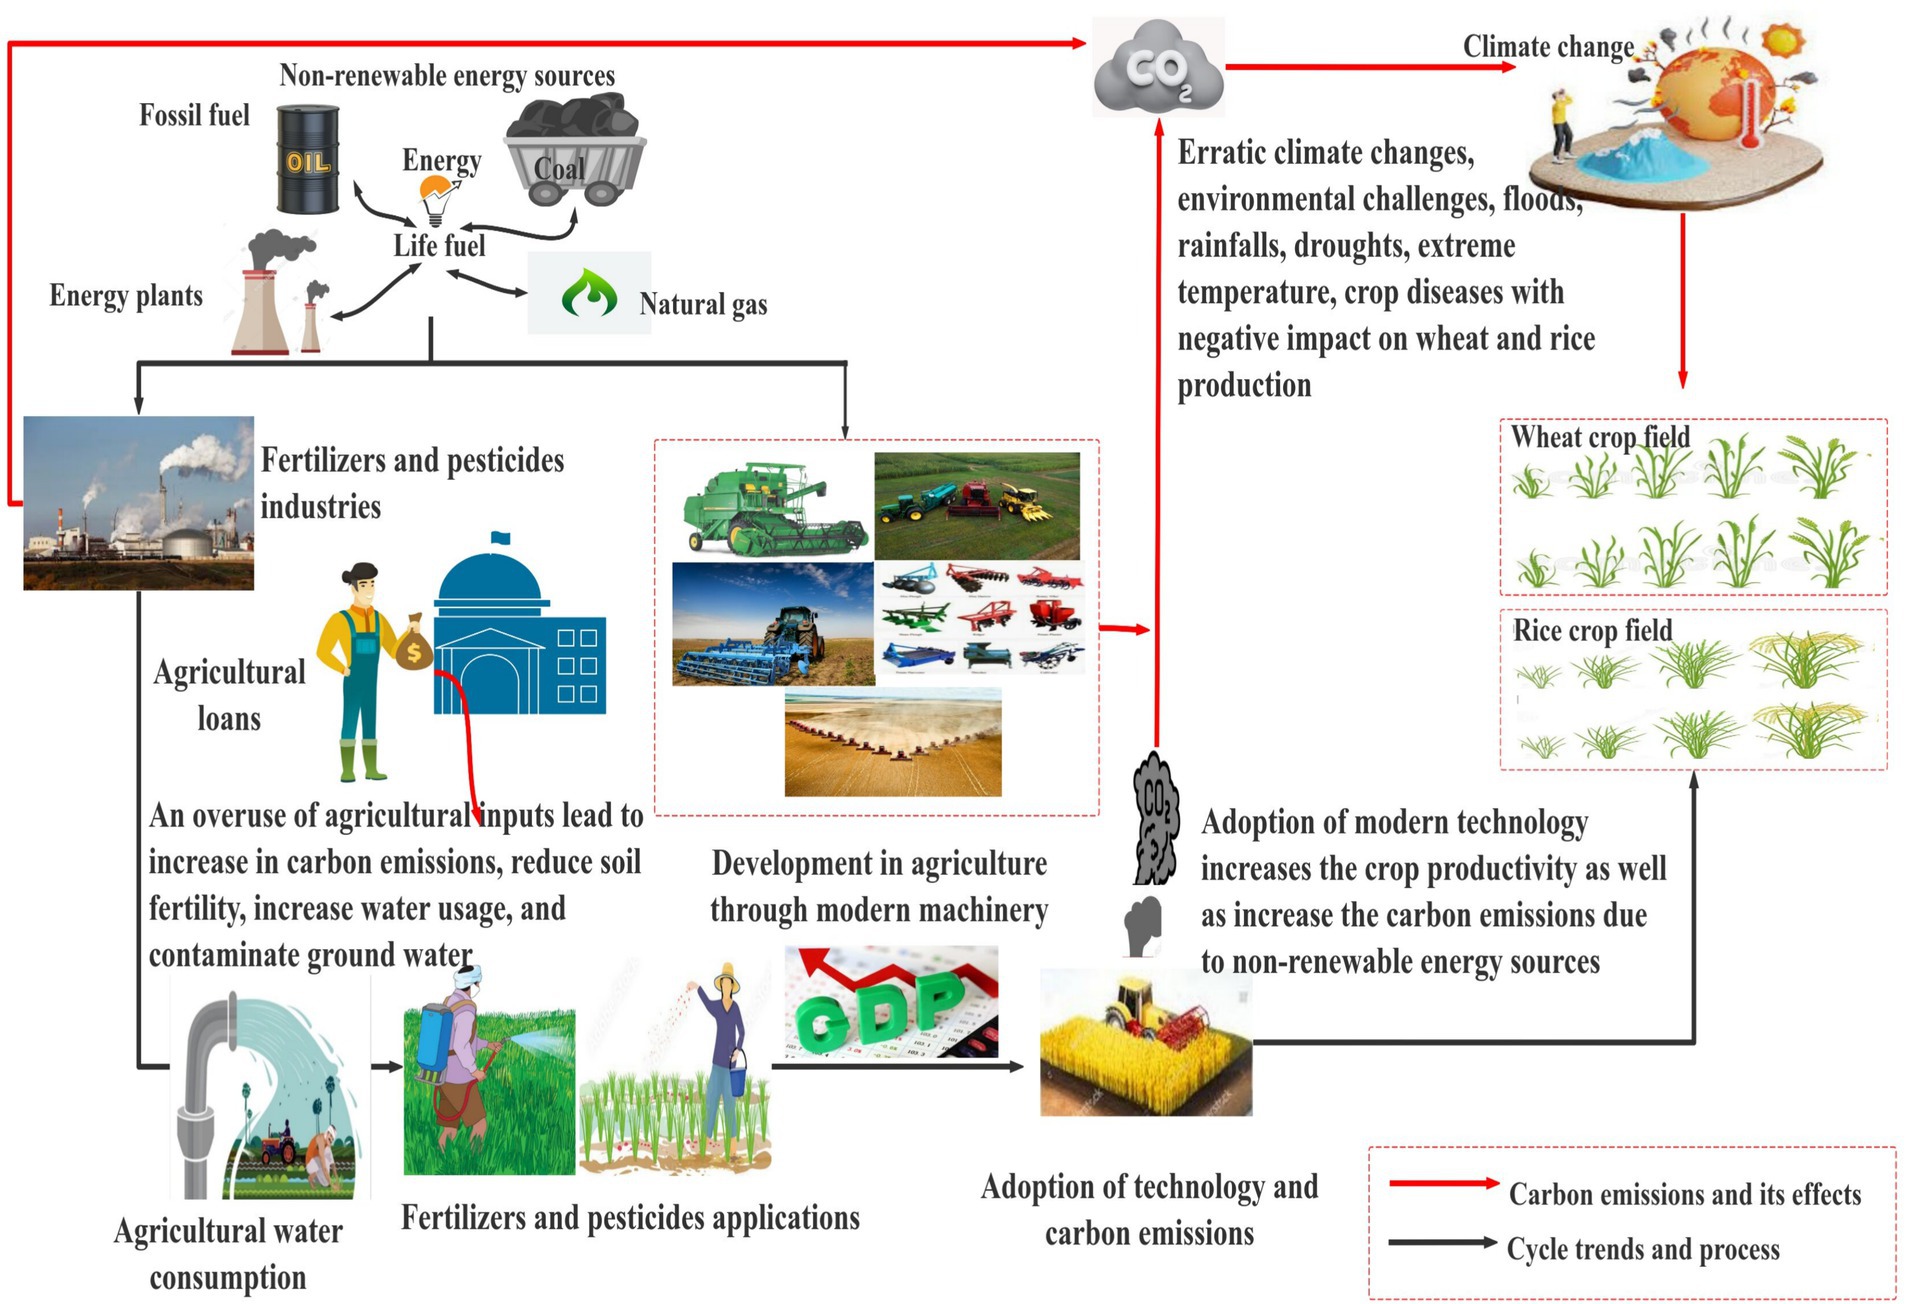
Figure 2. Theoretical analysis of the study.
3 Methodology
3.1 The data
This study analyses panel datasets from six mega wheat and rice producing provinces in China: Henan, Anhui, Hubei, Jiangsu, Sichuan and Hebei. These provinces are major agricultural production regions which contribute a significant agricultural output and account for a substantial share of the country’s rice and wheat production, making them critical for understanding the agricultural sector’s environmental impact (Zhang et al., 2022). Additionally, these regions encompass diverse climatic, economic, and agricultural conditions, providing a comprehensive perspective on the relationship between agricultural practices and carbon emissions (Li et al., 2020). Analyzing the datasets of these provinces ensures the robustness and applicability of the study’s findings across different contexts within China. This approach aligns with previous studies that emphasize the importance of regional diversity in environmental impact assessments (Wang et al., 2020). The key aim is to investigate the impact of wheat and rice productivity with influencing factors; such as pesticides usage, fertilizers usage, agricultural water consumption, financial support to farmers (agricultural credit), climate change and agricultural GDP impact on CO2 emissions. The data for this study is collected from the China Agricultural Statistical Yearbook (CASY) ranging from 1990 to 2022 (Table 1). The temperature data for this study are pre-computed by Cubic Data Academy using original data from NOAA’s National Centers for Environmental Information (NCEI)1. NCEI provides highly reliable meteorological data from observation stations, which Cubic Data Academy interpolates to create nationwide temperature maps. Several studies on climate change have used temperature data from this highly reliable source. As the primary source of greenhouse gas emissions is the combustion of fossil fuels (IPCC [Intergovmental Panel on Climate Change] Climate Change, 2007), therefore, we estimated CO2 emissions based on their historical terminal energy consumption data following Jiehua and Zhang (2020) and Li and Yin (2024). We included nine sources of energy consumption (coal, gasoline, diesel, natural gas, kerosene, fuel oil, crude oil, electricity, and coke) to calculate the total CO2 emissions by using the following equation:
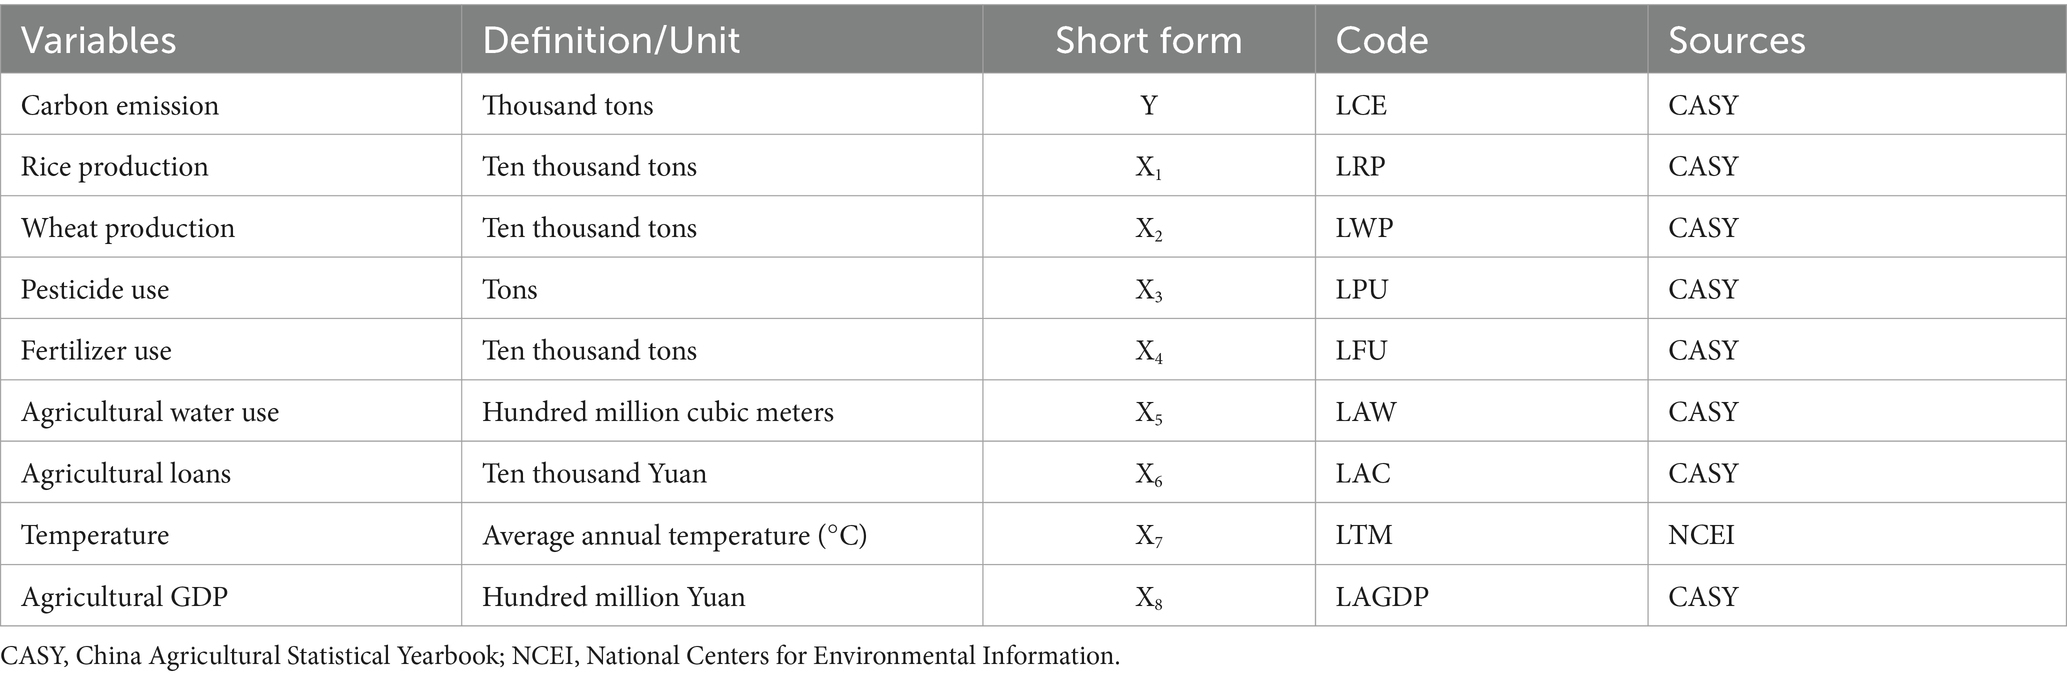
Table 1. The data, variable and sources.
represents the total carbon emissions of province in year ; represents the consumption of the th type of energy in province in year ; represents the carbon emission coefficient of the th type of energy; represents the province ; represents the th energy source. Since the original statistics of various energy consumptions are in physical quantities, they must be converted to standard statistical units for carbon emission calculations. The carbon emission factors of different types of energy are sourced from the “2006 IPCC Guidelines for National Greenhouse Gas Inventories,” and the carbon emission coefficients are calculated based on their average lower heating values and carbon emission factors. The carbon emission coefficients and measurement units of the nine types of energy coal, gasoline, diesel, natural gas, kerosene, fuel oil, crude oil, electricity, and coke 1.9003 kg-CO2/kg, 2.8604 kg-CO2/kg, 3.0202 kg-CO2/kg, 2.9251 kg-CO2/kg, 3.0179 kg-CO2/kg, 3.0959 kg-CO2/kg, 3.175 kg-CO2/kg, 2.1622 kg-CO2/m3, and 0.801 kg-CO2/(Kwh), respectively. Furthermore, the correlation analysis shows that carbon emissions has positive association with water usage, fertilizer usage, agricultural water usage, agricultural credit, and agricultural GDP, while being negatively correlated with rice production as shown in Table 2. Rice production is negatively correlated with water usage, fertilizer usage, and agricultural credit, but positively correlated with temperature. Water usage has positive correlations with fertilizer usage, agricultural credit, and agricultural GDP. Pesticide usage is positively correlated with fertilizer usage, agricultural credit, temperature, and agricultural GDP. Fertilizer usage shows strong positive correlations with water usage, pesticide usage, agricultural credit, and agricultural GDP. Agricultural water usage is positively correlated with agricultural credit and agricultural GDP. Agricultural credit shows strong positive correlations with carbon emissions, water usage, fertilizer usage, and agricultural GDP. Finally, temperature is positively correlated with pesticide usage. The analysis underscores the significant impact of agricultural inputs such as fertilizer usage, agricultural credit, and agricultural GDP on carbon emissions, while crop production has a negative correlation with carbon emissions. This research aims to investigate the interaction between climate change, including changes in temperature, and carbon emissions. The distinctive econometric methodologies of PMG-ARDL were used to evaluate the long-term and short-term impacts of variables. In addition, our analysis also used the Quantile regression and Panel Least Square regression to check the robustness in the findings. Figure 3 presents the econometric strategies employ during the empirical analysis.
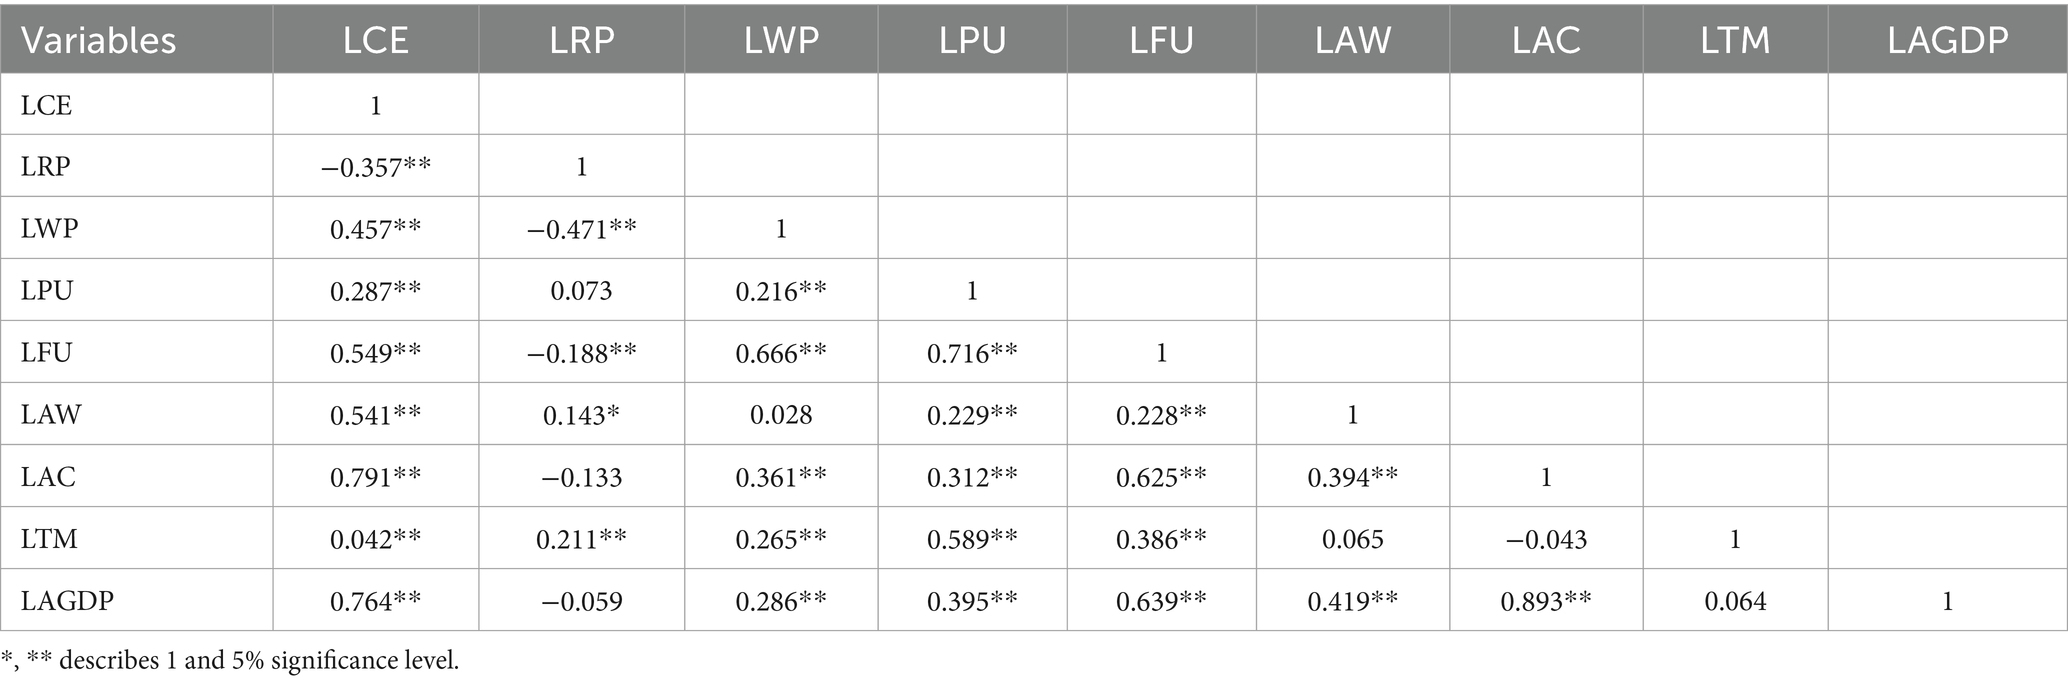
Table 2. Correlations analysis.

Figure 3. The methodological framework of the study.
3.2 Model specification
As this study used panel datasets ranging from 1990 to 2022 to explore the association of CO2 emissions and agricultural production of wheat and rice crops with including influencing factors such as climate change, fertilizers, pesticide, and agricultural water use, agricultural credit and agricultural GDP. To examine the interaction between the variables, the following model may be specified as:
The extended form of Eq. 2 is given as:
Furthermore, the logarithmic form of Eq. 3 can be written as:
where is logarithm of CO2 emissions; is logarithm of rice production; is logarithm of wheat production; is logarithm of pesticide use; is logarithm of fertilizer use; is logarithm of agricultural water use; is logarithm of agricultural credit; is logarithm of temperature; and is logarithm of agricultural GDP of each province; specifies the time measurement of the panel; and represents the dimension of the entity.
3.3 The cross sectional dependence and slope homogeneity method
This is important to investigate the stationarity test of the panel data before moving towards the analysis. In fact, unit root techniques are also effective on panel data as results of issues related to CSD and the homogeneity of slopes (Pesaran, 2015). Thus, in case of dealing with large panel datasets which may have several cross-sections, the Breusch-Pagan LM (BP-LM) test and the Pesaran Scaled LM (PS-LM) test are CSD tests that provide effective outcomes to deal these issues. However, these two investigations did not provide strong statistical conclusions for smaller panel series with lower cross-sections. The cross-sectional test introduced by Pesaran (2015) provides a viable solution to the issue of small sample bias in panel data analysis. We employed an alternative method of interpreting the cross-sectional investigation and is given as:
As it is most important to check the stationarity of the panel data before performing the first step. However, and slope homogeneity might hinder the effectiveness of unit root techniques when used to panel data series (Pesaran, 2015). The BP-LM test and the PS-LM test are two reliable tests that are particularly useful for analysing large panel data sets, especially those with several cross-sections. None of these generated reliable statistical results for smaller panel series with lower cross-sections. In order to mitigate the issue of small sample bias in panel data analysis, Pesaran (2015) developed the cross-sectional test and can be stated as:
Furthermore,
Where show the total number of observation in the sample, is an independent variable; is a comprehensive term, and shows the Swami’s statistics.
3.4 Second generation unit root testing
First-generation unit root tests cannot be used to panel datasets due to the presence of cross-sectional dependence and variability. Thus, in this study, we used the test conducted by Im et al. (2003) and Pesaran and Yamagata (2008), which are second-generation unit root tests, to ensure the reliability of our findings. The following equation can be stated as:
Where represents cross-sectional means. The (Augmented Dickey-Fuller) results are estimated from following equation:
3.5 Panel cointegration test
We also employed the panel cointegration test based on the error-correction to co-integration approach to reveal the long-term dynamics that exist in the panel datasets. For this purpose, we applied second-generation cointegration analyses to determine the long-term relationships among the variables. Because these outcomes remain reliable even when there is no cross-sectional dependency (Persyn and Westerlund, 2008). Therefore, we conducted an analysis to check the relationship among the dependent variables of interest and the null hypothesis. Rejecting the null hypothesis suggests that there is cointegration in the data series. The panel cointegration approach is employed by using the following equation:
3.6 Panel mean group autoregressive distributed lag model
This study employed PMG-ARDL technique proposed by Shin et al. (2014) to evaluate the both short and long run interaction among the variables which is well-suited for large panel datasets of time periods ( ), consistent slopes and stationary values. The PMG-ARDL technique increase the viability and efficacy in assessing both short and long term effects (Tiwari et al., 2023; Wang et al., 2023; Ye et al., 2023; Ma et al., 2024). The mathematical representation of this model is given as:
Where represents dependent variable which is CO2 emission at time for panel unit ; and represents a vector of independent variables which are rice production, wheat production, pesticides use, fertilizers use, agricultural water consumption, agricultural credit, temperature and agricultural GDP. represents the lagged values of the dependent variable at time ; represents the lagged values of independent variable at time ; are coefficients associated with the lagged values of the dependent variable; are coefficients associated with the lagged values of the independent variable; and is error term. For the estimation of short and long run impact, following equation can be specified as:
where is the change in from one period to the next; is the individual specific coefficients capturing the long-term relationship between the lagged values of and at specific to each panel unit ; represents short-term dynamics capturing the lagged first differences of the dependent variable up to lag order , and are the coefficients associated with these lagged first differences. represents short term dynamics capturing the lagged first differences of the independent variable up to lag order , and are the coefficients associated with these lagged first differences; is error term = in the model. represents long-run coefficients; and is the error correction component.
3.7 Panel quantile regression
Panel quantile regression is also employed to estimate the conditional quantiles of a response variable given certain predictor variables to check the connection amid variables across different quantiles of the response distribution, which provides understanding of how the predictors affect different parts of the distribution. Panel quantile regression extends this idea to panel data by accounting for both units for observations (individual-specific) effects and time varying effects to examine the relationships between variables change across different quantiles of the response variable within a panel data.
Where represents CO2 emissions at units for observations t time , is a vector of dependent variables for units for observations t time , is a vector of coefficients for the quantile ; units for observations specific effects; represents time-specific effects; represents conditional quantile of given at at quantile .
3.8 Dumitrescu Hurlin panel causality technique
For the casualty test, we employed Dumitrescu and Hurlin (2012) panel causality to investigate the interaction among CO2 emissions, rice production, wheat production, pesticides use, fertilizers use, agricultural water consumption, agricultural credit, temperature and agricultural GDP. The application of this technique is useful for sustainable production and assist policymakers to get valuable insights by understanding the causal effects among the mentioned variables and Dumitrescu and Hurlin causality test results. The findings indicate that all values vary across different sections. The Dumitrescu and Hurlin panel causality technique was estimated by using the following equation:
where represents the lag duration for the variables, is autoregressive constraint, and is the slope constant that changes across various cross-sections.
4 Results
4.1 Descriptive summary
Table 3 illustrates that the mean of all the variables is positive. The variance between the minimum and maximum values indicates the existence of outliers which show the certain data points that significantly deviate from the whole trend in their logarithmic form. However, the small values of standard deviation suggest that the data points are closely clustered around their individual means which indicate a relatively consistent and stable dataset with minimal deviation from the mean values. The negative Skewness values indicate a left-skewed distribution, and positive values show a right-skewed distribution. Kurtosis measures the flatness of a distribution compared to a normal distribution and positive values indicate heavier tails and a sharper peak. The values below three indicate relatively flatter distributions, while the values above three indicate leptokurtic distributions that suggest more peaked distributions with heavier tails. The Jarque-Bera (JB) test results indicate an asymmetry in the data distribution, deviating from the characteristic bell-shaped curve of a normal distribution. Such deviations imply differences in Skewness and kurtosis features compared to a standard normal distribution. Figure 4 displays the logarithm representations of our all concerns variable across the study provinces over the time from 1990 to 2022.
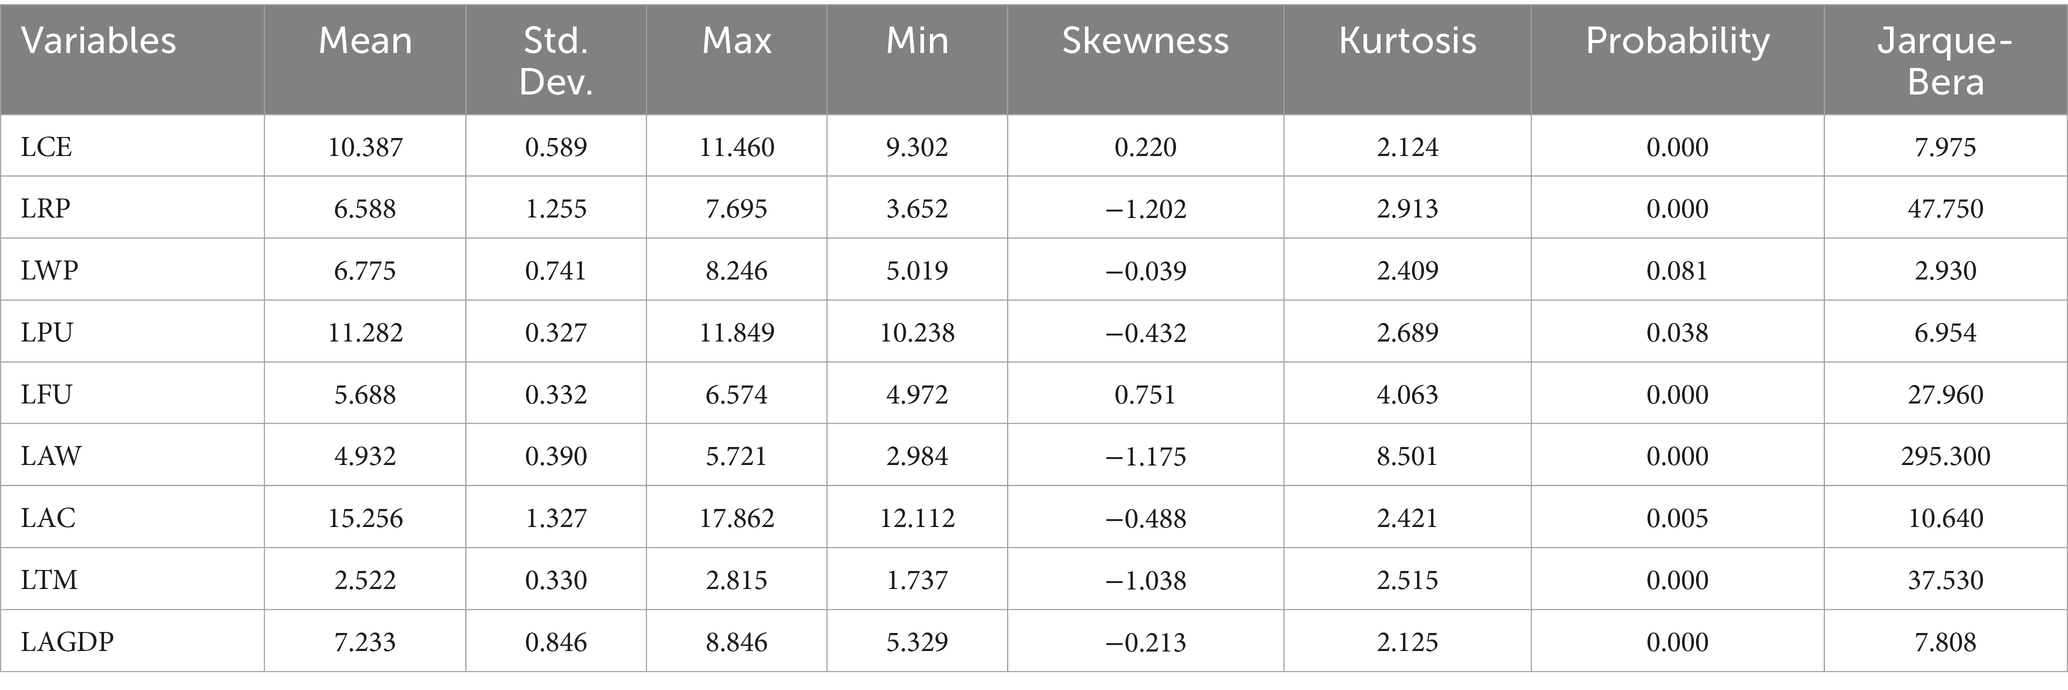
Table 3. Descriptive statistics (n = 198).
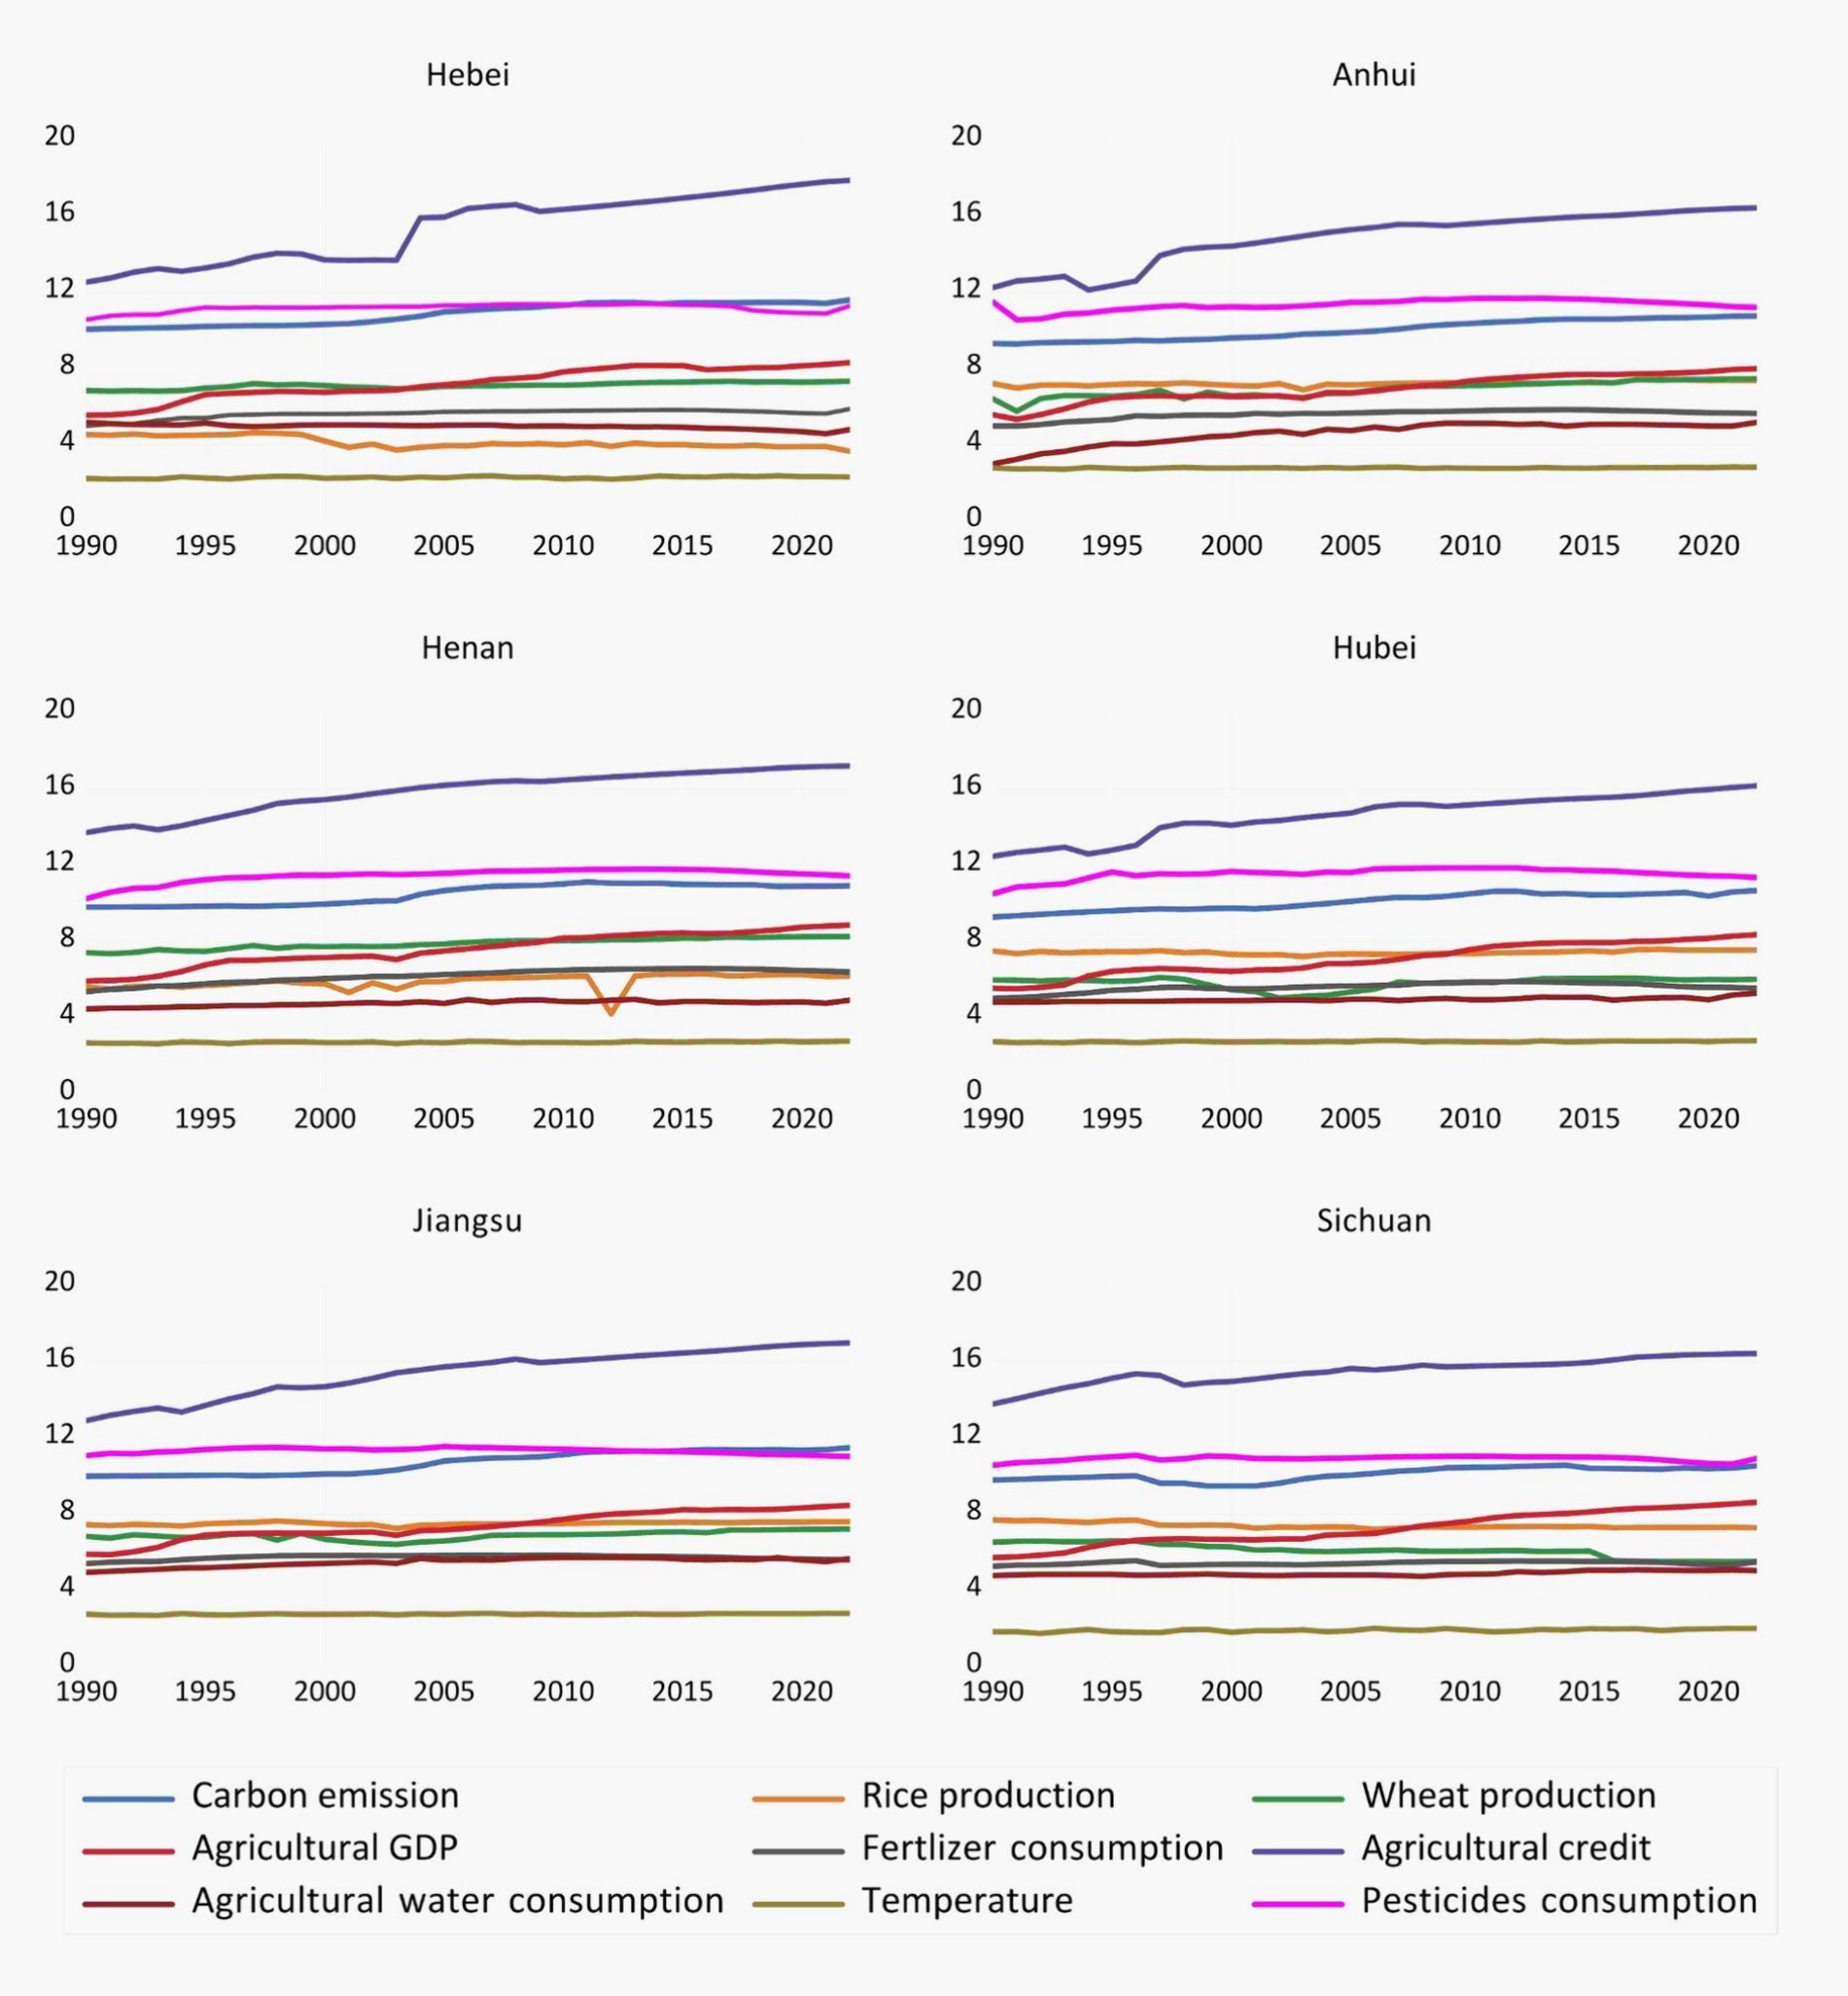
Figure 4. Trends of variables across study provinces (1990–2022).
4.2 Cross-sectional dependence testing results
Table 4 represents the results of Pesaran-scaled LM, Pesaran CD, Friedman and Frees approaches techniques (Pesaran, 2004, 2006; Breusch and Pagan, 1980) to determine whether there is cross-sectional dependence among the variables, which is essential for ensuring the validity of panel data analysis techniques. The findings provide evidence of with common shocks influencing the variables within the specified group of provinces. These results have significant implications for data analysis and modelling that indicates the importance of addressing cross-sectional dependence to ensure the accuracy and reliability of estimations in results. The significant findings of these tests indicate the need to account for cross-sectional dependence in the panel data analysis, increasing the robustness and validity of the study conclusions.
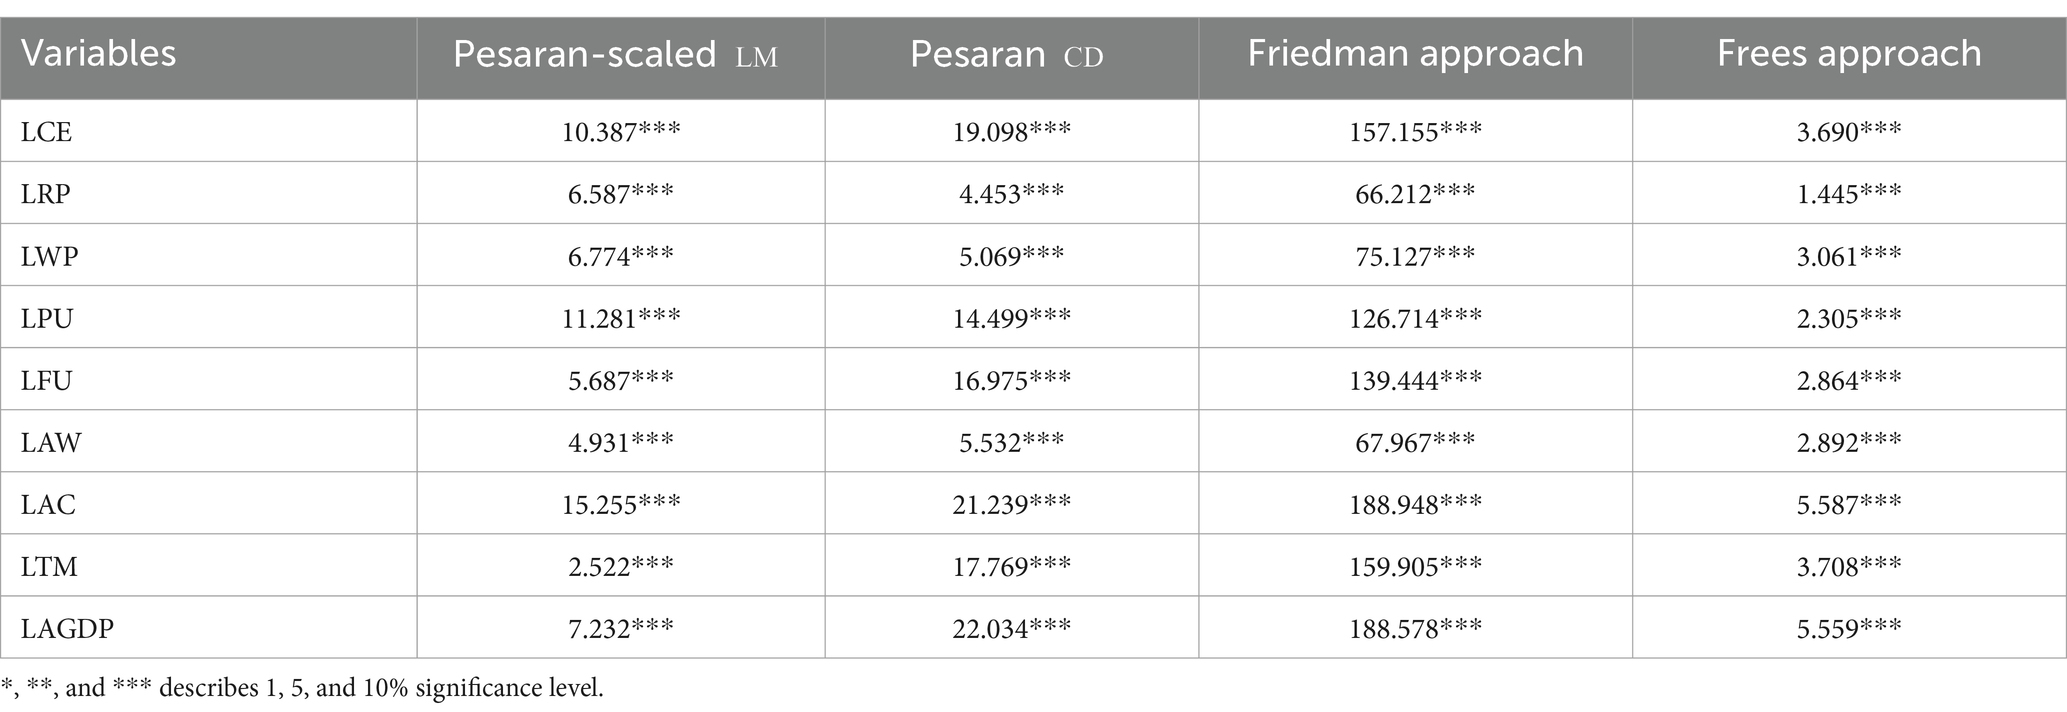
Table 4. CSD outcomes.
4.3 Panel unit root tests
Panel unit root tests and panel cointegration tests are often used in panel regressions to evaluate the validity, bias, stationarity, and robustness of variables. These tests are crucial for ensuring the reliability of the analysis and preventing inaccurate regression analysis and model predictions. Table 5 displays the outcomes of several unit root tests, including the Levin, Lin, and Chu test, the Harris-Tzavalis test, the Im-Pesaran-Shin test, and the Fisher augmented Dickey-Fuller (ADF) tests. These tests were conducted in both the level and first-difference. In addition, we used a second generation unit root test (Maddala and Wu, 1999; Im et al., 2003) at both the level and first difference.
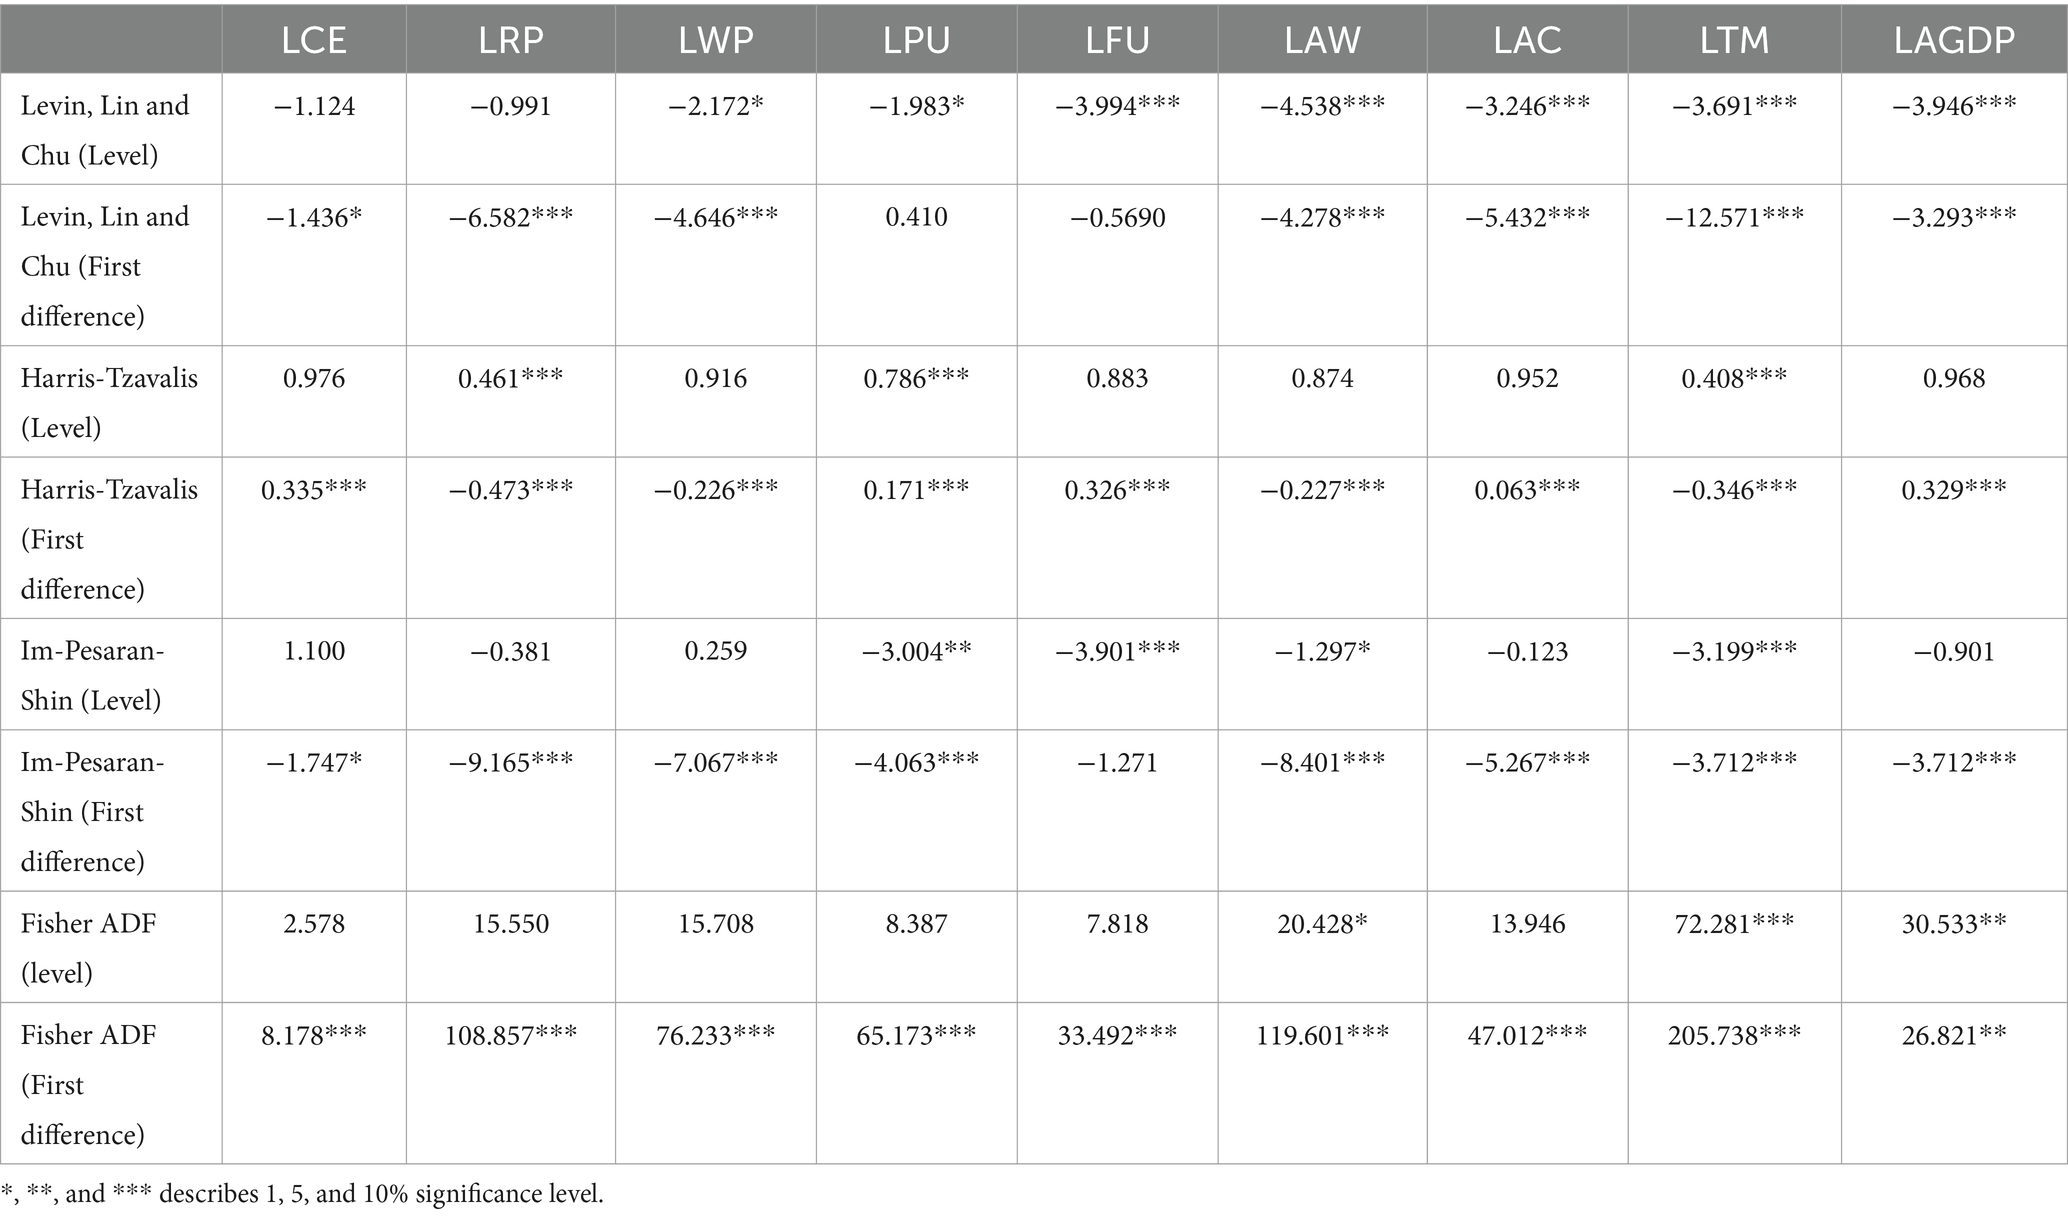
Table 5. Unit root test.
Table 6 presents the results of second-generation unit root testing and the and test statistics are reported for both at level and first difference specifications. The CIPS test results show that carbon emissions (LCE), rice production (LRP), pesticide usage (LPU), fertilizer use (LFU), agricultural water usage (LAW), temperature (LTM) and agricultural GDP (LAGDP) are stationary at the level. Whereas, wheat production (LWP) and agricultural credit (LAC), are stationary at the first difference. On the other hand, CADF results suggest that LCE, LRP, LAW and LAC are stationary at level, and the rest of are stationary at first difference.
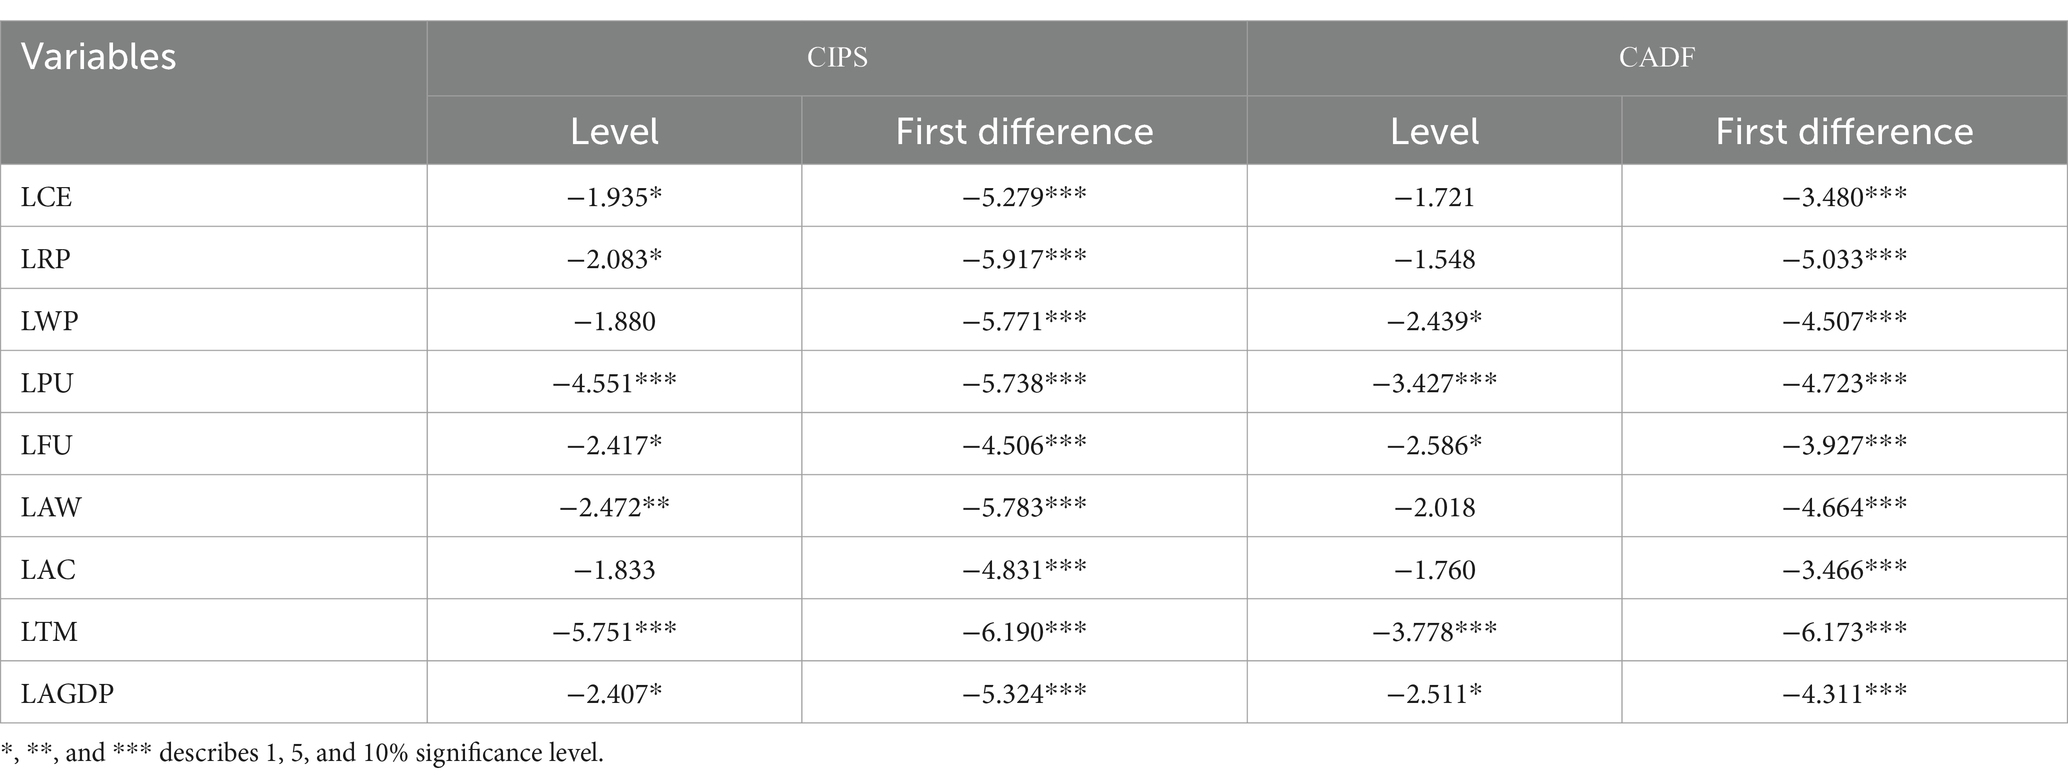
Table 6. Second generation unit root testing.
4.4 Co-integrations tests
The cointegration tests are essential for examining the enduring links between variables (Gengenbach et al., 2006). Thus, we performed the Kao and Pedroni cointegration test to determine whether our panel results are co-integrated in the long run. The findings indicate that the panel we used in our model exhibits a long run connection among the variables, as shown in Table 7. All tests, save the Modified Phillips-Perron test according to Pedroni, show a very significant rejection of the null hypothesis at the 1% significance level. Consequently, the null hypothesis that there is no co-integration among our variables is rejected, indicating the presence of long-term co-integration among our main variable. After acknowledging that our variables exhibit stationarity and co-integration over a long period of time, we proceeded to the subsequent stage of regression analysis.
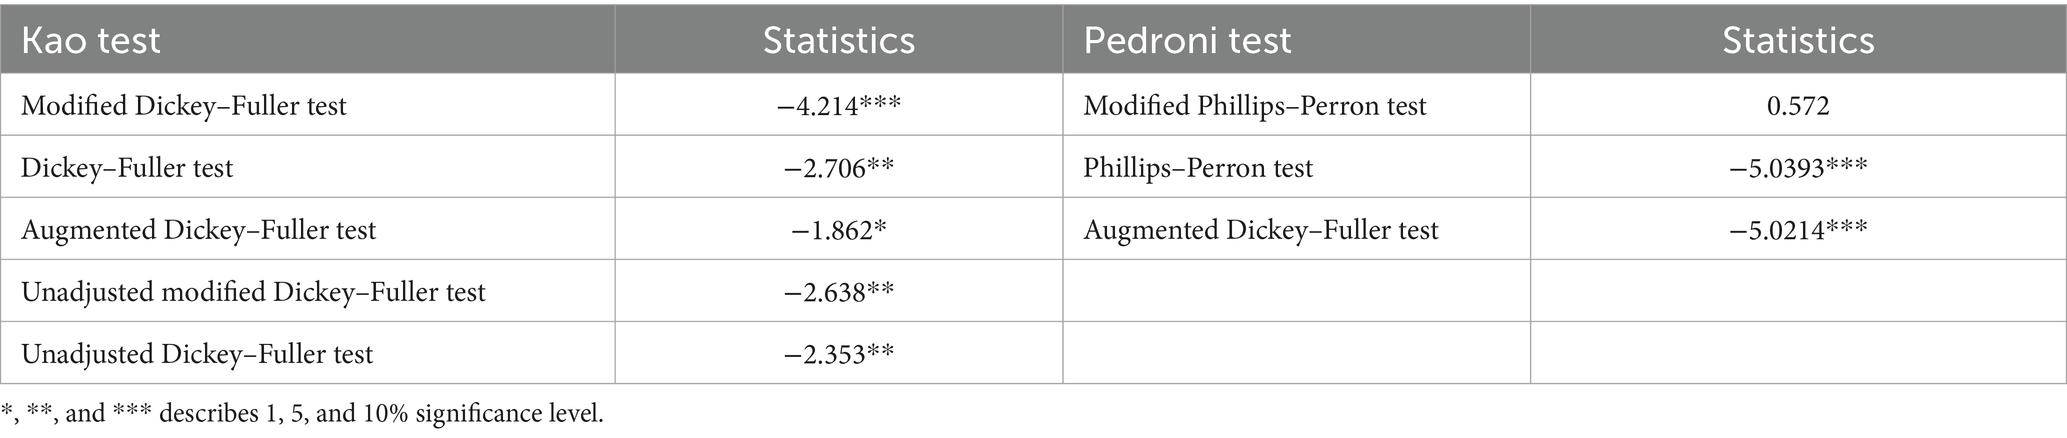
Table 7. Cointegration tests.
4.5 PMG-ARDL regressions outcomes
The PMG-ARDL results in Table 8 reveal that rice production has positive associations with CO2 emissions in the long run. Similarly, the consumption of fertilizers, agricultural water usage and agricultural credit are the key factors to increase carbon emissions in the long run. A one unit increase in rice production, fertilizer use, agricultural water consumption and agricultural credit significantly corresponds to show the increase of (0.07), (2.87), (1.03), and (0.40) in CO2 emissions during long run, respectively. The magnitude of fertilizers usage and agricultural water consumption are greater than the rest of our concerns variables. Interestingly, wheat production, pesticides consumption, climate change via temperature and agricultural GDP show negative associations with carbon emissions in the long run. The fertilizer use, agricultural water consumption and agricultural credit have long-term positive and considerable effect on CO2 emissions. All factors, with the exception of fertilizer use and agricultural loans, have a positive influence on carbon emissions in the short run. The short run analysis reveals that a 1% rise in rice production, pesticides use and agricultural GDP result in an increase of 12, 10, and 13% in environmental degradation. The Error Correction Term (ECT) is highly significant and negative (which should be significant and lie between the ranges of 0 to −2) which shows the validation of our model results, which mean the model rapidly adjust to towards equilibrium at higher velocity, with a speed adjustment of 13%.
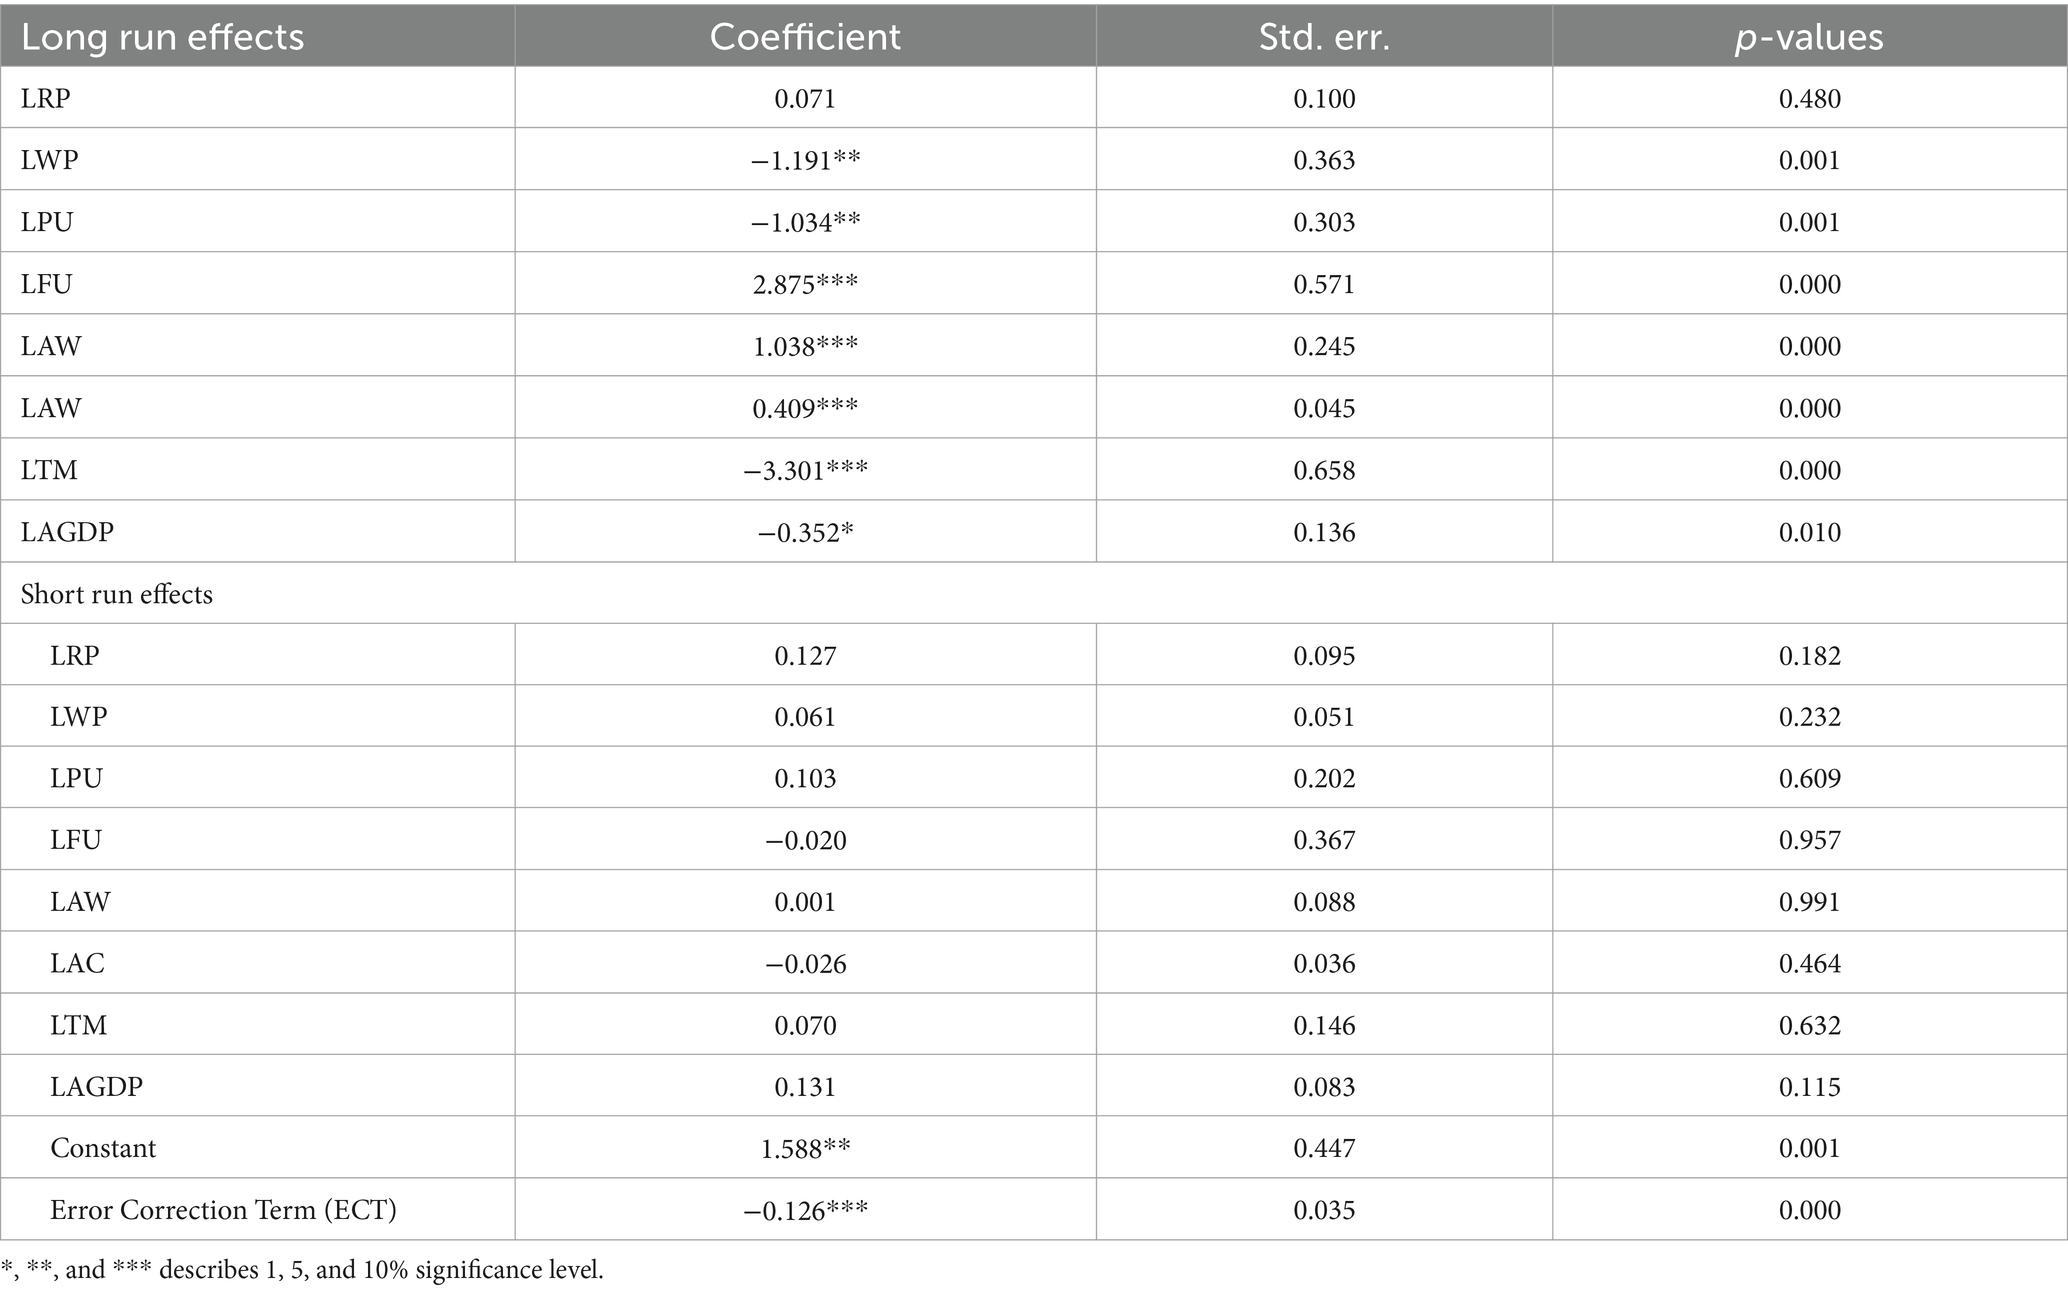
Table 8. PMG-ARDL regression results.
Figure 5 illustrates the trends in wheat and rice production in Hebei, Henan, Jiangsu, Anhui, Hubei, and Sichuan from 1990 to 2020. In Hebei and Henan, wheat production has shown a general increase, while rice production has remained low and stable. Jiangsu exhibits an increase in wheat production with fluctuations, whereas rice production, which is initially higher, has declined since 2000. In Anhui, wheat production has slightly increased, and rice production, higher than wheat, has shown a slight increase with fluctuations. In Hubei wheat production has seen a slight decline, whereas rice production has remained relatively stable with minor fluctuations. Sichuan displays a significant decrease in wheat production since 1990, with rice production, although much higher, remaining relatively stable but showing a slight decrease over time. These trends highlight regional differences in agricultural practices, crop preferences, and possibly varying environmental and climatic conditions affecting the provinces differently. Moving towards the findings of the Table 9, which represents PMG-ARDL outcomes of short run analysis across the provinces (the long run results are not displayed here they were same as reported in Table 8). The short run results reveal that the rice production leads to increase in CO2 emissions in Hebei and Jiangsu provinces. Whereas, the impact of rice production on carbon emissions is negative but the results are insignificant in Anhui and Hubei provinces. This result indicates that Hebei and Jiangsu provinces are the major rice producer with excessive consumption of pesticides and agricultural water which contributed to increase the CO2 emissions. For example, the positive impact of rice production on carbon emissions can be seen in the long run. In contemporary, the positive impact of wheat production on carbon emissions in Henan and Jiangsu provinces can be explain in a similar vein and vice versa.
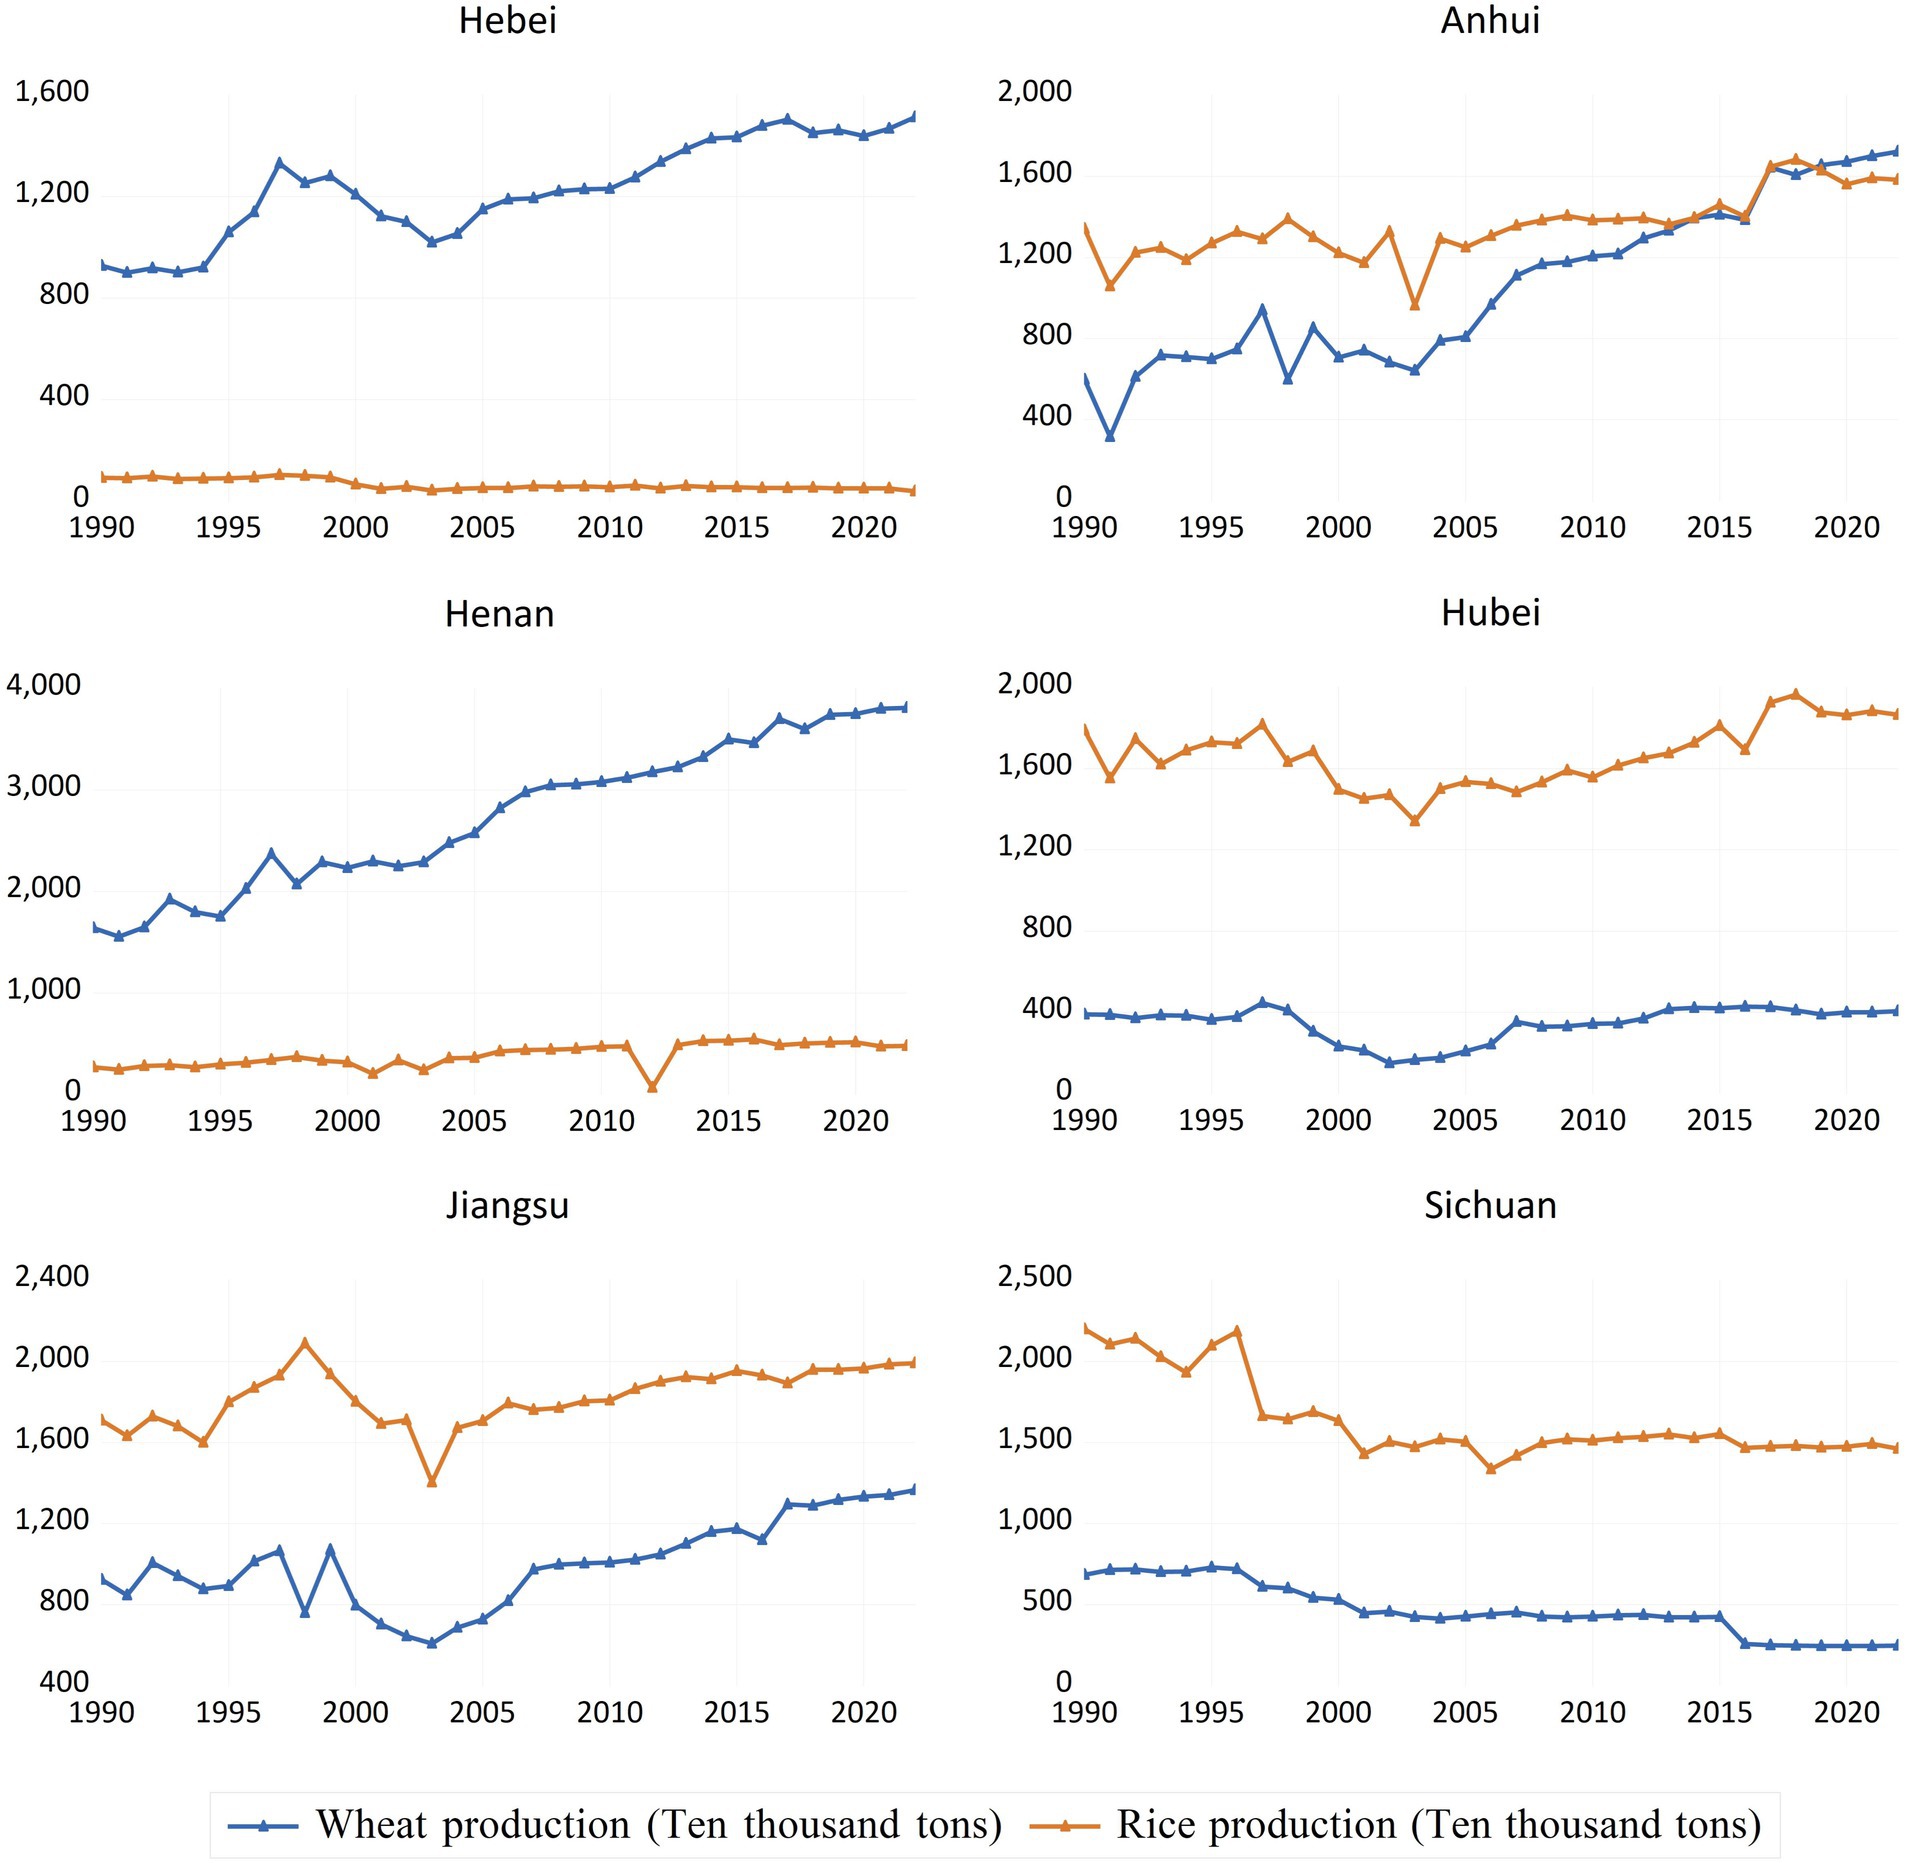
Figure 5. Spatial trends in wheat and rice production from 1990–2022. (Source: China Agricultural Statistical Yearbook).
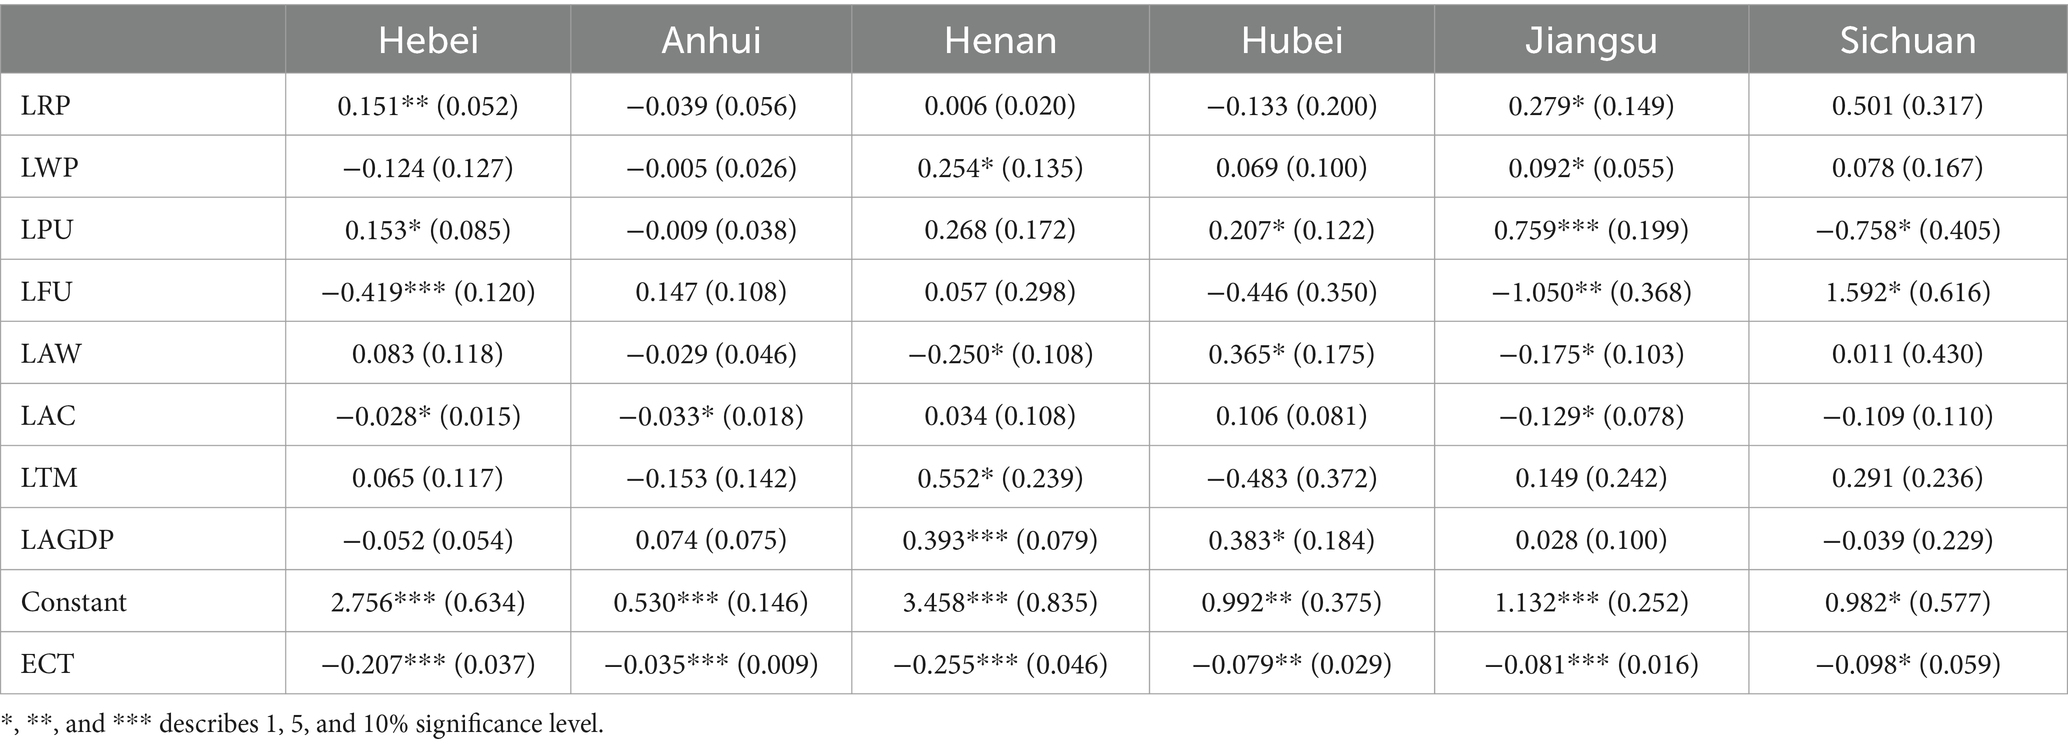
Table 9. PMG-ARDL short run regression results.
The pesticide use has positive impact on carbon emissions in Hebei, Hubei and Jiangsu provinces, while negative impact in Henan and Jiangsu provinces. Similarly, the fertilizer consumption has positive and significant impact on carbon emissions in Sichuan. Agricultural water consumption has positive and significant impact on carbon emissions in Hubei. Agricultural credit or financial supports to farmers also resulted the increase in carbon emissions in Henan and Hubei, while it shows negative impact on carbon emissions in Hebei, Anhui and Jiangsu provinces. Climate change via temperature significantly increases carbon emissions in Henan province. Finally, agricultural GDP shows positive relationship with carbon emissions across the provinces, except Hebei and Sichuan.
Figure 6 provides a comprehensive visualization of the annual usage of pesticides, fertilizers, and agricultural water across study provinces over three distinct periods. There has been a general increase in pesticide use over the three periods (1990–2000, 2001–2010, and 2011–2022), with the most significant increases observed in Henan and Jiangsu provinces. Similarly, fertilizer usage has also increased, particularly between the first period (1990–2000) and the second period (2001–2010). The highest usage is seen in Hebei and Henan provinces, indicating intensified agricultural practices. The use of agricultural water has shown fluctuations, with notable increases in water consumption in Sichuan and Hubei provinces over the three periods. This suggests changes in irrigation practices and possibly the introduction of more water-intensive crops. Figure 7 provides trends in agricultural credit GDP, and mean temperature across study provinces. There has been a significant increase in agricultural credit over the three periods. The highest increases are observed in Henan, Jiangsu, and Hebei provinces, indicating increased financial support for agriculture in these regions. Agricultural GDP has shown substantial growth across the periods, with the most notable increases in Hebei, Henan, and Jiangsu provinces. This reflects enhanced agricultural productivity and economic development in these areas. The annual mean temperature has risen consistently across all three periods. Hebei, Henan, and Jiangsu provinces exhibit significant temperature increases, which may impact agricultural practices and productivity. To conclude, the findings from Figures 6, 7 indicate a strong correlation between increased agricultural inputs (pesticides, fertilizers, and water) and the rise in agricultural credit and GDP. Provinces like Henan, Jiangsu, and Hebei show significant growth in both financial support and agricultural productivity. However, these regions also face rising mean temperatures, which could pose climate-related challenges to sustainable agricultural practices. The data suggest that while financial and input support have driven agricultural development, there is a need to address the environmental impacts and adapt to changing climatic conditions to ensure long-term sustainability in these provinces.
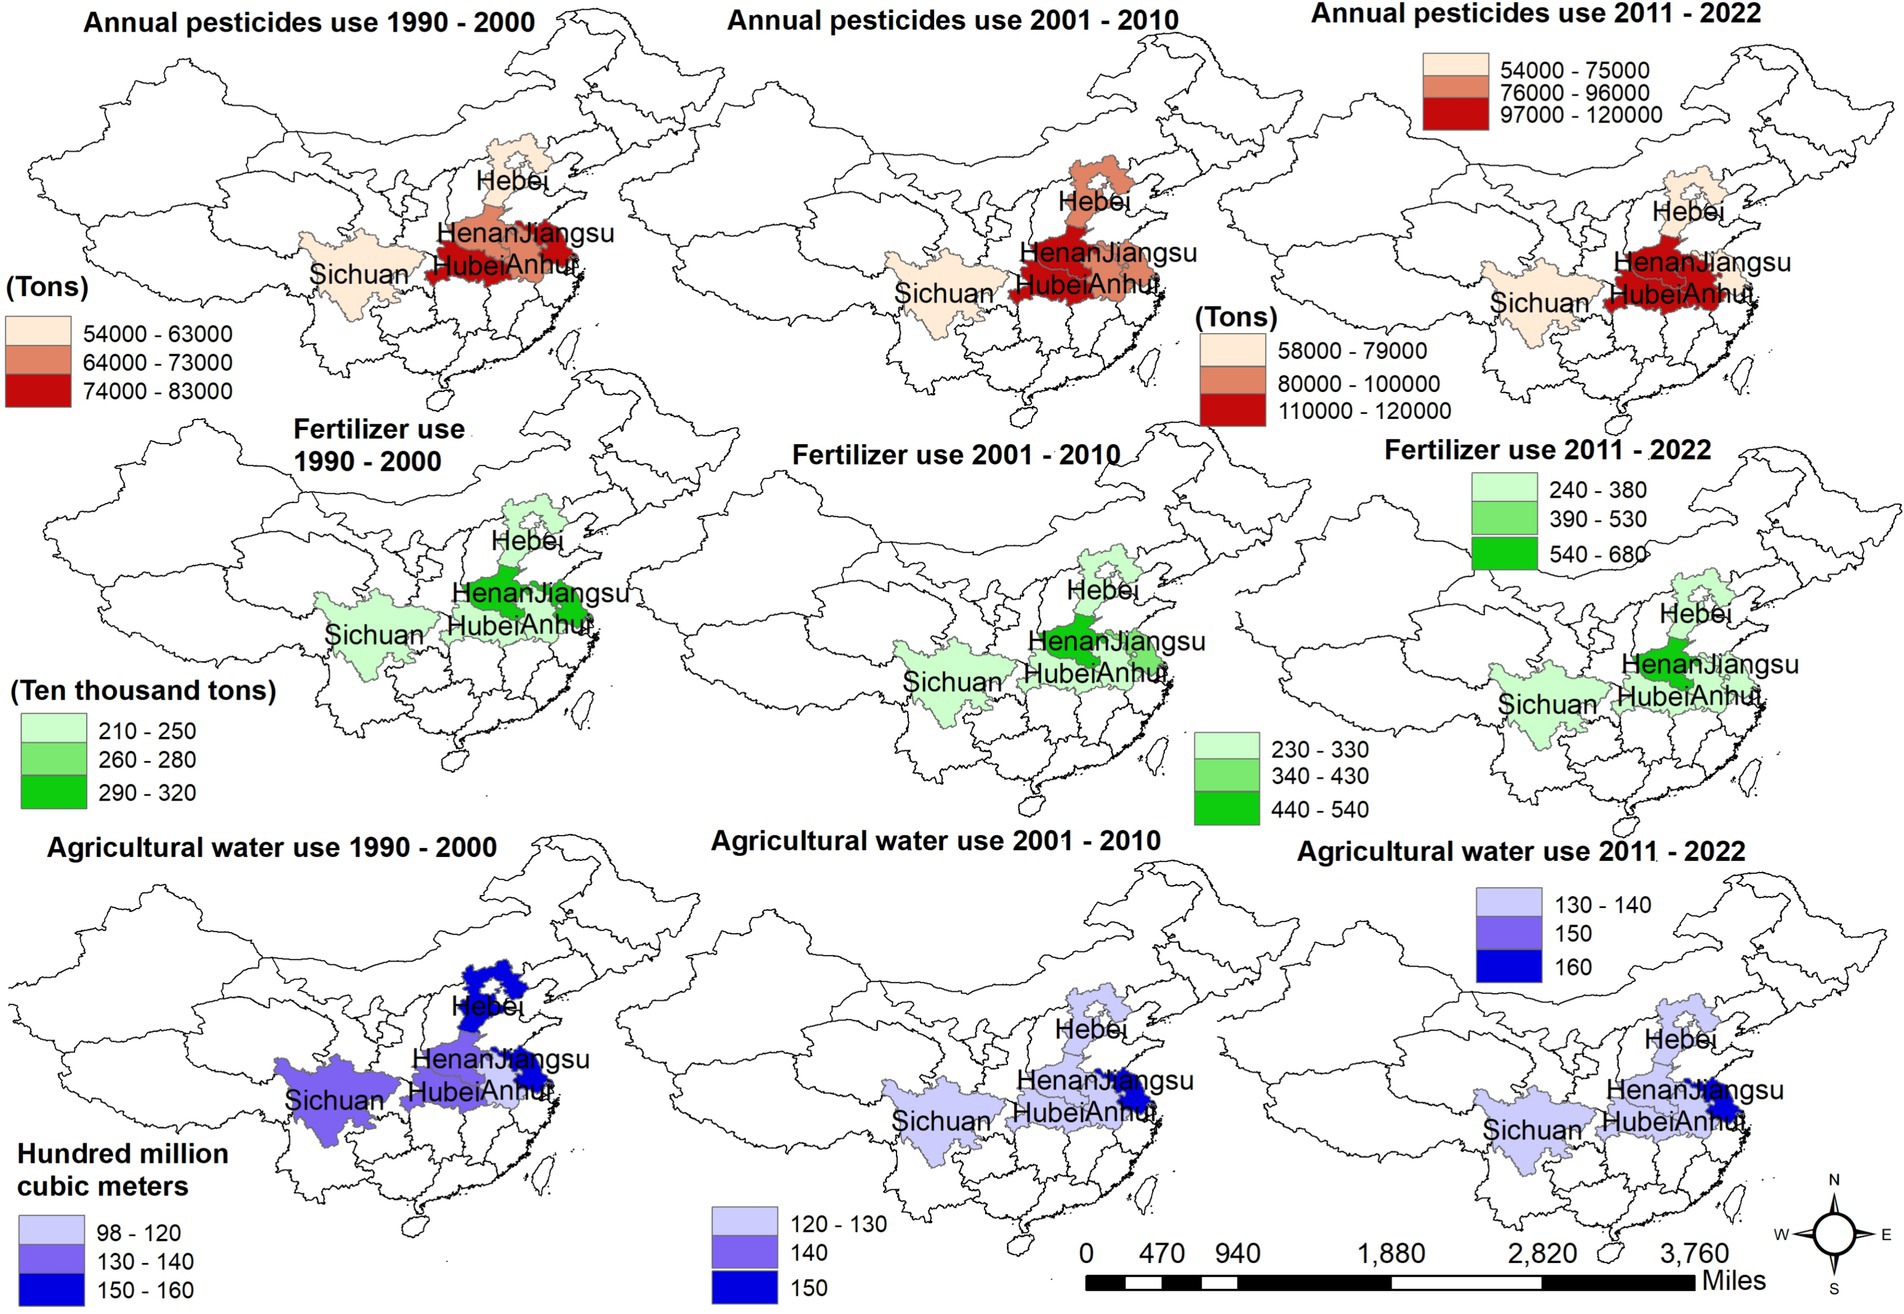
Figure 6. Trends in pesticides, fertilizer and agricultural water usage from 1990 to 2022. (Source: China Agricultural Statistical Yearbook).
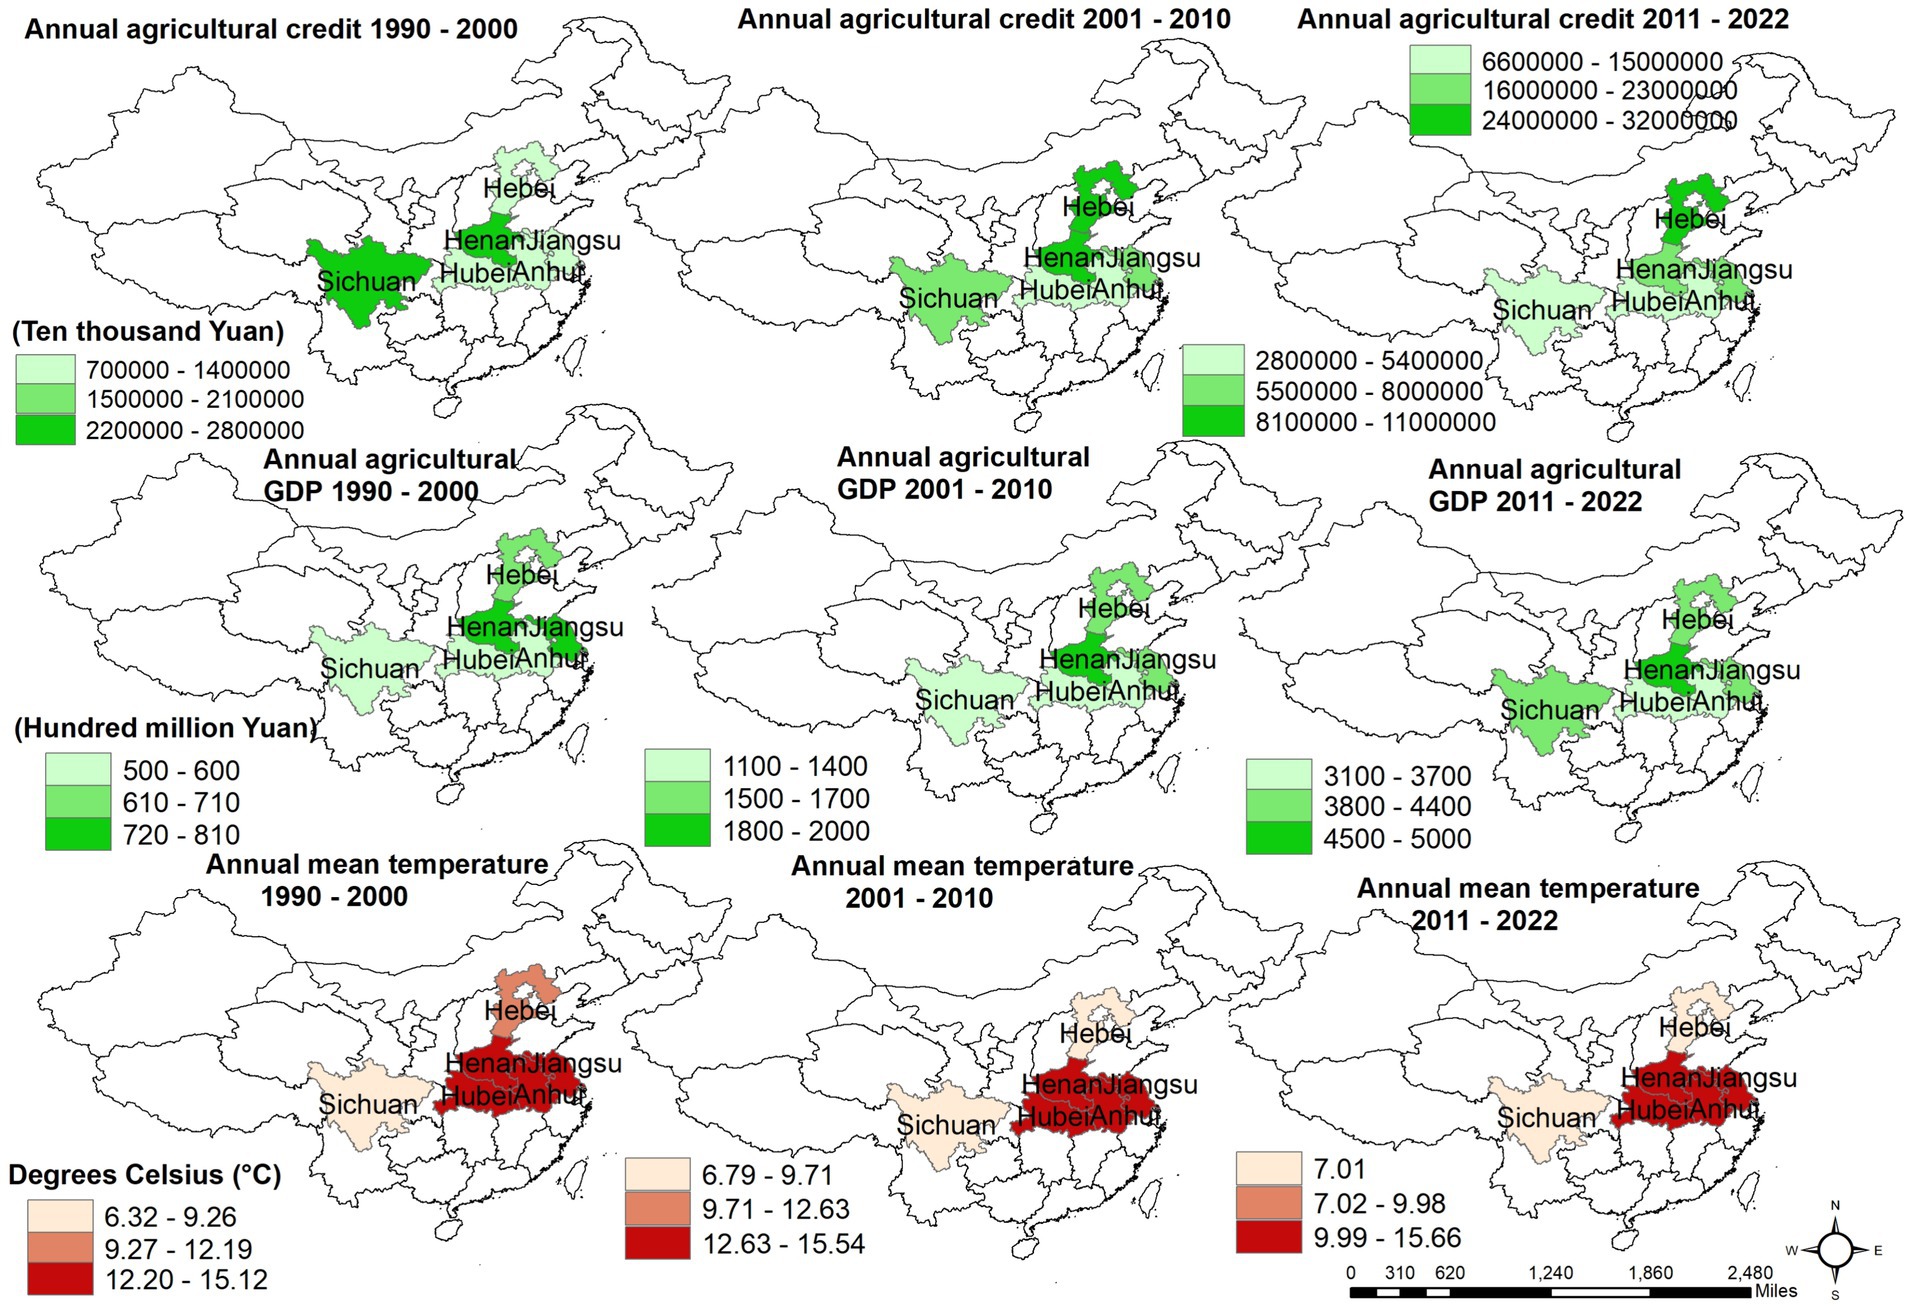
Figure 7. Trends in agricultural credit and agricultural GDP growth and climate change from 1990 to 2022. (Source: China Agricultural Statistical Yearbook).
4.6 Panel quantile regression
Table 10 represents the panel quantile regression results which indicate that rice and wheat productions have positive impact on CO2 emissions across the quantiles. Similarly, the impact of fertilizer use, agricultural water consumption, agricultural credit and agricultural GDP on carbon emissions are significant and positive in all quantiles. These results suggest that higher usage of these variables in agriculture are associated to increased carbon emissions. For example, providing financial assistance to farmers may encourage the adoption of modern farming techniques, leading to higher crop yields and increased carbon emissions. Thus, our findings indicate a strong correlation between agricultural financing and carbon emissions across different quantiles. The interaction between climate change, as measured by temperature and agricultural GDP has a positive and considerable influence on carbon emissions. These findings provide support for the consequences predicted by the PMG-model.

Table 10. Panel quantile regressions.
To further examine the reliability of the data, we also used Panel least squares regression to analyze the interaction between the variables (Table 11). The findings indicate that carbon emissions are highly influenced by rice and wheat production, fertilizer use, agricultural water consumption, agricultural credit, and agricultural GDP. The climate change via temperature has a negative impact on carbon emissions. Agricultural GDP has a positive and significant impact on carbon emissions. The 2 show that about 46% variation in carbon emissions is accounted by explanatory variables.
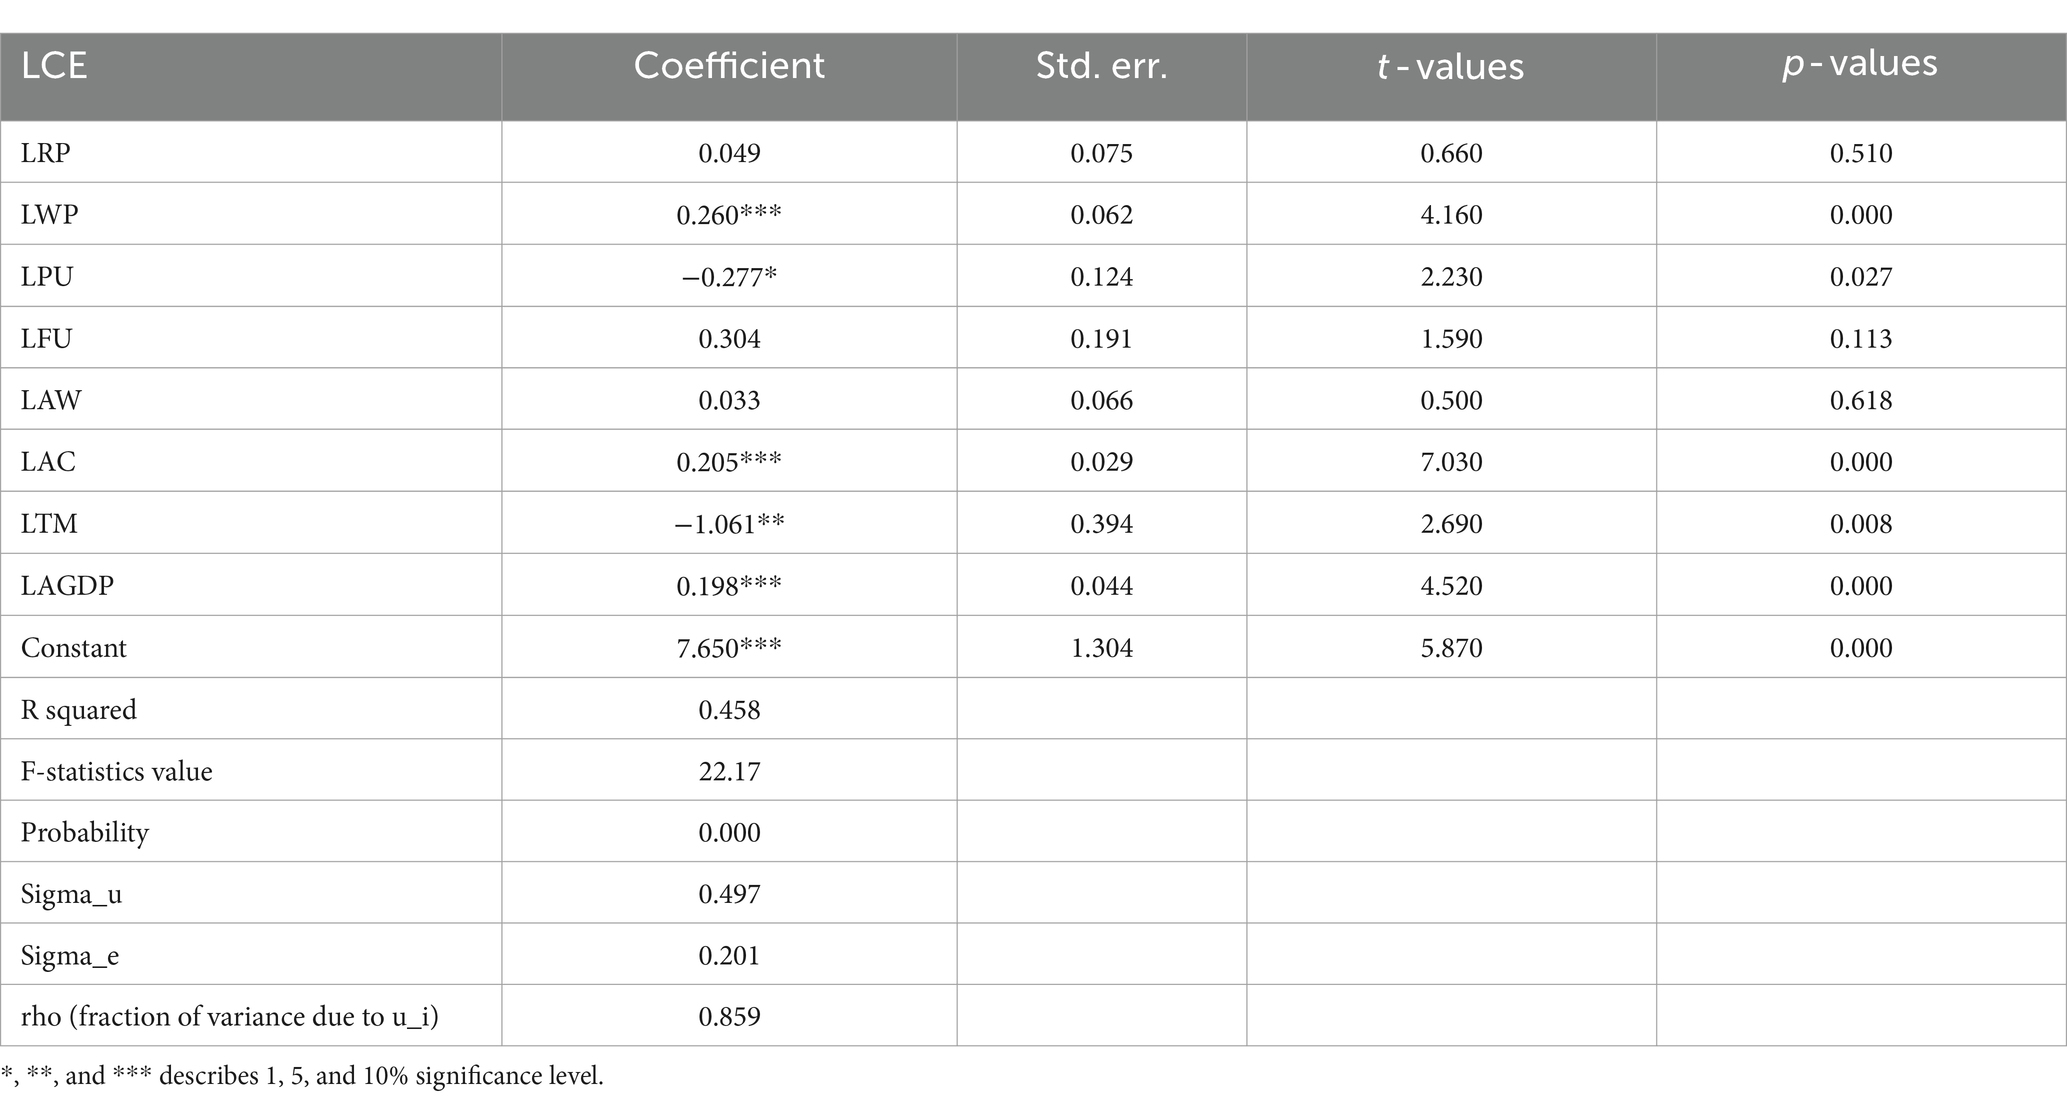
Table 11. Panel least square regression.
4.7 The causality test of panel Dumitrescu and Hurlin
We examine the causality among variables through employing Dumitrescu and Hurlin (2012) approach (Table 12). Our investigation reveals a significant flow of causal links between our concerns variables. The analysis found unidirectional causation among; CO2 emissions → agricultural credit, CO2 emissions → temperature and CO2 emission → agricultural GDP. A significant bidirectional causal association was found between CO2 emissions and other variables: CO2 emissions ↔ rice production, CO2 emissions ↔ wheat production, CO2 emissions ↔ pesticide, CO2 emissions ↔ fertilizer, and CO2 emissions ↔ agricultural water. These results provide us guidelines in the selection of PMG-ARDL, quantile regression, panel least square regression and cointegration techniques for robustness and consistent results for our study, particularly in explaining CO2 emissions and agricultural production under specific factors of pesticides, fertilizers, agricultural water consumptions, climate change and agricultural GDP as key factors impacting environmental quality in context of CO2 emissions.
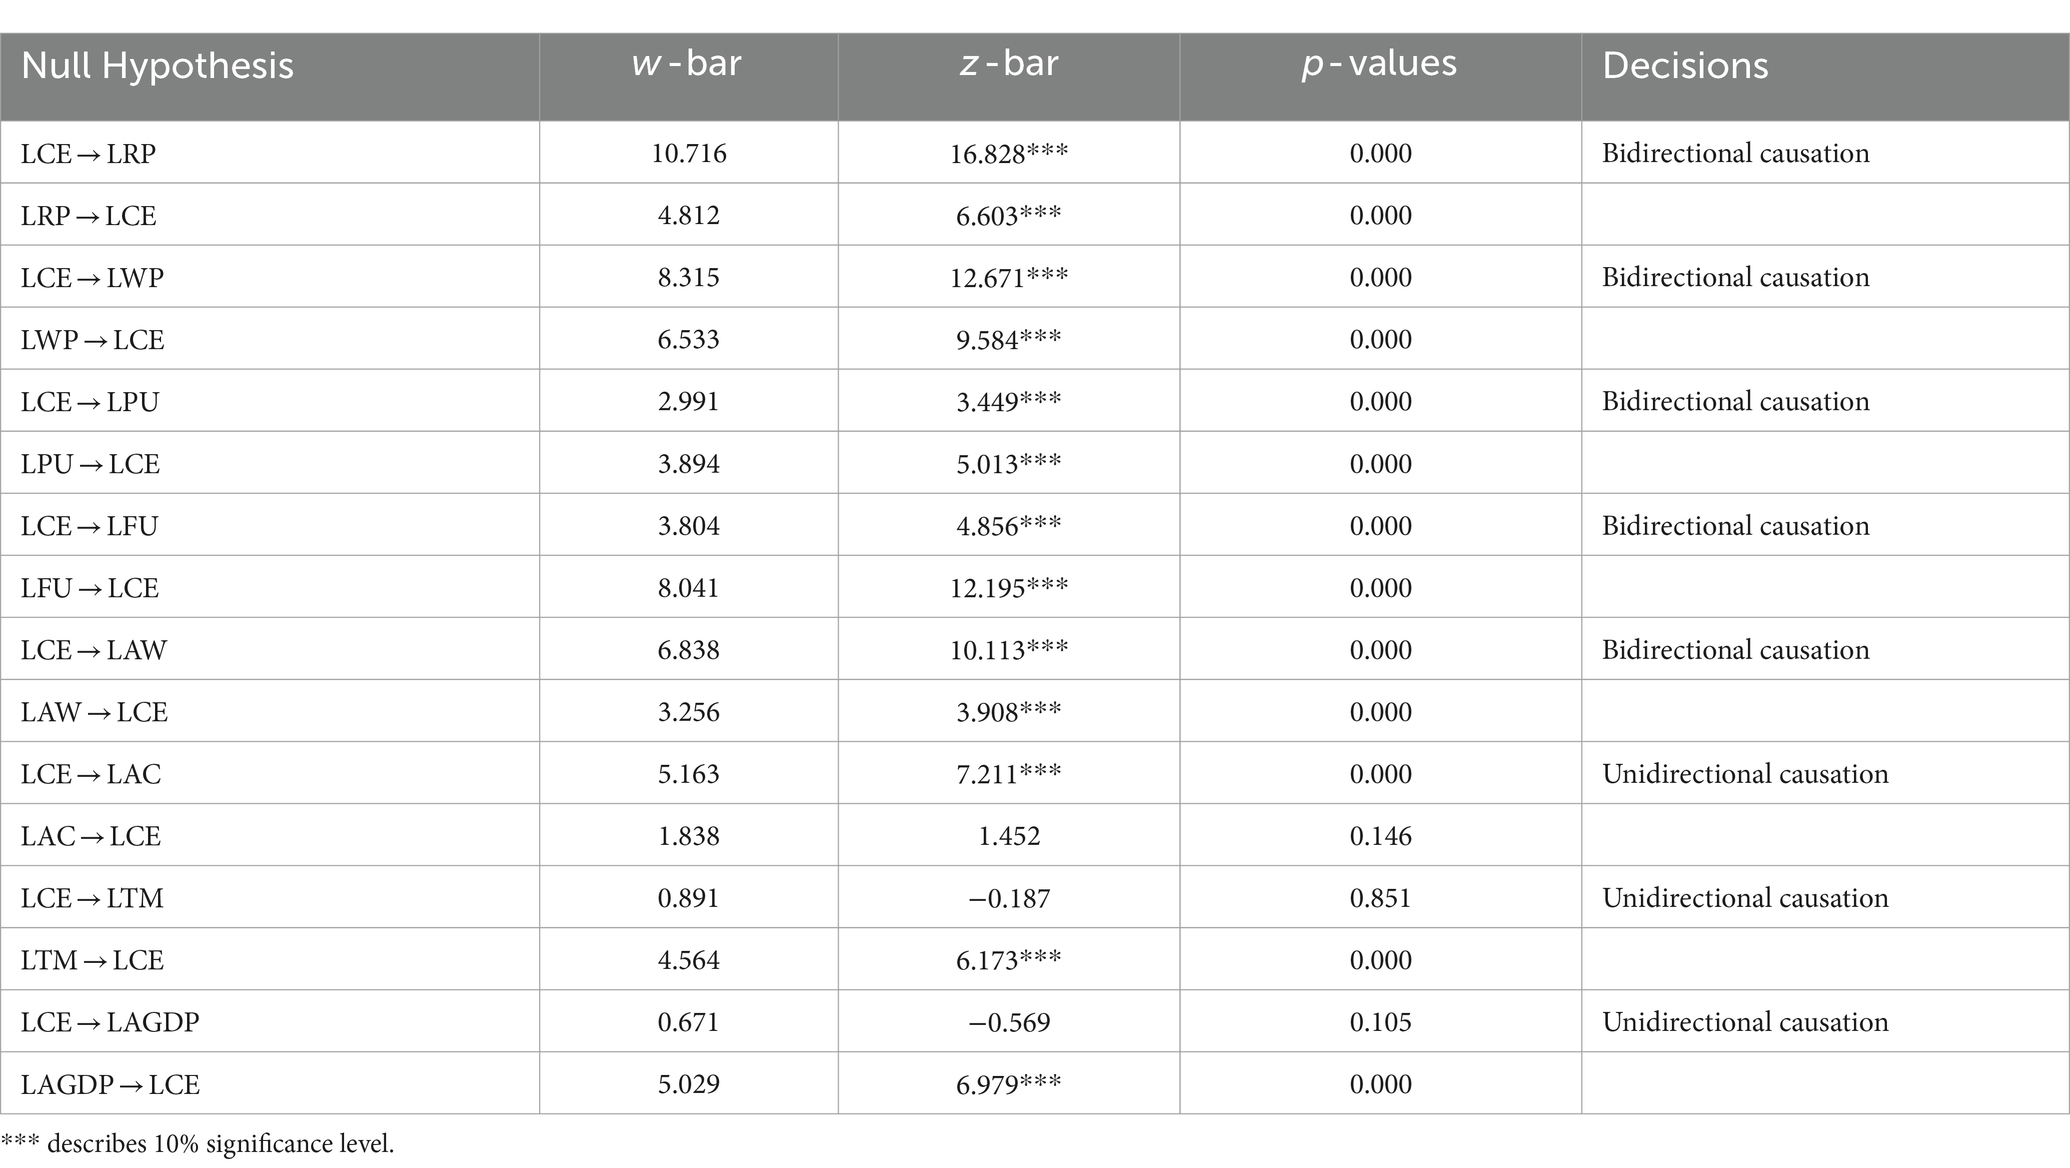
Table 12. Pairwise Dumitrescu and Hurlin panel causality test.
4.8 Discussion of findings
Economic growth often leads to increased industrial activities, which typically involve the combustion of fossil fuels that leads to higher carbon emissions. The Environmental Kuznets Curve (EKC) hypothesis suggests that as an economy grows, emissions increase up to a certain point, after which they begin to decline as the economy transitions to cleaner technologies and higher environmental awareness (Grossman and Krueger, 1995; Dinda, 2004). Socio-economic development is often accompanied by increased energy consumption. As societies industrialize and urbanize, the demand for energy in transportation, manufacturing, and residential sectors rises, leading to higher carbon emissions (Stern, 2004; Zhang et al., 2014). Population growth and urbanization are significant drivers of carbon emissions. As the population increases, so does the demand for goods and services, which leads to higher energy consumption and emissions. Urbanization can exacerbate this effect by increasing the density of energy use and associated emissions in cities (Jiang and Hardee, 2011; Wang et al., 2014, 2020; Wang and Wang 2021). Agricultural activities contribute to carbon emissions through the use of fertilizers, pesticides, and machinery, which are often fossil-fuel dependent. Additionally, agricultural practices such as deforestation and land-use change can release significant amounts of carbon stored in biomass and soil (Barker et al., 2009; Foley et al., 2011). (Wang et al., 2020; Wang and Wang 2021) Technological advancements can have both positive and negative impacts on carbon emissions. On one hand, technological improvements can lead to more efficient energy use and the development of cleaner energy sources, thereby reducing emissions. On the other hand, technological progress can also lead to increased production and consumption, potentially raising emissions (York, 2007; Jorgenson and Clark, 2012). The role of policy and governance is critical in shaping the relationship between socio-economic factors and carbon emissions. Effective environmental policies, such as carbon pricing, emissions trading systems, and regulations on industrial emissions, can mitigate the adverse effects of socio-economic activities on carbon emissions (Nordhaus, 2007; Stern, 2008).
The agricultural industry is a significant contributor to environmental concerns, particularly in terms of carbon emissions, which pose a significant danger to world ecosystems and contribute to global warming. The transition from traditional to modern agriculture has led to an increasing reliance on fossil fuels for operating modern farm machinery. The cultivation of key crops like wheat and rice necessitates substantial use of agricultural resources like as fertilizers, pesticides, irrigation water, and advanced gear for land management, which in turn contributes to a rise in CO2 emissions (Kashyap and Agarwal 2021). Our study emphasizes the complex interplay between wheat and rice production and its effect on the environmental quality, specifically in terms of carbon emissions. Our investigation indicates that there is a positive correlation between the production of rice and wheat and CO2 emissions over a long run and short run, respectively (Table 8). Furthermore, the use of fertilizers, agricultural water, and agricultural credit plays a crucial role in the long-term escalation of carbon emissions. Similarly, all of our concern variables had a positive influence on carbon emissions in the short term, with the exception of fertilizer use and agricultural credit. These results align with the findings of Panel Quantile regression analysis, indicating that both rice and wheat production have a positive and substantial influence on carbon emissions across all quantiles (refer to Table 10). Positive and substantial associations are shown between fertilizer use, agricultural water usage, agricultural credit, and carbon emissions across several quantiles.
Koondhar et al. (2021a) investigated fertilizer consumption varying impact on cereal crops production and found positive and negative association between agricultural based carbon emissions and cereal crops production. However, our study is different from Koondhar et al. (2021b) in terms of individual crop selection, data type, inclusion of most relevant variables such as consumption of pesticides, agricultural water usage, agricultural financial supports to farmers, climate change and agricultural GDP impact. Our finding reveal that rice production increases carbon emissions in both long run and short run, while wheat production reduces and increases carbon emissions in long run and short run, respectively. Our findings are consistent with Kumar et al. (2023) who found a long-term relationship between rice production and an increased carbon footprint. Chandio et al. (2021) investigated the impacts of climate change on rice production in China and found that increased carbon emissions have a significant effect on rice production. Furthermore, this aligns with our findings of a positive relationship between rice production and carbon emissions in both the long run and short run. Additionally, Chandio et al. (2021) found that climate change factors, including carbon emissions, significantly affect crop production, which supports our findings that wheat production influences carbon emissions variably over different time frames. Chandio et al. (2021) also supports the notion that carbon emissions and climate factors significantly impact rice and wheat production, strengthening the relationships between these variables and carbon emissions. In addition, Fan et al. (2020) investigated that rice crops produced 29% of total crop protein while emitted 54% of total crop GHG in China. In contrast, Raza et al. (2021) found that food crop production has the capacity to reduce CO2 emissions in the short run and is negatively and significantly related to CO2 emissions in the long run in the context of Pakistan. Similarly, Baig et al. (2022) determined that carbon emission levels hindered rice production in both the long and short term, while lower carbon emissions did not negatively impact rice production. The consumption of fertilizers, agricultural water usage, agricultural credit, positively contributed to increase in carbon emissions in the long run. These results suggest that the increase in explanatory variables lead to increase in carbon emissions. For example, the increasing use of fertilizers contribute to increase crop production, which ultimately increase the carbon emissions. These results are consistent with Chandio et al. (2023a,b) in context of crop productivity. They found the consumption of fertilizers have positive impact on grain crops production in both short and long terms in China. Similarly, Wu et al. (2021) observed positive impact of pesticides and fertilizers consumption on maize production in the long run in China. Guo et al. (2022) investigated a positive correlation between fertilizer consumption and agricultural carbon emissions. Our findings of these variables assess their impact on carbon emissions, accordingly.
Earlier studies (e.g., Zhai et al., 2017; Lin et al., 2019; Pickson et al., 2021; Zhang et al., 2022) discussed the irrigated land area and crop productivity, and few investigated the nexus between water energy consumption, water energy management and carbon emissions (e.g., Anser et al., 2020; Wang et al., 2020). The nexus between agricultural water consumption in context of water amount usage and carbon emissions is still unexplored. Our investigations of agricultural water consumption show significant and positive impact on carbon emissions. This result suggests that the extensive use of water for irrigation retracts with fertilizers and further evaporates into the atmosphere and contribute to increase the carbon emissions. Nair and Nair (2019) concluded that uncontrolled use of fertilizers such as nitrogen in green revolution leading to enormous nitrous oxide emission leading to global warming. Similarly, our findings of agricultural credit illustrate positive association with carbon emissions. It is obvious that agricultural financial supports to farmers can promote the adoption of modern agricultural practices that consequently increase crop production. Onyeneke et al. (2024) concluded that agricultural supports to farmers played a significant role in increasing maize and rice crops production in the long run in Nigeria. Tuan Anh et al. (2020) indicated that agricultural credit positively influences agricultural GDP in both the short run and long-run. Our results also reveal a significant and positive association between fertilizers consumptions, agricultural loans and carbon emissions in the long run. This result is consistent with Koondhar et al. (2021a) who noticed upward trends in carbon emissions due to agricultural financial development in China. In contrast, Qin et al. (2023) investigated that green credit significantly reduces agricultural carbon emissions. They showed that green credit indirectly curbs agricultural carbon emissions by encouraging the adoption of green technology innovations in agriculture.
The interaction between climate change and temperature demonstrates a positive correlation in the short term and a negative correlation in the long term with carbon emissions. However, the PQR findings indicate that temperature has a positive and substantial influence on carbon emissions. In a study conducted by Demirhan (2020), the researcher investigated the influence of temperature and carbon emissions on worldwide wheat production. The findings revealed that temperature variations and carbon emissions had an insignificant impact on global wheat production in the short term. However, their retarded short-term effects were found to have a significant impact on wheat production. He proposed that a rise in temperature has a substantial negative impact on wheat productivity, whereas an increase in carbon emissions has a beneficial long-term effect on wheat yield. Hence, it is essential to allocate resources towards adaptive strategies in wheat production to counteract the long-term consequences of temperature anomalies, even if the rise in carbon emissions partially mitigates the loss in wheat yield. Similarly, Hao et al. (2016) found a statistically significant effect of climate change on China’s carbon emissions. They determined that approximately 1.687% of China’s increased total carbon emissions from 1995 to 2011 could be attributed to climate change. Hence, our findings indicate the presence of an intricate correlation between temperature and carbon emissions, which necessitates more investigation for a comprehensive understanding. By including comparative analysis with current literature, our research enhances its credibility and offers useful insights into the continuing discourse on this issue. This method not only situates our research within the wider academic framework but also enables a more profound comprehension of its importance in furthering knowledge in this area.
5 Conclusion
This study utilizes panel datasets spanning from 1990 to 2022 to discover the impact of agricultural production of wheat and rice production on CO2 emissions from the six mega agricultural production provinces in China: Anhui, Jiangsu, Hubei, Hebei, Henan and Sichuan. The study employs novel econometric approaches of Cross-Sectional Dependency, second-generation unit root tests, cointegration tests, Panel Mean Group Autoregressive Distributed Lag (PMG-ARDL), Pane Quantile regressions (PQR), and Panel Least Square regression (PLS), Dumitrescu and Hurlin (DH) panel causality frameworks to check the results robustness.
The results highlight rice production has positive association on carbon emissions in the short and long run. However, wheat production showed adverse and positive impact on CO2 emissions in the long and short run, respectively. The influencing factors such as increasing use of fertilizer, agricultural water and agricultural credit significantly contribute to increase rice productivity as well as increase CO2 emissions in the long run. The results also highlight the significant role of temperature in influencing CO2 emissions with contrasting effects noticed in the short and long run that provide an opportunity to investigate the association between climate change and CO2 emissions. Additionally, our findings suggest that the financial supports to farmers or agricultural credit facility play an important role in the adoption of and promotion of modern agricultural practices, thereby it increases the crops productivity but also contributing to increase in carbon emissions and leading to environmental degradation and threats of long run sustainability.
The findings of this study contribute to existing literature with empirical evidences on the drivers of carbon emissions in agricultural production, offering insights into the complex relationship between agricultural practices, environmental quality and climate change. Furthermore, the study results are helpful to understand the dynamics of carbon emissions and highlight the importance of adopting adaptive agricultural approaches to mitigate emissions and ensure both environmental sustainability and food security in the face of global challenges.
5.1 Policy implications
According to the findings of the investigation we have tried to produce the important policy implications which are helpful for policymakers, agricultural stakeholders and environmental scientist:
Firstly, Policymakers should prioritize the promotion of sustainable agricultural practices to reduce CO2 emissions through encouraging the use of organic fertilizers, efficient irrigation techniques, and adoption of integrated pest management strategies to reduce reliance on agricultural inputs. Through increasing investment in agricultural research and innovation is crucial for developing and promoting technologies that boost productivity while mitigating environmental impacts. Therefore, policymakers should allocate resources towards research on climate-resilient crops, precision agriculture, and renewable energy solutions for agricultural operations.
Secondly, agricultural financial supports such and subsidies, although increase crop productivity and carbon emissions level in the atmosphere. Therefore, financial supports programs of sustainable farming practices should also be introduced with monitoring and evaluation mechanism at farm level. These programs should involve financial incentives for farmers in the adoption of agroforestry, climate resilient and climate smart technologies, conservation tillage and other sustainable land management practices.
Thirdly, efforts should be made to increase the capacity of farmers and agricultural extension services through workshops, training programs and educational materials on sustainable farming techniques, climate change adaptation and carbon emissions reduction strategies. Climate change considerations should be integrated into agricultural policies and planning processes at all levels. Policymakers should develop comprehensive climate adaptation and mitigation strategies that address the specific challenges faced by agricultural communities taking into account regional variations in climate, soil conditions and crop production systems.
Fourthly, a robust monitoring and reporting mechanisms should be established for the follow-up to reduce carbon emissions targets in the agriculture sector. This could involve the development of greenhouse gas inventories, carbon bookkeeping frameworks and performance indicators to assess the effectiveness of policy interventions and guide future decision making.
Fifthly, tailored strategies at the local level should address the specific needs of farming communities by providing financial incentives and support for sustainable practices like precision and organic farming. At the provincial level, comprehensive frameworks should promote collaboration among stakeholders, facilitate best practice sharing, and emphasize the development of climate-resilient crops and efficient water management. Nationally, sustainable agricultural practices must be integrated into broader policies, with prioritization of research and development investments to understand agriculture-carbon interactions.
Finally, collaboration among governmental research institutions, civil society and welfare organizations, and private sector stakeholders is critical for implementation of policies and initiatives to reduce carbon emissions from agriculture and improve the quality of environment. Therefore, policymakers should facilitate multi-stakeholder partnerships and collaborative initiatives aimed at promoting sustainable agricultural practices, innovation and achieving climate resilience in the agricultural sector.
5.2 Limitations and future research
Comparable to previous studies, this study also has a few limitations. Primarily, this research specifically examines the geographic area of China, and its findings may not be readily transferable to other nations or regions that possess distinct agricultural systems, socio-economic situations, and environmental contexts. Hence, it is imperative that we meticulously screen our findings outside the designated research zone. Furthermore, this paper offers policy suggestions derived from its first discoveries. However, the execution of these recommendations may encounter practical obstacles such as political scrutiny, limited resources, and conflicting stakeholder interests. Policymakers should thoroughly evaluate the practicality and consequences of adopting the suggested policies in real-life situations. In conclusion, this study proposes that more investigation should be conducted to analyze the effects of certain agricultural methods, undertake more thorough evaluations of the implications of climate change, and assess the efficacy of various policy initiatives. By addressing these areas of study that have not been explored, we may get a more precise comprehension of the connection between agriculture and carbon emissions.
Data availability statement
The datasets presented in this study can be found in online repositories. The names of the repository/repositories and accession number(s) can be found in the article/Supplementary material.
Author contributions
MA: Conceptualization, Data curation, Formal analysis, Investigation, Methodology, Software, Writing – original draft, Writing – review & editing. QS: Resources, Supervision, Validation, Writing – review & editing. YZ: Data curation, Methodology, Writing – review & editing. AR: Conceptualization, Writing – review & editing. CS: Writing – review & editing. HM: Conceptualization, Investigation, Resources, Supervision, Validation, Writing – review & editing.
Funding
The author(s) declare that financial support was received for the research, authorship, and/or publication of this article. This research was funded by the National Natural Science Foundation of China National Natural Science Foundation of China (Grant Number: 72003057); Henan Province Philosophy and Social Science Planning Project (Grant No. 2022CJJ147); Henan Province Philosophy and Social Sciences Planning Project: Research on the Internal Logic and Realization Path of High-Quality Farmers Innovation and Entrepreneurship under the background of Rural Revitalization (2023BJJ086); National Natural Science Fund of China (Grant No. 72103054); China Postdoctoral Science Foundation (Grant No. 2021T140181). Henan Province Higher Education Teaching Reform Research and Practice Project (2021SJGLX094).
Conflict of interest
The authors declare that the research was conducted in the absence of any commercial or financial relationships that could be construed as a potential conflict of interest.
Publisher’s note
All claims expressed in this article are solely those of the authors and do not necessarily represent those of their affiliated organizations, or those of the publisher, the editors and the reviewers. Any product that may be evaluated in this article, or claim that may be made by its manufacturer, is not guaranteed or endorsed by the publisher.
Supplementary material
The Supplementary material for this article can be found online at: https://www.frontiersin.org/articles/10.3389/fsufs.2024.1424173/full#supplementary-material
Footnotes
References
Aguilera, E., Guzmán, G. I., de Molina, M. G., Soto, D., and Infante-Amate, J. (2019). From animals to machines. The impact of mechanization on the carbon footprint of traction in Spanish agriculture: 1900–2014. J. Clean. Prod. 221, 295–305. doi: 10.1016/j.jclepro.2019.02.247
Ahmad, M. I., Ma, H., Shen, Q., Rehman, A., and Oxley, L. (2024). Climate change variability adaptation and farmers decisions of farm exit and survival in Pakistan. Climate Services 33:100437. doi: 10.1016/j.cliser.2023.100437
Aiello, G., Giovino, I., Vallone, M., Catania, P., and Argento, A. (2018). A decision support system based on multisensor data fusion for sustainable greenhouse management. J. Clean. Prod. 172, 4057–4065. doi: 10.1016/j.jclepro.2017.02.197
Anser, M. K., Yousaf, Z., Usman, B., Nassani, A. A., Abro, M. M. Q., and Zaman, K. (2020). Management of water, energy, and food resources: go for green policies. J. Clean. Prod. 251:119662. doi: 10.1016/j.jclepro.2019.119662
Baig, I. A., Chandio, A. A., Ozturk, I., Kumar, P., Khan, Z. A., and Salam, M. A. (2022). Assessing the long-and short-run asymmetrical effects of climate change on rice production: empirical evidence from India. Environ. Sci. Pollut. Res. 29, 34209–34230. doi: 10.1007/s11356-021-18014-z
Banerjee, S., and Murshed, M. (2020). Do emissions implied in net export validate the pollution haven conjecture? Analysis of G7 and BRICS countries. Int. J. Sustain. Econ. 12, 297–319. doi: 10.1504/IJSE.2020.111539
Barker, T., Bashmakov, I., Bernstein, L., Bogner, J. E., Bosch, P. R., Dave, R., et al. (2009). Contribution of working group III to the fourth assessment report of the IPCC: technical summary. Climate change 2007: Mitigation contribution of working group III to the fourth assessment report of the intergovernmental panel on climate change, intergovernmental panel on climate change, 27–93. Cambridge University Press.
Breusch, T. S., and Pagan, A. R. (1980). The Lagrange multiplier test and its applications to model specification in econometrics. Rev. Econ. Stud. 47, 239–253. doi: 10.2307/2297111
Bakhsh, K., Rose, S., Ali, M. F., Ahmad, N., and Shahbaz, M. (2017). Economic growth, CO2 emissions, renewable waste and FDI relation in Pakistan: New evidences from 3SLS. Journal of environmental management, 196, 627–632. doi: 10.1016/j.jenvman.2017.03.029
Chandio, A. A., Gokmenoglu, K. K., and Ahmad, F. (2021). Addressing the long-and short-run effects of climate change on major food crops production in Turkey. Environ. Sci. Pollut. Res. 28, 51657–51673. doi: 10.1007/s11356-021-14358-8
Chandio, A. A., Jiang, Y., Akram, W., Ozturk, I., Rauf, A., Mirani, A. A., et al. (2023a). The impact of R&D investment on grain crops production in China: analysing the role of agricultural credit and CO2 emissions. Int. J. Finance Econ. 28, 4120–4138. doi: 10.1002/ijfe.2638
Chandio, A. A., Ozdemir, D., and Jiang, Y. (2023b). Modelling the impact of climate change and advanced agricultural technologies on grain output: recent evidence from China. Ecol. Model. 485:110501. doi: 10.1016/j.ecolmodel.2023.110501
Cheng, K., Yan, M., Nayak, D., Pan, G. X., Smith, P., Zheng, J. F., et al. (2015). Carbon footprint of crop production in China: an analysis of National Statistics data. J. Agric. Sci. 153, 422–431. doi: 10.1017/S0021859614000665
Dagar, V., Bansal, E., Murshed, M., Mishra, V., Alvarado, R., Kumar, A., et al. (2020). Stochastic frontier analysis to measure technical efficiency: evidence from skilled and unskilled agricultural labour in India. Int. J. Agric. Stat. Sci. 16.
Demirhan, H. (2020). Impact of increasing temperature anomalies and carbon dioxide emissions on wheat production. Sci. Total Environ. 741:139616. doi: 10.1016/j.scitotenv.2020.139616
Dinda, S. (2004). Environmental Kuznets curve hypothesis: a survey. Ecol. Econ. 49, 431–455. doi: 10.1016/j.ecolecon.2004.02.011
Dong, W., Guo, J., Xu, L., Song, Z., Zhang, J., Tang, A., et al. (2018). Water regime-nitrogen fertilizer incorporation interaction: field study on methane and nitrous oxide emissions from a rice agroecosystem in Harbin, China. J. Environ. Sci. 64, 289–297. doi: 10.1016/j.jes.2017.06.007
Dufour, J., Serrano, D. P., Gálvez, J. L., Moreno, J., and Garcia, C. (2009). Life cycle assessment of processes for hydrogen production. Environmental feasibility and reduction of greenhouse gases emissions. Int. J. Hydrog. Energy 34, 1370–1376. doi: 10.1016/j.ijhydene.2008.11.053
Dumitrescu, E. I., and Hurlin, C. (2012). Testing for granger non-causality in heterogeneous panels. Econ. Model. 29, 1450–1460. doi: 10.1016/j.econmod.2012.02.014
Durba, K., and Tripti, A. (2021). Carbon footprint and water footprint of rice and wheat production in Punjab. India Agricultural Systems, 186, 102959.
Edoja, P. E., Aye, G. C., and Abu, O. (2016). Dynamic relationship among CO2 emission, agricultural productivity and food security in Nigeria. Cogent Econ. Finance 4:1204809. doi: 10.1080/23322039.2016.1204809
Environmental Protection Agency [EPA]. (2022), Inventory of US Greenhouse Gas Emissions and Sinks: 1990–2009. Available at: http://epa.gov/climatechange/emissions/.
Erenstein, O., Jaleta, M., Mottaleb, K. A., Sonder, K., Donovan, J., and Braun, H. J. (2022). “Global trends in wheat production, consumption and trade” in Wheat improvement: Food security in a changing climate (Cham: Springer International Publishing), 47–66.
Fan, X., Zhang, W., Chen, W., and Chen, B. (2020). Land–water–energy nexus in agricultural management for greenhouse gas mitigation. Appl. Energy 265:114796. doi: 10.1016/j.apenergy.2020.114796
FAO, (2016). Food and agriculture Organization of the United Nations, 2016, FAOSTAT database. FAO [DB/OL]. Available at: http://www.fao.org/faostat
FAOSTAT, (2020). Emissions Agriculture. Food and Agriculture Organization of the United Nations. Available at: http://www.fao.org/faostat/en/#data/GT
Foley, J. A., Ramankutty, N., Brauman, K. A., Cassidy, E. S., Gerber, J. S., Johnston, M., et al. (2011). Solutions for a cultivated planet. Nature 478, 337–342. doi: 10.1038/nature10452
Fox, J. A., Adriaanse, P., and Stacey, N. T. (2019). Greenhouse energy management: the thermal interaction of greenhouses with the ground. J. Clean. Prod. 235, 288–296. doi: 10.1016/j.jclepro.2019.06.344
Gengenbach, C., Palm, F. C., and Urbain, J. P. (2006). Cointegration testing in panels with common factors. Oxf. Bull. Econ. Stat. 68, 683–719. doi: 10.1111/j.1468-0084.2006.00452.x
Global Carbon Emissions, Country-by-Country for 2023, (2023), Available at: https://sigmaearth.com/global-carbon-emissions-country-by-country-for2023/#:~:text=China%20is%20the%20world%E2%80%99s%20largest%20emitter%20of%20carbon,accounting%20for%203225%20of%20global%20emissions%20in%202023
Grossman, G. M., and Krueger, A. B. (1995). Economic growth and the environment. Q. J. Econ. 110, 353–377. doi: 10.2307/2118443
Gul, A., Xiumin, W., Chandio, A. A., Rehman, A., Siyal, S. A., and Asare, I. (2022). Tracking the effect of climatic and non-climatic elements on rice production in Pakistan using the ARDL approach. Environ. Sci. Pollut. Res. 29, 31886–31900. doi: 10.1007/s11356-022-18541-3
Guo, L., Zhao, S., Song, Y., Tang, M., and Li, H. (2022). Green finance, chemical fertilizer use and carbon emissions from agricultural production. Agriculture 12:313. doi: 10.3390/agriculture12030313
Hao, Y., Chen, H., Wei, Y. M., and Li, Y. M. (2016). The influence of climate change on CO2 (carbon dioxide) emissions: an empirical estimation based on Chinese provincial panel data. J. Clean. Prod. 131, 667–677. doi: 10.1016/j.jclepro.2016.04.117
Hillier, J., Hawes, C., Squire, G., Hilton, A., Wale, S., and Smith, P. (2009). The carbon footprints of food crop production. Int. J. Agric. Sustain. 7, 107–118. doi: 10.3763/ijas.2009.0419
Huang, X., Xu, X., Wang, Q., Zhang, L., Gao, X., and Chen, L. (2019). Assessment of agricultural carbon emissions and their spatiotemporal changes in China, 1997–2016. Int. J. Environ. Res. Public Health 16:3105. doi: 10.3390/ijerph16173105
Im, K. S., Pesaran, M. H., and Shin, Y. (2003). Testing for unit roots in heterogeneous panels. J. Econ. 115, 53–74. doi: 10.1016/S0304-4076(03)00092-7
IPCC [Intergovmental Panel on Climate Change] Climate Change (2007). The fourth assessment report of the Intergovmental panel on climate change. England: Cambridge University Press.
Jiang, L., and Hardee, K. (2011). How do recent population trends matter to climate change? Popul. Res. Policy Rev. 30, 287–312. doi: 10.1007/s11113-010-9189-7
Jiehua, L., and Zhang, Z. (2020). China’s Provincial Carbon Emission Accounting Standards and Empirical Test Statistics and Decision Making, 36: 46–51
Jin, Z., Mu, Y., Li, Y., and Nie, L. (2023). Effect of different rice planting methods on the water, energy and carbon footprints of subsequent wheat. Front. Sustain. Food Syst. 7:1173916. doi: 10.3389/fsufs.2023.1173916
Jorgenson, A. K., and Clark, B. (2012). Are the economy and the environment decoupling? A comparative international study, 1960–2005. Am. J. Sociol. 118, 1–44. doi: 10.1086/665990
Kashyap, D., and Agarwal, T. (2021). Carbon footprint and water footprint of rice and wheat production in Punjab, India. Agric. Syst. 186:102959. doi: 10.1016/j.agsy.2020.102959
Khan, Z., Murshed, M., Dong, K., and Yang, S. (2021). The roles of export diversification and composite country risks in carbon emissions abatement: evidence from the signatories of the regional comprehensive economic partnership agreement. Appl. Econ. 53, 4769–4787. doi: 10.1080/00036846.2021.1907289
Koondhar, M. A., Shahbaz, M., Ozturk, I., Randhawa, A. A., and Kong, R. (2021a). Revisiting the relationship between carbon emission, renewable energy consumption, forestry, and agricultural financial development for China. Environ. Sci. Pollut. Res. 28, 45459–45473. doi: 10.1007/s11356-021-13606-1
Koondhar, M. A., Udemba, E. N., Cheng, Y., Khan, Z. A., Koondhar, M. A., Batool, M., et al. (2021b). Asymmetric causality among carbon emission from agriculture, energy consumption, fertilizer, and cereal food production—a nonlinear analysis for Pakistan. Sustain Energy Technol Assess 45:101099. doi: 10.1016/j.seta.2021.101099
Kumar, P., Sahu, N. C., Ansari, M. A., and Kumar, S. (2023). Climate change and rice production in India: role of ecological and carbon footprint. J. Agribusiness Dev. Emerg. Econ. 13, 260–278. doi: 10.1108/JADEE-06-2021-0152
Kuriachen, P., Devi, A., Sam, A. S., Kumar, S., Kumari, J., Suresh, A., et al. (2022). Wheat yield responses to rising temperature: insights from northern plains of India. Theor. Appl. Climatol. 150, 1157–1172. doi: 10.1007/s00704-022-04218-x
Li, Y., Ai, Z., Mu, Y., Zhao, T., Zhang, Y., Li, L., et al. (2023). Rice yield penalty and quality deterioration is associated with failure of nitrogen uptake from regreening to panicle initiation stage under salinity. Front. Plant Sci. 14:1120755. doi: 10.3389/fpls.2023.1120755
Li, Z. Z., Li, R. Y. M., Malik, M. Y., Murshed, M., Khan, Z., and Umar, M. (2021). Determinants of carbon emission in China: how good is green investment? Sustain. Prod. Consump. 27, 392–401. doi: 10.1016/j.spc.2020.11.008
Li, C., Xiong, Y., Huang, Q., Xu, X., and Huang, G. (2020). Impact of irrigation and fertilization regimes on greenhouse gas emissions from soil of mulching cultivated maize (Zea mays L.) field in the upper reaches of Yellow River, China. J. Clean. Prod. 259:120873. doi: 10.1016/j.jclepro.2020.120873
Li, A., and Yin, X. (2024). Analysis of factors influencing carbon emissions from rural residential energy consumption in China. Shandong Soc. Sci. 2, 169–176.
Lin, Y. C., Lin, C. C., Lee, M., Chiueh, P. T., Lo, S. L., and Liou, M. L. (2019). Comprehensive assessment of regional food-energy-water nexus with GIS-based tool. Resour. Conserv. Recycl. 151:104457. doi: 10.1016/j.resconrec.2019.104457
Lin, B., and Xu, B. (2018). Factors affecting CO2 emissions in China’s agriculture sector: a quantile regression. Renew. Sust. Energ. Rev. 94, 15–27. doi: 10.1016/j.rser.2018.05.065
Ma, B., Karimi, M. S., Mohammed, K. S., Shahzadi, I., and Dai, J. (2024). Nexus between climate change, agricultural output, fertilizer use, agriculture soil emissions: novel implications in the context of environmental management. J. Clean. Prod. 450:141801. doi: 10.1016/j.jclepro.2024.141801
Maddala, G. S., and Wu, S. (1999). A comparative study of unit root tests with panel data and a new simple test. Oxf. Bull. Econ. Stat. 61, 631–652. doi: 10.1111/1468-0084.0610s1631
Maraseni, T. N., Deo, R. C., Qu, J., Gentle, P., and Neupane, P. R. (2018). An international comparison of rice consumption behaviours and greenhouse gas emissions from rice production. J. Clean. Prod. 172, 2288–2300. doi: 10.1016/j.jclepro.2017.11.182
Masson-Delmotte, V., Zhai, P., Pörtner, H. O., Roberts, D., Skea, J., Shukla, P. R., et al. (2018). Intergovernmental Panel on Climate Change (IPCC). Global Warming of 1.5 °C: An IPCC Special Report on the Impacts of Global Warming of 1.5 °C Above Pre-Industrial Levels and Related Global Greenhouse Gas Emission Pathways, in the Context of Strengthening the Global Response to the Threat of Climate Change. Sustainable Development, and Efforts to Eradicate Poverty. Available online: https://www.ipcc.ch/sr15/ (accessed on 18 October 2019).
Mele, M., and Magazzino, C. (2020). A machine learning analysis of the relationship among iron and steel industries, air pollution, and economic growth in China. J. Clean. Prod. 277:123293. doi: 10.1016/j.jclepro.2020.123293
Murshed, M., and Alam, M. S. (2021). Estimating the macroeconomic determinants of total, renewable, and non-renewable energy demands in Bangladesh: the role of technological innovations. Environ. Sci. Pollut. Res. 28, 30176–30196. doi: 10.1007/s11356-021-12516-6
Nair, K. P., and Nair, K. P. (2019). How to manage water use for sustainable agriculture?. Intelligent Soil Management for Sustainable Agriculture: The Nutrient Buffer Power Concept, 191–232
Nathaniel, S. P. (2021). Environmental degradation in ASEAN: assessing the criticality of natural resources abundance, economic growth and human capital. Environ. Sci. Pollut. Res. 28, 21766–21778. doi: 10.1007/s11356-020-12034-x
Nordhaus, W. D. (2007). To tax or not to tax: alternative approaches to slowing global warming. Rev. Environ. Econ. Policy 1, 26–44. doi: 10.1093/reep/rem008
Ntiamoah, E. B., Li, D., Appiah-Otoo, I., Twumasi, M. A., and Yeboah, E. N. (2022). Towards a sustainable food production: modelling the impacts of climate change on maize and soybean production in Ghana. Environ. Sci. Pollut. Res. 29, 72777–72796. doi: 10.1007/s11356-022-20962-z
Nwaka, I. D., Nwogu, M. U., Uma, K. E., and Ike, G. N. (2020). Agricultural production and CO2 emissions from two sources in the ECOWAS region: new insights from quantile regression and decomposition analysis. Sci. Total Environ. 748:141329. doi: 10.1016/j.scitotenv.2020.141329
Onyeneke, R. U., Ejike, R. D., Osuji, E. E., and Chidiebere-Mark, N. M. (2024). Does climate change affect crops differently? New evidence from Nigeria. Environ. Dev. Sustain. 26, 393–419. doi: 10.1007/s10668-022-02714-8
Pathak, H., and Fagodiya, R. K. (2022). Nutrient budget in Indian agriculture during 1970–2018: assessing inputs and outputs of nitrogen, phosphorus, and potassium. J. Soil Sci. Plant Nutr. 22, 1832–1845. doi: 10.1007/s42729-022-00775-2
Pesaran, M. H. (2004). General diagnostic tests for cross section dependence in panels, vol. 3: University of Cambridge & USC Working paper no.0435, June 2004.
Pesaran, M. H. (2006). Estimation and inference in large heterogeneous panels with a multifactor error structure. Econometrica 74, 967–1012. doi: 10.1111/j.1468-0262.2006.00692.x
Pesaran, M. H. (2015). Testing weak cross-sectional dependence in large panels. Econ. Rev. 34, 1089–1117. doi: 10.1080/07474938.2014.956623
Pesaran, M. H., and Yamagata, T. (2008). Testing slope homogeneity in large panels. J. Econ. 142, 50–93. doi: 10.1016/j.jeconom.2007.05.010
Picano, E., Mangia, C., and D’Andrea, A. (2022). Climate change, carbon dioxide emissions, and medical imaging contribution. J. Clin. Med. 12:215. doi: 10.3390/jcm12010215
Pickson, R. B., He, G., and Boateng, E. (2021). Impacts of climate change on rice production: evidence from 30 Chinese provinces. Environ. Dev. Sustain. 24, 3907–3925. doi: 10.1007/s10668-021-01594-8
Persyn, D., and Westerlund, J. (2008). Error-correction–based cointegration tests for panel data. The STATA journal, 8, 232–241. doi: 10.1177/1536867X0800800205
Qin, L., Liu, S., Hou, Y., Zhang, Y., Wu, D., and Yan, D. (2023). The spatial spillover effect and mediating effect of green credit on agricultural carbon emissions: evidence from China. Front. Earth Sci. 10:1037776. doi: 10.3389/feart.2022.1037776
Rahim, A., Peng, Q., Chen, H., and Liu, Y. (2024). The impact of carbon emissions from lag fertilization on wheat production. PLoS One 19:e0299299. doi: 10.1371/journal.pone.0299299
Raza, M. Y., Khan, A. N., Khan, N. A., and Kakar, A. (2021). The role of food crop production, agriculture value added, electricity consumption, forest covered area, and forest production on CO 2 emissions: insights from a developing economy. Environ. Monit. Assess. 193, 1–16. doi: 10.1007/s10661-021-09523-y
Reay, D. S., Davidson, E. A., Smith, K. A., Smith, P., Melillo, J. M., Dentener, F., et al. (2012). Global agriculture and nitrous oxide emissions. Nat. Clim. Chang. 2, 410–416. doi: 10.1038/nclimate1458
Rehman, A., Chandio, A. A., Hussain, I., and Jingdong, L. (2019). Fertilizer consumption, water availability and credit distribution: major factors affecting agricultural productivity in Pakistan. Journal of the Saudi society of. Agric. Sci. 18, 269–274. doi: 10.1016/j.jssas.2017.08.002
Reynolds, L., and Wenzlau, S. (2012). Climate-friendly agriculture and renewable energy: Working hand-in-hand toward climate mitigation. Worldwatch Institute. (Ed). Available at: http://www.renewableenergyworld
Reynolds, T. W., Waddington, S. R., Anderson, C. L., Chew, A., True, Z., and Cullen, A. (2015). Environmental impacts and constraints associated with the production of major food crops in Sub-Saharan Africa and South Asia. Food Security, 7, 795–822. doi: 10.1007/s12571-015-0478-1
Shabani, Z. D., and Shahnazi, R. (2019). Energy consumption, carbon dioxide emissions, information and communications technology, and gross domestic product in Iranian economic sectors: a panel causality analysis. Energy 169, 1064–1078. doi: 10.1016/j.energy.2018.11.062
Sharma, P. C., Jat, H. S., and Fagodiya, R. K., (2021). Nitrogen management in conservation agriculture-based cropping systems. Available at: http://krishi.icar.gov.in/jspui/handle/123456789/69750
Shen, X., Liu, B., Lu, X., and Fan, G. (2017). Spatial and temporal changes in daily temperature extremes in China during 1960–2011. Theor. Appl. Climatol. 130, 933–943. doi: 10.1007/s00704-016-1934-3
Shen, J., Zhu, Q., Jiao, X., Ying, H., Wang, H., Wen, X., et al. (2020). Agriculture green development: a model for China and the world. Front. Agric. Sci. Eng. 7, 5–13. doi: 10.15302/J-FASE-2019300
Shuai, C., Chen, X., Wu, Y., Tan, Y., Zhang, Y., and Shen, L. (2018). Identifying the key impact factors of carbon emission in China: results from a largely expanded pool of potential impact factors. J. Clean. Prod. 175, 612–623. doi: 10.1016/j.jclepro.2017.12.097
Statista, (2023), Food crop acreage in China 2022, by main crop. Available at: https://www.statista.com/statistics/1198950/china-food-crop-acreage-by-major-crop/#:~:text=In%202022%2C%20farmers%20in%20China,23.5%20million%20hectares%20in%20China
Stern, D. I. (2004). The rise and fall of the environmental Kuznets curve. World Dev. 32, 1419–1439. doi: 10.1016/j.worlddev.2004.03.004
Sun, Y., Zhang, X., Ding, Y., Chen, D., Qin, D., and Zhai, P. (2022). Understanding human influence on climate change in China. National science review. 9, nwab113.
Shin, Y., Yu, B., and Greenwood-Nimmo, M. (2014). Modelling asymmetric cointegration and dynamic multipliers in a nonlinear ARDL framework. Festschrift in honor of Peter Schmidt: Econometric methods and applications, 281–314.
Tewatia, R. K., and Chanda, T. K. (2017). “Trends in fertilizer nitrogen production and consumption in India” in The Indian nitrogen assessment (Elsevier), 45–56.
Tiwari, S., Mohammed, K. S., Mentel, G., Majewski, S., and Shahzadi, I. (2023). Role of circular economy, energy transition, environmental policy stringency, and supply chain pressure on CO2 emissions in emerging economies. Geosci. Front. 15:101682. doi: 10.1016/j.gsf.2023.101682
Tuan Anh, N., Gan, C., and Anh, D. L. T. (2020). Does credit boost agricultural performance? Evidence from Vietnam. Int. J. Soc. Econ. 47, 1203–1221. doi: 10.1108/IJSE-04-2020-0238
Ullah, S., Ahmad, W., Majeed, M. T., and Sohail, S. (2021). Asymmetric effects of premature deagriculturalization on economic growth and CO2 emissions: fresh evidence from Pakistan. Environ. Sci. Pollut. Res. 28, 66772–66786. doi: 10.1007/s11356-021-15077-w
Valin, H., Havlík, P., Mosnier, A., Herrero, M., Schmid, E., and Obersteiner, M. (2013). Agricultural productivity and greenhouse gas emissions: trade-offs or synergies between mitigation and food security? Environ. Res. Lett. 8:35019. doi: 10.1088/1748-9326/8/3/035019
Walheer, B. (2018). Economic growth and greenhouse gases in Europe: a non-radial multi-sector nonparametric production-frontier analysis. Energy Econ. 74, 51–62. doi: 10.1016/j.eneco.2018.05.028
Wang, S., Fang, C., Guan, X., Pang, B., and Ma, H. (2014). Urbanisation, energy consumption, and carbon dioxide emissions in China: a panel data analysis of China’s provinces. Appl. Energy 136, 738–749. doi: 10.1016/j.apenergy.2014.09.059
Wang, X. X., He, A. Z., and Zhao, J. (2020). Regional disparity and dynamic evolution of carbon emission reduction maturity in China’s service industry. J. Clean. Prod. 244:118926. doi: 10.1016/j.jclepro.2019.118926
Wang, M., Hossain, M. R., Mohammed, K. S., Cifuentes-Faura, J., and Cai, X. (2023). Heterogenous effects of circular economy, green energy and globalization on CO2 emissions: policy based analysis for sustainable development. Renew. Energy 211, 789–801. doi: 10.1016/j.renene.2023.05.033
Wang, X. C., Klemeš, J. J., Wang, Y., Dong, X., Wei, H., Xu, Z., et al. (2020). Water-energy-carbon emissions nexus analysis of China: an environmental input-output model-based approach. Appl. Energy 261:114431. doi: 10.1016/j.apenergy.2019.114431
Wang, Q., and Wang, L. (2021). The nonlinear effects of population aging, industrial structure, and urbanization on carbon emissions: a panel threshold regression analysis of 137 countries. J. Clean. Prod. 287:125381. doi: 10.1016/j.jclepro.2020.125381
Wang, Q., and Zhang, F. (2021). The effects of trade openness on decoupling carbon emissions from economic growth–evidence from 182 countries. J. Clean. Prod. 279:123838. doi: 10.1016/j.jclepro.2020.123838
World Bank, (2020). World development indicators. The World Bank. Available at: https://data.worldbank.org/country/CN
Wu, J. Z., Zhang, J., Ge, Z. M., Xing, L. W., Han, S. Q., Chen, S. H. E. N., et al. (2021). Impact of climate change on maize yield in China from 1979 to 2016. J. Integr. Agric. 20, 289–299. doi: 10.1016/S2095-3119(20)63244-0
Xu, B., and Lin, B. (2017). Factors affecting CO2 emissions in China’s agriculture sector: evidence from geographically weighted regression model. Energy Policy 104, 404–414. doi: 10.1016/j.enpol.2017.02.011
Yang, H., Wang, X., and Bin, P. (2022). Agriculture carbon-emission reduction and changing factors behind agricultural eco-efficiency growth in China. J. Clean. Prod. 334:130193. doi: 10.1016/j.jclepro.2021.130193
Ye, M., Si Mohammed, K., Tiwari, S., Ali Raza, S., and Chen, L. (2023). The effect of the global supply chain and oil prices on the inflation rates in advanced economies and emerging markets. Geol. J. 58, 2805–2817. doi: 10.1002/gj.4742
York, R. (2007). Demographic trends and energy consumption in European Union nations, 1960–2025. Soc. Sci. Res. 36, 855–872. doi: 10.1016/j.ssresearch.2006.06.007
Zhai, S., Song, G., Qin, Y., Ye, X., and Lee, J. (2017). Modeling the impacts of climate change and technical progress on the wheat yield in inland China: an autoregressive distributed lag approach. PLoS One 12:e0184474. doi: 10.1371/journal.pone.0184474
Zhang, J., Bei, S., Li, B., Zhang, J., Christie, P., and Li, X. (2019). Organic fertilizer, but not heavy liming, enhances banana biomass, increases soil organic carbon and modifies soil microbiota. Appl. Soil Ecol. 136, 67–79. doi: 10.1016/j.apsoil.2018.12.017
Zhang, H., Chandio, A. A., Yang, F., Tang, Y., Ankrah Twumasi, M., and Sargani, G. R. (2022). Modeling the impact of climatological factors and technological revolution on soybean yield: evidence from 13-major provinces of China. Int. J. Environ. Res. Public Health 19:5708. doi: 10.3390/ijerph19095708
Zhang, L., Li, X., Yu, J., and Yao, X. (2018). Toward cleaner production: what drives farmers to adopt eco-friendly agricultural production? J. Clean. Prod. 184, 550–558. doi: 10.1016/j.jclepro.2018.02.272
Zhang, C., Liu, S., Wu, S., Jin, S., Reis, S., Liu, H., et al. (2019). Rebuilding the linkage between livestock and cropland to mitigate agricultural pollution in China. Resour. Conserv. Recycl. 144, 65–73. doi: 10.1016/j.resconrec.2019.01.011
Zhang, Y. J., Liu, Z., Zhang, H., and Tan, T. D. (2014). The impact of economic growth, industrial structure and urbanization on carbon emission intensity in China. Nat. Hazards 73, 579–595. doi: 10.1007/s11069-014-1091-x
Zhang, D., Shen, J., Zhang, F., Li, Y. E., and Zhang, W. (2017). Carbon footprint of grain production in China. Sci. Rep. 7:4126. doi: 10.1038/s41598-017-04182-x
Keywords: rice production, CO2 emissions, wheat, fertilizers, water usage, agricultural credit, climate change
Citation: Ahmad MI, Shen Q, Zhang Y, Rehman A, Song C and Ma H (2024) Do agricultural credit, wheat, and rice production impact environmental quality? Novel evidence from China’s mega agricultural regions. Front. Sustain. Food Syst. 8:1424173. doi: 10.3389/fsufs.2024.1424173
Edited by:
Muhammad Yousaf Raza, Shandong Technology and Business University, ChinaReviewed by:
Aqib Zahoor, Tianjin University, ChinaXiangjin Shen, Chinese Academy of Sciences (CAS), China
Farhad Zulfiqar, Asian Institute of Technology, Thailand
Copyright © 2024 Ahmad, Shen, Zhang, Rehman, Song and Ma. This is an open-access article distributed under the terms of the Creative Commons Attribution License (CC BY). The use, distribution or reproduction in other forums is permitted, provided the original author(s) and the copyright owner(s) are credited and that the original publication in this journal is cited, in accordance with accepted academic practice. No use, distribution or reproduction is permitted which does not comply with these terms.
*Correspondence: Hengyun Ma, aC55Lm1hQDE2My5jb20=