 Zeus Mateos-Fierro1,2*
 Michael P. D. Garratt3
 Michelle T. Fountain4
 Kate Ashbrook2
 Duncan B. Westbury2,5
- 1Department of Entomology, Purdue University, West Lafayette, IN, United States
- 2School of Science & the Environment, University of Worcester, Worcester, United Kingdom
- 3School of Agriculture, Policy and Development, University of Reading, Reading, United Kingdom
- 4NIAB, East Malling, United Kingdom
- 5Royal Agricultural University, Cirencester, United Kingdom
Sweet cherry (Prunus avium) production relies on modern growing practices like polytunnel coverings to improve yields but this may interrupt arthropod-mediated ecosystem services. The distribution of beneficial arthropods (natural enemies and flower visitors) and the ecosystem services they provide may be affected under polytunnel systems, especially at orchard edges. Across 10 commercial cherry orchards grown in polytunnels, we explored how wildflower strips mitigated edge effects on beneficial arthropods and pest regulation and pollination services. In each orchard, we established a standard wildflower strip (SWS; single cut at the end of the season) and an actively managed wildflower strip (AMWS; regularly cut at 20 cm height) between tree rows and compared this to a conventional control strip (CS). We recorded natural enemies in alleyways and cherry trees post-cherry anthesis (flowering) and flower visitors during and post-cherry anthesis at different distances from the orchard edge (2017–2019). In 2019, we deployed insect prey bait cards in trees to measure pest regulation services and recorded fruit quality (2017–2019) and fruit set (2018–2019) to measure pollination services. Distance from the orchard edge did not affect natural enemy density or diversity in any year or under any alleyway treatment, but pest regulation services decreased towards orchard centres with CS (by 33.0% reduction). Flower visitor density (−34% individuals) and diversity declined with distance from the edge during cherry anthesis. For post-cherry anthesis, marginal negative edge effects were observed for flower visitor density and diversity and behaviour. Overall, fruit set decreased towards the orchard centre while fruit quality increased. Our results suggest that wildflower strips are an effective tool to mitigate edge effects on pest regulation services but have limited effects on flower visitors and pollination.
1 Introduction
Intensive sweet (Prunus avium L.) and sour cherry (P. cerasus L.) production is highly dependent on management innovations (Bujdosó and Hrotkó, 2017), which range from rootstocks and cultivars, to training systems and protective coverings (i.e., polytunnels; Lang, 2005; Whiting et al., 2005). As a result of adopting modern improvements, global cherry production has increased in recent decades (FAOSTAT, 2023). In temperate regions, such as the UK, open-ended polytunnels are essential for commercial cherry cultivation (Ryder et al., 2020; Mateos-Fierro et al., 2023) to protect the crop against environmental factors (e.g., rainfall; Lang et al., 2016). When polytunnels are used, cherry trees are typically covered during the blossom and fruit development stages (Lang et al., 2016) and left uncovered in winter to meet the cherry chilling period requirement (Fadón et al., 2015). Polytunnels protect flowers and fruit, enhancing yields, fruit quality and consistency in marketable production; cherry anthesis (flowering period) and harvest can also be better anticipated (Blanke et al., 2017; Meland et al., 2017). In addition, under polytunnels, the persistence of plant protection products (e.g., insecticides such as lambda-cyhalothrin and cyantraniliprole) is increased (Shaw et al., 2019), reducing agricultural inputs.
There are negative effects of polytunnels however, such as excess heat, reducing fruit set and quality, and the development of pests and diseases (e.g., two-spotted spider mite; Tetranychus urticae; Lang, 2014; Blanke et al., 2017). Additionally, some polytunnel plastics can affect natural enemy performance (Doukas and Payne, 2007), and although natural enemies are not normally deterred from the crops under polytunnels (Hodgkiss et al., 2022; Buck et al., 2024), the influence of proximity from the polytunnel ends or “edge effects” on natural enemy density and diversity and pest regulation services has not been investigated. In contrast, edge effects are frequently reported in open cropping systems, with a decrease in some natural enemy taxa towards the centres of fields (Thomson and Hoffmann, 2013; Woodcock et al., 2016; Whitehouse et al., 2018). Edge effects can also be more prominent in crops with increasing distance from semi-natural habitats, which are reservoirs for natural enemies (Rand et al., 2006).
Studies in open crops have not reported reductions in pollinator visits and yields relative to the field edges (Button and Elle, 2014; Woodcock et al., 2016; Fountain et al., 2019). However, plastic films used to cover polytunnels can affect the light spectrum and influence pollinator health and visits to crop flowers (Lang, 2014; Kendall et al., 2021; Warren et al., 2024). Although Warren et al. (2024) did not find detrimental effects of covers on honeybee foraging behaviour, pollination services can ultimately be reduced (Kendall et al., 2021). For example, bee visits to blossoms and subsequent fruit set in berry crops can be reduced towards the centre of the fields under polytunnels (Hall et al., 2020; Howard et al., 2021; Willden et al., 2022). Little is known about edge effects on pollinator density and diversity and pollination services under polytunnels in stone fruits (e.g., cherries) and no studies have investigated management practices to mitigate them. Additionally, the impact of pollinators on cherry fruit quality, and studies taking place under polytunnels, are underrepresented in the cherry pollination literature (Osterman et al., 2024).
Both natural enemies and pollinators (beneficial arthropods) provide essential ecosystem services in cherries. Some of the major cherry pests (e.g., black cherry aphid; Myzus cerasi) can be controlled to some extent by natural enemies through pest regulation services (Stutz and Entling, 2011), reducing plant protection product usage. Pollinators provide essential pollination services ensuring commercial yields, since both sweet and sour cherries are pollinator-dependent (Reilly et al., 2020). Wildflower strips, established in alleyways between tree rows, are a tool growers can adopt as part of Integrated Pest and Pollinator Management (IPPM) programmes to enhance sustainable food production. In previous studies, we examined the impacts of wildflower strips on natural enemies and pest regulation services (Mateos-Fierro et al., 2021) and pollinators (henceforth flower visitors) and pollination services (Mateos-Fierro et al., 2023). We showed that natural enemies and flower visitors provide critical ecosystem services in cherry and are influenced by floral resources provided in polytunnels. However, the extent to which sown wildflowers can support and maintain an even distribution of beneficial arthropods and the ecosystem services they deliver throughout cherry orchards under polytunnel systems mitigating possible edge effects remains unknown. To understand the benefits and limitations of polytunnels on arthropod-mediated ecosystem services and provide growers with effective IPPM guidelines, this study combines and reanalyses data from these studies. Here, we investigate whether perennial native wildflower strips established in the alleyways of UK sweet cherry orchards under polytunnels can specifically mitigate possible edge effects. Our study tested whether edge effects changed (i) natural enemy and flower visitor density, diversity and behaviour, and (ii) their respective ecosystem services, pest regulation and pollination services (i.e., fruit set and quality) and (iii) to what extent any edge effects could be mitigated through the use of sown wildflower strips.
2 Materials and methods
2.1 Study sites
The study was conducted at five sites, each with two sweet cherry orchards, in the West Midlands, UK between 2017 and 2019 (Supplementary Figures 1A,B; Supplementary Table 1). All 10 commercial orchards were managed conventionally [see Mateos-Fierro et al. (2021) for plant protection product applications]. Polytunnels were in place from April (Supplementary Figures 1C,D), prior to cherry anthesis, until September, after harvest. Distance between sites varied from 2.8 to 92.9 km (mean ± SD: 57.2 km ± 35.4) and orchards within each site from 30.1 to 974.8 m (478.0 m ± 402.5). Orchard size varied from 1.3 to 7.5 ha (3.3 ha ± 1.8) and included two to six cultivars in separate rows. A combination of western honeybees (Apis mellifera), with hives located adjacent to the orchards, and commercial boxes of buff-tailed bumblebees (Bombus terrestris) were deployed along the alleyways by the growers (Supplementary Figures 1E,F); at one orchard, only honeybees were used.
Three alleyways per orchard (Supplementary Figures 1G–I) containing a row with the cultivar Kordia were selected and two randomly received a wildflower treatment, while the third functioned as a control (Mateos-Fierro et al., 2021, 2023):
i. Control Strips (CS). Conventionally managed alleyways cut regularly (once/twice per month) to a height of 10 cm from May to September and 8 cm in late September.
ii. Standard Wildflower Strips (SWS). Cut annually in late September to a height of 8 cm.
iii. Actively Managed Wildflower Strips (AMWS). Cut regularly (twice/three times per month) to a height of 20 cm from May to September and 8 cm in late September.
The alleyway treatment AMWS was introduced to enhance grower uptake since there may be additional benefits of this novel approach, such as minimising the inconvenience of tall vegetation in the alleyways, thus facilitating worker movement. The height of 20 cm was chosen because the wildflowers in the mix can still bloom at that height (Mateos-Fierro et al., 2021, 2023).
Distance between alleyway treatments ranged from 26 to 48 m (37.9 m ± 7.0), depending on Kordia row location within the orchards. To standardise among orchards, a 95 m alleyway length was established, from the first tree (orchard edge) towards the centre (Figure 1). To investigate edge effects in the orchard, alleyways were divided into five 19 m sections with three subsections each, but the last section was a buffer and not assessed (76–95 m). As five of the 30 alleyways measured 95 m, we did not include subsections 9–12 in the analyses for those five alleyways. Subsection 8 was the middle of the alleyway (i.e., centre of the orchard at 47.5 m) and from that point, sections would become closer to the other edge.
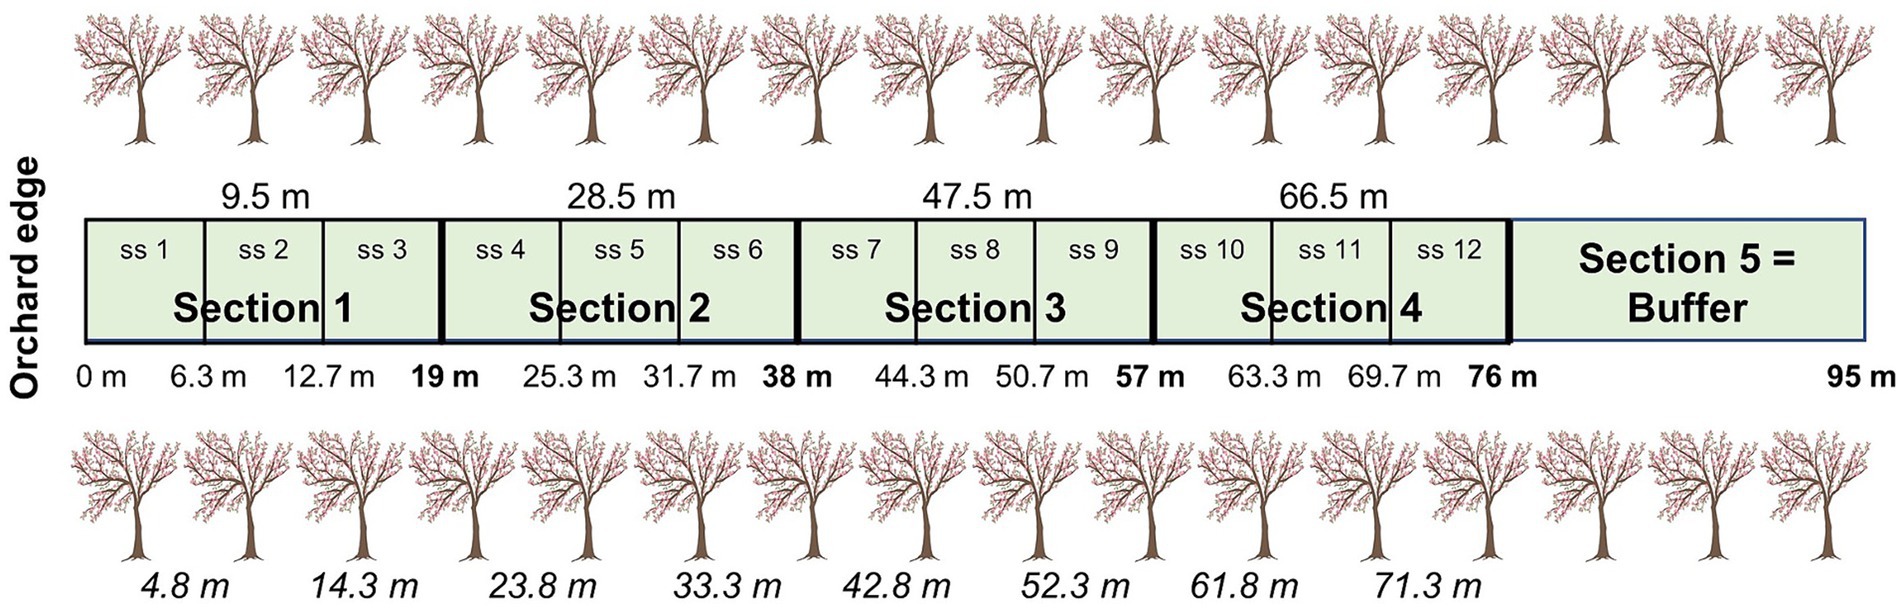
Figure 1. Division of the alleyways into four sections and 12 subsections (ss), including the buffer (not assessed). Top values give the four locations of the mid-section points and cherry trees for each of the four sections used for natural enemy assessments and environmental factor measurements. Middle values give the subsection distance ranges for flower visitor assessments; end of sections bolded. Bottom values (in italics) give the location of the eight trees used to measure ecosystem services (bait cards (2019) and fruit quality (2017-2019) and fruit set (2018-2019) assessments; we used four trees for pollination services in 2019). All distances are based on the distance from the orchard edge (m). Modified from Mateos-Fierro et al. (2021).
Wildflower treatments were established in autumn 2016 consisting of eight forb and one grass species at 1.9 gm−2 and 0.1 gm−2, respectively [for details, see Mateos-Fierro et al. (2018)]. All sites were re-sown in 2017 due to poor establishment; three in spring and two in autumn and maintained to 10 cm until spring 2018. Consequently, 2017 was a baseline year and wildflowers started to bloom post-cherry anthesis, late May-early June 2018. One site (two orchards) was discarded from data collection in 2019 post-cherry anthesis due to poor wildflower establishment. Floral units/inflorescences (heads; Carvell et al., 2015) were recorded within alleyways deploying 10 randomly placed square metre quadrats along the alleyways post-cherry anthesis in 2018 and 2019. Wildflowers blooming during cherry anthesis were scarce and not recorded. SWS and AMWS had significantly greater floral resources compared to CS (mean ± SE: 2.5 ± 0.9, 1.7 ± 0.6 and 0.4 ± 0.2, respectively). Detailed methodology and results on floral assessments are in Mateos-Fierro et al. (2021), while means of sown and unsown plant species are in Supplementary Table S3 in Mateos-Fierro et al. (2023). Results of the effects of alleyway treatments on arthropods and their ecosystem services are in Mateos-Fierro et al. (2021) and Mateos-Fierro et al. (2023).
2.2 Natural enemy assessments
Here, we present a summary of the methodology for natural enemy assessments and pest regulation services. For full details see Mateos-Fierro et al. (2021).
Natural enemy density and diversity were recorded in both the alleyways and cherry trees post-cherry anthesis between 2017 and 2019. In the alleyways, assessments were done twice monthly in 2017 but once monthly in 2018 and 2019 from July–September, June–September and May–August, respectively. Density and diversity were recorded with 2-min observations followed by Vortis™ suction sampling (Burkard Manufacturing Company Ltd., United Kingdom; 15 × 10 s each) in the middle of each of the four sections over 0.5 m2 (Figure 1).
In cherry trees, assessments were done twice monthly in 2017 and once monthly in 2018 and 2019, from May–October, May–October and May–August, respectively. Density and diversity were recorded with 2-min observations followed by beat sampling over ~1 m2, tapping five branches with a stick while holding a 45 × 35 × 2.5 cm tray underneath the middle tree in each of the four sections (Figure 1). All predators from both assessments were identified to family but parasitoid wasps (Hymenoptera) were not identified further. Natural enemies were grouped into eight taxa (1) Coleoptera (beetles), (2) Neuroptera (lacewings), (3) Syrphidae (hoverfly larvae), (4) Hemiptera (true bugs), (5) Araneae (spiders), (6) Opiliones (harvestmen), (7) Anystidae (whirligig mites) and (8) parasitoid wasps. Anystidae were not recorded in alleyways. Other recorded taxa with low density were not included [e.g., Dermaptera (earwigs), only 11 individuals recorded].
2.3 Pest regulation services
To measure predator/scavenger activity (feeding behaviour), aphid (Acyrthosiphon pisum) bait cards were deployed in eight cherry trees along the alleyways at 9.5 m intervals from the orchard edge with the first tree located at 5 m (Figure 1). We deployed one bait card per tree, in the inner part, at ~1.8 m above the ground (Supplementary Figure 2A). Ten aphids (including third and fourth nymph and adult stages) were glued (Pritt PVA Craft Glue) on white PVC cards (760 μm, CR80). Aphids were frozen prior to being glued. Bait cards were deployed three times (June, July and August 2019) and the number of aphids depleted/removed was recorded for 5 days every 24 h (Supplementary Figure 2B).
2.4 Flower visitor assessments
Here, we present a summary of the methodology on flower visitor assessments and pollination services. For full details see Mateos-Fierro et al. (2023). Methodologies on flower visitor behaviour and fruit quality parameters not included in Mateos-Fierro et al. (2023) are detailed in full.
Flower visitor density and diversity were recorded within each of the 12 × 6.3 m subsections (Figure 1) during 16-min walking transect surveys along the alleyways during cherry anthesis and post-cherry anthesis between 2017 and 2019. Two transect surveys were done per visit in 2017, and one in 2018 and 2019 in April–May during cherry anthesis (stages 59–69 BBCH scale; Fadón et al., 2015), with a minimum of six visits to each orchard (all three alleyway treatments) per year. Post-cherry anthesis, transect surveys were done monthly in 2017, 2018 and 2019 from May–September, June–September and May–August, respectively. Surveys were done when the temperature was higher than 8°C, on clear days, from 10:30 to 17:00 h.
All flower visitors were identified to species (or genus) when possible or caught for identification in the laboratory. Flower visitor behaviour was categorised into (i) visiting cherry flower (during cherry anthesis), (ii) visiting (extrafloral leaf) nectary (post-cherry anthesis; nectaries were not present earlier), (iii) visiting wildflower, (iv) flying, and (v) resting (Supplementary Figures 2C–G). Flower visitors were grouped into five taxa (1) honeybees, (2) buff-tailed bumblebees (during cherry anthesis), (3) wild bumblebees, (4) solitary bees, and (5) hoverflies (adults). All buff-tailed bumblebee workers during cherry anthesis were considered commercially managed.
2.5 Pollination services
We measured fruit quality in 2017–2019 and fruit set in 2018–2019 to explore the extent to which pollination services were affected by the edge (fruit set was not explored in 2017). We used eight trees per alleyway (two per section), located at intervals of 6.3 m from the orchard edge (Figure 1) in 2017–2018 but in 2019, we only used four trees located at 4.8, 23.8, 42.8 and 61.8 m. On each tree, prior to cherry anthesis, we randomly selected one spur (~30 cm long from the tip), with at least 20 buds (mean ± SD: 68.7 ± 26.0), at 1.5–2.0 m above the ground. All blossoms were left open for insect pollination and counted in 2018 and 2019. Fruit set was determined in July prior to harvest. A maximum of 10 cherry fruits per spur were harvested in 2017 and a maximum of three in 2018 and 2019. Fruits were evaluated within 48 h but stored at 6°C in the interim. Fruit quality was assessed by measuring fresh mass, height, width (diameter), length, firmness and dry matter (Koumanov et al., 2016); length was not measured in 2018. Mass was measured with an electronic scale (Precision Balances Entris®, model 822-1SUS) and dimensions (Supplementary Figure 2H) with an electronic digital calliper. A firmness tester (Agrosta® 100USB) was used to determine fruit firmness and values are reported as Durofel units (Zoffoli et al., 2017), which indicate resistance (1 to 100; Belge et al., 2017). A mean firmness value was calculated for each cherry by measuring two perpendicular sides. Prior to these assessments, all cherry stalks were removed. Finally, seeds were extracted with a stainless-steel cherry pitter and the cherry flesh was dried in an industrial oven at 65°C for 48 h.
2.6 Environmental factors
Temperature, humidity and wind speed (which could affect beneficial arthropods and their ecosystem services) were recorded using a Kestrel weather monitor (Kestrel 3500) to investigate their variation along the alleyways. Environmental factors were measured in the middle of each of the four sections (Figure 1) for each assessment conducted (including both natural enemy and flower visitor assessments) at ~1.5 m above the ground. In addition, an extra measurement was taken at the edge of the polytunnel (0 m).
2.7 Statistical analysis
Data were analysed with the software R (version R-4.4.0; R Core Team, 2024) using (Generalised) Linear Mixed-Effect Models (GLMER / LMER; ‘lme4’ package; Bates et al., 2015). Normality was tested (Shapiro–Wilk test) and models were selected using the Akaike Information Criterion (AICc; Burnham and Anderson, 2002) using the ‘MuMIn’ package (Bartoń, 2022). Distance from the orchard edge (continuous factor) and its interaction with alleyway treatment (categorical factor) were specified as fixed effects, while random effects were orchards nested within sites. We analysed each year separately to explore how the effects of wildflower strips changed from 2017 (baseline year with no wildflowers in bloom) to 2018 and 2019 (wildflowers in bloom post-cherry anthesis). To visualise edge effects, models were plotted computing marginal effects and adjusted predictions from the statistical models using the function ggeffect (‘ggeffects’ package; Lüdecke, 2018), unless otherwise specified (i.e., environmental factors, see section 2.7.3).
2.7.1 Beneficial arthropod density and diversity
For density, we calculated means of (i) natural enemies for each section (1–4), alleyway treatment (CS, SWS, AMWS), year (2017–2019), survey (monthly post-cherry anthesis) and habitat (alleyways or cherry trees) and (ii) flower visitors for each subsection (1–12), alleyway treatment (CS, SWS, AMWS), year (2017–2019), survey (at least six surveys during cherry anthesis and monthly post-cherry anthesis), cherry blossom period (during cherry anthesis and post-cherry anthesis) and behaviour (visiting cherry flowers, visiting nectaries, visiting wildflowers, resting or flying). To better understand the response to edge effect under polytunnels of the different natural enemy and flower visitor taxa, we also conducted separate analyses for each taxon (i.e., total and individual taxa). For diversity, means of richness (family for natural enemies and species for flower visitors) and Shannon diversity were calculated as above, i.e., for each (sub)section, alleyway treatment, year, survey and (i) habitat or (ii) cherry blossom period and behaviour. Density (total and individual taxa) and richness were analysed using GLMERs with negative binomial error distribution (function = GLMER.NB) and Shannon diversity with LMERs (function = LMER). Response variables can be found in Supplementary Table 2 (natural enemies) and Supplementary Table 3 (flower visitors).
2.7.2 Pest regulation and pollination services
GLMERs with binomial error distribution (function = GLMER; family = binomial) were used to analyse the bait cards and fruit set, considering the proportion of aphids that were depleted and fruits that set, respectively. Aphids covered in glue (2.4%) and therefore not available to natural enemies were removed from analyses. All fruit quality parameters were analysed using LMERs. We performed additional GLMER.NB models for each year to explore the relationship between fruit set and quality with cherry flower visitor density, alleyway treatment and distance, including their interactions. Response variables can be found in Supplementary Table 2 (pest regulation services) and Supplementary Table 4 (pollination services: fruit set and quality).
2.7.3 Environmental factors
Environmental factors were also analysed with GLMER.NBs; distance, blooming period and year were specified as fixed factors and random factors as above but with alleyway treatment also nested. Distance was transformed into a categorical factor to investigate differences along the polytunnels and the edge. Within the polytunnels along the alleyways, environmental factors did not vary (10 to 67 m, see results below in section 3.5). Consequently, we did not include these environmental factors as covariates in the beneficial arthropod and pest regulation and pollination services models (see above sections 2.7.1 and 2.7.2, respectively). Significant differences between years and sections were further investigated with Tukey tests (‘multcomp’ package; Hothorn et al., 2008) with Holm–Bonferroni corrections. Environmental factor visualisation was done using the function ggplot (‘ggplot2’ package; Wickham, 2016).
3 Results
3.1 Edge effects on natural enemies
We recorded a total of 6,823 natural enemies in alleyways and 7,573 in cherry trees within 21 families plus parasitoid wasps distributed along the four sections between 2017 and 2019 (Supplementary Table 5).
In alleyways, density (mean individuals per 0.5 m2 of alleyway) of all natural enemies combined, family richness and Shannon diversity were not affected by distance from the orchard edge in any alleyway treatment for any year, but specific taxa responded differently to edge each year (Supplementary Figure 3; Supplementary Table 2). In CS, the density of Hemiptera in 2017 (Z = −4.08, p < 0.001) and Opiliones in 2018 (Z = −3.46, p < 0.001) decreased towards the orchard centre by 72.2 and 16.7%, respectively (Figure 2). In contrast, in 2017, despite wildflowers not being in bloom, the density of parasitoid wasps in SWS (Z = 2.33, p = 0.02) and Hemiptera in AMWS (Z = 4.33, p < 0.001) increased by 101.9 and 25.0%, respectively. With SWS in 2018, when wildflowers were in bloom, Neuroptera (Z = 3.09, p < 0.01) and Opiliones (Z = 8.29, p < 0.001) density increased towards the orchard centre by 66.7 and 221.4%, respectively. Density of most taxa in AMWS also increased in 2018, including Hemiptera (Z = 6.29, p < 0.001), Opiliones (Z = 3.90, p = <0.001) and parasitoid wasps (Z = 2.87, p < 0.01) by 203.6, 132.1 and 110.9%, respectively, but Neuroptera density decreased towards the orchard centre by 58.3% (Z = −5.75, p < 0.001).
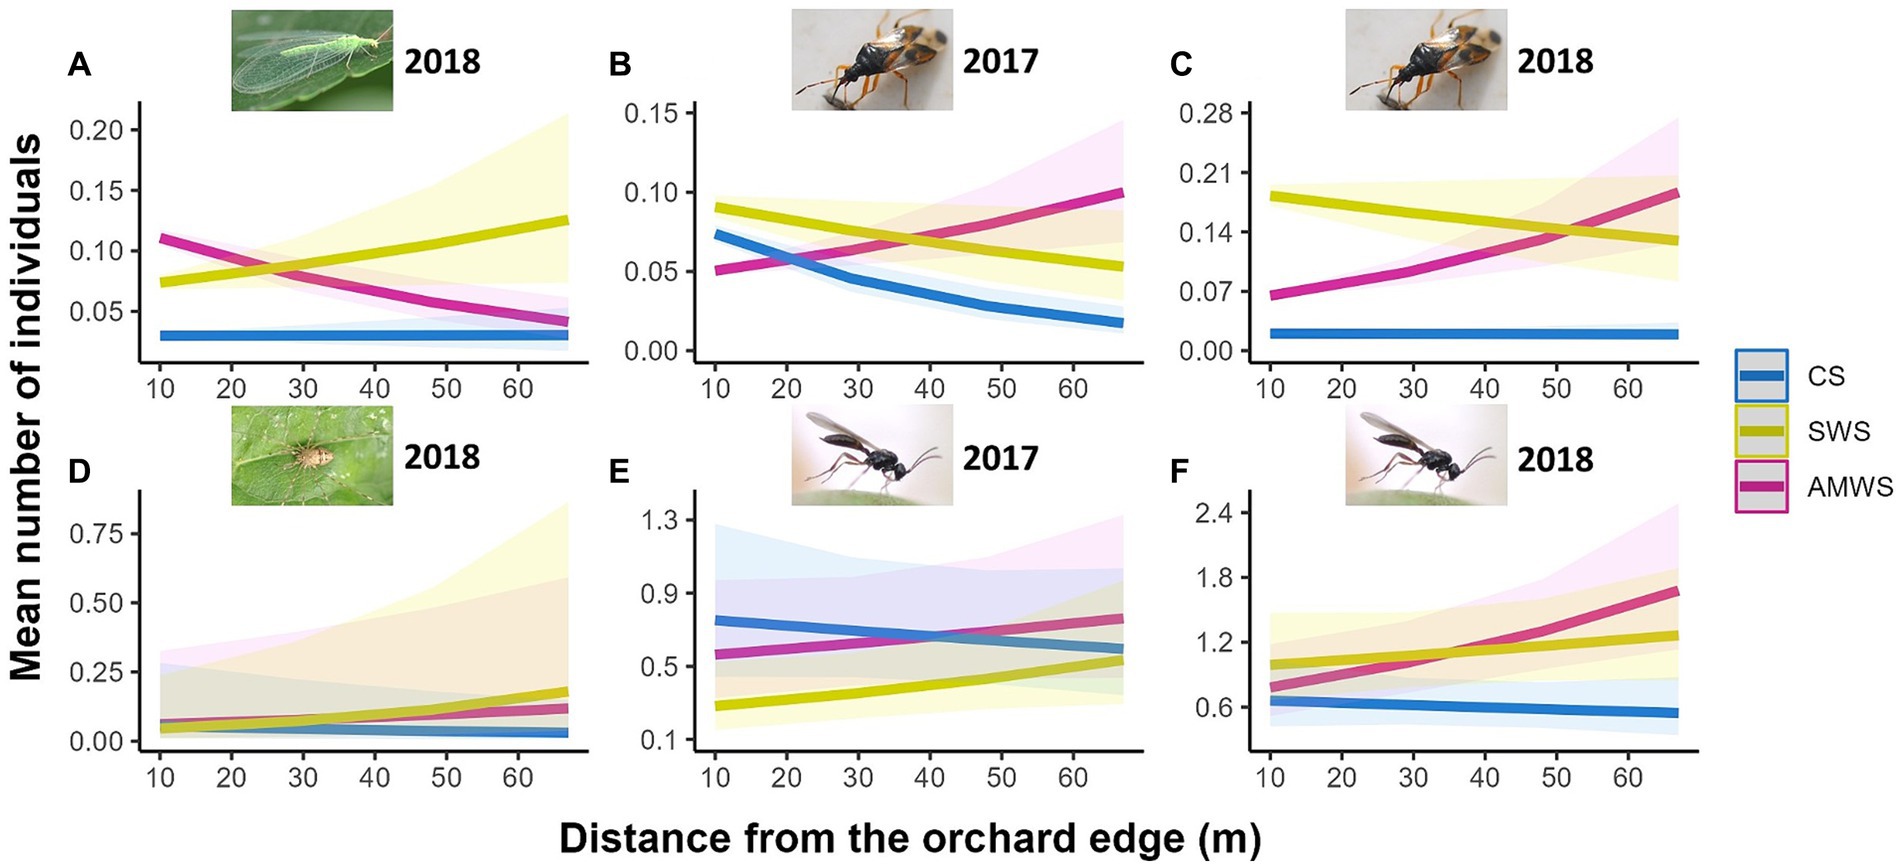
Figure 2. Predicted density (mean number of individuals) of the natural enemy taxa which were significantly affected by distance from the orchard edge in at least one alleyway treatment including (A) Neuroptera in 2018, Hemiptera in (B) 2017 and (C) 2018, (D) Opiliones in 2018 and parasitoid wasps in (E) 2017 and (F) 2018 from surveys in alleyways according to alleyway treatment and distance (m) from the orchard edge towards the orchard centre. Regression lines fitted on GLMER.NB with 95% confidence intervals (shadows). CS (Control Strips), SWS (Standard Wildflower Strips), AMWS (Actively Managed Wildflower Strips). Note differences in y-axes.
As in alleyways, the total natural enemy density (mean individuals per ~1 m2 of cherry tree), family richness and Shannon diversity in cherry trees were not significantly affected by distance from the edge (Supplementary Figure 4; Supplementary Table 2). However, the response of some taxa significantly varied across treatments and years (Figure 3; Supplementary Table 2). In trees next to CS, Hemiptera density decreased towards the orchard centre by 77.1% in 2019 (Z = −7.75, p < 0.001). Cherry trees adjacent to SWS had 46.4% fewer Hemiptera towards the orchard centre in 2017 (Z = −2.20, p = 0.03) and 61.9% of Araneae (Z = −2.02, p = 0.04) and 46.7% of Opiliones (Z = −6.18, p < 0.001) in 2019 but Hemiptera density in 2019 increased from the orchard edge by 33.3% (Z = 2.79, p < 0.01). After the baseline year, next to AMWS, the density of some taxa increased towards the orchard centre, Anystidae (Z = 2.29, p = 0.02) and parasitoid wasps (Z = 2.73, p < 0.01) in 2018 and Syrphidae in 2019 (Z = 9.53, p < 0.001) by 71.6, 66.7 and 471.4%, respectively, although Opiliones density in 2019 decreased by 83.7% (Z = −2.17, p = 0.03).
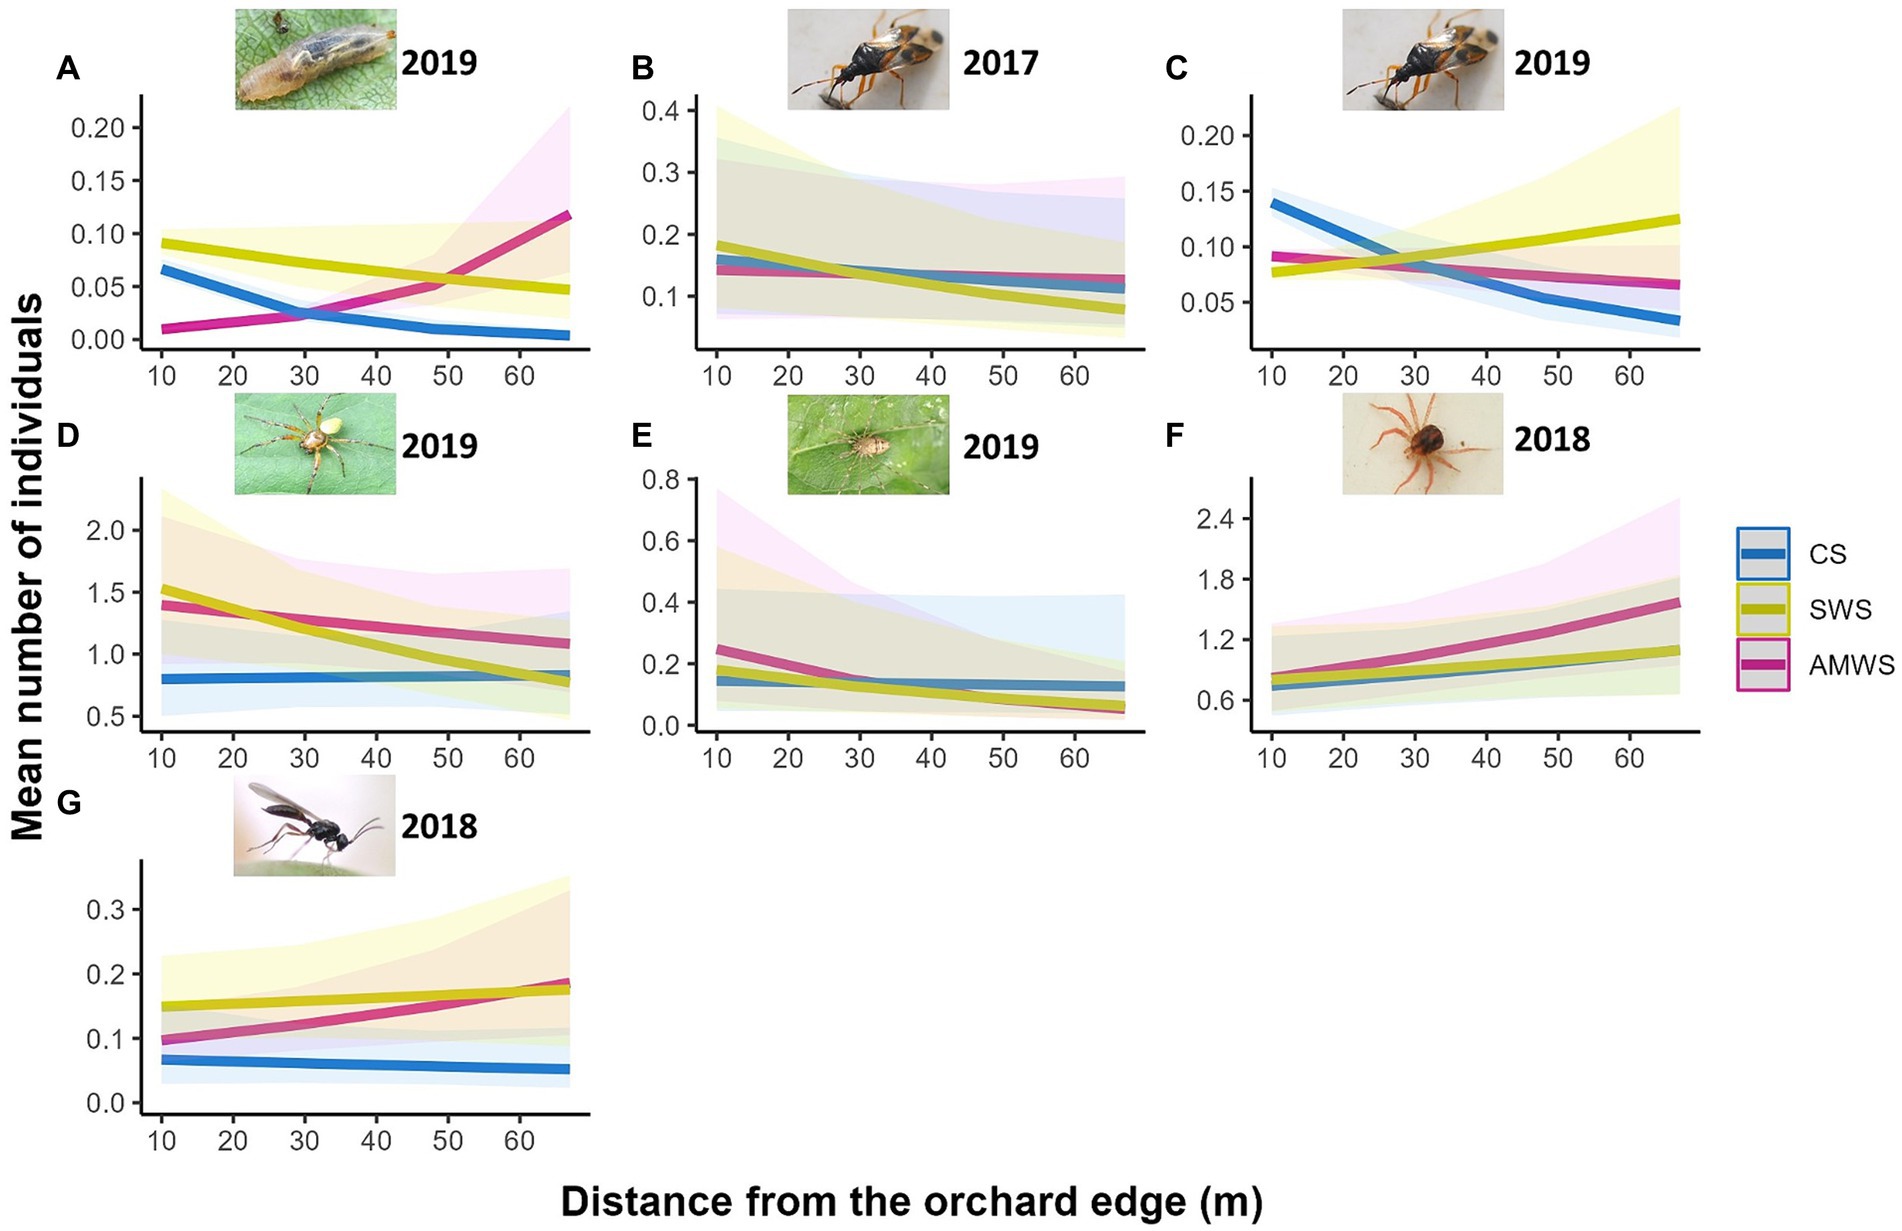
Figure 3. Predicted density (mean number of individuals) of the natural enemy taxa which were significantly affected by distance from the orchard edge in at least one alleyway treatment including (A) Syrphidae in 2019, Hemiptera in (B) 2017 and (C) 2019, (D) Araneae in 2019, (E) Opiliones in 2019, (F) Anystidae in 2018 and (G) parasitoid wasps in 2018 from surveys in cherry trees according to alleyway treatment and distance (m) from the orchard edge towards the orchard centre. Regression lines fitted on GLMER.NB with 95% confidence intervals (shadows). CS (Control Strips), SWS (Standard Wildflower Strips), AMWS (Actively Managed Wildflower Strips). Note differences in y-axes.
3.2 Edge effects on pest regulation services
Across all three alleyway treatments combined, there was not a significant edge effect on depletion (Z = −1.12, p = 0.27). Specifically, however, edge effects on depletion were significant on the bait cards deployed in cherry trees adjacent to CS (Z = −2.06, p = 0.04; Supplementary Table 2) with a 33.0% decrease in aphids depleted towards the orchard centre (Figure 4). In contrast, trees next to both AMWS and SWS had an equivalent depletion throughout the cherry tree rows.
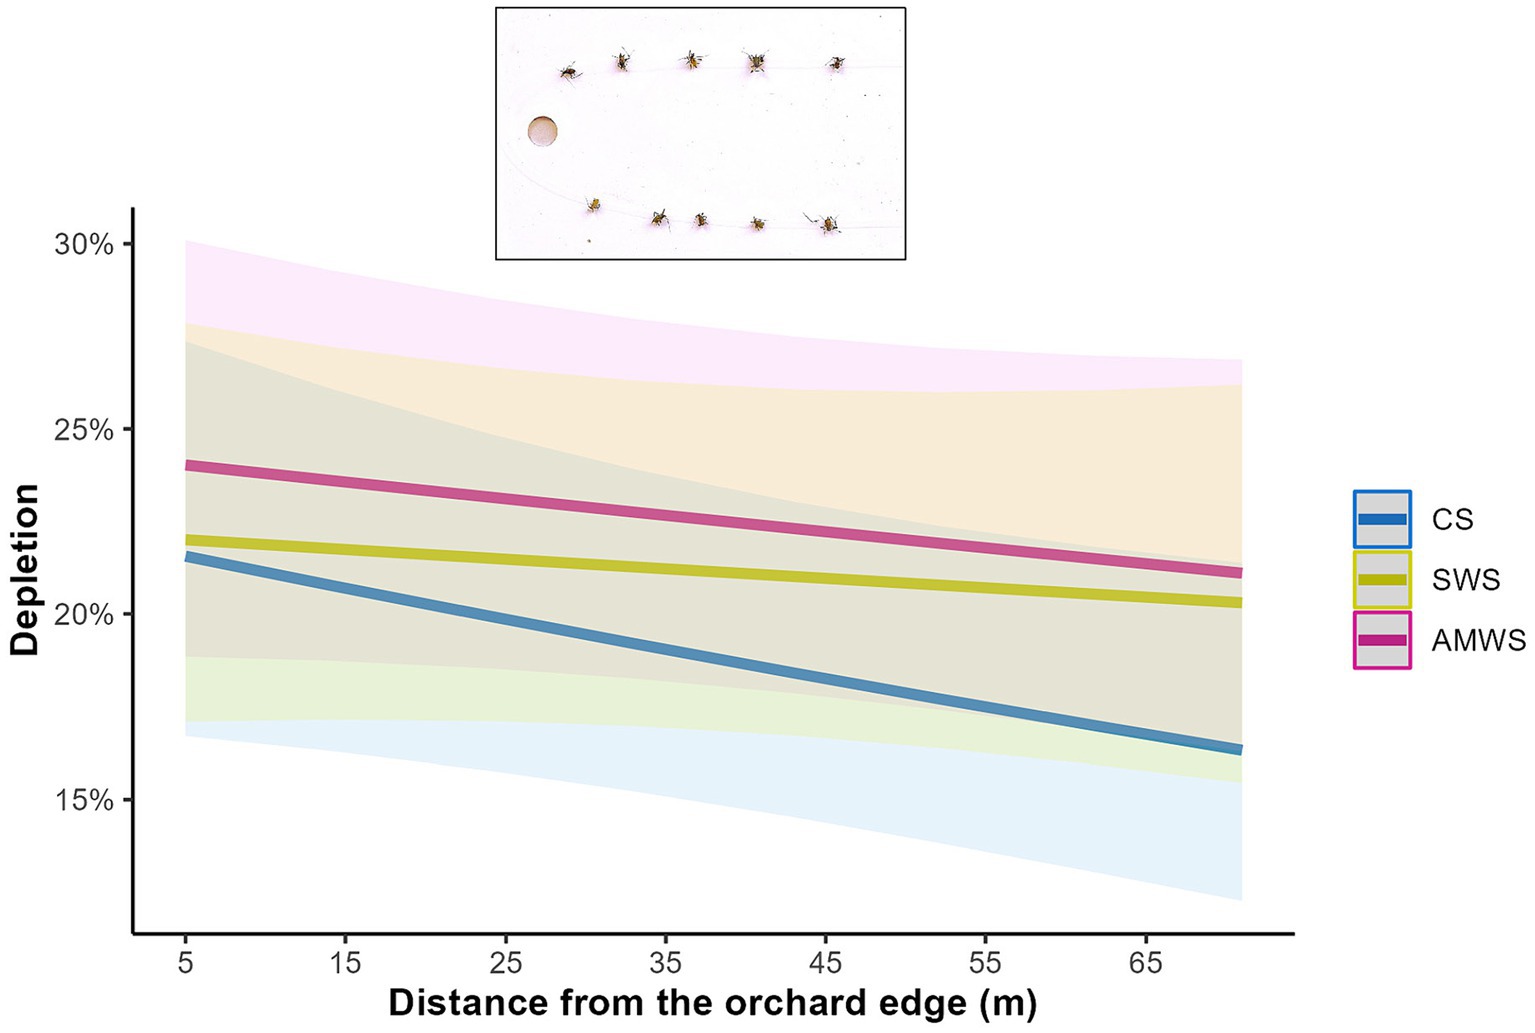
Figure 4. Predicted mean percentage of dead Acyrthosiphon pisum aphids depleted from bait cards deployed in cherry trees according to alleyway treatment and distance (m) from the orchard edge towards the orchard centre. Regression lines fitted on GLMER with binomial distribution with 95% confidence intervals (shadows). CS (Control Strips), SWS (Standard Wildflower Strips), AMWS (Actively Managed Wildflower Strips).
3.3 Edge effects on flower visitors
We recorded a total of 14,677 flower visitors during cherry anthesis and 4,818 post-cherry anthesis comprising 91 species along the alleyways and across all five behaviours between 2017 and 2019 (Supplementary Tables 6, 7). During cherry anthesis 9,179 flower visitors were recorded visiting cherry flowers (honeybees: 4,767, buff-tailed bumblebees: 2,893, bumblebees: 678, solitary bees: 355 and hoverflies: 486), 229 visiting wildflowers, 3,955 flying and 1,314 resting; post cherry anthesis 992 visiting nectaries, 1,126 visiting wildflowers, 1,895 flying and 805 resting.
For visits to cherry flowers, flower visitor density (mean individuals per subsection), species richness and Shannon diversity were significantly affected by the edge for all years and for all three alleyway treatments, with a decrease towards the orchard centre, except in 2019 for density in AMWS, species richness in CS and AMWS, and Shannon diversity in CS and SWS (Supplementary Figure 5; Supplementary Table 3). Overall, the density, richness and Shannon diversity decreased by 34.0, 26.4, and 47.4%, respectively. This was driven by honeybees (the most abundant cherry flower visitor taxon), which were strongly affected by the edge each year in each alleyway treatment (decreasing overall 52.1%) except for AMWS in 2019 (Z = −1.93, p = 0.053; Figure 5; Supplementary Table 3). In contrast, buff-tailed bumblebees (second most abundant taxon) visited cherry flowers evenly along the tree rows all years in all alleyway treatments except for SWS in 2019 (Z = −1.99, p = 0.047), where visits decreased towards the orchard centre. Of the wild flower visitors, bumblebees were negatively affected by orchard edge in 2017 in all alleyway treatments and in 2018 in CS and SWS (decreasing overall 45.2%) but not in 2018 in AMWS and in 2019 in any alleyway treatment. While solitary bee density decreased towards the orchard centre only in 2018 in AMWS by 74.8% (Z = −2.92, p < 0.01) and hoverfly density in 2017 in SWS (Z = −2.98, p < 0.01) by 61.8% and in 2019 in AMWS (Z = −2.68, p = 0.01) by 74.5%. Total flower visitor density, species richness and Shannon diversity for the other three behaviours recorded (visiting wildflowers, flying and resting), in most cases, were not significant (84.7%; Supplementary Table 3).
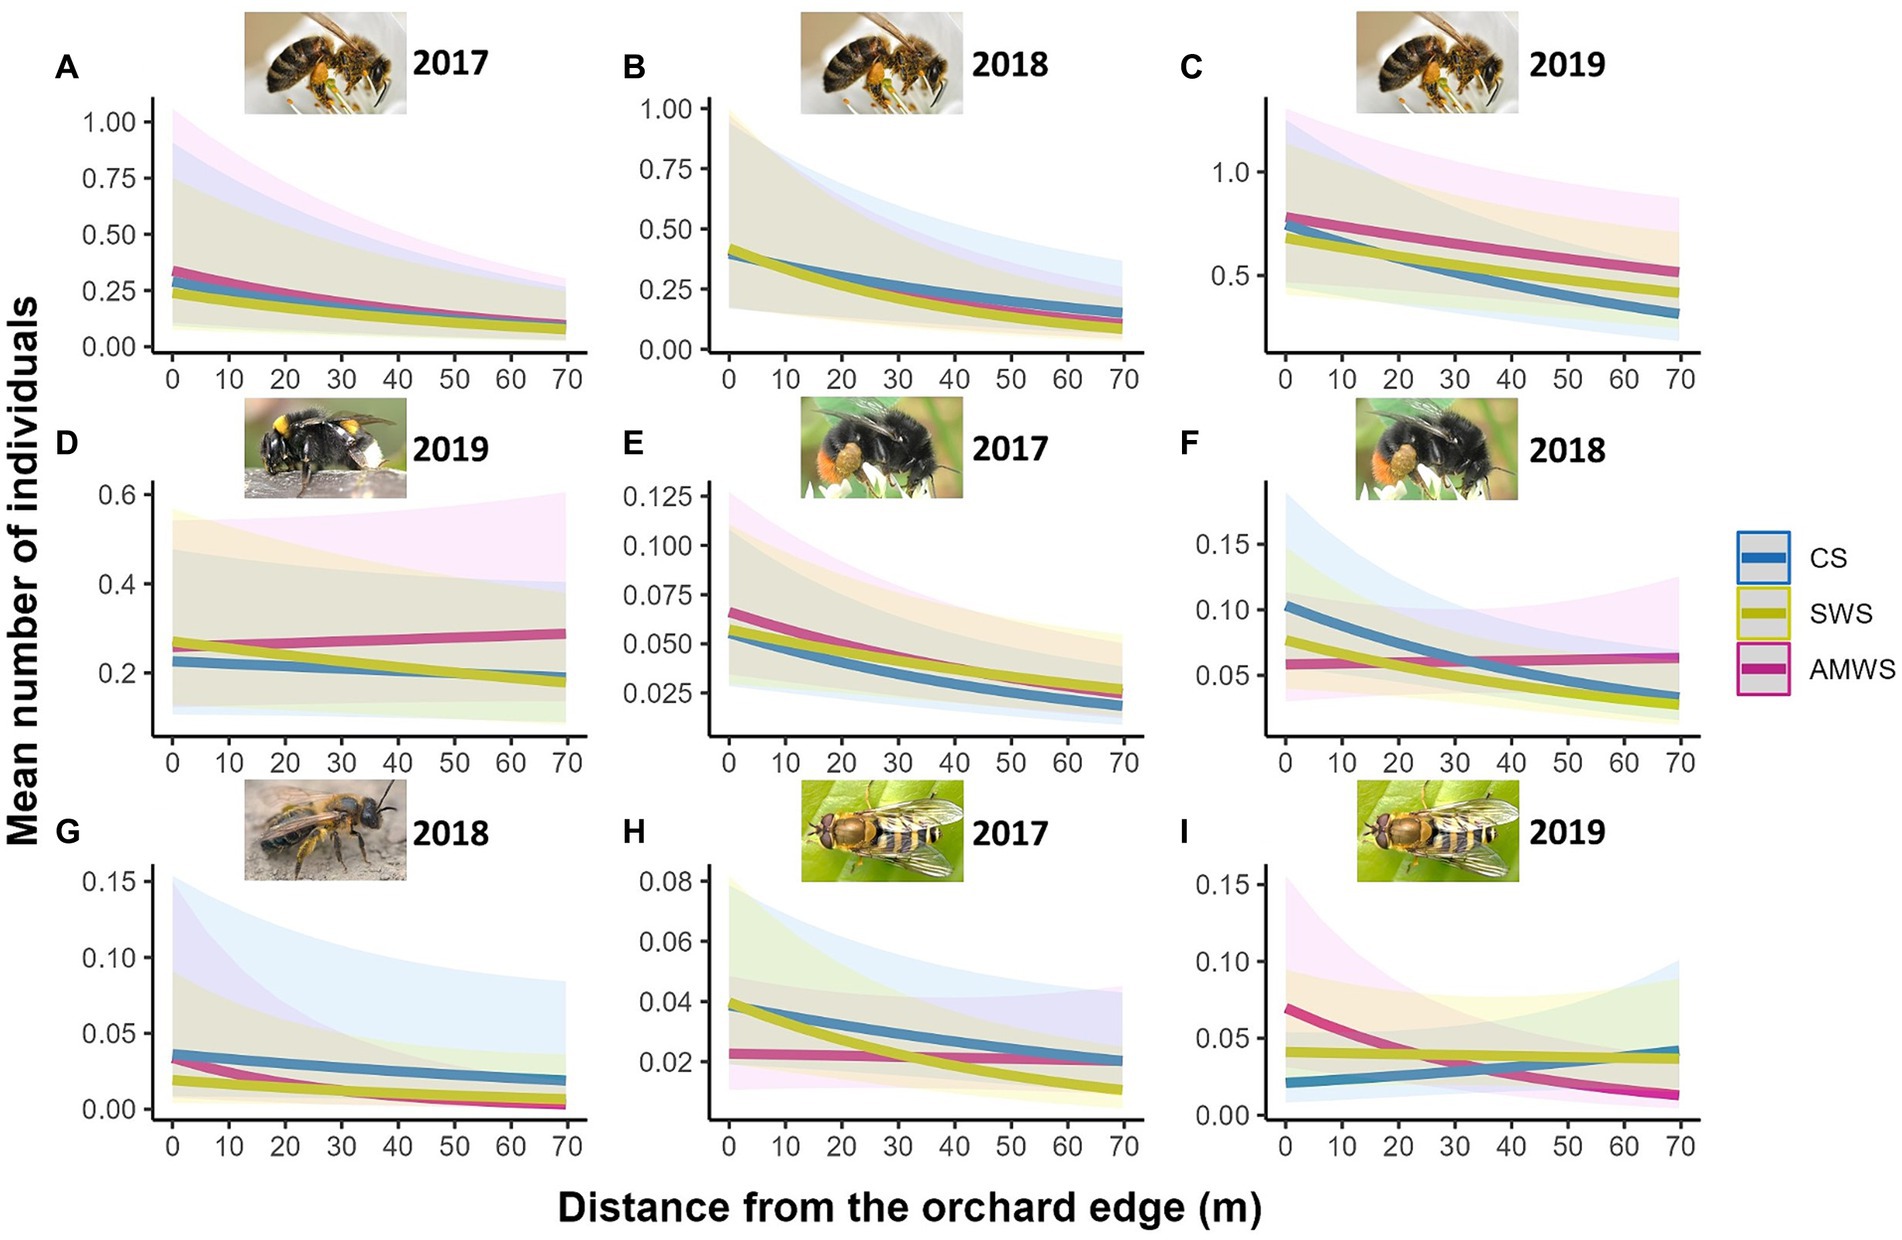
Figure 5. Predicted density (mean number of individuals) of the cherry flower visitor taxa which were significantly affected by distance from the orchard edge in at least one alleyway treatment including honeybees in (A) 2017, (B) 2018 and (C) 2019, (D) buff-tailed bumblebees in 2019, bumblebees in (E) 2017 and (F) 2018, (G) solitary bees in 2018 and hoverflies in (H) 2017 and (I) 2019 from surveys during cherry anthesis according to alleyway treatment and distance (m) from the orchard edge towards the orchard centre. Regression lines fitted on GLMER.NB with 95% confidence intervals (shadows). CS (Control Strips), SWS (Standard Wildflower Strips), AMWS (Actively Managed Wildflower Strips). Note differences in y-axes.
For post-cherry anthesis, only in 2017 in AMWS, wildflower visitor density significantly decreased by 33.3% from the orchard edge towards the orchard centre (Z = −2.22, p = 0.03; Supplementary Figure 6; Supplementary Table 3). Specifically, honeybee density significantly decreased towards the orchard centre with AMWS in 2017 (Z = −51.67, p < 0.001) and 2018 (Z = −2.41, p = 0.02) by 100.0% (no individuals were recorded in the orchard centre) and 54.5%, respectively (Figure 6; Supplementary Table 3). Solitary bee density decreased by 82.1% in 2018 in AMWS (Z = −2.38, p = 0.02) and hoverfly density decreased by 25.4% in 2017 in AMWS (Z = −4.98, p < 0.001). However, 408.5% more hoverflies were recorded towards the orchard centre in 2017 in SWS (Z = 6.47, p < 0.001). Total flower visitor density, species richness and Shannon diversity for the other three behaviours (visiting nectaries, flying and resting) recorded were also scarcely affected by the edge with most being not significant (92.3%; Supplementary Table 3).
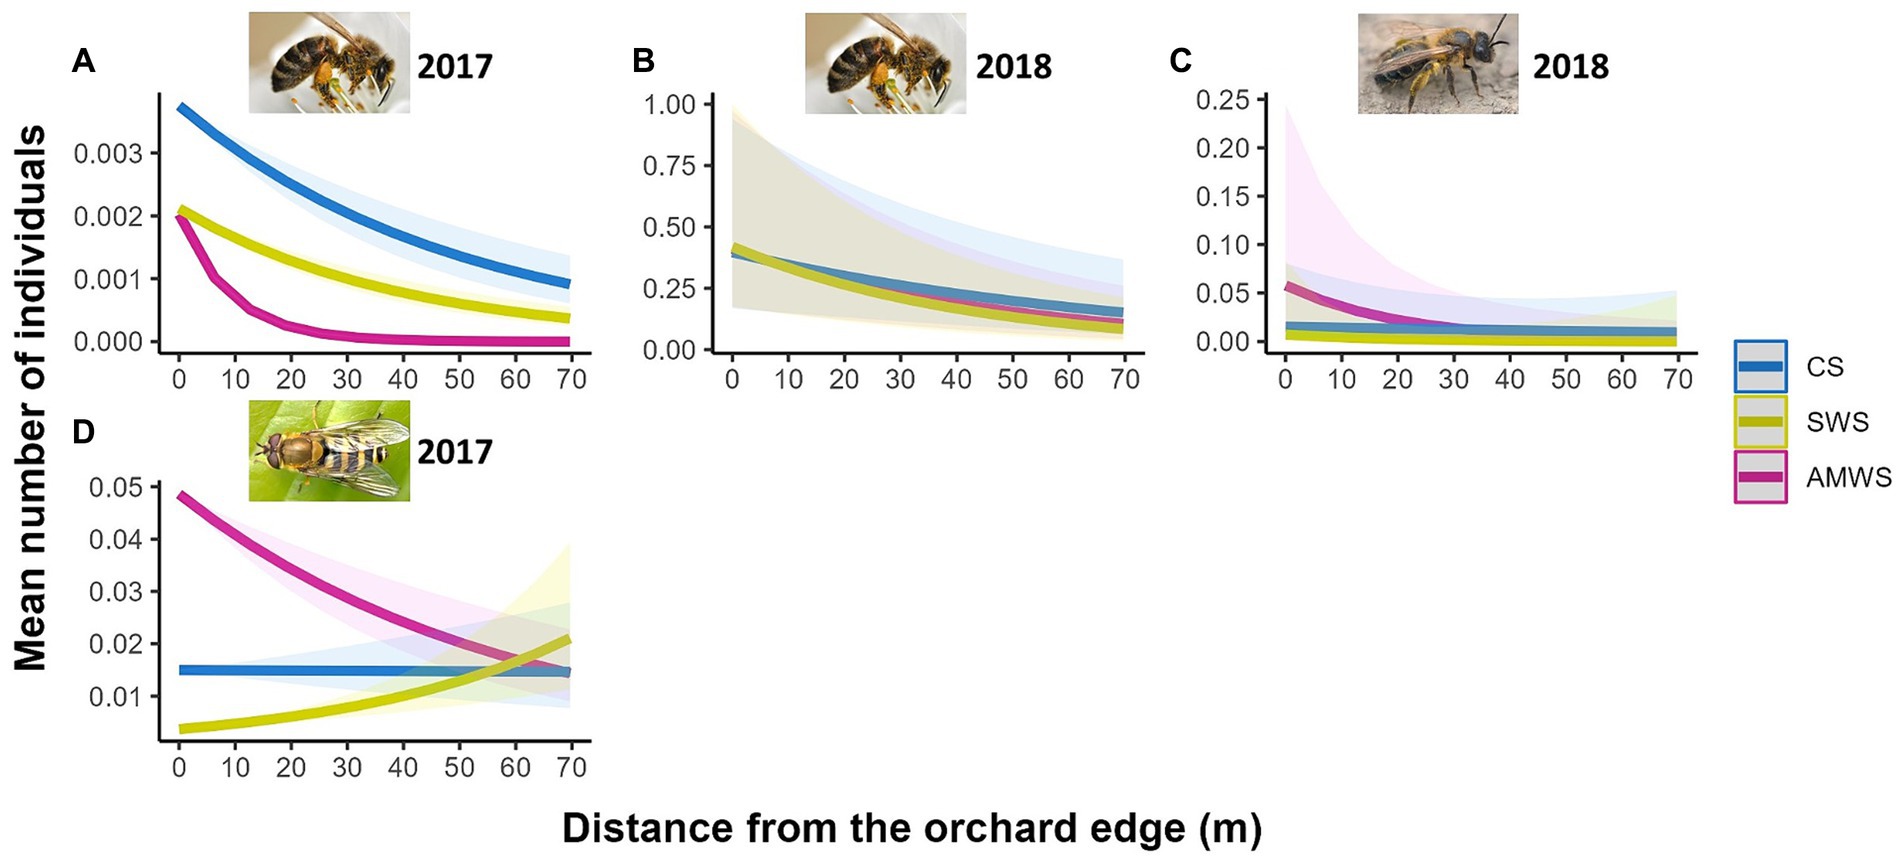
Figure 6. Predicted density (mean number of individuals) of the wildflower visitor taxa which were significantly affected by distance from the orchard edge in at least one alleyway treatment including honeybees in (A) 2017 and (B) 2018, (C) solitary bees in 2018 and (D) hoverflies in 2017 from surveys post-cherry anthesis according to alleyway treatment and distance (m) from the orchard edge towards the orchard centre. Regression lines fitted on GLMER.NB with 95% confidence intervals (shadows); no confidence intervals are shown for honeybees in 2017 due to the low number of individuals. CS (Control Strips), SWS (Standard Wildflower Strips), AMWS (Actively Managed Wildflower Strips). Note differences in y-axes.
3.4 Edge effects on pollination services
3.4.1 Fruit set
Fruit set decreased towards the orchard centre in both years under all alleyway treatments, but only significantly in 2018 with CS (Z = −4.77, p < 0.001) by 11.0% and SWS (Z = −5.75, p < 0.001) by 10.2% and in 2019 in CS by 5.6% (Z = −3.23, p < 0.01; Figure 7; Supplementary Table 4). The decrease in fruit set was supported by the interaction between cherry flower visitor density, alleyway treatment and distance. In 2019, fruit set significantly decreased towards the orchard centre in each alleyway treatment according to flower visitor density (CS: Z = −2.76, p = 0.01; SWS: Z = −3.40, p < 0.01; AMWS: Z = −2.48, p = 0.01).
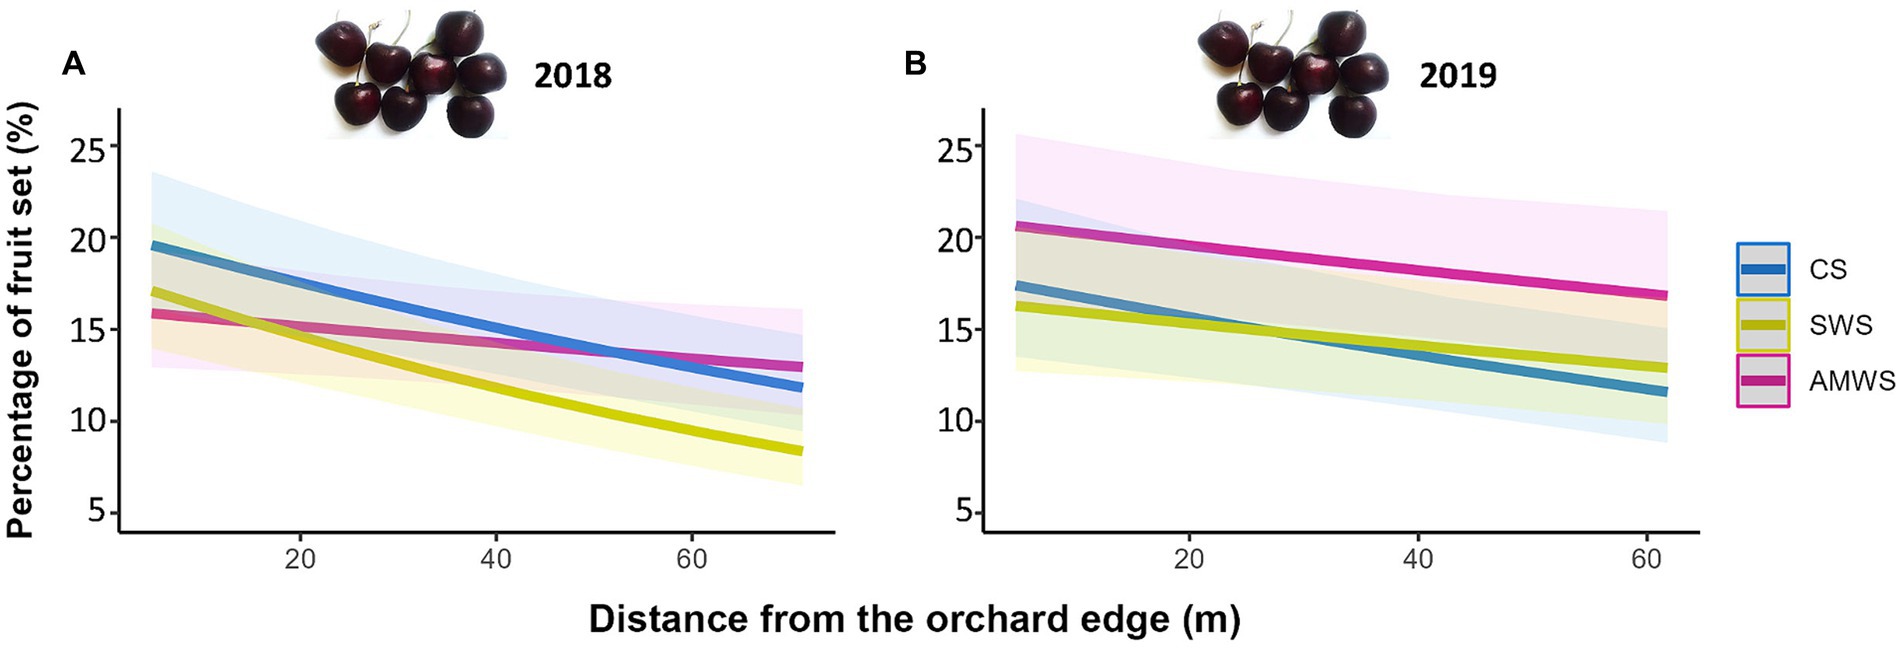
Figure 7. Predicted percentage of fruit set (%) in (A) 2018 and (B) 2019 according to alleyway treatment and distance (m) from the orchard edge towards the orchard centre. Regression lines fitted on GLMER with binomial distribution with 95% confidence intervals (shadows). CS (Control Strips), SWS (Standard Wildflower Strips), AMWS (Actively Managed Wildflower Strips).
3.4.2 Fruit quality
Overall, all cherry quality parameters tended to increase towards the orchard centre, but only a number of them increased significantly, including in 2017 mass in CS, mass, height, width and length in AMWS and dry matter in all three alleyway treatments (Figure 8; Supplementary Table 4). After the baseline year, in 2018, mass in CS (T = 2.24, p = 0.03) and AMWS (T = 1.99, p = 0.047), height in CS (T = 2.03, p = 0.04) and dry matter in CS (T = 2.19, p = 0.03), and in 2019 width in SWS (T = 2.61, p < 0.01) also significantly increased towards the orchard centre. In contrast to fruit set, the overall increase in fruit quality parameters towards the orchard centres was not supported by the interaction between cherry flower visitor density and alleyway treatment; fruit quality remained constant along the tree rows (data not shown).

Figure 8. Predicted mean of the fruit quality parameters which were significantly affected by distance from the orchard edge in at least one alleyway treatment including fresh mass (g) in (A) 2017 and (B) 2018, height (mm) in (C) 2017 and (D) 2018, width (mm) in (E) 2017 and (F) 2019, (G) length (mm) in 2017 and dry matter (g) in (H) 2017 and (I) 2018 according to alleyway treatment and distance (m) from the orchard edge towards the orchard centre. Regression lines fitted on LMERs with 95% confidence intervals (shadows). CS (Control Strips), SWS (Standard Wildflower Strips), AMWS (Actively Managed Wildflower Strips). Note differences in y-axes.
3.5 Edge effects on environmental factors
Environmental factors varied between years (except wind speed between 2017 and 2019) although the trend of each environmental factor was similar throughout the study (Supplementary Figure 7; Supplementary Table 8). Environmental factors remained constant within the polytunnels (from 10 to 67 m) being only significantly different from measurements taken at the orchard edge (at 0 m; Supplementary Table 9). Overall, compared to the orchard edge, temperature increased in the polytunnels by ~1°C, contrary to humidity and wind speed, factors which decreased by ~1.5% and ~ 0.5 m/s, respectively.
4 Discussion
Edge effects are an important factor in sweet cherry production under polytunnel systems because they influence the distribution and behaviour of beneficial arthropods, and therefore the ecosystem services they deliver, ultimately influencing sustainable food production. Although beneficial arthropod distribution varied among taxa, no studies have investigated how to minimise edge effects, particularly under polytunnels. Our study demonstrates wildflower strips established along orchard alleyways support pest regulation services throughout the season and polytunnels, but edge effects were still observed for pollination services.
4.1 Edge effects on natural enemies and pest regulation services
The uniformity of natural enemy distribution (all taxa combined) along the alleyways and cherry tree rows under polytunnels in all three alleyway treatments and in all 3 years of study suggests that these arthropods were not affected by the edge. 2017 was a baseline year with no wildflowers blooming compared to 2018–2019, where wildflowers bloomed post-cherry anthesis in SWS and AMWS but not in CS. However, we have shown for the first time, that overall, natural enemies were not affected by distance from the orchard edge in crops grown in polytunnels, for at least up to 76 m. The lack of edge effects on natural enemies may have been the result of all taxa balancing each other within a natural enemy community (Wimp and Murphy, 2021), since some taxa were more often recorded closer to the orchard edges and others towards the orchard centres. For example, fewer Opiliones were recorded in cherry trees closer to the edge in AMWS in 2018 but this may have been compensated for by more Syrphidae being recorded towards the orchard centre. Other inconsistencies in distribution of specific taxa across years (e.g., Opiliones density only decreased in CS alleyways in 2018) might have been related to weather (Kalita et al., 2015). During our study, 2018 was a warmer year compared to 2017 and 2019 (Supplementary Table 9), which may impact arthropod density, distribution and behaviour.
Exploring how different taxa are affected by orchard edge is crucial because taxa can control pests differently (Costamagna et al., 2008), and some natural enemies, specialist and generalists, are differentially affected by habitats (Bellone et al., 2020), such as wildflower strips. In sweet cherry, black cherry aphid, two-spotted spider mite, and spotted-wing drosophila (Drosophila suzukii) are major pests (Rather et al., 2021; González-Núñez et al., 2022), controlled to some extent by natural enemies (Stutz and Entling, 2011; Wang et al., 2014, 2021). Hemiptera, particularly anthocorids, are important contributors to controlling aphids and spider mites (Wang et al., 2014). In cherry trees, we recorded a decrease in Hemiptera density in SWS in 2017 (baseline year), prior to wildflower blooming, but this was reversed in 2019, when wildflowers were blooming. The most promising natural enemies against spotted-wing drosophila are parasitic wasps (Wang et al., 2021) and some species in the United Kingdom have the potential to parasitize this pest (Shaw et al., 2023). In our study, parasitic wasps were more often recorded in cherry trees towards the orchard centre which were adjacent to AMWS. Thus, some important natural enemy taxa can be enhanced with wildflower strips and not be negatively affected by the edge, which may result in more uniform pest control. To provide evidence of cherry pest control however, these natural enemies should be identified to species (Wimp and Murphy, 2021).
Similarly, the combination of all natural enemy taxa could also explain the absence of edge effects on diversity (i.e., family richness and Shannon diversity). A diverse natural enemy community tends to promote resilience of pest regulation services (Jonsson et al., 2017). Although distance from the edge did not significantly affect natural enemy diversity, a steeper trend was observed in alleyways in 2017 (baseline year) for all three alleyway treatments (Supplementary Figures 3D,G), which steadied in 2018 and 2019, particularly in SWS and AMWS (Supplementary Figures 3E,F,H,I) indicating that wildflower strips can provide resources to sustain a diverse natural enemy community (McKerchar et al., 2020). In cherry trees, even though the trends for diversity metrics decreased more steeply towards the orchard centres in the last study year in SWS and AMWS compared to CS (Supplementary Figures 4F,I), family richness and Shannon diversity were similar in the orchard centre in all three alleyway treatments with mean values of ~1.7 and ~ 0.5, respectively. Consequently, this did not result in a reduction in diversity spill-over into the trees from either of the wildflower treatments.
In fact, the even depletion of sentinel aphids from the bait cards along cherry tree rows in SWS and AMWS suggests that wildflower strips can provide a habitat for natural enemies within the polytunnels reducing edge effects and thus supporting enhanced, uniform, and potentially more resilient, pest regulation services. Despite the decreasing non-significant trend observed of natural enemy density in cherry trees next to SWS in 2019 (Supplementary Figure 4C), aphids were evenly depleted with this alleyway treatment compared to CS. This might be a consequence of natural enemy densities being higher in SWS than in CS throughout the tree rows while the non-significant decrease towards the orchard centre in SWS could have been inconsequential for aphid depletion. Our current observations have important implications for pest control management, and therefore sustainability, although more research is needed to confirm our results using cherry relevant pests on baited cards, enabling the behaviour of non-scavenger and parasitic wasps to be explored (e.g., Hogg et al., 2022).
In isolated cases, natural enemy density can be affected by the edge within the first 5 m from the edge (Mei et al., 2021). However, most studies in open crops do not typically observe edge effects on natural enemies until at least 20 metres (e.g., 25 m, Whitehouse et al., 2018; 40 m, Thomson and Hoffmann, 2013; 50 m, Woodcock et al., 2016) and on pest control from adjacent-to-orchard wildflower strips up to 15–20 m (Blaauw and Isaacs, 2015; Schneider et al., 2015). Yet, pest regulation services decline with increasing distance from the edge (e.g., 50 m; Woodcock et al., 2016). Our first sampling point for natural enemies within the orchards was located at 9.5 m from the orchard edge but we started measuring pest regulation services at 5 m. Thus, is it unlikely that this may have resulted in potential edge effects occurring within the first 5 m not being recorded.
Importantly, natural enemies overall were not deterred by polytunnels, which is consistent with other studies (e.g., Buck et al., 2024), although some specific taxa showed variation across years and alleyway treatments. Polytunnels are typically vented in summer to prevent diseases and heat excess, allowing mobile natural enemies to enter more easily. Certainly, some natural enemies may benefit from polytunnel protection as do some pests (Birch et al., 2011). The microclimate under polytunnels with less variation in environmental factors, such as temperature, humidity and wind speed (see Supplementary Figure 7), may provide stable and adequate environmental conditions that help natural enemies thrive (Welch and Harwood, 2014). Additionally, the wildflower strips provided extra resources, such as alternative prey, pollen, nectar and shelter that can also help to support and enhance natural enemies (Blaauw and Isaacs, 2015; Mateos-Fierro et al., 2021), and, in our study, this was uniform along the alleyways. The similar results for natural enemies and pest regulation services between the two wildflower strip management treatments indicates that growers can actively manage wildflower strips without diminishing benefits, likely increasing grower uptake (Kleijn et al., 2019).
4.2 Edge effects on flower visitors and pollination services
The greater density of honeybees and buff-tailed bumblebees compared to non-managed flower visitors suggests that pollination in sweet cherries under polytunnels is driven by managed pollinators, although it is often wild flower visitors which enhance pollination services in cherry (Holzschuh et al., 2012; Eeraerts et al., 2019). Of the managed pollinators, the edge effects seen for honeybees but not buff-tailed bumblebees can be explained by the pollinator management approach adopted by growers. Honeybees must enter the polytunnels from the edges, which may increase their reticence to travel farther towards orchard centres (Hall et al., 2020), but this would not be an impediment for buff-tailed bumblebees already situated within the polytunnels (Trillo et al., 2018). Among the wild flower visitors, the lack of edge effects on bumblebees during cherry anthesis in 2019 but not in 2017 and 2018, when wildflowers had not started to bloom (i.e., wildflowers started to bloom in 2018, post-cherry anthesis), might indicate that they used the wildflowers in summer 2018. Future queens could have benefited from the wildflower resources and hibernated within the orchards in 2018 and as a result, emergent queens in spring 2019 would not have been affected by orchard edge when establishing their nests. As for natural enemies, the combination of flower visitors under a flower visitor community could have masked effects on individual taxa (Albrecht et al., 2012). For example, solitary bees and hoverflies were scarcely affected by the edge during cherry anthesis but their distribution still tended to decrease towards the orchard centre. This, combined with honeybees and wild bumblebees, may have resulted in the observed edge effect on the diversity metrics. However, the marginal decrease towards orchard centres in all taxa densities (including honeybees) for all behaviours post-cherry anthesis may be a consequence of flower visitors benefiting from the wildflowers (i.e., more edge effects were recorded during cherry anthesis and in 2017, when wildflowers were not blooming). The absence of edge effects post-cherry anthesis, potentially due to wildflower resources being used, could have been extended to CS as a consequence of alleyway treatment proximity resulting in a relocation of flower visitors from SWS and AWMS to CS (Zurbuchen et al., 2010).
Wildflowers co-blooming with cherry in spring could potentially minimise edge effects on flower visitors and consequently on fruit set since wildflowers co-blooming with cherry can enhance pollination services (Eeraerts et al., 2019, 2021; Gilpin et al., 2022). Importantly, no competition between wildflowers and cherry crop flowers was reported in these studies, suggesting flower visitors are not drawn away from crop flowers (Eeraerts et al., 2019; Gilpin et al., 2022). Future research should therefore aim to explore spring flowering wildflower strips in early-bloom crops such as cherries since spring flower visitors (e.g., mining bees) may not fully benefit from summer wildflowers, especially under polytunnels (Mateos-Fierro et al., 2023).
Among the behaviours recorded, the most important for growers is visits to cherry flowers. Honeybees were more often recorded visiting cherry flowers probably because they do not spend any time searching for suitable nesting sites (O’Connor et al., 2017; Fountain et al., 2023) or mates (Ne’eman et al., 2006) as wild bees do. Hoverflies also spend time resting and searching for mates and places to lay eggs (Emtia and Ohno, 2017; Sánchez et al., 2022). These additional needs could explain why more wild flower visitors were recorded performing other behaviours than visiting cherry flowers compared to honeybees. Although managed buff-tailed bumblebees did not have to search for nest sites, we often recorded them flying because they were likely to be heading to or from their nests; similar to the high-flying activity that occurs next to honeybee hives (Marchal et al., 2020).
The higher fruit set near the edge may be a consequence of the greater flower visitor density and diversity (i.e., species richness and Shannon diversity) recorded near orchard edges (Holzschuh et al., 2012). Additionally, more diverse flower visitor communities can increase resilience of pollination services (Williams et al., 2019). Although we also recorded more honeybees next to the edge, pollination deficits can still be recorded with honeybees despite their density (Garibaldi et al., 2013). Thus, it is more likely that the greater flower visitor diversity increased fruit set. Interestingly, growers aim to reduce the variability of pollination services by distributing boxes of managed buff-tailed bumblebees along the alleyways, but this failed to maintain an equivocal fruit set along tree rows even though we recorded this taxon consistently throughout the orchards. This suggests the pollination behaviour of managed bumblebees is not as efficient as that of wild queens (Evans and Raine, 2014; Mateos-Fierro et al., 2022), which could have further implications for growers wanting to adopt more efficient and sustainable pollinator management practices (Osterman et al., 2021). The greater fruit set recorded with greater pollinator density and diversity near the edge supports the conclusion that flower visitors play a key role in sweet cherry pollination; if flower visitors are more reluctant to visit cherry blossoms in the centre of the orchards, lower yields could be expected in large orchards (Garibaldi et al., 2011). Additionally, the smaller size of cherries in trees closest to the edge could be the result of greater fruit burdens (number of fruits) on trees, leading to the production of smaller fruit (Whiting et al., 2006), indicating better cherries were produced farther from the orchard edges.
5 Conclusion
We investigated the influence of edge effects on natural enemies and flower visitors and the ecosystem services they provide in sweet cherry under polytunnels and how edge effects on these arthropods and ecosystem services could be mitigated with wildflower strips established along tree rows. Wildflower strips (SWS and AWMS) are an effective intervention that can support natural enemies and pest regulation services reducing edge effects along tree rows. Wildflower strips facilitated an even distribution of flower visitors along rows and mitigated to some extent edge effects on fruit set and quality. Implicitly, pollinator management approaches (other than managed pollinators alone) need to be applied by growers because pollinating insects are essential for yields and maximising fruit quality. Thus, growers will benefit from establishing wildflowers in orchard alleyways, which can be actively managed to a height of 20 cm. In turn, this would develop more efficient IPPM practices to support a more sustainable and resilient sweet cherry production system.
Data availability statement
The raw data supporting the conclusions of this article are available by the authors, without undue reservation, on GitHub: https://github.com/ZeusMF/Edge_Effects_Mateos-Fierro.
Author contributions
ZM-F: Conceptualization, Data curation, Formal analysis, Investigation, Methodology, Project administration, Validation, Visualization, Writing – original draft, Writing – review & editing. MG: Conceptualization, Methodology, Supervision, Validation, Writing – review & editing. MF: Conceptualization, Methodology, Resources, Supervision, Validation, Writing – review & editing. KA: Conceptualization, Methodology, Supervision, Validation, Writing – review & editing. DW: Conceptualization, Funding acquisition, Methodology, Project administration, Resources, Supervision, Validation, Writing – review & editing.
Funding
The author(s) declare that financial support was received for the research, authorship, and/or publication of this article. This project was funded by Waitrose & Partners, Berry Gardens Ltd., and the University of Worcester. While publication of this article was funded in part by Purdue University Libraries Open Access Publishing Fund.
Acknowledgments
This manuscript is part of ZM-F’s PhD thesis (Mateos-Fierro, 2020). We would like to thank Kristen Hunter and James Rowland for their help collecting data and the growers for allowing us to use their orchards and managing the wildflower strips. We also thank the reviewers for their comments and suggestions to improve our manuscript. Photo credits by ZM-F.
Conflict of interest
The authors declare that the research was conducted in the absence of any commercial or financial relationships that could be construed as a potential conflict of interest.
Publisher’s note
All claims expressed in this article are solely those of the authors and do not necessarily represent those of their affiliated organizations, or those of the publisher, the editors and the reviewers. Any product that may be evaluated in this article, or claim that may be made by its manufacturer, is not guaranteed or endorsed by the publisher.
Supplementary material
The Supplementary material for this article can be found online at: https://www.frontiersin.org/articles/10.3389/fsufs.2024.1423511/full#supplementary-material
References
Albrecht, M., Schmid, B., Hautier, Y., and Müller, C. B. (2012). Diverse pollinator communities enhance plant reproductive success. Proc. R. Soc. B Biol. Sci. 279, 4845–4852. doi: 10.1098/rspb.2012.1621
Bates, D. M., Mäechler, M., Bolker, B. M., and Walker, S. (2015). Fitting linear mixed-effects models using lme4. J. Stat. Softw. 67, 1–48. doi: 10.18637/jss.v067.i01
Belge, B., Goulao, L. F., Comabella, E., Graell, J., and Lara, I. (2017). Refrigerated storage and calcium dips of ripe ‘Celeste’ sweet cherry fruit: combined effects on cell wall metabolism. Sci. Hortic. 219, 182–190. doi: 10.1016/j.scienta.2017.02.039
Bellone, D., Björkman, C., and Klapwijk, M. J. (2020). Top-down pressure by generalist and specialist natural enemies in relation to habitat heterogeneity and resource availability. Basic Appl. Ecol. 43, 16–26. doi: 10.1016/j.baae.2019.10.005
Birch, A. N. E., Begg, G. S., and Squire, G. R. (2011). How agro-ecological research helps to address food security issues under new IPM and pesticide reduction policies for global crop production systems. J. Exp. Bot. 62, 3251–3261. doi: 10.1093/jxb/err064
Blaauw, B. R., and Isaacs, R. (2015). Wildflower plantings enhance the abundance of natural enemies and their services in adjacent blueberry fields. Biol. Control 91, 94–103. doi: 10.1016/j.biocontrol.2015.08.003
Blanke, M. M., Lang, G. A., and Meland, M. (2017). “Orchard microclimate modification” in Cherries: Botany, Production and Uses. Eds. J. Quero-García, A. Iezzoni, J. Puławska and G. A. Lang (Croydon, UK: CABI). 244–268.
Buck, N., Fountain, M. T., Potts, S. G., and Garratt, M. P. D. (2024). Insect excluding mesh enhances spotted-wing Drosophila (Drosophila suzukii) control in tunneled raspberry with limited effects on natural enemy abundance. Agric. Ecosyst. Environ. 359:108756. doi: 10.1016/j.agee.2023.108756
Bujdosó, G., and Hrotkó, K. (2017). “Cherry production” in Cherries: Botany, production and uses. eds. J. Quero-García, A. Iezzoni, J. Puławska, and G. A. Lang (Croydon, UK: CABI), 1–13.
Burnham, K. P., and Anderson, D. R. (2002). Model selection and multimodel inference: A practical information-theoretic approach. Second Edn. New York, USA: Springer-Verag.
Button, L., and Elle, E. (2014). Wild bumble bees reduce pollination deficits in a crop mostly visited by managed honey bees. Agric. Ecosyst. Environ. 197, 255–263. doi: 10.1016/j.agee.2014.08.004
Carvell, C., Bourke, A. F. G., Osborne, J. L., and Heard, M. S. (2015). Effects of an Agri-environment scheme on bumblebee reproduction at local and landscape scales. Basic Appl. Ecol. 16, 519–530. doi: 10.1016/j.baae.2015.05.006
Costamagna, A. C., Landis, D. A., and Brewer, M. J. (2008). The role of natural enemy guilds in Aphis glycines suppression. Biol. Control 45, 368–379. doi: 10.1016/j.biocontrol.2008.01.018
Doukas, D., and Payne, C. C. (2007). The use of ultraviolet-blocking films in insect pest management in the UK; effects on naturally occurring arthropod pest and natural enemy populations in a protected cucumber crop. Ann. Appl. Biol. 151, 221–231. doi: 10.1111/j.1744-7348.2007.00169.x
Eeraerts, M., Smagghe, G., and Meeus, I. (2019). Pollinator diversity, floral resources and semi-natural habitat, instead of honey bees and intensive agriculture, enhance pollination service to sweet cherry. Agric. Ecosyst. Environ. 284:106586. doi: 10.1016/j.agee.2019.106586
Eeraerts, M., Van Den Berge, S., Proesmans, W., Verheyen, K., Smagghe, G., and Meeus, I. (2021). Fruit orchards and woody semi-natural habitat provide complementary resources for pollinators in agricultural landscapes. Landsc. Ecol. 36, 1377–1390. doi: 10.1007/s10980-021-01220-y
Emtia, C., and Ohno, K. (2017). Diurnal foraging behavior of an aphidophagous hoverfly in an insectary plant patch. J. Biopest. 10, 154–162. doi: 10.57182/jbiopestic.10.2.154-162
Evans, L. J., and Raine, N. E. (2014). Changes in learning and foraging behaviour within developing bumble bee (Bombus terrestris) colonies. PLoS One 9:e90556. doi: 10.1371/journal.pone.0090556
Fadón, E., Herrero, M., and Rodrigo, J. (2015). Flower development in sweet cherry framed in the BBCH scale. Sci. Hortic. 192, 141–147. doi: 10.1016/j.scienta.2015.05.027
FAOSTAT. (2023). FAOSTAT statistical database. Food and agriculture Organization of the United Nations [WWW document]. Available at: https://www.fao.org/faostat/en/#data/QCL (accessed 3.12.23).
Fountain, M. T., Mateos-Fierro, Z., Shaw, B., Brain, P., and Delgado, A. (2019). Insect pollinators of conference pear (Pyrus communis L.) and their contribution to fruit quality. J. Pollinat. Ecol. 25, 103–114. doi: 10.26786/1920-7603(2019)547
Fountain, M. T., Tsiolis, K., Silva, C. X., Deakin, G., Garratt, M. P. D., O’Connor, R., et al. (2023). Location and creation of nest sites for ground-nesting bees in apple orchards. Insects 14:490. doi: 10.3390/insects14060490
Garibaldi, L. A., Steffan-Dewenter, I., Kremen, C., Morales, J. M., Bommarco, R., Cunningham, S. A., et al. (2011). Stability of pollination services decreases with isolation from natural areas despite honey bee visits. Ecol. Lett. 14, 1062–1072. doi: 10.1111/j.1461-0248.2011.01669.x
Garibaldi, L. A., Steffan-Dewenter, I., Winfree, R., Aizen, M. A., Bommarco, R., Cunningham, S. A., et al. (2013). Wild pollinators enhance fruit set of crops regardless of honey bee abundance. Science 339, 1608–1611. doi: 10.1126/science.1230200
Gilpin, A. M., O’Brien, C., Kobel, C., Brettell, L. E., Cook, J. M., and Power, S. A. (2022). Co-flowering plants support diverse pollinator populations and facilitate pollinator visitation to sweet cherry crops. Basic Appl. Ecol. 63, 36–48. doi: 10.1016/j.baae.2022.05.005
González-Núñez, M., Sandín-España, P., Mateos-Miranda, M., Cobos, G., De Cal, A., Sánchez-Ramos, I., et al. (2022). Development of a disease and pest management program to reduce the use of pesticides in sweet-cherry orchards. Agronomy 12:1986. doi: 10.3390/agronomy12091986
Hall, M., Jones, J., Rocchetti, M., Wright, D., and Rader, R. (2020). Bee visitation and fruit quality in berries under protected cropping vary along the length of polytunnels. J. Econ. Entomol. 113, 1337–1346. doi: 10.1093/jee/toaa037
Hodgkiss, D., Brown, M. J. F., Fountain, M. T., and Clare, E. L. (2022). Detection rates of aphid DNA in the guts of larval hoverflies and potential links to the provision of floral resources. Bull. Entomol. Res. 112, 451–457. doi: 10.1017/S0007485321001115
Hogg, B. N., Grettenberger, I. M., Borkent, C. J., Stokes, K., Zalom, F. G., and Pickett, C. H. (2022). Natural biological control of Bagrada hilaris by egg predators and parasitoids in north-Central California. Biol. Control 171:104942. doi: 10.1016/j.biocontrol.2022.104942
Holzschuh, A., Dudenhöffer, J. H., and Tscharntke, T. (2012). Landscapes with wild bee habitats enhance pollination, fruit set and yield of sweet cherry. Biol. Conserv. 153, 101–107. doi: 10.1016/j.biocon.2012.04.032
Hothorn, T., Bretz, F., and Westfall, P. (2008). Simultaneous inference in general parametric models. Biom. J. 50, 346–363. doi: 10.1002/bimj.200810425
Howard, S. R., Ratnayake, M. N., Dyer, A. G., Garcia, J. E., and Dorin, A. (2021). Towards precision apiculture: traditional and technological insect monitoring methods in strawberry and raspberry crop polytunnels tell different pollination stories. PLoS One 16:e0251572. doi: 10.1371/journal.pone.0251572
Jonsson, M., Kaartinen, R., and Straub, C. S. (2017). Relationships between natural enemy diversity and biological control. Curr. Opin. Insect Sci. 20, 1–6. doi: 10.1016/j.cois.2017.01.001
Kalita, H., Avasthe, R. K., and Rameash, K. (2015). Effect of weather parameters on population buildup of different insect pests of rice and their natural enemies. Indian J. Hill Farming 28, 69–72.
Kendall, L. K., Evans, L. J., Gee, M., Smith, T. J., Gagic, V., Lobaton, J. D., et al. (2021). The effect of protective covers on pollinator health and pollination service delivery. Agric. Ecosyst. Environ. 319:107556. doi: 10.1016/j.agee.2021.107556
Kleijn, D., Bommarco, R., Fijen, T. P. M., Garibaldi, L. A., Potts, S. G., and van Der Putten, W. H. (2019). Ecological intensification: bridging the gap between science and practice. Trends Ecol. Evol. 34, 154–166. doi: 10.1016/j.tree.2018.11.002
Koumanov, K. S., Staneva, I. N., Kornov, G. D., and Germanova, D. R. (2016). Sweet cherry fruit quality under fertigation. Acta Hortic. 1139, 551–558. doi: 10.17660/ActaHortic.2016.1139.95
Lang, G. A. (2005). Underlying principles of high density sweet cherry production. Acta Hortic. 667, 325–336. doi: 10.17660/ActaHortic.2005.667.47
Lang, G. A. (2014). Growing sweet cherries under plastic covers and tunnels: physiological aspects and practical considerations. Acta Hortic. 1020, 303–312. doi: 10.17660/ActaHortic.2014.1020.43
Lang, G. A., Sage, L., and Wilkinson, T. (2016). Ten years of studies on systems to modify sweet cherry production environments: retractable roofs, high tunnels, and rain-shelters. Acta Hortic. 1130, 83–90. doi: 10.17660/ActaHortic.2016.1130.12
Lüdecke, D. (2018). Ggeffects: tidy data frames of marginal effects from regression models. J. Open Source Softw. 3:772. doi: 10.21105/joss.00772
Marchal, P., Buatois, A., Kraus, S., Klein, S., Gomez-Moracho, T., and Lihoreau, M. (2020). Automated monitoring of bee behaviour using connected hives: towards a computational apidology. Apidologie 51, 356–368. doi: 10.1007/s13592-019-00714-8
Mateos-Fierro, Z. (2020). Sustainable production of sweet cherry: Maximising benefits from ecosystem services. (PhD thesis). University of Worcester, Worcester, UK.
Mateos-Fierro, Z., Fountain, M. T., Garratt, M. P. D., Ashbrook, K., and Westbury, D. B. (2021). Active management of wildflower strips in commercial sweet cherry orchards enhances natural enemies and pest regulation services. Agric. Ecosyst. Environ. 317:107485. doi: 10.1016/j.agee.2021.107485
Mateos-Fierro, Z., Garratt, M. P. D., Fountain, M. T., Ashbrook, K., and Westbury, D. B. (2018). Wildflower strip establishment for the delivery of ecosystem services in sweet cherry orchards. Asp. Appl. Biol. Ecosyst. Habitat Manag. Res. Policy, Pract. 139, 179–186.
Mateos-Fierro, Z., Garratt, M. P. D., Fountain, M. T., Ashbrook, K., and Westbury, D. B. (2022). Wild bees are less abundant but show better pollination behaviour for sweet cherry than managed pollinators. J. Appl. Entomol. 146, 361–371. doi: 10.1111/jen.12984
Mateos-Fierro, Z., Garratt, M. P. D., Fountain, M. T., Ashbrook, K., and Westbury, D. B. (2023). The potential of wildflower strips to enhance pollination services in sweet cherry orchards grown under polytunnels. J. Appl. Ecol. 60, 1044–1055. doi: 10.1111/1365-2664.14394
McKerchar, M., Potts, S. G., Fountain, M. T., Garratt, M. P. D., and Westbury, D. B. (2020). The potential for wildflower interventions to enhance natural enemies and pollinators in commercial apple orchards is limited by other management practices. Agric. Ecosyst. Environ. 301:107034. doi: 10.1016/j.agee.2020.107034
Mei, Z., de Groot, G. A., Kleijn, D., Dimmers, W., van Gils, S., Lammertsma, D., et al. (2021). Flower availability drives effects of wildflower strips on ground-dwelling natural enemies and crop yield. Agric. Ecosyst. Environ. 319:107570. doi: 10.1016/j.agee.2021.107570
Meland, M., Frøynes, O., and Kaiser, C. (2017). High tunnel production systems improve yields and fruit size of sweet cherry. Acta Hortic. 1161, 117–124. doi: 10.17660/ActaHortic.2017.1161.20
Ne’eman, G., Shavit, O., Shaltiel, L., and Shmida, A. (2006). Foraging by male and female solitary bees with implications for pollination. J. Insect Behav. 19, 383–401. doi: 10.1007/s10905-006-9030-7
O’Connor, S., Park, K. J., and Goulson, D. (2017). Location of bumblebee nests is predicted by counts of nest-searching queens. Ecol. Entomol. 42, 731–736. doi: 10.1111/een.12440
Osterman, J., Landaverde-González, P., Garratt, M. P., Gee, M., Mandelik, Y., Langowska, A., et al. (2021). On-farm experiences shape farmer knowledge, perceptions of pollinators, and management practices. Glob. Ecol. Conserv. 32:e01949. doi: 10.1016/j.gecco.2021.e01949
Osterman, J., Mateos-Fierro, Z., Siopa, C., Castro, H., Castro, S., and Eeraerts, M. (2024). The impact of pollination requirements, pollinators, landscape and management practices on pollination in sweet and sour cherry: a systematic review. Agric. Ecosyst. Environ. 374:109163. doi: 10.1016/j.agee.2024.109163
R Core Team (2024). R: A language and environment for statistical computing. Vienna, Austria: R Foundation for Statistical Computing.
Rand, T. A., Tylianakis, J. M., and Tscharntke, T. (2006). Spillover edge effects: the dispersal of agriculturally subsidized insect natural enemies into adjacent natural habitats. Ecol. Lett. 9, 603–614. doi: 10.1111/j.1461-0248.2006.00911.x
Rather, B. A., Mir, M. M., Iqbal, U., and Mir, S. A. (2021). “Integrated pest management of stone fruits” in Production Technology of Stone Fruits. eds. M. M. Mir, U. Iqbal, and S. A. Mir (Singapore: Springer), 397–422.
Reilly, J. R., Artz, D. R., Biddinger, D., Bobiwash, K., Boyle, N. K., Brittain, C., et al. (2020). Crop production in the USA is frequently limited by a lack of pollinators. Proc. R. Soc. B 287:20200922. doi: 10.1098/rspb.2020.0922
Ryder, J. T., Cherrill, A., Prew, R., Shaw, J., Thorbek, P., and Walters, K. F. A. (2020). Impact of enhanced Osmia bicornis (Hymenoptera: Megachilidae) populations on pollination and fruit quality in commercial sweet cherry (Prunus avium L.) orchards. J. Apic. Res. 59, 77–87. doi: 10.1080/00218839.2019.1654062
Sánchez, M., Velásquez, Y., González, M., and Cuevas, J. (2022). Activity and foraging behaviour of the hoverfly Eristalinus aeneus (Scopoli, 1763) in protected cultivation of mango (Mangifera indica L.). Bull. Entomol. Res. 112, 101–109. doi: 10.1017/S0007485321000717
Schneider, G., Krauss, J., Riedinger, V., Holzschuh, A., and Steffan-Dewenter, I. (2015). Biological pest control and yields depend on spatial and temporal crop cover dynamics. J. Appl. Ecol. 52, 1283–1292. doi: 10.1111/1365-2664.12471
Shaw, B., Hemer, S., Cannon, M. F. L., Rogai, F., and Fountain, M. T. (2019). Insecticide control of Drosophila suzukii in commercial sweet cherry crops under cladding. Insects 10:196. doi: 10.3390/insects10070196
Shaw, B., Walker, A., Hemer, S., Cannon, M. F., Brown, B., Rogai, F. M., et al. (2023). Preliminary evidence of Drosophila suzukii parasitism in Southeast England. Parasitol. Res. 122, 2585–2597. doi: 10.1007/s00436-023-07957-6
Stutz, S., and Entling, M. H. (2011). Effects of the landscape context on aphid-ant-predator interactions on cherry trees. Biol. Control 57, 37–43. doi: 10.1016/j.biocontrol.2011.01.001
Thomson, L. J., and Hoffmann, A. A. (2013). Spatial scale of benefits from adjacent woody vegetation on natural enemies within vineyards. Biol. Control 64, 57–65. doi: 10.1016/j.biocontrol.2012.09.019
Trillo, A., Herrera, J. M., and Vilà, M. (2018). Managed bumble bees increase flower visitation but not fruit weight in polytunnel strawberry crops. Basic Appl. Ecol. 30, 32–40. doi: 10.1016/j.baae.2018.05.008
Wang, X., Daane, K. M., Hoelmer, K. A., and Lee, J. C. (2021). “Biological control of spotted-wing drosophila: an update on promising agents” in Drosophila Suzukii Management. ed. F. R. Mello Garcia (Cham. Switzerland: Springer), 143–167.
Wang, S., Michaud, J. P., Tan, X. L., and Zhang, F. (2014). Comparative suitability of aphids, thrips and mites as prey for the flower bug Orius sauteri (Hemiptera: Anthocoridae). Eur. J. Entomol. 111, 221–226. doi: 10.14411/eje.2014.031
Warren, R. J., Colin, T., Quarrell, S. R., Barron, A. B., and Allen, G. R. (2024). Quantifying the impact of crop coverings on honey bee orientation and foraging in sweet cherry orchards using RFID. J. Appl. Entomol. 148, 566–581. doi: 10.1111/jen.13247
Welch, K. D., and Harwood, J. D. (2014). Temporal dynamics of natural enemy-pest interactions in a changing environment. Biol. Control 75, 18–27. doi: 10.1016/j.biocontrol.2014.01.004
Whitehouse, T. S., Sial, A. A., and Schmidt, J. M. (2018). Natural enemy abundance in southeastern blueberry agroecosystems: distance to edge and impact of management practices. Environ. Entomol. 47, 32–38. doi: 10.1093/ee/nvx188
Whiting, M. D., Lang, G. A., and Ophardt, D. (2005). Rootstock and training system affect sweet cherry growth, yield, and fruit quality. HortScience 40, 582–586. doi: 10.21273/HORTSCI.40.3.582
Whiting, M. D., Ophardt, D., and McFerson, J. R. (2006). Chemical blossom thinners vary in their effect on sweet cherry fruit sert, yield, fruit quality, and crop value. HortTechnology 16, 66–70. doi: 10.21273/HORTTECH.16.1.0066
Wickham, H. (2016). ggplot2: Elegant graphics for data analysis., second Edi. New York, USA: Springer-Verlag.
Willden, S. A., Pritts, M. P., and Loeb, G. M. (2022). The effect of plastic low tunnels on natural enemies and pollinators in New York strawberry. Crop Prot. 151:105820. doi: 10.1016/j.cropro.2021.105820
Williams, N. M., Isaacs, R., Lonsdorf, E., Winfree, R., and Ricketts, T. H. (2019). “Building resilience into agricultural pollination using wild pollinators” in Agricultural resilience. Perspectives from ecology and economics. eds. S. M. Gardner, S. J. Ramsden, and R. S. Hails (Cambridge: Cambridge University Press), 109–134.
Wimp, G. M., and Murphy, S. M. (2021). Habitat edges alter arthropod community composition. Landsc. Ecol. 36, 2849–2861. doi: 10.1007/s10980-021-01288-6
Woodcock, B. A., Bullock, J. M., McCracken, M., Chapman, R. E., Ball, S. L., Edwards, M. E., et al. (2016). Spill-over of pest control and pollination services into arable crops. Agric. Ecosyst. Environ. 231, 15–23. doi: 10.1016/j.agee.2016.06.023
Zoffoli, J. P., Toivonen, P., and Wang, Y. (2017). “Postharvest biology and handling for fresh markets” in Cherries: Botany, production and uses. eds. J. Quero-García, A. Iezzoni, J. Puławska, and G. A. Lang (Croydon, UK: CABI), 460–484.
Keywords: bees, ecosystem services, IPPM, predators, protection, wildflowers, sentinel bait cards, fruit set and quality
Citation: Mateos-Fierro Z, Garratt MPD, Fountain MT, Ashbrook K and Westbury DB (2024) Wildflower strips in polytunnel cherry orchard alleyways support pest regulation services but do not counteract edge effects on pollination services. Front. Sustain. Food Syst. 8:1423511. doi: 10.3389/fsufs.2024.1423511
Edited by:
Daniel Paredes, University of Extremadura, SpainReviewed by:
Maria Villa, Instituto Politécnico de Bragança, PortugalHannah J. Penn, Agricultural Research Service (USDA), United States
Copyright © 2024 Mateos-Fierro, Garratt, Fountain, Ashbrook and Westbury. This is an open-access article distributed under the terms of the Creative Commons Attribution License (CC BY). The use, distribution or reproduction in other forums is permitted, provided the original author(s) and the copyright owner(s) are credited and that the original publication in this journal is cited, in accordance with accepted academic practice. No use, distribution or reproduction is permitted which does not comply with these terms.
*Correspondence: Zeus Mateos-Fierro, em1hdGVvc2ZAcHVyZHVlLmVkdQ==