 Khara W. Stephen
 Katherine D. Chau
 Sandra M. Rehan
95% of researchers rate our articles as excellent or good
Learn more about the work of our research integrity team to safeguard the quality of each article we publish.
Find out more
ORIGINAL RESEARCH article
Front. Sustain. Food Syst. , 26 June 2024
Sec. Agroecology and Ecosystem Services
Volume 8 - 2024 | https://doi.org/10.3389/fsufs.2024.1411410
Human activities, including urban expansion, intensive farming practices, and the application of pesticides have significantly reshaped bee habitats. Understanding the nutritional content of pollen, the primary source of bees’ proteins and lipids, is important for maintaining their diet and health. In this study, we set out to determine the nutritional composition of pollen from various plant families and genera. Our objectives were to analyze the levels of non-esterified fatty acids (NEFAs), amino acids (AAs), protein-to-lipid (P:L) ratios, and omega-6:3 ratios of 57 pollen species native to North America. These data suggest a potential trade-off between NEFA and AA content within pollen, suggesting that a diverse floral diet may benefit bees more than a single pollen source. The AA profiles showed considerable diversity, with all pollen species providing the essential amino acids (EAAs) required for bee health, except for methionine which was lacking in Rhus glabra pollen. The plant family Asteraceae was especially abundant in EAAs. P:L ratios varied widely further emphasizing bees’ need for access to a diverse array of nutritional profiles. There were no overall nutritional differences between pollen from native and introduced plant species. This study highlights the significance of a diverse array of floral resources to meet the comprehensive nutritional needs of bees, contributing to the support of pollinator populations and the broader ecological system.
The mutualistic relationships between pollinators and flora have evolved through intricate ecological processes, with bees serving as a prime example of pollinators that directly rely on the flora they forage upon to fulfill their dietary needs. These plant-insect herbivore interactions have been observed in various insects, such as fruit flies, butterflies, and especially bees, which have been the focus of many studies in nutritional ecology (Filipiak, 2018). For instance, the diets of larval monarch butterflies (Danaus plexippus) depend on the species of milkweed consumed throughout their lifecycle, influencing the dispersal of traits and flight energetics in the adults (Pocius et al., 2022). Milkweed is also important for monarch butterfly diets, as it strengthens their resistance to a protozoan parasite (Ophryocystis elektroscirrha), highlighting the significance of these plant-insect interactions (Tan et al., 2018). The diversity of floral resources is instrumental in providing bees and other pollinators with the necessary nutrients, including proteins and lipids, which are imperative for their development, immune function, and overall health (Blüthgen and Klein, 2011; Vaudo et al., 2015). Pollinators often exhibit various preferences and adaptations for certain floral traits, such as flower scent, shape, color, nectar, and pollen production, which have co-evolved with the plants they pollinate (Janz and Nylin, 2008; Johnson, 2010). This interdependence has led to the formation of complex plant-pollinator networks, where certain bee species have evolved to preferentially forage on specific plant species, enhancing pollination efficiency and plant reproductive success (Mitchell et al., 2009; Gómez-Martínez et al., 2022). This interdependence between pollinators and the flora they forage upon highlights the intricate co-evolutionary processes that have shaped the dietary specializations observed in these species.
Human-induced changes, such as urbanization, agricultural intensification, and pesticide usage, have drastically altered bee habitats. These changes have led to a scarcity in the diversity and availability of pollen resources, essential for the health and proliferation of bee populations (Potts et al., 2010; Goulson et al., 2015). Declines in pollinator populations and alterations in their geographic spread disrupt pollination services, affecting plant communities and agricultural yield. Additionally, climatic alterations induced by human activity are now understood to affect the nutritional makeup of pollen. With the protein, lipid, and amino acid (AA) content of pollen influenced by rising temperatures and changing CO2 levels (Ziska et al., 2016; Ruedenauer et al., 2020), pollinators like bees face new nutritional challenges. Their ability to find the necessary nutrients for growth, development, and immunity is challenged, compounding the stressors imposed by habitat degradation.
Understanding the details of pollen nutrition is essential in this context. It encompasses more than measuring protein levels; it explores the broader nutritional ecology to address the decline of pollinator populations and their important roles in ecosystems (Filipiak, 2018). With over 20,000 described bee species worldwide providing pollination services for various flora and crops, they are important to global food security and ecosystem health (Winfree et al., 2011; Potts et al., 2016). Bees’ foraging behaviors are shaped by their nutritional needs, revealing preferences for certain macronutrients. For example, bumble bees (Bombus spp.) have been observed to select plants like Solanum tridynamum, Solanum elaeagnifolium, and Exacum affine, which offer pollen rewards concealed within poricidal anthers that are accessible only through buzz pollination demonstrating the bees’ adaptation to meet their complex nutritional requirements (Russell et al., 2016; Ruedenauer et al., 2021). Additionally, generalist bee species such as the honey bee (Apis mellifera), often forage on a diverse array of plant species, including sturdy, irregular-shaped flowers like snapdragons or penstemon, to meet their varied nutritional needs (Dafni and Kevan, 1997; Vaudo et al., 2015). This understanding goes beyond simplistic botanical classifications, suggesting the importance of examining the relationships between bees and the diverse plant species that sustain them.
Maintaining a diverse array of pollen sources is important, as it allows generalist bee species to forage on multiple plant species to fulfill their nutritional requirements. Most bees are generalists and they may visit a variety of plant species including ancient bee-pollinated flowers like magnolias and water lilies (Bernhardt and Thien, 1987; Vaudo et al., 2024). For instance, Kleijn et al. (2015) highlighted key North American bees such as Bombus impatiens, Anthophora urbana, and Andrena vicina, noting their frequent visits to specific crops like Alfalfa, Apple, and Carrot. This diversity in foraging options demonstates the importance of these species in both natural and cultivated ecosystems. This supports healthy bee populations and facilitates successful plant restoration efforts by ensuring adequate pollination services (Winfree et al., 2011; Potts et al., 2016). Nectar provides bees with energy-rich carbohydrates, while pollen is the primary source of proteins, lipids, free AAs, and other micronutrients essential for their cognitive functions, development, and immunity (Nicolson, 2011). Nutritional profiles vary widely among plant species and even within the same family or genus, which has implications for both specialist and generalist bees (Williams, 2003). Bee nutrition also differs among species, influencing foraging selectivity to fulfill specific dietary needs (Leonhardt et al., 2011). Honey bees, for instance, adjust their foraging preferences based on their colony’s nutritional demands, seeking out plants with suitable lipid and protein pollen profiles (Barraud et al., 2022). Honey bees also have been observed to prefer plants with lower lipid content to avoid impairing their sensory functions (Bennett et al., 2022). In contrast, the solitary mason bee, Osmia cornuta, favors plant species with higher pollen protein and lower lipid content (Sedivy et al., 2011). The generalist bumblebee Bombus terrestris is known for its broad foraging range, covering over 400 plant genera from more than 80 families (Goulson et al., 2008). While these findings are significant, there is a notable gap in bee nutrition research, particularly regarding solitary bees, which represent about 85% of identified wild bee species pollinating a substantial portion of crops across North America and worldwide (Reilly et al., 2020; Khalifa et al., 2021). This underlines the need for further study of the nutritional profiles across diverse plant genera and families to enrich our knowledge of wild bee nutrition and support their conservation (Crone et al., 2022; Ghosh et al., 2023).
Fatty acids are pivotal for the energy production, cellular integrity, and physiological regulation in bees (Kaplan et al., 2016). Bees must obtain essential non-esterified fatty acids (NEFAs), like omega-3 (linolenic acid) and omega-6 (linoleic acid), through their diet since they cannot synthesize them (Jeannerod et al., 2022). These fatty acids are essential for bee growth, overall health, development, and provide an energy reserve during low nectar and pollen periods (Arien et al., 2018). Additionally, they are key for reproductive and immune functions (Arien et al., 2020). The ideal omega-6:3 ratio for honey bees is around 1 or lower; higher omega-6 levels are linked to impaired learning and physiological issues (Arien et al., 2015; Bennett et al., 2022). Deficiencies in these fatty acids negatively impact bee development, immune response, and lifespan, and can reduce their resistance to environmental stressors including diseases (Vaudo et al., 2016a). Bees can synthesize some fatty acids from pollen and nectar components (Hsu et al., 2021). The availability and quality of these dietary sources are important, as they affect fatty acid synthesis and utilization which in turn influences bee health and physiological functions (Arien et al., 2020). However, the understanding of fatty acid metabolism in bees is not as comprehensive as it is in mammals, pointing to an area for further study to improve our knowledge of how dietary fats impact bee metabolism and health.
The protein-lipid (P:L) ratio in pollen is a metric used to evaluate the nutritional quality of pollen and understand foraging preferences across bee species (Crone and Grozinger, 2021). Bees are known to modulate their pollen consumption to attain an optimal P:L ratio for their dietary needs (Vaudo et al., 2020). Pollen species fall on a diverse P:L spectrum, typically ranging from 0.5 to 6.0, with the majority of bee-pollinated flora featuring a P:L ratio of 1–4 (Vaudo et al., 2020; Barraud et al., 2022). Honey bees show a preference for pollen with a P:L ratio of about 2–3, which offers a balanced mix of proteins and lipids (Vaudo et al., 2020). In contrast, bumble bees, such as Bombus terrestris and Bombus impatiens, actively regulate their pollen intake to achieve higher P:L ratios—14:1 for Bombus terrestris and 12:1 for Bombus impatiens (Vaudo et al., 2016a,b). Environmental stressors, including insecticide exposure, can be more harmful to bees when coupled with higher dietary P:L ratios, suggesting that the P:L ratio also influences bees’ resilience to such stressors (Crone and Grozinger, 2021).
The nutritional value of pollen protein is often characterized by its essential amino acid (EAA) content (Taha et al., 2019). De Groot (1953) identified 10 EAAs necessary for honey bees—arginine, histidine, lysine, phenylalanine, tryptophan, methionine, threonine, leucine, isoleucine, and valine—a list corroborated by recent studies quantifying these EAAs’ requirements by evaluating growth and protein content in bees on diets with varying AA levels (Jeannerod et al., 2022). In light of previous research showing that the nutritional value of pollen is not solely dependent on its protein content, but also on the presence of essential fatty acids and a balanced profile of AA, it is important to incorporate these metrics into nutritional evaluations (Arien et al., 2015, 2018). Deficiencies in EAAs impair protein synthesis and bee fitness (Mariotti, 2017). Bees show a preference for pollen high in EAAs, especially isoleucine, leucine, and valine, vital for their health (Cook et al., 2003). Weeks et al. (2018) further highlighted methionine’s significance, finding that bees cannot sustain brood on methionine-deficient pollen and typically avoid pollen or nectar from such plants. This avoidance behavior emphasizes methionine’s essential role in bee nutrition. Additionally, lysine is used for producing nitric oxide, a neurotransmitter that enhances memory in bees, while leucine influences protein regulation and impacts gene expression, indicating the roles EAAs play in bee health and development (Gage et al., 2020). Thus, a balanced EAA composition in pollen is essential for bee development and brood health.
This study has three aims to describe the nutritional profile of several pollen species from different families and genera: (1) document the content of NEFAs, AA, P:L, and omega-6:3 ratios in 57 North American pollen species; (2) identify phylogenetic signals of plant family and genus with NEFA and AA content; and (3) assess the overall nutritional value of the pollen species as important food sources for wild bees. This study sets the stage for future experimentation on how diverse floral resources meet the nutritional needs of bees. By examining these nutritional components, we aim to inform floral plantings and future strategies for ecological conservation and sustainable agriculture, with the goal of supporting healthy bee populations and robust pollinator networks.
We analyzed a total of 57 pollen samples, which include 20 former samples from Chau and Rehan (2024) and 37 newly acquired species, collectively spanning 47 genera and 27 families. Included in the former samples were Taraxacum officinale and Plantago lanceolata, which were specifically reanalyzed due to the acquisition of new pollen samples. The samples were sourced from wild plants in the Greater Toronto Area (Canada), with additional samples commercially obtained from the United States, Australia, and China (Supplementary Table S1). The targeted plant species were chosen for their ecological significance to northeastern wild bees and their prevalence. The collection method was tailored to each pollen species to optimize pollen extraction based on their distinct floral structures and pollen characteristics. The pollen was hand-collected in spring and summer 2022 and 2023 either from fresh blooms and then transported to the laboratory in sealed plastic bags, or from collected flowers that had been allowed to dry in the laboratory. The extraction process involved either brushing the pollen from flowers or tapping them over clean white paper to collect the pollen, which was then sieved to remove impurities (45 μm, Hogentogler & Co, Columbia), weighed in grams, and kept frozen at −80°C until further analysis.
Pollen samples were sent to the Mayo Clinic in Rochester, Minnesota to determine the content of NEFA and AA. The preparatory process for each pollen sample involved amalgamating the pollen with a phosphate-buffered saline solution, followed by homogenization through sonication and mixing via vortex to ready the samples for NEFA and AA measurements. The quantification of 12 NEFAs was executed employing a Thermo Quantum Ultra triple quadrupole interfaced with Waters’ Acquity liquid chromatography system, measured against the established protocol outlined by Persson et al. (2010). Subsequently, a 10 mg aliquot of pollen was treated with a blend of isotopic internal standards prior to the extraction process. Post-extraction, the samples were dried and reconstituted with a running buffer in preparation for the liquid chromatography-mass spectrometry (LC/MS) analysis using negative electrospray ionization.
For each pollen species analyzed, we quantified the total free fatty acids present, evaluated the composition of NEFAs, and determined the ratios of imperative NEFAs, specifically omega-3 (linolenic acid) and omega-6 (linoleic acid), measured in nmols/mg of pollen. The quantification of AA was carried out via LC/MS, adhering to the method delineated by Lanza et al. (2010). Briefly, to each 2 mg of pollen solution, isotopic internal standards were introduced prior to the removal of proteins using chilled methanol. Subsequently, the clear liquid was treated with 6-aminoquinolyl-N-hydroxysuccinimidyl carbamate as specified by the Waters’ MassTrakTM protocol. Following the addition of internal standards, a calibration curve of 10 points was prepared using the same derivatization method. These derivatized standards and pollen samples underwent analysis on a Thermo Quantum Ultra triple quadrupole mass spectrometer, paired with a Waters Acquity liquid chromatography system where a selective ion monitoring (SRM) technique facilitated data collection. The calculated concentrations of 42 analytes per sample were compared against their calibration standards with results expressed in nmols/mg of pollen.
Additionally, we estimated the total AA content, identified as EAAs for bees (arginine, histidine, isoleucine, leucine, lysine, methionine, phenylalanine, threonine, tryptophan, and valine; de Groot, 1953), and outlined the AA profile for each pollen species. The percentage of each EAA, in comparison to the requirements for a honey bee diet (de Groot, 1953), was also determined and depicted through a heatmap for the top 10 pollen species that most closely match the honey bee EAA requirements. The nutritional evaluation included calculating the P:L ratio for each pollen species, which was calculated by dividing the total content of AA and metabolites in nmols/mg of pollen by the total NEFA content for each pollen species. We also analyzed the omega-6:3 fatty acid ratios using the total linoleic acid content divided by the total linolenic acid content for each pollen species, as the omega-6:3 ratio obtained from diet has been found to impact bee cognitive function (Arien et al., 2015, 2018; Bennett et al., 2022).
Variations in the quantities of total NEFA, AA, EAA, and non-essential amino acids (NEAA) across various pollen species were visualized with non-metric multidimensional scaling (NMDS) based on Bray–Curtis dissimilarity indices (Chau and Rehan, 2024). Data were transformed using the “total” option in the decostand function from the vegan package in R (Oksanen et al., 2017), standardizing the data to relative total amounts for each pollen species. Further investigation determined whether the nutritional content (total AA, EAA, NEAA, NEFA, P:L ratio, and omega-6:3 ratio) exhibited significant variation among families with two or more species (Asteraceae, Brassicaceae, Theaceae, Cornaceae, Rosaceae, Oleaceae, Fabaceae, Pinaceae, Salicaceae, Anacardiaceae, and Adoxaceae). For this, we applied Bartlett’s test and the Shapiro-Wilks test, utilizing the bartlett.test and shapiro.test functions in base R to examine the homogeneity of variances and normality of distribution, respectively. Although variances were homogeneous across families, the data did not follow a normal distribution. Consequently, the Kruskal-Wallis test was employed, using the kruskal.test function in base R, to evaluate whether nutritional content differed by family. All statistical analyses were conducted in R version 4.3.1 (R Core Team, 2022).
To determine the evolutionary relationship between total NEFA and various AA profiles, we conducted phylogenetic generalized least squares (PGLS) analyses using the nlme package in R (Pinheiro and Bates, 2000; Pinheiro et al., 2023). This analysis considered the relationships of (1) total NEFA vs. total AA, (2) total NEFA vs. total EAA, (3) total NEFA vs. total NEAA, and (4) total omega vs. total EAA, all calculated per pollen species. The phylogenetic tree (Figure 1) used for this analysis was constructed using ribulose-1,5-bisphosphate carboxylase large subunit (rbcL) sequences from chloroplasts sourced from NCBI Genbank for each species (NCBI accession numbers in Supplementary Table S1). For three plant species that were not taxonomically identified to the species level (Trifolium sp., Prunus sp., and Rosa sp.), we substituted with rbcL sequences from Trifolium repens (HQ644078.1), Prunus serotina (NC_036133.1), and Rosa virginiana (MG247335.1) respectively, which are distributed in North America to construct the phylogenetic tree. A phylogenetic tree was constructed by employing the ultrafast IQ-TREE software (version 1.6.12) which used 1,000 bootstrap replicates to develop a maximum likelihood tree (Nguyen et al., 2015; Hoang et al., 2018). To align the tree with established angiosperm relationships, we used Mesquite version 3.70 (Maddison and Maddison, 2021) to revise branches to ensure adherence to the angiosperm phylogeny outlined by Li et al. (2021).
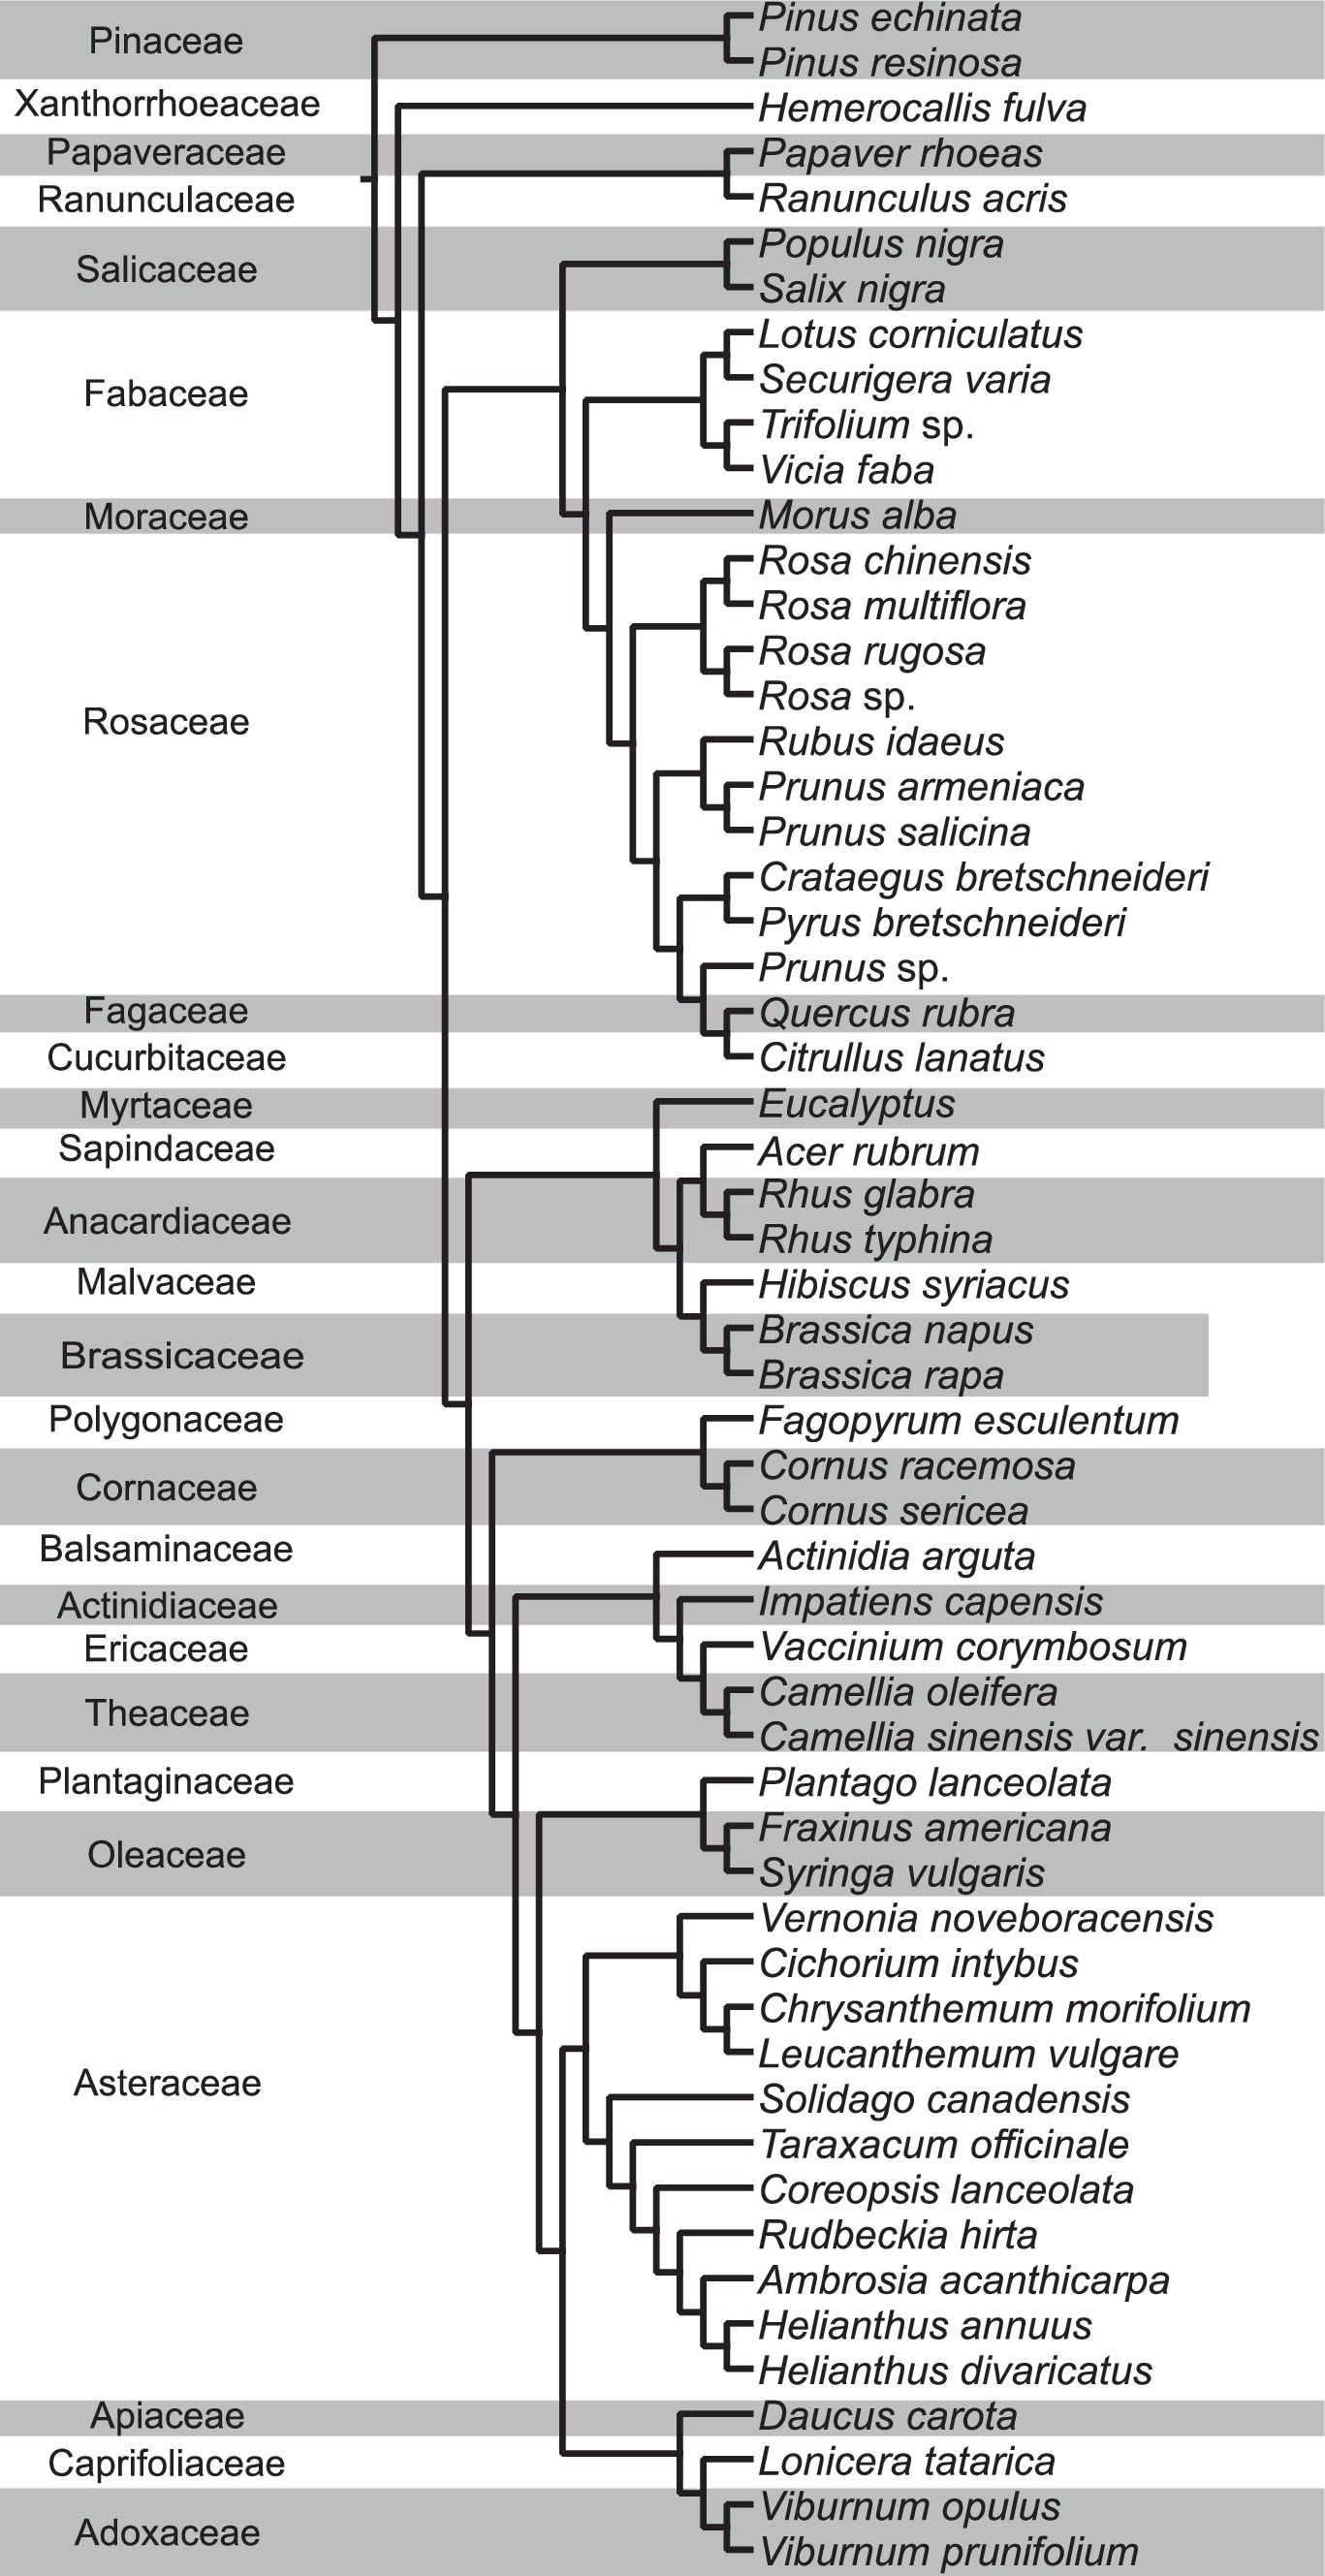
Figure 1. Phylogenetic tree of pollen species grouped by their plant families from this study and from Chau and Rehan (2024). In total, 57 pollen species from 45 genera and 27 families are analyzed for lipid and protein content in this study.
Next, each pollen species was classified as “native” or “introduced” to North America, to determine if the nutritional content shows a significant difference based on endemicity. Plant distribution data were sourced from the USDA PLANTS database (USDA and NRCS, 2024). Endemicity for three plants from Chau and Rehan (2024) were sourced from literature: Taraxacum officinale (Stewart-Wade et al., 2002), Viburnum opulus (Česonienė et al., 2010), and Rubus idaeus (Fernald, 1919). When pollen was identified only to the genus level, we utilized species-specific data corresponding to the same taxa as those used for rbcL sequence retrieval, including Trifolium repens, Rosa virginiana, and Prunus serotina. Given that the Shapiro-Wilks test indicated the data followed a non-normal distribution for total EAA, NEAA, AA, NEFA, P:L ratio, and omega-6:3 ratio with respect to endemicity, we applied the Mann–Whitney-Wilcoxon test using the wilcox.test function in base R to evaluate if there was a statistically significant difference in nutritional content between native and introduced pollen species.
We expanded our analysis on P:L ratios across pollen families by incorporating P:L ratios obtained from Vaudo et al. (2024) supplementary data which expanded our dataset from 57 to 167 species. To match the P:L ratio units from the study of Vaudo et al. (2024) which is in μg/mg, we converted our total protein and total lipid values from nmols/mg to μg/mg by multiplying our protein and lipid values by the molecular weight of each respective protein and lipid molecule, and then converting the units to μg/mg. The molecular weight was obtained in g/mol for each NEFA, AA, and metabolite by searching each molecule on PubChem (Kim et al., 2023). We then analyzed the expanded P:L ratios only from families with two or more species by first testing for normal distribution among P:L ratio means using a Shapiro–Wilk test. The data were not normally distributed. Hence, we used the Kruskal-Wallis test to test for differences in P:L ratio means among families. The Welch two sample t-test (the t.test function in base R) was used to determine the difference in mean total protein, omega, P:L and total lipid in native and introduced species.
Finally, to identify which pollen species had ideal EAA compositions compared to honey bee EAA requirements (de Groot, 1953), Euclidean distance was used as a measure of nutritional alignment with the bees’ optimal dietary profile. Utilizing base R functions, we calculated the average Euclidean distances for each pollen family to determine the top 10 most suitable pollen species for wild bee diet based on honey bee EAA requirements. Specifically, we used the apply function to compute the square root of the sum of squared differences between the AA ratios of each species and the optimal profile, interpreting lower scores as indicative of a more suitable match to the honey bees’ nutritional preferences.
Among the 57 pollen species studied, all contained a range of 7–10 NEFA (Supplementary Table S2). Notably, Rhus glabra pollen presented the lowest NEFA concentration at 1.55 nmols/mg, while Impatiens capensis had the highest at 49.67 nmols/mg. Some fatty acids were only detected in small quantities and among few species studied. For instance, docosahexaenoic acid was found exclusively in Cichorium intybus and Impatiens capensis. Arachidonic acid was identified in Coreopsis lanceolata, Cornus sericea, Daucus carota, Leucanthemum vulgare, Pinus resinosa, Plantago lanceolata, Ranunculus acris, Rudbeckia hirta, and Viburnum prunifolium. Elaidic acid was detected only in Rubus idaeus. Furthermore, eicosapentaenoic acid was only detected in six pollen species: Ambrosia acanthicarpa, Leucanthemum vulgare, Plantago lanceolata, Ranunculus acris, Rosa rugosa, and Viburnum prunifolium. Five NEFAs were universally found across all examined species, including essential linoleic and linolenic fatty acids, along with oleic, palmitic, and palmitoleic acids. Of these, linolenic, palmitic, and linoleic acids were identified as the three most prevalent NEFA across a majority of the pollen species. The concentration of NEFA linoleic acid was observed to vary, with a range between 0.19 nmols/mg in Actinidia arguta to 17.26 nmols/mg in Quercus rubra. Similarly, for linolenic acid, the range extended from 0.23 nmols/mg in Rhus glabra to 34.72 nmols/mg in Brassica napus.
The composition of pollen from each species included 26–34 AA and metabolites, with total protein concentrations ranging from 8.63 nmols/mg in Acer rubrum to 416.08 nmols/mg in Populus nigra (Supplementary Table S3). Almost all pollen genera contained all 10 EAAs. The levels of EAAs varied considerably, with the lowest levels detected in Prunus salicina (1.01 nmols/mg) and the highest levels in Quercus rubra (59.08 nmols/mg). Histidine was the most abundant EAA comprising 34.98% of the total AA content across all pollen species, followed by arginine at 21.74%, and the least prevalent being methionine at 0.978%. Among 17 species that recorded a total EAA concentration of 20% or higher, seven species were classified under the Asteraceae family (Coreopsis lanceolata, Leucanthemum vulgare, Rudbeckia hirta, Ambrosia acanthicarpa, Chrysanthemum morifolium, Helianthus divaricatus, and Cichorium intybus).
The NEAA content in pollen ranged with the least amount detected in Acer rubrum with 6.70 nmols/mg and the highest in Populus nigra with 358.39 nmols/mg (Supplementary Table S3). The pollen species with total NEAA concentrations exceeding 200 nmols/mg included one from the Asteraceae family (Vernonia noveboracensis), one from the Salicaceae family (Populus nigra), and one from the Fabaceae family (Lotus corniculatus). None of the pollen species analyzed contained detectable levels of the NEAAs anserine, carnosine, cystathionine, or hydroxylysines. The most prevalent NEAA was proline, accounting for 56.23% of the total, followed by asparagine at 15.26%, with the least common NEAAs being cysteine at 0.00015% and hydroxylysine 1 at 0.00016%.
The P:L ratios varied drastically, reaching levels as low as 0.11 in Acer rubrum and as high as 32.85 in Prunus sp., resulting in an average P:L ratio of 6.71 among the various pollen species (df = 56, p value = 0.47; Supplementary Table S4). Expanded analysis incorporating data from Vaudo et al. (2024) corroborates high variability in P:L ratios among pollen species (Supplementary Table S4; Figure 2). In the combined dataset with an additional 110 species, P:L ratios exhibited a considerable range, with the lowest value being 0.44 in Prunus salicina (Vaudo et al., 2024) and the highest was 32.85 in Prunus sp. (this study) resulting in a slightly lower average P:L ratio of 6.20 (df = 144, p value = 0.48; Supplementary Figure S2).
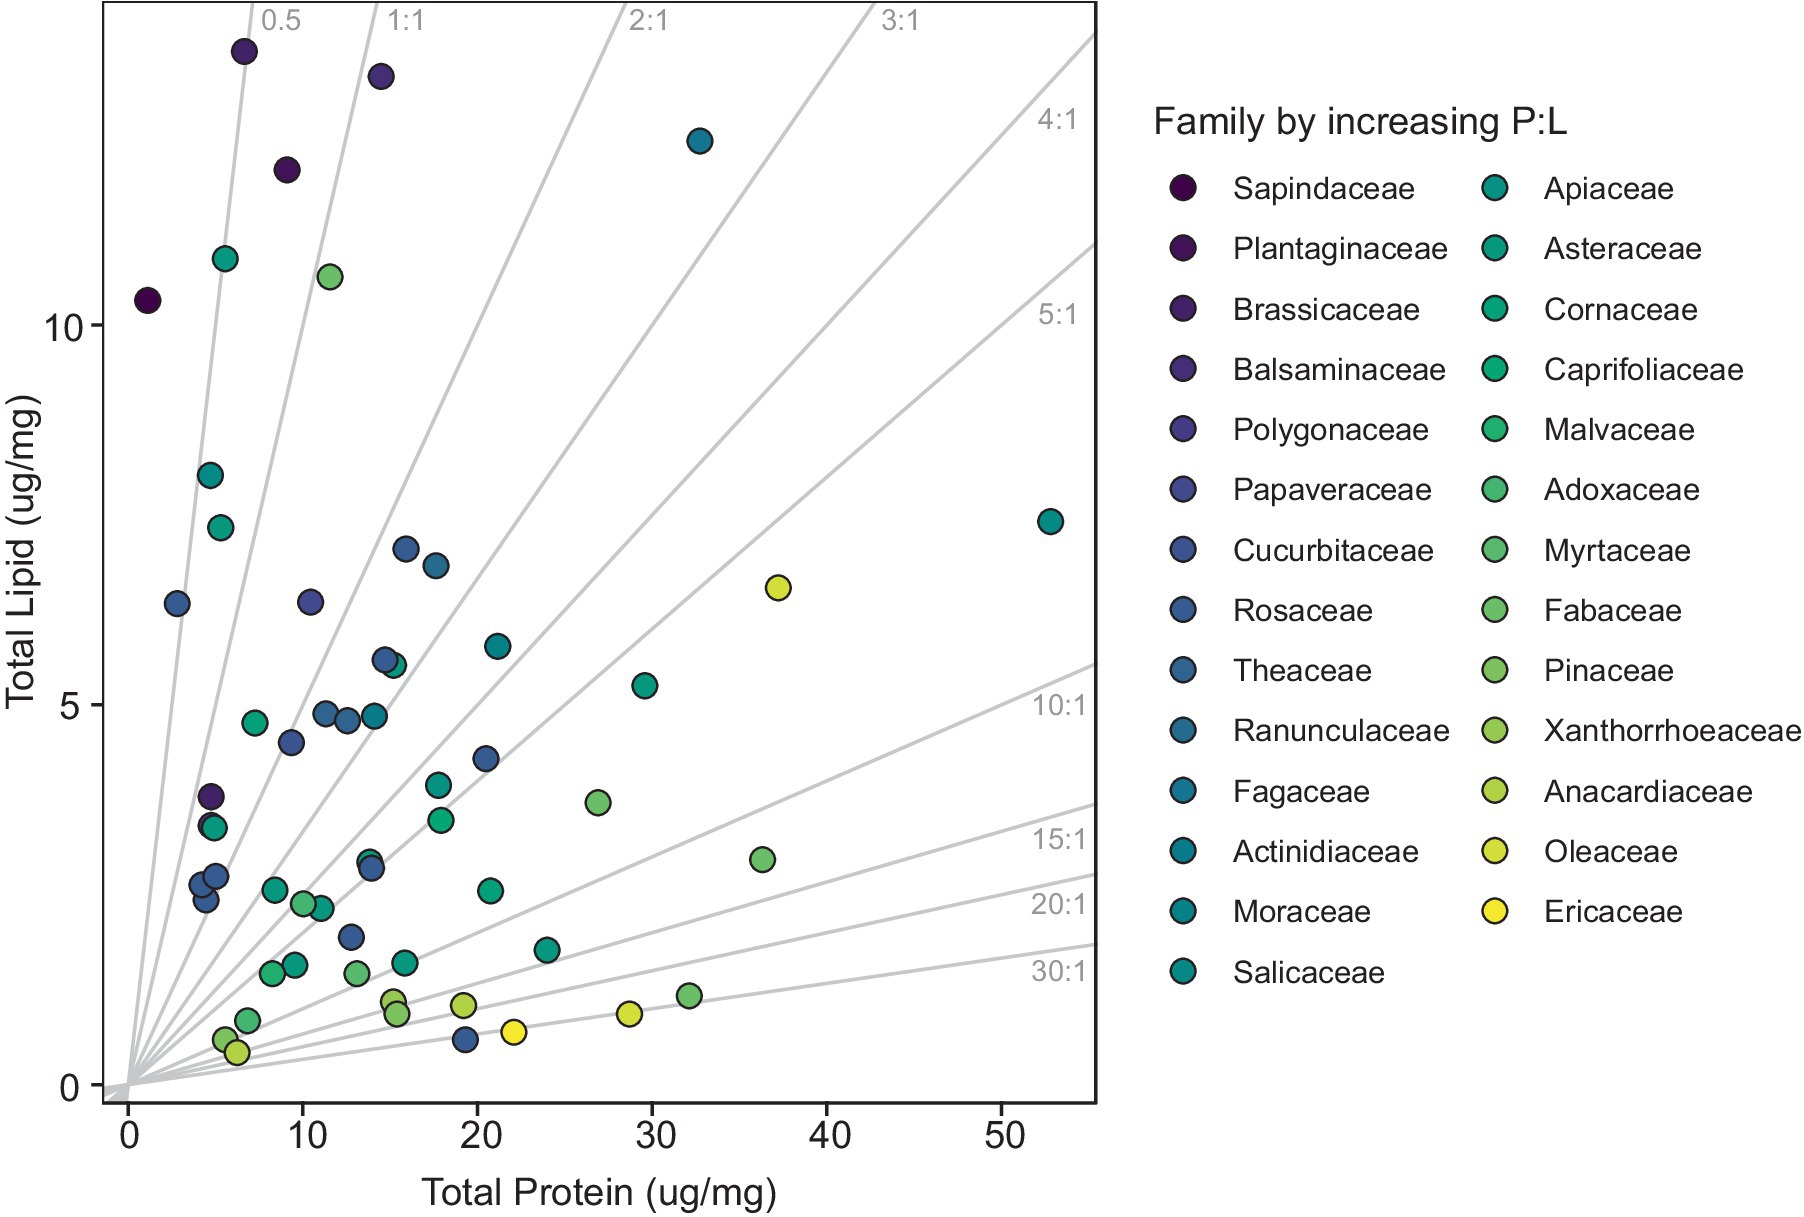
Figure 2. Scatterplot of pollen protein and lipid concentrations (μg/mg). Each point corresponds to a specific pollen species, with the color of the marker varying according to the plant family. Gray lines indicate P:L ratios and range from low to high moving left to right.
We observed a wide spectrum of total omega content among the pollen species analyzed. Total omega content ranged from 0.42 nmols/mg in Rhus glabra to 37.67 nmols/mg in Brassica napus, averaging 9.9 nmols/mg. Seven of the species analyzed exhibited omega-6:3 ratios exceeding 20% including: Acer rubrum 27.35 nmols/mg, Brassica napus 37.67 nmols/mg, Impatiens capensis 22.25 nmols/mg, Plantago lanceolata 24.16 nmols/mg, Quercus rubra 34.05 nmols/mg, Taraxacum officinale 29.75 nmols/mg, and Trifolium sp. 25.00 nmols/mg.
Examination of total NEFA content revealed that pollen species were not clearly segregated into distinct groups based on family (Figure 3A). Clustering of total AA content was only evident for Rosaceae (Figure 3B). However, clustering of total EAA content revealed that Asteraceae, Brassicaceae, and Fabaceae families formed distinct clusters (Figure 3C). A notable clustering was observed within the Brassicaceae family when analyzing total NEAA content (Figure 3D). PGLS revealed a significant negative correlation between total NEFA and total AA (t-value = −9.18, df = 57, p < 0.0001; Figure 4A) suggesting that total AA decreases as total NEFA increases.
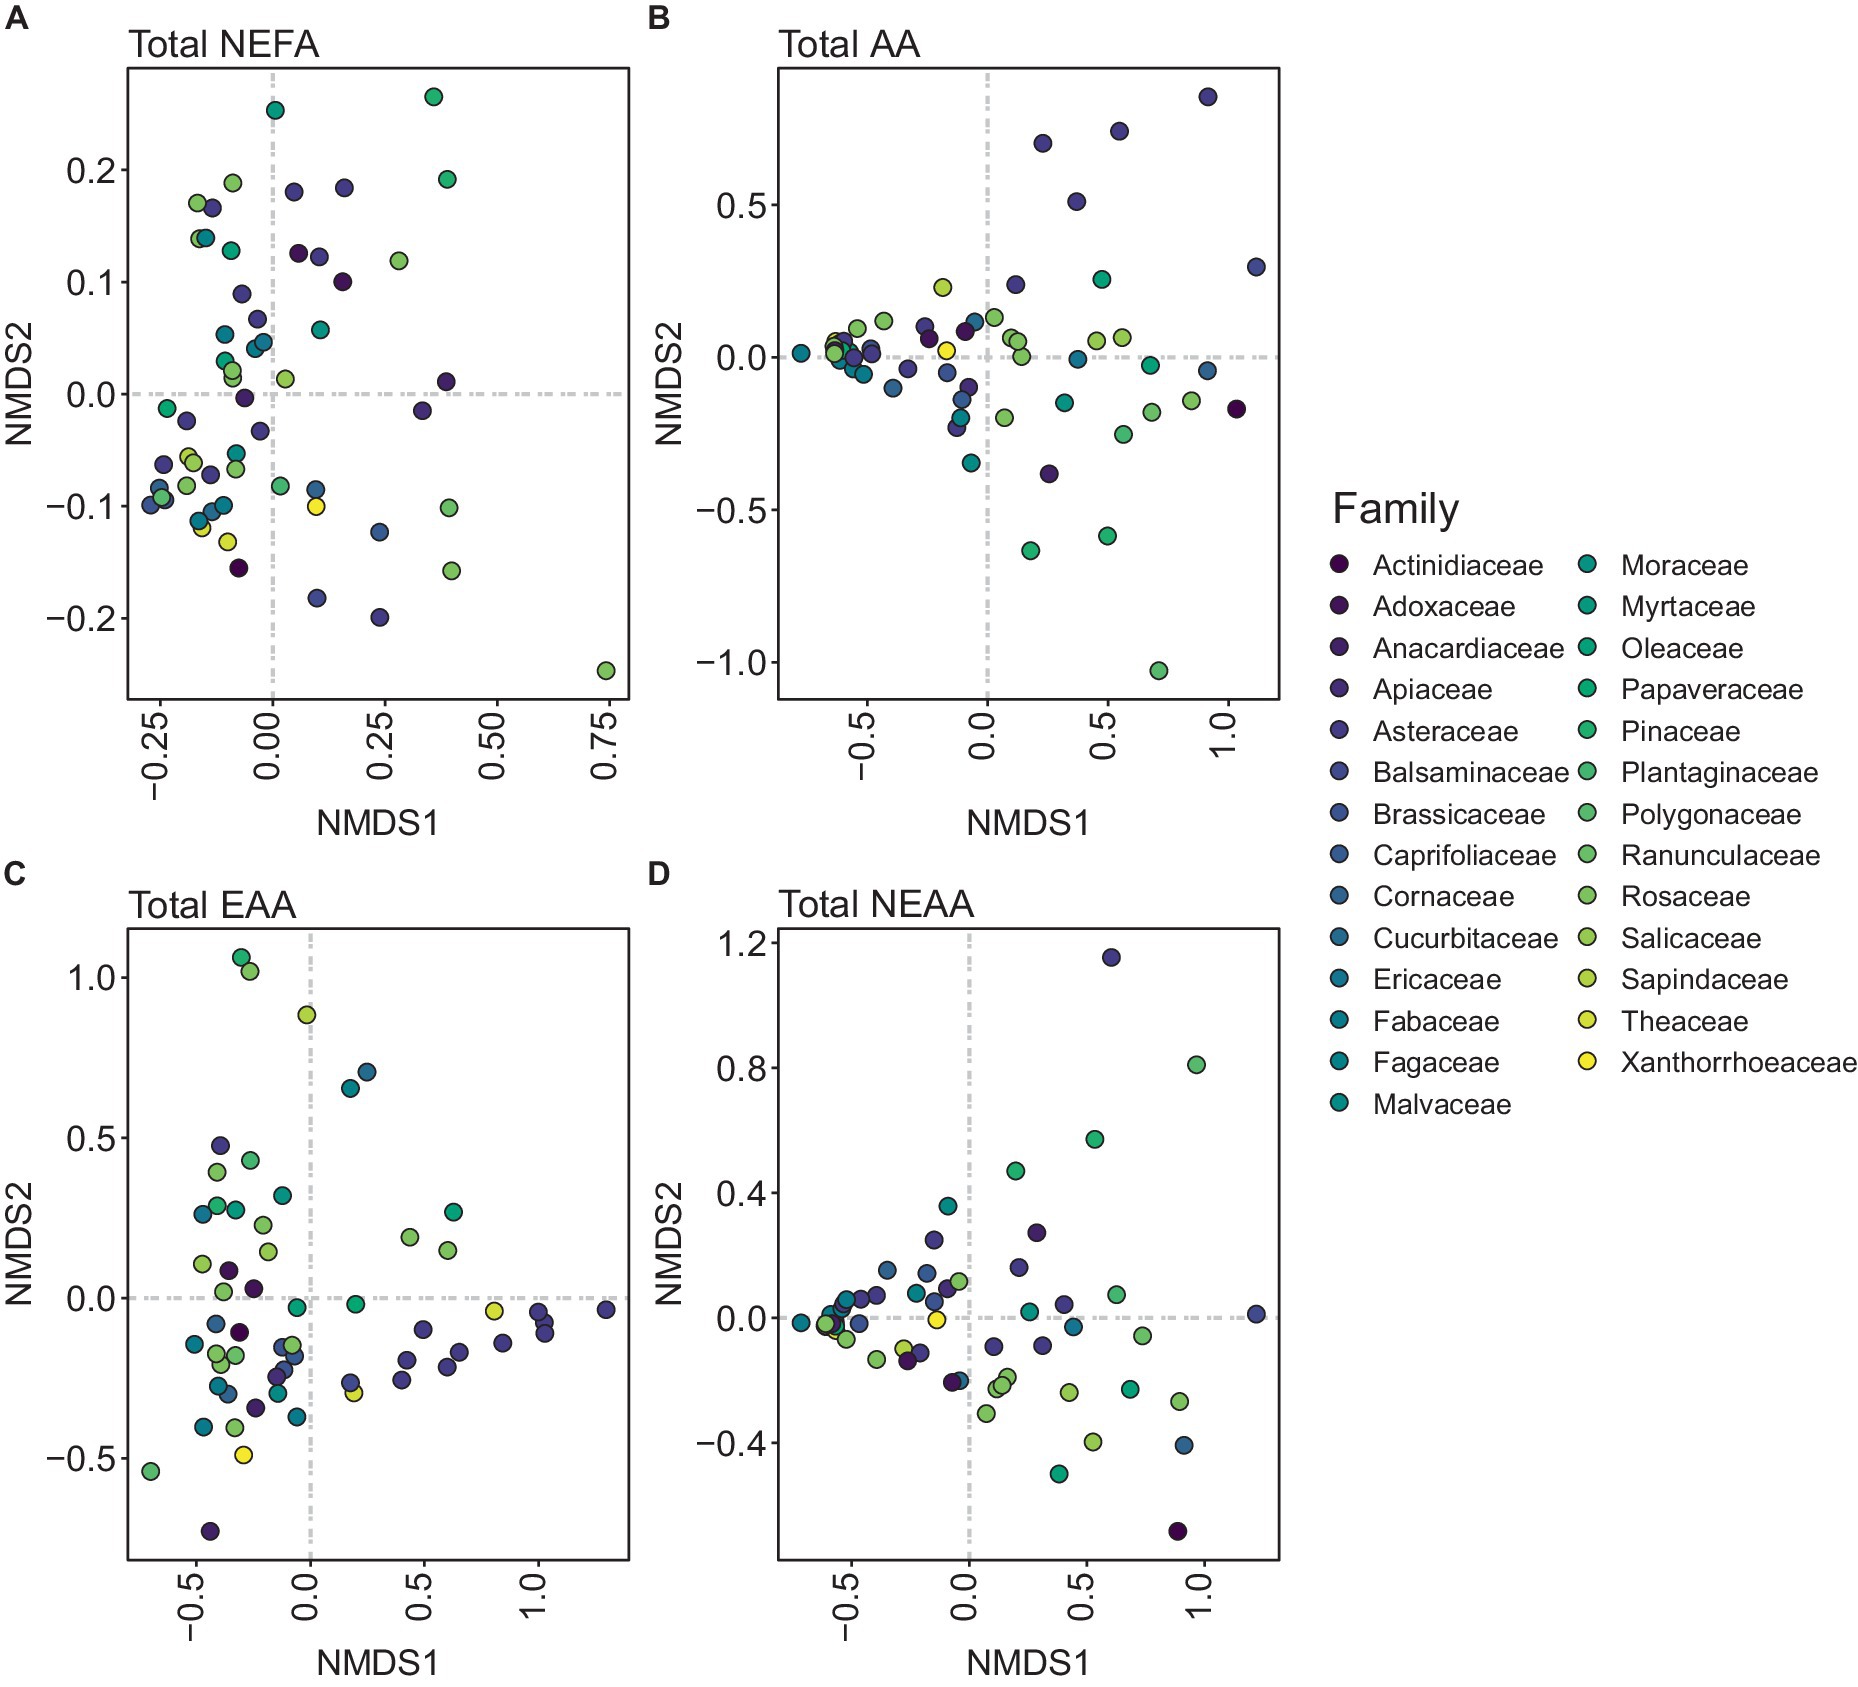
Figure 3. Non-metric dimensional scale (NMDS) plots representing the distribution of each pollen species per family. (A) Total non-esterified fatty acid (NEFA) content, (B) total amino acid (AA) content (essential and non-essential amino acids), (C) total essential amino acid (EAA) content, and (D) total non-essential amino acid (NEAA) content.
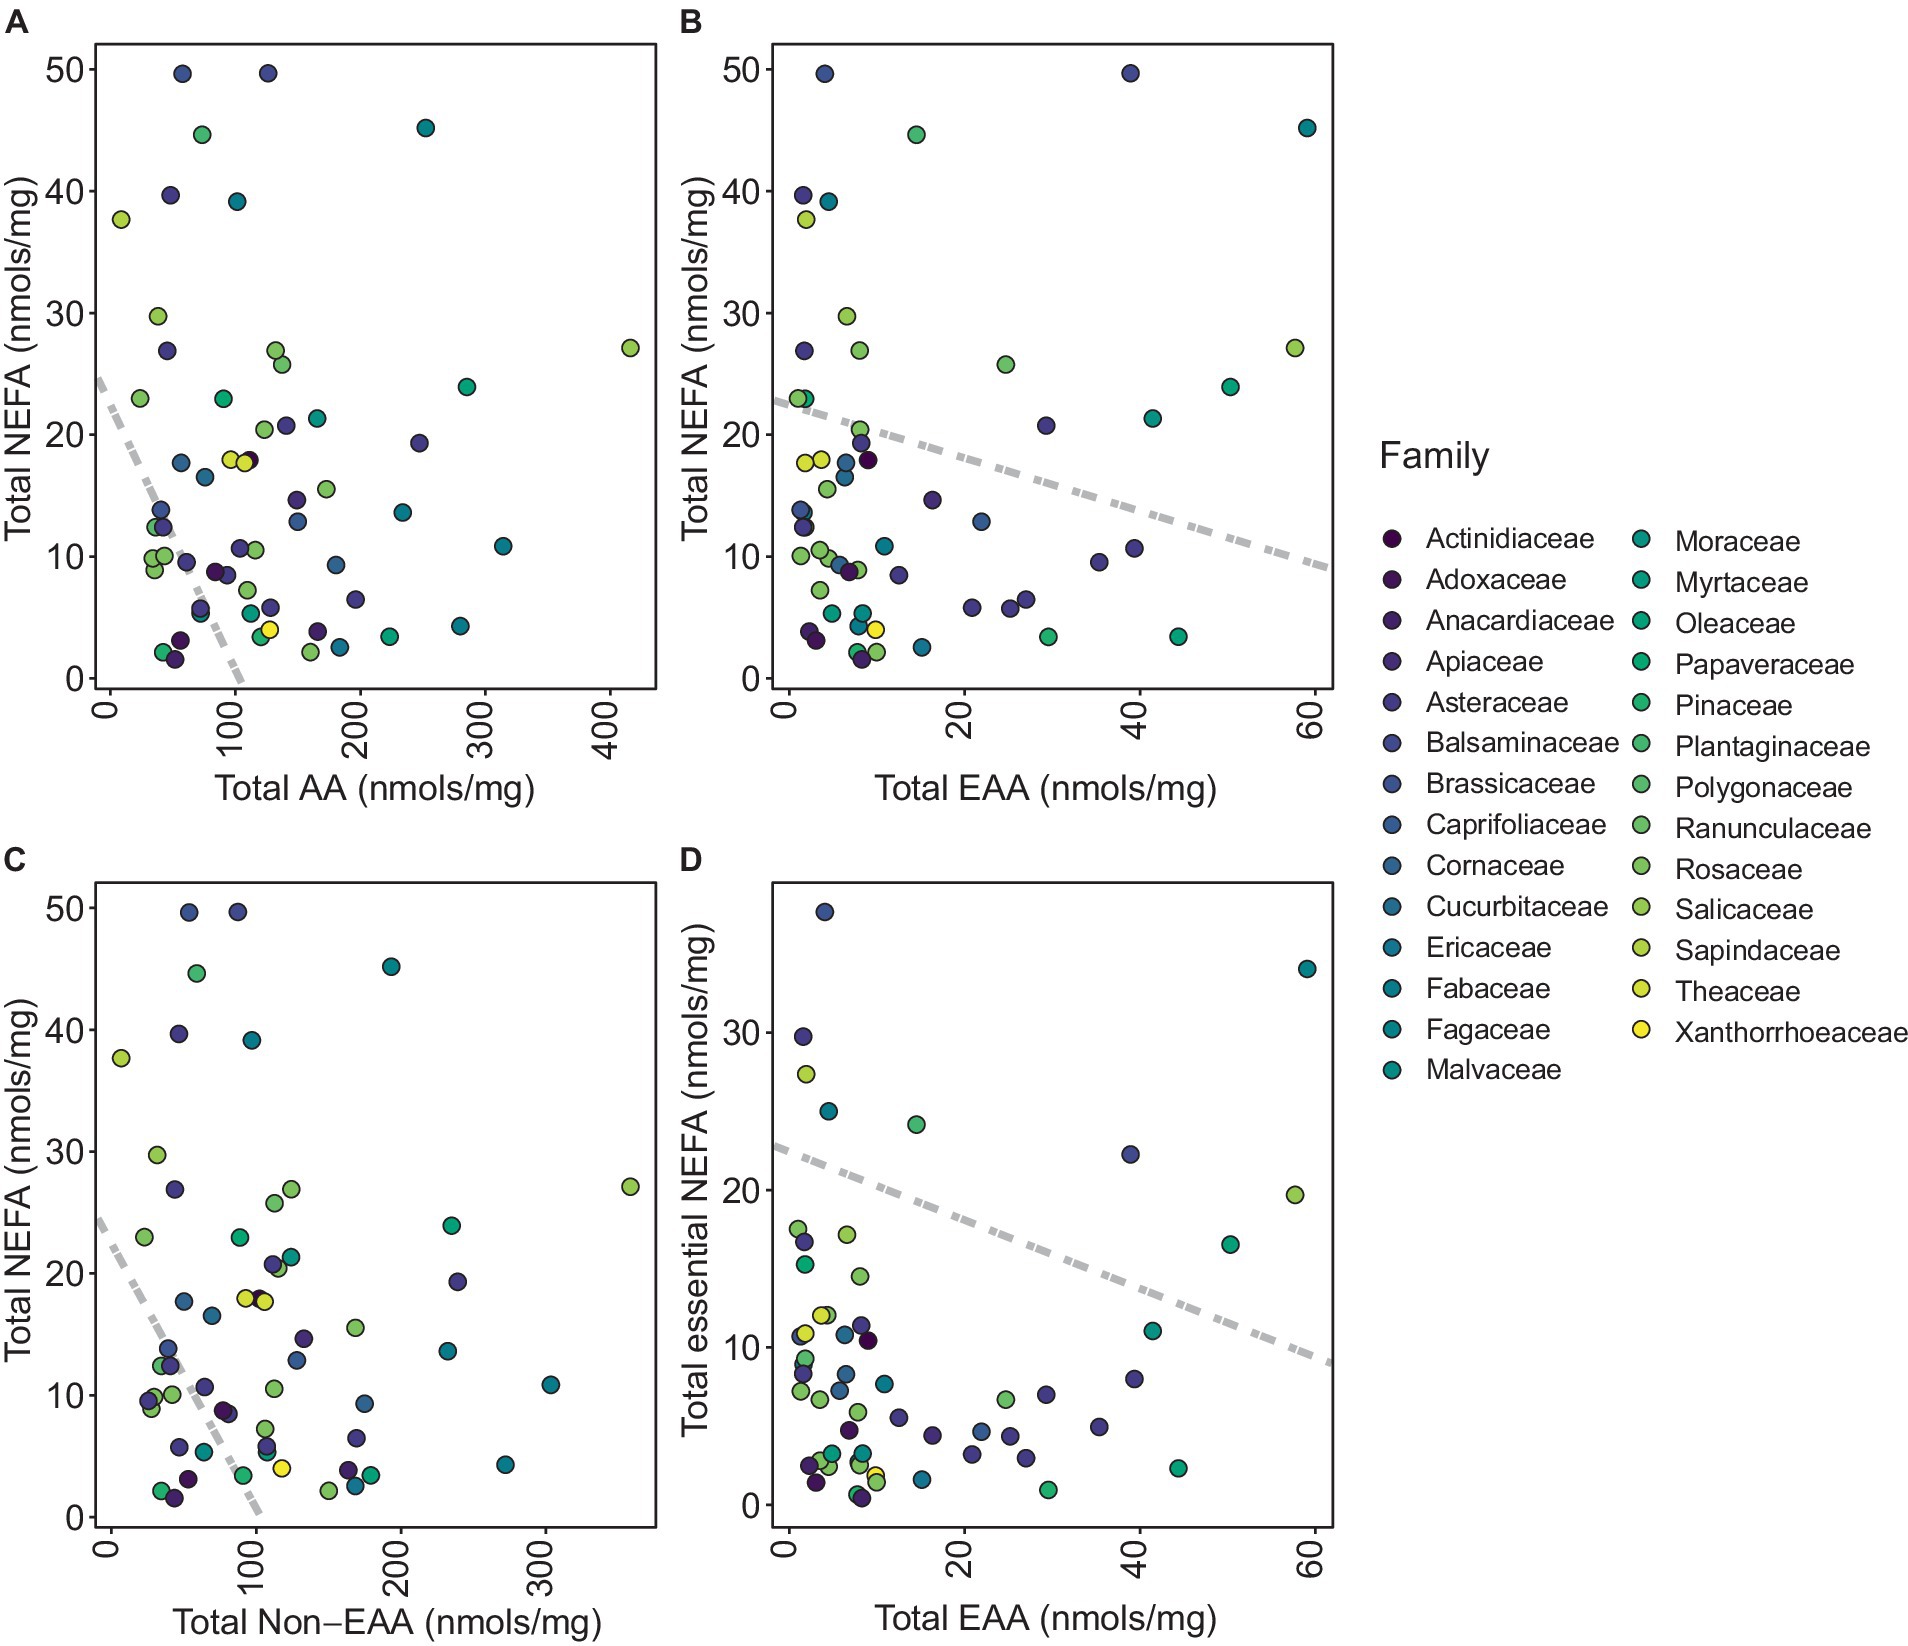
Figure 4. Phylogenetic generalized least square (PGLS) plots representing distribution of each pollen species per family. (A) Total non-esterified fatty acids (NEFA) against total amino acids (AA), (B) total NEFA against total essential amino acids (EAA), (C) total NEFA against total non-essential amino acids (NEAA), and (D) total essential NEFA (linoleic acid and linolenic acid) against total EAA.
Moreover, EAA exhibited a notable inverse correlation with NEFA (t-value = −4.25, df = 57, p < 0.0001), which suggests a concurrent increase in EAA content with a decrease in NEFA content (Figure 4B). The relationship between NEFA and NEAA was also negatively correlated (t-value = −7.52, df = 57, p < 0.0001), highlighting that an increase in NEAA corresponds with a reduction in NEFA (Figure 4C). Further analysis revealed a significant negative correlation between total omega fatty acids and EAA (t-value = −2.92, df = 57, p value = 0.0051), showing that an elevation in EAA is potentially linked with a decline in omega fatty acids within the species studied (Figure 4D).
The majority of pollen species exhibited a predominance of one of two AA: histidine or arginine (Figure 5; Supplementary Table S5). Our results indicated that Ranunculus acris presented the most similar alignment with honey bee dietary requirements, achieving the lowest Euclidean average similarity score of 12.66. This was closely followed by Actinidia arguta (13.36), Lotus corniculatus (13.56), Cornus sericea (14.54), Rosa multiflora (14.78), Rubus idaeus (15.12), Rosa virginiana (15.50), Hibiscus syriacus (17.04), Rhus typhina (18.29), and Viburnum opulus (18.63) comprising the top 10 plant species most aligned with the honey bees’ nutritional requirements.
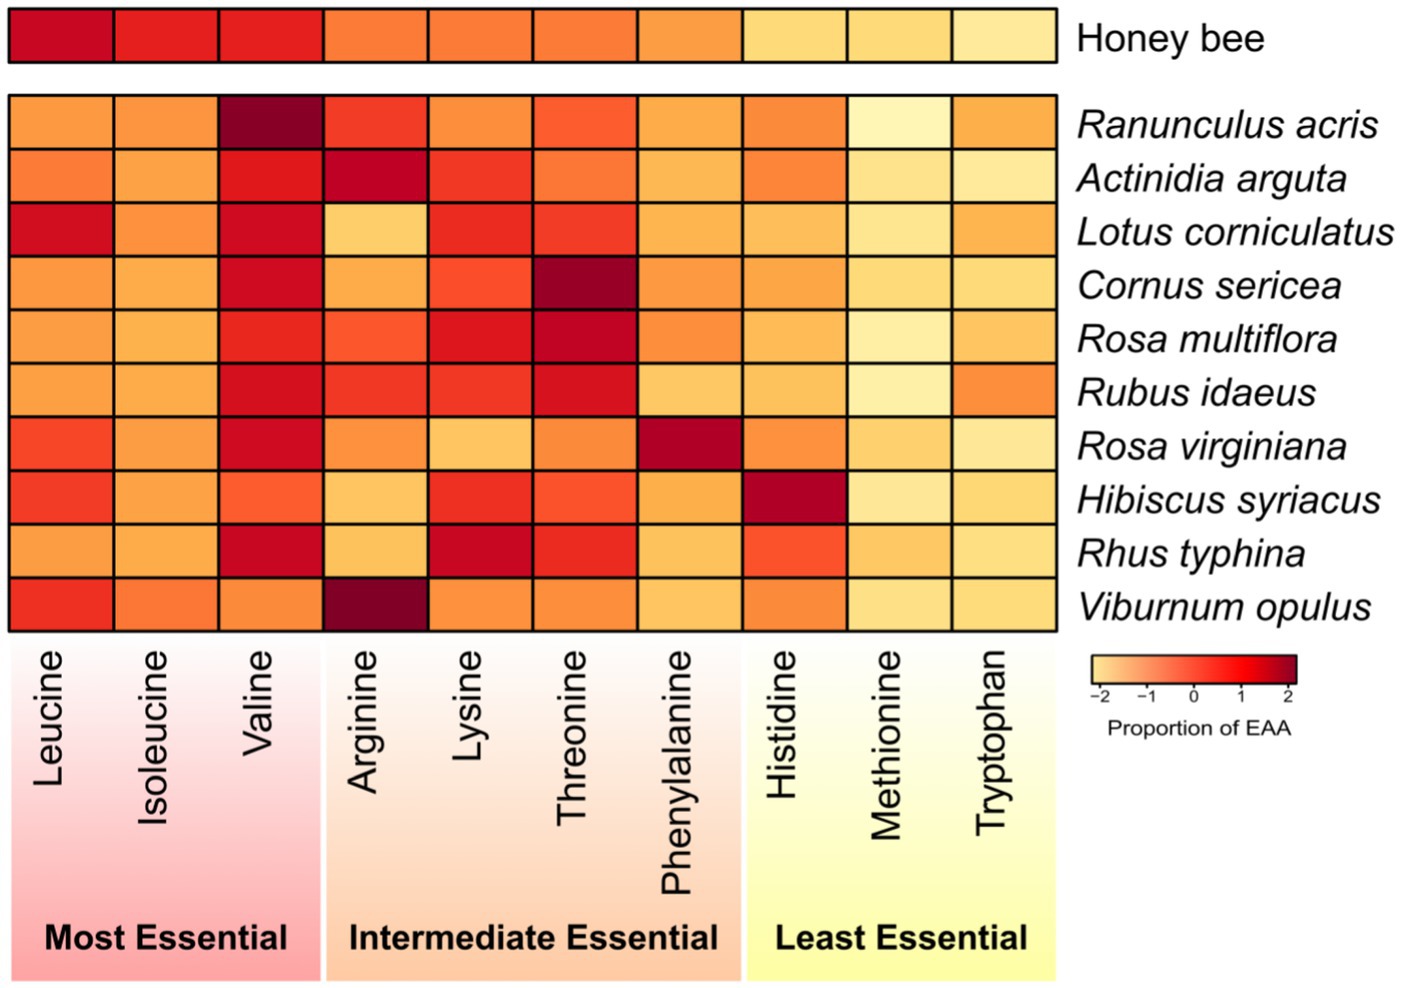
Figure 5. Heatmap representing the percentage composition of each essential amino acid (EAA) within different pollen species. Each color-coded square indicates the proportion of each AA relative to the total EAA present. The heatmap displays the percentage requirements of each EAA for honey bees as determined by de Groot (1953). The EAAs are arranged in descending order of their importance to honey bee nutrition, and the pollen species are ranked from the most beneficial to the least beneficial for honey bees based on Euclidean distances.
Across the focal 57 plant species, 30 (53%) are introduced and 27 (47%) are native to eastern North America (Supplementary Table S6). Average mean lipid content was not significantly different between introduced (16.02 μg/mg) and native (12.02 μg/mg) pollen species (t = 1.10, df = 25.5, p value = 0.28). For protein content, native species show a non-significantly higher average of 134.05 μg/mg compared to the 116.17 μg/mg in introduced species (t = −0.82, df = 30.15, p value = 0.42). Average P:L ratio was not significantly different between native and introduced pollen species, with a mean P:L ratio of 0.57 in native compared to 0.56 in introduced species (t = −0.30, df = 34.1, p value = 0.76). Additionally, native species have a mean total omega content of 6.81 nmols/mg, which is lower than the introduced species (8.79 nmols/mg), but non-significantly different (t = 1.03, df = 31.2, p value = 0.31). Overall, nutritional content did not statistically differ in pollen species based on endemicity.
Here we profiled the nutritional content of 57 pollen species to examine their value for bee health and long term conservation restoration initiatives. There was a consistent presence of five specific NEFAs across pollen species: linoleic (omega-6), linolenic (omega-3), oleic, palmitic, and palmitoleic acids. Notably, linolenic and linoleic acids, known for their roles in bee immune function and developmental support (Manning, 2001), were present and highly abundant across the majority of pollen species, with palmitic acid also commonly abundant across species. Further analysis revealed significant variability in the AA content among these species with all pollen samples containing EAA. However, the presence of arginine and histidine was notably predominant. Our findings also highlight extensive diversity in the P:L ratios, indicative of the vast range of P:L content among the different pollen species, a trait observed even within the same genus. This underscores the complexity of the nutritional landscape bees navigate and the diversity of plants required to meet pollinator dietary needs. We also note that there were no significant nutritional differences between the pollen nutritional profiles of native and introduced plant species. This suggests that wild bees, particularly generalist foragers, have the capacity to obtain their nutritional needs from an array of plant sources, regardless of the plant’s origin. Our findings indicates that several plant genera and families provide pollen with nutritional profiles that match the dietary requirements of honey bees, and potentially wild bees, though experimental research is much needed. This demonstrates the importance of diverse floral landscapes play in fulfilling the dietary needs of wild bees, which is imperative for sustaining ecological balance and supporting conservation efforts.
Non-esterified fatty acids support the complex dietary needs of pollinators. Pollen species typically comprised of 7–10 different NEFAs. Rhus glabra exhibited the lowest NEFA concentration, contrasting with the highest levels found in Impatiens capensis. Interestingly, specific fatty acids such as docosahexaenoic acid, eicosapentaenoic acid, and arachidonic acid were exclusive to a few species. Docosahexaenoic acid and eicosapentaenoic acid are omega-3 fatty acids that are important components in the diet of many animals, including bees (Arien et al., 2015). Although these fatty acids are rare in pollen, their presence significantly enhances its nutritional profile and can lead to improved cognitive abilities and overall health in pollinator species, marking them as key components in bee nutrition (Arien et al., 2015). The occasional presence of these omega-3 fatty acids in certain pollen types introduces diversity in nutritional content available to fulfill the dietary requirements of various pollinating species. Linolenic, palmitic, and linoleic acids were predominant across the majority of species analyzed. Omega-3 (linolenic acid) strengthens the immune response and supports the development of the nervous system in bees, both essential for effective foraging and navigation (Manning, 2001). Omega-6 fatty acids, particularly linoleic acid, have been directly linked to influencing key physiological processes in bees, including growth, reproduction, and larval development, thereby contributing to the colony’s health and resilience (Arien et al., 2020). An increase in dietary lipid levels was found to positively correlate with brood development, while imbalances in the omega-6:3 ratios are linked to decreased adult survival and impaired brood rearing (Arien et al., 2020). NEFA content did not show a uniform distribution among pollen species by plant family, except for some grouping within the Rosaceae based on total AA content. When assessing EAA content, both our results and those of Chau and Rehan (2024) indicate that pollen species within the Asteraceae are uniquely grouped, distinguishing them from other families. Similarly, distinct clusters were also observed in the Brassicaceae, and Fabaceae families. We found significant negative correlations between total NEFA and AA levels, suggesting that an increase in NEFA corresponds with a decrease in AA concentrations, a trend consistent for both EAA and NEAA contents. Furthermore, a significant inverse relationship was detected between total omega fatty acids and EAA, indicating that a rise in EAA may be associated with a decrease in omega fatty acid content within these pollen species. The contribution of various fatty acids to bee immune defense is well-documented, with stearic acid found in beeswax and pollen known to strengthen bee immune function (Alaux et al., 2010), and omega-3 fatty acids such as linolenic acid integral for the immune response and nervous system development in bees (Manning, 2001). Myristic acid is activates enzymes for immune responses, though its direct impact on immunity requires further investigation (Brodschneider and Crailsheim, 2010). Additionally, oleic acid is recognized for its anti-inflammatory and antimicrobial properties and may support bee health while serving as a natural hive preservative (Vaudo et al., 2016a).
All 10 EAAs were present across the examined pollen species, with the sole exception of smooth sumac (Rhus glabra) which lacked methionine. Methionine plays an essential role in the development of honey bee larvae, particularly during pupation and eclosion, and is an important l-methyl donor that influences caste differentiation in bee colonies, affecting the development of female larvae into worker bees (de Groot, 1953; Chen et al., 2021). Regardless, methionine was generally the least abundant EAA detected across all pollen species. Red oak (Quercus rubra) displayed the most diverse and abundant EAA profile. Among the subset of pollen species with an EAA concentration exceeding 20% of the total AA profile, those from the Asteraceae family stood out. Specifically, seven species within this family, including lanceleaf tickseed (Coreopsis lanceolata) and chicory (Cichorium intybus), demonstrated the highest EAA levels, exceeding 20% of the total AA content. This is consistent with previous research highlighting the Asteraceae family as a particularly rich source of EAAs for bees (Vaudo et al., 2015). The diverse array of Asteraceae species, many of which are bee-pollinated, likely contributes to this family’s prominence as a valuable nutritional resource for wild bee communities. Histidine was especially prevalent, constituting nearly 35% of the total AA profile in all pollen samples, followed by arginine, indicating the prominence of these AAs in bee nutrition. Nonetheless, methionine was consistently found in lower quantities relative to the other EAAs examined.
While our study found that Ranunculus acris pollen most closely matches the EAA needs of honey bees, no single pollen species was found to perfectly match honey bee nutritional EAA requirements. Rather, several pollen species portrayed EAA amounts conducive to honey bee EAA needs. This suggests that rather than seeking an optimal pollen source, a diversified approach incorporating a variety of plants is more beneficial for bee health. Future research should broadly profile the nutritional content of various plants, considering their availability across seasons and bees’ foraging preferences in different environments. It is also important to understand how diet variations affect bee resilience to challenges such as diseases and climate change, which will be pivotal in developing support strategies for bee populations, essential for both natural ecosystems and agriculture globally.
The NEAA proline emerged as the most prevalent metabolite across pollen species, often constituting over half of the total AA content. Proline serves as an alternative energy source for bees, especially during foraging activities (Jeannerod et al., 2022). Its presence in floral nectars enhances the attractiveness of these plants to various pollinators and may improve nectar’s nutritional quality (Carter et al., 2006). Diets high in proline have been linked to faster development rates in bee broods, suggesting that proline could reduce the time required for bees to reach maturity (Stec et al., 2021). Additionally, proline acts as a potent feeding stimulant, influencing honey bees’ dietary choices and contributing to key reproductive functions, such as egg-laying in queens (Bouchebti et al., 2022). The prevalence of proline in both pollen and nectar highlights its integral role in bee health and the broader pollination ecology.
This study reveals a complex balance between NEFAs and AAs within pollen nutrition, highlighting a trend where pollen types rich in NEFAs typically have lower levels of AAs. In contrast, pollen with a higher content of EAAs tends to have lower omega fatty acid concentrations. Hendriksma et al. (2019) support this finding, noting that while a diet high in lipids can boost brood production, an elevated omega-6:3 ratio may increase mortality and reduce brood rearing. This suggests that pollen with high NEFA levels, especially those with a skewed omega-6:3 ratio, may naturally adjust EAA levels to maintain an optimal nutritional profile for bee health. This balancing act is reflected in bee foraging behavior, where bees seem to preferentially select pollen with an optimized lipid composition, likely to support reproductive processes (Ruedenauer et al., 2020). Additionally, Arien et al. (2018) highlighted the importance of the omega-6:3 fatty acid ratio in bee diets, demonstrating that an imbalance in these essential lipids can affect not just bee health, but also their cognitive functions such as learning and memory. All studies highlight the diverse nutritional profiles across pollen species which emphasizes the need for varied floral diets. Such diversity is ideal for enhancing bee health and mitigating the effects of lipid overabundance, which is known to impair sensory acuity and alter foraging patterns detrimentally (Bennett et al., 2022).
We found a wide range of P:L and omega-6:3 ratios across the various pollen species. Incorporating data from Vaudo et al. (2024) revealed large P:L ratio differences even within the same genus. For instance, the highest P:L was in Prunus salicina (Vaudo et al., 2024) and the lowest was in another Prunus sp. (this study). The study by Vaudo et al. (2020) emphasizes that pollen P:L ratios can significantly guide the floral preferences of bees. Specifically, they found that bumble bees (Bombus impatiens) preferentially foraged on pollen with higher P:L ratios, as these macronutrient profiles better matched their nutritional requirements for growth, development, and colony fitness (Vaudo et al., 2016a). This suggests that bees may selectively forage on pollen that optimizes their nutritional intake. The wide variation in P:L and omega-6:3 ratios across pollen species, even within the same plant genus, illustrates the complex nutritional landscape that bees navigate. This diversity of pollen nutritional profiles likely enables bees, especially specialist species, to selectively forage on the resources that best meet their unique dietary requirements.
The top 10 pollen species from this study demonstrated that EAA ratios aligned with honey bee dietary needs vary considerably in their total lipid content, indicating that focusing exclusively on EAAs overlooks other important nutritional factors. This broader perspective is important for appreciating the complex dietary landscape bees encounter. Reinforcing these observations, Di Pasquale et al. (2013) found that while high EAA diets enhance certain developmental factors in bees, a diet balanced with NEAAs is essential for overall colony health and longevity, particularly as EAA dominance in pollen may elevate susceptibility to pathogens like the Nosema ceranae parasite. Together, these insights emphasize the complexity of bee nutrition, suggesting that multiple dietary components contribute to their health and colony sustainability.
While EAAs are essential for supporting larval growth and sustaining adult bees (Vaudo et al., 2016a,b), we should also consider the overall lipid profile. Our findings suggest that an optimal pollen diet for bees balances EAAs with a mix of lipids, maintaining an ideal omega-6:3 ratio close to 4:1 (Arien et al., 2020), and favorable P:L ratios, which range from 1:1 to 2:1 for honey bees (Vaudo et al., 2020). In this study, pollen species like Ranunculus acris, Actinidia arguta, Rosa sp. and Rubus idaeus all exhibited P:L ratios around 2.24, and are identified as particularly well-suited for wild bee nutrition. Similarly, Chau and Rehan (2024) found that pollen from Rosa sp., Trifolium sp., and Rubus idaeus were considered ideal for bumble bees and honey bees, with P:L ratios greater than 2:1 and EAA compositions similar to honey bee EAA requirements.
Our findings reveal that the nutritional content of pollen from both native and introduced plant species shows no significant differences, with marginally higher average omega fatty acid levels in introduced species. Average P:L ratios were also found to be consistent regardless of the plants’ endemicity status. Further analysis indicates that both native and introduced flora provide key lipids essential for bee development, with little difference in average lipid or protein content between them. This continuity in pollen nutrition regardless of endemicity demonstrates the remarkable potential for adaptability of pollinators to new and ever changing resources in their ecosystems. For instance, studies have shown that moderate levels of omega-3 polyunsaturated fatty acids (PUFAs), such as alpha-linolenic acid, can enhance immune function and longevity in honey bees (Arien et al., 2015). Additionally, omega-6 PUFAs like linoleic acid are essential for proper development and growth in bees (Vaudo et al., 2016b). Therefore, the slightly elevated omega fatty acid profiles observed in introduced plant species may actually expand the nutritional options available to native pollinators, provided the overall lipid composition remains balanced. The ability of bee species like the small carpenter bee (Ceratina calcarata) to adjust to varied dietary resources, such as foraging on clover (Trifolium sp.) despite its non-native origin, further highlights the resilience and flexibility of native pollinators given alternative food sources (Kooyers and Olsen, 2012; Lawson et al., 2020). However, this may be due to the polylectic nature of many native bees, whereas oligolectic bees are more limited in foraging resources. This continuity in pollen nutrition regardless of endemicity demonstrates the need to characterize foraging preferences and dietary requirements of wild bees more broadly to understand the adaptability of pollinators to new and native resources in their ecosystems.
The global decline of bee populations is an alarming issue, compounded by a multitude of stressors such as disease, climate change, parasites, poor nutrition, habitat destruction, and pesticide use (Klein et al., 2017; Cameron and Sadd, 2020). Endangered species, such as Bombus affinis and Bombus franklin as well as various solitary bees that have specialized plant dependencies, suggests a need for conservation measures (Strange and Tripodi, 2019; Graves et al., 2020; Kline and Joshi, 2020). A significant gap in our understanding lies in the inadequately studied dietary requirements of most bees species and nutritional profiles of many plant species for bee health (Kriesell et al., 2017). Effective conservation strategies must prioritize habitat restoration and the cultivation of diverse plant species, catering to the complex dietary requirements of bees (Brown and Paxton, 2009). Specifically, we recommend pollen species from roses (Rosa sp.), clovers (Trifolium sp.), red raspberry (Rubus idaeus), tall buttercup (Ranunculus acris), and Tara vine (Actinidia arguta) to be emphasized in wild flower restoration projects based on their ideal P:L ratios for wild bee nutrition. Our study reinforces this need, highlighting the role that varied pollen sources and diverse floral landscapes play in ensuring the nutritional welfare of pollinators. This diversity is essential for sustaining ecological balance and supporting robust plant-pollinator interactions, which are fundamental to the well-being of ecosystems.
The original contributions presented in the study are included in the article/Supplementary material; further inquiries can be directed to the corresponding author.
KS: Data curation, Formal analysis, Investigation, Methodology, Visualization, Writing – original draft. KC: Data curation, Formal analysis, Investigation, Methodology, Validation, Visualization, Writing – review & editing. SR: Conceptualization, Funding acquisition, Project administration, Resources, Supervision, Writing – review & editing.
The author(s) declare that financial support was received for the research, authorship, and/or publication of this article. Funding was provided by the Weston Family Foundation, an NSERC Discovery Grant and supplements to SR.
We thank Farida Samad-zada, Makaylee Crone, Phuong Nguyen, Anthony Ayers, and Changseng Ma for assistance with pollen sample collection and extractions.
The authors declare that the research was conducted in the absence of any commercial or financial relationships that could be construed as a potential conflict of interest.
All claims expressed in this article are solely those of the authors and do not necessarily represent those of their affiliated organizations, or those of the publisher, the editors and the reviewers. Any product that may be evaluated in this article, or claim that may be made by its manufacturer, is not guaranteed or endorsed by the publisher.
The Supplementary material for this article can be found online at: https://www.frontiersin.org/articles/10.3389/fsufs.2024.1411410/full#supplementary-material
SUPPLEMENTARY FIGURE S1 | Non-metric dimensional scale (NMDS) plots representing the distribution of each pollen species per family including Vaudo et al. (2024).
SUPPLEMENTARY FIGURE S2 | Scatterplot of pollen protein and lipid concentrations (μg/mg) including Vaudo et al. (2024) data. Each point corresponds to a specific pollen species, with the color of the marker varying according to the plant family. Gray lines indicate P:L ratios and range from low to high moving left to right.
Alaux, C., Ducloz, F., Crauser, D., and Le Conte, Y. (2010). Diet effects on honeybee immunocompetence. Biol. Lett. 6, 562–565. doi: 10.1098/rsbl.2009.0986
Arien, Y., Dag, A., and Shafir, S. (2018). Omega-6:3 ratio more than absolute lipid level in diet affects associative learning in honey bees. Front. Psychol. 9:1001. doi: 10.3389/fpsyg.2018.01001
Arien, Y., Dag, A., Yona, S., Tietel, Z., Lapidot Cohen, T., and Shafir, S. (2020). Effect of diet lipids and omega-6:3 ratio on honey bee brood development, adult survival and body composition. J. Insect Physiol. 124:104074. doi: 10.1016/j.jinsphys.2020.104074
Arien, Y., Dag, A., Zarchin, S., Masci, T., and Shafir, S. (2015). Omega-3 deficiency impairs honey bee learning. Proc. Natl. Acad. Sci. 112, 15761–15766. doi: 10.1073/pnas.1517375112
Barraud, A., Barascou, L., Lefebvre, V., Sene, D., Le Conte, Y., Alaux, C., et al. (2022). Variations in nutritional requirements across bee species. Front. Sustain. Food Syst. 6:824750. doi: 10.3389/fsufs.2022.824750
Bennett, M. M., Welchert, A. C., Carroll, M., Shafir, S., Smith, B. H., and Corby-Harris, V. (2022). Unbalanced fatty acid diets impair discrimination ability of honey bee workers to damaged and healthy brood odors. J. Exp. Biol. 225:jeb244103. doi: 10.1242/jeb.244103
Bernhardt, P., and Thien, L. B. (1987). Self-isolation and insect pollination in the primitive angiosperms: New evaluations of older hypotheses. Plant Syst. Evol. 156, 159–176. doi: 10.1007/BF00936071
Blüthgen, N., and Klein, A.-M. (2011). Functional complementarity and specialisation: The role of biodiversity in plant–pollinator interactions. Basic Appl. Ecol. 12, 282–291. doi: 10.1016/j.baae.2010.11.001
Bouchebti, S., Wright, G. A., and Shafir, S. (2022). Macronutrient balance has opposing effects on cognition and survival in honey bees. Funct. Ecol. 36, 2558–2568. doi: 10.1111/1365-2435.14143
Brodschneider, R., and Crailsheim, K. (2010). Nutrition and health in honey bees. Apidologie 41, 278–294. doi: 10.1051/apido/2010012
Brown, M. J. F., and Paxton, R. J. (2009). The conservation of bees: a global perspective. Apidologie 40, 410–416. doi: 10.1051/apido/2009019
Cameron, S. A., and Sadd, B. M. (2020). Global trends in bumble bee health. Annu. Rev. Entomol. 65, 209–232. doi: 10.1146/annurev-ento-011118-111847
Carter, C., Shafir, S., Yehonatan, L., Palmer, R. G., and Thornburg, R. (2006). A novel role for proline in plant floral nectars. Naturwissenschaften 93, 72–79. doi: 10.1007/s00114-005-0062-1
Česonienė, L., Daubaras, R., Venclovienė, J., and Viškelis, P. (2010). Biochemical and agro-biological diversity of Viburnum opulus genotypes. Central Eur. J. Biol. 5, 864–871. doi: 10.2478/s11535-010-0088-z
Chau, K. D., and Rehan, S. M. (2024). Nutritional profiling of common eastern North American pollen species with implications for bee diet and pollinator health. Apidologie 55:9. doi: 10.1007/s13592-023-01054-4
Chen, W., Wang, Y., Zhang, W., Liu, Z., Xu, B., and Wang, H. (2021). Methionine as a methyl donor regulates caste differentiation in the European honey bee (Apis mellifera). Insect Sci. 28, 746–756. doi: 10.1111/1744-7917.12788
Cook, S. M., Awmack, C. S., Murray, D. A., and Williams, I. H. (2003). Are honey bees’ foraging preferences affected by pollen amino acid composition? Ecol. Entomol. 28, 622–627. doi: 10.1046/j.1365-2311.2003.00548.x
Crone, M. K., Biddinger, D. J., and Grozinger, C. M. (2022). Wild bee nutritional ecology: Integrative strategies to assess foraging preferences and nutritional requirements. Front. Sustain. Food Syst. 6:847003. doi: 10.3389/fsufs.2022.847003
Crone, M. K., and Grozinger, C. M. (2021). Pollen protein and lipid content influence resilience to insecticides in honey bees (Apis mellifera). J. Exp. Biol. 224:jeb.242040. doi: 10.1242/jeb.242040
Dafni, A., and Kevan, P. G. (1997). Flower size and shape: implications in pollination. Israel J. Plant Sci. 45, 201–211. doi: 10.1080/07929978.1997.10676684
de Groot, A. P. (1953). Amino acid requirements for growth of the honeybee (Apis mellifera L.). Experientia 8, 192–194. doi: 10.1007/BF02173740
Di Pasquale, G., Salignon, M., Le Conte, Y., Belzunces, L. P., Decourtye, A., Kretzschmar, A., et al. (2013). Influence of pollen nutrition on honey bee health: Do pollen quality and diversity matter? PLoS One 8:e72016. doi: 10.1371/journal.pone.0072016
Filipiak, M. (2018). A better understanding of bee nutritional ecology is needed to optimize conservation strategies for wild bees—the application of ecological stoichiometry. Insects 9:85. doi: 10.3390/insects9030085
Gage, S. L., Calle, S., Jacobson, N., Carroll, M., and DeGrandi-Hoffman, G. (2020). Pollen alters amino acid levels in the honey bee brain and this relationship changes with age and parasitic stress. Front. Neurosci. 14:231. doi: 10.3389/fnins.2020.00231
Ghosh, S., Wang, Y., and Jung, C. (2023). Editorial: Nutritional ecology of wild and managed bees. Front. Ecol. Evol. 11:1223769. doi: 10.3389/fevo.2023.1223769
Gómez-Martínez, C., González-Estévez, M. A., Cursach, J., and Lázaro, A. (2022). Pollinator richness, pollination networks, and diet adjustment along local and landscape gradients of resource diversity. Ecol. Appl. 32:e2634. doi: 10.1002/eap.2634
Goulson, D., Lye, G. C., and Darvill, B. (2008). Decline and conservation of bumble bees. Annu. Rev. Entomol. 53, 191–208. doi: 10.1146/annurev.ento.53.103106.093454
Goulson, D., Nicholls, E., Botías, C., and Rotheray, E. L. (2015). Bee declines driven by combined stress from parasites, pesticides, and lack of flowers. Science 347:1255957. doi: 10.1126/science.1255957
Graves, T. A., Janousek, W. M., Gaulke, S. M., Nicholas, A. C., Keinath, D. A., Bell, C. M., et al. (2020). Western bumble bee: declines in the continental United States and range-wide information gaps. Ecosphere 11:e03141. doi: 10.1002/ecs2.3141
Hendriksma, H. P., Pachow, C. D., and Nieh, J. C. (2019). Effects of essential amino acid supplementation to promote honey bee gland and muscle development in cages and colonies. J. Insect Physiol. 117:103906. doi: 10.1016/j.jinsphys.2019.103906
Hoang, D. T., Chernomor, O., von Haeseler, A., Minh, B. Q., and Vinh, L. S. (2018). UFBoot2: Improving the ultrafast bootstrap approximation. Mol. Biol. Evol. 35, 518–522. doi: 10.1093/molbev/msx281
Hsu, P.-S., Wu, T.-H., Huang, M.-Y., Wang, D.-Y., and Wu, M.-C. (2021). Nutritive value of 11 bee pollen samples from major floral sources in Taiwan. Food Secur. 10:2229. doi: 10.3390/foods10092229
Janz, N., and Nylin, S. (2008). “The oscillation hypothesis of host-plant range and speciation” in Specialization, Speciation, and Radiation. The Evolutionary Biology of Herbivorous Insects. Ed. K. Tilmon (California, US: University of California Press), 203–215.
Jeannerod, L., Carlier, A., Schatz, B., Daise, C., Richel, A., Agnan, Y., et al. (2022). Some bee-pollinated plants provide nutritionally incomplete pollen amino acid resources to their pollinators. PLoS One 17:e0269992. doi: 10.1371/journal.pone.0269992
Johnson, S. D. (2010). The pollination niche and its role in the diversification and maintenance of the southern African flora. Philos. Trans. Roy. Soc. B. Biol. Sci. 365, 499–516. doi: 10.1098/rstb.2009.0243
Kaplan, M., Karaoglu, Ö., Eroglu, N., and Silici, S. (2016). Fatty acids and proximate composition of beebread. Food Technol. Biotechnol. 54, 497–504. doi: 10.17113/ftb.54.04.16.4635
Khalifa, S. A. M., Elshafiey, E. H., Shetaia, A. A., El-Wahed, A. A. A., Algethami, A. F., Musharraf, S. G., et al. (2021). Overview of bee pollination and its economic value for crop production. Insects 12:688. doi: 10.3390/insects12080688
Kim, S., Chen, J., Cheng, T., Gindulyte, A., He, J., He, S., et al. (2023). PubChem 2023 update. Nucleic Acids 51, D1373–D1380. doi: 10.1093/nar/gkac956
Kleijn, D., Winfree, R., Bartomeus, I., Carvalheiro, L. G., Henry, M., Isaacs, R., et al. (2015). Delivery of crop pollination services is an insufficient argument for wild pollinator conservation. Nat. Commun. 6:7414. doi: 10.1038/ncomms8414
Klein, S., Cabirol, A., Devaud, J.-M., Barron, A. B., and Lihoreau, M. (2017). Why bees are so vulnerable to environmental stressors. Trends Ecol. Evol. 32, 268–278. doi: 10.1016/j.tree.2016.12.009
Kline, O., and Joshi, N. K. (2020). Mitigating the effects of habitat loss on solitary bees in agricultural ecosystems. Agriculture 10:115. doi: 10.3390/agriculture10040115
Kooyers, N. J., and Olsen, K. M. (2012). Rapid evolution of an adaptive cyanogenesis cline in introduced North American white clover (Trifolium repens L.). Mol. Ecol. 21, 2455–2468. doi: 10.1111/j.1365-294X.2012.05486.x
Kriesell, L., Hilpert, A., and Leonhardt, S. D. (2017). Different but the same: bumblebee species collect pollen of different plant sources but similar amino acid profiles. Apidologie 48, 102–116. doi: 10.1007/s13592-016-0454-6
Lanza, I. R., Zhang, S., Ward, L. E., Karakelides, H., Raftery, D., and Nair, K. S. (2010). Quantitative metabolomics by 1H-NMR and LC-MS/MS confirms altered metabolic pathways in diabetes. PLoS One 5:e10538. doi: 10.1371/journal.pone.0010538
Lawson, S. P., Kennedy, K. B., and Rehan, S. M. (2020). Pollen composition significantly impacts the development and survival of the native small carpenter bee, Ceratina calcarata. Ecol. Entomol. 46, 232–239. doi: 10.1111/een.12955
Leonhardt, S. D., Schmitt, T., and Blüthgen, N. (2011). Tree resin composition, collection behavior and selective filters shape chemical profiles of tropical bees (Apidae: Meliponini). PLoS One 6:e23445. doi: 10.1371/journal.pone.0023445
Li, H.-T., Luo, Y., Gan, L., Ma, P.-F., Gao, L.-M., Yang, J.-B., et al. (2021). Plastid phylogenomic insights into relationships of all flowering plant families. BMC Biol. 19:232. doi: 10.1186/s12915-021-01166-2
Maddison, W.P., and Maddison, D.R. (2021). Mesquite: a modular system for evolutionary analysis. Version 3:70.
Manning, R. (2001). Fatty acids in pollen: a review of their importance for honey bees. Bee World 82, 60–75. doi: 10.1080/0005772X.2001.11099504
Mariotti, F. (2017). “Plant protein, animal protein, and protein quality” in Vegetarian and Plant-Based Diets in Health and Disease Prevention. Ed. F. Marioti (Elsevier), 621–642.
Mitchell, R. J., Irwin, R. E., Flanagan, R. J., and Karron, J. D. (2009). Ecology and evolution of plant–pollinator interactions. Ann. Bot. 103, 1355–1363. doi: 10.1093/aob/mcp122
Nguyen, L.-T., Schmidt, H. A., Von Haeseler, A., and Minh, B. Q. (2015). IQ-TREE: A fast and effective stochastic algorithm for estimating maximum-likelihood phylogenies. Mol. Biol. Evol. 32, 268–274. doi: 10.1093/molbev/msu300
Nicolson, S. W. (2011). Bee food: the chemistry and nutritional value of nectar, pollen and mixtures of the two. Afr. Zool. 46, 197–204. doi: 10.1080/15627020.2011.11407495
Oksanen, F.J., Simpson, G.L, and Blanchet, F.G. (2017). Vegan: community ecology package. R package Version 2.4-3.
Persson, X.-M. T., Błachnio-Zabielska, A. U., and Jensen, M. D. (2010). Rapid measurement of plasma free fatty acid concentration and isotopic enrichment using LC/MS. J. Lipid Res. 51, 2761–2765. doi: 10.1194/jlr.M008011
Pinheiro, J., and Bates, D.MR Core Team. (2023). nlme: linear and nonlinear mixed effects models. R package version 3.1–162.
Pocius, V. M., Cibotti, S., Ray, S., Ankoma-Darko, O., McCartney, N. B., Schilder, R. J., et al. (2022). Impacts of larval host plant species on dispersal traits and free-flight energetics of adult butterflies. Commun. Biol. 5:469. doi: 10.1038/s42003-022-03396-8
Potts, S. G., Biesmeijer, J. C., Kremen, C., Neumann, P., Schweiger, O., and Kunin, W. E. (2010). Global pollinator declines: trends, impacts and drivers. Trends Ecol. Evol. 25, 345–353. doi: 10.1016/j.tree.2010.01.007
Potts, S. G., Imperatriz-Fonseca, V., Ngo, H. T., Aizen, M. A., Biesmeijer, J. C., Breeze, T. D., et al. (2016). Safeguarding pollinators and their values to human well-being. Nature 540, 220–229. doi: 10.1038/nature20588
R Core Team (2022). R: language and environment for statistical computing. R Foundation for Statistical Computing, Vienna, Austria.
Reilly, J. R., Artz, D. R., Biddinger, D., Bobiwash, K., Boyle, N. K., Brittain, C., et al. (2020). Crop production in the USA is frequently limited by a lack of pollinators. Proc. R. Soc. B 287:20200922. doi: 10.1098/rspb.2020.0922
Ruedenauer, F. A., Biewer, N. W., Nebauer, C. A., Scheiner, M., Spaethe, J., and Leonhardt, S. D. (2021). Honey bees can taste amino and fatty acids in pollen, but not sterols. Front. Ecol. Evol. 9:684175. doi: 10.3389/fevo.2021.684175
Ruedenauer, F. A., Raubenheimer, D., Kessner-Beierlein, D., Grund-Mueller, N., Noack, L., Spaethe, J., et al. (2020). Best be(e) on low fat: linking nutrient perception, regulation and fitness. Ecol. Lett. 23, 545–554. doi: 10.1111/ele.13454
Russell, A. L., Golden, R. E., Leonard, A. S., and Papaj, D. R. (2016). Bees learn preferences for plant species that offer only pollen as a reward. Behav. Ecol. 27, 731–740. doi: 10.1093/beheco/arv213
Sedivy, C., Müller, A., and Dorn, S. (2011). Closely related pollen generalist bees differ in their ability to develop on the same pollen diet: evidence for physiological adaptations to digest pollen. Funct. Ecol. 25, 718–725. doi: 10.1111/j.1365-2435.2010.01828.x
Stec, N., Saleem, A., and Darveau, C. A. (2021). Proline as a sparker metabolite of oxidative metabolism during the flight of the bumblebee. Metabolites 11:511. doi: 10.3390/metabo11080511
Stewart-Wade, S. M., Neumann, S., Collins, L. L., and Boland, G. J. (2002). The biology of Canadian weeds. 117. Taraxacum officinale G. H. Weber ex Wiggers. Can. J. Plant Sci. 82, 825–853. doi: 10.4141/P01-010
Strange, J. P., and Tripodi, A. D. (2019). Characterizing bumble bee (Bombus) communities in the United States and assessing a conservation monitoring method. Ecol. Evol. 9, 1061–1069. doi: 10.1002/ece3.4783
Taha, E.-K. A., Al-Kahtani, S., and Taha, R. (2019). Protein content and amino acids composition of bee-pollens from major floral sources in Al-Ahsa, eastern Saudi Arabia. Saudi J. Biol. Sci. 26, 232–237. doi: 10.1016/j.sjbs.2017.06.003
Tan, W.-H., Tao, L., Hoang, K. M., Hunter, M. D., and de Roode, J. C. (2018). The effects of milkweed induced defense on parasite resistance in monarch butterflies, Danaus plexippus. J. Chem. Ecol. 44, 1040–1044. doi: 10.1007/s10886-018-1007-4
USDA and NRCS (2024). The PLANTS Database (http://plants.usda.gov, 02/05/2024). National Plant Data Team, Greensboro, NC, United States.
Vaudo, A. D., Dyer, L. A., and Leonard, A. S. (2024). Pollen nutrition structures bee and plant community interactions. Proc. Natl. Acad. Sci. USA 121:e2317228120. doi: 10.1073/pnas.2317228120
Vaudo, A. D., Patch, H. M., Mortensen, D. A., Tooker, J. F., and Grozinger, C. M. (2016a). Macronutrient ratios in pollen shape bumble bee (Bombus impatiens) foraging strategies and floral preferences. Proc. Natl. Acad. Sci. 113, E4035–E4042. doi: 10.1073/pnas.1606101113
Vaudo, A. D., Stabler, D., Patch, H. M., Tooker, J. F., Grozinger, C. M., and Wright, G. A. (2016b). Bumble bees regulate their intake of the essential protein and lipid pollen macronutrients. J. Exp. Biol. 219, 3962–3970. doi: 10.1242/jeb.140772
Vaudo, A. D., Tooker, J. F., Grozinger, C. M., and Patch, H. M. (2015). Bee nutrition and floral resource restoration. Curr. Opin. Insect Sci. 10, 133–141. doi: 10.1016/j.cois.2015.05.008
Vaudo, A. D., Tooker, J. F., Patch, H. M., Biddinger, D. J., Coccia, M., Crone, M. K., et al. (2020). Pollen protein: lipid macronutrient ratios may guide broad patterns of bee species floral preferences. Insects 11:132. doi: 10.3390/insects11020132
Weeks, E. N. I., Schmehl, D. R., Baniszewski, J., Tomé, H. V. V., Cuda, J. P., Ellis, J. D., et al. (2018). Safety of methionine, a novel biopesticide, to adult and larval honey bees (Apis mellifera L.). Ecotoxicol. Environ. Saf. 149, 211–216. doi: 10.1016/j.ecoenv.2017.11.026
Williams, N. M. (2003). Use of novel pollen species by specialist and generalist solitary bees (Hymenoptera: Megachilidae). Oecologia 134, 228–237. doi: 10.1007/s00442-002-1104-4
Winfree, R., Bartomeus, I., and Cariveau, D. P. (2011). Native pollinators in anthropogenic habitats. Annu. Rev. Ecol. Evol. Syst. 42, 1–22. doi: 10.1146/annurev-ecolsys-102710-145042
Keywords: nutritional ecology, pollen nutrition, amino acids, fatty acids, pollinator diet, bee health
Citation: Stephen KW, Chau KD and Rehan SM (2024) Dietary foundations for pollinators: nutritional profiling of plants for bee health. Front. Sustain. Food Syst. 8:1411410. doi: 10.3389/fsufs.2024.1411410
Edited by:
Daniel Paredes, University of Extremadura, SpainReviewed by:
Jelena Savić, University of Belgrade, SerbiaCopyright © 2024 Stephen, Chau and Rehan. This is an open-access article distributed under the terms of the Creative Commons Attribution License (CC BY). The use, distribution or reproduction in other forums is permitted, provided the original author(s) and the copyright owner(s) are credited and that the original publication in this journal is cited, in accordance with accepted academic practice. No use, distribution or reproduction is permitted which does not comply with these terms.
*Correspondence: Sandra M. Rehan, c2FuZHJhLnJlaGFuQGdtYWlsLmNvbQ==
Disclaimer: All claims expressed in this article are solely those of the authors and do not necessarily represent those of their affiliated organizations, or those of the publisher, the editors and the reviewers. Any product that may be evaluated in this article or claim that may be made by its manufacturer is not guaranteed or endorsed by the publisher.
Research integrity at Frontiers
Learn more about the work of our research integrity team to safeguard the quality of each article we publish.