 Christophe Béné1,2*
 Christine Kiria Chege3
 Brice Even4
 Ricardo A. Hernandez4
 Mark Lundy1Steven D. Prager1,5
 Jennifer Wiegel6
- 1International Center for Tropical Agriculture (CIAT), Cali, Colombia
- 2Wageningen Economic Group, Wageningen University, Wageningen, Netherlands
- 3International Center for Tropical Agriculture, Nairobi, Kenya
- 4International Center for Tropical Agriculture (CIAT), Hanoi, Vietnam
- 5Bill & Melinda Gates Foundation, Washington, DC, United States
- 6International Center for Tropical Agriculture, Managua, Nicaragua
In recent years, numerous examples of food system dashboards have been developed with the goal of offering users the opportunity to monitor or assess (their) national food systems. One of the many challenges faced by these initiatives has been to strike an acceptable balance between the complexity, local-specificity, and multi-sectoral nature of these food systems while also ensuring that the information remains accessible and usable for decision-makers. Perhaps even more critical, yet rarely discussed or implemented in most of the current food system dashboard initiatives, is the imperative of co-constructing these initiatives with local stakeholders. The case presented in this study puts participation at the center of the design and construction of a food systems’ monitoring dashboard. Using a replicable yet rigorous methodology, we demonstrate the feasibility of co-creating food system dashboards that integrate comprehensive and multi-sectoral inputs from national stakeholders while ensuring these dashboards are functional, evidence-based, and reflective of the country’s specific features. The approach is illustrated with the empirical cases of three pilot countries within the low-and middle-income countries group (Bangladesh, Ethiopia, and Honduras), where the methodology was tested between 2021 and 2022. We conclude by succinctly examining the ongoing challenges in constructing actionable food system dashboards.
Introduction
Food systems need to transform to reduce their impacts on human health and the environment while improving their social performances and resilience in the face of growing disturbances from geo-political instability and climate change (FAO et al., 2021). Food systems, however, are complex, involving multiple actors, and their societal and environmental outcomes are multi-faceted. As a result, it is often difficult to get a clear understanding of how and where to intervene to address specific challenges and improve (or restore) the overall sustainability of these systems (Zhou et al., 2022; Béné and Devereux, 2023).
In order to make appropriate decisions or investments, policy-makers need information on the current state of food systems and how these relate to and impact food security, nutrition, economic development, social equity, and environmental outcomes. In short, there is a critical need for diagnostic and monitoring tools to strengthen the overall sustainability of food systems and improve their outcomes (Fanzo et al., 2021). Partly responding to this need, a flurry of initiatives has emerged nationally and/or internationally, proposing to create multi-indicator compendiums and dashboards to monitor and assess food systems more comprehensively (Melesse et al., 2020; Zhou et al., 2022). Among these initiatives (but not limited to them) are the RUAF/FAO City Region Food Systems (Carey and Dubbeling, 2017); the GAIN-JHU dashboard (Fanzo et al., 2020); the WFP Hunger Map Live dashboard (WFP, n.d.); the Countdown Initiative (Fanzo et al., 2021); the Solomon Island dashboard (Farmery et al., 2023); the FoodShift 2030 (Chaido Anthouli et al., 2022); the Global Food Security Index (The Economist Intelligence Unit, 2021); the Global System Sustainability Index (Béné et al., 2022); or the Food Systems Analysis Toolkit (The Rockefeller Foundation, 2023).
Although noble in their intention, many of those dashboards are comprised of 50 or more indicators—sometimes as many as 200—overwhelming non-expert decision-makers with information overload and offering little guidance about what to look at and what to use. While there is clearly an urgent need to provide decision-makers with integrated diagnosis tools and holistic assessments, there is also a need to simplify the complexity that characterizes food systems and their multi-dimensionality and to reduce or keep the number of indicators manageable. Adding to these challenges is the extra tension created by the need to capture the local and country-specific context of food systems and, on the other hand, to operate under a protocol that is clear, transparent, and reproducible so as to be able to compare food systems’ performances across countries/regions and time and, in doing so, to learn from these comparative/multi-country analyses (Béné et al., 2019). In sum, there is a need to find a “perfect middle ground” whereby the complex, dynamic, multi-sectoral, and multi-actor nature of food systems is captured but boiled down to a handful of key indicators that help prioritize entry points for interventions. This can be seen as having to operate at the nexus created by four requirements: (1) data- and evidence-based assessments, (2) simplified food system information, (3) rigorous comparisons, and (4) local and country specificities.
In addition to this nexus, a critical element rarely discussed in current dashboard initiatives is the co-construction process, which should, ideally, underpin the entire approach. Surprisingly, many of the existing dashboards/compendiums have been designed and built by groups of international experts “behind closed doors” with no or very limited input from national stakeholders. This is the case with the Global Food Security Index (The Economist Intelligence Unit, 2021), the WFP Hunger Map Live dashboard (WFP, n.d.), the GAIN-JHU dashboard (Fanzo et al., 2020), the Food Systems Analysis Toolkit (The Rockefeller Foundation, 2023), or the Global System Sustainability Index (Béné et al., 2019, 2022). In some cases, regional consultations have been organized to validate the initiative or to comment on the choice of the proposed indicators, e.g., the Countdown Initiative (Fanzo et al., 2021). In most cases, however, these inputs are peripheral to the main effort and not systematically integrated as a central part of the process. In this paper, we argue that the non-participatory nature of these tools reduces their relevance and limits their uptake by those for whom they were initially designed—country decision-makers.
The case presented in this paper inverts the top-down approach adopted in many of these endeavors. It puts participation at the center of the design and construction of food systems’ dashboards. Research practice, funding agencies, and global science organizations have long recognized that research aimed at addressing sustainability and societal challenges is most effective when “co-produced” by academics and non-academics together (Volkery et al., 2008; Mauser et al., 2013; Karlsson et al., 2018; Nature Editorial, 2018; Norström et al., 2020). Examples include the strategic plans for sustainability research in countries such as Switzerland, Australia, the United Kingdom, and Germany (Norström et al., 2020); the decadal strategic plan of the US Global Change Research Program (Weaver et al., 2014) and the focus of international research networks such as the Program on Ecosystem Change and Society (Balvanera et al., 2017), the Global Land Program (Verburg et al., 2015), or the Future Earth program (van der Hel, 2016). In sum, co-production has demonstrated better suitability for addressing the complex nature of contemporary sustainability challenges than more traditional scientific approaches.
Our intention is not, however, to simply advocate for a more participatory process. Our intention is to demonstrate that it is possible to co-construct such participatory food system dashboards, while at the same time addressing the nexus highlighted above, that is, designing a dashboard that is holistic and multisectoral in nature, relying on a rigorous methodology that remains operational and empirical, even when it captures countries’ specific features over time.
The ambition of the paper is therefore 2-fold: first, to report on a recent initiative that developed and tested the feasibility of co-constructing such a food system dashboard and document how this co-construction can be done in a way that remains rigorous, replicable, and operational (Béné et al., 2023). Second, to ascertain the importance of the co-construction process, a missing element in most current international food system dashboards. As such, the paper is both conceptual and methodological: it discusses the concept of co-design and co-construction in the specific case of food system dashboards, and it presents a detailed methodology to achieve this in the challenging context of low- and middle-income countries (LMICs) where data are often missing or incomplete. The experience derived from three pilot countries (Bangladesh, Ethiopia, and Honduras), where the methodology was tested between 2021 and 2022, will also be shared. The initiative is currently being implemented in two other countries, Cambodia and Vietnam, with discussions to implement the approach in Indonesia, the Philippines, and Malaysia.
The rest of this paper is structured as follows: first, the protocol and detailed steps required for completing a rigorous, transparent, and replicable food system dashboard are presented, followed by the report of the implementation of these steps in the case of the three pilot countries where the food system country profile was tested. The next section revisits this experience in light of the two main points of this paper: why monitoring food system status (through a dashboard) is important, and why ensuring that this process is designed and implemented in a co-constructed way (i.e., involves the key food system stakeholders in the countries) is equally important. A final section concludes briefly.
Background and methodology
In this paper, the term “food system dashboard” refers to initiatives that aim at describing the status of countries’ food systems (or some of their main components), typically using a compendium of national-level indicators monitored over time. The main ambition of these initiatives is generally to provide a holistic overview of the entire food system, captured through a graphical user-friendly interface that offers an at-a-glance view of the whole system’s performance. These dashboards, therefore, generally have both a monitoring and a diagnosis/assessment objective. They usually cover multiple countries.
The project that supported the work presented in this paper started with the recognition that many compendiums and dashboards are not as practical/useful or informative as they could be for their intended users and use cases. While the reasons for this mismatch are numerous, they generally comprise three main issues.
First, the information offered by these dashboards often closely reflects the indicators/data that are available at the country level, leading to an imbalance in the representation of different segments of the food systems—i.e., in many cases, these dashboards end up providing information about the subsectors of the food system for which the most knowledge and data are already available (generally production and consumption subsectors). This further deepens the imbalance that exists in many national statistics systems between relatively well-documented components (agriculture and food security) and the other parts of the system (processing, transport, and retails). While recognizing the necessity to propose indicators for which data exist—to avoid the danger of “wish lists” and pure theoretical frameworks (e.g., Hebinck et al., 2021)—it is important to also acknowledge that “publicly available data” should not be the main criterion informing the indicator selection process. Instead, this process needs to be anchored in a clear conceptual and holistic framework.
This point links to the second issue that may reduce the relevance of some of these existing initiatives, namely their failure to provide a comprehensive/holistic overview of all the different elements that constitute food systems. In their recent systematic review of 42 studies that assess the impacts of diet choices on environmental, health, social, and economic dimensions, Webb and his colleagues found that too much reliance is placed on environmental and health assessments, thus failing to accurately encapsulate the economic and social dimensions of food systems (Webb et al., 2023). They conclude that this lack of representation of the social pillar, in particular, can be partially attributed to a lack of data and metrics, as well as a limited understanding of how best to define social sustainability. They insist (and we concur) that to fully understand the true implications of changes in food systems, research must begin to incorporate all four pillars of sustainability, with specific attention on economic and social implications (Webb et al., 2023).
The third major issue that often leads to a mismatch between these food system dashboards and decision-makers’ needs is the number of indicators that are proposed. It is not unusual to see dashboards that include 50, 100, or even 200 indicators. While the temptation to include as many indicators as possible is understandable (reflecting the widespread assumption that “the more [information], the better [the decision]”), policy research has long challenged this assumption (Powell, 2006; Du Toit, 2012). More importantly, a large number of indicators eventually leads to a counterproductive scenario where decision-makers are overwhelmed by the volume of information provided and struggle to identify which of those indicators is the most relevant to their needs.
Instead of replicating the approach adopted by these dashboards, our ambition was to follow a different path and to develop what is referred to in the rest of this paper as “food system country profiles”—or country profile (CP) for short. A food system CP can be defined as a short, interactive document that synthesizes in a clear, concise, and graphic fashion the critical information necessary for public and private decision-makers to gain a holistic/systemic yet synthetic overview of their countries’ food systems. As mentioned above, one key additional feature of these CPs is their co-constructed nature.
The details of the methodology used to build these CPs are presented in the rest of this section. The overall approach consists of 10 steps organized in a specific workflow synthesized in Figure 1 and detailed below.
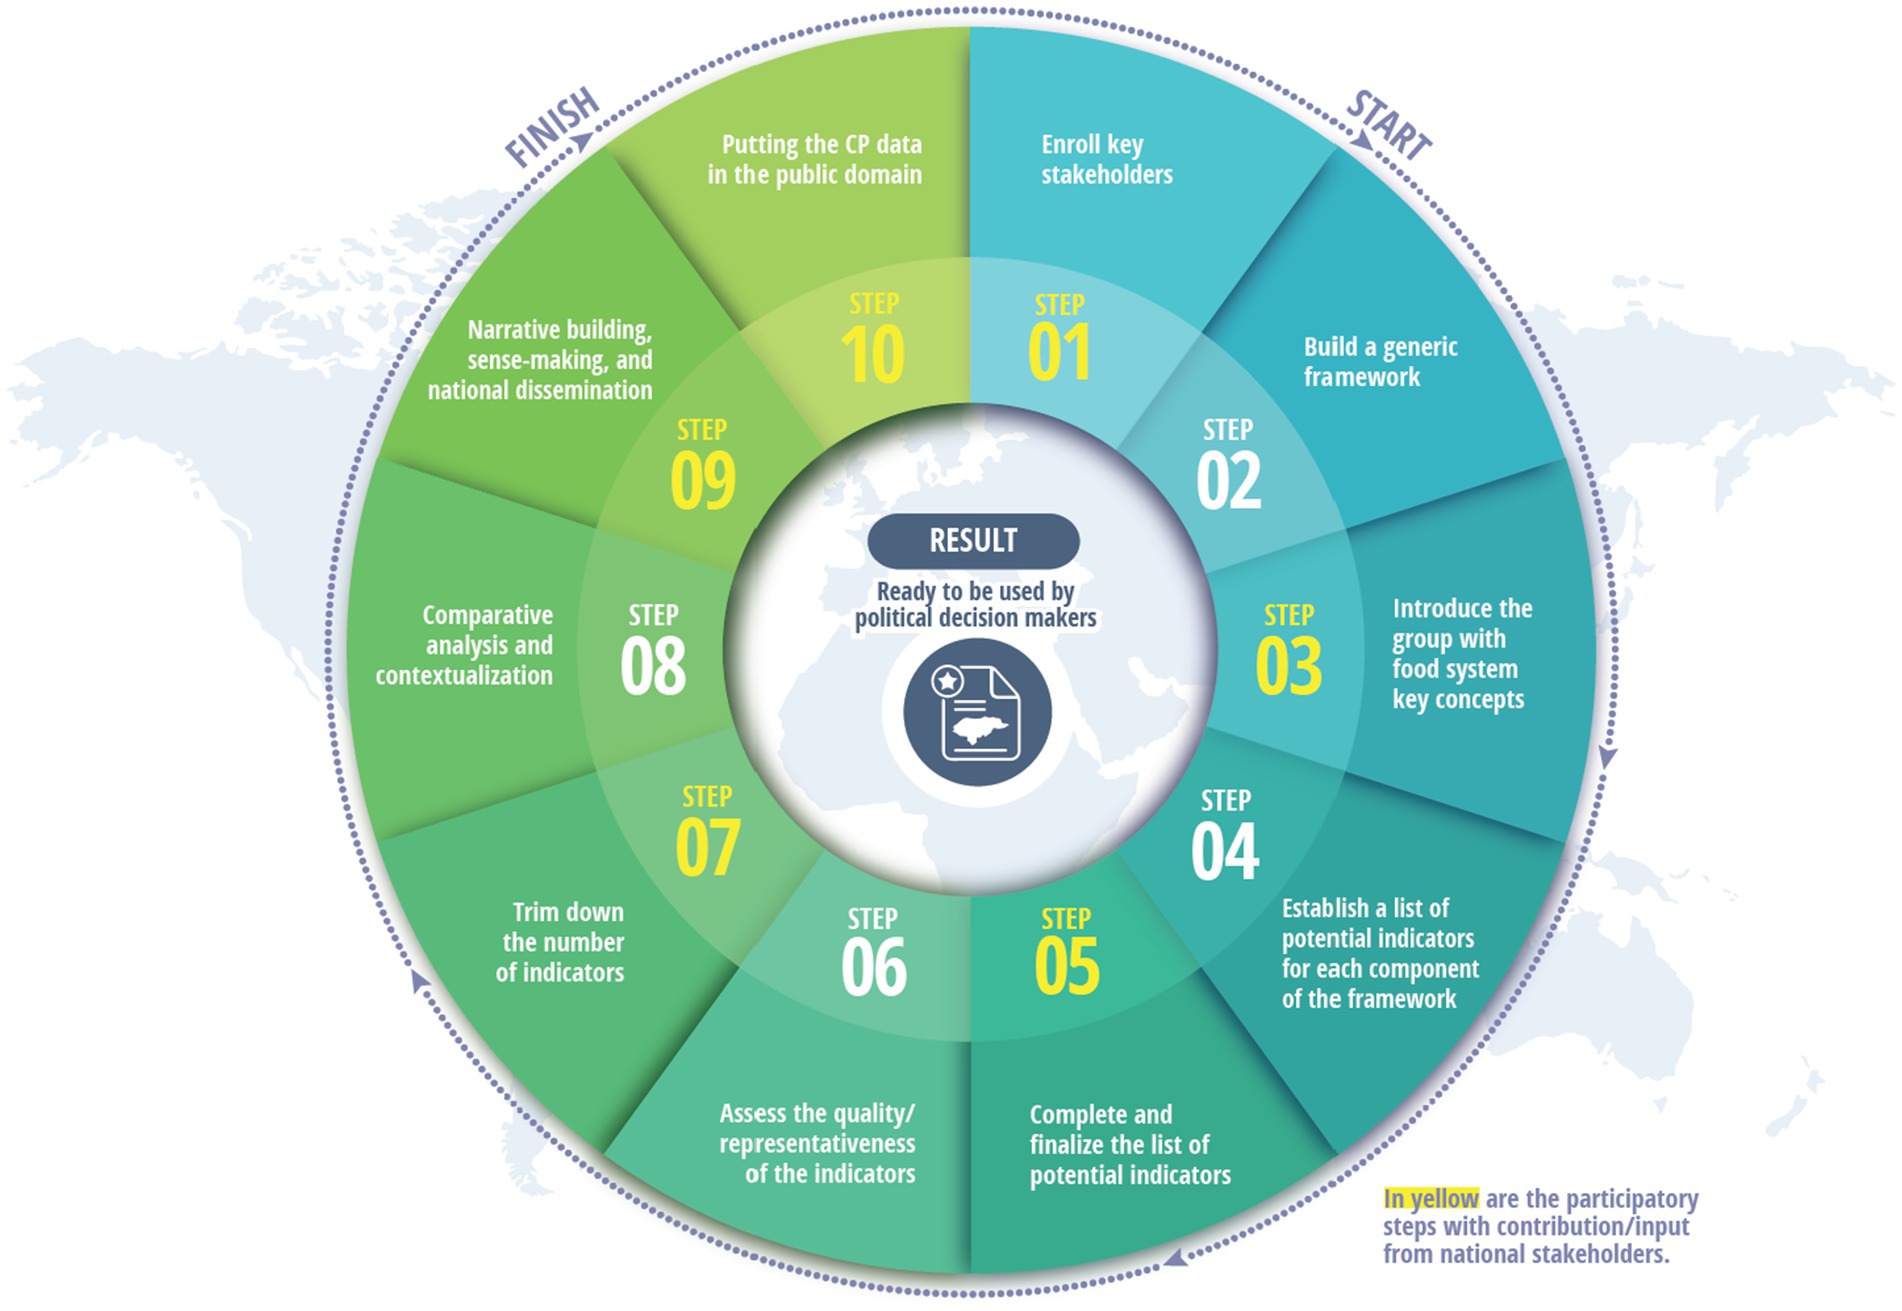
Figure 1. Workflow of steps and activities. Highlighted in yellow are steps that were designed or implemented in collaboration with national stakeholders (source: the authors).
Step 1: enroll key stakeholders
The first step consisted of identifying relevant stakeholders to ensure representation from food system-related sectors (agriculture, environment, health, nutrition, agribusiness, food retail, and consumers) and make sure that legitimate and relevant organizations are onboard (including the private sector, public sector, non-governmental organizations (NGOs)/civil society organizations (CSOs), and academia/research). This can be achieved by compiling an inventory of relevant organizations operating in the country through internet searches and interviews with key informants (public institutions and UN agencies often provide a good starting point), structured by sector/expertise in specific food system components and types of organizations. Two ways can be envisaged for creating such groups: either using existing multi-stakeholder platforms or creating a process-specific stakeholder group, depending on the circumstances within the country. Which option is eventually chosen depends on the circumstances in the country. Where a working group already exists with sufficient alignment in composition and agenda with the proposed process, building on this group can provide for a very quick and cohesive start (for example, the National Food and Nutrition Security groups that have become popular in several African countries).1 This was the case in one of our pilot countries, Ethiopia. In some other cases where identifying a relevant existing stakeholder group is more difficult, stakeholders will need to be identified individually based on their expertise, institutional profiles, and willingness to engage in the CP process, and subsequently, a new stakeholder group will be constituted for the CP process.2 This was the case in our two other pilot countries, Honduras and Bangladesh.
Step 2: build a generic framework
The second step consisted of developing a framework to ensure that the selection of indicators is holistic and covers all the critical components of a food system. In our case, we drew upon two widely recognized food system frameworks: the framework initially developed by the High-Level Panel of Experts report on Food System and Nutrition (HLPE, 2017) and the framework proposed by the One Planet Network Sustainable Food Systems Program (UNEP, 2019). The resulting generic framework is displayed in Figure 2. It highlights five key components of food systems: (i) the drivers; (ii) the food system supply, actors, and activities; (iii) the food environment; (iv) the consumers’ choices and subsequent diets; and (v) the food system outcomes where four distinct types of outcomes are considered: environment, nutrition and health, economic, and social outcomes. Those different components are described in greater detail in Table 1.
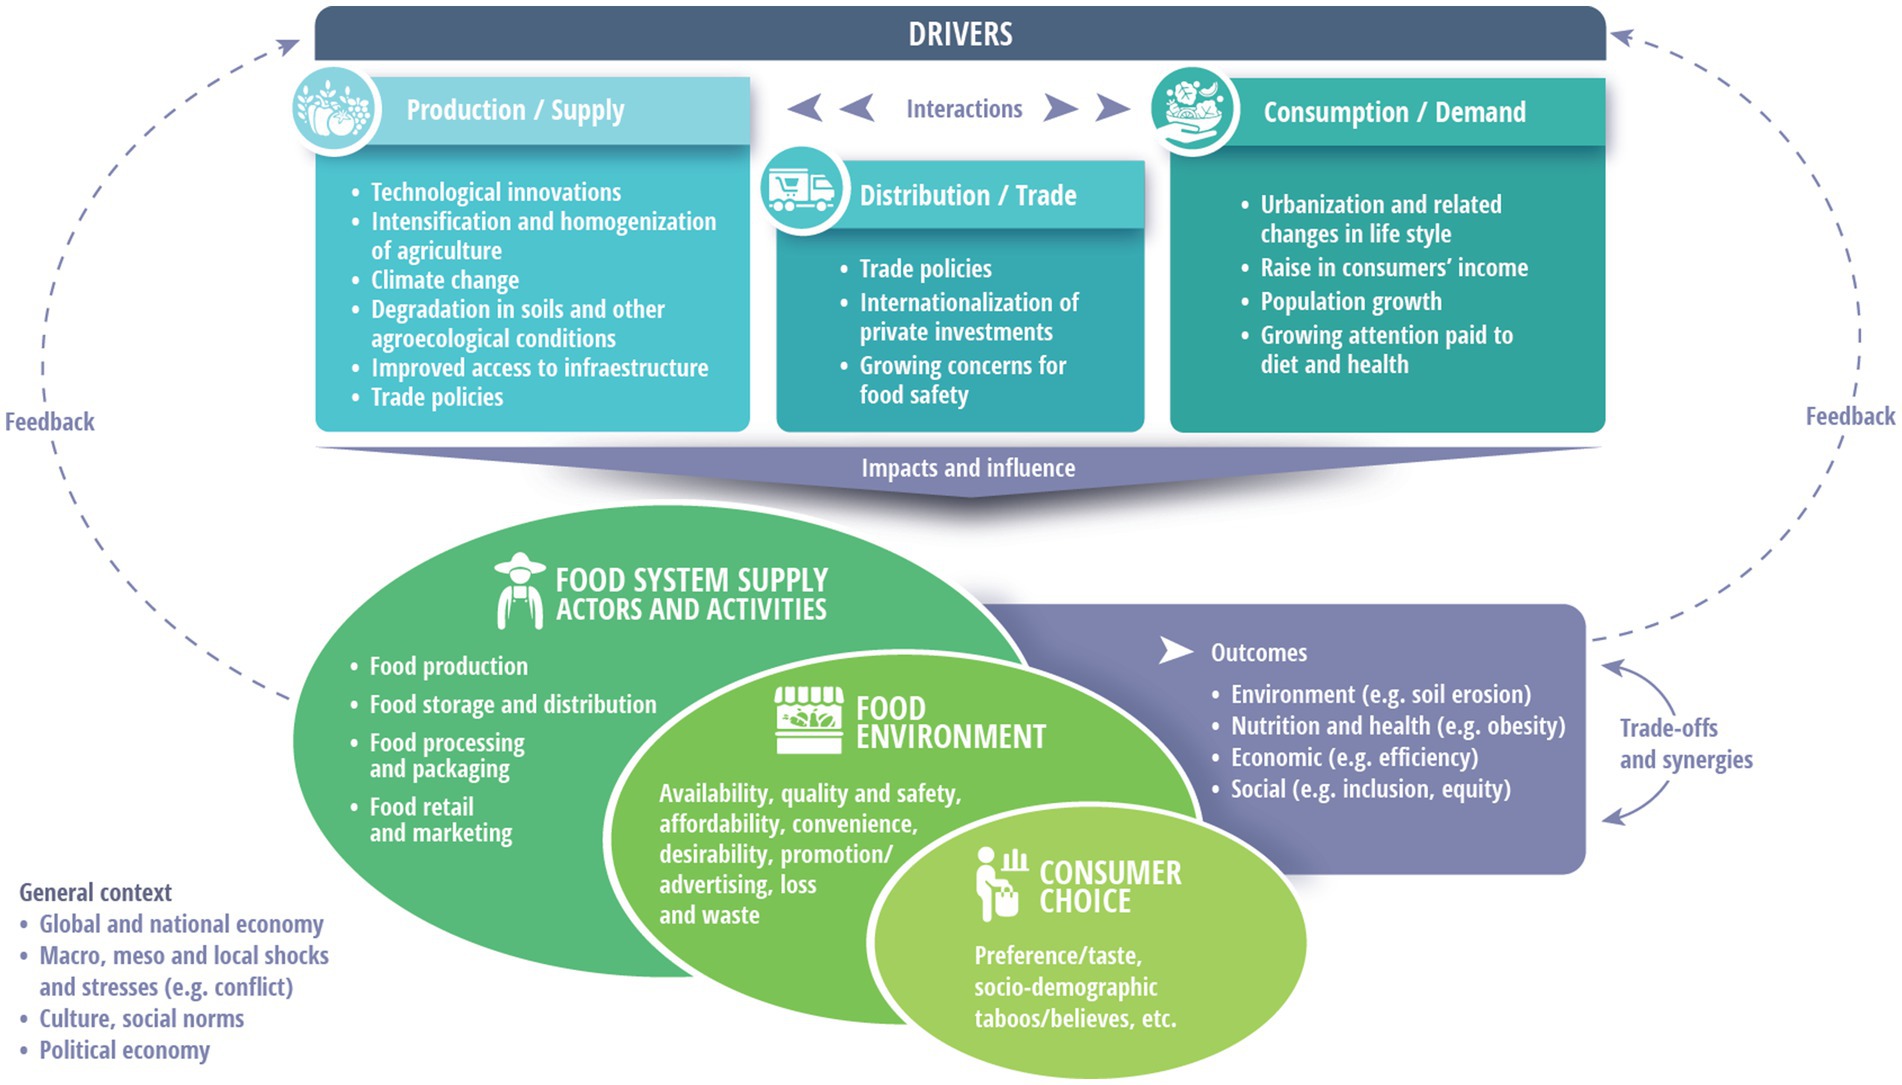
Figure 2. Food system—an analytical and conceptual framework used during the various meetings with countries’ stakeholders (source: the authors).
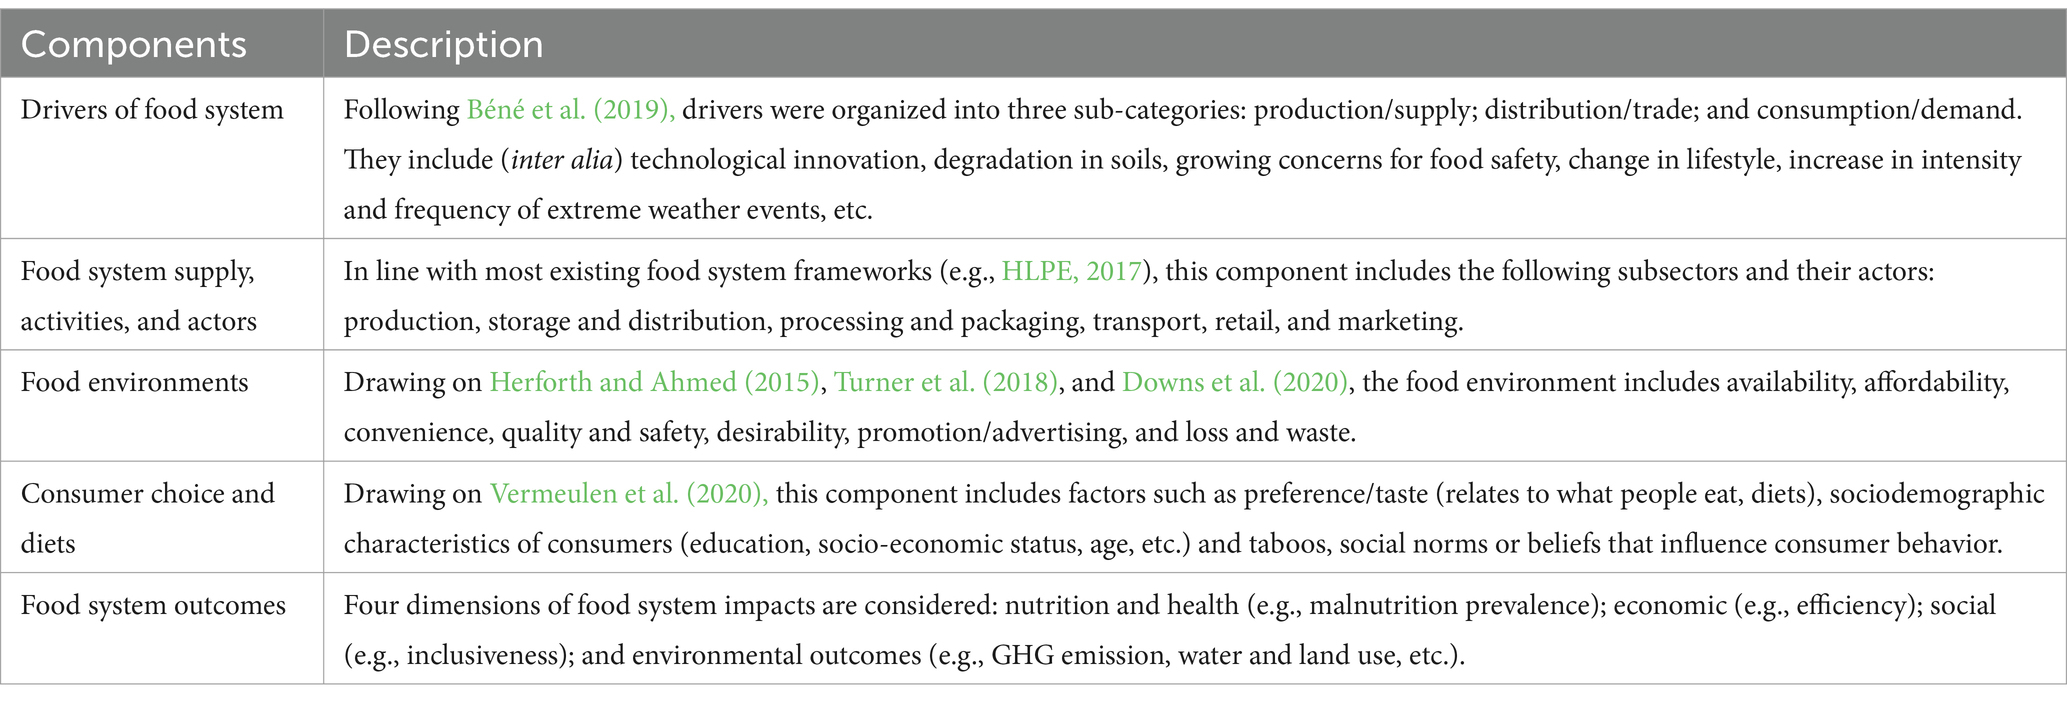
Table 1. The five major components of the food system included in country profiles.
The framework offers a visual representation of a food system and its components (which is very useful for building a common understanding among key stakeholders of what a food system is). The framework is partially analytical and partially conceptual. The analytical aspect relates to the interactions between the different components and their possible associated feedback and different roles in the systems: drivers, outcomes, etc. The conceptual aspect helps put boundaries around “what is in and what is out,” i.e., what should be considered internal and external to the system and the importance paid to the four dimensions of the concept of sustainability, which underpins the approach (economic, social, environmental, and food security and nutrition) (HLPE, 2017; FAO, 2018).
Step 3: introduce the group with food system key concepts
Step 3 involves bringing together stakeholders’ direct inputs from the very beginning of the process. During this first interaction, the general objective, rationale, and workflow of the CP process, along with key concepts (e.g., what a “food system driver” is, what “food environment” refers to, where the main feedback interactions in a food system are, etc.) are introduced to stakeholders together with the food system framework and its components. The objective is to develop a common language to talk about food systems and to create interest and build a sense of ownership among these stakeholders in line with principles of knowledge co-construction (Norström et al., 2020). Ideally, all interactions with stakeholders (during this first step and the subsequent ones) should take place through face-to-face exchanges. In our case, face-to-face meetings were not authorized at the time of the research due to COVID-19 restrictions. Video conferences and online meetings were organized instead (using interactive platforms like Zoom and Teams) without major disruption to the process. Through this step, stakeholders also get to know each other, provide feedback on the conceptual framework and its application to the country (does it fit? with what adaptations?), the constitution of the stakeholder group and its representativeness (who is missing?, how can the group be more inclusive?), and on the organization of the process in time as well as logistically (dates, place, and time of day).
Step 4: establish a list of potential indicators for each component of the framework
Step 4 is the first of a series of several steps aimed at identifying the most relevant set of indicators. The process relies on a set of inclusion/exclusion criteria that are introduced intentionally to build the legitimacy and rigorousness of the framework. It is, indeed, important to be able to claim that the choice of indicators is not simply the result of the (un)availability of data or reflects the subjective perspectives of (local) experts for whom some indicators may be “important” while others are “less important.” The inclusion/exclusion criteria (outlined in Table 2) cover, therefore, nine domains deemed essential for a rigorous process. These include the methodology of how the indicators are constructed and collected, their conceptual relevance, whether they allow for comparability, their time period, geographical scale and availability at the national level, and whether they can be expected to have observable effects (based on existing empirical evidence) on one or several components of the system. The final criterion is about their potential functions as drivers of food systems3—see Table 2 for details.
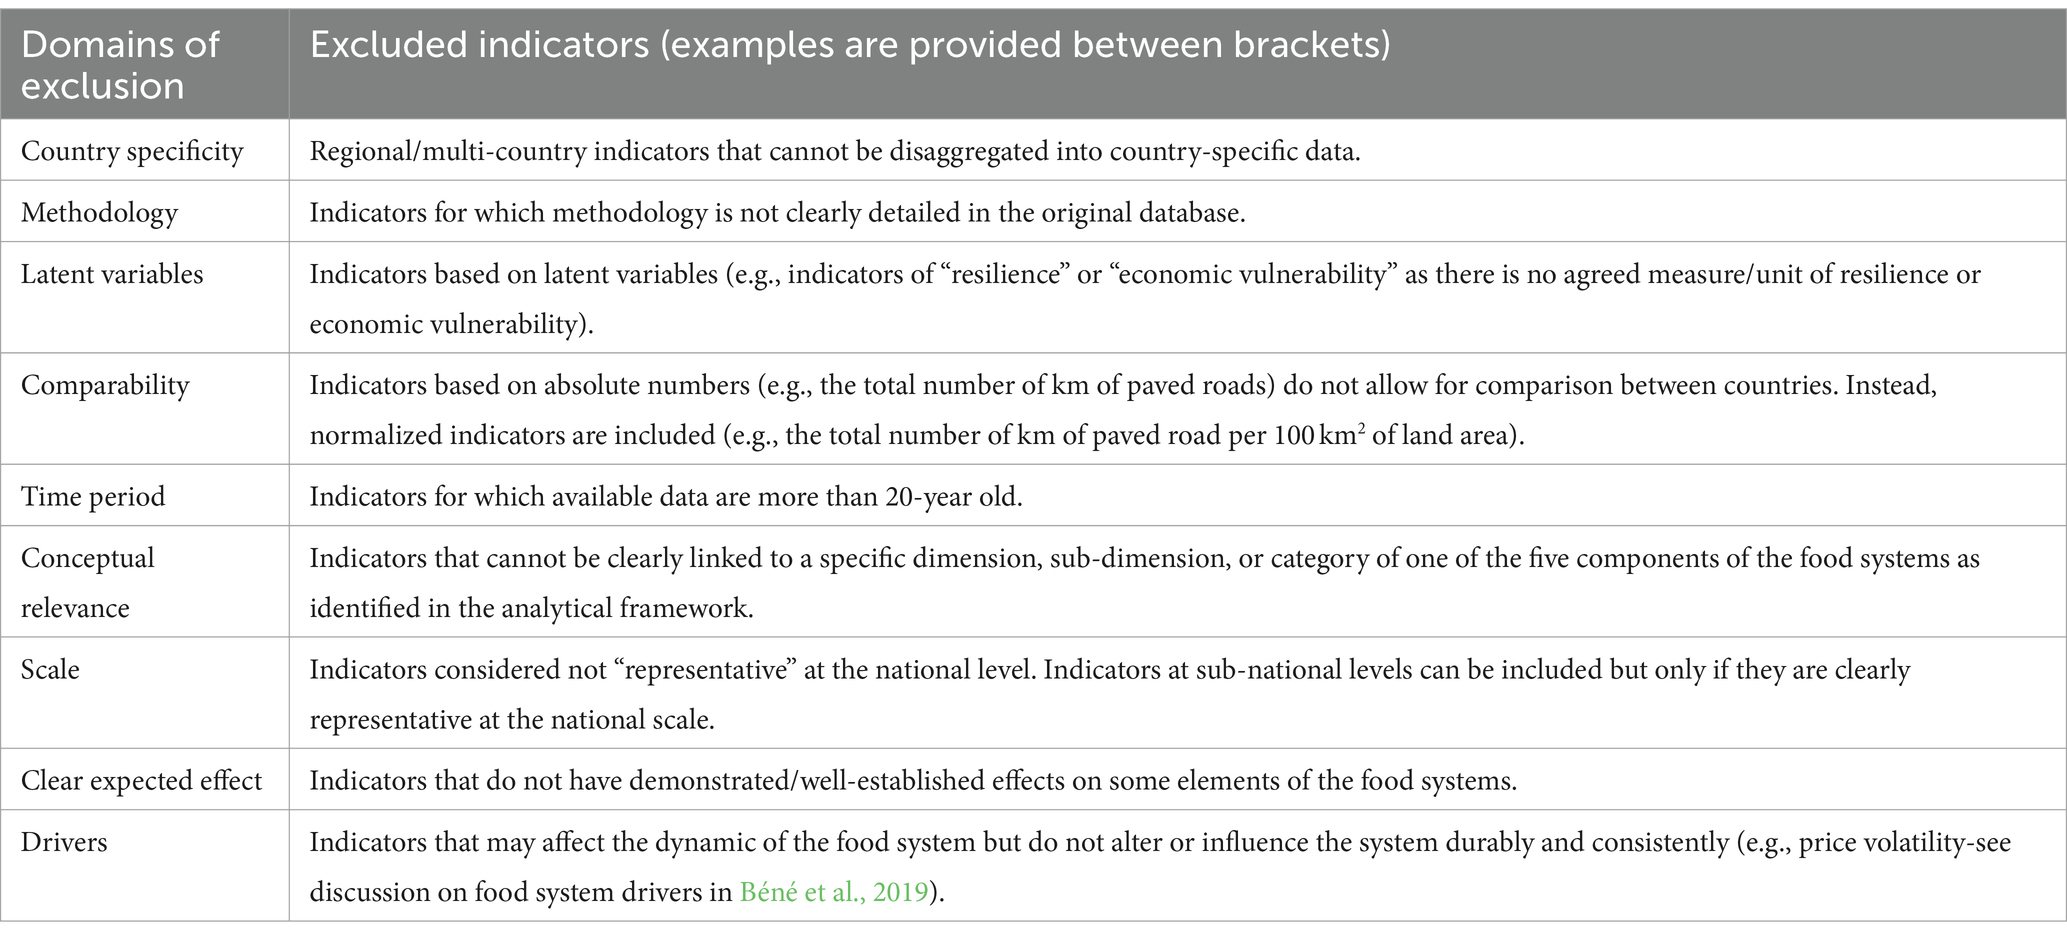
Table 2. List of exclusion criteria used to select indicators.
The inclusion/exclusion criteria are then applied to existing publicly available datasets in the countries under consideration. In our case, these publicly available datasets were identified through a two-stage process: starting with a thorough literature review conducted by the research team with the objective of identifying existing national-level datasets that could act as indicators for the different components of the food system and the national stakeholders, those were then reviewed before being systematically assessed using the inclusion/exclusion criteria, as described in Step 5 below.
Step 5: complete and finalize the list of potential indicators
Step 5 aims to identify additional relevant data/indicators that may be held within ministries or unpublished databases. In our case, contacts were established with national experts (beyond the stakeholders involved in the initiative) to determine the availability of additional databases. An initial workshop was used for this “reconnaissance” purpose, complemented by bilateral follows-up to obtain access to those additional databases. If those satisfied the inclusion criteria, they were added to the datasets. The resulting inventory includes the most comprehensive and updated food system-related datasets that are publicly available in each country. At this stage, the total number of potential indicators reached 114 in Bangladesh, 135 in Ethiopia, and 212 in Honduras.
Step 6: assess the quality/representativeness of the indicators
The aim of Step 6 is to conduct a semi-quantitative assessment of the “quality” of the indicators available at the country level. Using a 1–3 or 1–5 scoring system (depending on the nature of the criteria considered), the research team assessed the degree to which each indicator offers a good proxy for the process it seeks to capture. Five criteria were used for this purpose: representativeness, contemporariness, open access, existence of time series, and potential for repeatability. Details of the criteria and the scoring process are provided in Table 3. For each indicator, a total score was then computed by adding up the scores assigned for each criterion.4 The objective was to obtain a clear, easy-to-communicate, assessment of the existing data at the country level. The scoring is also to be used for the trimming process implemented in Step 7 (see below).
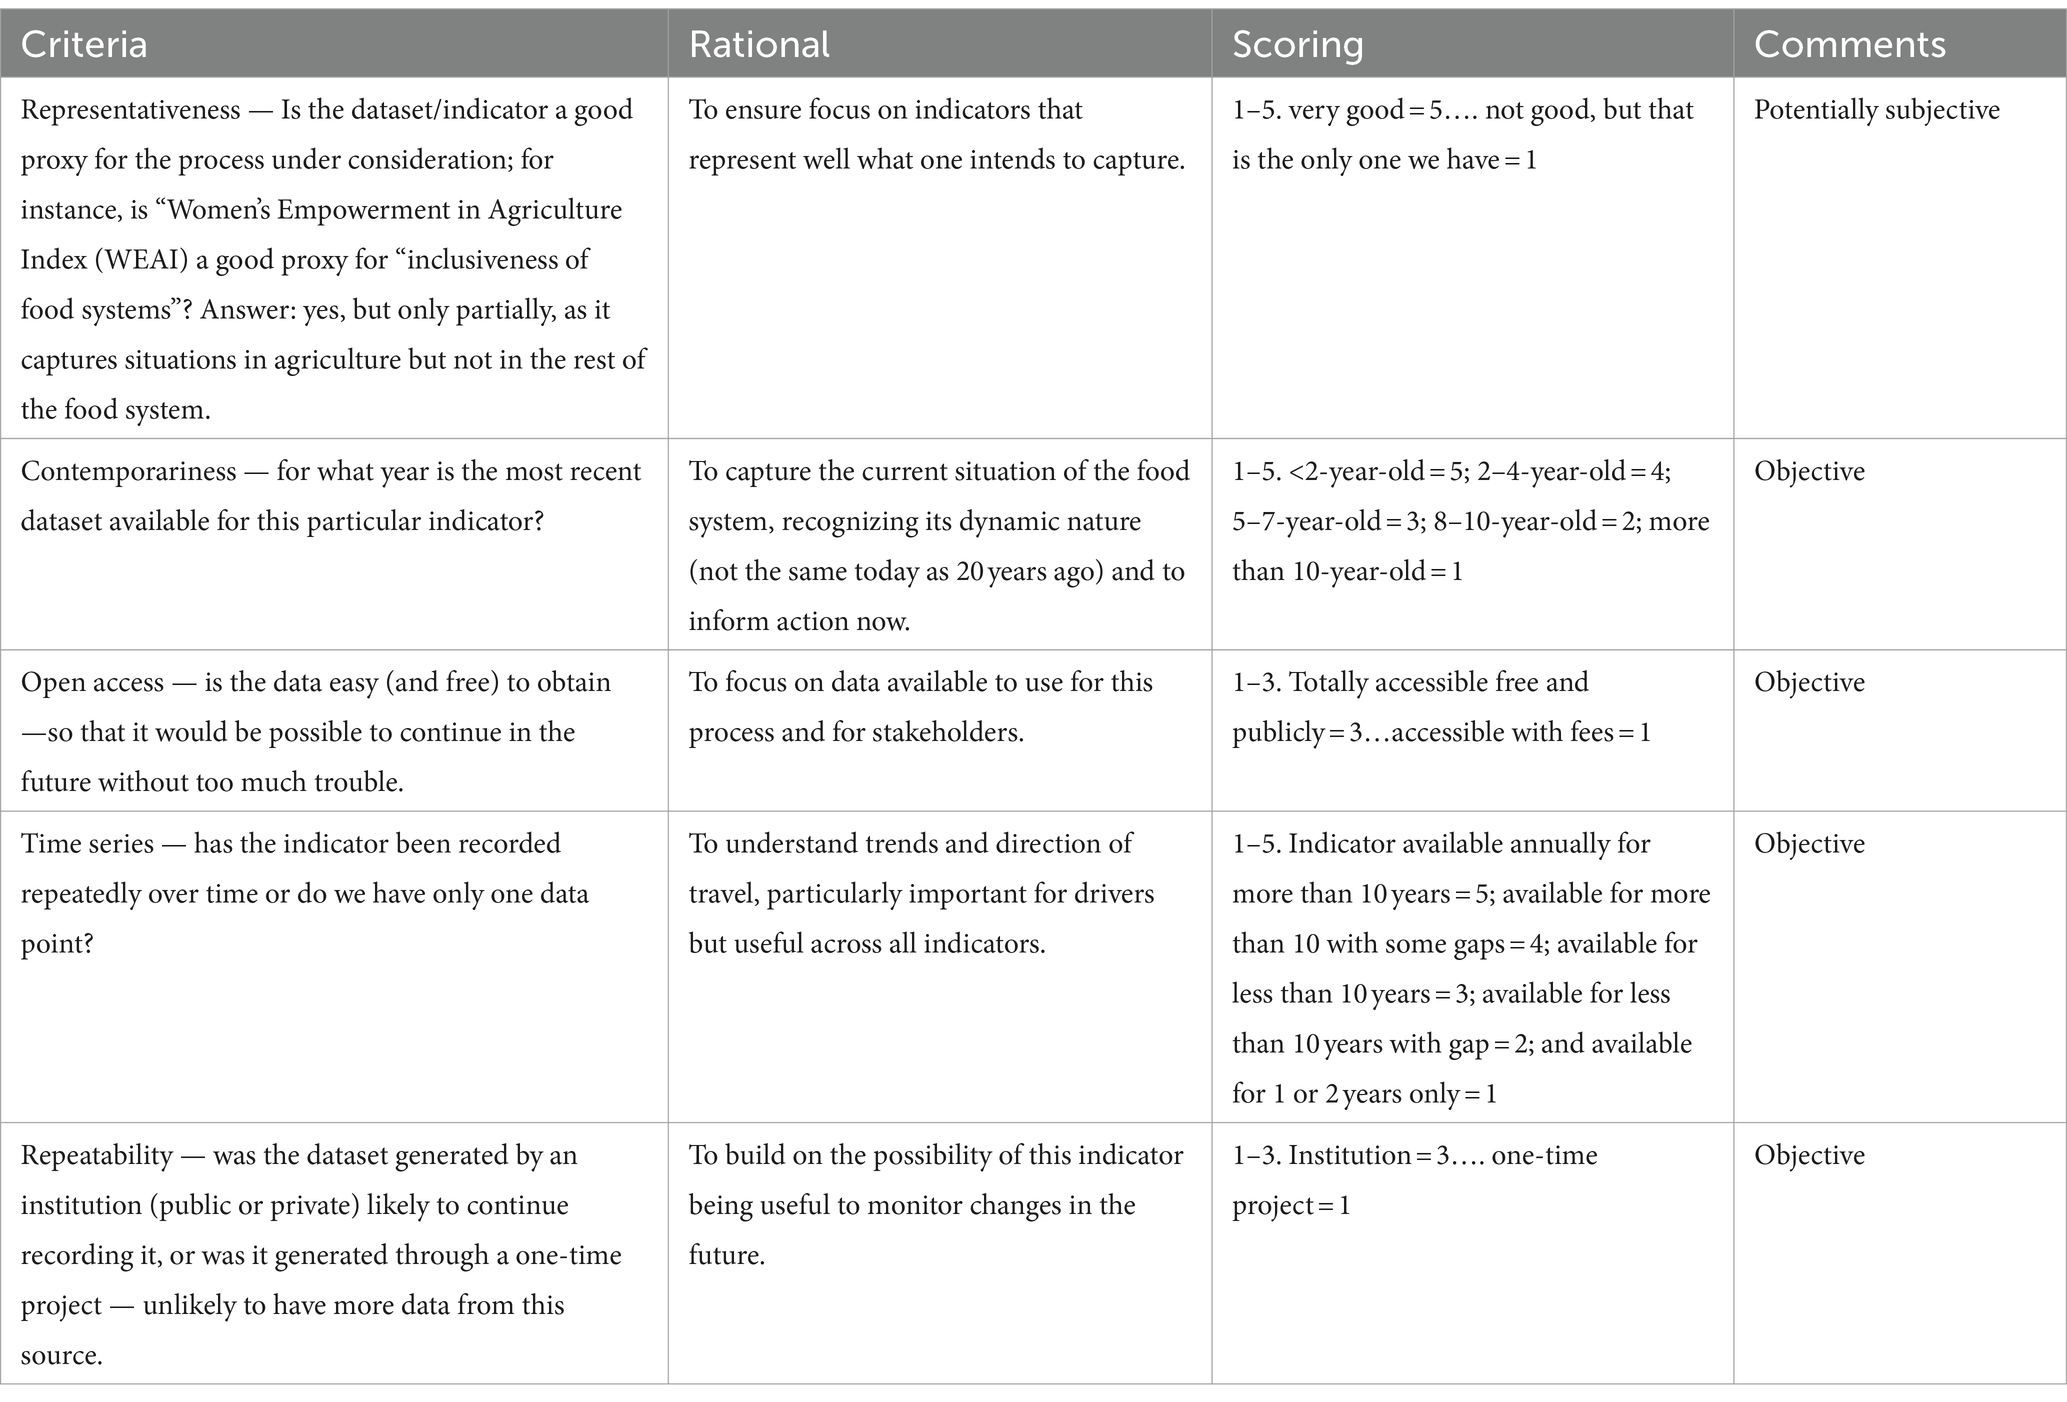
Table 3. Scoring system used to “assess” the indicators.
Step 7: trim down the number of indicators
From the original set of 100+ indicators identified in each pilot country through steps 4–6, the objective was then to trim it down to a more “manageable” set of 30 indicators using the scoring system presented in Table 3. The choice of this number, 30, reflects a compromise between the need to keep the total number of indicators as small and manageable as possible (and reduce the risk of overwhelming decision-makers with too many of these indicators) and the necessity to provide enough information about each of the five key components of the food system to be able to assess holistically and comprehensively the status of the system. Due to their multi-dimensionality and complexities, three components (drivers, food environment, and outcomes) were assessed through a higher number of indicators, followed by consumer choice and food supply actors and activities. The resulting allocation of indicators per component is detailed in Table 4. Among all five components, outcomes are eventually covered by the largest number of indicators (8), reflecting the fact that they capture the impacts of food systems on development outcomes and, as such, should receive particular attention as they can help prioritize action areas and monitor long-term results.
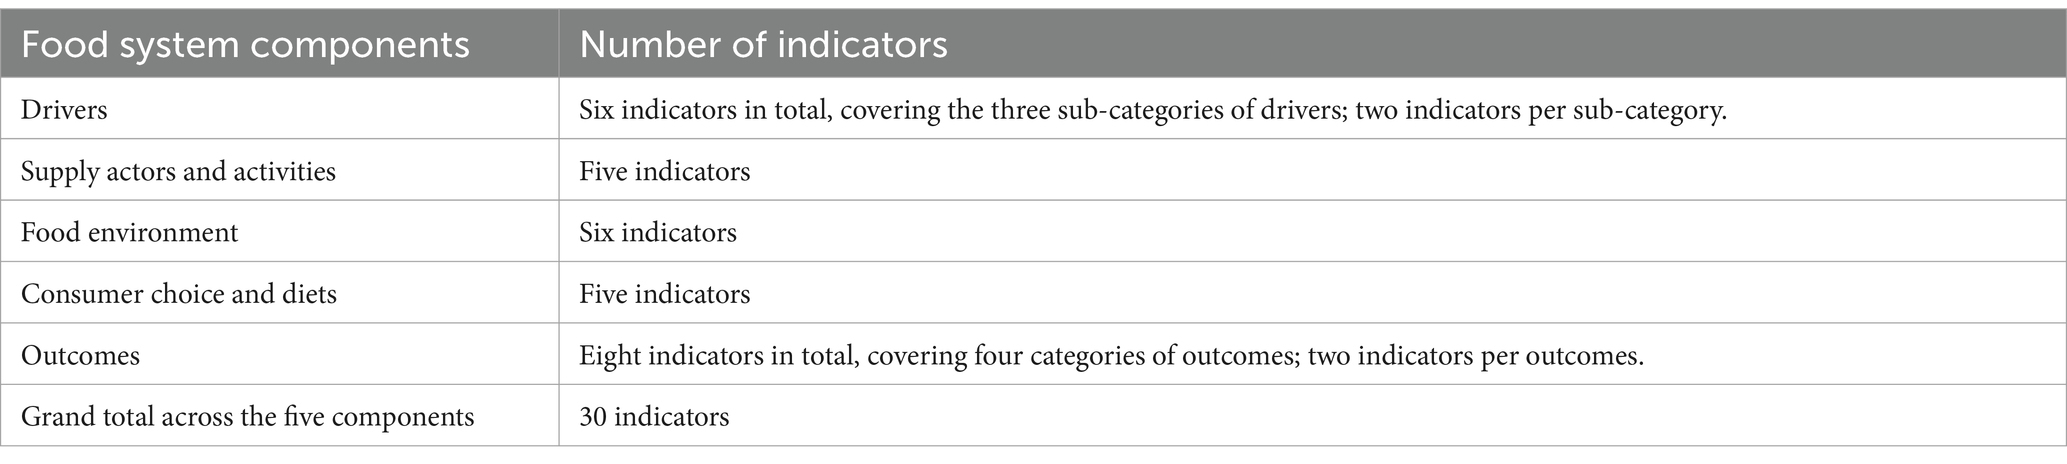
Table 4. Number of indicators per food system component.
As mentioned above, the aggregated score computed for each indicator in Step 6 was then used for the trimming process. For each component (and their sub-categories), the indicators with the highest scores were retained until the quota for that component was filled. Stakeholders were engaged in this step to comment and validate the final list of 30 indicators, especially in terms of their representativeness of the food system process under consideration or when multiple indicators had similar scores. It is important to note that this process means that the set of 30 selected indicators is not the same across countries, but it ensures that each component of the food system is covered by the same number of indicators across countries: six indicators for drivers, five indicators for activities, six indicators for food environment; five indicators for consumer choices, and eight indicators for outcomes (cf. Table 4); thus allowing cross-country comparative analysis (see step 8 and Discussion section). The process also ensures that, at national and subnational levels (i.e., where decisions are made), the decision-makers are provided with the set of the 30 most representative/informative indicators of the current situation for their national food system.
Step 8: comparative analysis and contextualization
Step 8 enriches the decision-making process by offering a comparative analysis tailored to the country under study, examining each of the 30 selected indicators across countries and over time. This analysis compares the country’s respective indicators with the same sets of indicators computed for three relevant groups of other countries: the world (i.e., all countries for which the set of indicators is available5), the geographic neighbors (i.e., countries geographically closest), and the “economic” neighbors (i.e., countries with the most similar GDP per capita). For illustration, Table 5 provides the list of geographic neighbors and economic neighbors identified for the three pilot countries considered in our initial work.
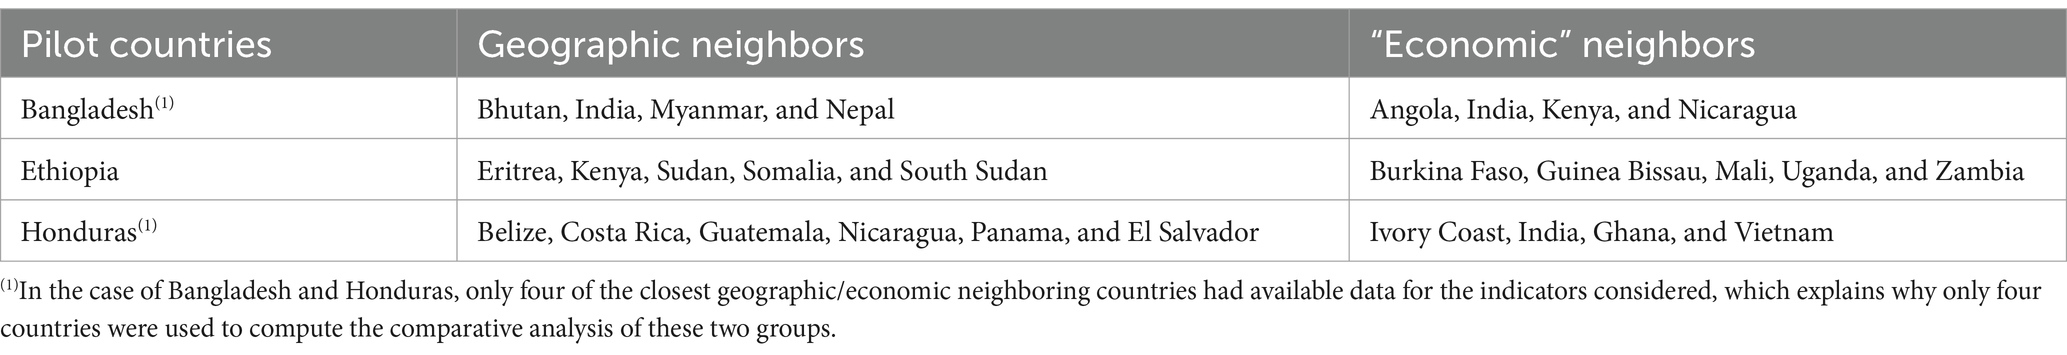
Table 5. List of geographic and economic neighbors used for the comparative analysis of the three pilot countries.
For each of the 30 indicators, the values obtained for the three comparator groups are then presented alongside the values computed for the pilot country, allowing decision-makers to put the performances of their own country’s food system into perspective.
Furthermore, when data availability allows it, a similar comparison can be conducted for the previous 10-year period, adding a time dimension to the comparative analysis. Figure 3 illustrates this trend analysis in the case of “urban population growth” (identified by the stakeholders in Bangladesh as one key driver of change in the food system). The directionality of the changes [toward (un)desirable outcomes] should be predetermined based on general knowledge. For instance, in the case of the indicator shown in Figure 3, a rapid increase in urban population would be considered undesirable as the literature shows that such a trend is often associated with adverse outcomes, such as a rise in consumption of unhealthy ultra-processed food (Ghosh et al., 2015; Andrade et al., 2020). For each indicator, the research team completed a directionality analysis based on existing scientific literature. This directionality analysis, then, made it possible to compare the pilot country under consideration with comparator countries in terms of both indicator values and trends.
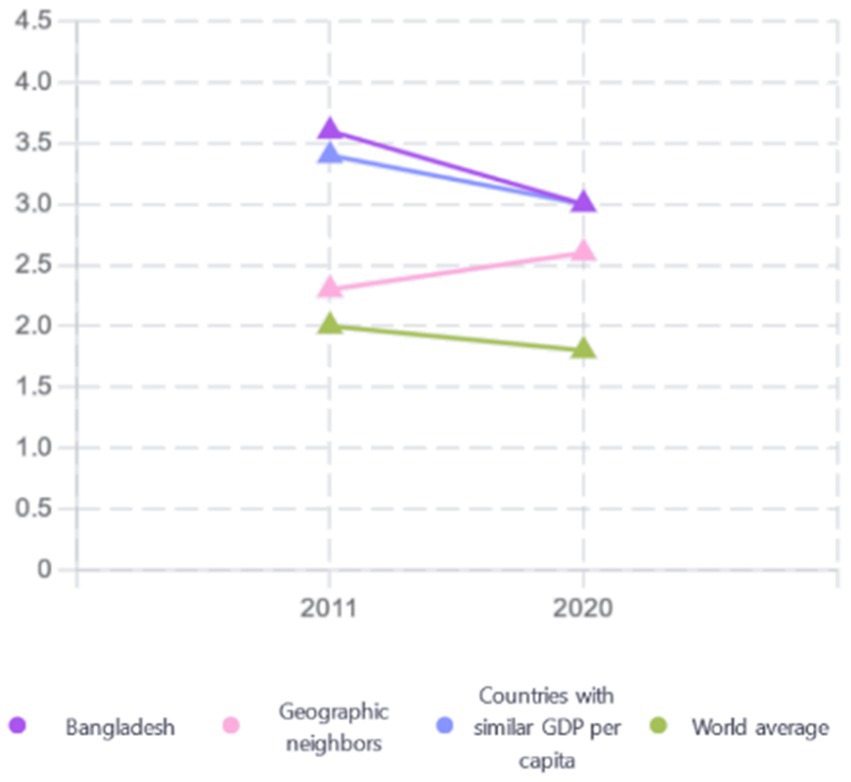
Figure 3. The 10-year changes observed in the indicator (urban population growth) displayed for the pilot country (Bangladesh) and the three comparator groups: the geographic neighboring countries, the economic neighbors (countries with similar GDP per capita), and the rest of the world.
Step 9: narrative building, sense-making, and national dissemination
Step 9 focuses on consolidating stakeholder engagement by providing a structured platform for them to review, critique, and collectively discuss the results of the assessment before broad dissemination. For this, two workshops were organized. The first workshop brought together stakeholders who have been engaged from the beginning of the CP process to partake in a narrative-building exercise. This session also served as a space to design the agenda and logistics of a subsequent, larger national workshop. This ensured that the wider event and its content were truly owned by the stakeholders.
Following this, a broader national workshop was convened, ideally aligning it with on-going related initiatives to leverage synergies and existing engagement. In the case of Honduras, for example, the national profile process dovetailed with the United Nation Food System Summit (UNFSS) pre-summit country dialogues, using the CP to frame discussions around the country’s food system challenges and potential action points. It was also used to develop the introductory section of the Honduras Roadmap for Food Systems Transformation submitted to the UNFSS.
Step 10: putting the CP data in the public domain
In parallel with Step 9, a dissemination tool should be designed in the form of a public website where the complete results of the food system CP are displayed. For transparency purposes, the website should detail the methodology used to identify, select, and trim the indicators, as well as their definition and the sources of the data. A team of professional graphic designers and communication experts with local understanding can be hired to help conceive a clear and compelling visualization of the country’s situation along with those of the comparator countries. Special effort should be made to structure the website content (through figures, infographics, and narratives) in a way that is easily understandable, avoids tunnel vision, and offers a full/systemic view of the food system. This should, therefore, build on the narrative developed in Step 9, providing a story-like interpretation of the data that aids in comprehension and highlights actionable insights (details are provided in the results section below). The objective is to offer a useful and interactive “platform” for key stakeholders and other potential users (CSOs, NGOs, private sector, researchers, etc.) and support them in their need to better understand what their country’s food system looks like, where the main issues are, and, potentially, identify key areas of priority interventions. Options to download data and their visualizations, as well as the accompanying narrative, could also be included.
Results
The participants
The food system country profile methodology was implemented in 2021–2022 in the three pilot countries, where it was well received despite the economic and social disruptions caused by the COVID-19 pandemic. Table 6 summarizes the participants’ institutional affiliations, along with the group they represented (private sector, public sector, NGOs/CSOs, and academia/research). In Honduras, 54 different individuals representing 22 different institutions participated in the CP process. The largest numbers came from the public and private sectors (six each), followed by NGOs and UN agencies (four each) and academia (two). In Bangladesh, 20 stakeholders representing 18 different organizations participated in the CP process. The largest group was from academia (seven), followed by NGOs (five), public (three), UN agencies (two), and others (one). In Ethiopia, 47 stakeholders representing 28 different organizations engaged in the CP process. The majority of the institutions represented were NGOs and UN agencies (eight different types), followed by donors (seven), universities and research organizations, and government ministries (public sector), each represented by five different institutions and the private sector (three).
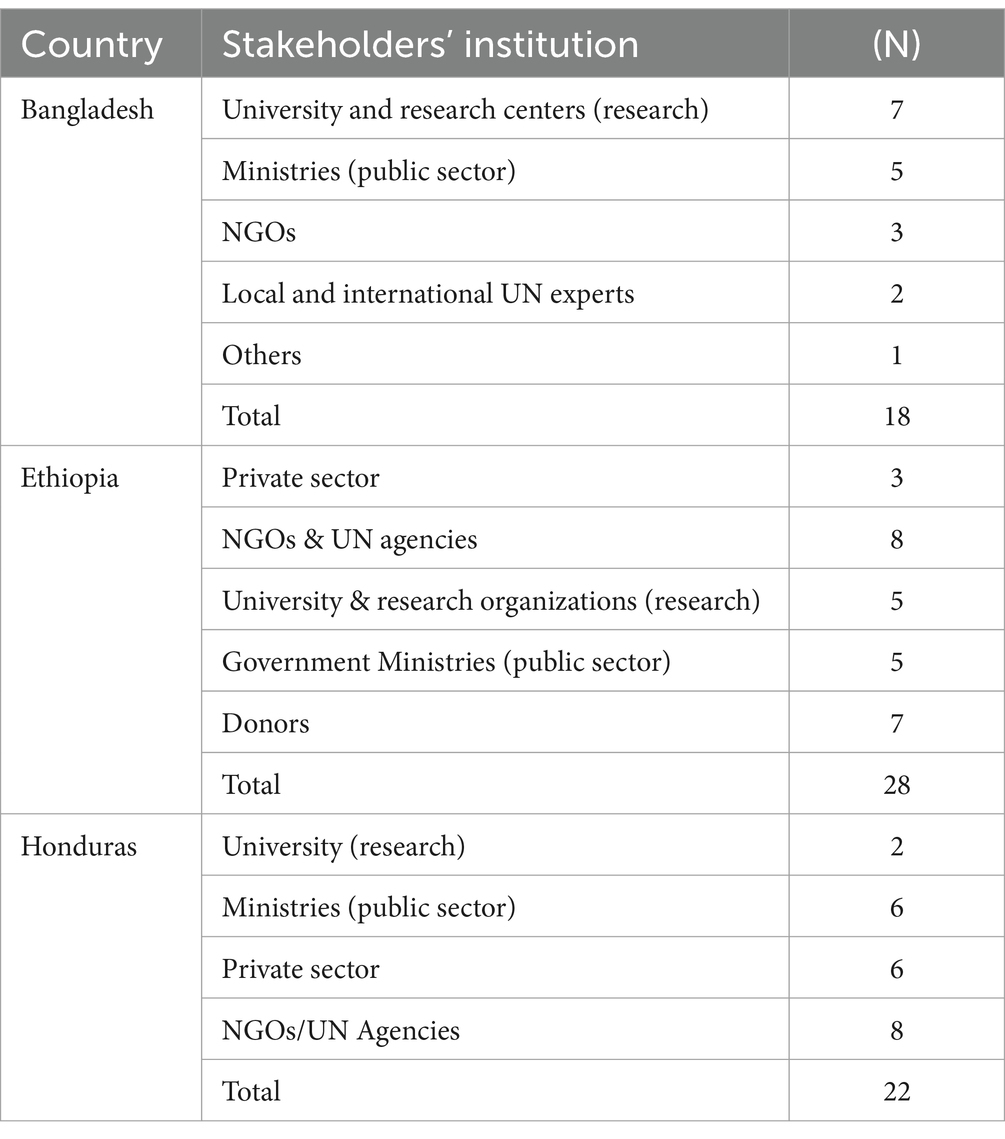
Table 6. Institutional origins of the participants who contributed to the co-construction of the food system country profile.
(Quality of) the data
As part of Steps 4 and 5, potential indicators were compiled from existing national databases: 114 in Bangladesh, 135 in Ethiopia, and 212 in Honduras. The scoring exercise conducted as part of Step 6 provides useful information about the overall availability and “quality” of the existing datasets in the three countries (Table 7). Except for Bangladesh, the outcome domains have the highest number of indicators meeting the inclusion/exclusion criteria (Table 2), with 74 in Honduras and 54 in Ethiopia, suggesting that these countries are already capturing significant information related to their food system outcomes. On the other hand, “consumer choices” emerged as the domain with the consistently lowest number of indicators across all three countries: 25 in Honduras, 11 in Bangladesh, and 14 in Ethiopia. In terms of data quality, open access and repeatability seem to be issues in both Bangladesh and Ethiopia, but not in Honduras, where these two criteria score high while the lowest score is found for time series. Also worth noticing is the fact that Bangladesh is characterized by poor outcome indicators.

Table 7. Scoring exercise assessing the quality of the data available at the country level.
The co-construction process
The process of co-constructing the food system CPs drawing on key contributions from national stakeholders was an iterative process (see discussion) that built on four instrumental steps: (i) validating the framework’s alignment with country’s specific context and needs; (ii) identifying reliable data sources and appropriate indicators; (iii) choosing the most relevant set of 30 indicators for the country; and (iv) analyzing and interpreting the data to discern trends, identify positive and negative patterns within the country’s food system, understand trade-offs, and determine priority areas for action.
It is important to note that the co-construction process took place mainly during the series of stakeholder events/group discussions; follow-up conversations were, however, also conducted as needed with several stakeholders, often to clarify/expand feedback given during the stakeholder events.
Reflecting on the potential difficulty in achieving consensus among stakeholders, the experience in the three pilot countries contradicts the conventional view (and the expectation of the authors) that stakeholders with different priorities or perspectives may find it difficult to agree on a limited set of indicators. Part of the explanation for this unexpected outcome may hold in the very clear and transparent inclusion/exclusion process that led to the selection of the final 30 indicators, as well as the fact that stakeholders were not imposed these indicators but, on the contrary, invited to propose additional ones completing the original list identified by the research team. Eventually, the scoring and its coherent set of quality-assessment criteria (representativeness, contemporariness, open access, existence of time series, and potential for repeatability) helped settle the few initial divergences between stakeholders.
The food system country profiles
The result of the co-construction process eventually translated into the building of an open-access website where the complete results of the food system CP are displayed (Step 10). Figure 4 illustrates the content of the last page of the website from where the infographics of the pilot countries’ food system country profiles are accessible.6 The page has been designed as a dashboard providing an at-a-glance overview of the food system situation for the country under consideration. The page has also been designed to be interactive, thus allowing viewers to choose which component of the system they want to examine at a time. The food environment in Honduras is used for this illustration (Cf. Figure 4).
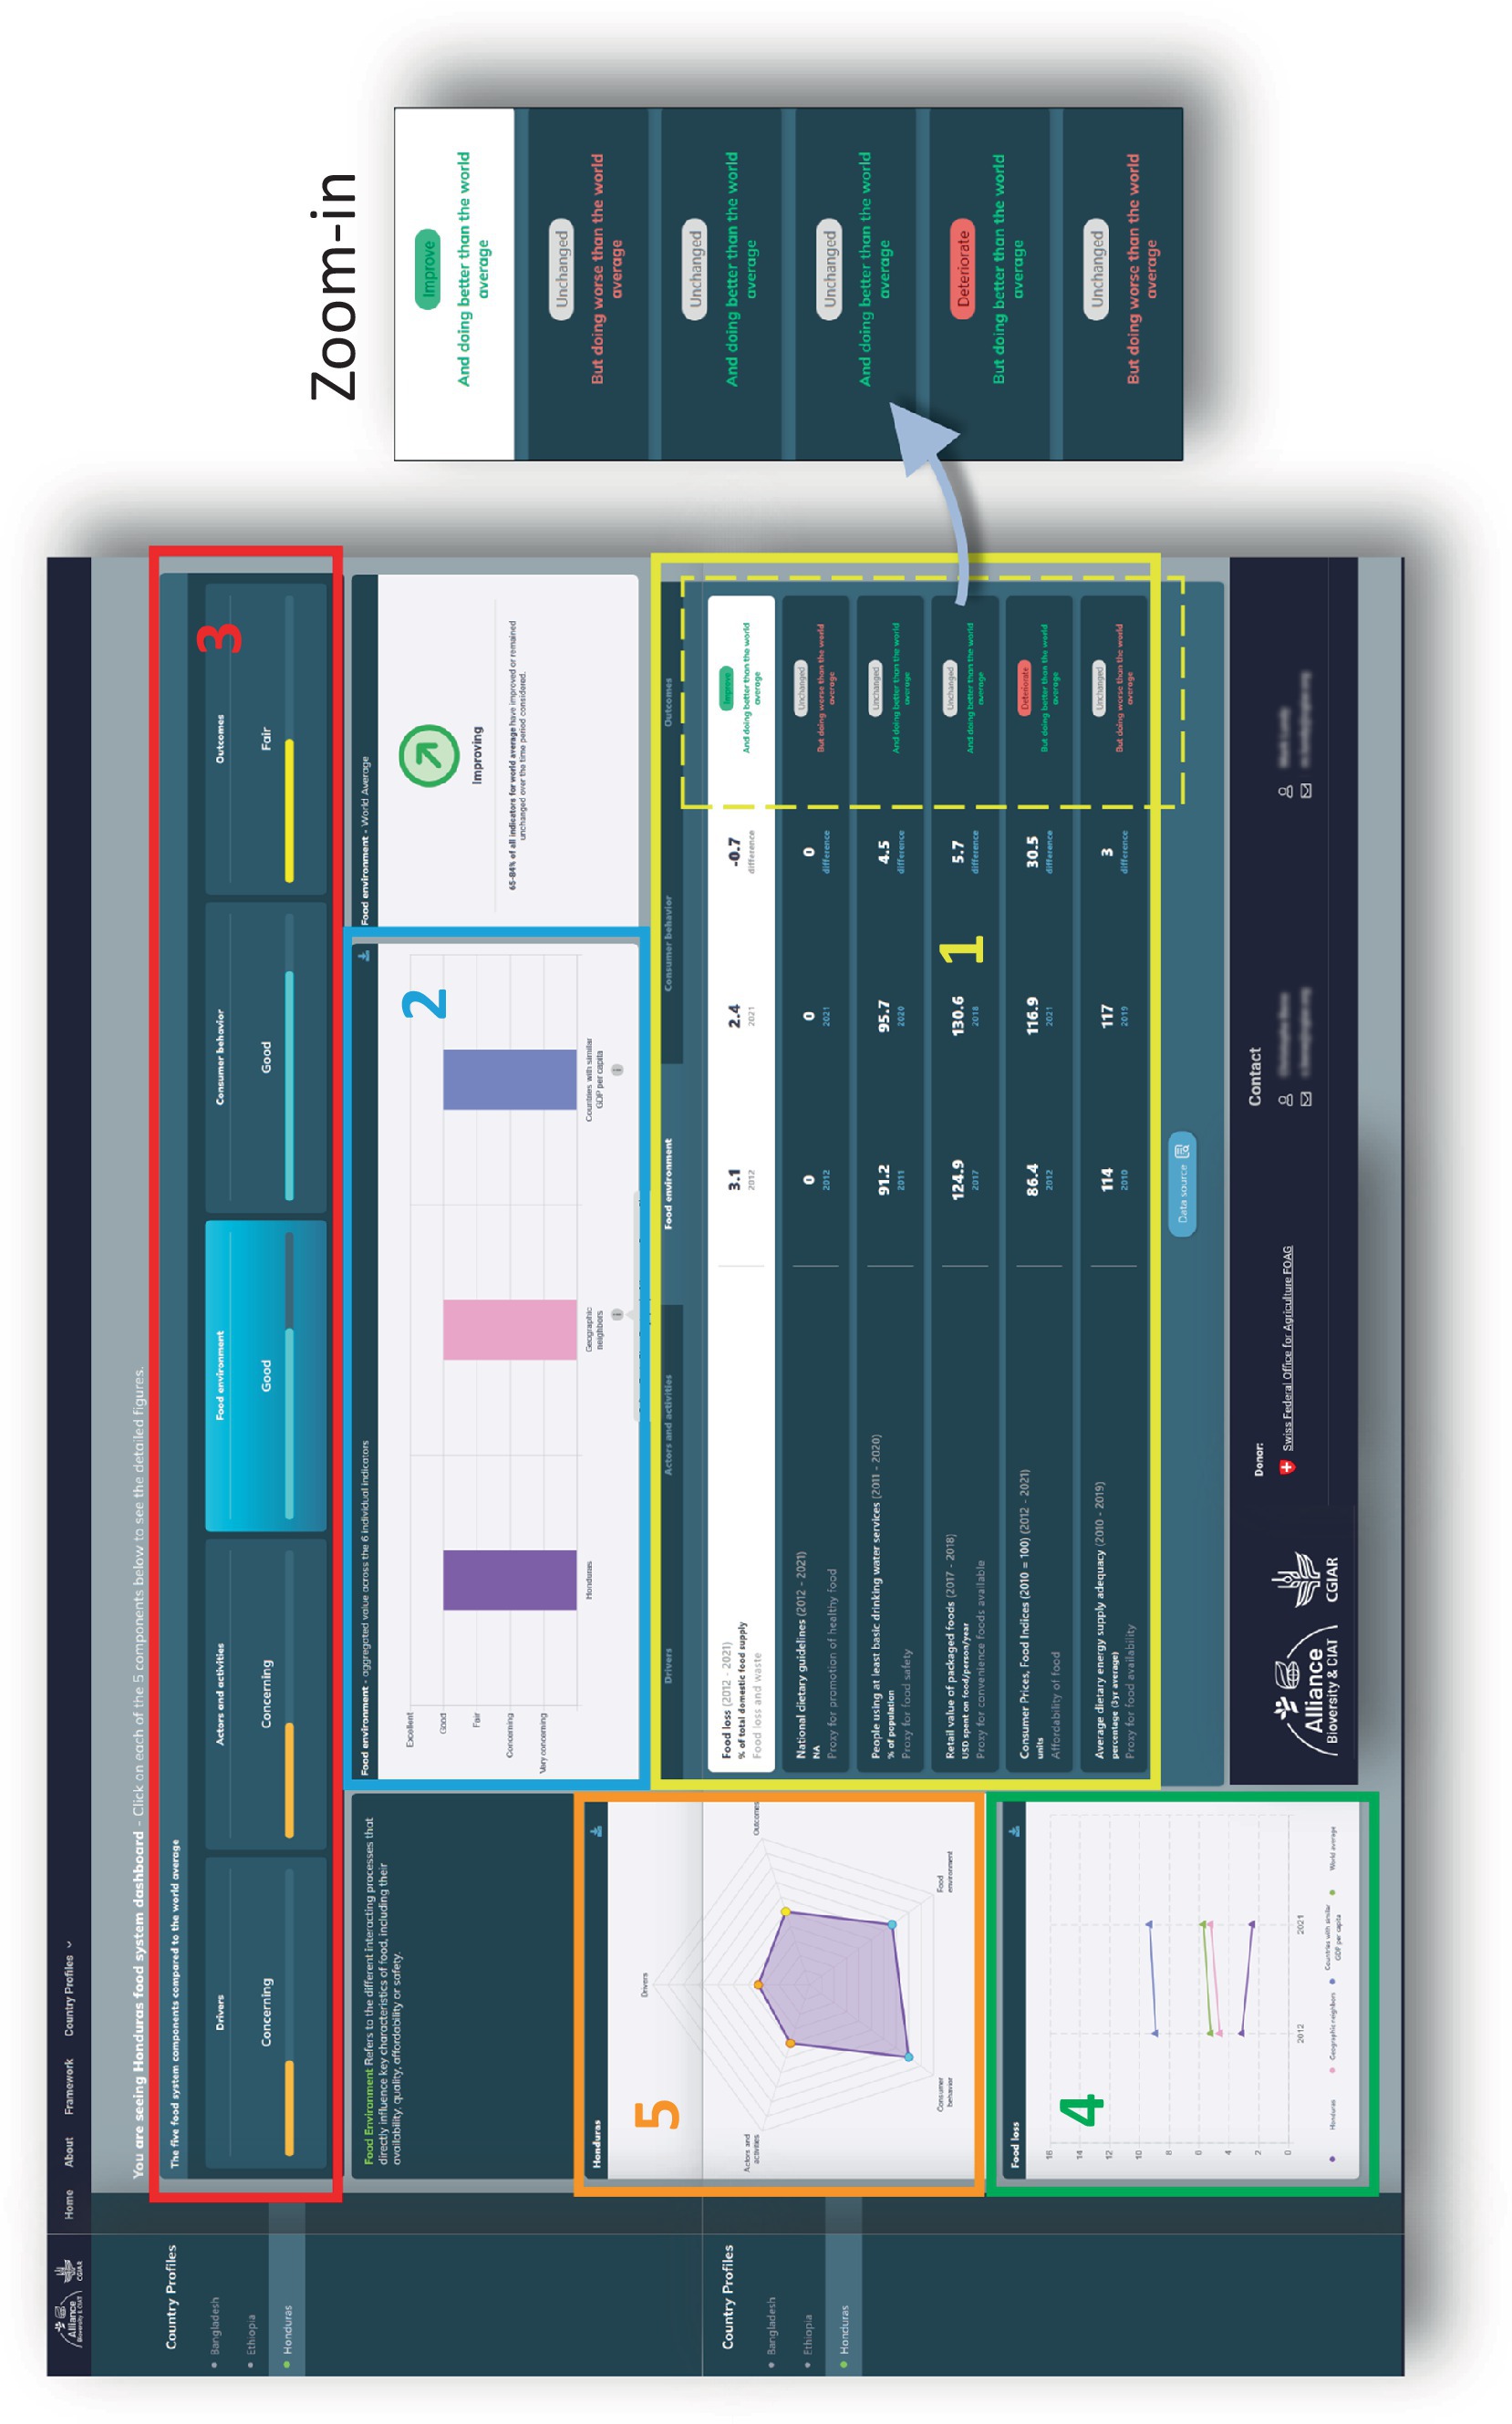
Figure 4. Illustration of the different infographics used on the dashboard of the food system country profile.
The bottom right panel (numbered 1, highlighted in yellow) displays the six indicators that were selected by the stakeholders in Honduras to reflect the status of the food environment, namely food loss, existence of national dietary guidelines, percentage of the population using basic drinking water services, retail value of packaged foods, consumer food price index, and average dietary energy supply adequacy. The zoom-in element shows how the performances of the country’s six indicators are displayed at the far-right hand of panel 1. For each indicator, a first piece of information, presented in the form of a three-level grade (deteriorate—unchanged—improve), informs the viewers about the directionality of the indicator over the last 10-year period. The present case shows that Honduras has improved its situation in relation to food loss but has seen its situation deteriorating with respect to the consumer food price index, while the four other food environment indicators have not significantly changed in the last 10 years. This directionality analysis is combined with a second piece of information (still shown in the right part of panel 1) where the performances of the country are compared with those of the rest of the world, using one of three possible options: “doing better than the rest of the world,” “doing like the rest of the world,” “doing worse than the rest of the world,” based on the averaged values computed for the world comparator group. The combination of these two pieces of information (directionality based on trends over the last 10 years and comparison with the rest of the world) is useful to bring some perspective to the current performance of the country under consideration. For instance, despite the food price index in Honduras showing deterioration over the past 10 years, Honduras still performs better than many other countries worldwide on this indicator. Conversely (as shown earlier in Figure 3), we observed that while the situation regarding urban population growth in Bangladesh (included as a driver of change) has improved over the last 10 years—in the sense that the country has slowed down urban migration—the country’s performance remains below the world global average.
The central panel above (numbered 2 and highlighted in light blue) displays the aggregate performance for the component under consideration—here, food environment—and compares it with that of geographic and economic neighbors, using a five-level performance system: excellent, good, fair, concerning, and very concerning.7 In the present case, the performance across the six food environment indicators places Honduras (as well as its geographic and economic neighbors) at a “good” performance level compared to the rest of the world.
The top horizontal panel above (red panel 3) displays the result of a similar performance exercise conducted for the five components of the food system (drivers, activities and actors, food environment, consumer behavior, and outcomes), thus providing a holistic yet simple overview of the overall performance of the country in comparison to the rest of the world. Panel 5 (middle left, highlighted in orange) is a radar chart of the same result displayed this time with the actual percentages. Finally, the bottom left panel (green numbered 4) displays the 10-year trend analysis for the indicator under consideration (in this case, food loss in Honduras) compared to the trends of the same indicator in the world and in geographic and economic neighbors.8
The selection of indicators for display on the dashboard is designed to be interactive, allowing users to first choose a food system component in panel 3 and then select an indicator from panel 1 for detailed examination. This functionality enables viewers not only to compare the performance of any indicator with three other groups of countries: geographic neighbors, economic neighbors, and the rest of the world but also to see trends over time. In sum, the CP dashboard offers on the same display the possibility to “dive” deep into one specific indicator (explore its time trend, compare it to other relevant country groups) and at the same time to put it into broader perspective, both in relation to other key indicators of the same food system component and in relation to the other components of that food system.
Eventually, the process can be completed just for one indicator, repeated for all the indicators of one particular component, or for the entire food system through the full set of 30 indicators, thus offering the viewers the opportunity to build a mental image (“big picture”) of the food system’s overall status in their countries of interest. The trend analysis helps remind users that food systems are dynamic and constantly evolving in response to changes within and outside the food systems’ boundaries. The comparison with other relevant groups of countries supports thinking as to what may be achievable and what might be limiting factors.
Discussion
In the last 5 years, a large number of initiatives have emerged that propose to compile multi-indicator “compendiums” and “dashboards” alike to describe and monitor countries’ food systems (Zhou et al., 2022; Webb et al., 2023). While the methodology, rigor, and transparency with which these multi-indicator dashboards are being constructed have improved, most of these initiatives, including the most recent ones, still suffer important flaws. Among those is the fact that, in many cases, these compendiums are built on the assumption that the higher the number of indicators available, the more informative these dashboards are. Empirical experience suggests, on the contrary, that the dozens, sometimes hundreds, of indicators that are compiled in these dashboards confuse rather than inform stakeholders. Second, even when it is more concise, this pool of indicators is typically identified by a small group of technical experts, often working in isolation from other stakeholders. When dissemination workshops take place, these are usually conducted to inform national decision-makers of the start or the completion of the project but rarely to invite these stakeholders to contribute to the full construction of the dashboard. In sum, the co-construction element that has been recognized to be a necessary condition for any sustainability project (Karlsson et al., 2018; Nature Editorial, 2018; Norström et al., 2020) is missing here; see however Jacobi et al. (2019). A third issue is that these initiatives generally rely on a set of standard indicators common to all countries. While this eases comparison and multi-country assessments, it overlooks or ignores the uniqueness of individual countries, thus failing to capture the vast differences among countries in terms of their production systems, consumption patterns, natural resources, and demographic profiles.
Against this background, the objective of this paper was 2-fold: first, to present a recent initiative that developed and tested the feasibility of a co-construction process, following a protocol that remains not only rigorous, transparent, and replicable but also operational and country-specific. Second, we aimed to emphasize and demonstrate the importance of the co-construction element of the entire process.
Why dashboards are important
Dashboards are often presented as comprehensive, independent, science-based tools aimed at measuring and monitoring the performance of food system activities, with the ambition to “help achieve meaningful progress by aligning food system actors, recognizing priorities, setting clear targets for actions, and identifying trade-offs” (Fanzo et al., 2021, p.3). The idea is indeed that by helping measure progress (or lack thereof), these dashboards can offer actionable evidence to hold governments and other actors (specifically, those with control and power over food system resources and investment capacities—IPES, 2017; Béné, 2022) accountable for their (no)decision. Beyond this accountability element, regularly measuring and analyzing these indicators can also help understand better the dynamics of the systems and identify potential interactions (synergies or trade-offs) between and within the different components of the systems. For complex systems such as food systems, which remain poorly understood, this analytical element is crucial and represents one of the main reasons behind the development of such descriptive tools (Fanzo et al., 2020). The fact that these dashboards are generally multi-countries is also important as it allows us to draw comparisons and lessons across countries (e.g., Béné et al., 2022).
The food system country profile presented in this paper was built with this initial logic in mind. It was, however, also designed to fulfill other specific features. The first of these features is its holistic nature. By holistic, we mean that food system country profiles should be designed to cover all the main components of a food system: drivers, actors/activities, food environment, consumer choice, and outcomes (as identified by, e.g., HLPE, 2017), cf. Table 1.
The second important feature of the food system country profile is its universal applicability to any country, including data-poor LMICs. Because of its unique protocol and the way indicators are identified, the food system CP can be constructed for any country in the world. This contrasts drastically with many current initiatives, which end up focusing their monitoring effort on a limited subsample of countries for which selected indicators are available. In their review of methodologies developed for assessing sustainable diets and associated indicators, Eme et al. (2019) found, for instance, that over 90% of the 51 initiatives they reviewed focus on high-income countries. The main reason for this bias is the lower availability of data in other parts of the world, where data are often collected infrequently or on an ad hoc basis, making it challenging to build a holistic profile of the food system under consideration (Mauli et al., 2023). Investments in capacity, structures, and institutions should be encouraged to ensure effective, streamlined, and relevant data collection (Webb et al., 2023). The approach adopted for the food system CP presented here—and in particular its steps 4 and 5 (cf. Figure 1)—ensures that indicators selected for each country exist and are publicly available in that specific country.
The third important feature offered by the food system CP is its comparability. The need for such comparability (essentially with “peer” countries and over time) is often identified as a key issue for these types of initiatives (Cirone et al., 2023). In our case, the use of a common framework ensures that (a) all food system components are covered (cf. the holistic nature of the framework above) and that (b) a consistent number of indicators within each of these components is used (cf. Table 4). The comparability is therefore not taking place at the indicator level but at the component level through the different elements of the scoring system (cf. Figure 4), allowing users to assess the performance of the country food systems’ components in a rigorous yet holistic way.
Another part of the comparative analysis relies on an innovative and unique approach involving two aspects: a directionality analysis (improve, unchanged, deteriorate) and a cross-country analysis (country versus geographic neighbors/economic neighbors/world), providing a comprehensive yet straightforward basis for assessment (cf. Figure 4).
Why co-constructed dashboards are important
We detailed above why some of the features built into the food system CP make the latter particularly relevant for decision-makers. In this section, we now propose to discuss another important feature of these CPs, that is, their co-constructed nature.
The literature provides some initial rhetorical reasons why including some degree of co-construction in any food system dashboard is critical. Epistemologically, knowledge co-construction is part of a loosely linked and evolving cluster of participatory and transdisciplinary research approaches that have emerged in recent decades (Etgar, 2008; Sanchez de la Guia et al., 2017). These approaches reject the idea that scientists alone can properly identify issues, analyze problems, and deliver knowledge to society; they argue, on the contrary, that interactive arrangement between academic and non-academic actors is the only solution when it comes to complex societal challenges such as climate change, green transition, and sustainable urbanization (Karlsson et al., 2018; Norström et al., 2020). Sala et al. (2013, p.1692), for instance, contend that these types of analyses need to embrace a “shift from an academic, monodisciplinary and predictive mode of science to a transdisciplinary, participative, uncertain and explorative approach” (our emphasis). These types of approaches give voice and representation to those who are rarely invited to the table, provide mechanisms for downwards accountability, and can help spur new social norms (Vermeulen et al., 2020; Spires et al., 2023). Some recent research, for instance, used participatory methods to identify visions for desirable food systems (Belisle-Toler et al., 2021; Karan et al., 2023). Karlsson et al. (2018, p.4) remark, “The process of designing such futures (…) is inevitably associated with unavoidable normative decisions at different levels that have to be taken in a democratic and transparent process by key stakeholders rather than researchers.” More and more examples of these co-constructed visioning exercises are now available. We argue, however, that the involvement of stakeholders should not be limited to a vision exercise but should also include the choice of indicators, as this choice entails political decisions, not just scientific or technical ones. Scientists should, of course, be part of it, especially to facilitate and ensure that the selection process and the resulting set of indicators are both consistent with the systemic nature of food systems and are sound and valid (in the sense that the methodology that has been used to identify those indicators is replicable and robust). But ultimately, selecting one specific indicator over another is a political decision, not an academic one.
Beyond these conceptual and theoretical considerations, several pragmatic reasons for emphasizing the importance of co-construction emerge. First and foremost, we need to ensure that we capture the countries’ food system-specific nature through the selection of these indicators. Not two single countries’ food systems are identical; rather, they vary significantly in their structure or even in their consumers’ dietary patterns. Participatory processes are therefore necessary to capture and reflect these specificities, as there is little chance that a panel of international experts could do the job. This is especially true for LMICs, where food systems are dominated by informal actors and local processes (Spires et al., 2023).
Along with the imperative to capture and reflect the context-specific elements of the system is the need to ensure genuine ownership of the process. At a time when science in general, and agriculture and food system in particular, are accused of perpetuating forms of neo-colonialism (Taylor, 2017; de Vos, 2020; Haelewaters et al., 2021), and when the UNFSS process is being severely criticized for its poor representativeness of LMICs’ interests (FIAN, 2021; Nisbett et al., 2021), it is crucial to cultivate a strong sense of ownership among national and local stakeholders, ideally through their active involvement in the process from the start. Building this ownership helps ensure a shared understanding of the CP as well as an increase in the likelihood that stakeholders will use it. In Honduras, for instance, the Office of the UN Resident Coordinator for Honduras requested to play a prominent role in the process and insisted the resulting CP be linked to the UNFSS country dialogues process; the Honduran Private Sector Council (COHEP) published an op-ed in their own social media about the CP initiative and their participation,9 and the new Minister of Agriculture requested to be convenor of the launch of the food systems CP to ensure attendance of government and media at a time when they were proposing a transition from an agricultural to an agri-food policy for the sector.10
Co-construction, not just participation
Co-construction is more than just participation. In particular, a critical element in the co-construction process is its iterative nature. Norström and his colleagues define knowledge co-production in the context of sustainability research as: “Iterative and collaborative processes involving diverse types of expertise, knowledge and actors to produce context-specific knowledge and pathways toward a sustainable future” (2020, p.183). In their view, the process has to be “iterative” because “there is no single approach for success” and “collaborative” because “the act of engagement across domains and disciplines can be as important for the pursuit of sustainability as the production of knowledge.” Other studies also emphasize this iterative element in the context of food system knowledge building. Karlsson et al. (2018), for instance, drawing on Volkery et al. (2008) and Mauser et al. (2013)’s methodologies, used an iterative stakeholder integration process to design and model the future food vision for the Nordic countries. They remark, “The process was iterated until a compelling and reasonable set of decisions and model outputs was obtained” (Karlsson et al., 2018, p.3). There are, however, some important caveats here. Of particular note is that while co-construction needs iteration, iteration in itself is not sufficient to create co-construction. A good counter-example is the Delphi technique: although the Delphi method is an iterative knowledge-generating exercise aiming at reaching consensus (Hsu and Sandford, 2007), it is generally conducted with groups of selected experts, not with stakeholders, limiting therefore greatly its potential for proper co-construction, −see, e.g., Allen et al. (2019) or Fanzo et al. (2021).
Finally, the co-construction process produces more than just knowledge; it “develops capacity, builds networks, fosters social capital, and implements actions that contribute to sustainability” (Norström et al., p.183). In our case, the co-construction process did not just ensure the making of a good dashboard. It also led to change in the stakeholders’ perceptions and hopefully improved their relationship to data and how they understand food systems. Although this is still to be confirmed, we argue that we might see more actions of stakeholders influenced by them having been in the process than by them having used the dashboard. While quotes are not evidence, the comment from one of the Honduras participants illustrates well our argument: “This process brought invaluable learning because it has allowed me to exchange ideas and technical criteria with other colleagues from the government through UTSAN, academia, NGOs, international cooperation and private sector organizations. We also learned about experiences and lessons learned by other countries that have implemented it, such as Vietnam, Bangladesh, and Colombia (in the city region of Cali), which generated inputs for the characterization and improvement of our food system” (Participant X).
Remaining challenges
Beyond the successful implementation of this particular initiative, a series of challenges remain in relation to the construction of food system dashboards in general. We propose to finish this discussion section with a summary of these challenges.
Dynamic nature of food systems−Food systems are dynamic and can be influenced by various factors such as climate change, economic shifts, technological advancements, local armed conflicts, or geopolitical (in)stability (Chaudhary et al., 2018; Fanzo et al., 2020; Herforth et al., 2022; Hassoun et al., 2024). Adapting indicators to reflect these changes and staying up-to-date with emerging trends poses a constant challenge (Oteros-Rozas et al., 2019; Mottet et al., 2020; Béné et al., 2024), especially in data-poor countries.
Interconnectedness of indicators − Food systems are complex and interconnected (Ericksen, 2008). Changes in one aspect of the system may have ripple effects across others (Béné et al., 2020; Schneider et al., 2023). Attempting to isolate and quantify the impact of specific interventions or changes on a single indicator is, therefore, inherently difficult and may, in fact, be misleading. This complexity is amplified when dealing with multiple interrelated indicators, making it even more challenging to discern the impacts’ origin (Zhou et al., 2022).
Data quality and availability − The gaps in data availability or even the reliability and accuracy of data can be a significant challenge—especially for LMICs (Jacobi et al., 2019; Karan et al., 2023; Mauli et al., 2023). This often hinders our ability to get a complete and accurate picture of the food system. The use of inappropriate data could lead to flawed analyses, misinterpretation, and misguided policies.
Limited resources for monitoring − Establishing and maintaining a robust monitoring system requires financial and human resources (HLPE, 2022). Many countries, especially those with limited resources, may face challenges in allocating sufficient funds and personnel to effectively monitor and evaluate their food systems (Mauli et al., 2023).
Lack of standardization − The absence of standardized indicators and measurement methods makes it difficult to compare progress across countries or regions (Chaudhary et al., 2018; Béné et al., 2019; Zhou et al., 2022). The current lack of consistency in data collection and reporting hinders the development of meaningful benchmarks and global comparisons (Béné et al., 2019; Fanzo et al., 2020, 2021).
Community and cultural variability − Indicators may not always capture the nuances of local communities and cultural practices (Carey and Dubbeling, 2017; Andress et al., 2020; Belisle-Toler et al., 2021). Food systems, being partially social constructs, cannot be boiled down to just quantitative indicators. Attempting to approach food system analysis solely through the lens of quantitative metrics risks oversimplification. Such perspectives may favor technical problem-solving approaches, grounded in quantitative objectives, over other more nuanced perspectives, and potentially miss the critical need to reevaluate values and question the foundational structures of food systems.
National-level aggregation − The aggregation of data at the national level might not be able to capture the nuances/specificities within individual countries. This is particularly true in the context of large and diverse nations such as Brazil, India, and Nigeria (e.g., Norde et al., 2023), where the amalgamation of data at the national level fails to represent diverse subpopulations and unique regional characteristics. Policies and interventions guided only by national-level data risk overlooking the granularity needed for addressing region-specific issues and fostering targeted development strategies.
Political and institutional challenges − Monitoring progress may be affected by both political considerations and institutional challenges. Political considerations create a first layer of complexity by shaping the agenda and influencing decision-making processes (choice of indicators, interpretation of progress, etc.). It is important to recognize and not hide from this political dynamic/nature (Leeuwis et al., 2021; Marshall et al., 2021). In addition, institutional challenges—which relate more to bureaucratic hurdles, resource constraints, institutional inertia, etc.—impede data collection, data analysis, timely results dissemination, etc.
Addressing these different challenges (from the dynamic nature of food systems to the political element of their monitoring) will require constant dialogues between governments, researchers, international organizations, and key stakeholders (including local communities) to develop effective monitoring strategies that are adaptable, context-specific, and capable of providing meaningful insights into the complexities of food systems.
Conclusion
The objective of this study was to showcase the relevance and feasibility of the food system country profile—a co-constructed food system dashboard aimed at providing a holistic overview of food system performances. The study documents how the co-construction of those profiles can be done in a way that remains rigorous, replicable, and operational, and insists on the importance of the co-construction process.
The approach has already been tested in three countries (Bangladesh, Ethiopia, and Honduras) and is currently being implemented in two others (Cambodia and Vietnam), paving the way for the development of similar profiles in a larger number of LMICs. The aim is to progressively build decision-makers’ capacities and knowledge in those LMICs on the current state of their food systems, supporting them in making more informed and evidence-based decisions with the long-term ambition to curb current negative outcomes (triple burden, environmental footprint, social or economic inefficiency, food safety, food waste and losses, etc.) and contribute to improving the sustainability of those food systems.
Data availability statement
The original contributions presented in the study are included in the article/supplementary material, further inquiries can be directed to the corresponding author.
Author contributions
CB: Conceptualization, Formal analysis, Funding acquisition, Investigation, Methodology, Project administration, Supervision, Validation, Visualization, Writing – original draft, Writing – review & editing. CC: Conceptualization, Data curation, Formal analysis, Investigation, Methodology, Validation, Writing – original draft, Writing – review & editing. BE: Writing – original draft, Writing – review & editing. RH: Conceptualization, Data curation, Formal analysis, Investigation, Methodology, Validation, Writing – original draft, Writing – review & editing. ML: Conceptualization, Funding acquisition, Methodology, Supervision, Writing – original draft, Writing – review & editing. SP: Conceptualization, Methodology, Validation, Writing – original draft, Writing – review & editing. JW: Conceptualization, Data curation, Investigation, Methodology, Validation, Writing – original draft, Writing – review & editing.
Funding
The author(s) declare that financial support was received for the research, authorship, and/or publication of this article. This study was funded by the Swiss Federal Office for Agriculture and the CGIAR Sustainable and Healthy Diet through Food System Transformation (SHiFT) initiative.
Conflict of interest
The authors declare that the research was conducted in the absence of any commercial or financial relationships that could be construed as a potential conflict of interest.
Publisher’s note
All claims expressed in this article are solely those of the authors and do not necessarily represent those of their affiliated organizations, or those of the publisher, the editors and the reviewers. Any product that may be evaluated in this article, or claim that may be made by its manufacturer, is not guaranteed or endorsed by the publisher.
Footnotes
1. ^In that case, it is important to obtain the commitment from the existing platform to the complete process and it might also be important to broaden the existing stakeholder group as needed to ensure adequate coverage of the entire food system.
2. ^In that case, obtaining commitment to the full process from the highest levels within stakeholder institutions is important to ensure that participants have institutional support for their involvement in the process. In this step, stakeholders are engaged to provide inputs into the constitution or selection of the stakeholder group and the organization of the process based on country context and multi-stakeholder dynamics.
3. ^We use Béné et al. (2019)‘s definition of food system drivers, namely: “endogenous or exogenous processes that deliberately or unintentionally affect or influence a food system over a long-enough period of time so that their impacts result in altering durably the activities [or actors], and subsequently the outcomes, of that system” (p.152. modified by us). In that context, while price volatility or one-off conflicts cannot be considered drivers, constant increase (or decrease) in food price over a long period of time, or occurrence of protracted/prolonged conflicts in a region would be considered as drivers.
4. ^To account for the fact that the maximum value for some criteria is 3 and 5 for others, the scores are normalized before being added.
5. ^To minimize potential issue related to time difference between the focal country (country A) and the other countries, we include only those countries for which the indicator has been recorded at least once within a 5-year window centered on the year for which we have data for country A.
6. ^The other pages of the website include the general introduction of the CP initiative and the objective, methodology, and generic framework. See https://food-system-country-profiles.cgiar.org/.
7. ^See https://food-system-country-profiles.cgiar.org/ for definitions of the five-level performance system (excellent; good; fair; concerning; and very concerning) used in panels 2 and 3.
8. ^It is similar to what was presented earlier in Figure 3 for urban population growth in Bangladesh.
9. ^See https://www.voxpopulihn.com/los-sistemas-alimentarios-sostenibles-una-oportunidad-para-honduras
10. ^See their website: https://www.prensa.sag.gob.hn/2022/12/05/honduras-pone-en-la-pizarra-como-esta-y-hacia-donde-va-su-sistema-alimentario/
References
Allen, T., Prosperi, P., Cogill, B., Padilla, M., and Peri, I. (2019). A Delphi approach to develop sustainable food system metrics. Soc. Indic. Res. 141, 1307–1339. doi: 10.1007/s11205-018-1865-8
Andrade, G. C., Gombi-Vaca, M. F., Louzada, M., Azeredo, C. M., and Levy, R. B. (2020). The consumption of ultra-processed foods according to eating out occasions. Public Health Nutr. 23, 1041–1048. doi: 10.1017/S1368980019002623
Andress, L., Byker Shanks, C., Hardison-Moody, A., Prewitt, T. E., Kinder, P., and Haynes-Maslow, L. (2020). The curated food system: a limiting aspirational vision of what constitutes “good” food. Int. J. Environ. Res. Public Health 17:6157. doi: 10.3390/ijerph17176157
Balvanera, P., Daw, T., Gardner, T. A., Martín-López, B., Norström, A. V., Ifejika Speranza, C., et al. (2017). Key features for more successful place-based sustainability research on social-ecological systems: a Programme on ecosystem change and society (PECS) perspective. Ecol. Soc. 22:14. doi: 10.5751/ES-08826-220114
Belisle-Toler, R., Hodbod, J., and Wentworth, C. (2021). A mixed methods approach to exploring values that inform desirable food-systems futures. Sustain. Sci. Pract. Policy 17, 362–376. doi: 10.1080/15487733.2021.1996768
Béné, C. (2022). Why food systems’ great transformation may not happen … a deep-dive into food systems’ political economy, controversies and politics of evidence. Word Dev. 154:105881. doi: 10.1016/j.worlddev.2022.105881
Béné, C., and Devereux, S. (eds.) (2023). Resilience and food security in a food systems context. Palgrave Studies in Agricultural Economics and Food Policy, Palgrave Macmillan.
Béné, C., Fanzo, J., Achicanoy, H. A., and Lundy, M. (2022). Can economic development be a driver of food system sustainability? Empirical evidence from a global sustainability index and a multi-country analysis. PLOS Sustain. Transform. 1:e0000013. doi: 10.1371/journal.pstr.0000013
Béné, C., Fanzo, J., Prager, S. D., Achicanoy, H. A. E., Mapes, B. R., Alvarez, T. P., et al. (2020). Global drivers of food system (un)sustainability: a multi-country correlation analysis. PLoS One 15:e0231071. doi: 10.1371/journal.pone.0231071
Béné, C., Lundy, M.M., Achicanoy Estrella, H.A., Chege, C.G.K., Hernandez Barco, R.A., and Wiegel, J.R. (2023). Food system country profiles. Available at: https://food-system-country-profiles.cgiar.org/
Béné, C., Maitre, D. H. E., Pelloquin, R., Badaoui, O., Garba, F., and Sankima, J. (2024). Resilience – and collapse – of local food systems in conflict affected areas; reflections from Burkina Faso. World Dev. 176:106521. doi: 10.1016/j.worlddev.2023.106521
Béné, C., Prager, S. D., Achicanoy, H. A. E., Alvarez, T. P., Lamotte, L., Bonilla, C. C., et al. (2019). Global map and indicators of food system sustainability. Sci. Data 6:279. doi: 10.1038/s41597-019-0301-5
Carey, J., and Dubbeling, M. (2017). City region food system indicator framework. Available at: https://ruaf.org/document/city-region-food-system-indicator-framework/ (Accessed September 28, 2023).
Chaido Anthouli, A., Tsouti, C., and Valta, K. (2022). FoodShift 2030: validated core set of foodShift indicators. Available at: https://foodshift2030.eu/ (Accessed September 28, 2023).
Chaudhary, A., Gustafson, D., and Mathys, A. (2018). Multi-indicator sustainability assessment of global food systems. Nat. Commun. 9, 848–813. doi: 10.1038/s41467-018-03308-7
Cirone, F., Petruzzelli, M., De Menna, F., Samoggia, A., Buscaroli, E., Durante, E., et al. (2023). A sustainability scoring system to assess food initiatives in city regions. Sustain. Prod. Consum. 36:88–99. doi: 10.1016/j.spc.2022.12.022
Downs, S. M., Ahmed, S., Fanzo, J., and Herforth, A. (2020). Food Environment typology: advancing an expanded definition, framework, and methodological approach for improved characterization of wild, cultivated, and built food environments toward sustainable diets. Food 9:532. doi: 10.3390/foods9040532
de Vos, A. (2020). The problem of “colonial science” in Scientific American. Available at: https://www.scientificamerican.com/article/the-problem-of-colonial-science/
Du Toit, A. (2012). “Making sense of evidence: notes on the discursive politics of research and pro-poor policy making” in PLAAS Working Paper No.21. PLAAS, Cape Town.
Eme, P. E., Douwes, J., Kim, N., Foliaki, S., and Burlingame, B. (2019). Review of methodologies for assessing sustainable diets and potential for development of harmonised indicators. Int. J. Environ. Res. Public Health 16:1184. doi: 10.3390/ijerph16071184
Ericksen, P. J. (2008). Conceptualizing food systems for global environmental change research. Glob. Environ. Chang. 18, 234–245. doi: 10.1016/j.gloenvcha.2007.09.002
Etgar, M. (2008). A descriptive model of the consumer co-production process. J. Acad. Mark. Sci. 36, 97–108. doi: 10.1007/s11747-007-0061-1
Fanzo, J., Haddad, L., Mclaren, R., Marshall, Q., Davis, C., Herforth, A., et al. (2020). The food systems dashboard is a new tool to inform better food policy. Nat. Food 1, 243–246. doi: 10.1038/s43016-020-0077-y
Fanzo, J., Haddad, L., Schneider, K., Béné, C., Covic, N. M., Guarin, A., et al. (2021). Viewpoint: rigorous monitoring is necessary to guide food system transformation in the countdown to the 2030 global goals. Food Policy 104:102163. doi: 10.1016/j.foodpol.2021.102163
FAO (2018). Sustainable food systems—concept and framework. Food and Agriculture Organization, Rome. Available at: https://www.fao.org/3/ca2079en/CA2079EN.pdf
FAO, (2021). IFAD, UNICEF, WFP and WHO, The state of food security and nutrition in the world 2021: transforming food Systems for Food Security, Improved Nutrition and Affordable Healthy Diets for All Rome.
Farmery, A., Andrew, N. L., Brewer, T., Maelaua, J., Mauli, S., Scott, J., et al. (2023). National assessment of the Solomon Islands food system. Honiara. Accessed September 28, 2023.
FIAN (2021). Q & A: (almost) all you need to know about the UNFSS: Dissecting and digesting what's behind the controversy-ridden 2021 UN food systems Summit: FIAN International; Available at: https://www.fian.org/en/publication/article/q-a-almost-all-you-need-to-know-about-the-unfss-2840
Ghosh, A., Sarkar, D., Pal, R., and Mukherjee, B. (2015). Correlates of overweight and obesity among urban adolescents in Bihar, India. J. Family Med. Prim. Care 4, 84–88. doi: 10.4103/2249-4863.152261
Haelewaters, D., Hofmann, T. A., and Romero-Olivares, A. L. (2021). Ten simple rules for global north researchers to stop perpetuating helicopter research in the global south. PLoS Comput. Biol. 17:e1009277. doi: 10.1371/journal.pcbi.1009277
Hassoun, A., Al-Muhannadi, K., al-Muhannadi, K., Hassan, H. F., Hamad, A., Khwaldia, K., et al. (2024). From acute food insecurity to famine: how the 2023/2024 war on Gaza has dramatically set back sustainable development goal 2 to end hunger. Front. Sustain.Food Syst. 8:1402150. doi: 10.3389/fsufs.2024.1402150
Hebinck, A., Zurek, M., Achterbosch, T., Forkman, B., Kuijsten, A., Kuiper, M., et al. (2021). A sustainability compass for policy navigation to sustainable food systems. Glob. Food Secur. 29:100546. doi: 10.1016/j.gfs.2021.100546
Herforth, A., and Ahmed, S. (2015). The food environment, its effects on dietary consumption and potential for measurement within agriculture-nutrition interventions. Food Secur. 7, 505–520. doi: 10.1007/s12571-015-0455-8
Herforth, A., Bellows, A. L., Marshall, Q., McLaren, R., Beal, T., Nordhagen, S., et al. (2022). Diagnosing the performance of food systems to increase accountability toward healthy diets and environmental sustainability. PLoS One 17:e0270712. doi: 10.1371/journal.pone.0270712
HLPE (2017). Nutrition and food systems. A report by the high level panel of experts on food security and nutrition of the committee on world food security, Rome.
HLPE (2022). Data collection and analysis tools for food security and nutrition: towards enhancing effective, inclusive, evidence-informed, decision making. A report by the high level panel of experts on food security and nutrition of the committee on world food security. Rome. Available at: https://www.fao.org/3/cc1865en/cc1865en.pdf
Hsu, C.-C., and Sandford, B. A. (2007). The Delphi technique: making sense of consensus. Pract. Assess. Res. Eval. 12. doi: 10.7275/pdz9-th90
IPES (2017). Too big to feed: Exploring the impacts of mega-mergers, consolidation, and concentration of power in the Agri-food sector. International panel of experts on sustainable food systems, 108 p.
Jacobi, J., Wambugu, G., Ngutu, M., Augstburger, H., Mwangi, V., Zonta, A., et al. (2019). Mapping food systems: a participatory research tool tested in Kenya and Bolivia. Mt. Res. Dev. 39, R1–R11. doi: 10.1659/MRD-JOURNAL-D-18-00024.1
Karan, R., Mowlds, S., McKeown, P. C., Lundy, M., and Spillane, C. (2023). Data for decision-making for sustainable food systems transformation in the eastern cape of South Africa: what is needed? Front. Sustain. Food Syst. 7:1243466. doi: 10.3389/fsufs.2023.1243466
Karlsson, J. O., Carlsson, G., Lindberg, M., Sjunnestrand, T., and Röös, E. (2018). Designing a future food vision for the Nordics through a participatory modeling approach. Agron. Sustain. Dev. 38:59. doi: 10.1007/s13593-018-0528-0
Leeuwis, C., Boogaard, B. K., and Atta-Krah, K. (2021). How food systems change (or not): governance implications for system transformation processes. Food Secur. 13, 761–780. doi: 10.1007/s12571-021-01178-4
Marshall, Q., Bellows, A. L., Mclaren, R., Jones, A. D., and Fanzo, J. (2021). You say you want a data revolution? Taking on food systems accountability. Agriculture 11:422. doi: 10.3390/agriculture11050422
Mauli, S., Maelaua, J., Reeve, E., Thow, A. M., Johnson, E., Farrell, P., et al. (2023). Systemic capacity in food system governance in the Solomon Islands: "its more than just training". Sustain. For. 15:10710. doi: 10.3390/su151310710
Mauser, W., Klepper, G., Rice, M., Schmalzbauer, B. S., Hackmann, H., Leemans, R., et al. (2013). Transdisciplinary global change research: the co-creation of knowledge for sustainability. Curr. Opin. Environ. Sustain. 5, 420–431. doi: 10.1016/j.cosust.2013.07.001
Melesse, M. B., van den Berg, M., Béné, C., de Brauw, A., and Brouwer, I. D. (2020). Metrics to analyze and improve diets through food systems in low and middle-income countries. Food Secur. 12, 1085–1105. doi: 10.1007/s12571-020-01091-2
Mottet, A., Bicksler, A., Lucantoni, D., de Rosa, F., Scherf, B., Scopel, E., et al. (2020). Assessing transitions to sustainable agricultural and food systems: a tool for agroecology performance evaluation (TAPE). Front. Sustain.Food Syst. 4:579154. doi: 10.3389/fsufs.2020.579154
Nature Editorial (2018). The best research is produced when researchers and communities work together. Nature 562:7. doi: 10.1038/d41586-018-06855-7
Nisbett, N., Friel, S., Aryeetey, R., Gomes, F. S., Harris, J., Backholer, K., et al. (2021). Equity and expertise in the UN food systems summit. BMJ Glob. Health 6:e006569. doi: 10.1136/bmjgh-2021-006569
Norde, M. M., Porciuncula, L., Garrido, G., Nunes-Galbes, N. M., Sarti, F. M., Marchioni, D. M. L., et al. (2023). Measuring food systems sustainability in heterogenous countries: the Brazilian multidimensional index updated version applicability. Sustain. Dev. 31, 91–107. doi: 10.1002/sd.2376
Norström, A. V., Cvitanovic, C., Löf, M. F., West, S., Wyborn, C., Balvanera, P., et al. (2020). Principles for knowledge co-production in sustainability research. Nat. Sustain. 3, 182–190. doi: 10.1038/s41893-019-0448-2
Oteros-Rozas, E., Ruiz-Almeida, A., Aguado, M., González, J. A., and Rivera-Ferre, M. G. (2019). A social–ecological analysis of the global Agrifood system. Proc. Natl. Acad. Sci. 116, 26465–26473. doi: 10.1073/pnas.1912710116
Powell, M. (2006). Which knowledge? Whose reality? An overview of knowledge used in the development sector. Dev. Pract. 1, 518–532. doi: 10.1080/09614520600957951
Sala, S., Farioli, F., and Zamagni, A. (2013). Life cycle sustainability assessment in the context of sustainability science progress (part 2). Int. J. Life Cycle Assess. 18, 1686–1697. doi: 10.1007/s11367-012-0509-5
Sanchez de la Guia, L., Puyuelo Cazorla, M., and de-Miguel-Molina, B. (2017). Terms and meanings of participation in product design: From user involvement to co-design. Des. J. 20, S4539–S4551. doi: 10.1080/14606925.2017.1352951
Schneider, K., Fanzo, J., Haddad, L., Herrero, M., Moncayo, J. R., Herforth, A., et al. (2023). The state of food systems worldwide in the countdown to 2030. Nat. Food 4, 1090–1110. doi: 10.1038/s43016-023-00885-9
Spires, M., Battersby, J., Cohen, N., Daivadanam, M., Demmler, K. M., Mattioni, D., et al. (2023). The People’s, Summit: A case for lived experience of food environments as a critical source of evidence to inform the follow-up to the 2021 UN Food Systems Summit. Glob. Food Secur. 37, 100–690. doi: 10.1016/j.gfs.2023.100690
Taylor, R (2017). Using agroecology to oppose neo-colonialism: Institute of Development Studies. Available at: https://www.ids.ac.uk/opinions/using-agroecology-to-oppose-neo-colonialism/
The Economist Intelligence Unit (2021). Food sustainability index 2021 global executive summary food sustainability index 2021: Global executive summary 2. The Economist Group.
The Rockefeller Foundation (2023). FS-TIP food systems analysis toolkit. Available at: https://www.rockefellerfoundation.org/fs-tip-food-systems-analysis-toolkit/ (Accessed September 28, 2023).
Turner, C., Aggarwal, A., Walls, H., Herforth, A., Drewnowski, A., Coates, J., et al. (2018). Concepts and critical perspectives for food environment research: A global framework with implications for action in low- and middle-income countries. Glob. Food Secur. 18, 93–101. doi: 10.1016/j.gfs.2018.08.003
UNEP (2019) 10-year framework of Programmes on sustainable consumption and production patterns, One Planet Network Sustainable Food Systems Programme, United Nations Environment Programme.
van der Hel, S. (2016). New science for global sustainability? The institutionalisation of knowledge co-production in future earth. Environ. Sci. Pol. 61, 165–175. doi: 10.1016/j.envsci.2016.03.012
Verburg, P. H., Crossman, N., Ellis, E., Heinimann, A., Hostert, P., Mertz, O., et al. (2015). Land system science and sustainable development of the earth system: a global land project perspective. Anthropocene 12, 29–41. doi: 10.1016/j.ancene.2015.09.004
Vermeulen, S., Park, T., Khoury, C., and Béné, C. (2020). Changing diets and the transformation of the global food system. Ann. N. Y. Acad. Sci. 1478, 3–17. doi: 10.1111/nyas.14446
Volkery, A., Ribeiro, T., Henrichs, T., and Hoogeveen, Y. (2008). Your vision or my model? Lessons from participatory land use scenario development on a European scale. Syst. Pract. Action Res. 21, 459–477. doi: 10.1007/s11213-008-9104-x
Weaver, C. P., Mooney, S., Allen, D., Beller-Simms, N., Fish, T., Grambsch, A. E., et al. (2014). From global change science to action with social sciences. Nat. Clim. Chang. 4, 656–659. doi: 10.1038/nclimate2319
Webb, P., Livingston, S. K., Lee, H., Howell, B., Battaglia, K., Bell, B. M., et al. (2023). Measurement of diets that are healthy, environmentally sustainable, affordable, and equitable: a scoping review of metrics, findings, and research gaps. Front. Nutr. 10:1125955. doi: 10.3389/fnut.2023.1125955
WFP (n.d.). Hunger map, world food program. Available at: https://hungermap.wfp.org/
Keywords: food systems, assessment, dashboard, co-construction, Bangladesh, Ethiopia, Honduras
Citation: Béné C, Chege CK, Even B, Hernandez RA, Lundy M, Prager SD and Wiegel J (2024) Why building participatory dashboards is key for sustainable food system transformation. Front. Sustain. Food Syst. 8:1405670. doi: 10.3389/fsufs.2024.1405670
Edited by:
Gary Wingenbach, Texas A&M University, United StatesReviewed by:
Viswanathan Pozhamkandath Karthiayani, Amrita Vishwa Vidyapeetham (Amritapuri Campus), IndiaRami Zurayk, American University of Beirut, Lebanon
Copyright © 2024 Béné, Chege, Even, Hernandez, Lundy, Prager and Wiegel. This is an open-access article distributed under the terms of the Creative Commons Attribution License (CC BY). The use, distribution or reproduction in other forums is permitted, provided the original author(s) and the copyright owner(s) are credited and that the original publication in this journal is cited, in accordance with accepted academic practice. No use, distribution or reproduction is permitted which does not comply with these terms.
*Correspondence: Christophe Béné, Yy5iZW5lQGNnaWFyLm9yZw==