 Kelly M. Suttles1*
 Brian V. Smoliak2
 Aditya P. Ranade2Samuel F. Potter2
 Marika Jaeger3
 Eileen L. McLellan4
- 1Environmental Defense Fund, Raleigh, NC, United States
- 2Two Degrees Adapt, Minneapolis, MN, United States
- 3Environmental Defense Fund, New York, NY, United States
- 4Environmental Defense Fund, Washington, DC, United States
Introduction: Advances in farming technologies and practices have helped farmers to increase crop yields, but continued production increases – while needed to feed a growing global population – are being hindered by climate change and other environmental challenges. Kansas, a globally important region for wheat production, is already experiencing threats to staple crop production. This study explores one possible alternative future for Kansas crop production in which farmers could, by crop switching, continue to grow nutrient-rich crops while responding to hotter temperatures and increasing water demand.
Methods: We used a combination of climate and crop modeling with simple water budgets to identify optimal crop mixes under anticipated climatic and water constraints. Interviews with Kansas farmers helped identify feasible crop switching options: sorghum instead of corn (maize), winter rye and winter oats instead of winter wheat, and millet instead of soybeans.
Results: Our analysis suggests that a sizeable proportion of current Kansas cropland would need to shift to these alternative crops by 2050 to meet anticipated water constraints and produce equivalent nutritional value under projected climate conditions. Alternative crops could increase from 16% of Kansas' crop area in 2021 to 43% of the area in 2050, resulting in a reduction in 2050 crop water demand of 12% relative to that of the current crop mix. This crop water demand reduction would be concentrated in parts of the state that will experience the greatest change in water needs between today and mid-century due to changing climate conditions.
Discussion: Our analysis shows that, by changing (diversifying) the mix of crops grown, it is biophysically possible for crop production in Kansas to be both sustainable and resilient under future climate conditions. However, achieving a more climate-resilient crop mix on the ground, in Kansas and elsewhere, will require major shifts in the broader agricultural system. Food companies, agricultural lenders, and policymakers can play a key role in enabling farmers to adapt cropping systems in the face of climate and environmental challenges.
1 Introduction
Farmers have benefited from advancements in agricultural technologies, leading to higher crop yields over time, but ongoing challenges posed by climate change are impeding further growth in global crop production (Altieri et al., 2015; Ortiz-Bobea et al., 2021). Climate-driven changes in seasonal temperature and precipitation are already negatively impacting crop yields across the United States (US) and globally (Ray et al., 2019; Ortiz-Bobea et al., 2021), while interannual variability in yields is predicted to increase (Urban et al., 2012; Liu et al., 2021). Anticipated yield declines and variability are especially problematic given that global crop production needs to increase in order to satisfy anticipated future demands for food (Van Dijk et al., 2021). Impacts are likely to be even more severe than modeled to date because current models do not address extreme climatic events (droughts, floods and heatwaves) which further stress agricultural production. For example, in 2012, drought extending from the US Corn Belt to the West Coast resulted in $30 billion in agricultural losses (Rippey, 2015), while floods in the same area in 2019 led to a $4.5 billion loss in agricultural sales (English et al., 2021).
In this study we focus on predicted climate impacts on the production of Kansas' leading agricultural exports: wheat (Triticum aestivum), corn (Zea mays, maize), and soybeans (Glycine max). Kansas is the top wheat-producing state in the US and contributes approximately 8% of global wheat supplies (Obembe et al., 2021); wheat is one of the world's most important crops both in terms of production and nutrition (Broberg et al., 2017). Kansas ranks in the top 10 states in soybean and corn production in the US and all three crops directly contribute over $6 billion to the state's economy (USDA NASS, 2021). However, climate change is expected to lead to yield declines. Previous studies suggest that US wheat yields are expected to decrease due to an increase in damaging extreme heat in spring, which will outweigh a beneficial decrease in fall freezing days (Tack et al., 2015; Araya et al., 2017; Obembe et al., 2021). Globally, wheat production is predicted to decrease by 6% for each degree Celsius of warming (Asseng et al., 2015). More specifically, modeling studies predict that, under a moderate climate change scenario (representative concentration pathway [RCP] 4.5), Kansas corn yields will fall by up to a third, with winter wheat yields decreasing by 17% (Obembe et al., 2021). Greater yield reductions are expected for both crops under the more pessimistic RCP8.5 scenario (Araya et al., 2017; Obembe et al., 2021).
In the face of these dire predictions, what can Kansas farmers do to ensure that they remain productive and profitable? Our paper explores one opportunity for adaptation: switching to crops which are more resilient under predicted future climates. We provide a county- and regional-scale assessment of this opportunity to assist farmers, the agricultural community, food companies, and policymakers in preparing for a changing climate. Although we focus on Kansas, we believe that our methods and conclusions are more broadly generalizable to other crop production regions.
1.1 Overview of Kansas agriculture
Kansas agriculture varies significantly across the state. Biophysically, agriculture is influenced by a gradual increase in temperature from the north to the south, and in precipitation from the west to the east. The latter leads to significant regional differences in both the extent of irrigation and the irrigation source. Western Kansas uses much more irrigation compared to eastern Kansas. Western Kansas largely irrigates with groundwater whereas the east and north-central regions primarily irrigate with surface water from 16 reservoirs. The extent and intensity of crop production also varies by region across the state. Spatial variability in cropping extent can be seen in statistics computed from USDA CropScape rasters (USDA CropScape, 2023): only half of the pixel area in eastern Kansas is cultivated, whereas the vast majority of pixel area is cultivated in western Kansas. There is also spatial variability in cropping intensity: cultivated land in eastern Kansas is primarily under continuous crop production without fallow periods, whereas some cropland in western Kansas is allowed to fallow each year (Rosenzweig and Schipanski, 2019). Both cropping extent and intensity impact soil nutrient retention and water storage, with fallow periods increasing soil moisture and nutrient availability for the following growing season (Nielsen and Calderón, 2011). Due to regional differences the Kansas Department of Agriculture divides the state into the five regions shown below in Figure 1.
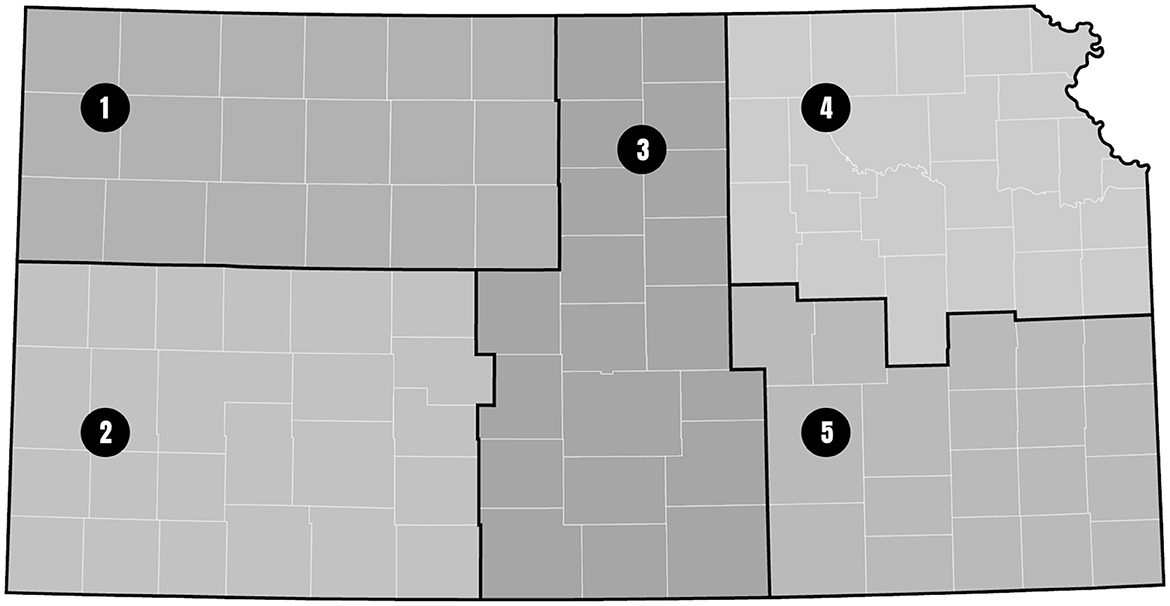
Figure 1. Kansas Department of Agriculture conservation regions. Source: Kansas Department of Agriculture, Division of Conservation.
Kansas' primary crops by harvested area and economic value are winter wheat, corn and soybeans (USDA NASS, 2024). Hay (alfalfa, Medicago sativa) and sorghum (Sorghum bicolor) are the other leading crops by area. Other crops grown in Kansas include cotton (Gossypium hirsutum), oats (Avena sativa), sunflower (Helianthus annuus), canola (Brassica napus), rye (Secale cereale) and proso millet (Panicum miliaceum). Their areas are considerably lower compared to the three primary crops.
Winter wheat is grown throughout the state, often double-cropped with summer grains or forage. Kansas wheat yields have stagnated in the past 20 years, but this state-level stagnation obscures offsetting trends in western Kansas (decreasing yields, primarily due to severe drought) and eastern Kansas (increasing yields) (Linin, 2023). Average irrigated yields are around 3,400 kilograms per hectare throughout the state. Average rainfed winter wheat yields vary from 2,000 kilograms per hectare in the west to 3,400 kilograms per hectare in the east. Wheat area has been steady around 2.8 million hectares for the past 10 years but is down by 50% from historical highs in the early 1980s. The rainfed area fraction has fluctuated between 92% and 95% for the past 40 years.
In 2021, Kansas farmers grew corn on 2 million hectares. Corn has seen yield increases over the past 40 years, particularly where irrigated: average irrigated yields exceed 12,500 kilograms per hectare throughout the state. Average rainfed yields vary from 4,400 kilograms per hectare in the west to over 7,500 kilograms per hectare in the east. About 30% of Kansas corn area is irrigated, primarily in western Kansas. While the total irrigated area has remained steady, Kansas has seen an increase in the rainfed fraction over the past 20 years as dryland corn cultivation has expanded (USDA NASS, 2024).
Soybean cultivation is common in eastern Kansas, grown in rotation with corn or double-cropped with winter wheat; most soybeans are rainfed (rainfed area fraction has fluctuated between 80% and 90% over the past 40 years). Average rainfed yields range from 2,000 kilograms per hectare in the west to over 2,700 kilograms per hectare in the east, while average irrigated yields can climb above 4,000 kilograms per hectare. Total soybean area has almost doubled over the past 20 years, from 1 million hectares to nearly 2 million hectares.
While irrigated cultivation plays a key role in Kansas agriculture, current groundwater withdrawal rates for irrigation are unsustainable and rapidly depleting water resources (Kansas Water Office, 2022). In response, the state recently passed two laws that will tighten limits on the use of groundwater for agriculture (Condos, 2023). Climate change will make this situation much worse. Climate change-driven reductions in precipitation together with increased groundwater withdrawals are projected to cause up to a 25% decrease in groundwater storage for Kansas from 2010 to 2060 (Steward et al., 2013). Similar predictions have been made based on relationships between groundwater levels measured by the US Geological Survey and water storage inferred from NASA's GRACE satellite (Scanlon et al., 2021). In addition, with precipitation projected to decrease and evaporative losses to increase, modeling suggests there will be a 50% reduction in the volume of water stored in surface water reservoirs between 2007 and 2050 (Brikowski, 2008).
It seems likely, therefore, that biophysical and regulatory constraints on water availability will limit the ability to expand irrigation today and into the future. Such reductions in water availability can be expected to significantly affect farmers and crop production in Kansas. In 2022, the state's Water Office released the Kansas Water Plan, which outlines a water management and conservation strategy for the state with an emphasis on locally driven solutions. As potential solutions to current and future water scarcity, the report suggests increasing irrigation efficiency, increasing the water use efficiency of existing crops, and the use of alternative crops (Kansas Water Office, 2022).
1.2 Purpose of this paper
Our intent in this paper is to explore the combined impacts of climate change and water scarcity on crop production in Kansas, and to suggest potential paths forward that are viable under climatic and water constraints. In addition, recognizing the need for increased food production to meet the needs of a growing population, we have sought to ensure that potential adaptations do not decrease, and potentially even increase, total levels of nutrition.
The goal of this study is to identify a rainfed crop mix that (1) maintains or increases nutritional output; (2) reduces water demand; and (3) is compatible with predicted future climate conditions. As a fundamental constraint on water demand, we set a requirement that there be no new use of irrigation for crop production (i.e., we maintain the current ratio of irrigated to dryland cultivation). In addition, recognizing that two of the water-saving options described in the Kansas Water Plan (increased irrigation efficiency and increasing the water use efficiency of existing crops) are being explored by other researchers (e.g., Rudnick et al., 2020; Volk et al., 2024), in this study we opted to focus on reducing the intensity of water use in rainfed crops through substitution of less water-intensive and more climate-resilient crops. We refer to this substitution of one crop to another as “crop switching.” Crop switching maintains the current area of productive cropland, but changes (and often diversifies) the mix of crops being grown on that land. Our emphasis on changing the cropping mix at a given location distinguishes crop switching from crop migration (as described by Rising and Devineni, 2020; Sloat et al., 2020) which explores the opportunity to shift the location of the current cropping mix to more climatically-favorable regions.
To guide crop switching decisions, we developed a tool which can be used to identify viable, nutrition-rich, water-saving and more-resilient rainfed crop mixes which could be grown in different regions in Kansas under the climatic and environmental conditions predicted for 2050. We informed the development of the tool through conversations with Kansas farmers about their needs, concerns and considerations pertaining to crop switching. It is important to note that our analysis identifies one possible future scenario for crop production in Kansas using one approach (crop switching) and a specific set of constraints; we did not attempt to model all possible scenarios, approaches, and constraints. However, the results of our study offer hope that crop production in Kansas—and the vital contribution that Kansas makes to global nutrition—will remain viable in the face of climatic and environmental challenges.
2 Methods
In order to explore the viability of switching to alternative crops as an adaptation to climate change and water constraints, we (i) interviewed farmers to identify plausible crop substitutions for the current primary crops (wheat, corn and soybeans), (ii) quantified the impact of these substitutions on overall levels of nutrition produced, (iii) quantified the impacts of predicted climate conditions on the future yields of current and proposed alternative crops, (iv) developed a water use efficiency index to track the impacts of proposed crop substitutions on water demand, and (v) combined this information into a decision support tool which we applied at the county scale. As noted above, we restricted our analysis to rainfed crops.
For each region we identified: (i) a baseline cropping mix (the crop proportions and yields of those crops grown in that region in 2021); (ii) a business-as-usual cropping mix (crops in the same proportions as in 2021, but with predicted 2050 water demand); and (iii) a proposed alternative cropping mix better adapted to the predicted 2050 climate and water availability.
2.1 Farmer interviews
We conducted a series of interviews with Kansas producers which helped us determine feasible crop switching options based on a variety of factors, including overlap in growing seasons, ability to replace crops in existing rotations, ability to use the same planting and harvesting equipment, and access to the same supply chains as current primary crops. Based on these interviews, we determined that the following crop switching options were feasible for a subset of Kansas farmers to incorporate by mid-century: corn to sorghum, winter wheat to winter rye, winter wheat to winter oats and soybeans to millet.
We initially considered sunflower, canola, and hay as possible alternative crops, but decided to exclude them from analysis because each presented unique challenges. Sunflowers deplete nutrients at a faster rate from the soil compared to row crops; as a result, leasing clauses restrict the planting of sunflowers, limiting their cultivation to a few counties that house sunflower oil processing facilities. Winter canola is being actively researched as a cover crop and a potential substitute for winter wheat by Kansas State University. However, growers do not consider it to be a good candidate for switching from wheat as the end use as an edible oil dictates a substantially different supply chain and buyers. Hay is produced for on farm use by farmers owning livestock and commercial hay production. However, our interviews only revealed examples of farmers switching from row crops to forage grass for on-farm use in eastern Kansas, but not for commercial hay production. A water demand analysis of a combined crop and livestock operation was beyond the scope of this study.
2.2 Quantifying the nutritional value of crops
Nutrient rich food scores (NRF9.3) are a well-established metric from the literature to measure nutrient density and compare different foods for their relative nutritional value (Fulgoni et al., 2009; Drewnowski, 2010; Gupta et al., 2019; Murakami et al., 2020). The NRF9.3 evaluates nine desirable nutrients (protein, fiber, vitamins A, C, and E, calcium, iron, potassium and magnesium) and three nutrients to limit (saturated fat, sugar and sodium) (Drewnowski, 2009). We used data from the US Department of Agriculture's Food Data Central to calculate the NRF9.3 for the seven crops evaluated (field corn, millet, oats, rye, sorghum, soybeans and winter wheat) (USDA Agricultural Research Service, 2019). All values were calculated per 100 grams of food. While increasing atmospheric CO2 levels are expected to reduce protein content and nutritional value of wheat, we did not include these changes in our modeling (Zampieri et al., 2017).
2.3 Predicted Kansas climate in 2050
2.3.1 Historical climate data
This study uses historical climate data from the gridMET dataset, a dataset of daily high-spatial resolution (~4 km, 1/24th degree) surface meteorological data covering the contiguous US from 1979 through present day (Abatzoglou, 2013). Our historical period (1981–2020) captures a generation of farmer experience with the modern climate. We obtained the gridMET dataset from the aggregated THREDDS catalog hosted by the University of Idaho Northwest Knowledge Network.
2.3.2 Future climate projections
The Multivariate Adapted Constructed Analogs (MACA) (Abatzoglou and Brown, 2012) dataset was used for future climate projections. MACA uses daily data from global climate models (GCMs) and historical observations. MACA downscales climate projections to ~4 km, 1/24th degree resolution using a statistical method. The MACA data set consists of output from 20 GCMs produced by 13 climate research centers. We obtained the MACAv2-METDATA dataset from the aggregated THREDDS catalog hosted by the University of Idaho Northwest Knowledge Network.
While a large ensemble increases computation costs, it is key for understanding the differences between internal variability (noise) and changes emerging due to anthropogenic global warming (signal). This is particularly important for the climate scenario we chose, RCP4.5, which has lower emissions than the higher warming scenario RCP8.5 and consequently a lower signal to noise ratio. With the deceleration of emissions growth in recent years and advances in non-fossil energy sources, RCP8.5 is now viewed as a “worst case” scenario rather than “business-as-usual” (Hausfather and Peters, 2020). For this reason, we find RCP4.5 to be a more useful scenario to study near-term changes. Our mid-century period (2041–2060) is a standard definition for studying medium-term climate change used by the Intergovernmental Panel on Climate Change (IPCC, 2021).
2.3.3 Localization
Rather than average climate data over the entire area of each county, we implemented a weighted average using historical crop growing areas. In other words, we produced a county average by up-weighting the areas with more intensive crop growing and down-weighting the areas with little or no crop cultivation, such as urban areas and inland waters (e.g., lakes, rivers). This is particularly useful for large counties with mixed landcover.
The weighting scheme was implemented as follows. First, we developed historical crop growing baselines for each use case. These were determined from US Department of Agriculture (USDA) CropScape maps with 30 meter resolution (USDA CropScape, 2023). For each 30-meter grid cell in each state, we determined the crop frequency from 2017 to 2021. Next, we computed the fraction of each 4 km climate data grid cell with any crop cultivation from 2017 to 2021 (crop frequency >0). Then for each county, grid cell weights were computed by dividing each grid cell's crop area fraction by the sum of the crop area fractions within the county. Lastly, crop area-weighted county climate data were formed for each climate variable as an area-weighted average of the gridded climate data using the crop area fraction weights. In other words, each 4 km by 4 km grid cell in a county is weighted by its crop area fraction. Grid cells with a large crop area fraction will contribute more to the county average than grid cells with a small crop area fraction (e.g., due to urbanization, water, or conservation). Each 4 km by 4 km grid cell was geolocated to one county based on its centroid.
2.3.4 Key climate variables that impact crop production
Crop production will be affected by changes in temperature (described below in terms of growing degree days and failing degree days) and water availability relative to crop water demand. We therefore used a combination of agronomic and water demand models to explore the impacts of climate change on crop yields.
For each 4 km by 4 km area in Kansas, we assessed projected changes in seven climate variables for 2050: minimum temperature, maximum temperature, precipitation, vapor pressure deficit (the difference between the amount of moisture in the air and the amount of moisture the air can hold), specific humidity, wind speed/direction, and downward solar radiation. With this data, we calculated the following crop-specific variables as necessary inputs into our agronomic and water demand models: growing degree days, failing degree days, growing season precipitation and crop evapotranspiration. Growing degree days are a measure of heat units in a beneficial temperature range. They help to estimate the growth of crops during the growing season. Failing degree days are a similar metric to growing degree days, but they measure heat units in a detrimental temperature range. The accumulated temperatures in this range are, at best, too hot for crops to grow and, at worst, damage or kill the crop. Other studies have referred to such detrimental heat as extreme degree days (e.g., Rising and Devineni, 2020; Beckman et al., 2023), killing degree days (Butler and Huybers, 2013), or stress degree days (Danneberger and Street, 1985), whereas we prefer “failing” as an antonym to “growing”. Growing season precipitation is the accumulated precipitation over the growing season. Crop evapotranspiration is a measure of how much water evaporates from the soil surface and plants “exhale” through their leaves as they grow and so is a measure of crop water demand.
2.3.5 Future crop yields
Crop yields quantify production in terms of mass per unit area. We project future crop grain yields as one of several factors that determine crop water use efficiency. Our goal is to explore plausible future grain yield projections using an ensemble of downscaled climate model simulations, not to predict or forecast future yields.
The balance between beneficial heat (growing degree days) and detrimental heat (failing degree days) directly impacts crop yields. We additionally consider the impact of climate change on crop water availability (for rainfed crops, this is growing season precipitation) and crop water demand. Our empirical crop yield model follows Rising and Devineni (2020). Their model was a Bayesian formulation, whereas ours utilizes multiple least-squares (OLS) regression:
where Y is annual crop yield, α0 is a constant, β1t is a linear time-term represented by the calendar year t (assumed to represent improvements in crop biotechnology and agronomic management practices over time), βn{GDD, FDD, CWI} are crop-specific growing season climate terms for growing degree-days (GDD), failing degree days (FDD), and crop water index (CWI; precipitation minus crop evapotranspiration), and ϵ are residuals. The model is trained separately for each county using historical yield and climate data 1981–2020, centered by removing the long-term mean; therefore, the regression coefficients vary by county. Rainfed and irrigated yields are modeled separately based on disaggregated yields from surveys reported by the USDA National Agricultural Statistics Service; our crop switching decision tool relies on rainfed yields alone. Future crop yield projections are made by applying GDD, FDD, and CWI data from the 20-member multi-model ensemble MACA RCP4.5 dataset separately for each climate model ensemble member, then averaging across the 20-member multi-model ensemble, and lastly averaging over the mid-century period 2041–2060.
Technology- and management-driven yield improvements associated with the linear time-term are determined by extrapolating the time-term into the future. This time-term is data-driven, and can be positive, negative, or zero depending on the historical trends for a particular crop in a particular county. Climate-induced yield increases (i.e., boosts) and decreases (i.e., burdens) are quantified using the sum of the projected climate-related terms (GDD, FDD, CWI) in absolute terms (kg/ha) as a percentage of the mid-century yield (%).
This empirical multiple linear regression method was possible for crops with good historical data coverage in Kansas: corn, soybeans, winter wheat, and sorghum. As of 2020, the USDA National Agricultural Statistics Service reports only 10,000 hectares of oats, fewer than 4,000 hectares of rye, and no millet in Kansas, so county-level data are limited for those crops. Therefore, for millet, rye, and oats we employed a proxy-modeling approach to estimate historic yields by county. For oats and rye, we estimated county-level historical yields by scaling the state-average historical yield by the ratio of county-average rainfed winter wheat yield to state-average rainfed winter wheat yield. This assumes oat and rye yields vary geographically like winter wheat. For millet yields, for which there was no Kansas data, we used a linear combination of South Dakota and Colorado state-average yields, using entirely South Dakota in the east, entirely Colorado in the west, and half of each in central Kansas. Mid-century millet, rye, and oat yields were projected by first extrapolating their linear trends from the historic period through the mid-century period, then multiplying the extrapolated mid-century yields by the county-level winter wheat climate boost/burden as a percentage of mid-century yields.
These proxy-modeling approaches, by necessity, incorporate assumptions that could influence our findings. For instance, the assumption that oat and rye yields vary geographically like winter wheat may not fully capture the unique environmental responses of these crops. Similarly, the linear combination model for millet yields assumes linearly varying climatic and agronomic conditions from Colorado through Kansas to South Dakota, which would not account for geographic non-linearities in climate impacts or agricultural management. We acknowledge these limitations and have endeavored to ground our analysis in the available historical data. Ultimately yield is only one of several factors involved in our crop switching analysis and our results are not sensitive to small changes in millet, oat, or rye yields.
2.4 Constraints on crop switching
2.4.1 Nutritional content
The crop switching decision framework driving the alternative crop mix seeks to reduce crop water demand while maintaining or increasing the nutritional content of crop production. To quantify this constraint, we implemented the Nutrient Rich Food Index 9.3 (NRF9.3; Drenowski 2010). The NRF9.3 index is an unweighted sum of the percentage of daily values for nine nutrients to encourage minus the sum of percentage of daily values for three nutrients to limit. See Supplementary Tables 1, 2 for details on NRF9.3 computation. NRF9.3 estimates for grains under consideration are shown in Table 1. Crop switching from field corn to sorghum provides an obvious nutrition benefit. Compared to winter red wheat, rye is slightly more nutritious and oats are slightly less nutritious. A switch from soybeans to millet would decrease nutritional yield.
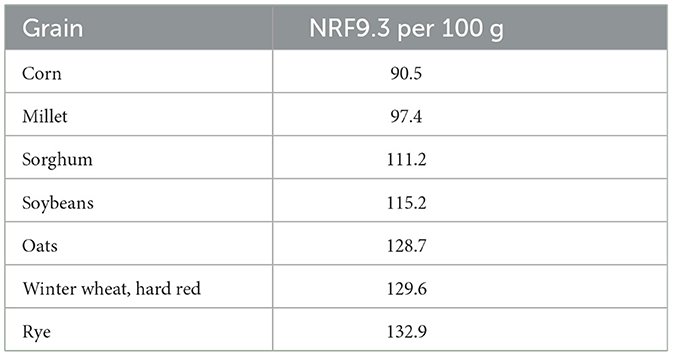
Table 1. Nutrient Rich Food Index 9.3 (NRF9.3) values for select grains.
2.4.2 Future crop water demand
Evapotranspiration is the movement of water from the land surface to the atmosphere, a fundamental component of the hydrologic cycle. Estimates of evapotranspiration from farmland are a key tool farmers use to anticipate crop water needs, as crop water demand changes throughout a crop's life cycle. We estimated future crop evapotranspiration using a method based on the Penman-Monteith equation, which provides an estimate of potential evapotranspiration. To estimate daily crop evapotranspiration, we used crop coefficients from the USDA crop coefficient database (USDA NRCS, 1993). Typical crop planting and harvest dates were taken from Kansas State University Extension School and USDA publications (Shroyer et al., 1996; Agricultural Statistics Board, 1997). Planting dates tend to be earliest in the southeast and latest in the northwest. We estimated 2050 crop water demand for both the business-as-usual (current) crop mix and for the proposed alternative crop mix.
2.4.3 Future crop water availability
To analyze crop water availability, we developed a crop water index. For each crop, we averaged potential evapotranspiration and crop coefficients (described above) over the growing season, county by county. That gave us crop water demand (crop evapotranspiration) in millimeters, the same units as precipitation. Then we calculated the crop water index for each crop by subtracting crop evapotranspiration from precipitation. Negative numbers indicate a shortfall in crop water availability, which is associated with crop water stress unless irrigation is applied to make up the difference.
2.4.4 Crop water use efficiency targets
As an input to the decision tool, we created targets for crop water use efficiency in the future. We define nutritional water use efficiency (NWUE) as NRF9.3 per hectare per millimeter of crop water demand. NWUE is calculated by the following equation:
where Yield is measured in kilograms per hectare, NRF9.3 is expressed per kilogram of grain, and ET is evapotranspiration in millimeters. Examples of the data used to calculate NWUE for field corn and sorghum to inform crop switching in Norton County are shown in Tables 2, 3.
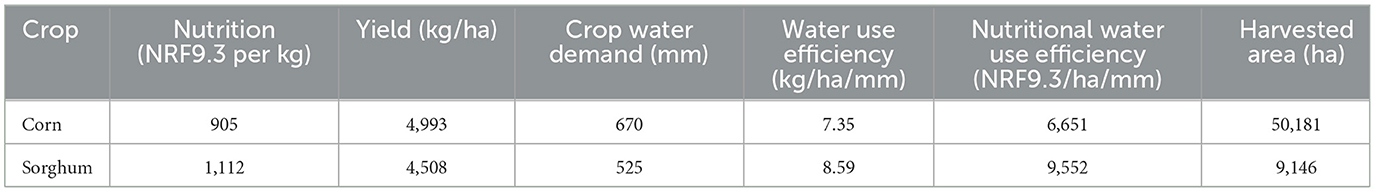
Table 2. Historical timeframe (2021) decision tool inputs for switching corn to sorghum in Norton County, Kansas.
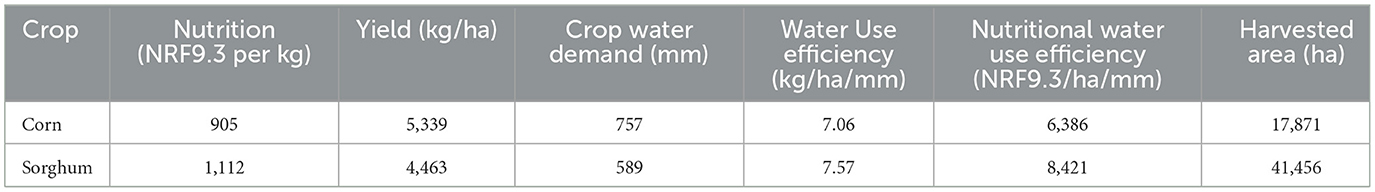
Table 3. Mid-century timeframe (2050) decision tool inputs for switching corn to sorghum in Norton County, Kansas.
To ensure that future cropping patterns would not use any more water than has been used previously, we set a target for water use efficiency based on the percent decrease in the crop water index from historical (2021) to mid-century (2050). We calculated the crop water index for corn, soybeans, and wheat over the growing season for both the historical (2021) and mid-century time frames. The local change in crop water index was then converted to a percentage of future crop evapotranspiration to become the target for nutritional water use efficiency improvement.
2.5 Crop switching decision tool
We developed a crop switching decision tool to guide identification of a more resilient future crop mix. The goal was to maintain the same total row crop area in each county in 2050 as in 2021, but with an alternative crop mix that would demand no more (or ideally, less) water than in 2021, while maintaining or increasing the amount of nutrition produced. The proposed alternative crop mix is made from combinations of current and alternative crops in proportions as needed to meet our environmental and nutritional constraints. To illustrate the impacts of crop switching on water demand, we compare the nutritional water use efficiency of the business-as-usual crop mix (as defined above) to the nutritional water use efficiency of the proposed alternative crop mix scenario in 2050.
This spreadsheet-based tool incorporated the following assumptions about climate and water availability. Rainfed crops will require more water due to climate change, but surface water and groundwater supplies will be reduced. In other words, there will be no new irrigation sources to support production of water-intensive crops. Given this constraint on irrigation, increases in crop water demand (evapotranspiration) can only be satisfied through increases in precipitation. Where rainfall cannot meet crop water demand, a less water-intensive crop must be grown. As stated before, we assume that water intensity reduction happens through switching to alternative crops rather than through more efficient irrigation or use of varieties of corn, wheat or soybeans that demand less water.
While it is theoretically possible to replace a current crop with multiple alternatives, based on interviews with farmers we chose instead to simulate a 1:1 substitution of alternative for current crops. The proposed substitutions are field corn to sorghum, soybeans to millet, and winter wheat to winter rye or winter oats (whichever has a higher nutritional water use efficiency). The extent of the crop switching needed to meet these water and nutritional constraints is determined by a combination of projected mid-century yields, the mid-century crop water demand (i.e., crop evapotranspiration), and nutrient density (as measured by the NRF9.3 index).
The logic implemented in our tool is as follows. First, we calculated water intensity reduction targets for each crop switch in each county. We used the change in crop water index from the historic to mid-century timeframe as a percentage of mid-century crop water demand. Next, we computed the change in the crop water index and the water use efficiency for each crop in units of nutritional value per hectare per millimeter of water used (NRF9.3/ha/mm). Lastly, for each county and crop switch, we solved for the number of hectares of each crop that would give us a composite water use efficiency score equal to the water intensity reduction target, where the composite water use efficiency score derives from the individual scores of each current and alternative crop weighted by the area of each crop within the county. In some cases, the water intensity reduction targets were not able to be met through crop switching. This suggests that other adaptation measures may be necessary in some areas.
Tables 2, 3 show the data for an example calculation for Norton County, Kansas. The combined corn-sorghum nutritional water use efficiency is derived as the area-weighted average of nutritional water use efficiency (NRF9.3/ha/mm) for corn and sorghum: 7,098 NRF9.3/ha/mm. The target corn-sorghum nutritional water use efficiency improvement in 2050 is 7,808 NRF9.3/ha/mm (+10%), based on the −10% change in Norton County crop water index from the historic to mid-century timeframe (as a percentage of mid-century crop water demand [i.e., crop evapotranspiration]).
Meeting the nutritional water use efficiency target with crop switching requires a shift from corn to sorghum to compensate for greater atmospheric demand for water (i.e., higher evapotranspiration), assuming the total crop area and nutritional content of corn and sorghum remain constant. This shift is reflected in Table 3. The water use efficiency (kg/ha/mm) of corn and sorghum decrease due to greater crop water demand; sorghum retains a higher future water use efficiency compared to corn; however, its water use efficiency decreases more than corn because its mid-century yield remains stagnant while corn yield is projected to increase. In the case of Norton County, about 32,000 hectares switch from corn to sorghum.
3 Results
3.1 Projected Kansas growing season climate changes by 2050
Our growing season climate change results for warm season crops are illustrated with corn in Table 4. One benefit of warming is an increase in growing degree days, but with increased warmth also comes an increase in failing degree days. Except for corn in northwestern Kansas (Region 1), climate-induced yield boosts from increases in growing degree days are overshadowed by climate-induced yield burdens from the larger relative increases in failing degree days.
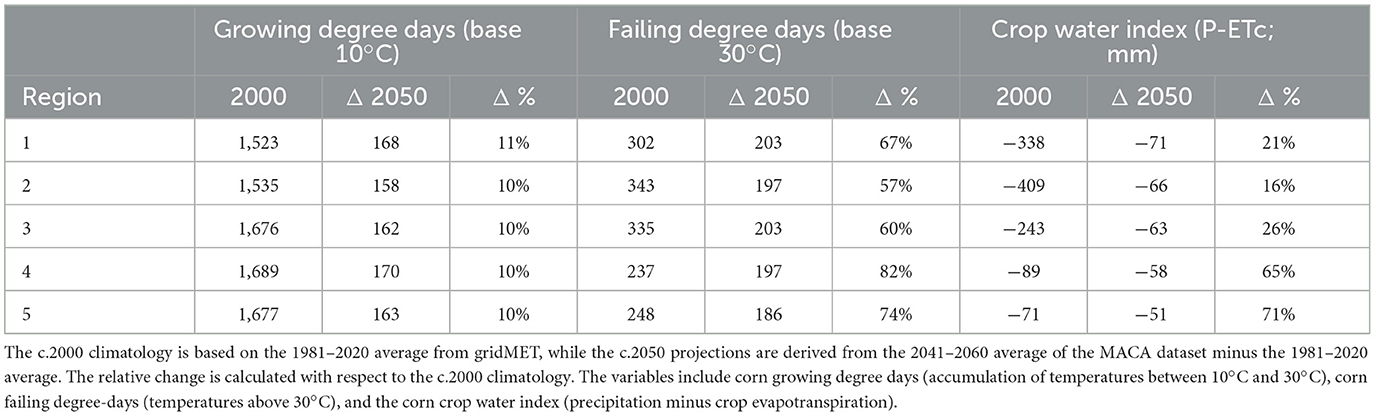
Table 4. Kansas corn growing season crop-climate variables for the recent past (c.2000) and projected changes by mid-century (c.2050).
Another implication of higher temperatures is increased crop evapotranspiration and decreases in the crop water index across Kansas. This is illustrated in Figure 2, which shows the historical crop water index and projected crop water index change for corn. Every warm season crop we consider is projected to have a negative crop water index (water deficit).
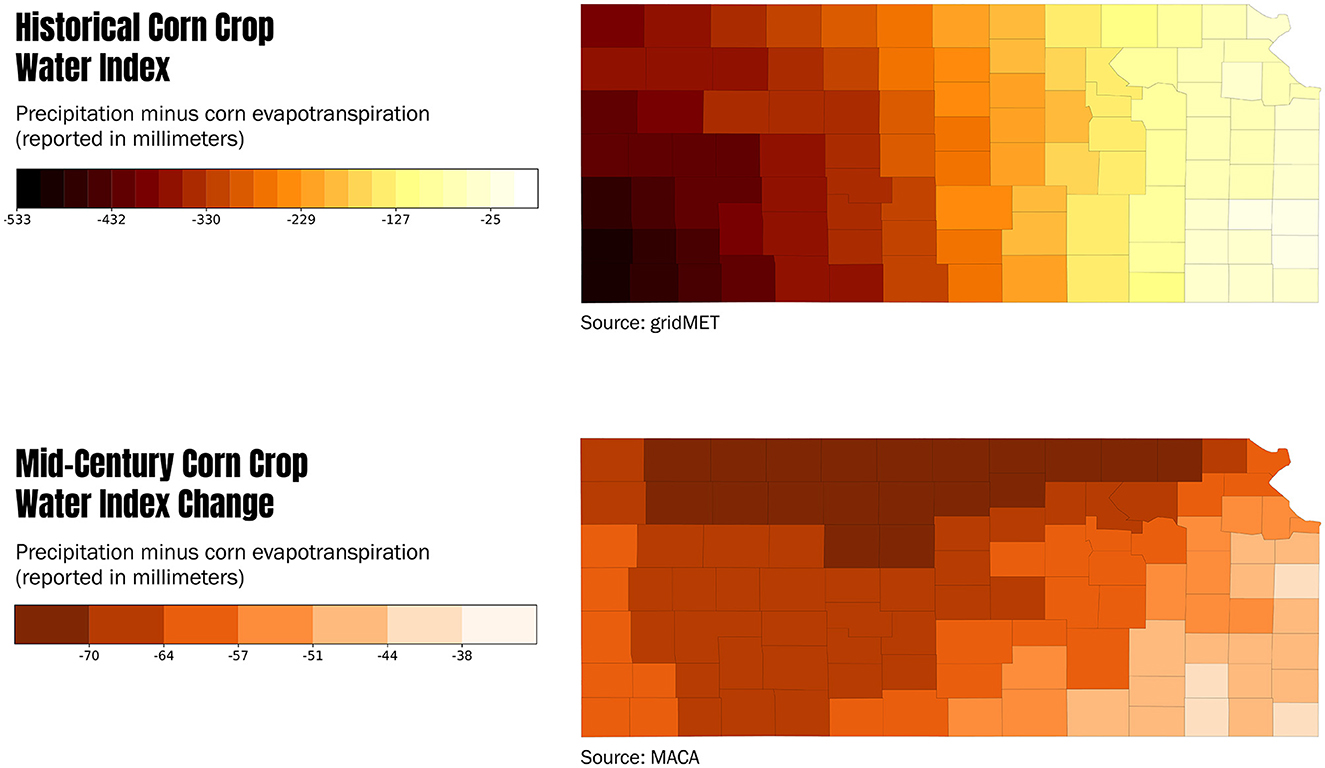
Figure 2. (Top) historical corn crop water index (1981–2020 from gridMET) and (Bottom) mid-century change in corn crop water index (2041–2060 minus 1981–2020 from MACA). The crop water index is reported in millimeters.
Our growing season climate change results for cool season crops are illustrated for winter wheat in Table 5. The results for heat units largely mirror the results for warm season crops, with larger relative increases in failing degree days compared to growing degree days. However, in contrast to the warm season crop water deficits across the entire state, the cool season crop water index climatology is positive in eastern Kansas (Regions 4 & 5). This suggests that crop water demand is generally met there (as shown in Table 5). This could change by mid-century, when winter crop water index decreases will create crop water deficits in all but southeastern Kansas (Region 5).
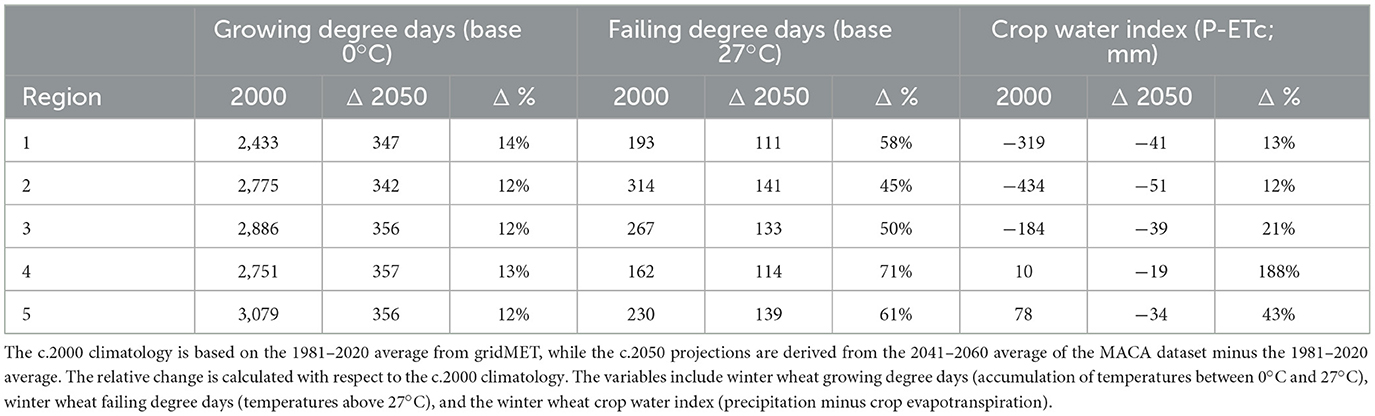
Table 5. Kansas winter wheat growing season crop-climate variables for the recent past (c.2000) and projected changes by mid-century (c.2050).
3.2 Proposed alternative crop mix for 2050
The decision tool enables us to suggest, for each county, an alternative crop mix that could optimize water use efficiency and nutritional value. We present our results by agricultural region (as identified in Figure 1) and aggregate those to the state level. The proposed change in rainfed crop hectares for each region from the baseline (2021) to the alternative (2050) is shown in Table 6.
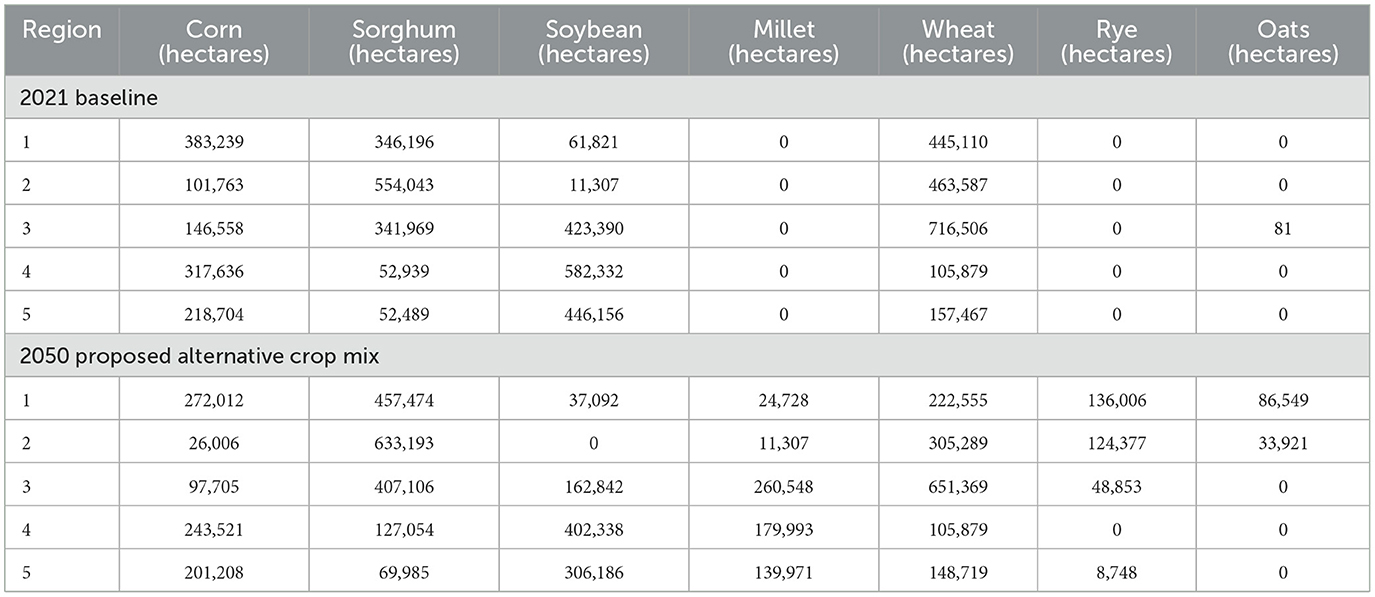
Table 6. Crop mix by region for baseline (2021) and proposed alternative (2050) scenarios.
Regional results are aggregated to state level in Figure 3. The proposed future scenario shows an increase of nearly 30% in the share of alternative crops from 2021 to 2050. In this future scenario, rye, oats and millet expand from occasional niche crops to a fifth of Kansas' rainfed crop area in 2050, while sorghum cultivation increases by 7%.
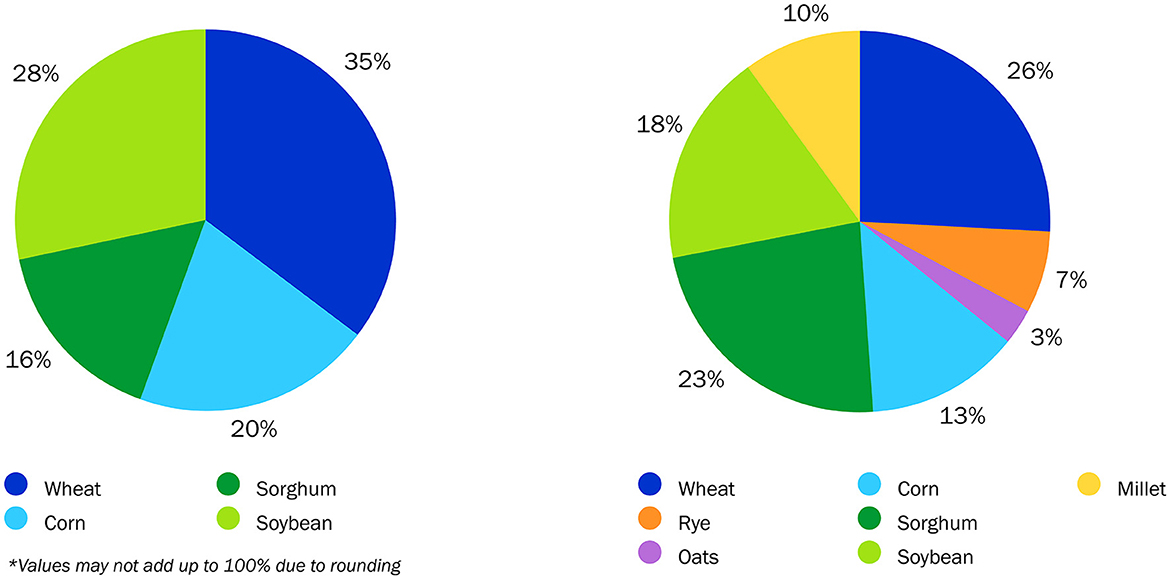
Figure 3. Pie charts showing the 2021 baseline rainfed crop mix (left) and the 2050 proposed alternative rainfed crop mix (right) for Kansas.
Kansas shows significant variation across its five agricultural regions in terms of its current crop mix and projected future climate, and indeed within each region on a county-by-county basis. Figure 4 shows the potential change in each region from the baseline (2021) to the proposed alternative future (2050). In the two western regions, crop switching is the most diverse, using all crop combinations. The northwest region has the highest percentage of additional alternative crops (29%).
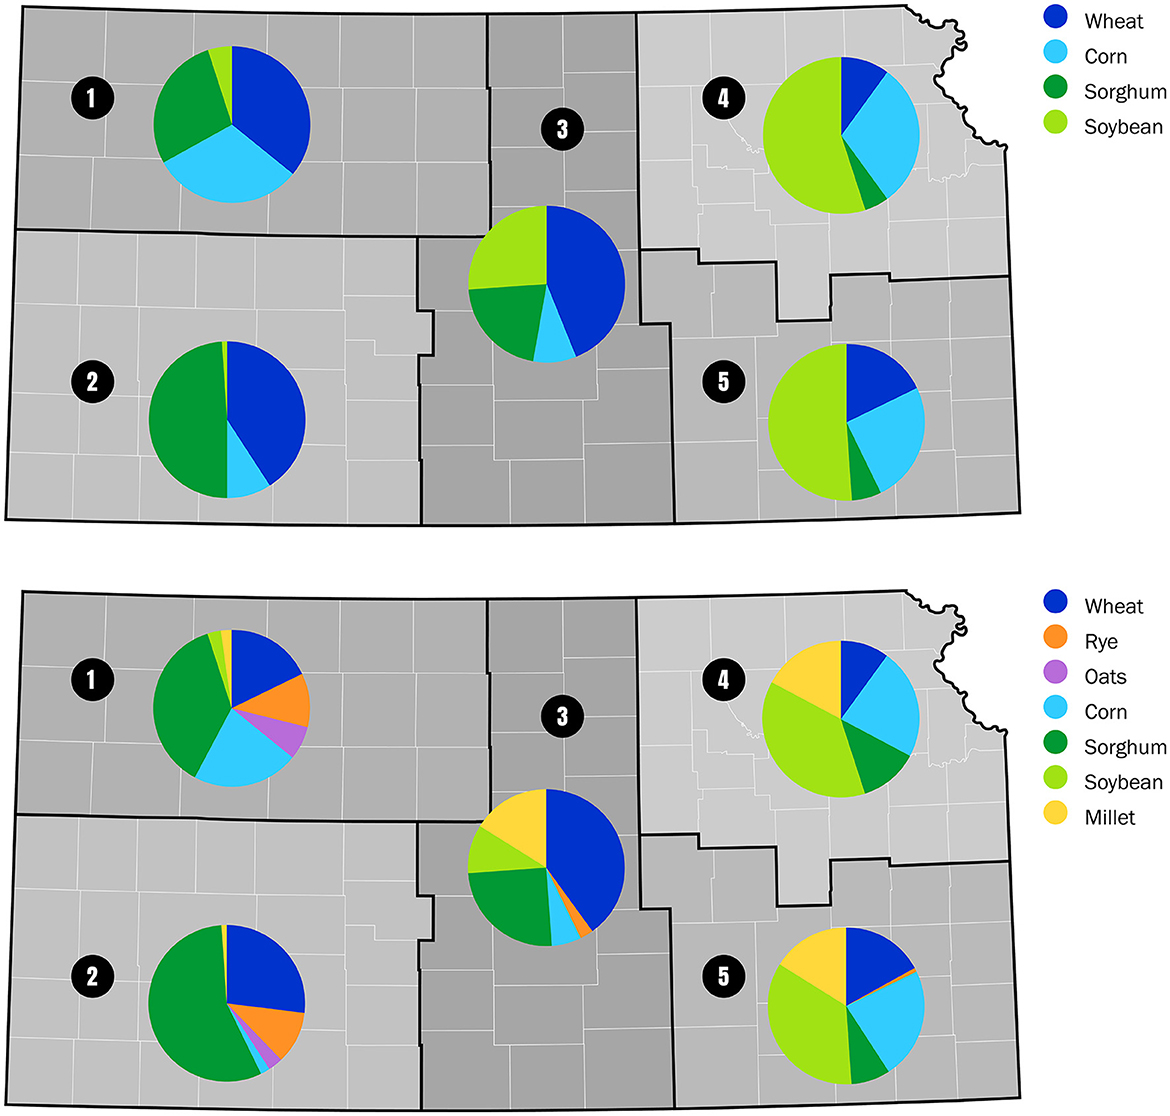
Figure 4. (Top) 2021 baseline rainfed crop mix for each of the five agricultural Kansas regions. (Bottom) 2050 proposed alternative rainfed crop mix for each of the five agricultural Kansas regions.
As seen in Figures 5, 6, the northwest and southwest regions present a high degree of crop switching that is diverse, with contributions from all alternative crops studied (i.e., sorghum, rye, oats and millet). This is not surprising, given that these regions show a high number of failing degree days and rising crop water deficits for conventional crops.
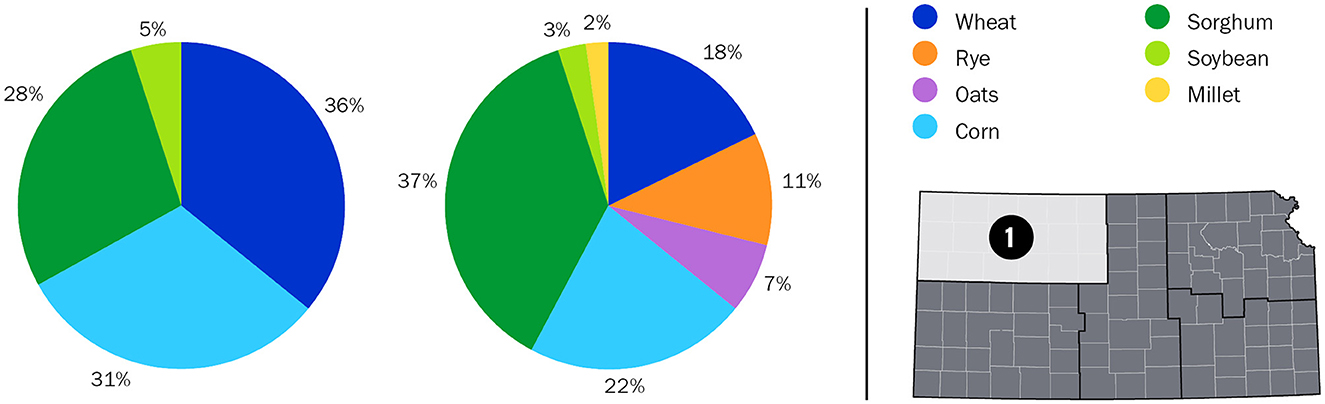
Figure 5. 2021 baseline (left) and 2050 proposed alternative (right) rainfed row crop mix for northwest Kansas Region 1.
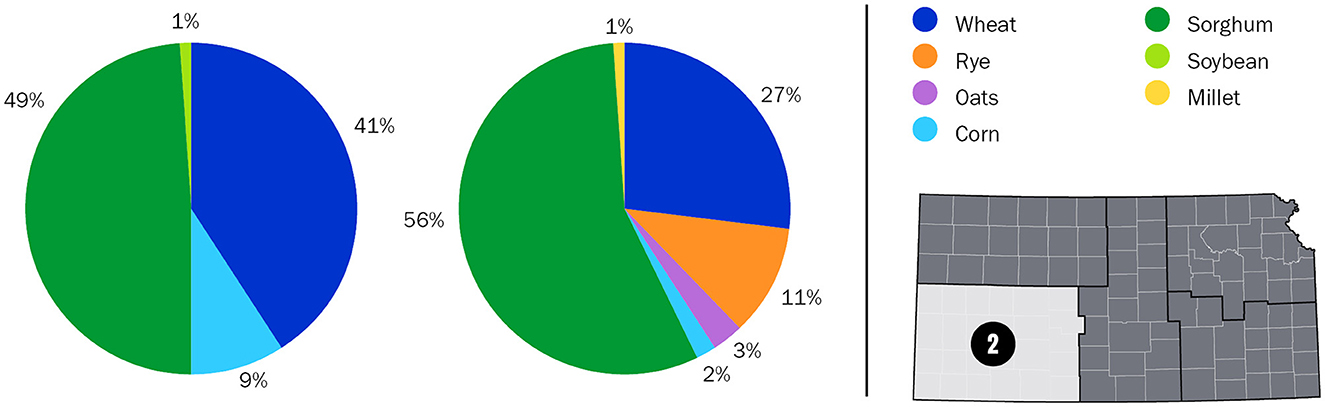
Figure 6. 2021 baseline (left) and 2050 proposed alternative (right) rainfed row crop mix for southwest Kansas Region 2.
The extent of crop switching in the central region (Figure 7) is diverse as well, with contributions from sorghum, rye and millet—but not oats. Oats have slightly lower nutrition and higher evapotranspiration than rye, and thus they were not recommended by the decision tool.
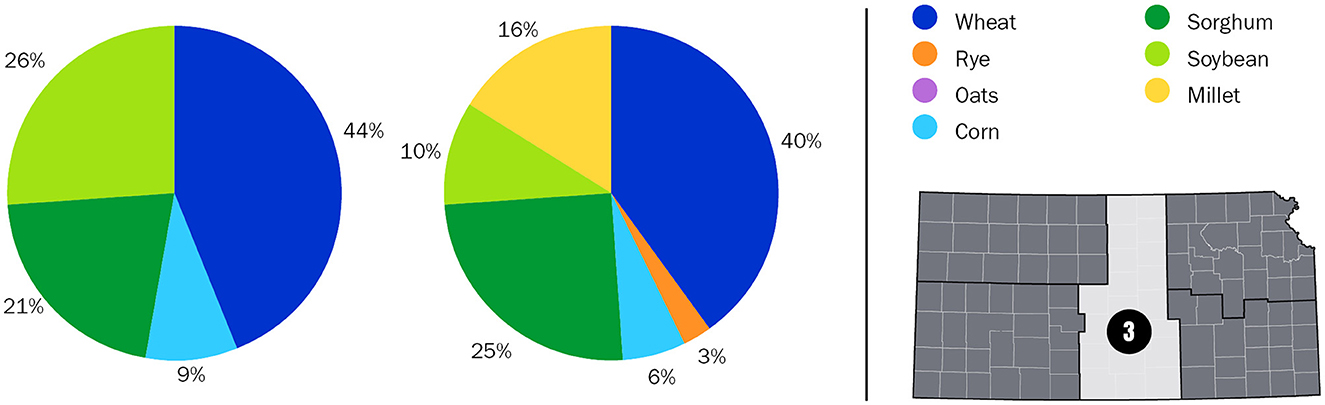
Figure 7. 2021 baseline (left) and 2050 proposed alternative (right) rainfed row crop mix for central Kansas Region 3.
In the northeast region, only soybeans and corn switch to millet and sorghum (Figure 8). Winter wheat growing season precipitation is projected to be nearly equal to future evapotranspiration (i.e., crop water index near zero), so the current wheat area can be maintained.
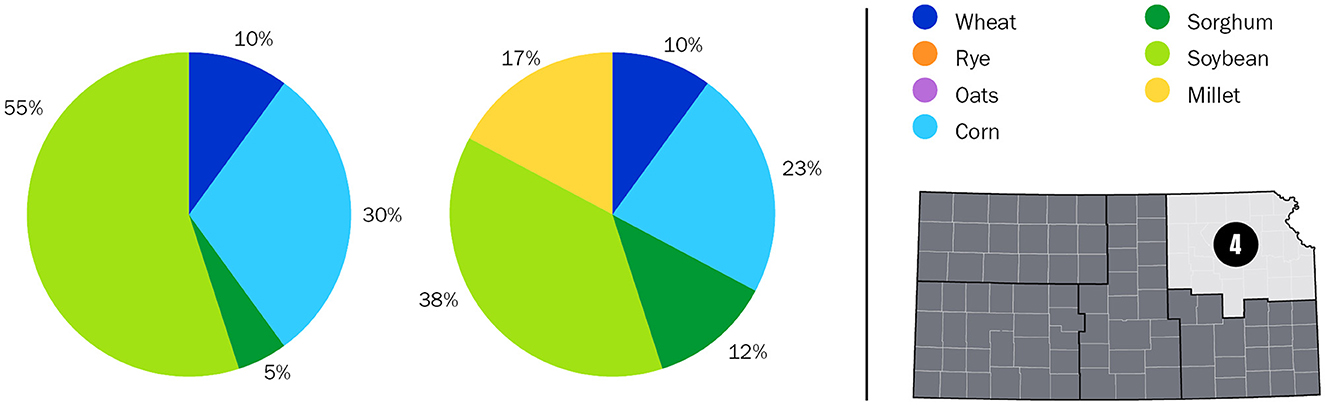
Figure 8. 2021 baseline (left) and 2050 proposed alternative (right) rainfed row crop mix for northeast Kansas Region 4.
The southeast region will also be able to maintain the current wheat area under future climate conditions due to crop water index remaining in surplus (Figure 9). However, a significant shortfall in precipitation over summer months suggests a high level of switching from soybeans to millet and corn to sorghum will be needed.
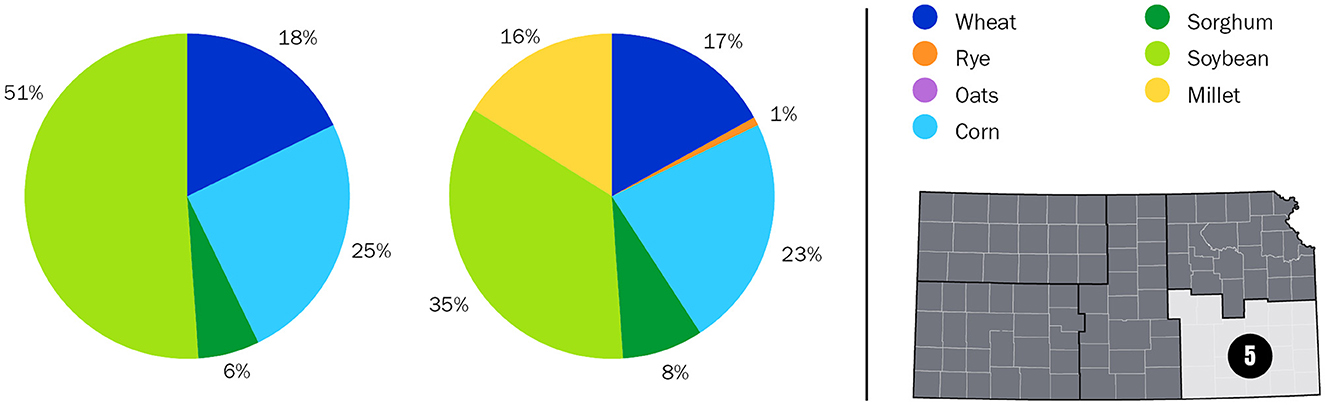
Figure 9. 2021 baseline (left) and 2050 proposed alternative (right) rainfed row crop mix for southeast Kansas Region 5.
3.3 Changes in water demand under proposed alternative crop mix
Table 7 shows the 2050 average nutritional water use efficiency (NRF9.3 kg/ha/mm) for the business-as-usual crop mix and with the proposed alternative crop mix by region. The percent increase illustrates how much more water efficient the proposed alternative crop mix would be compared to the business-as-usual scenario.
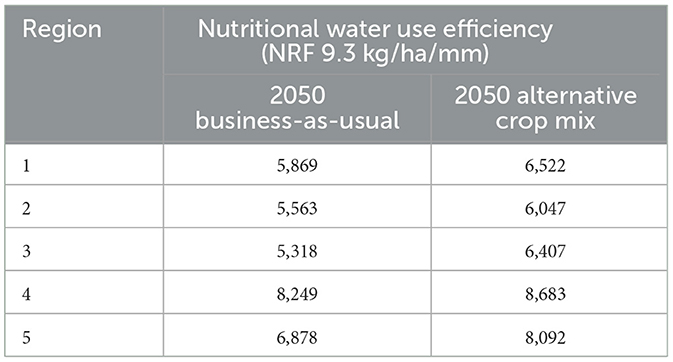
Table 7. Average nutritional water use efficiency by region.
By partially replacing water-intensive corn, wheat, and soybeans with alternative crops, crop switching could reduce water demand by 12% on average across the state. The 2050 proposed alternative crop mix leads to a reduction in crop water demand ranging from 6.5% to 19.3% by region (Table 8). The extent of crop switching in the central region results in the highest reduction (19.3%) in crop water demand by 2050 (Table 8). This is consistent with the large decrease in the crop water index projected for all crops in this region. The crop water demand reduction between 2021 and 2050 under this proposed alternative scenario is illustrated by county in Figure 10.

Table 8. Crop mix water demand by region for business-as-usual and proposed alternative scenarios.
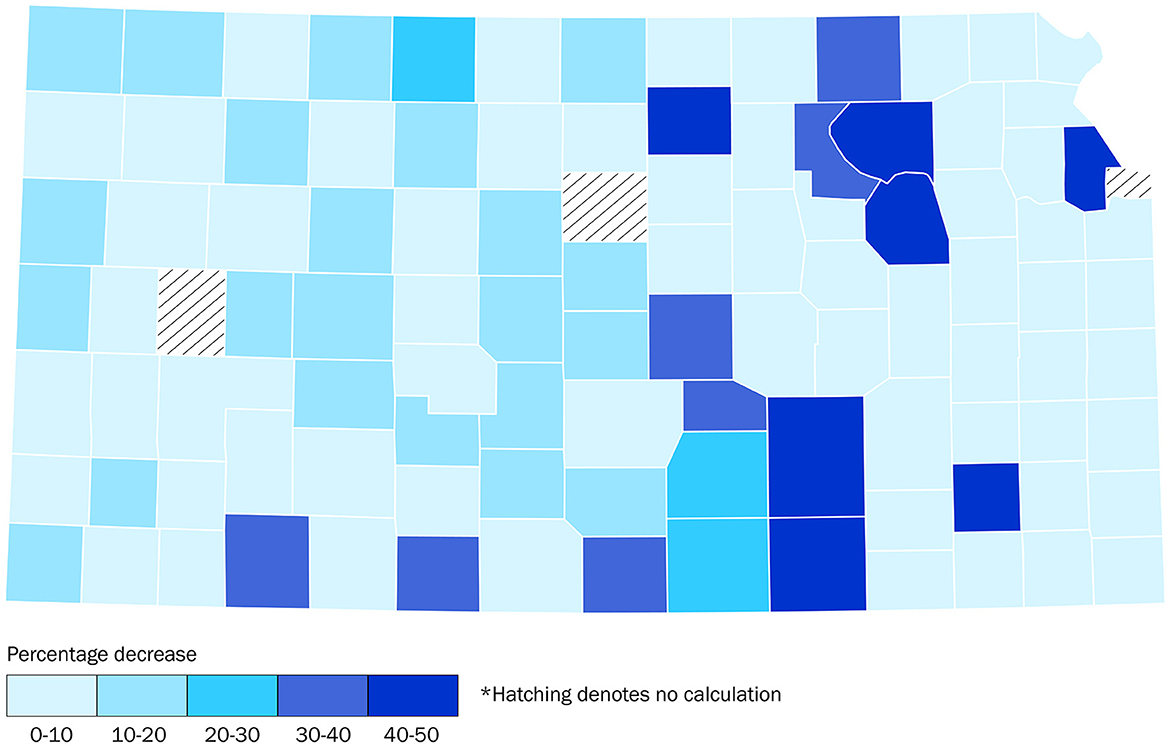
Figure 10. Change in mid-century crop water demand, in percent. Crop water demand reduction is from switching to the proposed alternative crop mix in 2050, relative to the business-as-usual crop mix. The three counties shown with a hatched area do not have any USDA recorded area for wheat, soybeans, or corn in 2021.
4 Discussion
The Kansas growing-season climate projections shown in this study are aligned with state, national, and international climate assessments. While Kansas temperatures increase significantly across the MACA ensemble, projections of average precipitation only show modest changes, with small decreases in summer and fall and small increases in winter and spring. This is consistent with the single digit percentage changes in projected annual precipitation reported in the Southern Great Plains chapter of the Fifth National Climate Assessment (McPherson, 2023). However, vapor pressure deficit, a measure of the difference between how much water vapor is in the air and how much moisture the air can hold when saturated, is projected to increase upwards of 25% by mid-century (Ficklin and Novick, 2017). This greatly increases the risk of drought (Gamelin et al., 2022).
Our study relied on empirical multiple linear regression and proxy-modeling approaches to inform our crop switching decision tool. Other modeling approaches like process-based models (e.g., Decision Support System for Agro-technology Transfer [DSSAT]) have also been used to explore the impacts of crop switching (Gao et al., 2022). Process-based models may be particularly effective at demonstrating the impacts of crop switching for locations with long-term field trials of various crops. However, they may not be easily calibrated for application across large areas like the State of Kansas. Mechanistic ecological models like Agro-IBIS or AgroTEM may also be leveraged to explore crop switching. They may be more suitable for large area ecosystem modeling, however their relatively less complex crop modules may limit their applicability for practical decision-support.
Several authors have suggested farmers adapt to climate change by converting from rainfed crops to irrigated crops, or by expanding or intensifying irrigation (Wolfe et al., 2018; Rosa et al., 2020). While increasing irrigation efficiency is important, the reality for Kansas and other states dependent on the already-overdrawn Ogallala aquifer is that water resources are already inadequate to support current levels of irrigation, evidenced by accelerating groundwater declines (Jasechko et al., 2024). Surface water availability is also expected to remain constrained (Wada and Bierkens, 2014). As has been seen in California's Central Valley, an increasing mismatch between water availability and irrigation demand is likely to lead to a shutdown of irrigation and long-term fallowing of agricultural land (Espinoza et al., 2023). Given this reality, increasing irrigation in response to growing water scarcity can be considered a “maladaptation” to climate change: while it may appear to provide a short-term solution to a climate challenge, it is not a true adaptation in the long term, and may in fact hinder long-term adaptation by discouraging timely adoption of climate resilience practices (Sanderson and Hughes, 2019).
Given the improbability of increased irrigation in Kansas, our analysis explores an alternative adaptation to the combination of climate change and water scarcity: shifting some of the current crop mix to less water-intensive crops. We show how, by diversifying the crop mix with more climate-resilient and less-thirsty crops, total nutritional output can be maintained, and water use reduced. Our conclusion—that diversified crop mixes can optimize water savings—is congruent with a recent national-level study (Richter et al., 2023).
We hope that our study encourages the agricultural community to conduct additional research on the production of alternative crops in Kansas. In particular, the US Department of Agriculture and the Kansas Department of Agriculture could fund research on growing rye and oats in Regions 1 and 2, and on growing millet in Regions 3, 4 and 5, to enable best production practices to be shared with farmers. We also suggest that farmers and farmer associations could use this study to determine which alternative crops are feasible in their counties and consider pilot projects to determine local best practices for the production of these crops. The Kansas Department of Water Resources along with Regional Advisory Committees could use this study and the academic research that it cites to develop projections on the impact of climate change on surface and groundwater availability by county and make recommendations for agricultural water use accordingly.
We also note the likely challenges of shifting to more climate-resilient cropping systems. While it may be in farmers' best long-term interest to switch some or all their crops, farmers are acting within a complex system of constraints and conditions that may make such a change difficult to implement. In reference to aquifer depletion and a lack of behavior change, Matt Sanderson, a sociologist who has surveyed farmers across the Ogallala region stated: “People talk about this as a crisis. This is not a crisis. […] You don't have a crisis for 40 years. You have a structural problem” (Condos, 2023). Solving this structural problem will require changes in the system within which farmers operate.
In this larger system, farmers wishing to change their crop mix face a suite of barriers and disincentives related to policy, market barriers, infrastructure, technical support, and historical inequities. Current policy structures like crop insurance can make it more profitable and less risky to grow certain crops (even if those crops are less resilient to climate change) while making it less feasible to grow alternative crops (Mortensen and Smith, 2020). Some policy structures may also encourage maladaptive practices such as continuing to grow corn in increasingly water-scarce areas (Annan and Schlenker, 2015). Farmers also need access to clear markets for alternative crops to invest in growing them (Roesch-McNally et al., 2018). Current markets in Kansas and the broader Midwest region primarily demand corn, soy and winter wheat, incentivizing farmers to continue growing those crops despite increasing water and climatic constraints (Mayer, 2016; Anderson, 2021). Without a clear sustained market for an alternative crop and access to delivery points and transport, most farmers will not begin growing a new crop (Mayer, 2016; Sergeant, 2023). Additional logistical and cost barriers arise in cases where switching to alternative crops requires different planting and/or harvesting machinery, and/or storage and transportation infrastructure (Mortensen and Smith, 2020). Even if all these challenges are overcome, farmers will struggle to adopt new crops without access to adequate information and resources (Iles and Marsh, 2012).
Beginning farmers and historically marginalized farmers (minority farmers, female farmers, and farmers of any group that has been historically excluded from the resources and support most farmers have access to) face additional barriers, including greater difficulty accessing credit and lower rates of land ownership, which restrict long-term decision-making (Carlisle et al., 2019). It is important to note that the above barriers affect different groups of farmers differently. Farmers have varying resources and tools available to them to overcome some of these barriers, depending on factors like income level, race, land ownership and operation size, history of farming, and gender, among other factors (Horst and Marion, 2019).
For the shift in cropping systems that we propose to become reality, pathways must be found to overcome the barriers described above. Here, we briefly suggest some potential pathways. In terms of policy changes, changing crop insurance frameworks could help support and reward farmers for growing alternative, more climate-resilient crops (Annan and Schlenker, 2015). Expanding crop insurance policies for better-adapted alternative crops across more counties can provide producers with a key risk management tool needed to support the adoption of new crops. In addition, initiatives such as the USDA Rural Economic Development Loan and Grant Program could provide low- or no-cost finance to farmers investing in the equipment and infrastructure needed to support more climate-resilient crops, and private finance could explore the business case for farmers growing more resilient crops. Food companies could work with farmers to create reliable markets for these alternative crops, and with support could begin a reformulation process to make their products and supply chains more climate resilient. Increased funding for extension services to bolster resources and expertise around a greater array of crops could expand the information and technical support available to farmers growing these more resilient crops (Iles and Marsh, 2012). All these efforts would need to include opportunities tailored to support historically marginalized and disadvantaged farmers.
Fortunately, the 2022 Kansas Water Plan notes the need for some of the system shifts described above, stating that policies—including crop insurance, banking and property valuation—should “encourage and reward” water conservation practices including the growing of alternative crops (Kansas Water Office, 2022). Taken together, these changes constitute the beginning of a system-level shift that could support Kansas crop production—and global food security—for decades to come.
5 Conclusion
Our analysis shows that, by 2050, climate change will affect rainfed cropping systems across Kansas both directly (through changes in temperature) and indirectly (through temperature-driven changes in crop water demand and availability). We show that changes in temperature and precipitation will create an increasing imbalance between crop water demand (which will increase) and crop water availability (which will decrease) and—absent additional water supply from irrigation—this will impact yields from the current wheat-corn-soybean cropping system. However, current and projected future limitations on both surface water and groundwater supplies are likely to preclude the conversion of rainfed to irrigated production.
We explore one potential avenue of adaptation: diversifying the current cropping mix to include more climate-resilient and less water-intensive crops. Using a county-level decision tool, we quantify the extent to which alternative crop mixes—better suited to future climate and water constraints—could be implemented in some areas to decrease water use while maintaining or increasing nutritional value. We show that, by switching a portion of current crop area from more water-demanding crops such as corn, wheat and soybeans to sorghum, rye, oats and millet, crop water demand for Kansas could be reduced by up to 12%. Achieving such savings would require that the area under these alternative crops increased from 16% in 2021 to 43% by 2050. In some regions, the water savings are even greater; in the southeast region of Kansas, alternative crops could go from 6% of the crop mix to 25%, reducing crop water demand by 16% by 2050.
Combining historical data, climate projections, nutritional data, and a crop switching decision tool framework allows us to ask “what if?” with regards to future Kansas crop water demand. Our results suggest one pathway toward reduced demand, however different targets and mechanisms could be employed to adapt water demand to the future climate. We encourage other researchers to explore alternative scenarios. Realizing this “what if?” scenario will require significant market, policy, and behavioral barriers to be solved.
To achieve profitability at these significantly increased volumes, new uses and markets would need to be created for alternative crops. Sorghum and millet may need to move beyond animal feed and biofuels toward more human consumption. Rye and oats would have to move from niche products into the mainstream. This is a great opportunity for food companies to innovate, differentiate themselves from their competition and contribute to a more sustainable future. It is also an opportunity for feed companies and livestock producers to explore the potential for incorporating more small grains into livestock feed.
While our proposed alternative cropping mix is just one possible pathway to support the Kansas agriculture of the future, it offers hope that farmers have a path forward even in the face of climatic and water constraints. The good news is that crop-switching can allow farmers to become both more sustainable and more resilient, and in ways that support global nutrition into the future.
Data availability statement
The raw data supporting the conclusions of this article will be made available by the authors, without undue reservation.
Author contributions
KS: Conceptualization, Project administration, Writing – original draft, Writing – review & editing. BS: Conceptualization, Data curation, Formal analysis, Methodology, Visualization, Writing – review & editing. AR: Conceptualization, Data curation, Formal analysis, Methodology, Visualization, Writing – review & editing. SP: Conceptualization, Data curation, Formal analysis, Methodology, Visualization, Writing – review & editing. MJ: Conceptualization, Writing – review & editing. EM: Conceptualization, Methodology, Writing – review & editing.
Funding
The author(s) declare financial support was received for the research, authorship, and/or publication of this article. This research was funded by the Valhalla Foundation and the Walton Family Foundation.
Acknowledgments
This research was originally published in a report titled, Kansas in 2050: A pathway for climate-resilient crop production (Environmental Defense Fund, 2023). The authors would like to thank Pixels and Pulp for their graphic design of the figures. The authors' organizations fully support this work and its claims.
Conflict of interest
KS, MJ, and EM were employed by Environmental Defense Fund. SP, AR, and BS were employed by Two Degrees Adapt.
Publisher's note
All claims expressed in this article are solely those of the authors and do not necessarily represent those of their affiliated organizations, or those of the publisher, the editors and the reviewers. Any product that may be evaluated in this article, or claim that may be made by its manufacturer, is not guaranteed or endorsed by the publisher.
Supplementary material
The Supplementary Material for this article can be found online at: https://www.frontiersin.org/articles/10.3389/fsufs.2024.1404315/full#supplementary-material
References
Abatzoglou, J. T. (2013). Development of gridded surface meteorological data for ecological applications and modelling. Int. J. Climatol. 33, 121–131. doi: 10.1002/joc.3413
Abatzoglou, J. T., and Brown, T. J. (2012). A comparison of statistical downscaling methods suited for wildfire applications. Int. J. Climatol. 32, 772–780. doi: 10.1002/joc.2312
Agricultural Statistics Board National Agricultural Statistics Service, and United States Department of Agriculture. (1997). “Usual planting and harvesting dates for U.S. field crops (No. 628),” in Agricultural Handbook (Washington, DC: National Agriculture Statistics Service).
Altieri, M. A., Nicholls, C. I., Henao, A., and Lana, M. A. (2015). Agroecology and the design of climate change-resilient farming systems. Agron. Sustain. Dev. 35, 869–890. doi: 10.1007/s13593-015-0285-2
Anderson, M. (2021). Farm Progress Survey Points to More Wheat, Corn, Soybean Acres. U.S. Wheat Associates. Available online at: https://www.uswheat.org/wheatletter/farm-progress-survey-points-to-more-wheat-corn-soybean-acres/ (accessed March 15, 2024).
Annan, F., and Schlenker, W. (2015). Federal crop insurance and the disincentive to adapt to extreme heat. Am. Econ. Rev. 105, 262–266. doi: 10.1257/aer.p20151031
Araya, A., Kisekka, I., Lin, X., Vara Prasad, P. V., Gowda, P. H., Rice, C., et al. (2017). Evaluating the impact of future climate change on irrigated maize production in Kansas. Climate Risk Manage. 17, 139–154. doi: 10.1016/j.crm.2017.08.001
Asseng, S., Ewert, F., Martre, P., Rötter, R. P., Lobell, D. B., Cammarano, D., et al. (2015). Rising temperatures reduce global wheat production. Nature Clim Change 5, 143–147. doi: 10.1038/nclimate2470
Beckman, J., Ivanic, M., and Nava, N. (2023). “Estimating market implications from corn and soybean yields under climate change in the United States,” in Report No. ERR-324. Washington, D.C.: United States Department of Agriculture, Economic Research Service.
Brikowski, T. H. (2008). Doomed reservoirs in Kansas, USA? Climate change and groundwater mining on the Great Plains lead to unsustainable surface water storage. J. Hydrol. 354, 90–101. doi: 10.1016/j.jhydrol.2008.02.020
Broberg, M. C., Högy, P., and Pleijel, H. (2017). CO2-induced changes in wheat grain composition: meta-analysis and response functions. Agronomy 7, 32. doi: 10.3390/agronomy7020032
Butler, E., and Huybers, P. (2013). Adaptation of US maize to temperature variations. Nat. Clim. Chang. 3, 68–72. doi: 10.1038/nclimate1585
Carlisle, L., de Wit, M. M., DeLonge, M. S., Calo, A., Getz, C., Ory, J., et al. (2019). Securing the future of US agriculture: the case for investing in new entry sustainable farmers. Elementa: Sci. Anthropocene 7, 17. doi: 10.1525/elementa.356
Condos, D. (2023). With the Ogallala Aquifer Drying up, Kansas Considers Limits to Crop Irrigation. Kansas City: Kansas City Public Radio.
Danneberger, T., and Street, J. (1985). Climatic adaptability of annual bluegrass in ohio using growing degree-days. Ohio Acad. Sci. 85, 108–111
Drewnowski, A. (2009). Defining nutrient density: development and validation of the nutrient rich foods index. J. Am. Colleg. Nutr. 28, 421S−426S. doi: 10.1080/07315724.2009.10718106
Drewnowski, A. (2010). The Nutrient Rich Foods Index helps to identify healthy, affordable foods. Am. J. Clin. Nutr. 91, 1095S−1101S. doi: 10.3945/ajcn.2010.28450D
English, B. C., Smith, S. A., Menard, R. J., Hughes, D. W., and Gunderson, M. (2021). Estimated economic impacts of the 2019 midwest floods. Econ. Dis. Cli. Cha 5, 431–448. doi: 10.1007/s41885-021-00095-2
Environmental Defense Fund (2023). Kansas in 2050: A Pathway for Climate-Resilient Crop Production. New York, NY.
Espinoza, V., Bernacchi, L. A., Eriksson, M., Schiller, A., Hayden, A., and Viers, J. H. (2023). From fallow ground to common ground: perspectives on future land uses in the San Joaquin valley under sustainable groundwater management. J. Environ. Manage. 333, 117226. doi: 10.1016/j.jenvman.2023.117226
Ficklin, D. L., and Novick, K. A. (2017). Historic and projected changes in vapor pressure deficit suggest a continental-scale drying of the United States atmosphere. J. Geophys. Res.: Atmospheres 122, 2061–2079. doi: 10.1002/2016JD025855
Fulgoni, V. L., Keast, D. R., and Drewnowski, A. (2009). Development and validation of the nutrient-rich foods index: a tool to measure nutritional quality of foods1–3. J. Nutr. 139, 1549–1554. doi: 10.3945/jn.108.101360
Gamelin, B. L., Feinstein, J., Wang, J., Bessac, J., Yan, E., and Kotamarthi, V. R. (2022). Projected U.S. drought extremes through the twenty-first century with vapor pressure deficit. Sci. Rep. 12:8615. doi: 10.1038/s41598-022-12516-7
Gao, F., Luan, X., Yin, Y., Sun, S., Li, Y., Mo, F., et al. (2022). Exploring long-term impacts of different crop rotation systems on sustainable use of groundwater resources using DSSAT model. J. Cleaner Product. 336. doi: 10.1016/j.jclepro.2022.130377
Gupta, S., Hawk, T., Aggarwal, A., and Drewnowski, A. (2019). Characterizing ultra-processed foods by energy density, nutrient density, and cost. Front. Nutr. 6:70. doi: 10.3389/fnut.2019.00070
Hausfather, Z., and Peters, G. P. (2020). RCP8.5 is a problematic scenario for near-term emissions. Proc. Nat. Acad. Sci. 117, 27791–27792. doi: 10.1073/pnas.2017124117
Horst, M., and Marion, A. (2019). Racial, ethnic and gender inequities in farmland ownership and farming in the U.S. Agric Hum Values 36, 1–16. doi: 10.1007/s10460-018-9883-3
Iles, A., and Marsh, R. (2012). Nurturing diversified farming systems in industrialized countries: how public policy can contribute. Ecol. Soc. 17:170442. doi: 10.5751/ES-05041-170442
IPCC (2021). “Summary for policymakers, climate change 2021: the physical science basis,” in Contribution of Working Group I to the Sixth Assessment Report of the Intergovernmental Panel on Climate Change. New York, NY; Cambridge: Cambridge University Press.
Jasechko, S., Seybold, H., Perrone, D., Fan, Y., Shamsudduha, M., Taylor, R. G., et al. (2024). Rapid groundwater decline and some cases of recovery in aquifers globally. Nature 625, 715–721. doi: 10.1038/s41586-023-06879-8
Kansas Water Office (2022). 2022 Kansas Water Plan. Topeka, KS: Kansas Water Office. Available online at: https://www.kwo.ks.gov/water-plan/water-plan
Liu, W., Ye, T., Jägermeyr, J., Müller, C., Chen, S., Liu, X., et al. (2021). Future climate change significantly alters interannual wheat yield variability over half of harvested areas. Environ. Res. Lett. 16:094045. doi: 10.1088/1748-9326/ac1fbb
Mayer, A. (2016). “Can midwest farmers fight monoculture and grow new crops?,” in KCUR - Kansas City news and NPR. Available online at: https://www.kcur.org/agriculture/2016-04-04/can-midwest-farmers-fight-monoculture-and-grow-new-crops (accessed March 15, 2024).
McPherson, R. A. (2023). Fifth National Climate Assessment, Fifth National Climate Assessment. Washington, DC: U.S. Global Change Research Program.
Mortensen, D. A., and Smith, R. G. (2020). Confronting Barriers to Cropping System Diversification. Front. Sustain. Food Syst. 4:564197. doi: 10.3389/fsufs.2020.564197
Murakami, K., Livingstone, M. B. E., Fujiwara, A., and Sasaki, S. (2020). Application of the Healthy Eating Index-2015 and the nutrient-rich food index 9.3 for assessing overall diet quality in the Japanese context: different nutritional concerns from the US. PLoS ONE 15:e0228318. doi: 10.1371/journal.pone.0228318
Nielsen, D. C., and Calderón, F. J. (2011). Fallow Effects on Soil, in: Soil Management: Building a Stable Base for Agriculture. Hoboken, NJ: John Wiley & Sons, Ltd, 287–300.
Obembe, O. S., Hendricks, N. P., and Tack, J. (2021). Decreased wheat production in the USA from climate change driven by yield losses rather than crop abandonment. PLoS ONE 16:e0252067. doi: 10.1371/journal.pone.0252067
Ortiz-Bobea, A., Ault, T. R., Carrillo, C. M., Chambers, R. G., and Lobell, D. B. (2021). Anthropogenic climate change has slowed global agricultural productivity growth. Nat. Clim. Chang. 11, 306–312. doi: 10.1038/s41558-021-01000-1
Ray, D. K., West, P. C., Clark, M., Gerber, J. S., Prishchepov, A. V., and Chatterjee, S. (2019). Climate change has likely already affected global food production. PLoS ONE 14:e0217148. doi: 10.1371/journal.pone.0217148
Richter, B. D., Ao, Y., Lamsal, G., Wei, D., Amaya, M., Marston, L., et al. (2023). Alleviating water scarcity by optimizing crop mixes. Nat Water 1, 1035–1047. doi: 10.1038/s44221-023-00155-9
Rippey, B. R. (2015). The U.S. drought of 2012 weather and climate extremes. USDA Res. Prog. Extrem. Events 10, 57–64. doi: 10.1016/j.wace.2015.10.004
Rising, J., and Devineni, N. (2020). Crop switching reduces agricultural losses from climate change in the United States by half under RCP 8.5. Nat. Commun. 11, 4991. doi: 10.1038/s41467-020-18725-w
Roesch-McNally, G. E., Arbuckle, J. G., and Tyndall, J. C. (2018). Barriers to implementing climate resilient agricultural strategies: The case of crop diversification in the U.S. Corn Belt. Global Environm. Change 48, 206–215. doi: 10.1016/j.gloenvcha.2017.12.002
Rosa, L., Chiarelli, D. D., Sangiorgio, M., Beltran-Peña, A. A., Rulli, M. C., D'Odorico, P., et al. (2020). Potential for sustainable irrigation expansion in a 3°C warmer climate. Proc. Nat. Acad. Sci. 117, 29526–29534. doi: 10.1073/pnas.2017796117
Rosenzweig, S. T., and Schipanski, M. E. (2019). Landscape-scale cropping changes in the High Plains: economic and environmental implications. Environ. Res. Lett. 14, 124088. doi: 10.1088/1748-9326/ab5e8b
Rudnick, D. R., Stockton, M., Taghvaeian, S., Warren, J., Dukes, M. D., Kremen, A., et al. (2020). Innovative extension methods in the U.S. to promote irrigation water management. Trans. ASABE 63, 1549–1558. doi: 10.13031/trans.13929
Sanderson, M. R., and Hughes, V. (2019). Race to the bottom (of the Well): groundwater in an agricultural production treadmill. Soc. Probl. 66, 392–410. doi: 10.1093/socpro/spy011
Scanlon, B. R., Rateb, A., Pool, D. R., Sanford, W., Save, H., Sun, A., et al. (2021). Effects of climate and irrigation on GRACE-based estimates of water storage changes in major US aquifers. Environ. Res. Lett. 16:094009. doi: 10.1088/1748-9326/ac16ff
Sergeant, D. J. (2023). “How to market value-added grains in the Northeast,” in Lancaster Farming. Available online at: https://www.lancasterfarming.com/farming-news/field-crops/how-to-market-value-added-grains-in-the-northeast/article_664d256f-bd04-5c00-8d9b-1fe249681785.html (accessed March 15, 2024).
Shroyer, J. P., Ohlenbusch, P. D., and Duncan, S. (1996). Kansas Crop Planting Guide. Kansas State University.
Sloat, L. L., Davis, S. J., Gerber, J. S., Moore, F. C., Ray, D. K., West, P. C., et al. (2020). Climate adaptation by crop migration. Nat. Commun. 11:1243. doi: 10.1038/s41467-020-15076-4
Steward, D. R., Bruss, P. J., Yang, X., Staggenborg, S. A., Welch, S. M., and Apley, M. D. (2013). Tapping unsustainable groundwater stores for agricultural production in the High Plains Aquifer of Kansas, projections to 2110. Proc. Nat. Acad. Sci. 110, E3477–E3486. doi: 10.1073/pnas.1220351110
Tack, J., Barkley, A., and Nalley, L. L. (2015). Effect of warming temperatures on US wheat yields. Proc. Natl. Acad. Sci. U.S.A. 112, 6931–6936. doi: 10.1073/pnas.1415181112
Urban, D., Roberts, M. J., Schlenker, W., and Lobell, D. B. (2012). Projected temperature changes indicate significant increase in interannual variability of U.S. maize yields. Clim. Change 112, 525–533. doi: 10.1007/s10584-012-0428-2
USDA Agricultural Research Service (2019). FoodData Central. Available online at: fdc.nal.usda.gov (accessed June 21, 2023).
USDA CropScape (2023). “CropScape - Cropland data layer,” in Center for Spatial Information Science and Systems. Available online at: https://nassgeodata.gmu.edu/CropScape/ (accessed June 6, 2023).
USDA NASS (2024). “2022 state agriculture overview for Kansas,” in USDA, National Agricultural Statistics Service. Available online at: https://www.nass.usda.gov/Quick_Stats/Ag_Overview/stateOverview.php?state=KANSAS (accessed Februaury 12, 2024).
USDA NRCS (1993). “Chapter 2, irrigation water requirements,” in National Engineering Handbook (Title 210) Part 623. Washington, D.C.: USDA NRCS, 74–76.
Van Dijk, M., Morley, T., Rau, M. L., and Saghai, Y. (2021). A meta-analysis of projected global food demand and population at risk of hunger for the period 2010–2050. Nat Food 2, 494–501. doi: 10.1038/s43016-021-00322-9
Volk, J. M., Huntington, J. L., Melton, F. S., Allen, R., Anderson, M., Fisher, J. B., et al. (2024). Assessing the accuracy of OpenET satellite-based evapotranspiration data to support water resource and land management applications. Nat Water 2, 193–205. doi: 10.1038/s44221-023-00181-7
Wada, Y., and Bierkens, M. F. P. (2014). Sustainability of global water use: past reconstruction and future projections. Environ. Res. Lett. 9:104003. doi: 10.1088/1748-9326/9/10/104003
Wolfe, D. W., DeGaetano, A. T., Peck, G. M., Carey, M., Ziska, L. H., Lea-Cox, J., et al. (2018). Unique challenges and opportunities for northeastern US crop production in a changing climate. Clim. Change 146, 231–245. doi: 10.1007/s10584-017-2109-7
Keywords: alternative crops, crop switching, water demand, crop resilience, climate change, farming adaptation
Citation: Suttles KM, Smoliak BV, Ranade AP, Potter SF, Jaeger M and McLellan EL (2024) Kansas agriculture in 2050: a pathway for climate-resilient crop production. Front. Sustain. Food Syst. 8:1404315. doi: 10.3389/fsufs.2024.1404315
Received: 20 March 2024; Accepted: 26 June 2024;
Published: 17 July 2024.
Edited by:
Jagadeesh Yeluripati, The James Hutton Institute, United KingdomReviewed by:
Sue Walker, Agricultural Research Council of South Africa (ARC-SA), South AfricaKatherine Nelson, Kansas State University, United States
Copyright © 2024 Suttles, Smoliak, Ranade, Potter, Jaeger and McLellan. This is an open-access article distributed under the terms of the Creative Commons Attribution License (CC BY). The use, distribution or reproduction in other forums is permitted, provided the original author(s) and the copyright owner(s) are credited and that the original publication in this journal is cited, in accordance with accepted academic practice. No use, distribution or reproduction is permitted which does not comply with these terms.
*Correspondence: Kelly M. Suttles, a3N1dHRsZXNAZWRmLm9yZw==