- 1Department of Statistics, College of Natural and Computational Science, Debre Tabor University, Debre Tabor, Ethiopia
- 2Department of Management and Organization, Terme Vocational School, Ondokuz Mayis University, Samsun, Türkiye
Introduction: Irrigation plays an imperative role in the expansion of agriculture production and productivity growth that reduces food security. Implementing irrigation schemes is a crucial step towards ending poverty and enhancing food security. A strong association between farmers’ engagement in irrigated agriculture boosts households’ annual income and food expenditure and improves households’ food security. To what extent, though, does the households’ food security in the Dessie Zuria District that employs irrigation surpass the food security of other households that rely on rainfall remains unclear. In addition, there is not enough information available in the research area about how irrigation affects household income or expenditure and food security. Thus, this study aims to assess the factors influencing households’ participation in small-scale irrigation and the effect of irrigation on food security. This study covers the severity of the issue and closes any gaps.
Methods: Multistage random sampling was used to consider the proportion of the heterogeneous groups to the entire population. The data were gathered in 2023 at Dessie Zuria District from a survey of 198 households (92 small-scale irrigation users and 106 non-users). Utilizing the logistic regression model, the variables affecting the likelihood of small-scale irrigation engagement were examined. Propensity Score Matching was used to examine the impacts of small-scale irrigation on households’ food security using the household’s annual income and their annual food expenditure as proxy variables. Eleven explanatory variables were used and a logit analysis result showed household family size, livestock holding in total livestock unit, access to credit, sex of households, and cultivable land were found as the main factors of small-scale irrigation participation.
Results: The Propensity Score Matching model result indicates that the adoption of small-scale irrigation increases the average annual income and annual food expenditure by 60, 273.27 (54.88%) and 5,589.12 (55.31%) Ethiopian Birr, respectively. Therefore, to recover the food security of agricultural households’ current situation stakeholders should give due attention to the growth of small-scale irrigation.
1 Introduction
For many African nations, implementing irrigation projects is a crucial step toward ending poverty and enhancing food security (Domenech, 2015). Food insecurity has been a problem for smallholder farmers in Zimbabwe due to climate-related droughts and inefficient use of irrigation systems (Mhembwe et al., 2019).
Small-scale (SS) rain-fed agriculture makes up the majority of Ethiopia’s agricultural sector; its effectiveness is influenced by a variety of factors, including erratic rainfall patterns (Sisay, 2023). Since thousands of years ago, irrigation has been the primary agricultural technology used worldwide (Kapari et al., 2023). Irrigation has long been used as a way to address poor agro-climate in regions with little rainfall and certain seasons after World War II. China, India, Egypt, and other Asian countries have all used irrigation (Hamda, 2014).
Socioeconomic transformation has also been facilitated by the use of small-scale irrigation. The term “small-scale irrigation” refers to irrigation typically done on small plots under the direction of small farmers with technology that they can efficiently manage and maintain. Among the technologies used in agriculture is irrigation that ensures double cropping by providing a continuous water supply (Aseyehegu et al., 2012). A major contributing reason to the rise in agricultural output in the rural areas of the nation is the construction of small-scale irrigation systems. This helps overcome the limitations caused by rainfall for agricultural and livestock production (Food and Agriculture Organization of the United Nations, 2011). Irrigation expansion and practice are suggested as a strategy to increase agricultural productivity and achieve economic development (Shikur, 2020).
Irrigated agriculture plays a key role in food and nutritional security and is a vital economic activity for many rural producers. In Ethiopia, irrigation produces high-value crops sold in the market, and by harvesting once or more a year, income and household resilience are increased, and livelihoods are protected (Bacha et al., 2011). This situation allows those farming to purchase more food, household goods, child education, and investment by increasing production (Eshetu et al., 2010). Ethiopia prioritizes small-scale irrigation and enterprises to reduce rural poverty and promote economic growth (Central Statistical Authority, 2012; Ebrahim et al., 2023). However, according to Seleshi (2010) at the International Water Management Institute, only approximately 5% of arable land of Ethiopia is irrigated. Furthermore, yearly withdrawals from all renewable water resources amount to less than 5% (Ministry of Water and Energy, 2013). Another study in northern Ethiopia showed the average treatment effect (ATE) on treated (ATT) results shows that participation in irrigation has a positive influence on household income, food availability, food variety score, household diet diversity, and calorie intake. Thus, it was concluded that small-scale irrigation expansion would have a positive effect on the food security of beneficiary rural households (Manjur et al., 2023).
According to Aseyehegu et al. (2012), irrigation increases input year-round, particularly labor. Additionally, it encourages self-employment and reduces active laborers’ free time. Drought; land degradation and depletion of natural resources due to rapid population growth; cultivable land shortage; dependency on rain-fed agriculture; low infrastructure, loss of produce due to problems, illnesses, and lack of durable and high-yielding types; and less productivity of animals are significant challenges facing the community in the study area (Ministry of Finance and Economic Development, 2012). Such challenges make the agricultural production in the area too low (Abraham et al., 2015).
According to a study conducted by Jambo et al. (2021) in the Oromia Regional State of Ethiopia, irrigation improved agricultural production, consumption, and revenue generation—all of which pointed to an improvement in food security—using the PSM model.
A propensity score matching (PSM) model was used to assess how irrigation affected income and food security of household (measured in terms of daily calorie intake). The outcome demonstrates that in comparison with farmers who do not use irrigation, small-scale irrigation users have a favorable and significant impact, increasing household income by 5234.258 ETB annually and increasing daily caloric intake by 244.162 kilocalories. This demonstrates that, in comparison with similar groups, households engaged in small-scale irrigation activities had greater yearly incomes and food security statuses (Awol and Arebu, 2024).
Farmers face various challenges and opportunities in irrigation practices. The irrigation extension service was of poor quality and unpackaged. Increasing the productivity of irrigated crops was limited by credit service bureaucracy, which is similar to group collateral. Water users managed their resources, but government meddling made conflicts over water use worse. In addition to improving income, irrigation gave household members and the rural community work opportunities (Kassie, 2020).
The size of the home, the amount of land under cultivation, the number of animals kept, the farmers’ assessment of the fertility of the land, the availability of financing, the proximity to the water source, and the size of the household square are the factors that strongly indicate access to irrigation. Although it did not completely solve the issue of food insecurity, small-scale irrigation was shown to be one of the workable options for securing family food needs in the research area (Tesfaye et al., 2006).
Many researchers (Wubetie et al., 2023; Aseyehegu et al., 2012) have made a great deal of effort to investigate problems associated with small-scale irrigation (SSI) in rural household income in Ethiopia. For example, the study by Hintsa et al. (2015) assessed the limitations and opportunities of small-scale irrigation practice in South Tigray, Ethiopia. Irrigation sources such as Gerardo at Dessie Zuria and Kelela Woreda Attesa watersheds are found in the South Wollo Zone of Amhara Regional State. The Attesa watershed is endowed by many rivers with potential for small-scale irrigation such as Attesa Merko Lego and several springs. However, with the available resources, a comprehensive study has not been conducted on the impacts of small-scale irrigation on food security of households, using the annual income of households and their annual food expenditure as proxy variables, and assessing the factors influencing farmers’ participation in small-scale irrigation practice. Thus, the purpose of this study was to investigate how income of households and consumption expenditures in the Dessie Zuria district are impacted by irrigation and assess the associated determinants that affect small-scale irrigation practice.
2 Methodology
2.1 The study area
Dessie Zuria district is found in South Wollo Zone, Amhara Regional State, Ethiopia. It is located at latitude 110 23”N and longitude 390 8″E and is 401 km north of Addis Ababa. It has a total area of approximately 97,672 ha, divided into 31 peasant associations. Among the total household population, there are 23,226 men and 5,972 women, whereas the total population is 164,855 of which 83,718 were women (Central Statistical Authority, 2012). Dessie town is located in northern Ethiopia, 400 km distance from Addis Ababa, its astronomical location 11,008 North Latitude and 39,038 East Longitude, total area of 15.08 square km. There are six rural and 10 urban Kebeles in the district. The total population is 151,094, of which 72,891 are men and 78,203 are women (Central Statistical Authority, 2012).
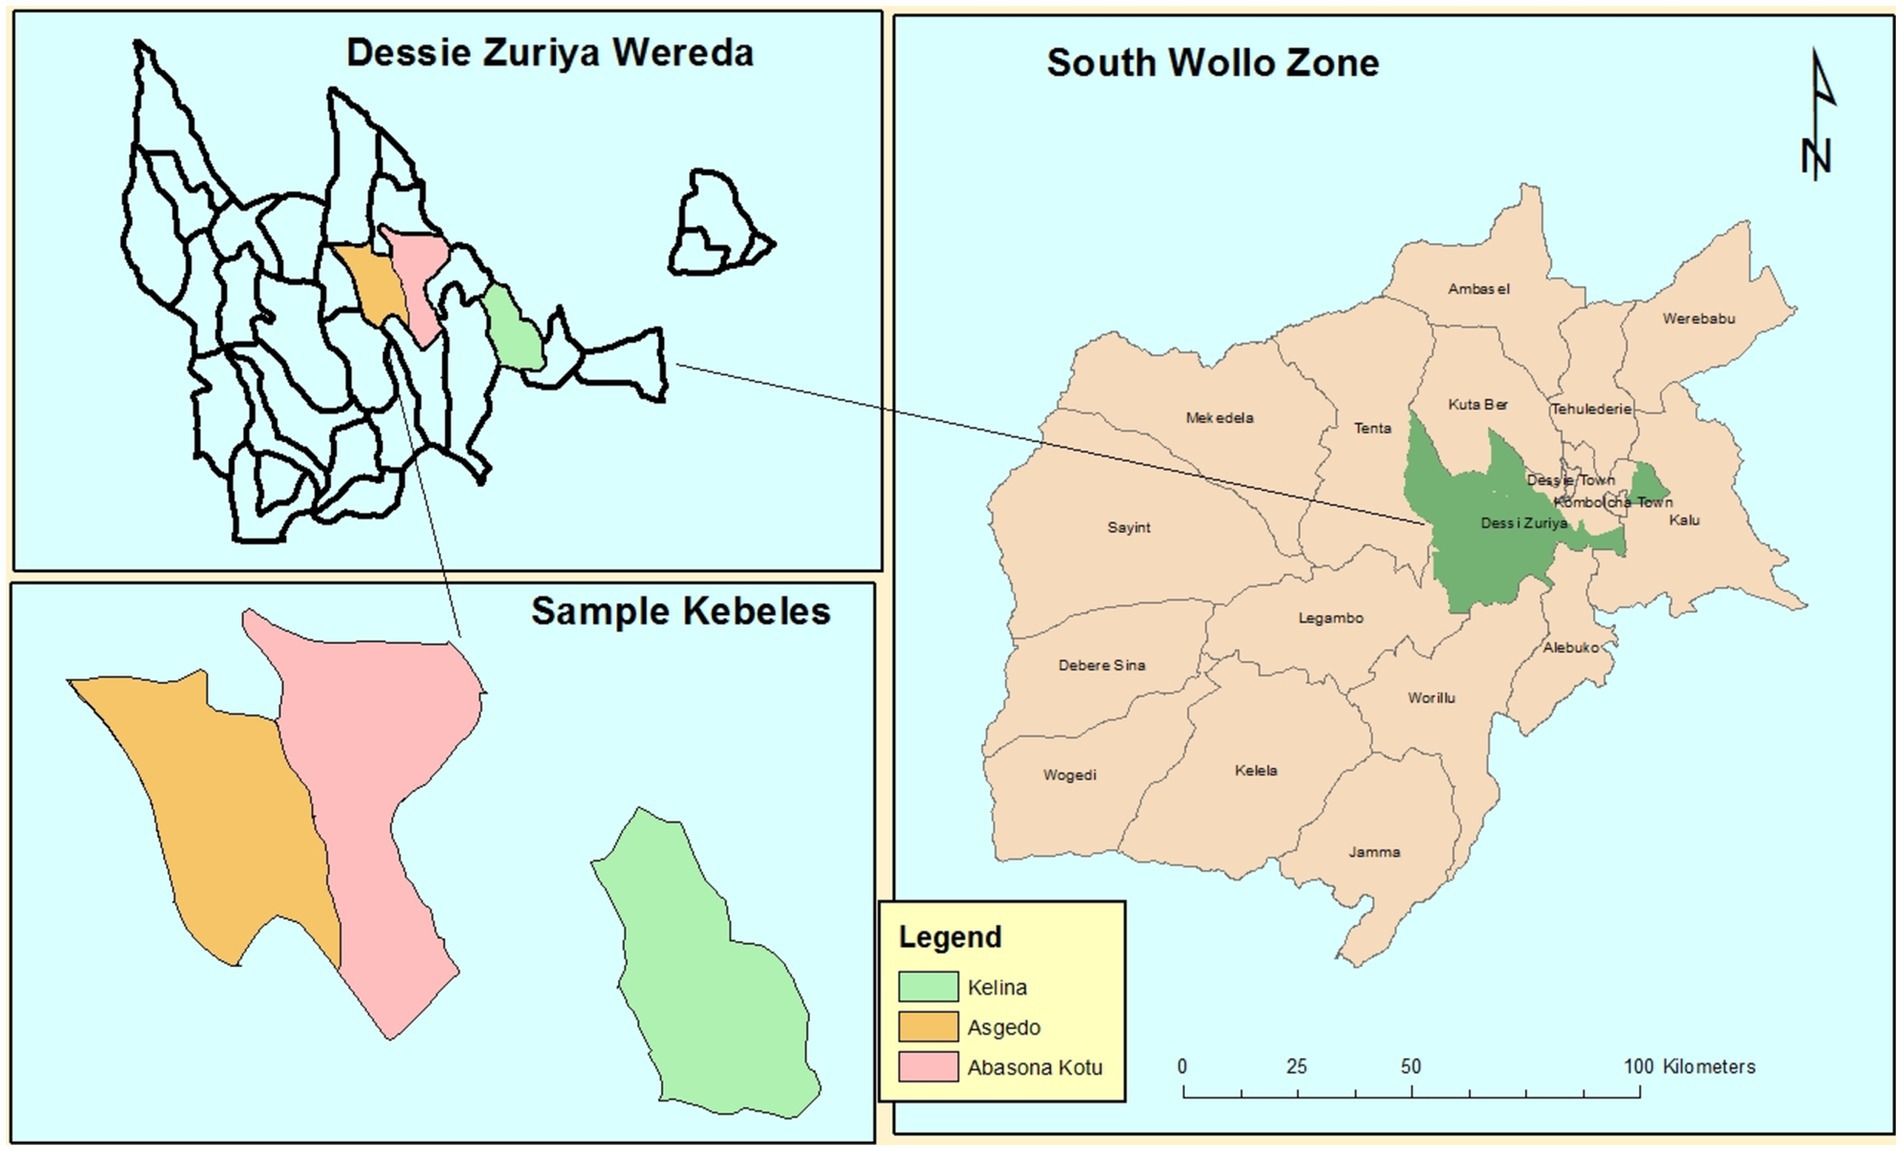
The study area (Figure 1) is Dessie Zuria district; average annual rainfall is 1,000 mm; it has the highest temperature of 22.5°C; it has the lowest temperature of 12.5°C; and altitude ranges from 1,600 m around Mitti-kolo (PA) and 3,800 m at the Yewol Mountain in Dessie Zuria District. In contrast, in Dessie town elevation is between 2,470 and 2,550 meters above sea level; the total area of Dessie Zuria District and Dessie town in hectares is 96,148.39 and 16,939.16, respectively; land use in Dessie Zuria District and Dessie town are as follows: cultivation land, 43,767.42 hectares and 6,712 hectares; settlement and plantation, 2,745.42 and 8,588.16 hectares; grazing land, 27,636.3 and 1,639 hectares; respectively. River alteration irrigation organizations are practiced in the three Kebeles.
2.2 Target population, sampling procedure, and sample size
The study considered three Kebeles of the Dessie Zuria district: Abaso, Asgedo, and Kelina. The study used multistage random sampling to choose sample respondents. First, Dessie Zuria District was purposely selected among rural districts of South Wollo Zone because the district had superior small-scale irrigation practices that allowed the creation of contemporary small-scale irrigation practices. Consequently, the researchers were inspired to select the Dessie Zuria District for this study. Out of a total of 33 Kebeles found within the district, three Kebeles were selected, namely, Abaso, Asgedo, and Kelina again purposely selected due to the availability of irrigation schemes and their proximity to the district center. That means the three Kebeles were selected based on their irrigation potential (the accessibility of groundwater and surface water for farming).
In the second stage, each selected Kebele farmer was grouped into Small_Scale irrigation users and non-users. This study considered “participants or users” of those households who used small-scale irrigation, whereas the “non-participants” were those households with no small-scale irrigation access. In the third stage, 198 farm households consisting of 92 small-scale irrigation users and 106 non-users were selected from a total of 6,178 populations within the selected three Kebeles using the Yamane formula and distributed to each kebele using a number-to-size ratio together simple random sampling approach at the lowest stage. The appropriate sample size is determined from the population (Yamane, 1967). The sample was proportionally allocated to each selected kebele and based on the irrigation engagement of households as irrigators and non-irrigators. As shown in Table 1.
N = 6,178, where = sample size, = population size, and = desired significance level; 7% desired significance level.
2.3 Data analysis methods
The collected data were entered into SPSS 25 for data management and descriptive analyses. The econometric analysis was performed using the STATA 14 software package to estimate determinates of small-scale irrigation adoption with the logit model by comparing the difference between small-scale irrigation participants and non-participants based on selected covariates. The influences of small-scale irrigation with ATE on treated groups of the study on the degree of food security of sample households was evaluated using the propensity score matching algorithm.
2.3.1 The logit model
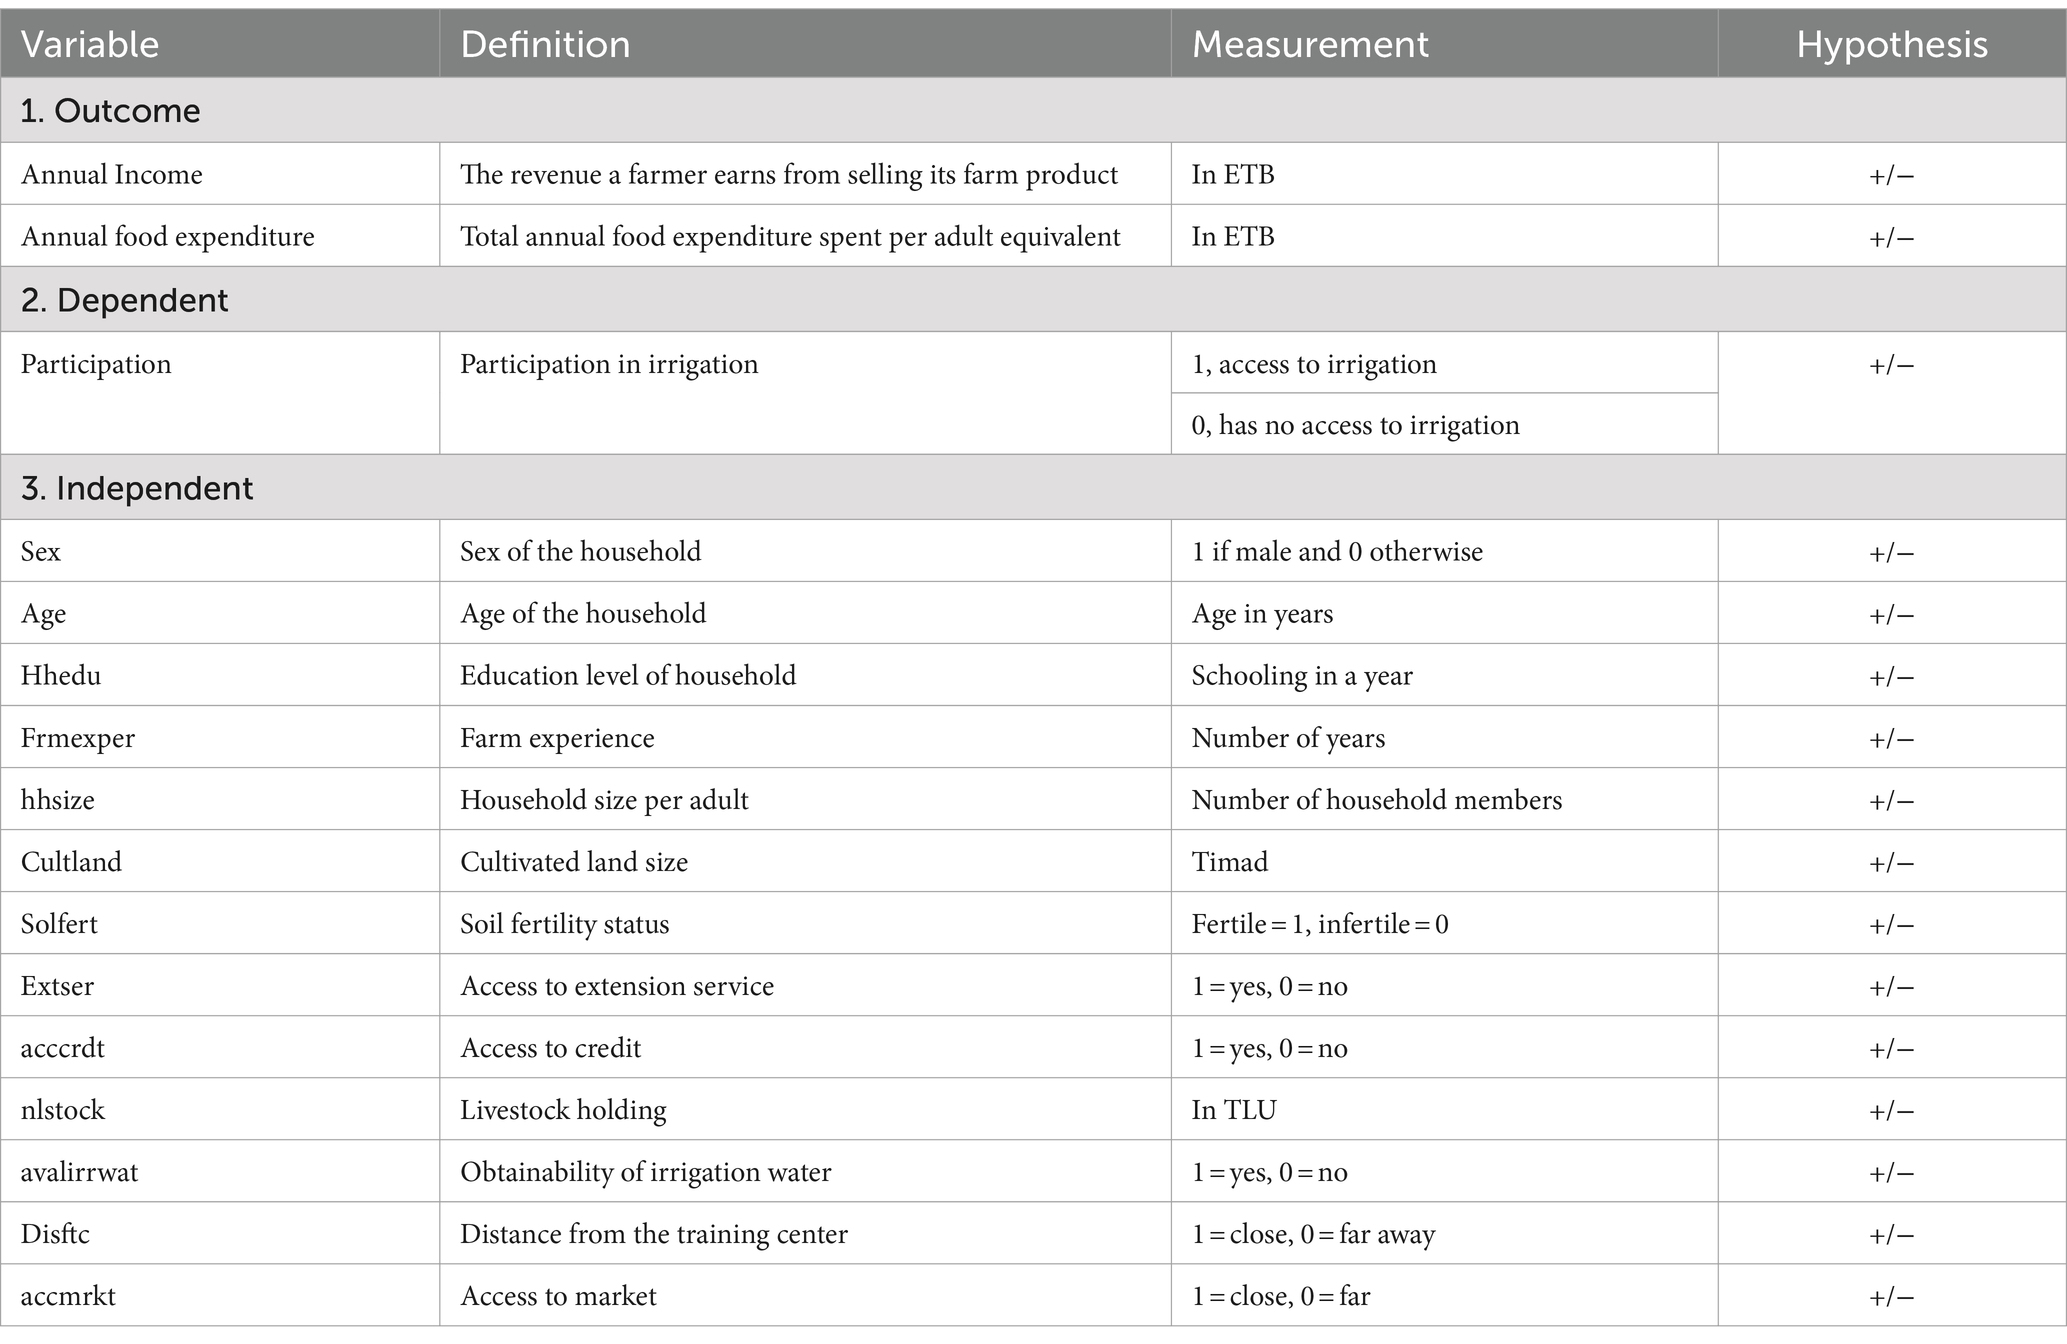
According to Caliendo and Kopeinig (2008), the choice of logit and probit models is not too critical because, for the binary treatment case, they usually yield similar results. Therefore, the probability that each family will take part in the irrigation package as a function of observable household factors was estimated using a logit model in this study utilizing a sample of small-scale irrigation beneficiaries and non-beneficiaries. The households’ participation is a dependent variable in the logit model, with a value of 1 indicating that the household took part in the program and 0 otherwise. The two outcome variables (annual income and annual food expenditure) and the explanatory variables in this model are household head sex, age, education level, family size, number of livestock (TLU), household participation in credit service, access to market, cultivable land size, farmers’ farming experience, availability of irrigation water, and soil fertility (Table 2). Mathematically the logit model is given by:
The likelihood that participation of the household in the package is as follows: , whereas the chance of not participating in the irrigation package is . Thus, it can be written as: . where () is the ratio between the likelihood that the household took part in the irrigation package and the possibility that it did not. Finally, take the natural log of the above equation, where is the probability of participating in the irrigation package. is a log of odds ratio which is linear in both and the parameters. is a function of independent variables () which can be written as:
is an intercept and represents the slopes for each independent variable. as pre-intervention features if the logit model includes the disturbance term, .
2.3.2 Propensity score matching model
The observational study approach compares the results of groups that participate in a program non-randomly and receive a “treatment” to those of a control (comparison) group. PSM has become a popular approach to estimating treatment effects (Austin, 2011). The propensity score method evaluates the treatment effect for all circumstances where one has a group of treated and untreated individuals. It is helpful in situations where treatment participation is determined stochastically by a vector of the observable features of households rather than by random assignment. Monitoring all pre-program observable household characteristics that are connected to irrigation program contribution is the top priority because the selection of irrigation beneficiary homes was not done at random. The purpose of this study was to evaluate the average treatment effect of the food security status of irrigation-engaged households that were selected using a non-random technique. However, it depends on several observable characteristics of the households (Caliendo and Kopeinig, 2008).
The most straightforward PSM estimators were nearest-neighbor (NN) matching, caliper matching, kernel and local linear matching, and stratification or interval matching.
2.3.2.1 The nearest-neighbor matching
The matching estimator with the least complexity is the nearest-neighbor (NN). To match a treated individual with the closest propensity score, the comparison group member is selected. Replacement choices are not necessary when doing NN matching. The case of the NN matching with replacement involves a tradeoff between bias and variance (Caliendo and Kopeinig, 2008).
2.3.2.2 Caliper matching
Using a caliper or tolerance width, this estimator selects the NN. Another method of enforcing the common support requirement is as follows. The caliper matching estimator is a variant of nearest neighbor that allows matches only under a tolerance on the distance in the attempt to avoid matches where the comparisons are “too far away” from the treatment unit. Thus, this is an alternative way of setting the support region.
2.3.2.3 Kernel and local linear matching
It is a recently developed non-parametric matching estimator that constructs a match for each program participant using a kernel-weighted average over multiple persons in the comparison group and assesses each treated person’s output against a weighted average of all the untreated participants’ scores, giving the most weight to those who scored similarly to the treated person.
2.3.2.4 Stratification or interval matching
The objective behind stratification matching is to take the mean difference in outcomes between treated and control observations and use that information to determine the impact within each interval, or stratum, created by partitioning the shared support of the propensity score. Analyzing the covariates inside each stratum or the propensity score balance yields the number of strata. The majority of the algorithms fit the following description: First, check to see whether the propensity score is balanced within a stratum. If not, it is necessary to split the strata. Assume that the propensity score conditional is balanced. Therefore, the propensity score specification must be revised by including higher order terms or interactions because it is insufficient in that scenario (Caliendo and Kopeinig, 2008).
2.3.2.5 Common support condition
Common support refers to the region where the values of propensity scores only exist and have a positive density within both the beneficiary and non-beneficiary distributions. Hence, all combinations of traits seen in the treatment group will be observable in the control group as long as the common support condition is implemented (Harris and Horst, 2016). By disclosing treatment observations whose estimated propensity score exceeds or falls short of the comparison group propensity scores, common support is strengthened.
2.3.2.6 Testing matching quality
It must be examined whether the matching approach can balance the distribution of the relevant variables in the control and treatment groups as the evaluation process does not condition all covariates on the propensity score. This subsection covers various methods for doing so. As previously indicated, these methods can also assist in choosing which higher-order words and interactions to include for a certain set of covariates. Comparing the pre- and post-match conditions to see whether any disparities still exist after conditioning on the propensity score is the fundamental notion behind all of the approaches. If there are discrepancies, corrective action is required because matching the score is not a complete success (Caliendo and Kopeinig, 2008).
2.3.2.7 Estimation of the ATE
The primary goal of this study was to associate the variation level in annual household income and annual food expenditure as a measure of the food security situation of small-scale irrigators and non-irrigators. Let Yi = 1 and Yi = 0 be the outcome of small-scale irrigation users and non-user households, respectively. Then, the average total treatment effect (ATT) on the treated groups is defined as: , where indicates beneficiary households (small-scale irrigation users).
Sensitivity analysis and model assessment procedures are needed to select the best-fit statistical model and estimates for the dataset (Al-Essa et al., 2024). As a sensitivity analysis, the randomization tests and the related interval estimates are not usually appropriate in observational studies as treatments are not randomly assigned to experimental units. The sensitivity of estimated treatment effects was assessed for the common support problem on unobserved covariates and its impact on the inference drawn from subgroup estimates. This can be done by using Rosenbaum-bounds analysis for conditional independence assumption (CIA). If results are very sensitive, reconsider identifying assumptions and consider alternative estimators (Caliendo and Kopeinig, 2005).
2.4 Description of study variables and hypotheses
The decision of rural families to engage in irrigation schemes and the amount of irrigation revenue generated in the research area are anticipated to be influenced by many factors. This section explains the variables that are thought to affect decisions on irrigation participation and food security.
2.4.1 Dependent variables
Participation in the small-scale irrigation system is the dependent variable for the first stage of this study, with dummy values of 1 for families with access to irrigation and 0 for those without in the study region. Moreover; the outcome variable was the total annual income earned from selling farm products and the annual food expenditure of household (Smith and Ali, 2007).
2.4.2 Independent variables
The combined effects of many factors are the independent variables hypothesized to influence the households’ decision to engage in small-scale irrigation and food security status. This study examines the potential explanatory variables that may influence farmers’ decisions to participate in small-scale irrigation and their level of food security status.
2.4.2.1 Sex of the household head (hhsex)
This variable is dummy, meaning that it has a value of 1 for men and 0 for women. Because they employ better labor inputs and have more farming expertise, men family heads are projected to earn more than female household heads. This could allow them to engage in small-scale irrigation as early as possible and earn more money than their counterparts. One significant factor influencing the uptake of technology is sex. Men frequently manage home finances and make decisions about what agricultural inputs and technology to buy. Therefore, the study hypothesized that male-headed families had a higher likelihood of taking part in the small-scale irrigation program of the study area.
2.4.2.2 Age of a household head (age)
When expressed in years, age is a continuous variable. It is among the variables that influence an individual’s decision-making. The choice to use irrigation systems and other agricultural technologies is positively correlated with age, according to earlier research. According to Tesfaye et al. (2006), younger farmers are more inventive, receptive to technical advancements, and eager to embrace new technologies.
2.4.2.3 Education level of a household head (hhedulel)
The total number of years of formal education of household head is used to measure this continuous variable. According to earlier research, the likelihood of implementing innovative farming techniques rose with educational attainment. That is to say, farmers with higher levels of education would be more likely to use irrigation technology might be easier to train with the help of extension and would encourage irrigation participation (Tafesse, 2007).
2.4.2.4 Farming experience (Frmexper)
The total number of years that the selected household has been engaged in farming is represented by this continuous variable. A farmer with more farming experience has a broader understanding of how to operate and manage agricultural operations and production techniques.
2.4.2.5 Family size (hhsize)
This is a quantitative variable that is expressed as the total number of people living in the same home after being converted to adult size. A bidirectional association between family size and the decision to use irrigation systems and other agricultural technologies was discovered in earlier research. More households with a large labor force than those with a small labor force can engage in small-scale irrigation (Tafesse, 2007).
2.4.2.6 Cultivated land holding (cultland)
The entire cultivated land area of the household heads is represented by this continuous variable, which is measured in timads. A sufficient amount of land ownership has been identified as a fundamental prerequisite for the implementation of agricultural technologies in several prior studies. It is therefore assumed that the likelihood of a farmer implementing small-scale irrigation technology increases with farm size. The amount of land under cultivation should positively correlate with an income of household (Eshetu et al., 2010).
2.4.2.7 Soil fertility (solfert)
This is a dummy variable: 0 indicates infertile soil and 1 indicates fertile soil. It is among the elements influencing crop yield. Productivity and land fertility are directly correlated. According to the investigation, the state of food security and soil fertility are systematically correlated. The decision to choose an agricultural technology can also be influenced by the quality of the land (Zhou et al., 2008). Therefore, it is assumed that farmers with fertile soil have a higher likelihood of having secure food supplies than those without.
2.4.2.8 Total livestock holdings (nlstock)
This variable, which is continuous, denotes the total number of livestock in TLU. The number of each type of animal multiplied by its conversion factor yields the home livestock size in TLU, which is then summed. In Ethiopian agriculture, livestock is a vital source of food, cash, and draught power for crop production. It is anticipated that raising more animals will raise the likelihood of engaging in small-scale irrigation.
2.4.2.9 Market access (accmrkt)
This is a dummy variable with a value of 1 if farmers can purchase and sell their farm products at neighboring markets, and a value of 0 otherwise. A farmer is more likely to engage in small-scale irrigation and sell farm products if they have access to markets. Adoption decisions may be influenced by local characteristics (Tafesse, 2007). As a result, it is anticipated that households with market access will be more likely to engage in small-scale irrigation and raise their level of food security.
2.4.2.10 Distance from farmers’ training center (disft)
This continuous variable has a unit of measurement of km. The likelihood of commencing and using irrigation decreases with the distance between home and the farmer training centers, development agency offices, and/or other locations.
2.4.2.11 Access to extension service (extser)
This variable takes values of 1 when the household head has an extension facility and 0 when no extension facility is provided. This shows whether or not the head of the household uses extension services of development agents (DAs). Farmers can increase agricultural productivity by acquiring new skills and knowledge through the assistance of extension services. According to Bacha et al. (2011), access to extension differed significantly between irrigators and non-irrigators. The greater the likelihood that farmers will have access to and utilize irrigated agriculture. Therefore, it was hypothesized that this variable would favorably affect the number of people who participate in the small-scale irrigation system.
2.4.2.12 Access to credit (acccrdt)
This is a dummy variable that, in the event that the household accepts the loan, takes the value 1. Having access to credit is a crucial component of investing. Households with financial access are more likely to obtain agricultural inputs. Thus, it is hypothesized that farmers’ decisions to engage in small-scale irrigation and their level of food security are positively influenced by their access to financing. This suggests that a valuable resource for rural living is the formal and informal credit options that help farmers pay for their purchases of agricultural supplies.
3 Results and discussion
3.1 Descriptive analysis of characteristics of sample households
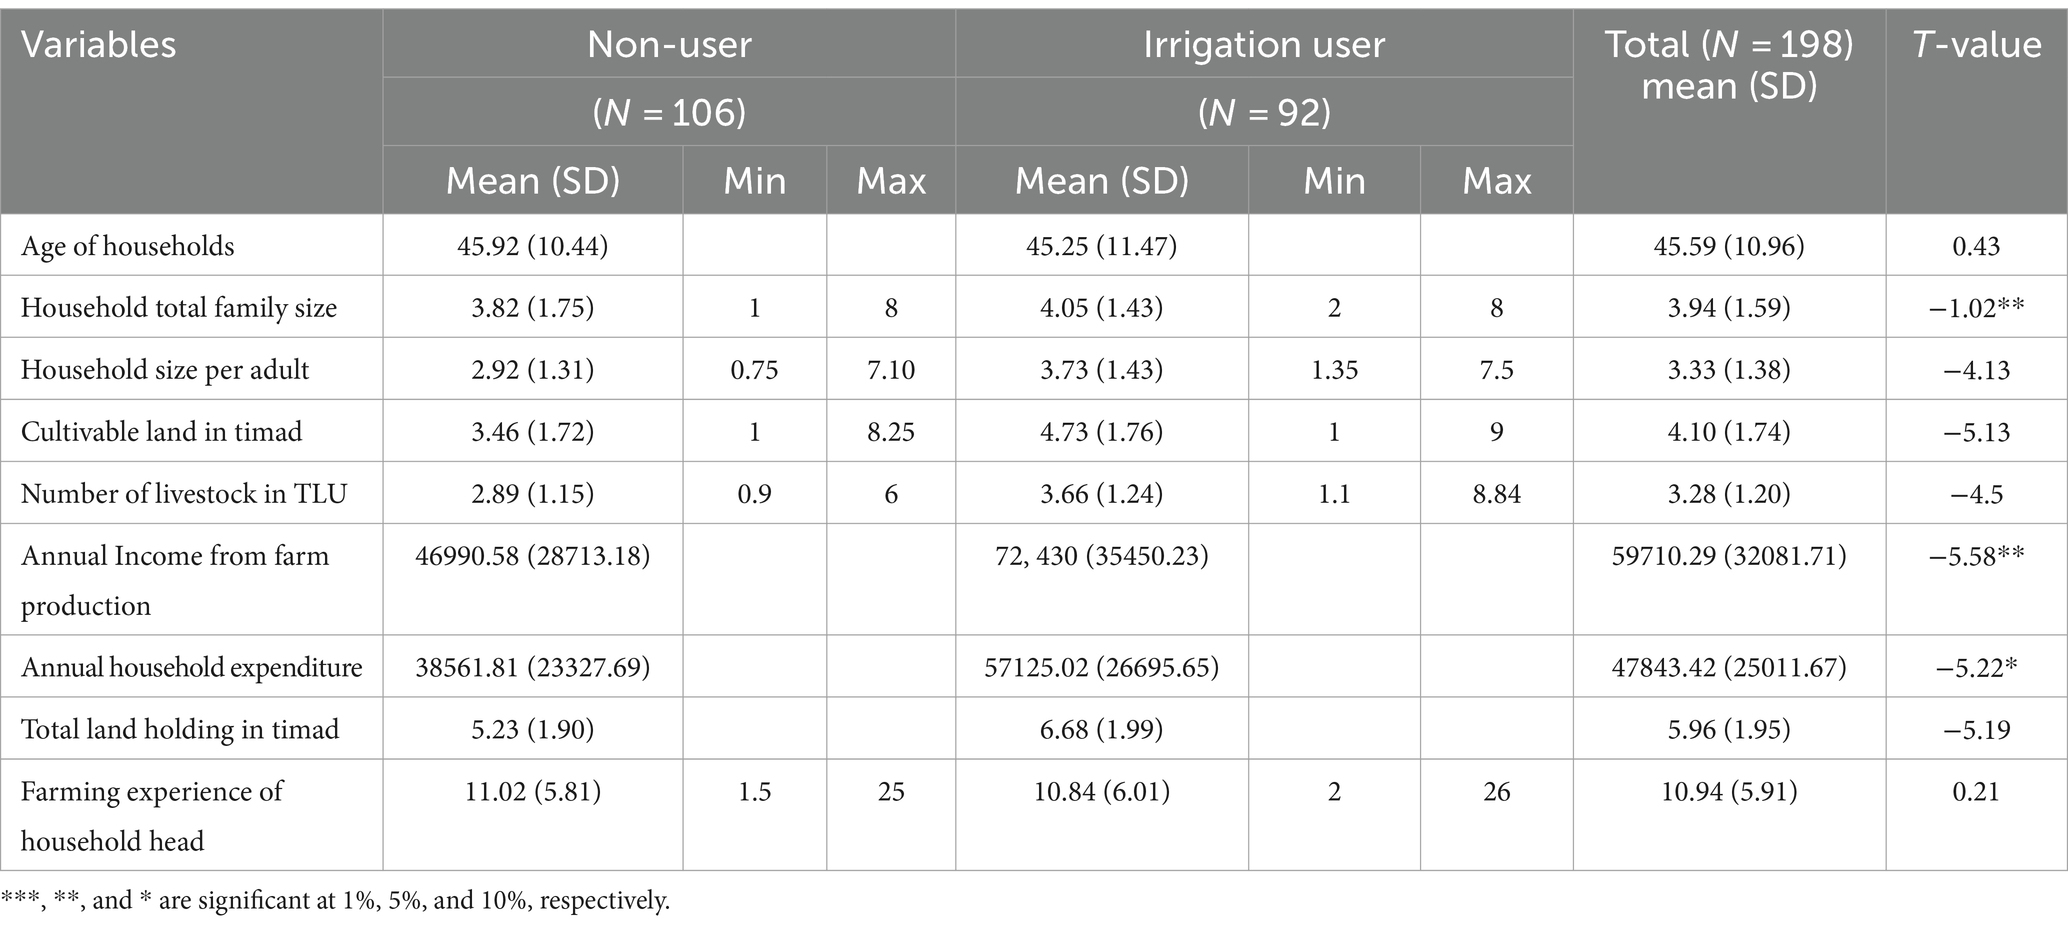
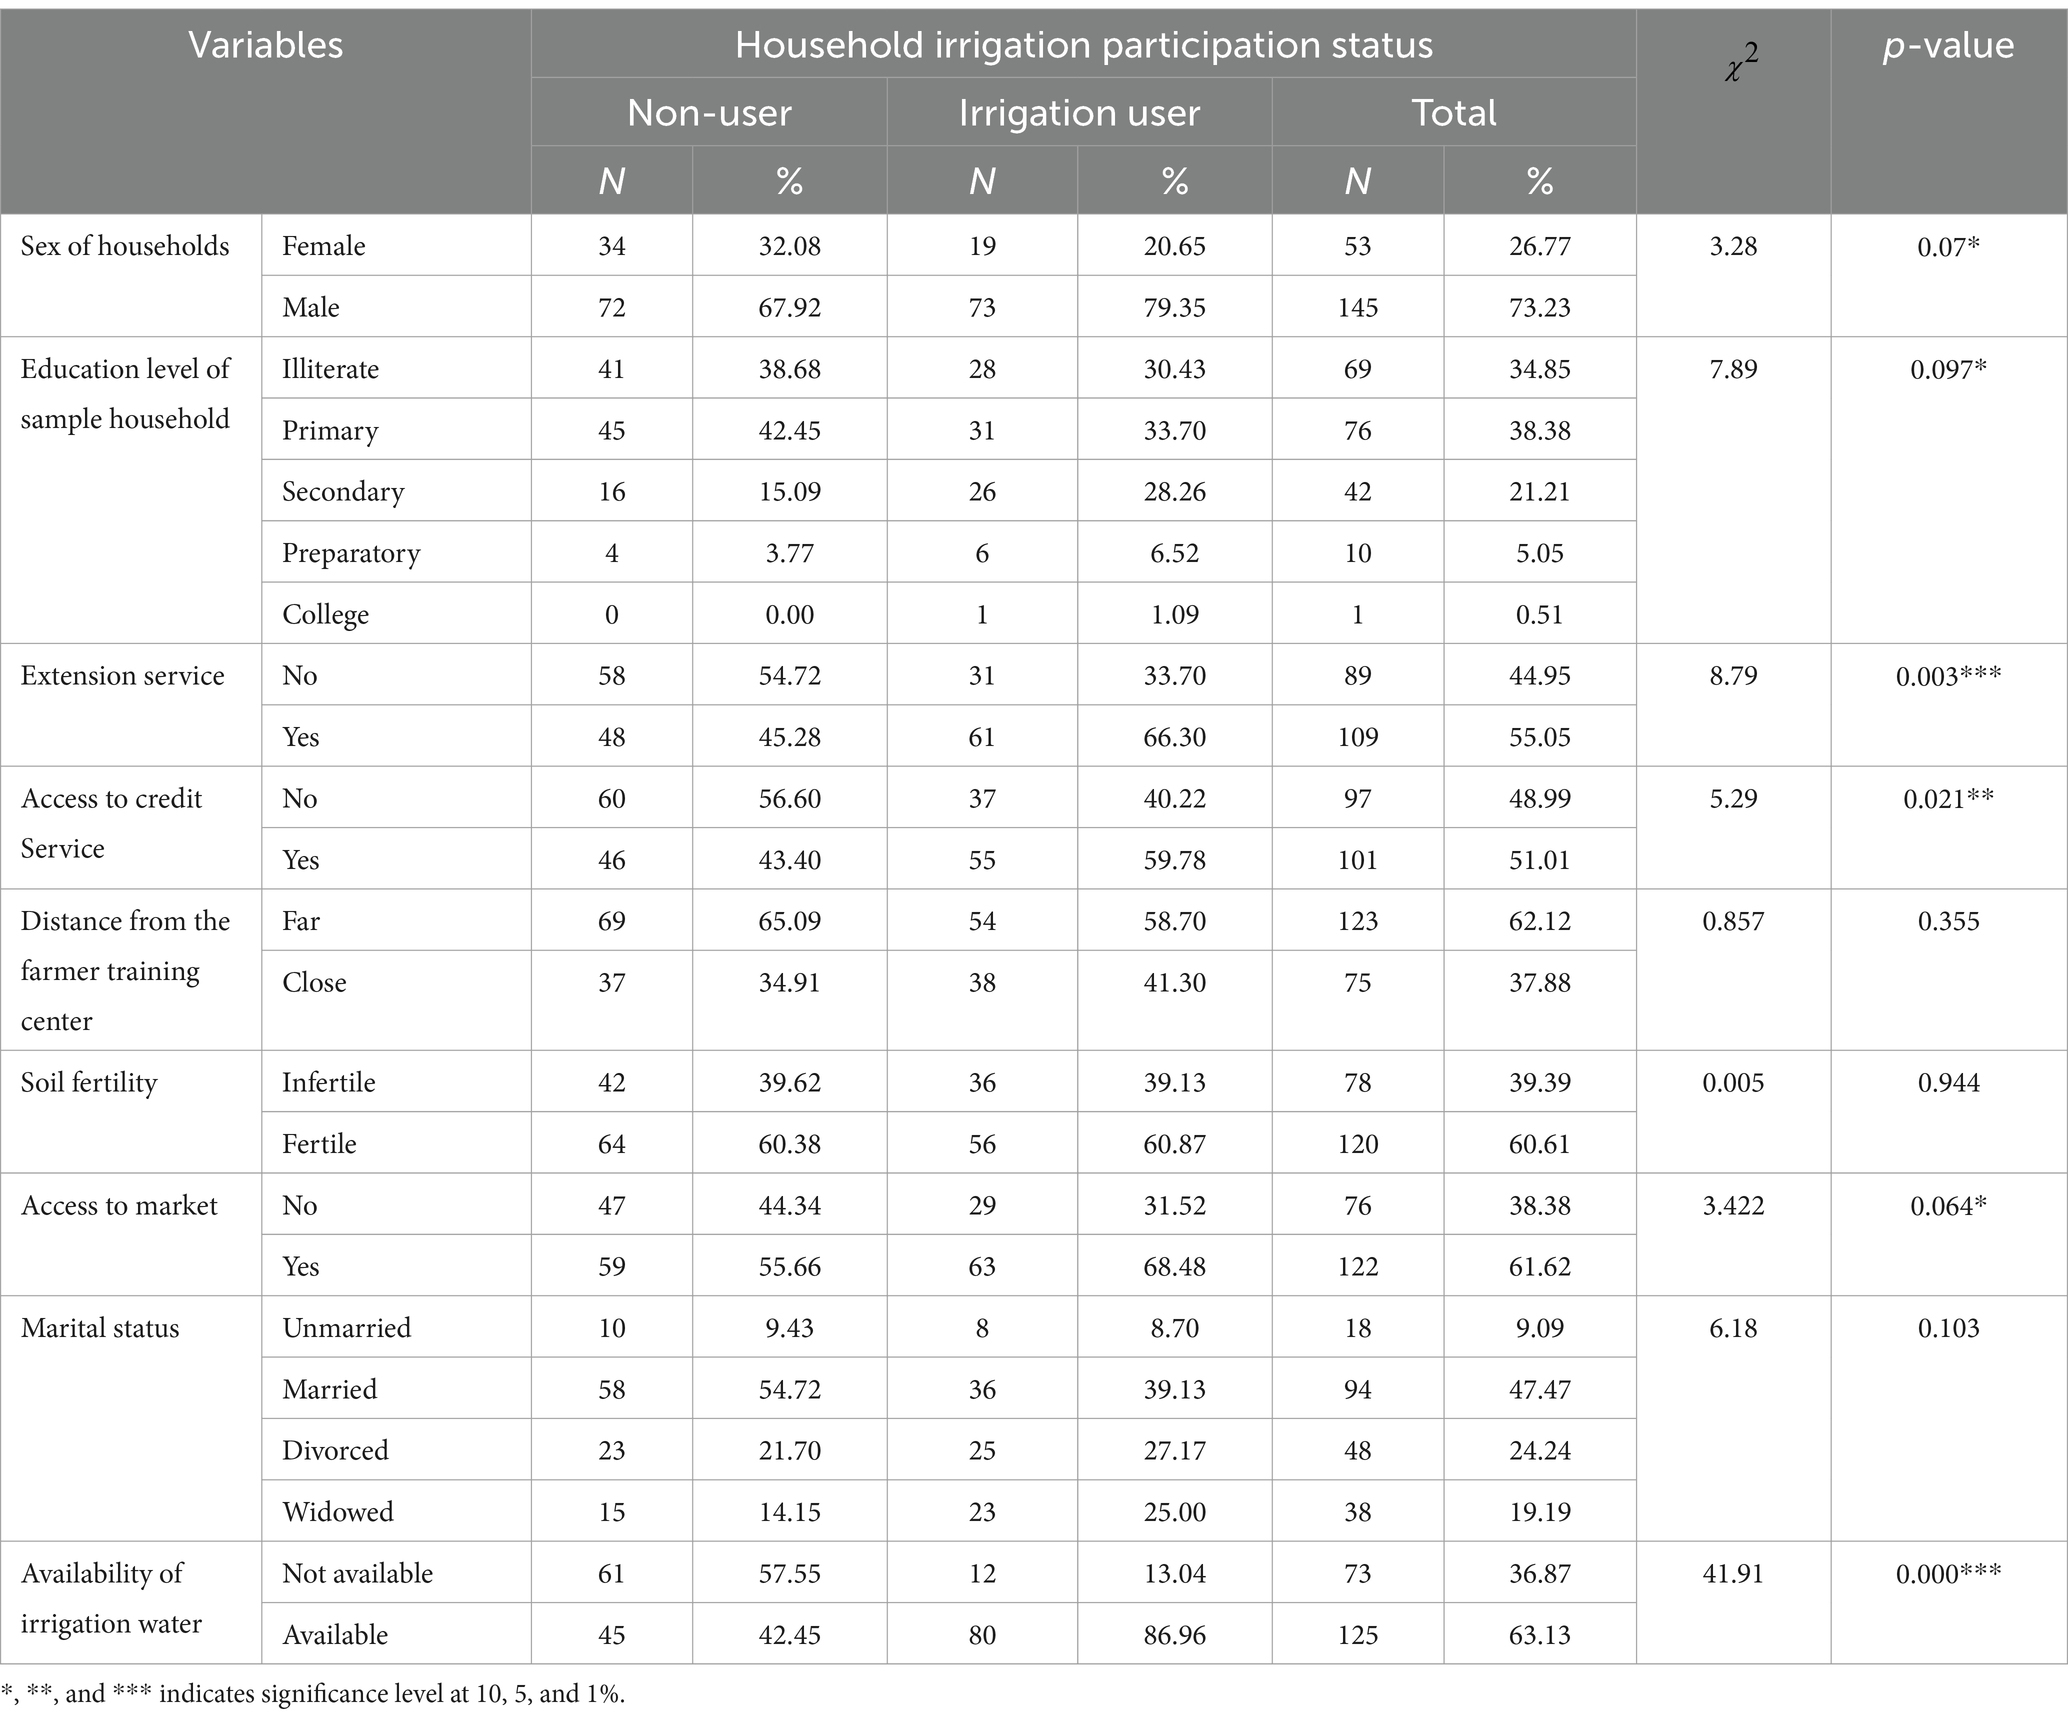
Based on previous research experiences, various social, economic, and institutional variables were used in this study, including the household head’s age, sex, and educational attainment; family size; land holding; agricultural experience; distance from the farmer training center; credit; irrigation water and extension access; and livestock holding. Important variables are summarized in Tables 3–5, together with their mean, standard deviation, t-test, and chi-square test of important variables. Preliminary results show that 92 of the 198 households in the study area—or 46.5% of the total—adopted small-scale irrigation, and the other 106 (53.5%) were non-irrigation and from this 20 were female-headed households. However, the degree of small-scale irrigation participation differs widely between sex groups of households (Table 3).
3.1.1 Sex
From those irrigation users, 79.35% were male-headed households and 20.65% were female-headed households, whereas 67.97% were male-headed households and only 32.08% were female-headed households for non-participants. According to the results of the chi-square test on sex, the variation between participants and non-participants was found to be statistically significant at a 10% significance level. Therefore, being male is advantageous to involve in small-scale irrigation in the study area.
3.1.2 Age
The mean age of irrigators and non-irrigators was 45.9 and 45.3 years, respectively (Table 4), which is almost similar, and the t-test showed that there is no significant age difference between irrigation users and non-users in the study area.
3.1.3 Family size
The mean family size of irrigation user and non-user households in the study area was approximately 4 and 3, respectively (Table 4). The descriptive analysis showed a significant difference in family size of households between irrigation users and non-users in agricultural practice at a 5% significance level. This result implies that the family size of irrigation users was higher as compared to non-irrigators. This may be due to the labor-intensive nature of irrigation practices.
3.1.4 Family size per adult
As the descriptive analysis shows the mean family size per adult equivalent of small-scale irrigation participants was 3.73 for small-scale irrigation users and 2.92 for non-users, but the t-statistics indicates that there is an insignificant difference between small-scale irrigation users and non-irrigators (Table 4).
3.1.5 Education level
This variable was represented by categorical value. Of the total sample households 34.85% were illiterate, 38.38% primary, 21.21% secondary, 5.05% preparatory, and 0.51% college level (Table 5). Of those participants 30.43% were illiterate, 33.7% primary, 28.26% secondary, 6.52% preparatory, and 1.09% college level, whereas non-participants attained 38.68% illiterate, 42.45% primary, 15.09% secondary, 3.77% preparatory, and 0% college level. Household heads of irrigation participants and non-participants had significantly different educational backgrounds, with a 10% significance level. The findings show that, in comparison with the participants, the non-participants had a lower educational level.
3.1.6 Farming or agricultural experience
The average amount of farming experience across all the households in the study area was 10.94 years, with a standard deviation of 5.91 years. The average farming experience of irrigators was 10.84 years with a standard deviation of 6.01 (Table 4). However, the mean farming experience of the non-participants was 11.02 with minimum and maximum experience of 1.5 and 25, respectively, and a standard deviation of 5.81. The descriptive analysis showed that there was an insignificant difference in the year of farming experience of households between irrigation users and non-users.
3.1.7 Extension service
This refers to the farmer’s capacity-building activity mostly delivered by district experts and extension agents on crucial farming information. The findings in Table 5 showed that out of the total respondents, 55.1% of them have gotten extension services with DA and district experts many times a year. However, out of the total irrigation users, 66.6% have access to extension services while 45.3 of non-user respondents have extension access. The chi-square test showed that there exists a significant difference between irrigation participants and non-participants at a 10% significance level. This result indicates that those households who had extension services have a good chance of involvement in small-scale irrigation practices. Positive and significant associations were also found in other similar investigations (Petros and Yishak, 2017).
3.1.8 Cultivable land
According to the findings of the descriptive analysis (Table 4), the mean cultivable land size for all sample households in the study region was 4.10 timad, with minimum and maximum cultivable land sizes of 1 and 9 timad, respectively. Conversely, the average cultivable land area of the non-participating households was determined to be 3.46 timad, with minimum and maximum values of 1 and 8.25 timad, respectively, while the participants’ average cultivable land area was discovered to be 4.73 ha, with minimum and highest values of 1 and 9 timad, respectively. When comparing families with and without irrigation practices, the descriptive analysis did not find any discernible differences in the amount of cultivable land (Table 4).
3.1.9 Total landholding
Landholding plays an excessive role in using small-scale irrigation. This study revealed the mean value of land holding of the total respondents was 5.96 timad. However, the average land size of irrigation users was 6.68 timad whereas it was 5.23 timad for non-user respondents. According to the t-statistics result (Table 4), there was no significant mean difference in the amount of land held by households that used irrigation and those that did not.
3.1.10 Number of livestock available (TLU)
For all study sample households combined, the mean total livestock holding is 3.28. The mean livestock holding of the non-participants was 2.89 with a standard deviation (SD) of 1.15. However, the average (mean) livestock holding of the irrigation participants was 3.66 with a standard deviation of 1.24 (Table 4). Thus, there was no significant difference in the livestock owned by households between irrigators and non-irrigators.
3.1.11 Annual households’ food expenditure
The mean annual food expenditure of small-scale irrigators and non-irrigators was found to be 57125.02 and 38561.81 Ethiopian Birr, respectively, and this mean difference was significant with a 10% significance level. However, the annual food expenditure per adult equivalent was 5589.12 birr for small-scale users and 4338.43 birr for non-users (Table 4)
3.1.12 Water available for irrigation
The availability of irrigation water is the basic resource to run irrigation activities. The descriptive statistics revealed that approximately 86.9% of small-scale irrigation users have easy access to water sources while only 42.5% of non-users have accessible water. From the focus group discussion, those small-scale irrigation participants who have not had easy access to natural or diversion water sources use different water collection methods like digging small water harvesting structures and fetching distant rivers and springs.
3.1.13 Access to credit service
As past research conducted showed credit access is a main factor that can determine the technology adoption status of poor farmers in different developing countries, where capital is the prevailing bottleneck. According to Table 5 results, out of the overall 198 sample respondents, 51% used credit from Amhara Credit and Saving Institution (ACSI) and Government credits (Food security programs). However, out of this 59.8% were participants and 43.4% were non-participants. The results of the chi-square test statistic showed a significant difference in credit access between irrigation user participants and non-users at a 5% significance level. Therefore, those farmers who had credit access have the possibility of involvement in small-scale irrigation practices, this may be through purchasing different farming tools and necessary inputs.
3.1.14 Market access
From the descriptive analysis, from the total 198 sample households 61.62% have access to the market for their production, and among 92 sample small-scale participants and 106 sample non-irrigation participants, 68.48 and 56.6% households have market access, respectively, and the chi-square statistics showed that, at a 10% significance level, there was a substantial difference in the market access between irrigators and non-irrigators farmers in irrigation practice. The finding suggests that non-irrigators have greater access to the market than irrigators.
3.2 Food security level of sample households
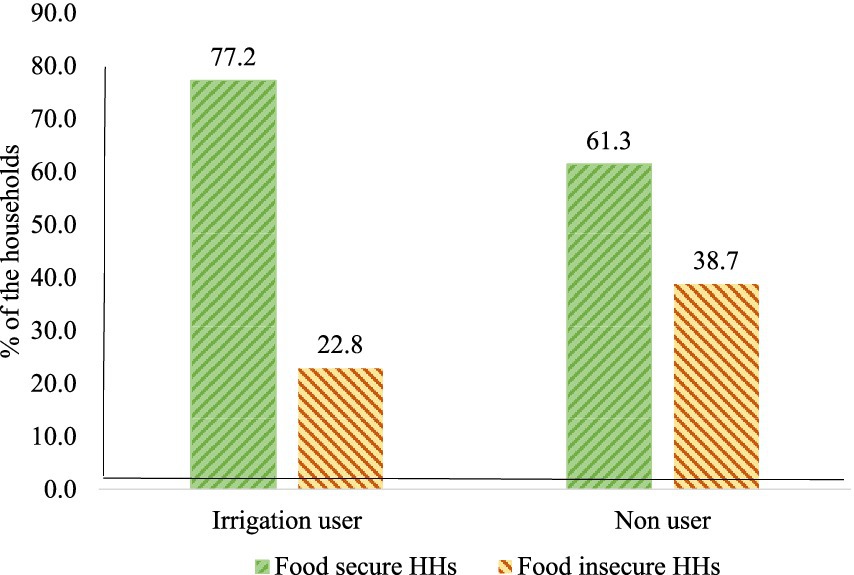
The Ethiopian development plans which are well aligned with the Millennium Development goal set an equal value of 225 kg/adult/year to 2,200 kcal/adult/year, and this is equivalent to 3,781 birr/adult/year (Central Statistical Authority and World Food Program, 2014). Based on the evidence (Figure 2) in this study, approximately 77.2% of small-scale irrigation users are food-secured households; 61.3% of non-small-scale irrigation users are food-secured; the other 38.8 and 22.8% are food-insecure (Wubetie et al., 2023) irrigation non-user and user households, respectively.
3.3 Econometric result
The entire procedure used to determine how small-scale irrigation affects households’ food security in the Dessie Zuria District is covered in this section. The practical steps were fitting the binary logistic regression, estimating the PSM (predicting pr), matching across exposure (using different matches), choosing the matching algorithm; throwing off support observations, assessing balance between groups, balancing test, and sensitivity analysis.
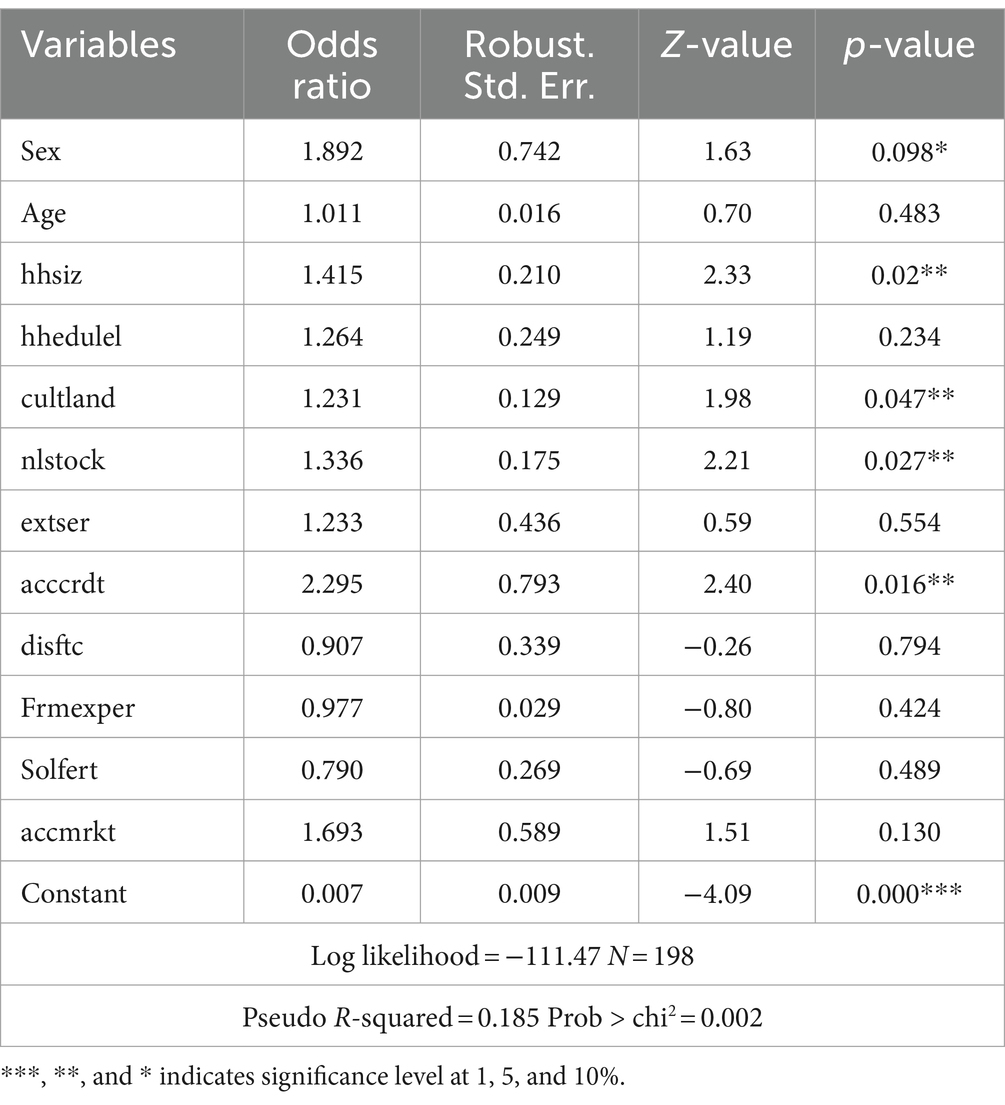
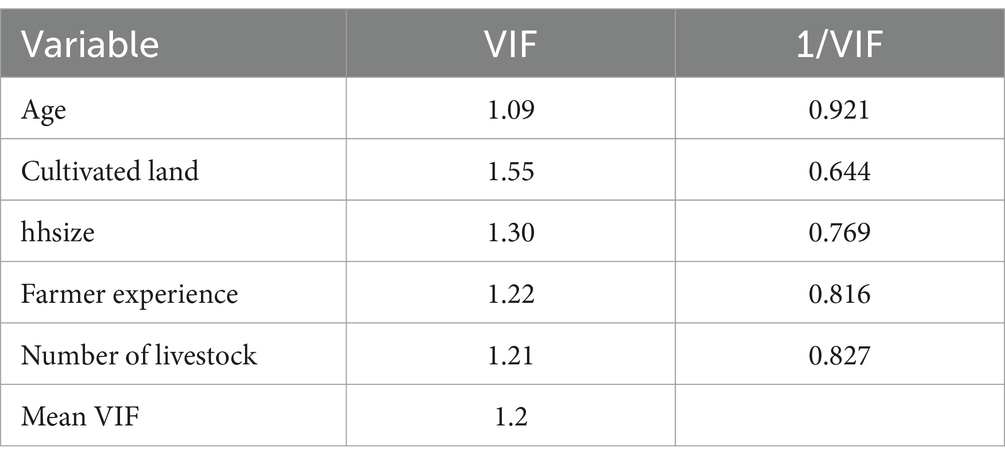
Before running all STATA econometric analyses, we attempt to include important variables that had a strong influence on the adoption of small-scale irrigation technologies through reviewed past research. For this study, 12 important explanatory variables were selected and it is found very important to look into whether there exists a linear correlation between selected independent variables or not (i.e., multicollinearity); for this case, variance inflation factor (VIF) test for continuous independent variables was conducted and the VIF value was under 10, which shows there is no linear correlation between this explanatory variable. Similarly, the degrees of association within dummy explanatory variables were tested with a contingency coefficient test, and among four discrete explanatory variables, only one variable (access to availability of irrigation water) was omitted due to a correlation problem. In addition, the multicollinearity test (Appendix Tables A1, A2) with VIF and correlation coefficients; the heteroscedasticity problem using the hettest and omitted variable problem using the ovtest were conducted. Finally, as model goodness fit showed logit model was appropriate and even significant at a lower than 1% significance level (Appendix Table A3). Therefore, for this study, a total of 11 explanatory variables were used and a logit analysis result (Table 6) showed that a total of five variables were significant and the other seven were not significant. Household family size in adult equivalent, number of livestock in TLU, cultivable land, and access to credit were highly significant at a 5% significance level and positive relationship with uses of small-scale irrigation. The sex of households was also found significant at a 10% significance level with a positive relation. The effect of significant explanatory variables on participating on small-scale irrigation was discussed below.
3.3.1 Sex of households (sex)
This variable significantly and favorably affects engagement of households in small-scale irrigation. Thus, one extra additional male-headed household increases the odds of contributing to small-scale irrigation by a factor of 1.89, this result shows that additional male-headed households can positively contribute to participation in small-scale irrigation practice in the study area.
3.3.2 Household size (hhsize)
The number of households per adult equivalent was positively associated with participating in small-scale irrigation activities with a 5% significance level. Hence, most small-scale irrigation activities need more labor force, and those households having more family labor are found to participate in small-scale irrigation activities. Thus, one extra additional family size per adult equivalent increases the odds of involvement in small-scale irrigation by a factor of 1.42. This result indicates that additional adult family size can positively contribute to participating in small-scale irrigation activities.
3.3.3 Cultivable land (cultland)
It is obvious that cultivable land is the most important and scarce resource for most farmers to cultivate a variety of crops. In the study area, the average cultivable land was found to be approximately 1 ha and this may make most farmers involved in small-scale irrigation beyond rain-fed agriculture. From the econometric result, cultivable land was found to be positively affected by farmers’ participation in small-scale irrigation with a 5% significance level. This result revealed that one extra additional timad of land increases the odds of farmers’ participation in small-scale irrigation by a factor of 1.23.
3.3.4 The number of livestock (nlstock)
There is also evidence that the number of livestock in total livestock units (TLU) is an important factor in farmers’ irrigation participation. This variable was found to positively affect farmers’ participation with a 5% significance level. This may illustrate that livestock were the main sources of income for rural farmers to adopt different agricultural inputs and technologies and also used to plow farmlands beyond their sources of food and energy to farmers. The study result showed one extra additional number of livestock in TLU can increase the odds of a farmer’s small-scale irrigation participation by a factor of 1.34.
3.3.5 Access to credit (acccrdt)
This variable was also shown to be highly significant at the 5% probability level. The outcome indicated that the likelihood of a farmer participating in small-scale irrigation increases by a factor of 2.29 for every additional farmer who gains access to financing. According to this, having financing (credit) availability increases farmers’ awareness of and interest in new technologies, which promotes their adoption.
3.3.6 Estimation of propensity scores
In PSM, the treated groups were used to assess what happened to the household food security level in the presence of small-scale irrigation. PSM was used to obtain information from a pool of units that practice small-scale irrigation, and it was possible to evaluate the effect of small-scale irrigation usage on households’ food security level by comparing it with the quantity of income gained from agricultural products.
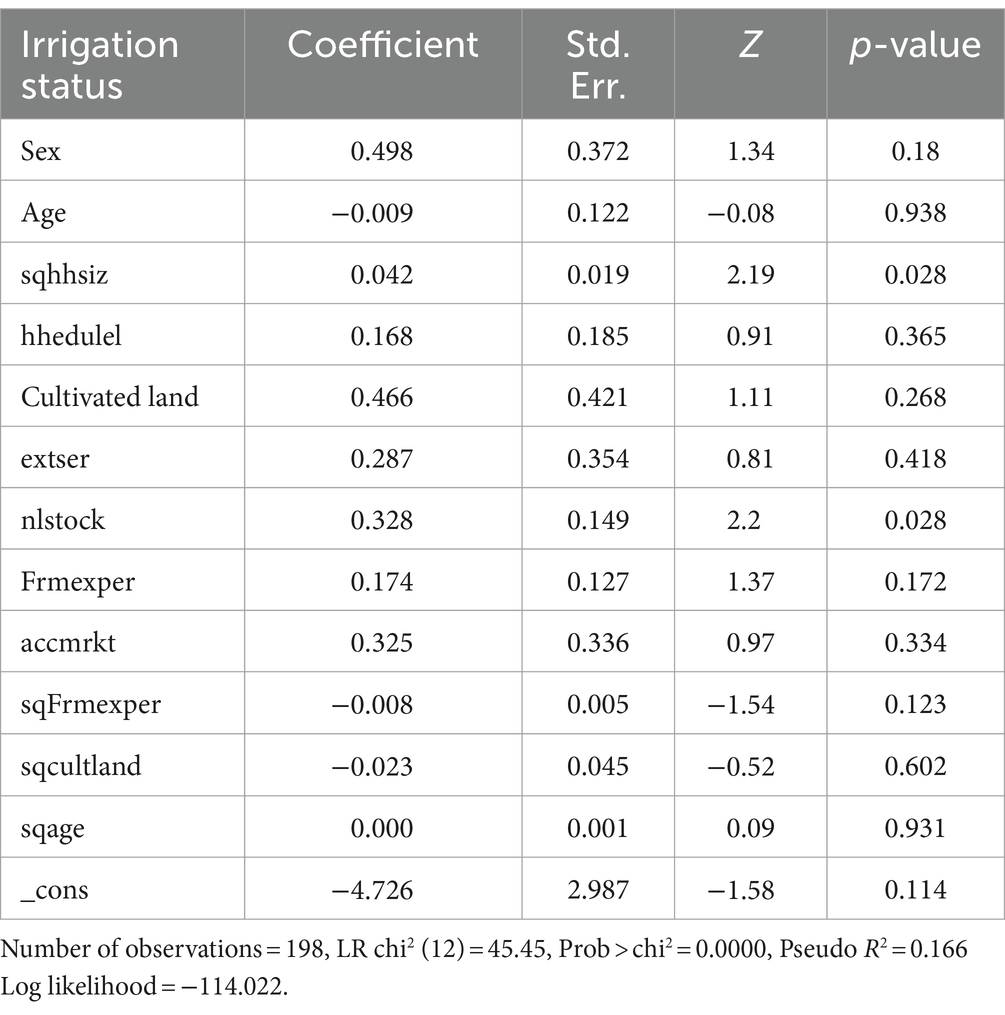
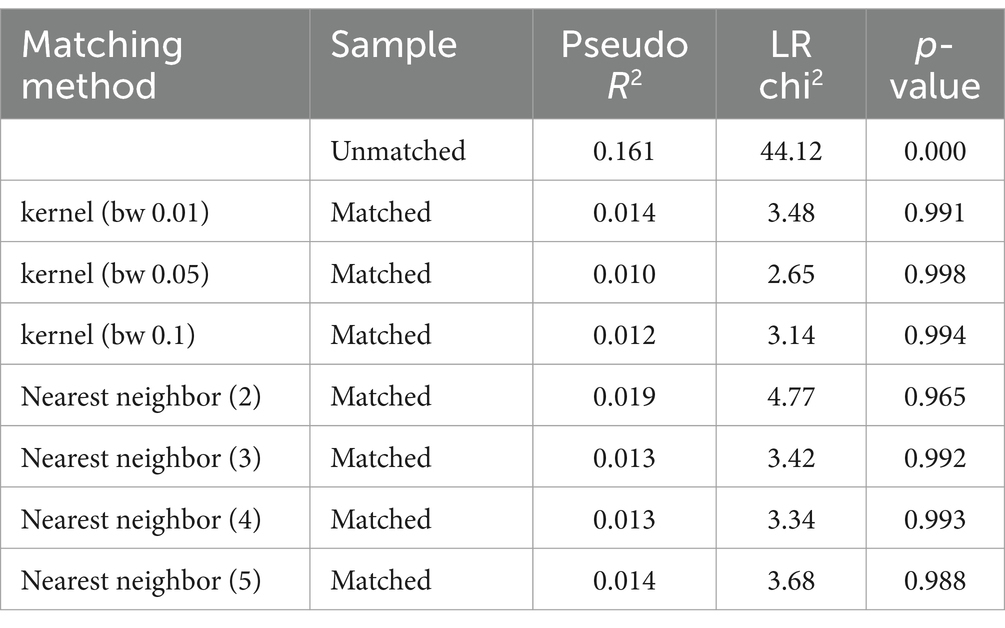
Propensity score matching for small-scale irrigation users and non-user households was estimated using the logistic regression model. In this phase, matching on a single variable was made possible by generating PSM, or the probability of involvement, which summarizes the information for all input features. The pseudo-R2 value is 0.166, as seen in Table 7, which suggests that there are not many features that differ between the households. Finding a match between those who participate in small-scale irrigation and those who do not could therefore be easy.
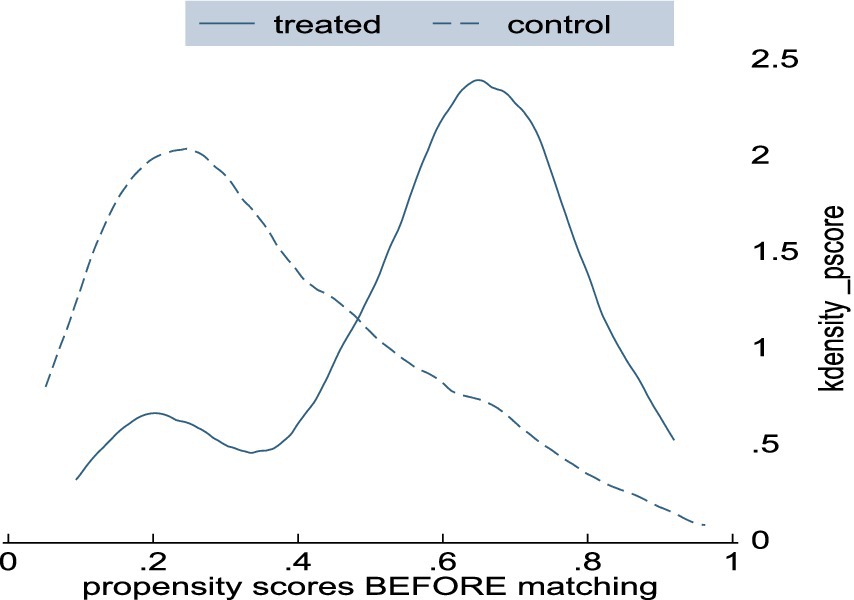
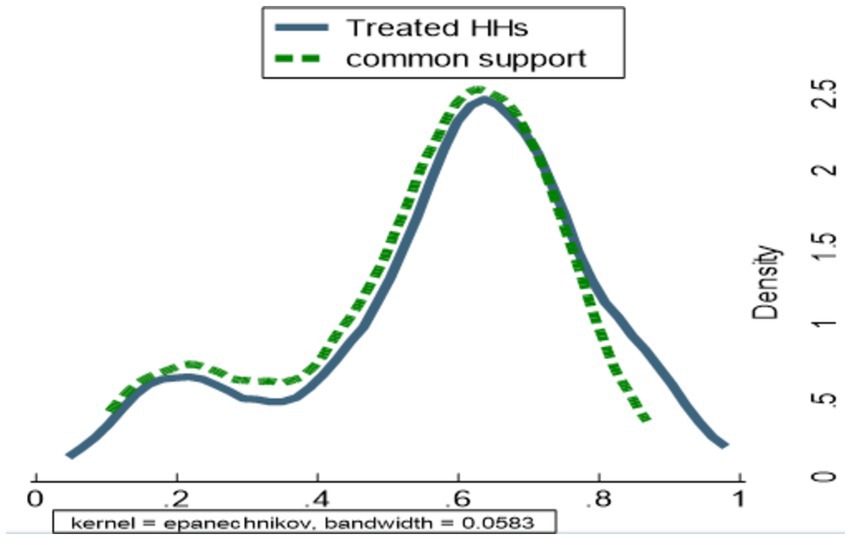
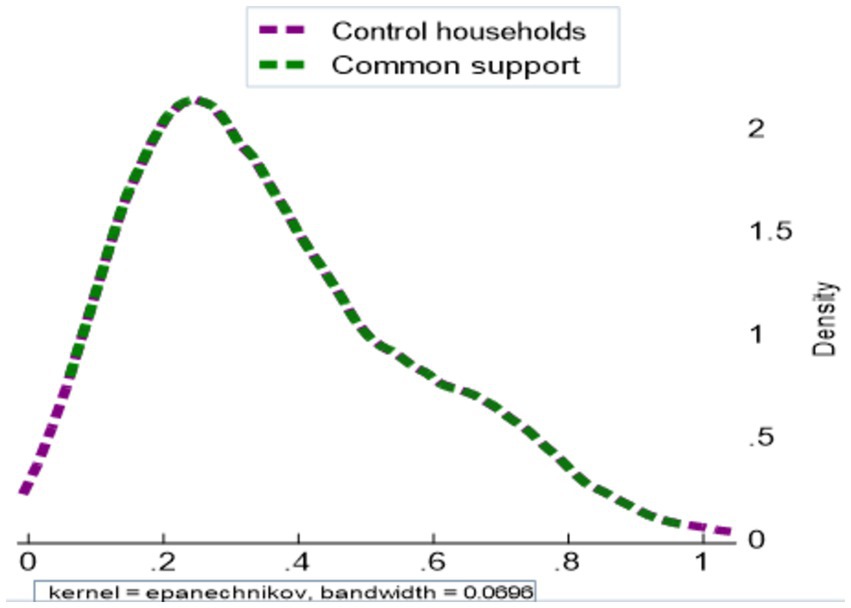
The propensity score of the treated households was primarily located on the right side of the graph and partially in the middle, as depicted in Figure 3. In contrast, the control or untreated households were primarily located on the left side of the graph and partially in the middle.
3.3.7 Matching small-scale irrigation participants with non-participants
From Table 8, the propensity distribution for sample households was between 0.061148 and 0.97089. This propensity score ranges from 0.1038903 and 0.92183 for small-scale irrigation users and between 0.061148 and 0.97089 for non-small-scale irrigation users. Based on the criteria of maxima and minima, the shared area of support is located between 0.103893 and 0.92183. The households included in this analysis do not fall under this region. Consequently, the study excluded 0 control and 13 treated households as shown in Figures 4, 5.
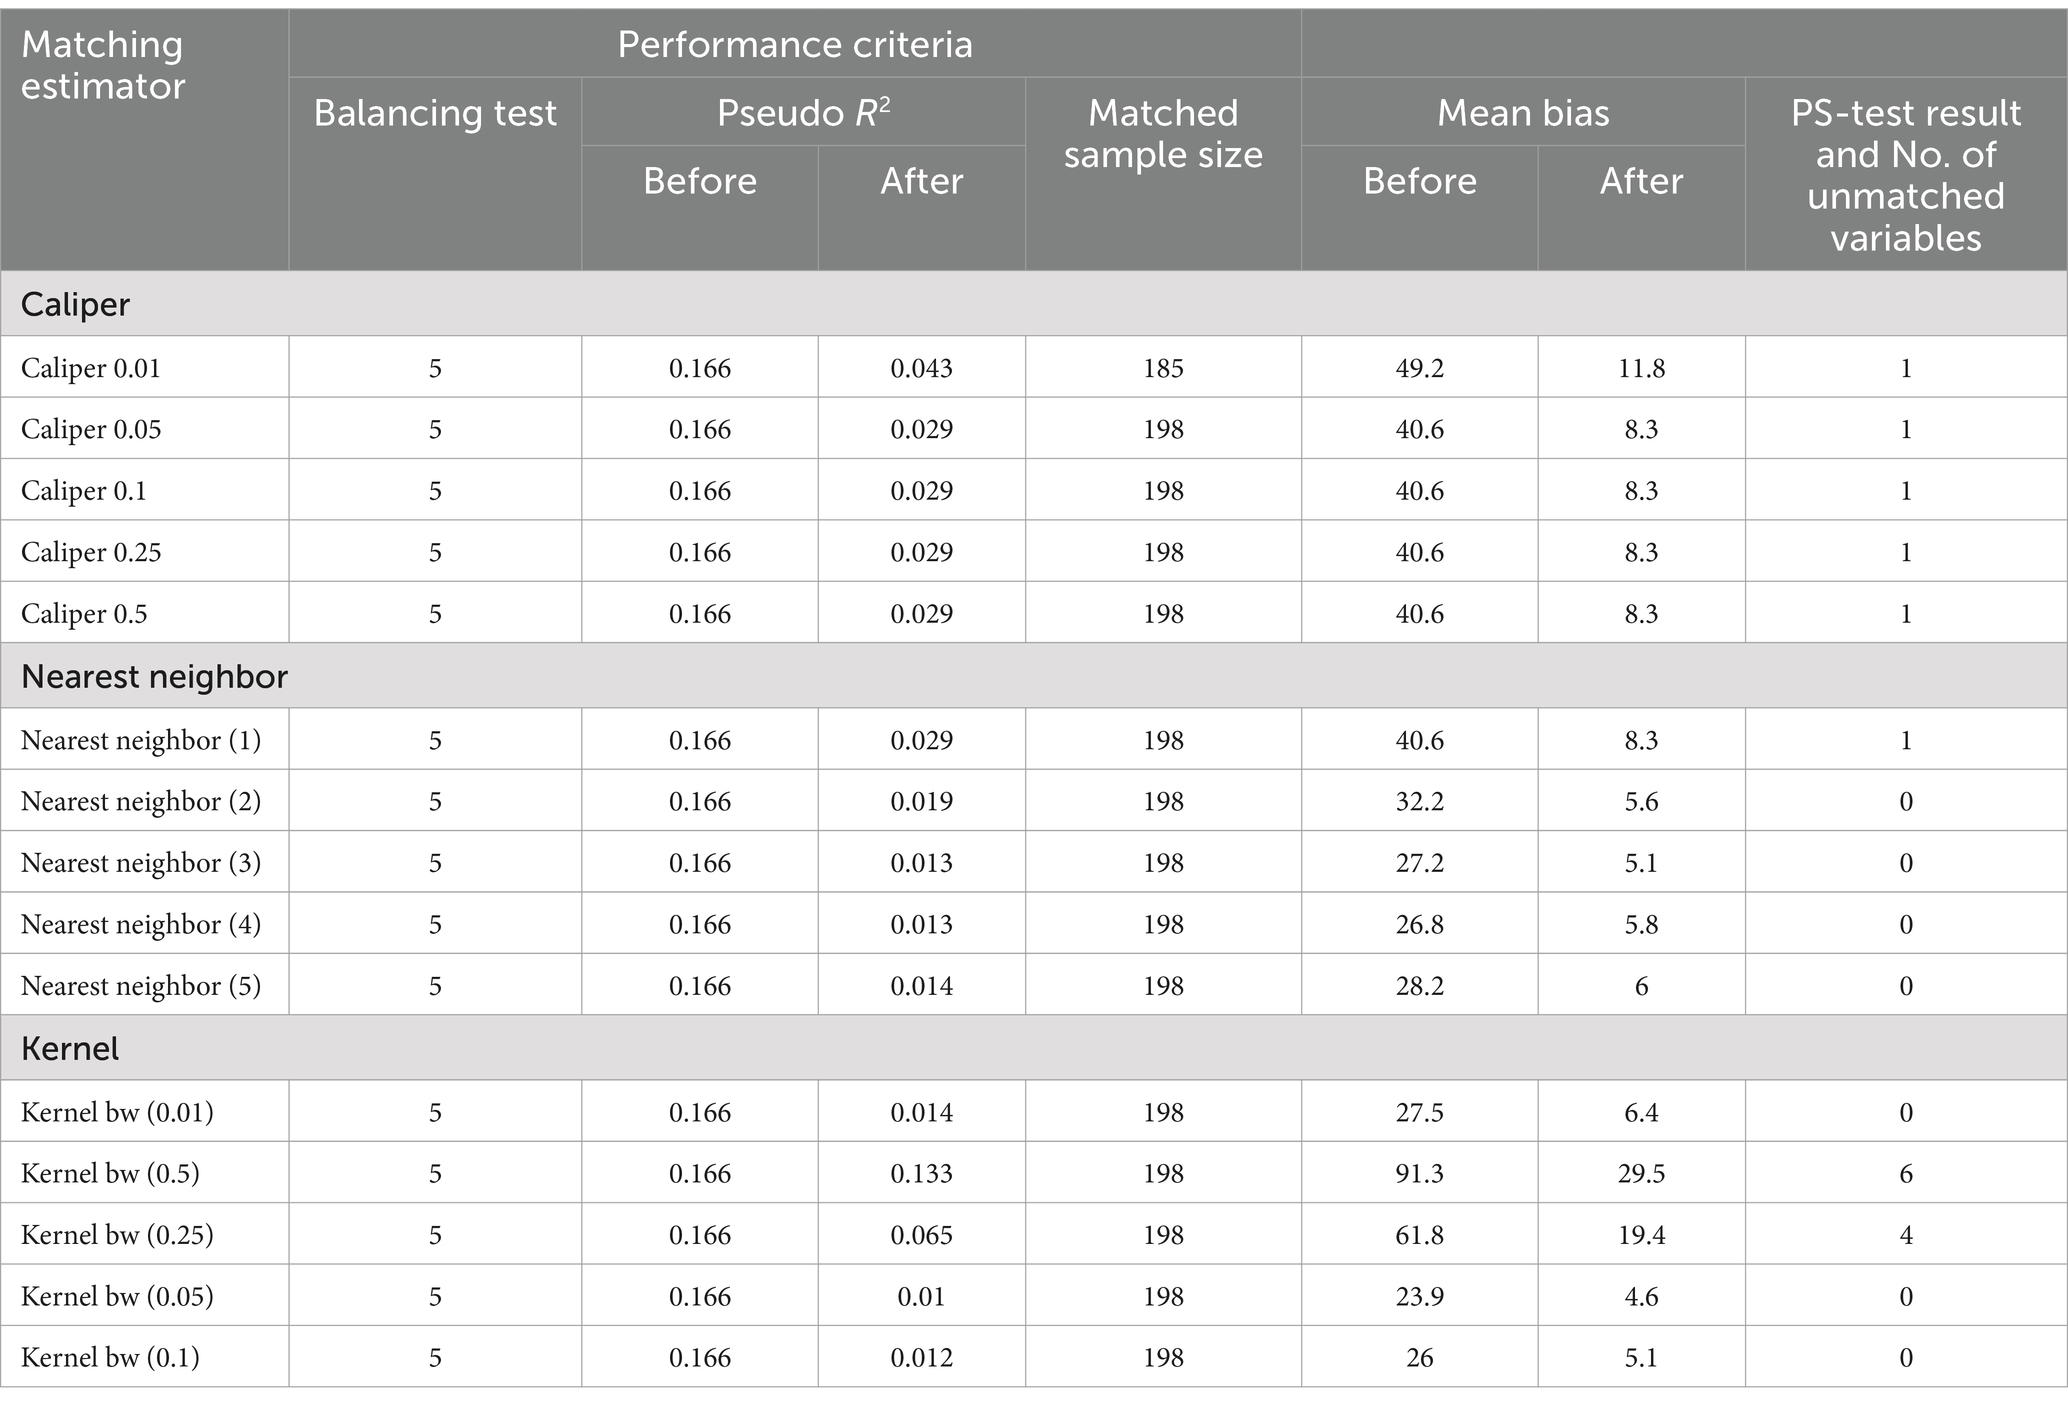
Table 9 demonstrates that the value of the balancing test is 5, and pseudo-R2 before matching which is 0.166 is identical for all matching estimators. The matched sample size is 198, which is also the same across all matching estimators except in caliper 0.01 which is 185.
To know whether all explanatory variables were adequately balanced and to identify the best matching estimator, the propensity score test (PS test) was applied for each matching estimator. From the test result, as indicated in Table 10, the nearest neighbor (NN2, NN3, NN4, and NN5) and kernel matching (bw 0.01, bw 0.05, and bw 0.1) matching techniques sufficiently balance all independent variables. However, as a rule, the absolute mean bias after matching should be less than 5%. Therefore, from the joint significance test result, the best matching method was found to be a kernel (bw 0.05), which has an absolute average bias of 4.6% after matching and with a small pseudo-R2 value of 0.01.
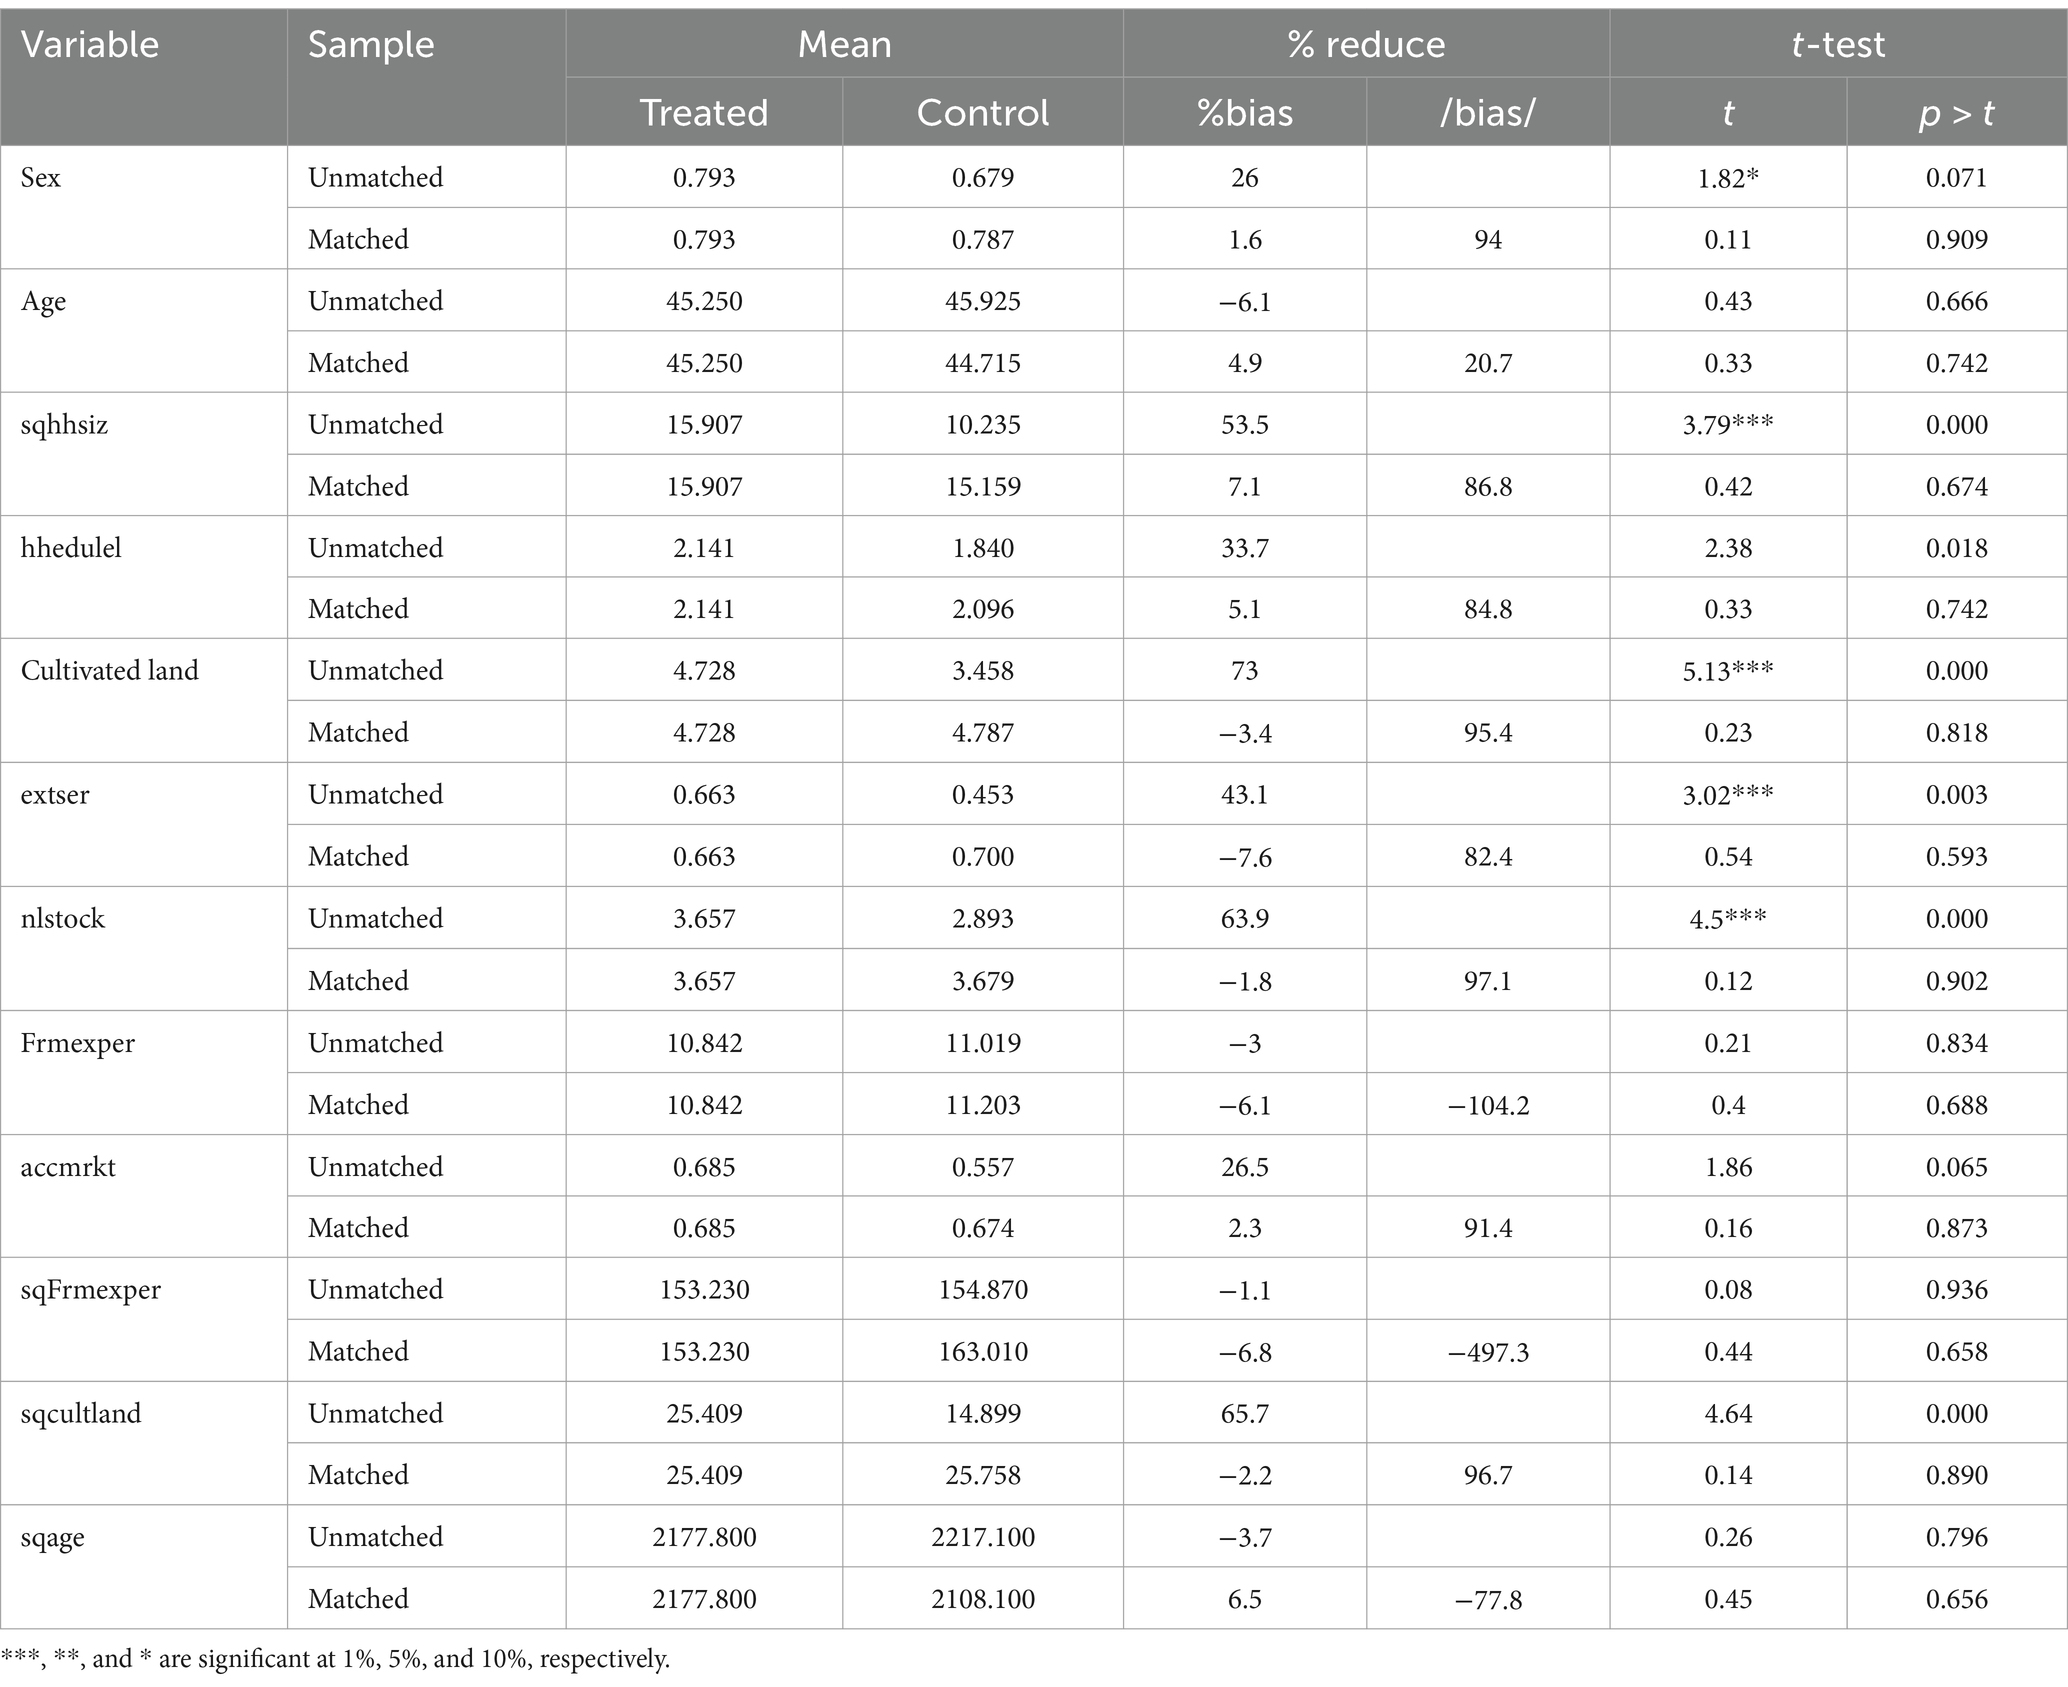
The propensity score and explanatory variable balance test using the kernel (bw 0.05) matching estimator in Table 10 showed that, before matching the mean of sex of household, household size in adult equivalent, cultivable land, extension services, and number of livestock (TLU) are significantly different. Nevertheless, following matching, the mean difference between the variables of the treatment and control groups is not statistically significant.
From the matching estimators which balanced all covariant, kernel (bw 0.05) in the chi-square test results in Table 11 showed the lowest pseudo-R2 and LR and the highest chi-square value. As Caliendo and Kopeinig (2008) stated low pseudo-R2 shows the absence of a significant difference in the distribution of covariates between small-scale irrigation participants and non-participants. Therefore, all the above test evidence confirmed that the kernel (bw 0.05) matching method is relatively the best estimator from others and could be used to determine how small-scale irrigation treatments, on average, affect families’ food security status (Kapari et al., 2023) using outcome variables (household annual income and their annual food expenditure).
3.3.8 The ATE on the treated groups
This part presents the impacts of small-scale irrigation participation on a household’s food security level using annual income and annual food expenditure as outcome variables. Then, using PSM with the kernel (bw 0.05) matching method, the ATT was calculated in Table 12. As the model result indicates the effects of farmers’ small-scale irrigation participation on average annual income of households was found to be 60273.27 birr, which is higher than 10728.21 birr on average than non-participants. The annual income difference between the two groups is significant with a 1% significance level.
On the other hand, the ATT model result of the annual food expenditure of household indicates that the effect of participating in small-scale irrigation on the farmer’s annual food expenditure per adult equivalent was 5,589.12 birr on average. The annual food expenditure per adult equivalent between the two groups is also significant with a 1% significance level. These two outcome variables confirmed that the average annual income and annual food expenditure of small-scale irrigation users are different and higher than those of non-user households.
3.4 Sensitivity analysis
To determine whether the treatment effects are influenced by variables that are not visible, estimation has been carried out. Therefore, to respond to this query, sensitivity analyses were carried out for both yearly income and annual food consumption per adult equivalent. Table 13 below presents the critical level of in the first row from 1 up to 2. The upper bound’s p-critical values are represented by the values in each row that correspond to particular gamma values. The findings of the sensitivity analysis showed that, even when the treated and control households were given different odds of receiving treatment up to , the estimation of the impacts of small-scale irrigation participation remains unchanged. However, beyond that point, the estimation of ATT is impacted by unobserved covariance. This we can conclude that beyond the specified covariant there exist other variables which affect the estimated ATT for the outcome variables.

Table 13. Sensitivity analysis of Mantel and Haenszel (1959) bounds.
4 Discussion
This study aims to analyze the determinant of participation of rural household in irrigation and the impact of irrigation on rural household food security. The descriptive results show that 92 of the 198 households in the study area—or 46.5% of the total—adopted small-scale irrigation, and the other 106 (53.5%) were non-irrigation. The propensity scores avoided bias that was generated by the matching method to find controlled units that were similar to treated units allowing the estimation of program intervention impact (Guo et al., 2020).
The PSM model result indicates the effects of farmers’ small-scale irrigation participation on households’ average annual income and expenditure as measures of food security. The results demonstrated that irrigation interventions improved food security (Domenech, 2015). Households having relatively higher annual income and food expenditure are relatively food-secured. In addition, the outcome variables, annual income, and annual food expenditure showed that the average annual income and annual food expenditure of small-scale irrigation users are different and higher than those of non-user households. Therefore, this implies, that relatively higher annual income and food expenditure are one measure of a farmer’s food security level. These findings are consistent with the findings of Awol and Arebu (2024) and Manjur et al. (2023).
Among the hypothesized factors influencing farmers’ participation in small-small irrigation, this study revealed that household family size in adult equivalent, number of livestock in TLU, cultivable land, sex of the household head, and access to credit were highly significant and positively related to farmers’ participation or uses of small-scale irrigation. This result is consistent with the findings of Petros and Yishak (2017), Tesfaye et al. (2006) and Tafesse (2007).
To assess the consistency of the outcome and correct selection bias, several assumption propensity score models were employed to calculate the effects of small-scale irrigation. Participation of farmers in small-scale irrigation raised household food security levels, according to the propensity model outcome. Small-scale irrigation can increase land productivity, farmers can produce on small plots of land multiple times a year, and the money earned from selling this product can be utilized to buy different foods, according to the focus group study. In addition, small-scale irrigation users were more likely than non-producers to plant and eat a variety of vegetables. In general, this finding revealed that households’ participation in small-scale irrigation improves the annual income and annual food expenditure/per adult equivalent/ (Manjur et al., 2023).
The PSM model results were compared based on performance tests before and after matching, and the test results evidence confirmed that the kernel (bw 0.05) matching method is relatively the best estimator from others, and could be used to determine how small-scale irrigation treatments, on average, affect families’ food security status (using outcome variables household annual income and their annual food expenditure). This is supported by Kapari et al. (2023) and Caliendo and Kopeinig (2008).
5 Conclusion and recommendation
This study aims to evaluate the impacts of small-scale irrigation on household food security based on primary and secondary data that were collected from households in the Dessie Zuria district. The demographic data of household heads were gathered using a structured questionnaire consisting of both closed-ended and open-ended questions from the sample respondents. Data were entered into SPSS 25 for data cleaning, processing, and descriptive analyses. Econometric analysis was conducted using STATA 14 software packages.
From the descriptive data analysis, in this study, out of the 198 total households, 92 adopted small-scale irrigation and the others were non-users of irrigation. Out of the sample respondents, 20 were female-headed households. However, the degree of small-scale irrigation participation differs widely between households. Ethiopian development plans, which are well aligned with the Millennium Development goal set an equal value of 225 kg/adult/year to 2,200 kcal/adult/year and this is equivalent to 3,781 birr/adult/year. Based on this evidence, approximately 77.2% of small-scale irrigation users are food-secured households and 61.3% of non-small-scale irrigation users were food-secured while the other 38.8 and 22.8% are food insecure non-users and user households, respectively.
The logit model was used to determine the features affecting food security in participation in small-scale irrigation. For this purpose, a total of 12 explanatory variables were used and a logit analysis result showed that a total of five variables were significant and the other seven were not significant. Household family size in adult equivalent, number of livestock in TLU, cultivable land, and access to credit were highly significant at a 5% significance level and positive relationship with uses of small-scale irrigation. The sex of households was also found significant at a 10% significance level with a positive relation.
This study also revealed that participation of households in small-scale irrigation has statistically significant and positive impacts on their food security level. Therefore, it is suggested that households need for improving their annual income and annual food expenditure by participating on small-scale irrigation activities, which will improve their food security status: household family size in adult equivalent affects farmers’ involvement in irrigation; this is due to the labor-intensive behavior of the activities. In most cases, rural farmers used family labor. Therefore, by hiring more labor and adopting labor-substituting technologies with the support of the government, it is possible to increase farmers’ involvement in small-scale irrigation activities.
The number of livestock in TLU also significantly and positively affects farmers’ participation in small-scale irrigation. It is obvious that most rural farmers’ life relies on livestock, which is a source of their income, food, and drought animals, and most farmers use animals to perform their farming activities as energy sources. Therefore, it is recommended that increasing livestock holding of rural farmers and keeping the health of animals will induce farmers to participate in small-scale irrigation activities. Finally, the shortage of cultivable land is another constraint that hinders farmer’s small-scale irrigation participation. Even though it is impossible to expand further cultivable land in the study area, it is possible to increase the productivity of the land by practicing yield-increasing activities like using small-scale irrigation.
The impact of irrigation water utilization on household food security means that improving the efficiency of the current small-scale irrigation schemes and designing and implementing new ones leads to sustainable production that could transform the lives of the rural poor. However, simply having access to irrigation will not bring about the expected change in people’s lives unless adequate equipment and materials, improved input technologies, and most importantly, skills for proper handling and management of small-scale irrigation schemes are well addressed. Therefore, to reduce poverty and increase food security, governmental and non-governmental organizations should increase the number of households with access to small-scale irrigation and support by providing resources.
6 Limitations and future implications
The scope of this study included three Kebeles, one administration Woreda, and a random sampling of respondents. The ‘data of study came from a cross-sectional survey. The precise numbers of the impacts of small-scale irrigation involvement on food security and the related determinants might be demonstrated by a potential longitudinal study. Taking part in irrigation allows people to diversify their food intake and provide additional revenue. As a result, irrigation should be taken into consideration in development policies and initiatives that support food security through agricultural productivity.
Data availability statement
The raw data supporting the conclusions of this article will be made available by the authors, without undue reservation.
Author contributions
EE: Conceptualization, Data curation, Formal analysis, Methodology, Software, Validation, Writing – original draft, Writing – review & editing. AT: Investigation, Resources, Software, Validation, Visualization, Writing – review & editing.
Funding
The author(s) declare that no financial support was received for the research, authorship, and/or publication of this article.
Conflict of interest
The authors declare that the research was conducted in the absence of any commercial or financial relationships that could be construed as a potential conflict of interest.
Publisher’s note
All claims expressed in this article are solely those of the authors and do not necessarily represent those of their affiliated organizations, or those of the publisher, the editors and the reviewers. Any product that may be evaluated in this article, or claim that may be made by its manufacturer, is not guaranteed or endorsed by the publisher.
Abbreviations
ATT, Average total treatment effect; CSA, Central Statistical Agency; FAO, Food and Agriculture Organization; MoFED, Ministry of Finance and Economic Development; MoWE, Ministry of Water and Energy; PSM, Propensity Score Matching; TLU, Total livestock unit; ATE, Average treatment effect.
References
Abraham, G. Y., Addis, A. G., and Mesfin, T. G. (2015). The impact of small-scale irrigation on income of rural farm households: evidence from Ahferom Woreda in Tigray, Ethiopia. Int. J. Bus. Econ. Res. 4, 217–228. doi: 10.11648/j.ijber.20150404.14
Al-Essa, L. A., Ebrahim, E. A., and Mergiaw, Y. A. (2024). Bayesian regression modeling and inference of energy efficiency data: the effect of collinearity and sensitivity analysis. Front. Energy Res. 12:1416126. doi: 10.3389/fenrg.2024.1416126
Aseyehegu, K., Yirga, C., and Rajan, S. (2012). Effect of small-scale irrigation on the income of rural farm households: the case of Laelay Maichew district, Central Tigray, Ethiopia. J. Agric. Sci. 7, 43–57. doi: 10.4038/jas.v7i1.4066
Austin, P. C. (2011). An introduction to propensity score methods for reducing the effects of confounding in observational studies. Multivar. Behav. Res. 46, 399–424. doi: 10.1080/00273171.2011.568786
Awol, H., and Arebu, H. (2024). Influence of small-scale irrigation on livelihoods of rural farm households in the case of Legehida district, Ethiopia. Sci. World J. 2024:9982796. doi: 10.1155/2024/9982796
Bacha, D., Namara, R., Bogale, A., and Tesfaye, A. (2011). Impact of small-scale irrigation on household poverty: empirical evidence from the Ambo district in Ethiopia. J. Irrig. Drain. 60, 1–10. doi: 10.1002/ird.550
Caliendo, M., and Kopeinig, S. (2005). Some practical guidance for the implementation of propensity score matching. Soc. Sci. Res. Netw. 1588:721907. doi: 10.2139/ssrn.721907
Caliendo, M., and Kopeinig, S. (2008). Some practical guidance for the implementation of propensity score matching. J. Econ. Surv. 22, 31–72. doi: 10.1111/j.1467-6419.2007.00527.x
Central Statistical Authority (2012). Agricultural sample survey for strategic planning: annual report of the Federal Democratic Republic of Ethiopia. Central Statistical Authority of Ethiopia: Scientific Research.
Central Statistical Authority and World Food Program. (2014). Comprehensive food security and vulnerability analysis (CFSVA), Ethiopia
Domenech, L. (2015). Improving irrigation access to combat food insecurity and undernutrition: a review. Glob. Food Secur. 6, 24–33. doi: 10.1016/j.gfs.2015.09.001
Ebrahim, E. A., Toy, A., and Kassim, Y. H. (2023). The factors that influence the growth and performance of Micro and small-scale Enterprises in Dessie Town Administration. Front. Sustain. Cities 5:1296605. doi: 10.3389/frsc.2023.1296605
Eshetu, S., Belayneh, B., Degeye, G., Belay, K., Demeksa, T., Estifanos, W., et al. (2010). Income diversification through improved irrigation in Ethiopia: impacts, constraints and prospects for poverty reduction Evidence from East Harerghe Zone, Oromia Region, Ethiopia. Addis Ababa, Ethiopia: RIPPLE.
Food and Agriculture Organization of the United Nations (2011). The state of food insecurity in the world: How does international Price volatility affect domestic economies of food security? Rome: FAO.
Guo, S., Fraser, M., and Chen, Q. (2020). Propensity score analysis: recent debate and discussion. J. Soc. Soc. Work Res. 11, 463–482. doi: 10.1086/711393
Hamda, T. (2014). “The effects of small-scale irrigation on rural households’ income: the case of Adami Tulu Jido Kombolcha district, Oromia National Regional State, Ethiopia” in Master thesis (Dire Dawa: Faculty of Agriculture, Department of Rural Development and Agricultural Extension, Haramaya University).
Harris, H., and Horst, S. J. (2016). A brief guide to decisions at each step of the propensity score matching process. Pract. Assess. Res. Eval. 21:4. doi: 10.7275/yq7r-4820
Hintsa, L., Kidane, W., and Kiflom, D. (2015). Assessment of Constraints and Opportunities of Small-Scale Irrigation Practices in South Tigray, Ethiopia. J. earth environ. sci. 5. [Epub ahead of print].
Jambo, Y., Alemu, A., and Tasew, W. (2021). Impact of small-scale irrigation on household food security: evidence from Ethiopia. Agric. Food Secur. 10. doi: 10.1186/s40066-021-00294-w
Kapari, M., Hlophe-Ginindza, S., Nhamo, L., and Mpandeli, S. (2023). Contribution of smallholder farmers to food security and opportunities for resilient farming systems. Front. Sustain. Food Syst. 7:1149854. doi: 10.3389/fsufs.2023.1149854
Kassie, A. (2020). Challenges and opportunities of irrigation practices in Ethiopia: a review. J. Eng. Res. Rep. 9, 1–12. doi: 10.9734/jerr/2019/v9i317016
Libseka, H., Welde, K., and Degef, K. (2015). Assessment of Constraints and Opportunities of Small-Scale Irrigation Practices in South Tigray, Ethiopia. Environ. Earth Sci. 5:8.
Manjur, K., Woldegebrial, G., Girmay, M., and Sahlu, W. (2023). Does small-scale irrigation have an impact on food security outcomes? Evidence from southern Tigray Ethiopia. J. Geogr. Nat. Disasters 13:266.
Mhembwe, S., Chiunya, N., and Dube, E. (2019). The contribution of small-scale rural irrigation schemes towards food security of smallholder farmers in Zimbabwe. Jamba 11:674. doi: 10.4102/jamba.v11i1.674
Mantel, N., and Haenszel, W. (1959). Statistical aspects of the analysis of data from retrospective studies of disease. JNCI 22:719–748.
Ministry of Finance and Economic Development. (2012). Performance and challenges on the five-year strategic plan of growth and transformation. Kampala: Ministry of Finance, Planning and Economic Development.
Ministry of Water and Energy (2013). Water resources management and irrigation policy: annual report of MOWE. Addis Ababa, Ethiopia: MOWE.
Petros, W., and Yishak, G. (2017). Determinants of small-scale irrigation use: the case of Boloso Sore District, Wolaita zone, and southern Ethiopia. Am. J. Agric. For. 5, 49–59. doi: 10.11648/j.ajaf.20170503.13
Seleshi, B. A. (2010). Irrigation potential in Ethiopia: constraints and opportunities for enhancing the system. Addis Ababa: IWMI (International Water Management Institute).
Shikur, Z. H. (2020). Agricultural policies, agricultural production and rural households’ welfare in Ethiopia. Econ. Struct. 9:50. doi: 10.1186/s40008-020-00228-y
Sisay, K. (2023). Impact of irrigated agriculture on households’ income and food security from the southwest region of Ethiopia. Irrig. Drain. 73, 676–693. doi: 10.1002/ird.2898
Smith, L. C., and Ali, S. (2007). Measuring food security using household expenditure surveys. Food security in practice technical guide series. Washington, DC: International Food Policy Research Institute.
Tafesse, H. (2007). “Socio-economic and institutional determinants of small-scale irrigation schemes utilization in Bale Zone, Oromiya National Regional State” in Master thesis (Dire Dawa: Alemaya University).
Tesfaye, A., Ayalneh, B., and Regassa, E. (2006). The impact of small-scale irrigation on household food security: the case of Filtino and Godino irrigation schemes in Ada Liben district, East Shoa, Ethiopia. London: Springer Nature.
Wubetie, H. T., Zewotir, T., Mitku, A. A., and Dessie, Z. G. (2023). Household food insecurity levels in Ethiopia: quantile regression approach. Front. Public Health 11:1173360. doi: 10.3389/fpubh.2023.1173360
Zhou, S. D., Herzfeld, T., Glauben, T., Zhang, Y., and Hu, B. (2008). Factors affecting Chinese farmers’ decisions to adopt a water-saving technology. Can. J. Agric. Econ. 56, 51–61. doi: 10.1111/j.1744-7976.2007.00116.x
Appendix
Keywords: small-scale irrigation, logistic regression, propensity score matching, food security, households
Citation: Ebrahim EA and Toy A (2024) Impact of irrigation participation on households food security in a rural area of Ethiopia: application of propensity score matching (PSM) method for causal inference. Front. Sustain. Food Syst. 8:1403317. doi: 10.3389/fsufs.2024.1403317
Edited by:
Ole Mertz, University of Copenhagen, DenmarkReviewed by:
Faruque As Sunny, Zhejiang University, ChinaLutengano Mwinuka, University of Dodoma, Tanzania
Copyright © 2024 Ebrahim and Toy. This is an open-access article distributed under the terms of the Creative Commons Attribution License (CC BY). The use, distribution or reproduction in other forums is permitted, provided the original author(s) and the copyright owner(s) are credited and that the original publication in this journal is cited, in accordance with accepted academic practice. No use, distribution or reproduction is permitted which does not comply with these terms.
*Correspondence: Endris Assen Ebrahim, ZW5kMzg0QGdtYWlsLmNvbQ==
†ORCID: Endris Assen Ebrahim, https://orcid.org/0000-0002-8959-6052
 Endris Assen Ebrahim
 Ahmet Toy