 Chen Yusheng
 Ma Ye1
 Yang Weili
- 1School of Management, Ocean University of China, Qingdao, Shandong, China
- 2Department of Rural Economic Research, Development Research Center of the State Council, Beijing, China
Based on the panel data of the province and municipality in 2010–2021, this paper measures the fishery eco-efficiency by using the SBM-DEA model and empirically analyses how China’s marine ranch construction improves the fishery eco-efficiency by using the double-difference fixed-effect model. The results show that, firstly, China’s marine ranch construction can improve the fishery eco-efficiency. Secondly, China’s marine ranch construction promotes fisheries eco-efficiency by improving the input efficiency of labor, fish species, fishing vessel, fishery technology extension, aquaculture area and by reducing pollutant outputs. Thirdly, the fishery eco-efficiency of the marine ranch construction region has increased annually since 2015, and technological changes, scale efficiency changes and technical efficiency changes can all contribute to the fishery eco-efficiency improvement, and increase in order. Based on the results of the empirical analyses, this paper proposes policy recommendations to improve the fishery eco-efficiency in the conjunction with the construction of marine ranch in China.
1 Introduction
In the 21st century, fishery resources play a vital role in economic development and daily life of human beings, not only as an important source of economic growth, but also as an important source of daily protein needs of human beings. The traditional mode of utilization of marine fishery resources focuses too much on the efficiency of fishery production, leading to the continuous deterioration of the marine ecological environment, the continuous decay of marine fishery resources and the continuous reduction of fishery eco-efficiency. In order to make more rational and full use of marine resources, the report of the 20th National Congress of the Communist Party of China pointed out the importance of further developing the marine economy and protecting the marine ecological environment. Improving the marine ecological environment and promoting the fishery eco-efficiency is also an important initiative for China to participate in the governance of the world marine ecological environment and protect the world marine ecological environment. The construction of marine ranch can provide stable, abundant and safe fishery products, while promoting the conservation of marine biological resources and improving the marine ecological environment, which is an effective model for improving the fishery eco-efficiency. Since 2017, the “Central First Document” has emphasized the promotion of the construction of marine ranch for three consecutive years, and the “Central First Document 2023” continues to point out the importance of constructing modern marine ranch and building a diversified food supply system (Central People's Government of the People's Republic of China, 2023). The new-era marine ranch established on the basis of high level, high starting point and high standard will be able to generate greater economies of scale in the supply of fishery resources and play a more important role in the conservation and sustainable use of fishery resources.
Eco-efficiency was originally proposed by the World Business Council for Sustainable Development (WBCSD) in 1992 (Nakahara, 1992). It means “the provision of competitively priced goods or services that satisfy human needs and improve the quality of human life, while conforming to the Earth’s carrying capacity and reducing ecological impacts.” It has also been defined by scholars as being linked to sustainable development and being able to satisfy human social needs with the least amount of resource and ecological pollution (Schaltegger and Sturm, 1996). In comparison with traditional efficiency of production, eco-efficiency can express the separation between economic growth and environmental pressure and can reflect the green competitive strength of a country (Zhu and Zhu, 2005). Existing studies on fishery ecological efficiency have focused on measurement, problems, and studies of influencing factors. As an important part of China’s economic development, the fishery industry has been developing rapidly in recent years, but the conflict between the crude mode of economic development and the concept of sustainable development has led to the depletion of fishery resource and the aggravation of the marine pollution problem (Liu et al., 2023). Currently, some scholars have used different methods to measure eco-efficiency, such as Stochastic Frontier Gravitational Analysis (SFA), Data Envelopment Analysis (DEA), et al. By analyzing the eco-efficiency of China’s fishery industry, it has been found that the eco-efficiency of China’s fishery industry is significantly lower than the industry’s economic efficiency and the development of the fishery industry is not in coordination with the protection of the environment (Yan and Zhong, 2022). The loss of fishery eco-efficiency is mainly due to over-consumption of resources and unrestricted output of pollution (Qin et al., 2018). Although China’s coastal provinces have inherent advantages in fishery development due to their geographical location, analyses of the spatial and temporal evolution of fishery eco-efficiency in China’s coastal provinces have also found that the fishery eco-efficiency of the coastal provinces is mainly of the medium-low efficiency type and the slow growth of the fishery eco-efficiency has been caused mainly by environmental pollution (Han et al., 2019).
Marine ranch refers to the implementation of artificial management in a certain sea area to provide a good living environment for marine aquatic organisms, combining aquatic organisms breeding and proliferation and making full use of the existing marine space within a reasonable range, so as to maximize the productivity of the fishery industry and ensure the sustainable use of marine resources, Marine ranch is a fishery production method that combines economic development and environmental protection (Tan and Lou, 2021). There have been studies focusing on analyzing the historical evolution of marine ranchlands and the significance of marine ranch in improving the eco-efficiency of fisheries. The history of marine ranch can be traced back to 1860, when in order to restore salmon stocks that had been reduced by environmental pollution, salmon species enhancement program were carried out in United States, Canada, and other regions, and thus marine ranch can also be called “stock enhancement” (Salvanes, 2001). The idea of marine ranch was proposed by United States in 1968 and put into action in 1972 (Yang, 2016). In the 21st century, America has deployed functional reefs in 2,400 areas, increasing biological resources nearly 43-fold and increasing fisheries production by 5 million tons (Hu et al., 2019). As a government-driven project, marine ranch can generate economical, social and ecological benefits, while maintaining ecological safety is the basis for it to provide other functions (Du and Li, 2022). Its unique ecological function makes it superior to traditional fishery model, which not only provides abundant fishery product but also provides ecosystem services to human beings (Zhou et al., 2019). Marine ranch can improve fishery eco-efficiency through biological growth environment improvement technology, biological behavior control technology, biological growth environment detection technology, biological resources assessment technology and equipping with professional human management and perfect infrastructure. Biological growth environment improvement technology mainly through providing a good feeding and breeding environment for fish by putting in artificial reefs and mudflat modification (Liu et al., 2022). Biological behavioral control technology is mainly through the sound, light and electricity to achieve the domestication of fish behavior, this way achieved the combination of physical and biological methods, thus achieving the productivity improvement (Yang et al., 2004). Biological growth environment detection technology mainly through the establishment of sensors, monitoring nodes to achieve the growth environment, seawater temperature automatic monitoring and early warning to ensure the stability of the marine ecological environment (Jia et al., 2022). Biological resources assessment technology is to use electronic and acoustic principles, such as the use of fish detectors, timely understanding the growth status of various fish species, adjust the proportion of various fish species, and maximize the benefits of marine ranch (Wang et al., 2020). In conclusion, marine ranch has economical and ecological benefits to a certain extent, it can make full use of a series of technical methods to protect the marine environment to achieve the increase of fishery resources and fishery eco-efficiency improvement.
In conclusion, as a modernized production model equipped with advanced production technology and equipment and also effective in reducing pollutant output and closely linked to secondary and tertiary industries which consume less resources and have high technological content, the marine ranch has great research value in exploring the process of improving fishery eco-efficiency. However, the existing literature on marine ranch focuses on theoretical analyses, and there is a lack of empirical evidence on whether and how marine ranch can improve fishery eco-efficiency. Therefore, this paper firstly applies a Differences in Differences model and uses empirical analyses to link marine ranch and fishery eco-efficiency to provide empirical research evidence of causal identification of how marine ranch can improve fishery eco-efficiency. Secondly, using regulatory effect analysis to identify the detailed pathway of action of marine ranch in improving fishery eco-efficiency. Then, through productivity index analysis to find out the problems of marine ranch in the process of improving fishery eco-efficiency from the level of technology and efficiency. Finally, combined with the construction of marine ranch, put forward policy recommendations to improve fishery eco-efficiency.
2 Policy evolution and research design
2.1 Policy evolution
The marine ranch concept appeared in China in 1991 when Liaoning Province issued the policy document “Changhai County Marine Ranch 1,646 Project” (Liaoning Bureau of Oceanography, 1991), and since then marine ranch has continued developing in China. China’s marine ranch construction can be divided into three stages: initial formation period (1991–2005), construction promotion period (2005–2015) and construction acceleration period (2015). In the first stage, the construction of marine ranch is mainly led by local governments and pilot exploration has only started in certain coastal provinces, the construction is still in infancy. In the second stage, the construction of marine ranch has been highly valued by the central government and has changed from being led by the local government to being led by the central government. In the third stage, more attention is paid to the construction of modernized marine ranch (national marine ranch demonstration zone), with emphasis on ecological sustainability and this stage is also a new period of marine ranch construction (Yang et al., 2019; Yu and Zhang, 2020). The construction of marine ranch in new period was officially launched in 2015, in 2017, the “National-level Marine Ranch Demonstration Area Construction Plan” was officially published (Ministry of Agriculture, 2017), which promotes new breakthrough in marine ranch. Until 2022, China has built 169 national level marine pasture demonstration zones, covering the Bohai Sea, Yellow Sea, East China Sea and South China Sea. The construction of marine ranch in new period has changed the development goal from the improvement of fishery production efficiency to the track of ecological efficiency improvement, which is really consistent with the original intention of the construction of marine ranch and it is a brand-new stage of the development of marine ranch in China.
2.2 Model construction
Data Envelopment Analysis (DEA) was created by Charnes and Cooper, which uses a linear programming approach to analyze multiple input and multiple output indicators to calculate relative efficiency (Charnes et al., 1978). This method avoids the subjective influence of manually determined weights on the measurement results and has been widely used in eco-efficiency research (Pan and Ying, 2013). However, traditional DEA models require inputs to change in equal proportion with outputs when evaluating efficiency, which ultimately results in biased efficiency measurements. Therefore, Tone constructed the SBM model based on the traditional DEA model, which is an efficiency measure based on slack variables (Tone, 2001). However, the SBM model still has some shortcomings, as its measurement of efficiency values still only remains between [0, 1], resulting in the inability to compare effective decision-making units. Therefore Tone built the Super-SBM model based on SBM model, which solved the problem of the limitation of the value of the efficiency value (Tone, 2002). But the calculation of fishery eco-efficiency needs to consider not only desired outputs but also non-desired outputs. Therefore, this paper refers to the Super-SBM model, while considering the undesired outputs, and finally the fishery eco-efficiency is calculated by using the undesired output Super-SBM model.
2.2.1 Undesired output Super-SBM model
Assume that there are n decision-making units (DMUs), each of which contains three elements: inputs, desired outputs and undesired outputs (X, Y, B), X = (xij)∈R m × n, Y = (ykj)∈s1 × n, Z = (zlj)∈s2 × n. Let X>0, Y>0 Z>0 then the set of production possibilities: P = {(x,y)|x ≥ XΛ, y ≤ YΛ, z ≥ ZΛ, Λ ≥ 0} in which Λ = [λ1, λ2, …,]∈ Rn represents the vector of weights coefficients, P represents the efficiency value of the decision-making unit, and the three inequalities in the P function represent that the actual input level is larger than the frontier level, the actual output is smaller than the frontier output level, and the actual undesired output is larger than the frontier level. The specific model is shown in Equation (1):
2.2.2 Differences in differences fixed effect model
The Differences in Differences method, as a quasi-natural experiment, is able to analyze the role of something by comparing an experimental group with a control group. In order to explore the impact of marine ranch construction on fishery eco-efficiency, this paper constructs the following Differences in Differences model. The specific model is shown in Equation (2):
EEFit is the Explained variable, which refers to the fishery eco-efficiency. didit is the region dummy variable, and timeit is the time dummy variable, which are multiplied together to produce didit × timeit, which is the policy dummy variable in this paper. Xit is the control variable, vi is the region fixed effect, ut is the time fixed effect, and ɛit is the small disturbance term. β 1 is to indicate the relationship between the construction of marine ranch and fishery eco-efficiency, which is positively related if positive and negatively related if negative.
2.2.3 Balanced trend test
The basis of the differences in differences realization is through the balanced trend test, which means that there is no significant difference between the experimental group and the control group before the implementation of the policy, so this paper constructs the following balanced trend test model. The specific model is shown in Equation (3):
The policy dummy variable didit × timeit is replaced by D in the equation, with the superscript indicating the policy’s lead or lag term, and 2014 is excluded in order to prevent multicollinearity due to dummy variable traps. If the regression result of the policy dummy variable before policy implementation is not significant, it means that there is no significant difference between the experimental group and the control group before policy implementation.
2.3 Variable selection and data source
2.3.1 Variable selection
Explained variable: the explained variable selected in this paper is fishery eco-efficiency (EEF), which is calculated by using the non-expected output Super-SBM model, by referring to previous practices (Arita and Leung, 2014; Iliyasu et al., 2016; Rahman et al., 2019; Yan and Zhong, 2022) and combining with own reflections. The input variables are: fishery labor, fishery species, fishery vessel, fishery technology extension fund, fishery culture area and fishery intermediate consumption; The desired output variables are: total fishery GDP and total fishery production; The undesired output variables are: fishery pollutant emission, the total pollutant emission is calculated in this paper with reference to Zhong et al. (2023). The input–output indicators are shown in Table 1:
Core Explanatory Variable: the core explanatory variable in this paper is didit × timeit which is whether or not the region is a policy implementation region in 2015.In this paper, the region which belongs to the experimental group is set to 1 and the region which belongs to the control group is set to 0, thus generating the region dummy variable for this paper. The time dummy variable for this paper is generated by setting the time before 2015 to 0 and the time after 2015 (including 2015) to 1. Multiplying the region dummy variable with the time dummy variable generates the core explanatory variables of the paper.
Control variable: The specific control variables in this paper include: the number of industrial enterprises, which refers to industrial legal units with annual main business income of 20 million yuan and above; the level of transport, which is measured by using waterborne freight turnover; the level of external trade, which is measured by using total exports and imports; the level of electricity consumption, which is measured by using total electricity consumption; the level of revenue, which is measured by using government general budget revenues; size of population, which is measured by using total population; the level of consumption, which is measured by using the total retail sale of consumer goods; the level of financial development, which is measured by using the balance of deposits in financial institutions at the end of the year. The control variables are standardized in this paper.
Moderating variable, which are introduced in this paper with the aim of exploring the detailed pathways of marine ranch’s role in improving fishery eco-efficiency. Because the redundancy of each variable is calculated correspondingly during the calculation of the SBM model, which provides insights for the selection of moderating variables in this paper, the redundancy of the input variables, and undesired output variables are selected as the moderating variables in this paper.
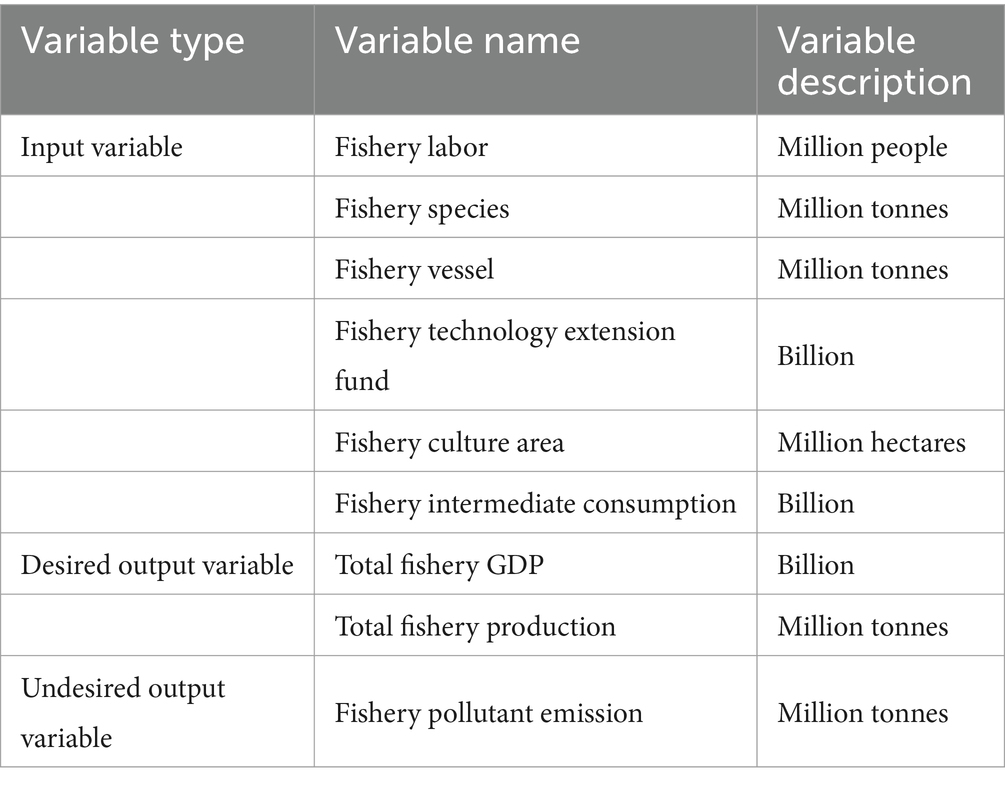
Table 1. Input–output table.
2.3.2 Data source
This paper selects panel data from 30 provinces and municipalities for the period 2010–2021, of which the number of experimental groups is 11 and the number of control groups is 19. Due to the more serious missing data in Tibet, it was excluded, and there are a few parts of this paper with missing data, all of which were made up using linear interpolation. The data in this paper are from the China Fisheries Statistical Yearbook, the China Agricultural Statistical Yearbook and the EPS Global Database (Table 2).

Table 2. Descriptive statistics for each variable.
3 Empirical analysis
3.1 Analysis of differences in differences regression result
Columns (1) and (2) of Table 3 report the relationship between marine ranch construction and fishery eco-efficiency based on Equation (1), controlling for time and region effect in the regression model to eliminate the endogeneity problem caused by unobservable factors of region and time, which may lead to bias in the estimation result. Column (1) of Table 3 shows the result of the regression without adding the control variables and Column (2) of Table 3 shows the result of the regression after adding the control variables, both using robust standard errors in the regression methodology. The result shows that the relationship between marine ranch construction and fishery eco-efficiency is significantly positive regardless of whether control variables are added or not, which indicates that marine ranch construction can improve fishery eco-efficiency. To further prove the correctness of the result, a series of robustness tests are conducted in this paper.
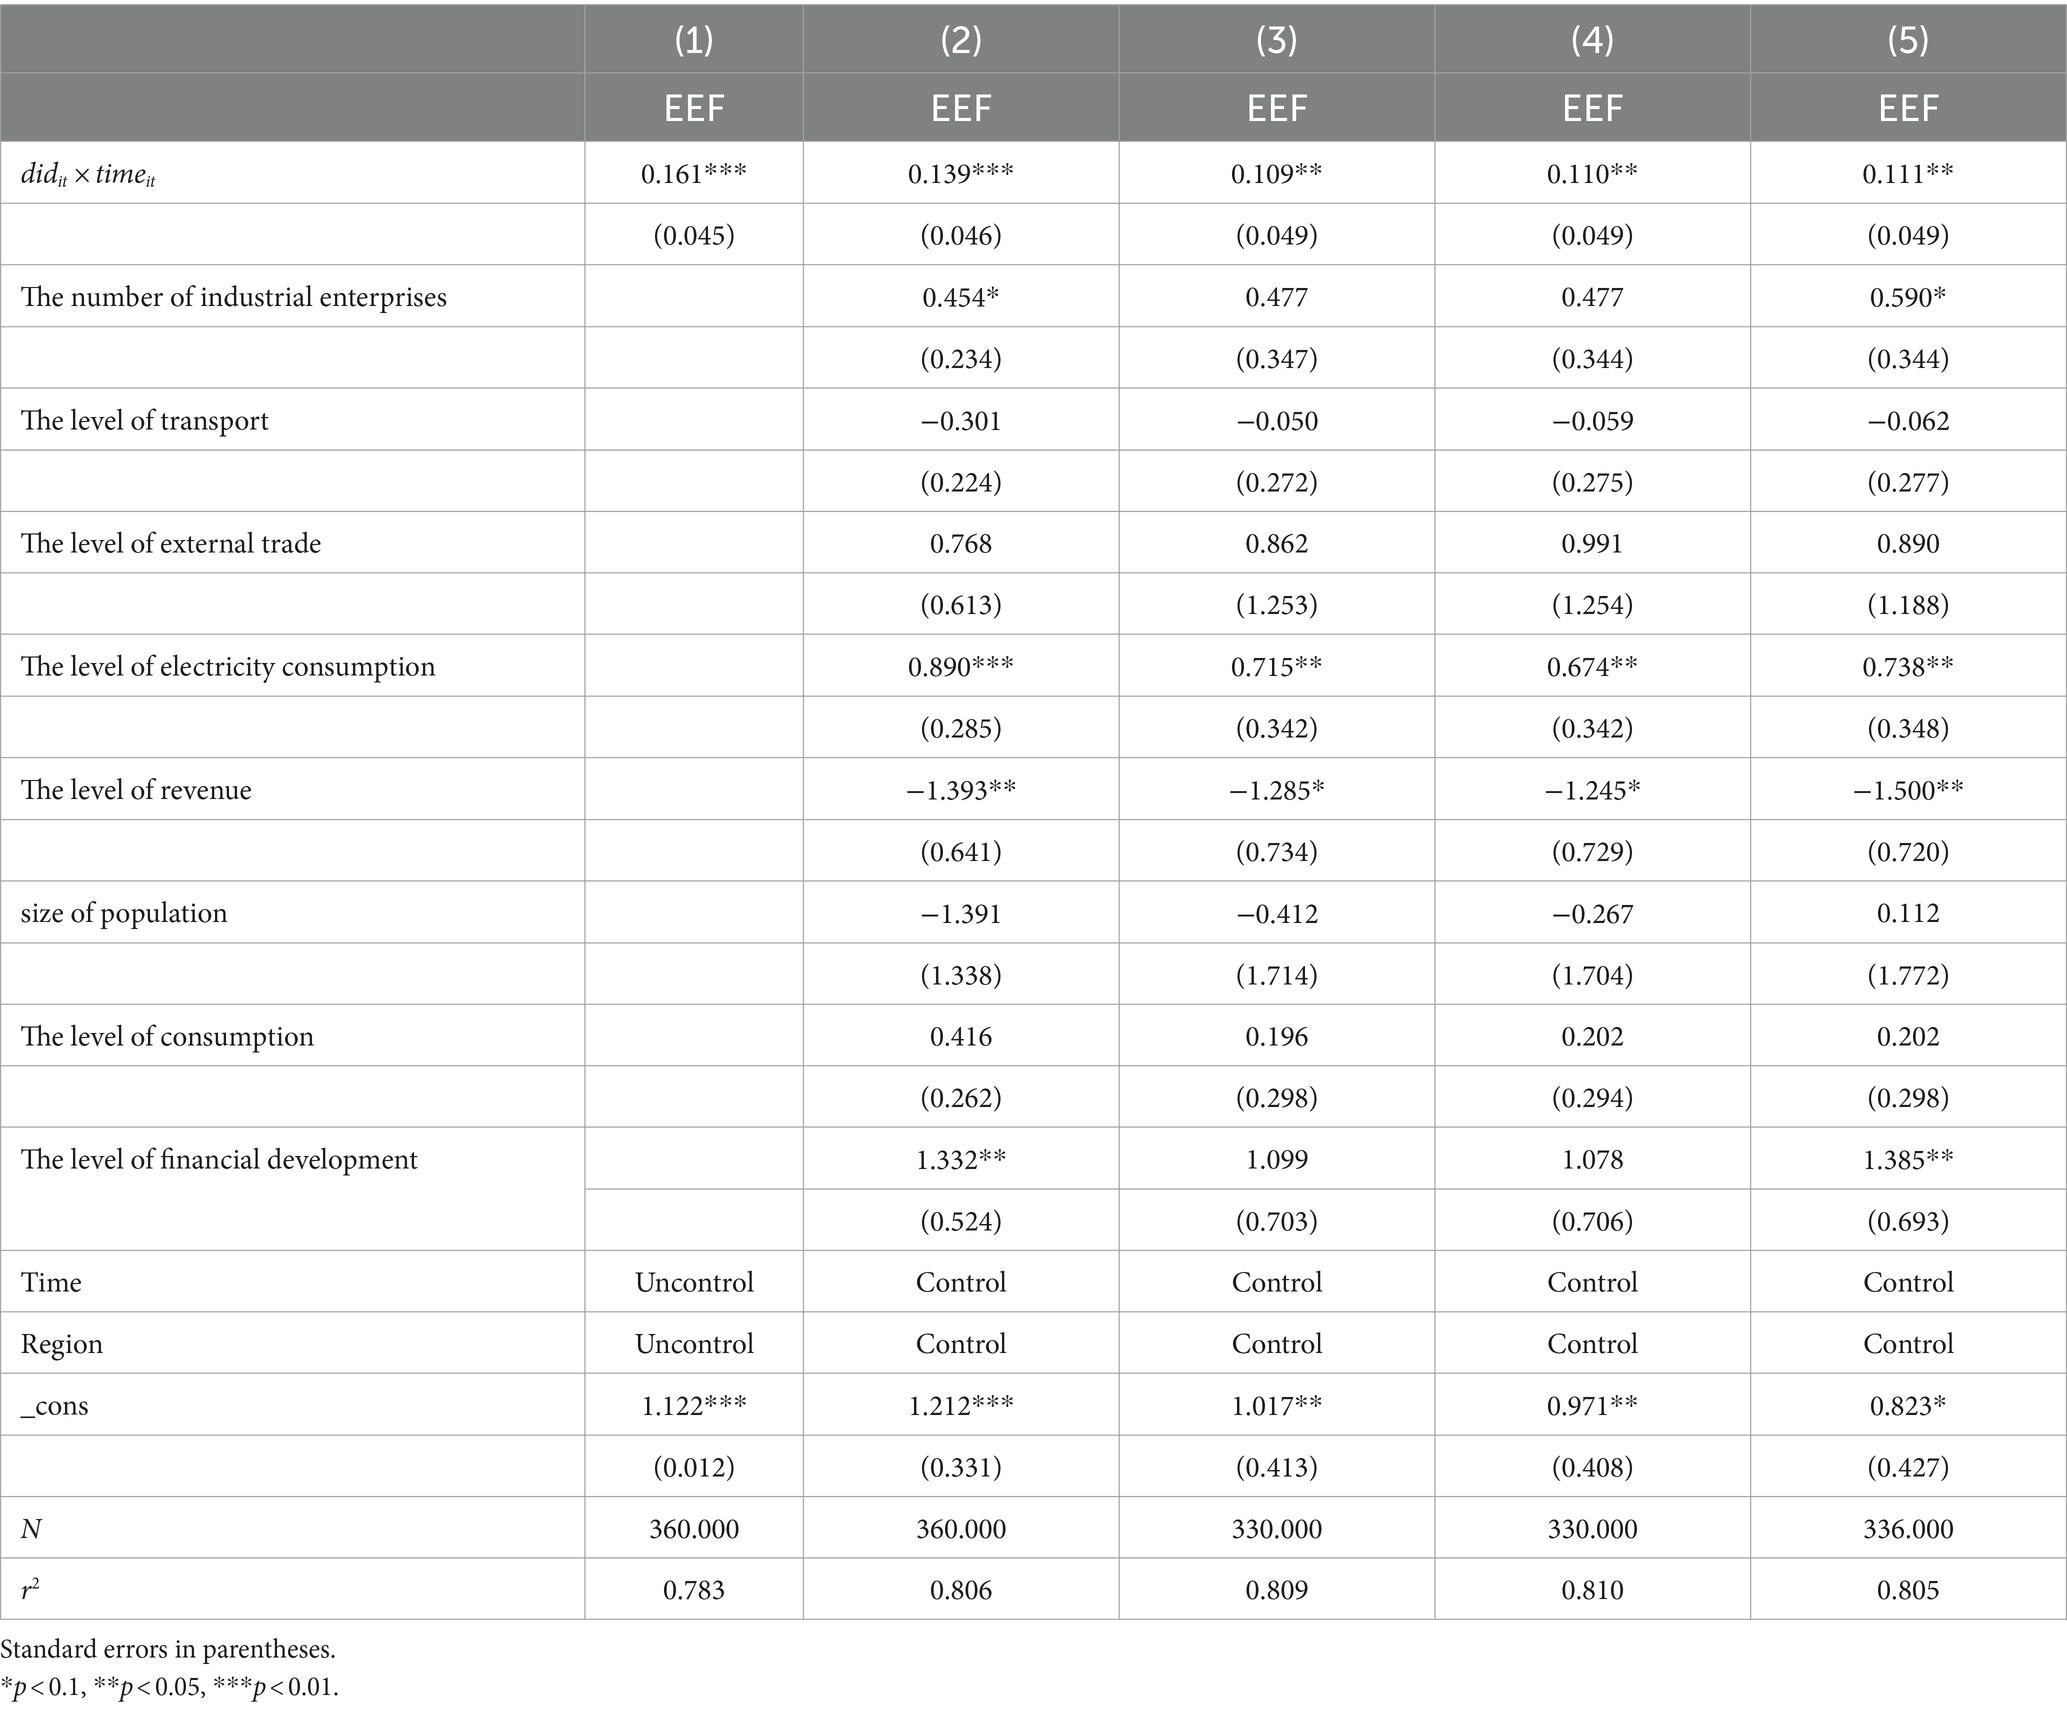
Table 3. Analysis of regression result.
3.2 Robustness test
3.2.1 Balanced trend test
The use of Differences in Differences is based on the fulfillment of the balanced trend test, which is carried out to demonstrate that there is no significant difference between the experimental and control groups before the policy is implemented, while there should be a significant difference between the experimental and control groups after the policy is implemented. In this paper, 2015 is set as the base year, while 2014, the previous year of policy implementation, is excluded to avoid the problem of multicollinearity, and the result is shown in Figure 1. In Figure 1, the horizontal coordinate represents the time of the policy and the vertical coordinate represents the effect of the policy; if the dashed line for a given year passes through the 0 scale, the effect of the policy is insignificant and if it does not pass through the 0 scale, the effect of the policy is significant. Figure 1 shows that the policy is not significant in any of the years prior to its implementation, and that it becomes significant in 2020, indicating that the effect of the policy has a certain lag.
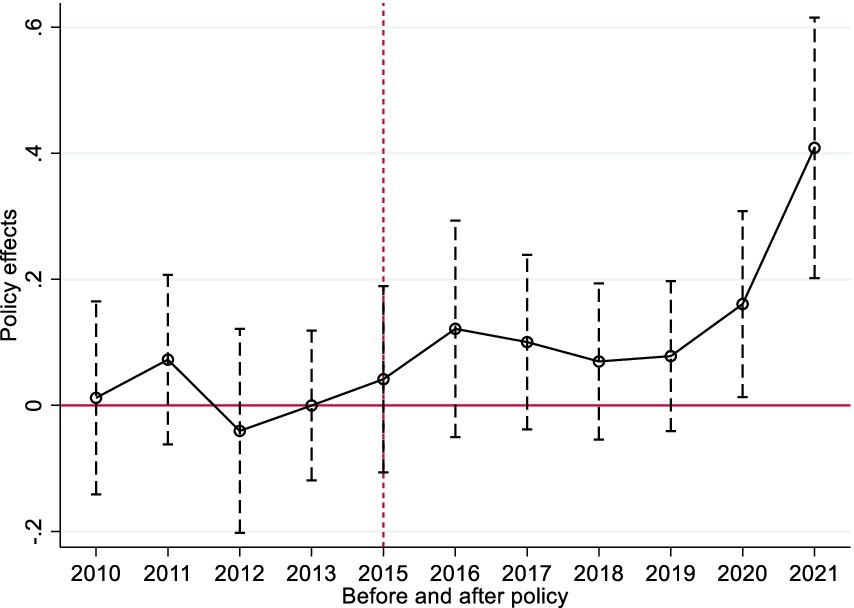
Figure 1. Balanced trend test.
3.2.2 Propensity score matching robustness test
This paper uses propensity score matching for robustness testing, mainly to eliminate the sample self-selection bias problem as much as possible. If there are certain factors between the experimental and control groups that cause them to be inherently biased, it will reduce the accuracy of the estimate. Therefore, this paper aims to eliminate the bias between the experimental and control groups that may affect the estimation results by propensity score matching. This paper suggests that the fishery eco-efficiency is likely to be higher in regions with higher levels of economic development. Due to the construction of the marine ranch is in the coastal region, the coastal region has a higher level of economic development compared to the inland region, and this paper thinks that the important reason for this deviation in the level of economic development is because the coastal region has advantages in foreign trade that the inland region does not have, so this paper takes the level of foreign trade as one of the matching variables in this paper. In addition, the level of consumption can also reflect the level of economic development, and the difference in the financial ability of local governments can also lead to the difference in financial support for the fishery industry, thus resulting in different fishery eco-efficiency in each region, so this paper takes the level of consumption and the level of revenueas the matching variables in this paper as well. The regression results after matching are shown in columns (3) and (4) of Table 3, and in the matching method, nearest neighbor matching (1:4) and radius matching are used, according to the regression results, it can be seen that the regression results are significantly positive regardless of which method is used, which verifies the correctness of the results of this paper. It should be noted that after propensity score matching, the deviation of each matching variable before and after matching needs to be examined to ensure that the deviation of each matching variable after matching is within an acceptable range. Figure 2 reports the matching results for each matching variable, and it can be seen that the deviation of each matching variable is reduced to less than 10%after matching, indicating successful matching.
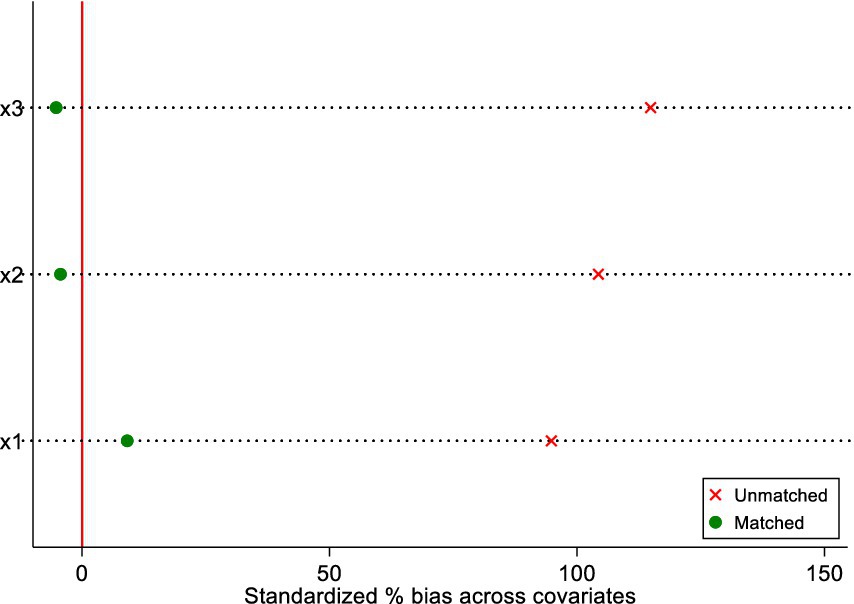
Figure 2. Matching variable test.
3.2.3 Altering the timing of policy shocks
The purpose of this section of the paper is to explore whether the erroneous estimation results are due to the fact that other policies were implemented at the same time in the year in which the policy was implemented. In this paper, the policy implementation time is advanced to 2012 and 2011 respectively, thus regenerating the core explanatory variables, the regression results are shown in Table 4, the regression results are not significant, proving the robustness of the result of this paper.
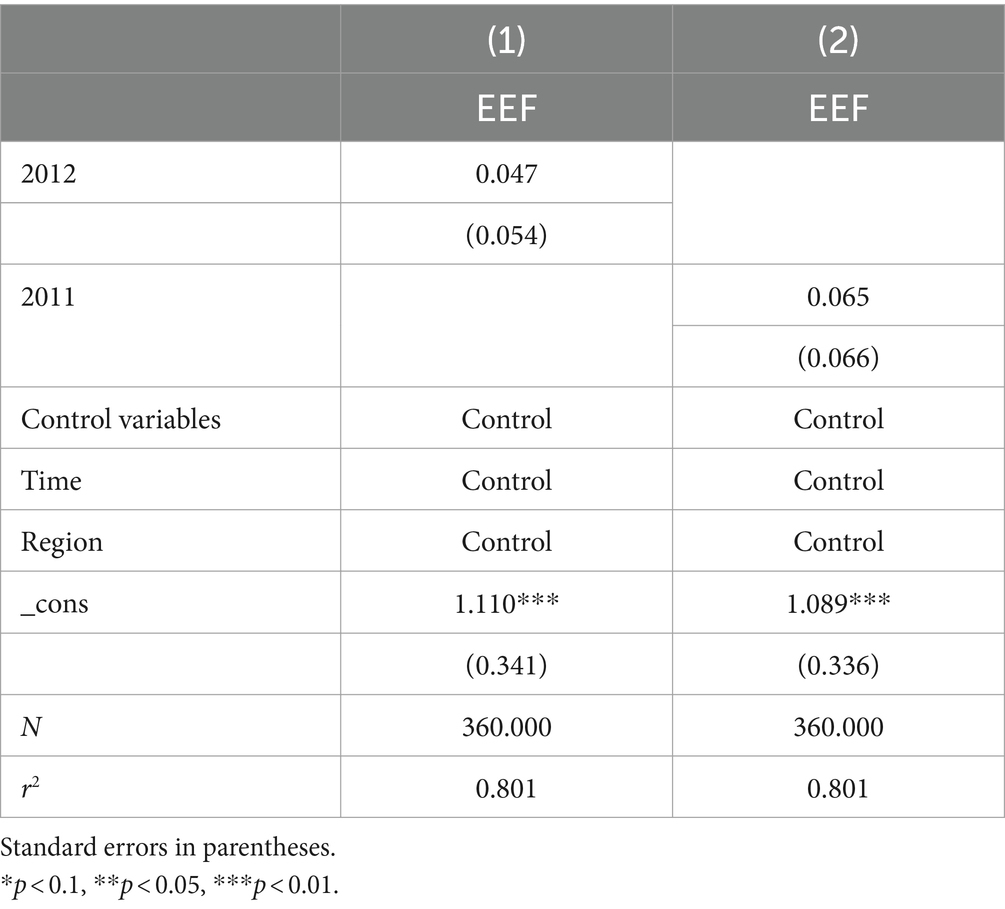
Table 4. Altering the timing of policy shocks.
3.2.4 Fictitious experimental groups
By fictionalizing the experimental group, this paper explores whether there are other unobservables that cause the regression to be significant, independent of which regions enter the experimental group. The specific idea is to randomly select the same number of regions as the experimental group as the fictitious experimental group in all the samples, and regress the fictitious experimental group with the control group in this paper, this process was repeated 1,000 times, the results of the 1,000 regressions are presented in the form of kernel density distribution plots. The results are shown in Figure 3, the estimated coefficients of the 1,000 regressions are around 0, proving the robustness of the result of this paper.
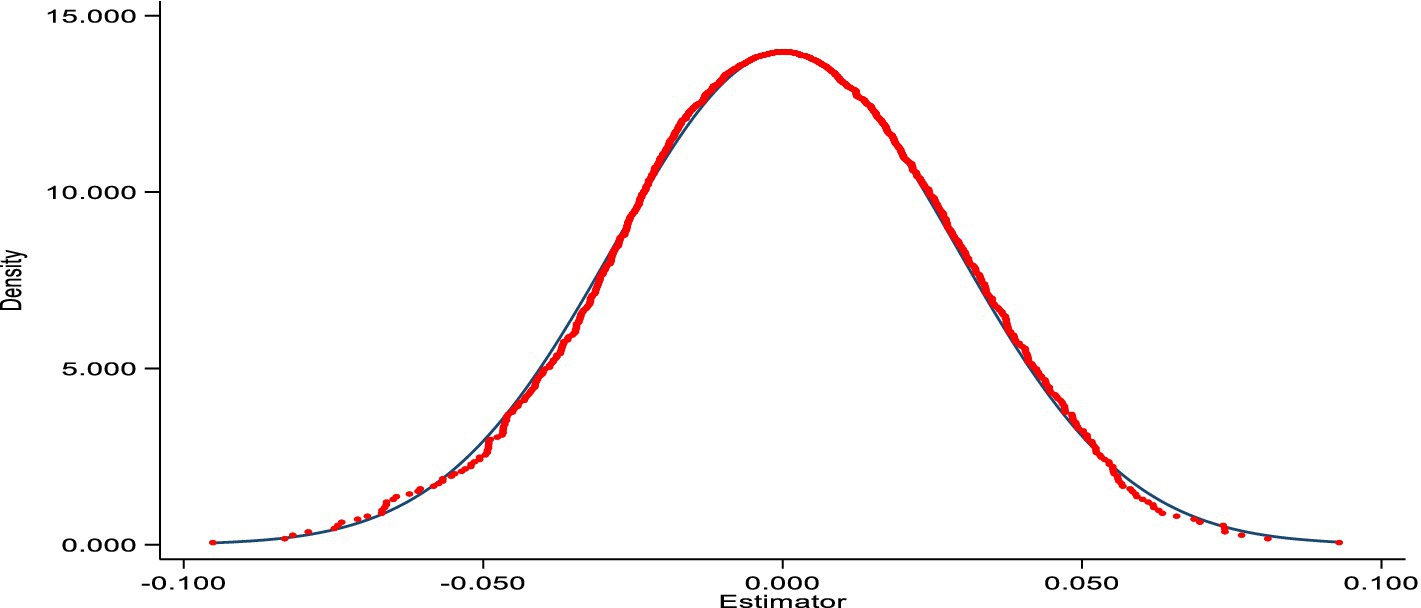
Figure 3. Kernel density distribution.
4 Analysis of the moderating effect
This paper aims to find out the pathway of China’s marine ranch construction to improve the fishery eco-efficiency by the analysis of the moderating effect. Because when the SBM-DEA model is applied to calculate the fishery eco-efficiency, the redundancy of each variable will be calculated together, which provides the idea for the analysis of the moderating effect in this paper. Therefore, the amount of redundancy in each input variable and the amount of redundancy in the undesired output variable are selected as the moderating variables in this paper, which are logarithmised in this paper. Moderating effect is mainly analyzed by constructing the interaction term between the moderating variable and the core explanatory variable to analyze what factors influence the core explanatory variable in affecting the explained variable. If the coefficient of the interaction term is positive, it means that the moderator variable strengthens the relationship between the core explanatory variable and the explained variable, if the coefficient is negative, it means that it weakens the relationship between the core explanatory variable and the explained variable. The regression results are shown in Table 5, according to the results, it can be seen that the labor redundancy (inter1), fishery species redundancy (inter2), fishery vessel redundancy (inter3), fishery technology extension fund redundancy (inter4), fishery culture area redundancy (inter5), fishery pollutant emission redundancy (inter7) are significantly negative, which indicates that these redundancy variables will play a negative role in the process of improving fishery eco-efficiency by the construction of China’s marine ranch, and it can be interpreted as the construction of China’s marine ranch can improve the fishery eco-efficiency by improving the redundancy of labor force, fishery species, fishery vessel, fishery technology extension fund, fishery culture area and fishery pollutant emission (Figure 3).
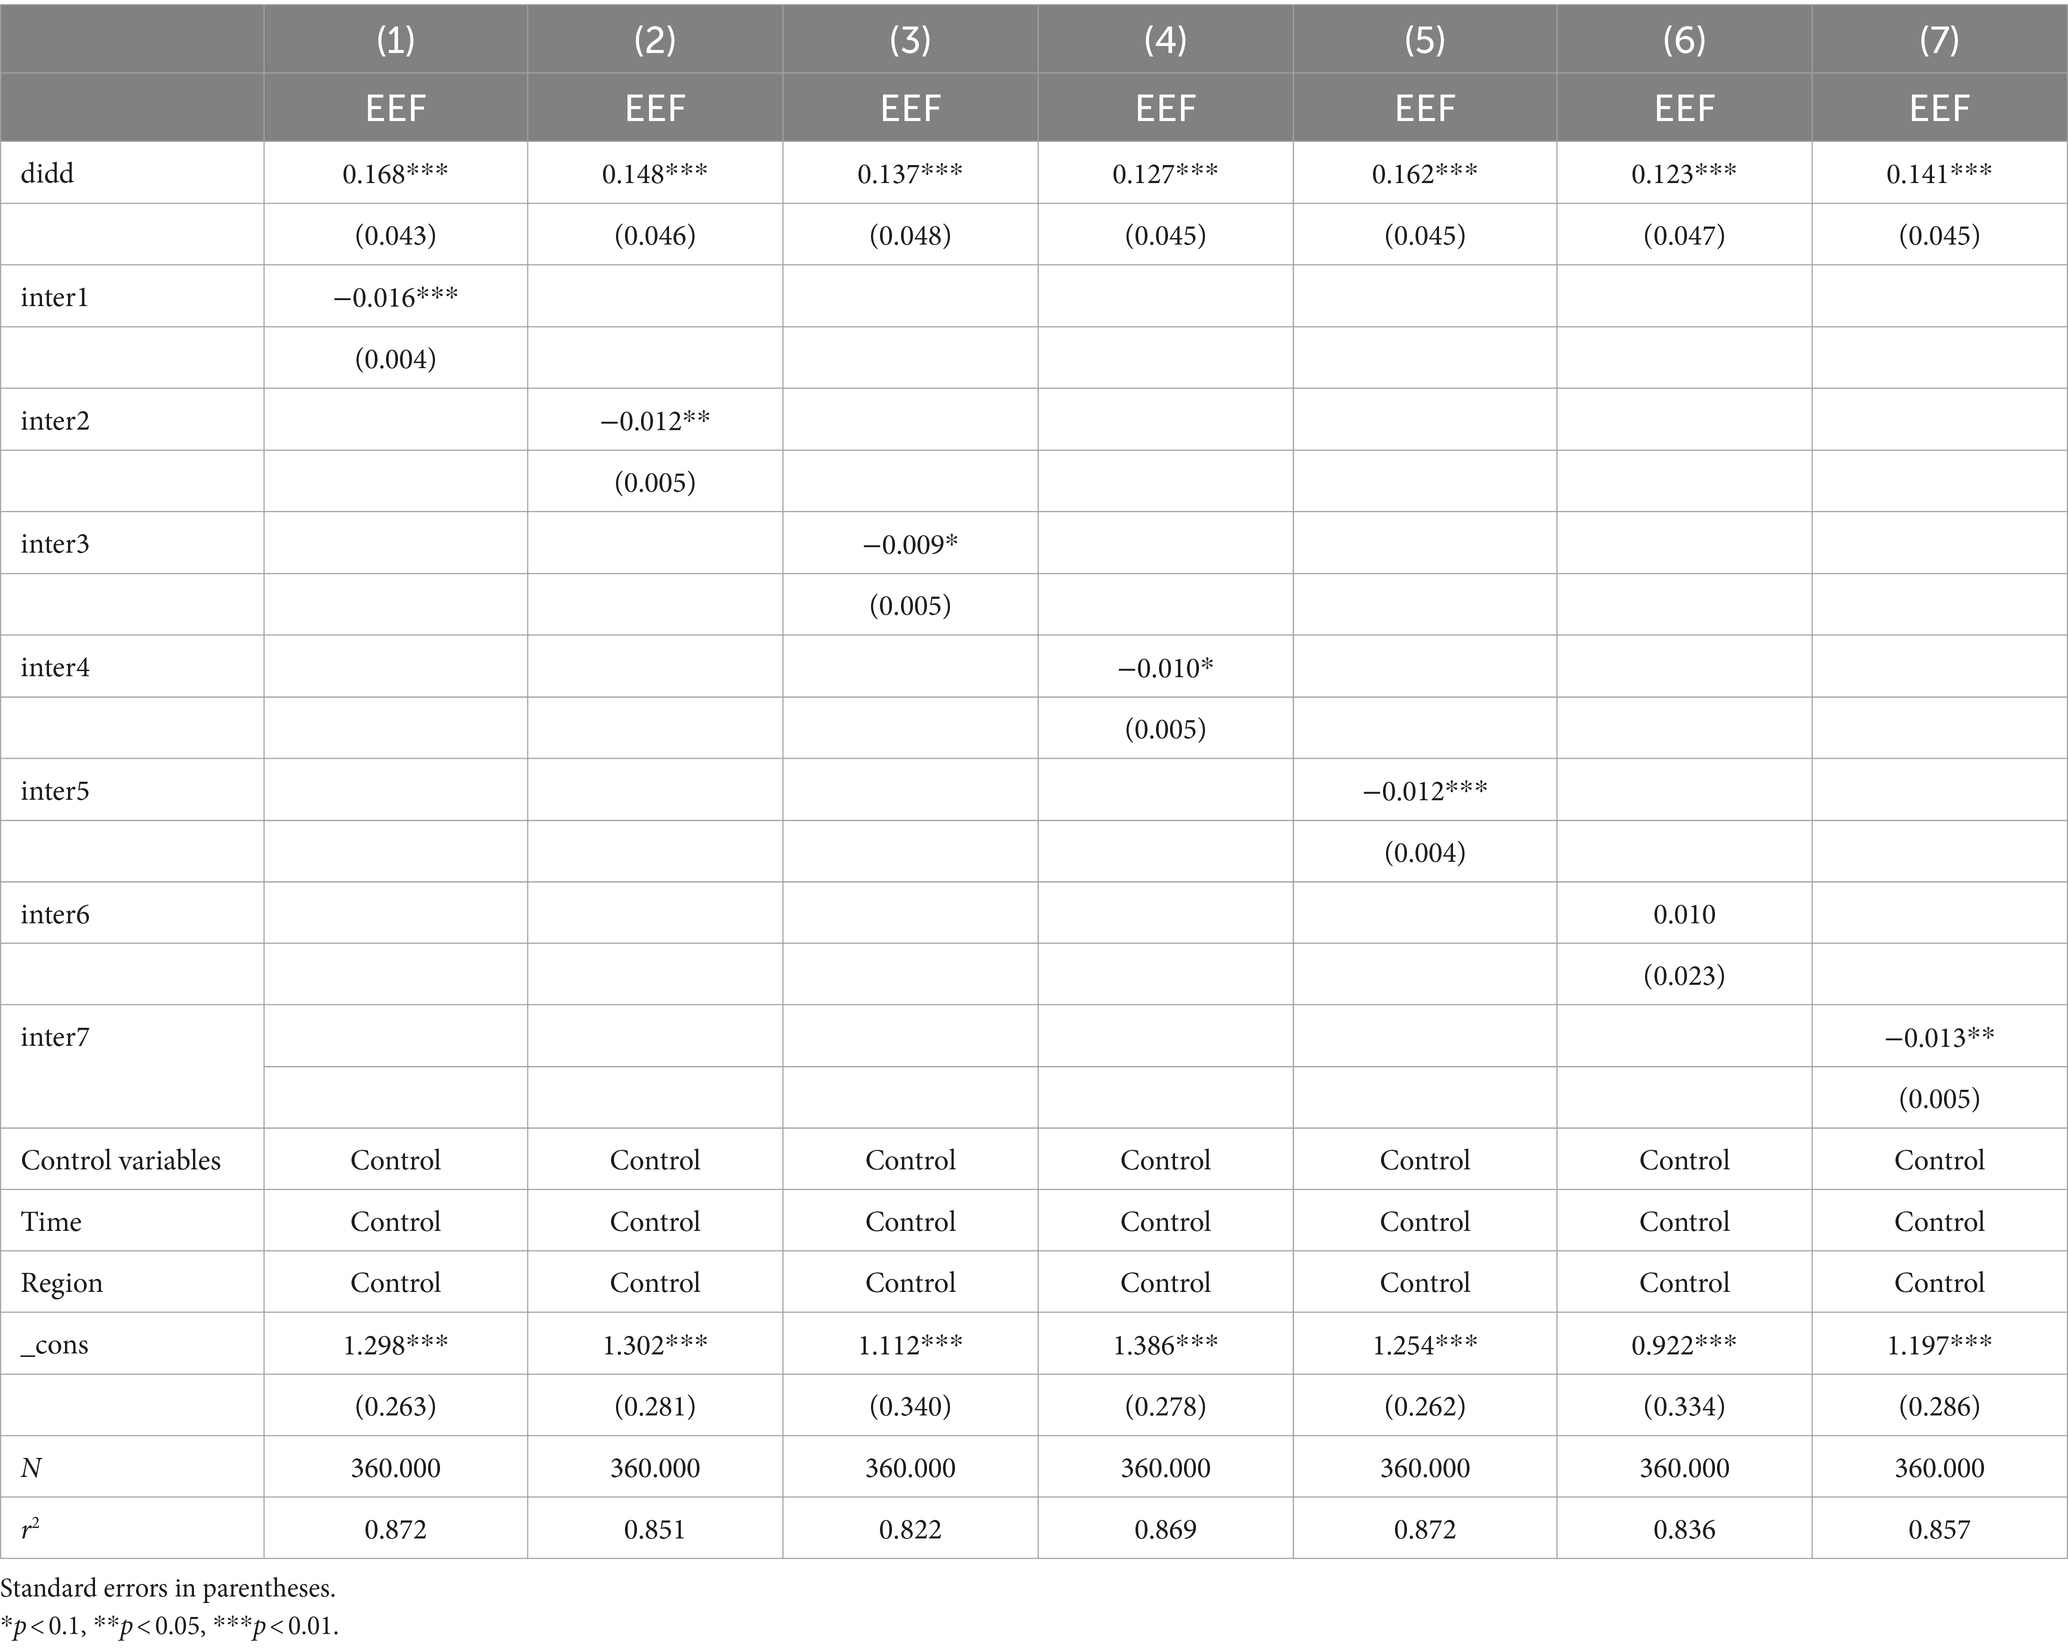
Table 5. Analysis of the moderating effect.
5 Productivity index analysis
The productivity index (Malmquist Index) was originally proposed by Swedish economist Sten Malmquist in 1953 and has been developed ever since. Because early DEA was only used to analysis cross-sectional data, it was only able to analysis the efficiency of different units in the same period of time. The emergence of panel data has made it possible to compare efficiencies in different periods, and this has led to the emergence of the productivity index, which is mainly used to analysis the level of change in productivity and is able to reflect the changes in efficiencies in different periods very well, through the decomposition of the productivity index, it is also possible to analysis the reasons for the changes in fishery eco-efficiency in a more detailed way.
This paper refers to Fare et al. (1994) and decomposes the fishery eco-efficiency index into TC (technical change), PEC (pure technical efficiency change), and SEC (scale reward change) (Fare et al., 1994). Figure 4 reports the index of fishery eco-efficiency in the region where the marine ranch was constructed from 2015 to 2021, and the changes in TC, PEC, and SEC: the fishery eco-efficiency index increased from 2015 to 2016, with changes in pure technical efficiency as the main contributor, while technical changes played a negative role; There was a small increase in the fishery eco-efficiency index from 2016 to 2017, with technological changes, technical efficiency changes, and scale remuneration changes all contributing; The fishery eco-efficiency index declined in 2017–2018, mainly from a decline in scale efficiency; The fishery eco-efficiency index declined further in 2018–2019, with technological change as the main reason; The fishery eco-efficiency index rises in 2019–2020, which comes from increasing scale efficiency and technical efficiency; The fishery eco-efficiency index rises slightly in 2020–2021, mainly from technical efficiency improvement. From the chart and the analysis, it can be seen that the fishery eco-efficiency index varies in different magnitudes but is greater than 1, indicating that the efficiency value is increasing year by year and the change in the fishery eco-efficiency index mainly comes from the efficiency change. Further calculation yields an average value of 1.085 for the fishery eco-efficiency index from 2015–2021, an increase of 8.5%; The average value of changes in technical efficiency is 1.0436, an increase of 4.36%; The average change in scale efficiency is 1.0316, an increase of 3.16%; The average change in technology is 1.0178, an increase of 1.78%. The result further suggests that the change in fishery eco-efficiency index is mainly from efficiency change.
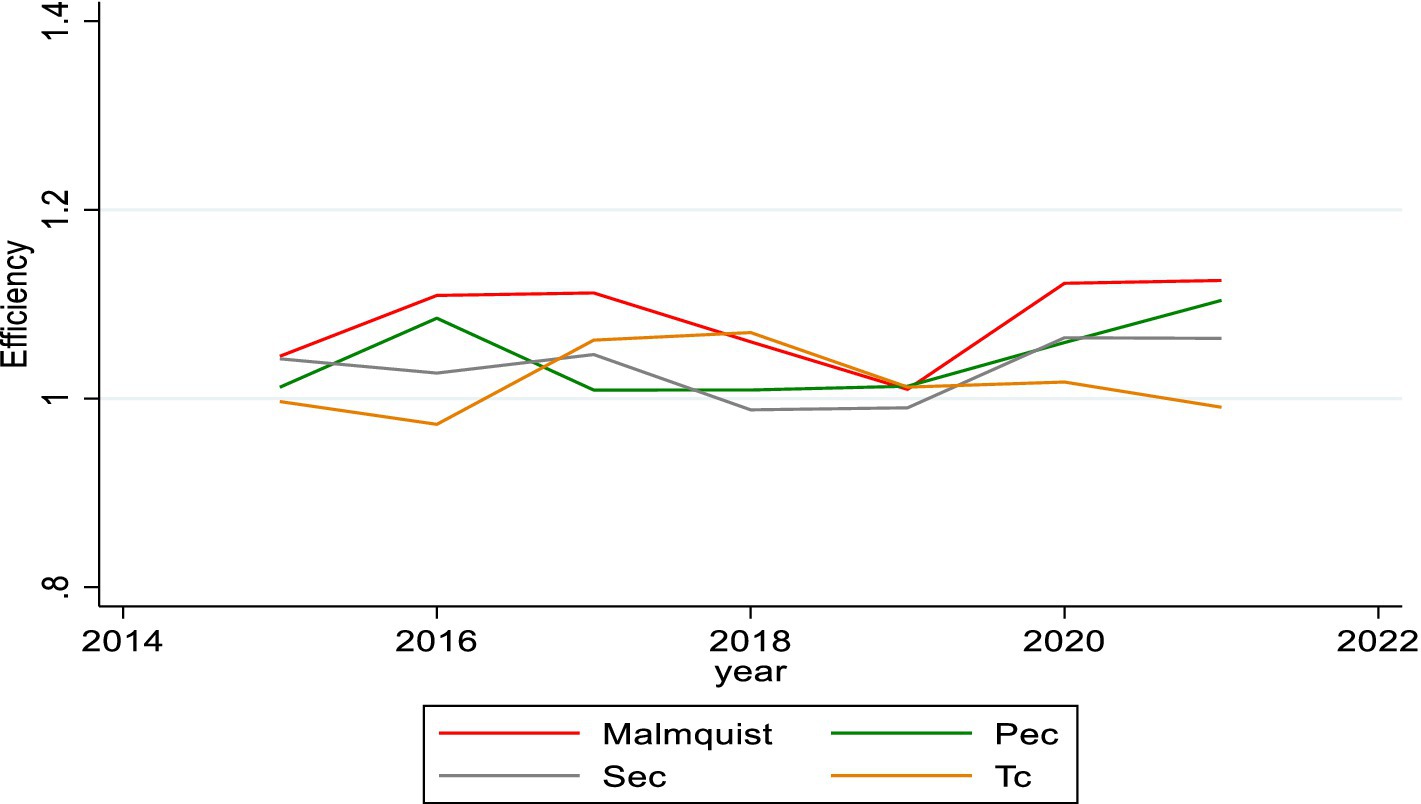
Figure 4. Productivity index analysis.
In conclusion, the overall eco-efficiency of marine ranchland in the new period shows a trend of steady improvement and both technological change and efficiency change can make contribution, but efficiency improvement is the main contribution. It indicates that environmental improvement, biological behavior control and other technologies have played a role and the efficiency of technology utilization has steadily increased, but technological innovation needs to be strengthened and in order to further promote the fishery eco-efficiency it is necessary to actively introduce advanced production methods and technologies.
6 Conclusions and policy recommendations
This paper selects panel data from 30 provinces and municipalities from 2010 to 202, and uses a double-difference fixed-effects model to explore how China’s marine ranch construction improves fishery eco-efficiency. The main conclusions of this paper are as follows:
1. The result of the regression shows that the construction of marine ranch in China can improve the fishery eco-efficiency. The result of the balanced trend test shows that there is no significant difference between the experimental group and the control group before the implementation of the policy and the policy effect appears in 2020, which indicates the lagged effect of the policy. To verify the correctness of the conclusions, the paper conducts robustness tests for propensity score matching, altering the timing of policy shocks and fictitious experimental groups, the results still hold.
2. Analysis of the moderating effect, finding the pathway of China’s marine ranch construction to improve the fishery eco-efficiency by constructing an interaction term. The result shows that the construction of China’s marine ranch can improve the fishery eco-efficiency by improving labor redundancy, fish species redundancy, fishery vessel redundancy, fishery technology extension fund redundancy, fishery culture area redundancy, and fishery pollutant emission redundancy. China’s marine ranch not only improves traditional production factor inputs, but also achieves ecological improvements.
3. The result of the productivity index analysis shows that the fishery eco-efficiency in the region where the new-era marine ranch was built has increased year by year since 2015 and technological changes, scale-efficiency changes and technical-efficiency changes can all contribute to the fishery eco-efficiency and increase in order, indicating that the marine ranch should be further strengthened with technological innovations.
Based on the above conclusions, policy recommendations to promote the improvement of fishery eco-efficiency are proposed in conjunction with the construction of marine ranch.
1. Strengthen the implementation of marine ranch policy. Actively promoting the development of marine ranch in the direction of deep-sea aquaculture; Strengthen the integrated planning for the construction of marine ranch and build marine ranch on the basis of full consideration of the characteristics of each place; Strengthen the integrated planning for the construction of marine ranch, and build marine ranch according to local conditions on the basis of full consideration of the characteristics of each region; Continuously strengthen financial support for marine ranch, using a combination of government and market approaches to raise funds for marine ranch construction at multiple levels and through multiple channels; Strengthen education and training for fishermen, improve their cultural quality and train modern professional fishermen who meet the requirements of marine ranch; Further improve the laws and regulations related to marine ranch (Yang, 2024), promote the improvement of the institutional mechanism for the operation of marine ranch and improve fishery eco-efficiency by promoting the construction of marine ranch.
2. Strengthen the breeding of deep-sea aquaculture species for marine ranch. Strengthen the selection and breeding of marine fish and shrimp breeds, enhance the protection of germplasm resources and promote the innovative development of breeding and promotion of deep-sea aquaculture breeds; To build a policy guarantee system for the innovative development of breeding and propagation of deep-sea aquaculture species and realise the development of deep-sea aquaculture in marine ranch by combining it with deep-water netting technology (Ke et al., 2023); Strengthen the protection of intellectual property rights of deep-sea aquaculture varieties, build a protection system for innovative achievements in deep-sea aquaculture breeding, enhance the fishery eco-efficiency by improving the quality of fish species.
3. Promote the development of deep-sea netting aquaculture technology for marine pastures. Strengthen research and development of aquaculture nets to enhance the ability of nets to adapt to extreme environment; Promote innovation in materials for the construction of deep-sea aquaculture nets, enhance the ability of nets to withstand wind and wave; Improve the construction of supporting facilities for deep-sea netting aquaculture, strengthen research on deep-sea netting aquaculture equipment and technology, upgrade key technologies for deep-sea netting aquaculture and improve the fishery eco-efficiency by increasing the utilization rate of deep-sea aquaculture space.
4. Strengthen effort to prevent and control pollution in marine ranch. Actively promote a paradigm shift in fisheries farming to reduce outputs of pollution such as COD and Ammonia Nitrogen; Strengthen the real-time monitoring of the aquaculture environment in marine ranch, build a technical system for real-time monitoring of marine ranch, establish a mechanism for assessing the sustainable development of marine ranch; Strengthen technical monitoring for marine ranch, outlaw or renovate unreasonable equipment and facilities, effectively improve fishery eco-efficiency by reducing the output of pollution.
6.1 Future prospect
This study analyzed the path of the role of marine ranch in improving the ecological efficiency of fisheries, and did not analyze the guarantee factors for the construction of marine ranch in China. In the future, more adequate research will be carried out in the field of guarantee factors for the construction of sea ranch in China.
Data availability statement
Publicly available datasets were analyzed in this study. This data can be found here: National Bureau of Statistics, https://www.stats.gov.cn/sj/.
Author contributions
CY: Funding acquisition, Writing – review & editing. MY: Writing – original draft. YW: Writing – review & editing. SZ: Writing – review & editing. HY: Writing – review & editing.
Funding
The author(s) declare that financial support was received for the research, authorship, and/or publication of this article. This work was supported by: Innovative Research Group Project of the National Natural Science Foundation of China (42176218); Key Technology Research and Development Program of Shandong Province (2023RZA02025); Qingdao National Laboratory for ocean Science and Technology Blur Think Tank KEY Program(BTT-B201712).
Conflict of interest
The authors declare that the research was conducted in the absence of any commercial or financial relationships that could be construed as a potential conflict of interest.
Publisher's note
All claims expressed in this article are solely those of the authors and do not necessarily represent those of their affiliated organizations, or those of the publisher, the editors and the reviewers. Any product that may be evaluated in this article, or claim that may be made by its manufacturer, is not guaranteed or endorsed by the publisher.
References
Arita, S., and Leung, P. (2014). A technical efficiency analysis of Hawaii's aquaculture industry. J. World Aquacult. Soc. 45, 312–321. doi: 10.1111/jwas.12124
Central People's Government of the People's Republic of China (2023). Opinions on the key work of comprehensively promoting rural revitalisation in 2023. https://www.gov.cn/zhengce/zhengceku/2023-02/22/content_5742671.htm
Charnes, A., Cooper, W. W., and Rhodes, E. (1978). Measuring the efficiency of decision making units. Eur. J. Oper. Res. 2, 429–444. doi: 10.1016/0377-2217(78)90138-8
Du, Y. W., and Li, X. X. (2022). Critical factor identification of marine ranching ecological security with hierarchical DEMATEL. Mar. Policy 138:104982. doi: 10.1016/j.marpol.2022.104982
Fare, R., Grosskopf, S., Norris, M., and Zhang, Z. Y. (1994). Productivity growth, technical progress, and efficiency change in industrialized countries. Am. Econ. Assoc. 84, 66–83.
Han, Z. L., Ji, X. Q., Hu, Y., and Cai, X. Z. (2019). Spatio-temporal evolution of eco-efficiency of China's marine fisheries based on the SBM model. Marine Dev. Manag. 36, 3–8. doi: 10.20016/j.cnki.hykfygl.2019.12.001
Hu, Y., Li, C. L., Zhao, B., and Han, S. (2019). Reflections on scientific promotion of modernized sea ranch construction. China Marit. Econ. 7, 50–63.
Iliyasu, A., Mohamed, Z. A., and Terano, R. (2016). Comparative analysis of technical efficiency for different production culture systems and species of freshwater aquaculture in peninsular Malaysia. Aquacult. Rep. 3, 51–57. doi: 10.1016/j.aqrep.2015.12.001
Jia, W. J., Yan, C. Y., and Li, H. Z. (2022). Research on internet of things Technology for Online Monitoring of ecological environment in marine rangelands. Mar. Sci. 1, 83–89.
Ke, K., Cao, Y.N., Zhao, Y.X., Zhuang, Y.W., Xu, X.Y., and Gao, F., (2023). Construction of digital fishery aquaculture system for deep-water net pens based on internet of things. Agric. Eng. Technol. 43 13–14. https://10.16815/j.cnki.11-5436/s.2023.11.003
Liaoning Bureau of Oceanography (1991). What is the "1646" project of Changhai County. Ocean Coast. Zone Dev. 2:79. doi: 10.20016/j.cnki.hykfygl.1991.02.021
Liu, G., Xu, Y., Ge, W., Yang, X., Shen, B., and Ran, Q. (2023). How can marine fishery enable low carbon development in China? Based on system dynamics simulation analysis. Ocean Coas. Manag. 231:106382. doi: 10.1016/j.ocecoaman.2022.106382
Liu, S., Zhou, X., Zeng, C., Frankstone, T., and Cao, L. (2022). Characterizing the development of sea ranching in China. Rev. Fish Biol. Fish. 32, 783–803. doi: 10.1007/s11160-022-09709-8
Ministry of Agriculture (2017). Circular of the Ministry of Agriculture on the issuance of the plan for the construction of State-Level Sea ranch demonstration areas (2017-2025). Bull. Minist. Agric. People Repub. China 11, 31–37.
Nakahara, H. (1992). Japanese efforts in marine-ranching development. Resources and environment in Asia's marine sector. Washington: Taylor and Francis.
Pan, D., and Ying, R.Y., (2013). Evaluation methods and empirical evidence of agricultural eco-efficiency in China--an analysis of SBM model based on unexpected outputs. Ecol. Lett. 33, 3837–3845. https://kns.cnki.net/kcms/detail/detail.aspx?FileName=STXB201312030& DbName=CJFQ2013, doi: 10.5846/stxb201207080953
Qin, H., Zhang, Y., and Lu, Y. Y. (2018). Measuring the ecological and economic efficiency of mariculture in China based on the SBM model. Agric. Technol. Econ. 39, 67–79. doi: 10.13246/j.cnki.jae.2018.09.006
Rahman, M. T., Nielsen, R., Khan, M. A., and Asmild, M. (2019). Efficiency and production environmental heterogeneity in aquaculture: a meta-frontier DEA approach. Aquaculture 509, 140–148. doi: 10.1016/j.aquaculture.2019.05.002
Salvanes, A. G. V. (2001). Ocean ranching. Encycl. Ocean Sci. 146-155. doi: 10.1016/B978-012374473-9.00485-9
Schaltegger, S., and Sturm, A. (1996). Managerial eco-control in manufacturing and process industries. Greener Manag. Int. 13, 78–91.
Tan, Y. M., and Lou, S. Y. (2021). Research and development of a large-scale modern recreational fishery marine ranch system. Ocean Eng. 233:108610. doi: 10.1016/j.oceaneng.2021.108610
Tone, K. (2001). A slacks-based measure of efficiency in data envelopment analysis. Eur. J. Oper. Res. 130, 498–509. doi: 10.1016/S0377-2217(99)00407-5
Tone, K. (2002). A slacks-based measure of super-efficiency in data envelopment analysis. Eur. J. Oper. Res. 143, 32–41. doi: 10.1016/S0377-2217(01)00324-1
Wang, D. L., Yu, J., and Chen, P. M. (2020). Progress of research on marine ranch construction technology. Anhui Agric. Sci. 48, 7–11.
Yan, W., and Zhong, C. (2022). The coordination of aquaculture development with environment and resources: based on measurement of provincial eco-efficiency in China. Int. J. Environ. Res. Public Health 19:8010. doi: 10.3390/ijerph19138010
Yang, H. S. (2016). Review and Prospect of China's sea ranch construction. J. Aquac. 40, 1113–1140, https://kns.cnki.net/kcms/detail/detail.aspx?FileName=SCKX201607015&DbName=CJFQ2016
Yang, F., (2024). Research on the Current Situation and Countermeasures of Marine Ranch Construction in Liaoning Province. Dalian Ocean University.
Yang, J. L., Wu, X. Y., Shi, G. F., and Chen, Y. (2004). Research status and development trend of sea ranch technology. China Fish. Econ. 5, 48–50.
Yang, H. S., Zhang, S. Y., Zhang, X. M., Chen, P. M., Tian, T., and Zhang, T. (2019). Strategic thinking on the construction of Modernized Sea ranches in China. J. Aquac. 43, 1255–1262.
Yu, J., and Zhang, L. (2020). Evolution of marine ranching policies in China: review, performance and prospects. Sci. Total Environ. 737:139782. doi: 10.1016/j.scitotenv.2020.139782
Zhong, S., Li, A., and Wu, J. (2023). Eco-efficiency of freshwater aquaculture in China: an assessment considering the undesirable output of pollutant emissions. Environ. Dev. Sustain. 25, 3555–3576. doi: 10.1007/s10668-022-02189-7
Zhou, X., Zhao, X., Zhang, S., and Lin, J. (2019). Marine ranching construction and Management in East China Sea: programs for sustainable fishery and aquaculture. Water 11:1237. doi: 10.3390/w11061237
Keywords: China’s marine ranch, fishery ecological efficiency, Super-SBM model, differences in differences model, food safety
Citation: Yusheng C, Ye M, Weili Y, Zhaofa S and Yang H (2024) How to improve fishery eco-efficiency by building marine ranch in China. Front. Sustain. Food Syst. 8:1401842. doi: 10.3389/fsufs.2024.1401842
Edited by:
Yuan-Wei Du, Yunnan University, ChinaReviewed by:
Xiaozhong Li, Northeast Agricultural University, ChinaYang Gao, Qufu Normal University, China
Copyright © 2024 Yusheng, Ye, Weili, Zhaofa and Yang. This is an open-access article distributed under the terms of the Creative Commons Attribution License (CC BY). The use, distribution or reproduction in other forums is permitted, provided the original author(s) and the copyright owner(s) are credited and that the original publication in this journal is cited, in accordance with accepted academic practice. No use, distribution or reproduction is permitted which does not comply with these terms.
*Correspondence: Chen Yusheng, MjAxMDAxOUBvdWMuZWR1LmNu