 Gao Xin
 Humayun Khan2
 Xin Ling
- 1Institute of Agricultural Economics and Development, Chinese Academy of Agricultural Sciences, Beijing, China
- 2College of Economics and Management, Huazhong Agricultural University, Wuhan, China
Trade facilitation is essential for enhancing the import and export of agricultural products between China and BRICS countries. Improving trade efficiency and identifying potential opportunities contribute to establishing formal cooperation mechanisms among nations, laying a robust foundation for the development and collaboration of BRICS countries post-expansion. This study developed a comprehensive indicator system and employed principal component analysis to assess trade facilitation levels among BRICS member states. Additionally, we employed a stochastic frontier gravity model to examine the trade efficiency and potential impact of BRICS trade facilitation on China’s agricultural imports and exports from 2009 to 2022. The findings suggest that the overall level of trade facilitation in BRICS countries remains relatively low, with considerable scope for enhancement. The United Arab Emirates exhibits the highest level of trade facilitation, whereas Ethiopia shows the lowest. Factors such as economic status, business environment, and advancements in technology positively influence trade efficiency, while inadequate infrastructure impedes it. A notable disparity exists in the average trade efficiency of agricultural imports and exports between China and BRICS countries, with Russia displaying the highest efficiency and Iran the lowest. Brazil demonstrates significant trade potential, whereas the trade demand between Iran and China is comparatively minimal. The results are important for policymakers, pointing to the need for specialized trade policies and agricultural management strategies that reflect the diverse characteristics and challenges within BRICS economies.
1 Introduction
Adhering to the principles of openness, transparency, solidarity, mutual assistance, deepened cooperation, and shared development, the BRICS countries—Brazil, Russia, India, China, and South Africa—are committed to fostering a closer, more comprehensive, and robust partnership. Embodying the BRICS spirit of “openness, inclusiveness, cooperation, and win-win outcomes,” this collaboration among BRICS nations holds significant implications for China’s agricultural trade. Notably, the BRICS member countries have consistently played a crucial role in China’s agricultural trade sector. According to statistics from China Customs, the total import and export of agricultural products in 2023 was 333.03 billion U.S. dollars. Specifically, exports amounted to 98.93 billion U.S. dollars, showing a modest increase of 0.9% compared to 2022, while imports totaled 234.11 billion U.S. dollars, representing a slight decrease of 0.3%. This ongoing collaboration among BRICS nations is expected to further strengthen and enhance bilateral trade relations in the agriculture sector. Moreover, trade facilitation remains a critical determinant of agricultural trade efficiency among BRICS nations. Since the inception of the BRICS alliance, the scope of agricultural trade cooperation between China and its BRICS counterparts has expanded significantly, with an increasing frequency of collaborative endeavors. Between 2010 and 2019, BRICS countries exhibited relatively low levels of trade facilitation, highlighting significant potential for improvement. Among these nations, South Africa had the highest level of trade facilitation, categorized as relatively efficient. In contrast, Brazil and Russia exhibit lower trade facilitation levels, characterized by trade barriers, while India and China fall under the general facilitation category (Li and Chen, 2022). In 2023, the BRICS cooperation mechanism extended invitations to Egypt, Ethiopia, Iran, Saudi Arabia, and the United Arab Emirates, signaling a new phase of trade collaboration. This expansion is anticipated to enhance the levels of trade facilitation within the region, directly impacting agricultural cooperation between China and other BRICS member countries, and significantly promoting bilateral agricultural trade (Zou, 2023).
Amid the current rise in international geopolitical conflicts, growing uncertainty about global economic recovery post-COVID-19, and the backlash against economic globalization, the constraints on China’s agricultural imports and exports have become increasingly evident in terms of “trade inefficiency” (Xu et al., 2024). Concurrently, challenges within BRICS countries, including inadequate infrastructure, complex import and export procedures, and flawed institutional mechanisms, have created significant barriers that hinder the efficiency of China’s agricultural trade. Addressing these institutional obstacles, streamlining trade procedures, and developing a more rational, effective, and convenient trade facilitation system are now crucial for advancing regional economic cooperation. This effort holds significant theoretical and practical importance in the field of international trade (Chen et al., 2023). It enriches the discussion on trade facilitation by linking it to agricultural trade and expands the research perspective on how trade facilitation affects agricultural exports. Furthermore, by assessing and comparing the overall trade facilitation levels and development of sub-indicators among BRICS countries, the current state of China’s trade facilitation and its gap relative to countries with higher facilitation standards are revealed. This analysis can provide a decision-making foundation for China to formulate policies and measures to enhance trade facilitation. Additionally, it supports China’s alignment with international high-standard economic and trade regulations, the creation of a higher-standard free trade zone network, and the strengthening of China’s position within regional industrial and supply chains, ultimately contributing to the development of a more advanced open economic system (Zhou, 2024).
Existing research primarily focuses on regions such as APEC, the Belt and Road Initiative, and ASEAN, with relatively few studies on BRICS member countries. In particular, there is a notable lack of analyses on the efficiency of agricultural trade between China and BRICS nations, especially in light of the recent expansion of BRICS membership. To address this gap, this paper constructs a trade facilitation index system based on the current state of agricultural trade between China and other BRICS countries. It employs the stochastic frontier gravity model to calculate the potential for agricultural trade, analyze the inefficiency factors, and determine the trade efficiency. The ultimate aim is to improve bilateral trade efficiency and increase the share of agricultural trade.
2 Literature review and research hypotheses
2.1 Literature review
To date, the academic community lacks a unified standard for defining and understanding trade facilitation. Scholars have proposed various perspectives on this concept. In practical research, the definitions provided by leading international organizations are frequently utilized. The World Trade Organization (WTO) defines trade facilitation as the simplification of regulations, procedures, and transport services involved in the flow of goods and services in international trade, to enhance overall process efficiency (WTO, 2017). In a broader context, the World Bank describes trade facilitation as the simplification of policy measures and the improvement of efficiency in the trading of goods or services (WTO, 2014). The Asia-Pacific Economic Cooperation (APEC) views trade facilitation as the implementation of robust measures and innovative technologies to streamline the global trade process, foster regional and national cooperation, eliminate mobility barriers, and reduce circulation costs (APEC, 1997). Additionally, the United Nations Conference on Trade and Development (UNCTAD) also researches trade facilitation, each organization focusing on its specific areas (Zheng and Xi, 2008b).
First and foremost, due to the lack of an internationally unified consensus on the definition of trade facilitation, the methods for measuring and assessing levels of trade facilitation vary significantly. Wilson et al. (2003) developed a framework for evaluating trade facilitation within the Asia-Pacific Economic Cooperation (APEC), which included four primary indicators: port efficiency, customs environment, policy environment, and e-commerce (APEC, 2002). This framework also includes thirteen secondary indicators, such as the port efficiency index, port facilities, inland water transportation, non-traditional payments, and trade barriers. The construction of these indexes employs diverse methodologies and covers various indicator systems, which restricts the comparability of findings across studies. Consequently, many scholars have built upon (Wilson et al., 2003) primary indicators, while modifying the secondary indicators for analysis (Minghui, 2011). For instance, (Safaeimanesh and Jenkins, 2020) developed a system of secondary indicators specifically adapted to the characteristics of goods trade, for assessing the level of trade facilitation in African countries. Other researchers adjusted the number and content of primary indicators based on the specific context of their studies and utilized various methods to construct the trade facilitation indexes (Zheng and Xi, 2008a), for instance, applied the Analytic Hierarchy Process (AHP) to select five primary indicators—port efficiency, taxing environment, regulatory environment, e-commerce, and business personnel mobility—to construct a trade facilitation measurement system. In general, scholars primarily consider the primary indicators of their constructed measurement systems as the determinants of trade facilitation levels, analyzing them through various methodologies. These include gray correlation analysis (Zhong-Hai and Pei-Lei, 2014; Li et al., 2020), principal component analysis (Zhang, 2019; Francois and Manchin, 2013), factor analysis, and structural equation modeling (Li and Shuai, 2014), the simple arithmetic average method (Minghui, 2011; Xie and Yue, 2011), the weighted average method (Xiao-Jing and Liang, 2015), hierarchical analysis (Feng and Zhang, 2019), and the entropy method (Li et al., 2014). Despite the advanced development of these comprehensive evaluation techniques, different methods can yield varying results. Therefore, it is crucial to carefully select and combine methods for the specific issues under investigation. To minimize subjective bias in objective evaluations, this study employs a subjective analysis approach tailored to the specific problem at hand to conduct a comprehensive assessment of trade facilitation levels among BRICS countries. Future research can further investigate the development of a unified, comprehensive, and internationally comparable trade facilitation index to more accurately assess trends in trade facilitation levels among BRICS countries.
Secondly, in examining agricultural trade among BRICS countries, scholars largely focused on international competitiveness, trade characteristics, and trade relations, offering valuable perspectives and insights. Zhuang et al. (2015) employed the CMS model to assess the international competitiveness of agricultural products within BRICS nations, revealing significant structural shifts: the competitiveness of labor-intensive agricultural products is gradually declining, while that of capital-intensive agricultural products is increasing. Similarly, De Brauw et al. (2004), after an extensive examination of China’s agricultural development, evaluated the country’s agricultural trade by creating an international competitiveness evaluation index. Their study assessed the global market position of China’s agricultural products and analyzed the factors influencing this competitiveness. However, these studies predominantly address the overall competitiveness of agricultural products, with limited exploration of the competitive dynamics, complementarities, and potential cooperation opportunities among different countries and products. Geng (2009) and Anderson (1990) compared the international competitiveness of China’s agricultural products with those of Brazil and India, highlighting Brazil’s strong competitiveness in the Chinese market and the diminishing competitive advantage of China’s agricultural products in India. Zhang (2015) investigated the import and export markets and product structures of major agricultural products in Russia, Brazil, India, and South Africa, finding that BRICS agricultural products are highly complementary, which suggests considerable potential for future trade development. Yin and Fan (2016) analyzed agricultural trade between China and other BRICS countries from the perspectives of competitiveness and complementarity, concluding that the existing trade is largely complementary and beneficial for market expansion. Their study reveals that BRICS countries should enhance trade in agricultural products where they possess comparative advantages. Zhao and Mu (2018) categorized agricultural products into four major groups based on HS codes and analyzed the factors influencing China’s import and export of these products to other BRICS countries using the gravity model of trade. They suggested that China should consider the political and economic contexts of partner countries to achieve balanced trade development (Zhang and Zong, 2018) utilized the CMS model to evaluate intra-industry trade levels in agricultural products between China and other BRICS countries from both static and dynamic perspectives, identifying low scores and a predominance of inter-industry trade. They further conducted empirical analyses of the factors affecting intra-industry trade levels. Despite the varied focus of these studies, most scholars have reached optimistic conclusions regarding the potential for enhanced agricultural trade among BRICS nations.
Finally, in analyzing the impact of trade facilitation on agricultural trade, scholars have predominantly employed the gravity model of trade to assess this relationship. Empirical studies focusing on trade facilitation within the six economic corridors of the “Belt and Road Initiative” and regions like Singapore and Japan show that simpler customs procedures and improved e-commerce significantly boost trade (Hertel et al., 2001; Ramasamy et al., 2017). Variables such as different transaction costs (Djankov et al., 2010), institutional frameworks, and infrastructure (Francois and Manchin, 2013) significantly affect the volume and potential of bilateral agriculture trade. Moreover, the benefits of improved trade facilitation are particularly pronounced for developing countries, leading to increased welfare and trade flows (Zaki, 2014; Khan and Chen, 2024). Additionally, research has explored the relationship between trade facilitation, the neighbor effect, and bilateral agricultural exports (Dong and Gao, 2020; Khan et al., 2024). Studies have consistently demonstrated the positive impact of trade facilitation on agricultural trade between China and countries along the “Belt and Road” Initiative (Fan et al., 2023; Fu et al., 2023), indicating a strong correlation between higher level of trade facilitation and increased volumes of agricultural imports and exports (Guo and Wu, 2015; Tan and Hua, 2016; Zhang, 2018). Furthermore, studies have examined the effects of trade facilitation on the trade flows of specific types of agricultural products (Zheng et al., 2019; Zhang and Zhang, 2022), reinforcing the significant role of trade facilitation in enhancing agricultural trade dynamics.
The literature review clarifies the definition of trade facilitation, the selection of indicators, agricultural trade among BRICS countries, and the factors influencing it. While many studies examine agricultural trade within BRICS, few focus on the impact of trade facilitation on China’s agricultural trade with these nations. Research related to the Belt and Road Initiative and ASEAN is abundant, yet studies from a BRICS perspective are scarce, highlighting a significant research gap. To address this gap, this paper examines the impact of trade facilitation in BRICS countries on China’s agricultural trade. Using a stochastic frontier gravity model, we assess the trade potential of China’s agricultural products with BRICS nations, contributing to the understanding of trade facilitation and competitiveness within BRICS agricultural trade.
2.2 Research hypotheses
The effect of trade facilitation on agricultural import and export activities is influenced by various specific indicators used to assess trade facilitation, as outlined in the framework by Wilson et al. (2003). By optimizing each sub-indicator, a subsequent paper will explore in detail the mechanisms by which each trade facilitation indicator affects agricultural import and export. For this research, trade facilitation is assessed through five key indicators: infrastructure, regulatory environment, economic conditions, business environment, and technological research and development. These indicators form the basis for the research hypotheses.
Infrastructure plays a crucial role in logistics efficiency and reflects the quality and capacity of a country’s roads, railways, aviation, and ports. As international agricultural trade grows, the speed of cargo transportation becomes increasingly important. Generally, better infrastructure supports faster goods movement, improving transportation efficiency, reducing transaction costs, and thus enhancing trade development. Thus, this paper proposes Research Hypothesis 1.
H1: Increased infrastructure construction in BRICS countries can stimulate the growth of China’s agricultural import and export trade.
The regulatory environment assesses a nation’s administrative capacity, directly influencing its economic landscape. It encompasses the regulatory systems and norms of the agricultural trade industry in each country, as well as the policy structure that underpins international trade relations. Timely and effective government interventions that rectify systemic deficiencies can significantly bolster trade development in agricultural imports and exports. Thus, this paper proposes Research Hypothesis 2.
H2: Enhancing the regulatory environment in BRICS countries can foster the advancement of China’s agricultural import and export trade.
The economic level of a nation acts as a critical indicator of its internal capabilities and its attractiveness in bilateral trade relations, significantly influencing the composition of its foreign trade commodities. Developed countries typically import primary products and export manufactured goods, whereas developing nations exhibit the inverse pattern. This dynamic alignment enhances the efficiency and precision of China’s agricultural trade partnerships with its import and export counterparts. Thus, this paper posits Research Hypothesis 3.
H3: The greater the economic development level of BRICS countries, the more it can promote the advancement of China’s agricultural import and export trade.
The business environment constitutes a vital facet of a nation’s global trade dynamics, reflecting its economic impact and highlighting its trade efficiency and competitive potential. Moreover, the quality of the business environment dictates the extent of a nation’s openness to international trade. A favorable business environment achieves this by decentralizing operations, optimizing public services, and enhancing policy implementation quality, thereby empowering domestic enterprises to compete robustly in the global economy. Hence, this paper posits Research Hypothesis 4.
H4: Enhancing the business environment in BRICS countries can stimulate the advancement of China’s agricultural import and export trade.
The adoption of information technology and increased investment in research and development (R&D) will gradually replace traditional trade practices with cross-border e-commerce, shifting more physical transactions to online platforms. This transformation is expected to boost transactional efficiency and expand the scope of agricultural trade. Additionally, the level of R&D investment reflects a nation’s capacity to innovate and develop new technologies, thereby improving agricultural production techniques and enhancing the value-added aspects of agricultural products. Therefore, this paper postulates Research Hypothesis 5.
H5: Strengthening technology R&D efforts in BRICS countries can foster the growth of China’s agricultural import and export trade.
3 Materials and methods
3.1 Construction of trade facilitation indicator system for BRICS countries
In this study, building upon the research of Wilson et al. (2003) and others, and guided by international trade frameworks such as the Doing Business Report and the Trade Facilitation Agreement, we identified five fundamental dimensions—infrastructure, regulatory environment, economic capacity, business climate, and technological innovation—as the primary indicators for our trade facilitation index system. To ensure a thorough and systematic evaluation of each host country’s trade facilitation capabilities, these indicators have been further disaggregated into 27 detailed components (refer to Appendix Table A1). Utilizing Stata software, we applied principal component analysis to quantify the trade facilitation scores, ensuring robust scientific rigor. The data for this analysis were sourced from the Global Competitiveness Report (GCR) and the World Bank, covering the years 2009 to 2022.
Firstly, infrastructure—covering rail networks, ports, aviation, and transportation systems—significantly influences trade development and efficiency by affecting transport times and costs (Tan and Hua, 2016). Secondly, the regulatory environment, including policy stability and legal frameworks, directly shapes the allocation of economic activities within the market (Xie and Yue, 2011). This environment impacts supply and demand decisions and is linked to intellectual property protections, government transparency, legal rights, and corruption control.
The economic landscape includes indicators like market size, economic stability, industrial development, openness to trade, and the quality of financial services, which gauge the host nation’s economic climate. Furthermore, indicators such as taxation policies, labor market dynamics, and the efficacy of public policy implementation provide insights into the quality of public services and the business environment (Cui and Huang, 2016). Finally, perspectives on the application of information technology, workforce quality, and investments in research and development (R&D) highlight the trade potential and technological innovation capabilities of the host country.
3.2 Modeling the impact of trade facilitation on China’s agriculture import and export trade
The study constructs the frontier level of stochastic frontier gravity for foreign trade by:
where represents China’s total agricultural trade with the (i)th BRICS country in period (t); comprises a series of explanatory variables influencing the efficiency of China’s agricultural trade; are a parameter to be estimated; and represents an external random shock.
Under the influence of trade resistance , real trade is:
Taking logarithms on both sides of Equation 2 simultaneously gives the basic linear form of the stochastic frontier trade model, leading to Equation 3:
and are independent of each other and both are independent of , and is a randomized perturbation term, , ), . The non-negative setting indicates that the factors affecting trade efficiency are dominated by factors hindering trade, which follow a truncated one-sided normal distribution, , ).
To assess the alignment of the study population with the stochastic frontier gravity model, two prevalent methods are employed: the gamma test (γ-test), which evaluates the proportion of the technical inefficiency term within the error term, and the generalized likelihood ratio test (LR test). A γ value approaching 1 indicates a significant impact of technical inefficiency on the model’s outcomes, justifying the incorporation of a trade inefficiency term. The foundational principles of these methods are outlined in Equations 4, 5:
According to Equations 1, 2 measures the trade efficiency index of China’s trade with country i of the BRICS countries in period t as the efficiency of China’s trade with country t in period i, as shown in Equation 6:
Earlier stochastic frontier model settings assumed that the trade inefficiency term was invariant over time, a perspective that overlooks the dynamic nature of efficiency levels. In contrast, this study adopts the frameworks proposed by Jondrow et al. (1982) and Cornwell et al. (1990), incorporating time-varying factors into the stochastic frontier gravity model, as detailed in Equation 7:
Where T denotes the number of observation periods, which is the base period for comparing whether or not trade efficiency has changed, and is a time-varying term reflecting the rate of change in trade efficiency losses =0, trade “inefficiency” does not change over time, that is, technical inefficiency is not related to T; >0, trade “inefficiency” decreases, that is, trade efficiency is increasing; <0, trade “inefficiency” increases, i.e., the trade efficiency is decreased.
In pursuit of a deeper understanding of the impact exerted by the random disturbance term on the trade efficiency between China and the BRICS countries, this study incorporates the approach established by Battese and Coelli (1995). It utilizes the ‘one-step method’ for model estimation, detailed in the expressions below in Equation 8:
where denotes the exogenous variable of trade inefficiency, is the parameter variable to be estimated, and is the random perturbation term.
3.3 Econometric model and data description
The objective of this paper is to study the impact of five aspects of trade facilitation indicators on trade efficiency. The model is based on the time-varying stochastic frontier gravity model discussed in the previous theoretical section. This model not only estimates the frontier facet influences and the inefficiency term at the same time, but also estimate the impact of each inefficiency factor on . It calculates the actual trade volume, accounting for technical inefficiency, and the optimal trade volume in the absence of technical inefficiency. Trade efficiency is then determined by the ratio of these two volumes.
Building upon the foundational model setup, this study conducts a regression analysis of China’s agricultural import and export trade using a time-varying stochastic frontier gravity model. The econometric model constructed for this analysis is as follows, as shown in Equation 9:
In this study, “i” represents BRICS countries and “t” represents the year “ ” denotes China’s total trade in agricultural products. GDP signifies the gross domestic product of BRICS nations, while CGDP denotes China’s gross domestic product, serving to gauge the overall size of each economy. Per capita gross domestic product (PGDP) reflects economic development and standards of living within the population. Total population (POP) measures the labor market of the host country, while geographical distance (Dist), computed as the straight-line distance from China to the capitals of BRICS countries (CEPII), is adjusted by international oil prices. Exchange Rate (RATE) captures currency fluctuations. Data sources include the United Nations Trade Database, World Bank, WDI Database, and French CEPII Database.
Several key considerations guide the selection of explanatory variables. Firstly, GDP is chosen as an explanatory variable due to its role in facilitating economies of scale and scope in bilateral trade. A larger market size in the host country is believed to enhance trade advantages (Bin and Mingzhong, 2004; Sun and Ni, 2013). Secondly, the total population is selected because a larger labor force can potentially lower labor costs and attract foreign direct investment (FDI) (Buckley, 2009), which is crucial for sustaining China’s economic growth and securing natural resource supplies. Thirdly, geographic distance is included as an explanatory variable because distance costs, influenced by international shipping rates, vary dynamically. To address the fixed-effects model’s limitations in identifying individual fixed effects, bilateral distance is adjusted by multiplying it with international oil prices as a proxy for distance costs (Jiang and Zhang, 2011). Lastly, exchange rates are incorporated because fluctuations in the RMB’s real exchange rate significantly impact imports and exports. Establishing Free Trade Agreements (FTAs) between China and other countries helps mitigate these impacts on exports (Lu and Dai, 2005; Yang and Du, 2015).
Due to significant disparities in national conditions among the BRICS countries, China’s trade efficiency with these nations varies markedly. Therefore, this study meticulously considers non-efficiency factors affecting China’s trade performance in these countries and regions. It analyzes their impact on trade efficiency through the lens of trade facilitation, focusing on five key indicators. These include for infrastructure, assessing a country’s transportation capabilities and associated costs; for the regulatory environment, crucial for trade governance; for economic conditions, reflecting a country’s economic strength and trade potential; for the business environment, indicating economic competitiveness; and for technological research and development, measuring a nation’s future trade capacity. Thus, a technological inefficiency model is formulated as shown in Equation 10:
where is the technical inefficiency factor constant term and (0 < i < 10) is the coefficient of the explanatory variable of interest.
4 Results and discussion
4.1 Measurement of trade facilitation levels and analysis of results
This study employs principal component analysis (PCA) to evaluate the levels of trade facilitation across BRICS countries. Initially, as shown in Appendix Table A1, the indicator system includes both positive and negative metrics, resulting in some scoring ambiguities beyond the 1–7 range. To facilitate comparative analysis, all negative indicators are inverted to align with positive influences. Subsequently, second-level indicators are normalized to a 0–1 scale using linear transformation methods. The Kaiser-Meyer-Olkin (KMO) test and Bartlett’s test of sphericity are then conducted. A KMO result exceeding 0.6 indicates suitability for principal component analysis, while a p-value below 0.05 confirms inter-indicator correlations, which supports effective dimensionality reduction. Table 1 results demonstrate strong correlations among the selected indicators, affirming their compatibility with the principal component analysis method. Finally, principal components are derived from the 27 third-level indicators based on eigenvalues greater than 1, establishing the trade facilitation rankings among BRICS countries.
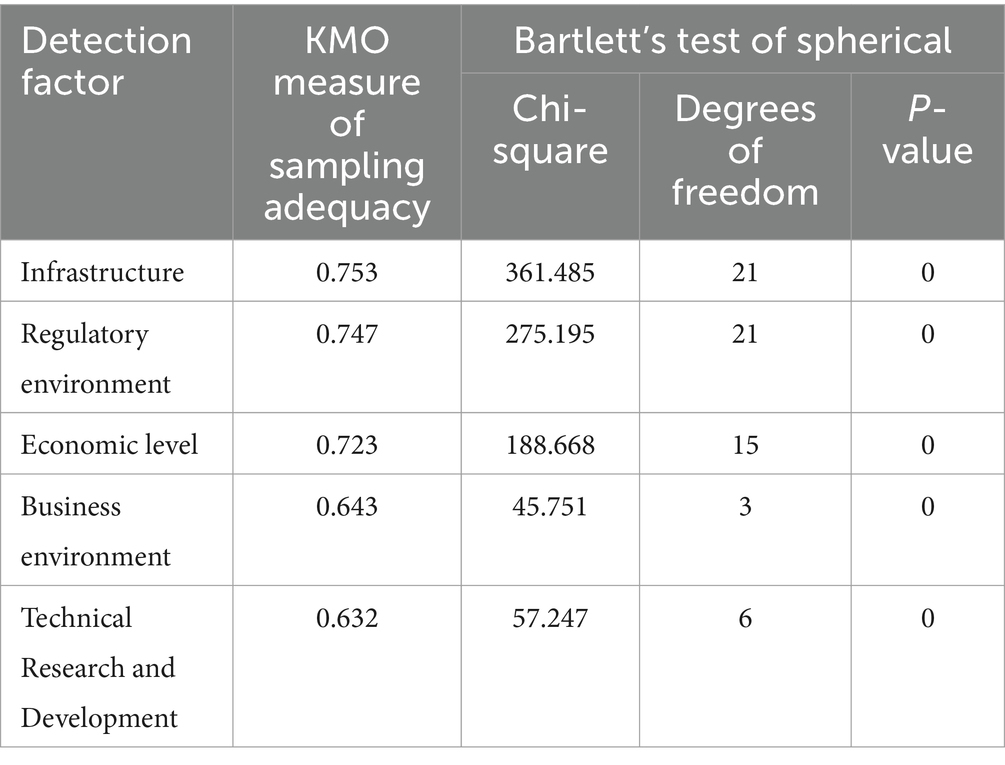
Table 1. Results of KMO test and Bartlett’s test of spherical.
To comprehensively assess the trade facilitation status of a country or region, the trade facilitation scores are categorized into four tiers: scores above 0.8 indicate a very high level of trade facilitation, while scores between 0.7 and 0.8 suggest a high level. Scores ranging from 0.5 to 0.7 indicate a relatively facilitated level, and scores below 0.5 denote an average level of facilitation (Liu and Zhao, 2021). This study specifically examines the outcomes and rankings of trade facilitation measures across BRICS countries for the years 2013, 2018, and 2022, including their respective mean values (see Appendix Table A2).
In terms of overall levels of trade facilitation, between 2009 and 2022, two countries achieved an average trade facilitation index of 0.8, one country fell within the range of 0.5–0.7, and six countries scored below 0.5. These findings suggest that the average trade facilitation score across BRICS countries remains relatively modest, indicating a generally suboptimal level. Specific country rankings are as follows in descending order: United Arab Emirates, Saudi Arabia, Russia, South Africa, Egypt, Iran, Brazil, India, and Ethiopia. These results underscore a noticeable correlation between a country’s level of trade facilitation and its economic development.
From a temporal perspective, Saudi Arabia has shown a declining trend in trade facilitation since 2013, plummeting to as low as 0.31 in 2022, highlighting significant potential for improvement. In 2019, China and Saudi Arabia embarked on deepening industrial collaboration under the “Belt and Road Initiative” and Saudi Arabia’s “Vision 2030,” pledging to advance the China-GCC Free Trade Area. This partnership involves not only industrial engagement but also commits both nations to enhancing trade and pursuing traditional cooperation, thereby jointly promoting the establishment of the China-GCC Free Trade Zone. The anticipated completion of the China-Pakistan Economic Corridor is expected to boost interactions between China and Saudi Arabia, facilitating the swift transportation of agricultural products between the two countries. Meanwhile, the levels of trade facilitation in the United Arab Emirates and Russia have shown a consistent upward trajectory, particularly noteworthy in the UAE, where it soared to 5.43 in 2022, underscoring its high facilitation standards and securing its leading position. According to China’s customs data, trade in agricultural products between China and the UAE initially declined but surged significantly from 2018, reaching a total value of US$1.42 billion in 2022, a 50.2% increase from 2018. Despite pandemic challenges, China-Russia agricultural trade hit record highs in 2020, driven by the establishment of stable trade channels and robust demand in China’s domestic market. South Africa, an important player in African economic dynamics, maintained a favorable trade environment between 2009 and 2015. However, trade facilitation dropped from 0.46 in 2015 to 0.31 in 2016 due to economic recession, increased government debt, and capital flight during that period.
4.2 Empirical analysis of trade facilitation on China’s import and export trade of agricultural products
In this section, the Frontier 4.1 software is employed to organize panel data using the aforementioned research methods and to regress sample observations through several systematic steps. Initially, the model’s applicability is tested, and the necessity of introducing time-varying factors and technical inefficiency factors is assessed. Subsequently, synchronized time-varying stochastic frontier analysis and technical inefficiency analysis are conducted for the relevant countries. This aims to identify the influencing factors of variables affecting China’s trade in agricultural products with each host country, pinpoint specific technical inefficiency factors that disrupt trade efficiency, and gauge their impact on trade deviations. Finally, the efficiency and potential analysis is executed to ascertain China’s trade efficiency with BRICS countries and its distinctive performance characteristics. This analysis assesses changes in efficiency levels to discern shifts in time-varying factors within the model, alongside the potential space for expansion despite impediments posed by technical inefficiencies.
This section involves the organization of panel data and the execution of regression analysis on sample observations using the aforementioned research methodology, following a systematic progression through several key stages. The initial phase involves a thorough evaluation of the model’s suitability, including an assessment of the need to incorporate time-varying factors and technical inefficiency variables. Subsequently, upon confirming the model’s applicability, synchronized time-varying stochastic frontier analysis and technical inefficiency analysis are conducted across relevant countries. This stage seeks to discern the variables influencing China’s agricultural trade with each host country, pinpoint specific technical inefficiencies affecting trade efficiency, and assess their impact on trade deviations. The final phase entails a comprehensive analysis of trade efficiency and potential, evaluating the trade efficiency between China and the host nations, particularly those within the BRICS group. This analysis examines efficiency levels, and performance characteristics, and evaluates how time-varying and technical inefficiency factors influence changes in efficiency, as well as exploring potential trade opportunities and avenues for expansion in each country.
4.2.1 Model applicability test
The stochastic frontier gravity model imposes rigorous conditions for its application, with the generalized likelihood ratio (LR) test serving as a pivotal tool to validate its suitability, assess temporal variations, and justify variable selection. Table 2 presents the findings, showing that the LR statistic, testing the null hypothesis of no technical inefficiency term, yields 8.225612.
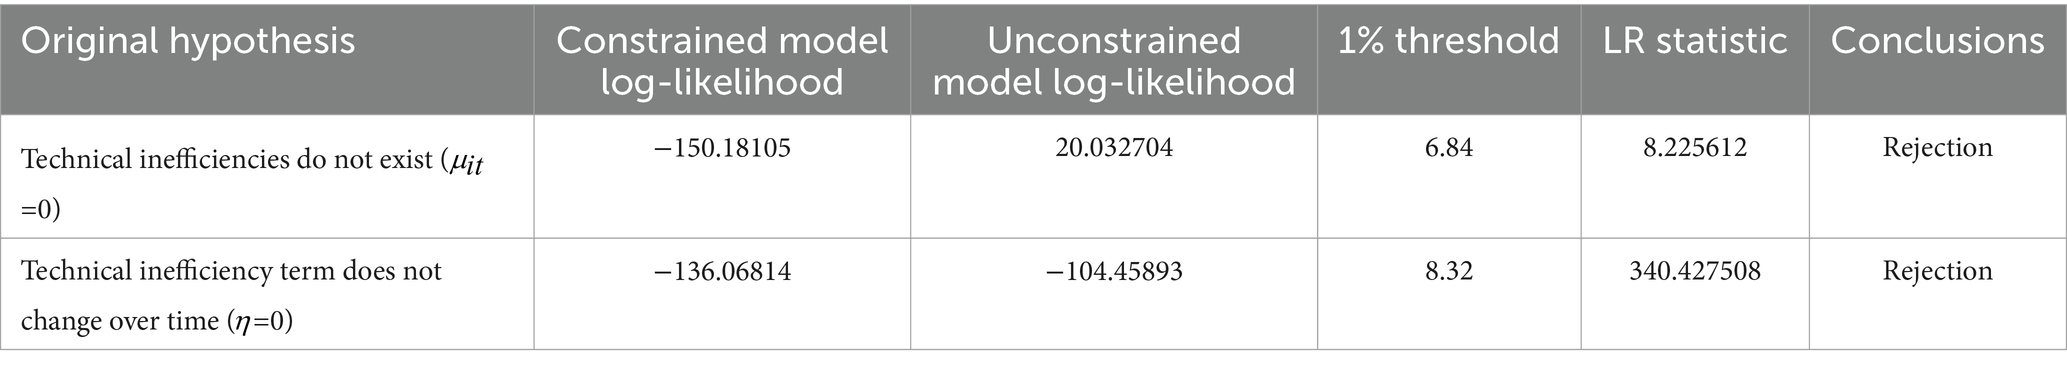
Table 2. Test of model applicability results.
This hypothesis is firmly rejected at the 1% significance level, confirming the model’s suitability for the trade gravity equation. Additionally, the LR statistic for testing the hypothesis that “the technical inefficiency term remains constant over time” is 340.427508, surpassing the 1% significance threshold. This outcome underscores the dynamic nature of the technical inefficiency term across time.
4.2.2 Time-varying stochastic frontier gravity mode regression results
Based on the validated applicability depicted in Table 2, this study proceeds to estimate the stochastic frontier gravity model for China’s agricultural trade with BRICS countries from 2009 to 2022. Employing both time-varying and time-invariant models, panel data analysis yields regression coefficients for each explanatory variable, detailed comprehensively in Table 3.
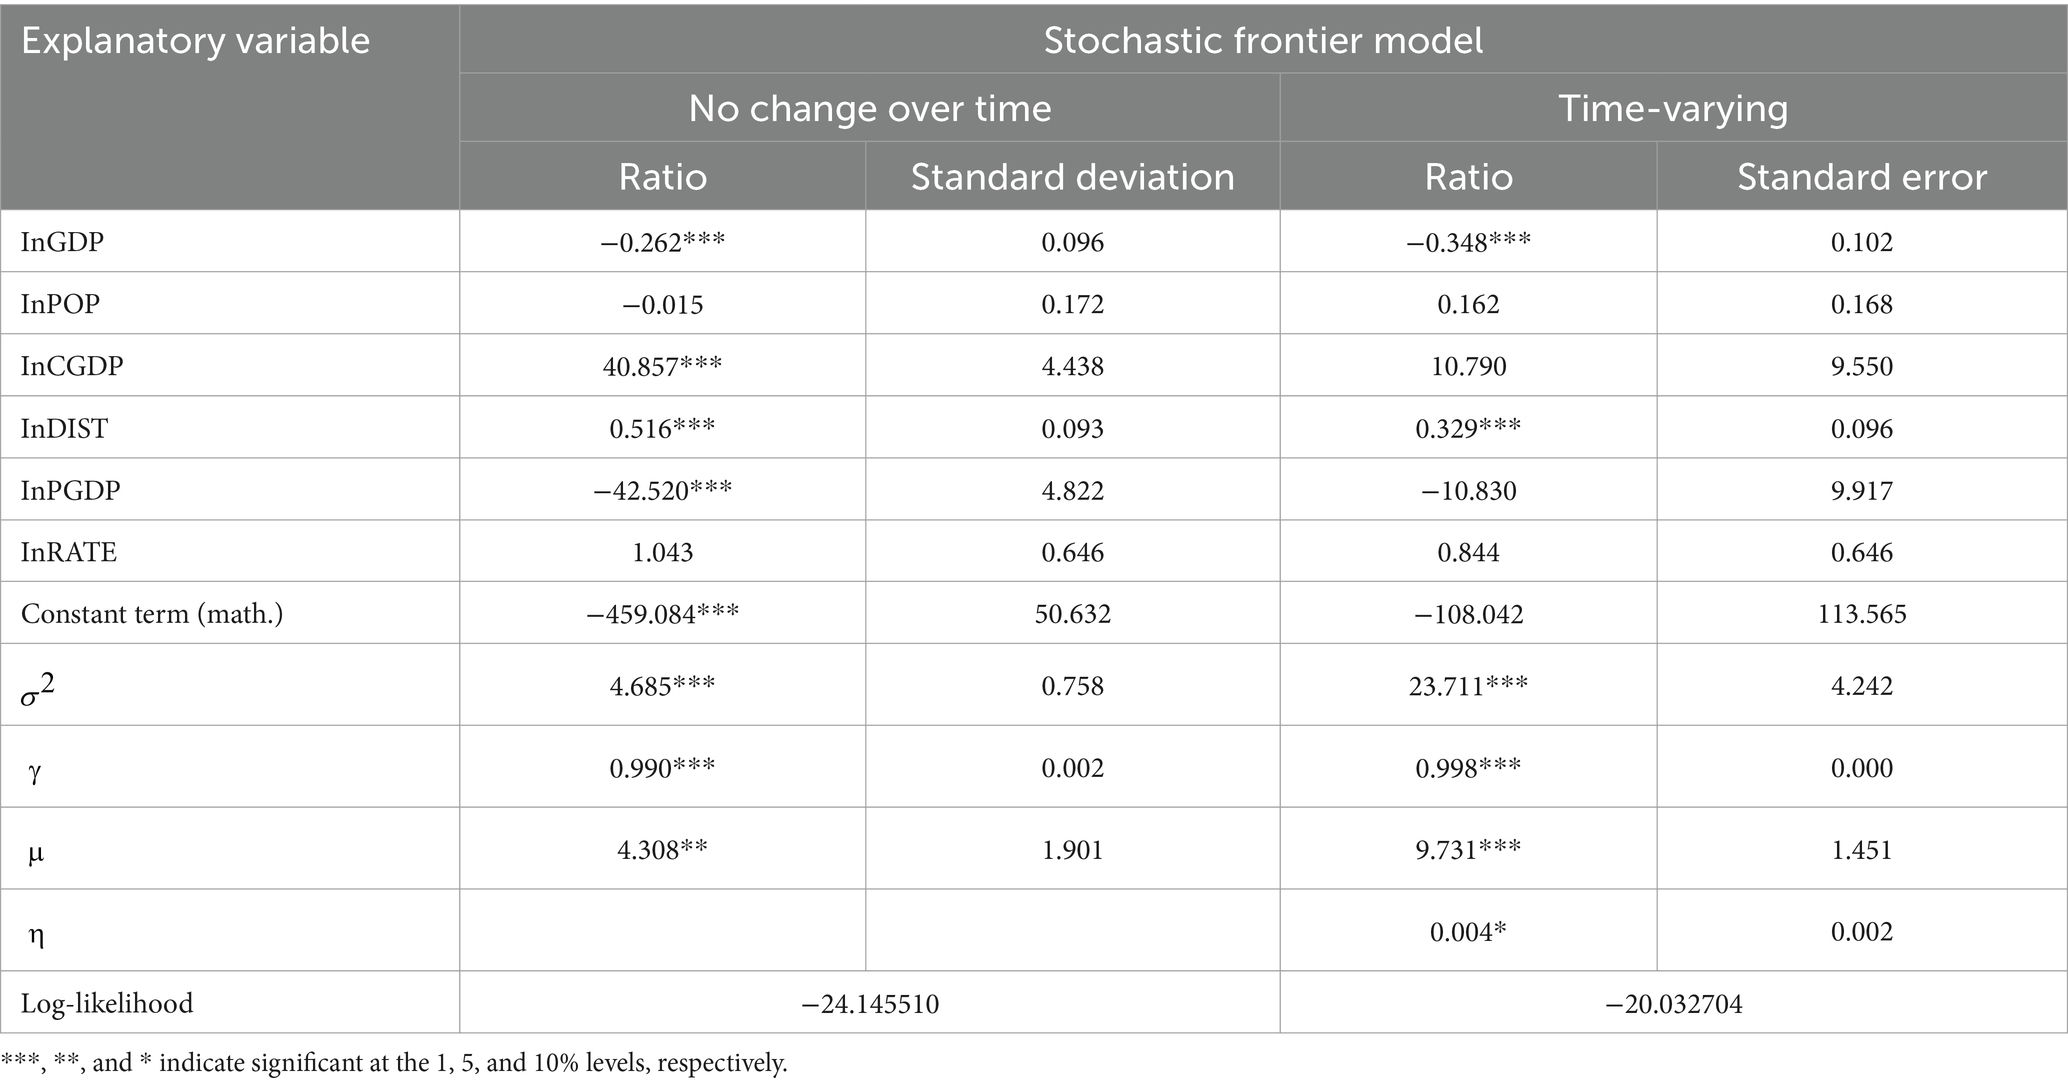
Table 3. Stochastic frontier gravity model estimation results.
The outcomes from the time-varying model reveal a significant , underscoring the variability of the trade inefficiency term over time and reinforcing the superiority of the time-varying model over its time-invariant counterpart. Moreover, the positive coefficient of suggests a decline in trade inefficiency over time. In the analysis presented, a 1% significance level is consistently used as the critical threshold for conducting T-tests on all relevant variables.
The results reveal that GDP plays a significant role, highlighting how the economic scale of the host country constrains China’s agricultural trade potential in imports and exports. This constraint can be attributed to emerging trade barriers, elevated living standards in affluent nations, and heightened concerns over health and safety, which steer preferences toward diversified agricultural products. Moreover, China’s trade composition, predominantly focused on primary products, fails to fully align with the diverse needs of high-income countries.
The significance of PGDP remains elusive, with its negative coefficient implying that Chinese firms prioritize trade with countries offering lower labor costs and ample land resources over those with advanced economies and consumer markets. Moreover, higher per capita GDP in the host country is associated with escalated labor costs, potentially creating financial bottlenecks. This observation resonates with Lewis (1958) contention that demographic growth and labor costs are pivotal considerations in industrial relocation.
POP did not meet the significance threshold, indicating that the caliber of the labor force in the host nation, rather than its developmental stage or sheer size, is the primary magnet for China’s import and export activities. Conversely, DIST significantly influences trade flows, aligning with theoretical expectations and underscoring the role of transportation costs—symbolized by distance—as a critical factor in China’s agricultural trade.
Finally, γsymbolizes the magnitude of trade inefficiency within the stochastic disturbance term, reaching 0.990 and 0.998 in the time-invariant and time-varying models, respectively. These figures underscore a substantial disparity between actual trade levels and potential, primarily attributable to inefficiencies in trade operations. Subsequent analysis of the trade inefficiency model delves deeper into the factors influencing these inefficiencies.
4.2.3 Empirical results analysis of technological inefficiency model
To substantiate the hypothesis further, the technical inefficiency model was introduced to assess the impact of infrastructure, regulatory environment, economic level, business environment, and technological research and development on China’s agricultural import and export trade. Table 4 presents the regression coefficients and T-values of the technological inefficiency variables affecting China’s agricultural trade with BRICS countries. Notably, the coefficient nearing 0.999 approaches unity, underscoring the substantial interference of technical inefficiencies in China’s agricultural trade beyond the random error’s stochastic process. This highlights the validity of integrating the technical inefficiency model into the stochastic frontier gravity model.
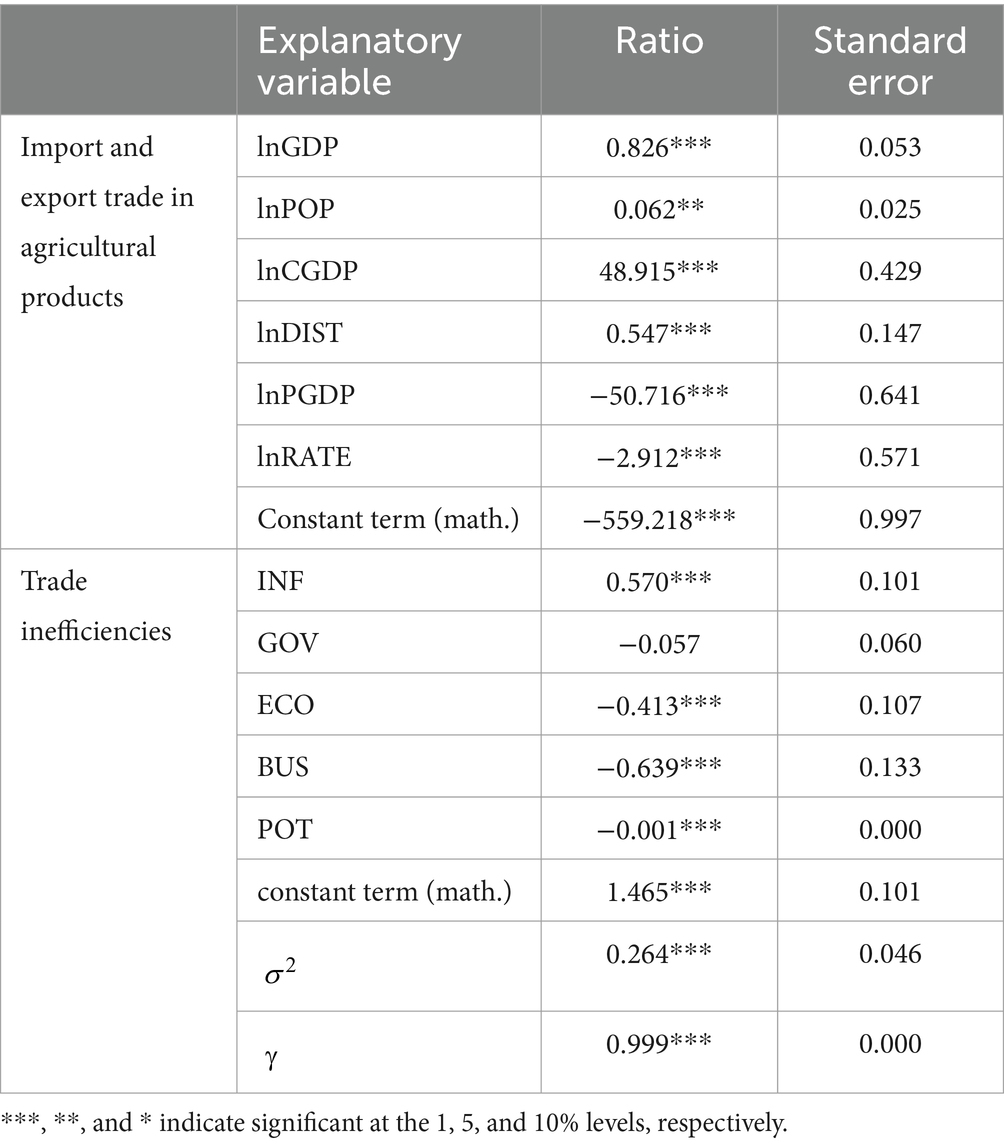
Table 4. Inefficiency model estimation results.
Based on the regression findings, the following conclusions can be inferred:
exerts a notable and positive influence, indicating that advancements in infrastructure development paradoxically diminish the efficiency of China’s agricultural trade with BRICS countries. This phenomenon arises because as trade infrastructure expands, BRICS nations are inclined to diversify their imports and exports of agricultural goods across a broader spectrum of countries. Simultaneously, improvements in domestic transportation infrastructure streamline the internal distribution of agricultural products, thereby altering the dynamics of China’s agricultural trade with BRICS countries.
The variable exhibits insignificance with a negative coefficient, suggesting it holds little sway over agricultural trade among BRICS nations. This trend may stem from political instability and governmental turbulence within the BRICS cohort. China’s agricultural trade preferences within BRICS lean toward nations characterized by efficient governance, transparent operational frameworks, minimal interference in business activities, and robust institutional support. Thus, these non-significant outcomes align with the conclusions drawn by Kang and Jiang (2012), underscoring opportunities for broadening China’s agricultural trade footprint within the BRICS framework.
The variable exhibits a notable negative effect, underscoring the impact of the host country’s economic stature on BRICS trade efficiency. A policy environment that favors open trade, coupled with liberal economic policies and strong financial systems, bolsters a nation’s ability to navigate trade complexities effectively, thereby optimizing efficiency and fostering enhanced trade potential.
The significant negative effect observed in suggests that these initiatives promote bilateral trade expansion. Technological innovations elevate product competitiveness in global trade by advancing production and product technologies. Moreover, they refine trade structures by augmenting the prevalence of high-value and high-technology goods, thereby enhancing trade efficiency and effectiveness through the widespread adoption of e-commerce and associated technologies. Consequently, this fosters industrial upgrades, deepens the international division of labor, and facilitates international trade development built upon this division.
4.2.4 Analysis of trade efficiency and potential
The average efficiency of China’s agricultural trade with BRICS nations from 2009 to 2022 is relatively low at 0.286, indicating substantial potential for improvement. A notable decline began in 2013, coinciding with the initiation of the “Belt and Road Initiative,” which shifted trade focus toward countries along the route. This redirection had a moderate impact on BRICS nations, resulting in decreased trade efficiency. However, the subsequent increase in efficiency after 2019 can be attributed to China assuming the BRICS presidency in 2017. This initiative solidified a multifaceted cooperation framework encompassing economics, trade, finance, political security, and cultural exchanges, underpinned by the “BRICS+” model. The “BRICS+” cooperation paradigm has laid a robust groundwork for bilateral trade, enabling China to seize opportunities to enhance the efficiency of agricultural product trade with BRICS nations. As of July 2023, China’s trade with BRICS nations reached 2.38 trillion yuan, reflecting a 19.1% year-on-year increase and accounting for 10.1% of China’s total foreign trade, a rise of 1.6 percentage points. Exports amounted to 1.23 trillion yuan, up by 23.9%, while imports totaled 1.15 trillion yuan, marking a 14.3% increase, indicating sustained rapid growth in trade efficiency.
Moreover, the efficiency of China’s agricultural trade with BRICS nations and their affiliates varies significantly by country, with Russia leading in average efficiency, followed by Brazil, India, South Africa, Egypt, Ethiopia, the United Arab Emirates, Saudi Arabia, and Iran. According to the World Bank’s 2022 classification, the United Arab Emirates and Saudi Arabia are categorized as high-income countries; Russia, Brazil, and South Africa as upper-middle-income countries; Egypt, India, and Iran as lower-middle-income countries; and Ethiopia is classified as a low-income country. These findings highlight a strong correlation between trade efficiency and a nation’s economic scale (refer to Appendix Table A3).
However, among them, the United Arab Emirates (UAE) and Saudi Arabia exhibit inefficiencies in trade. Firstly, the UAE relies heavily on imports to meet its food requirements, particularly cereals and related products, likely due to climatic and soil conditions. Despite being a significant global food exporter, data from the United Nations Trade Database does not list the UAE among the major sources of food (especially cereals) imports. Secondly, with a per capita GDP reaching $47,700 in 2022, the UAE surpasses the economic development levels of many European and U.S. regions. As a high-income economy, the UAE predominantly demands high-quality agricultural imports. Overall, China’s agricultural export structure remains focused on primary products, leveraging natural resources and cost advantages. Geographical constraints contribute to lengthy and costly logistics and transportation times between China and the UAE, particularly affecting the export of perishable agricultural goods, whose quality assurance is challenging without robust logistics infrastructure. Furthermore, the UAE’s fluctuating tariffs and tax policies further complicate agricultural exports from China.
The low efficiency in trade with Saudi Arabia can be attributed to the fact that agricultural exchanges between the two nations constitute a mere 0.17% of China’s total agricultural trade volume, highlighting the limited scale of bilateral agricultural commerce and China’s modest market share in Saudi Arabia. As a substantial importer of agricultural products, Saudi Arabia predominantly imports fruits from countries such as Egypt, Ireland, and South Africa, whereas China’s fruit exports rank significantly lower, holding the 19th position as of 2021. Despite being the leading source of vegetable imports in 2021, China only accounted for 11% of Saudi Arabia’s total vegetable imports. The scope of agricultural goods exchanged between these countries remains narrow and predominantly low in value; China’s imports from Saudi Arabia mainly comprise shrimp, while its exports primarily include vegetables, fruits, and other basic commodities. There exists considerable potential for augmenting the extent of trade between China and Saudi Arabia.
According to the equation used to compute trade efficiency, trade potential is calculated by dividing the actual trade volume by trade efficiency. Similarly, the equation for expandable trade space is articulated as “[(export potential/actual export volume)-1] × 100%.” Based on data from 2022, the potential and expansibility of China’s agricultural trade with BRICS countries were computed, as presented in Appendix Table A4. The analysis reveals that China’s agricultural trade efficiency with South Africa, Egypt, Iran, and Saudi Arabia is notably suboptimal, with significant untapped trade potential. In terms of actual trade volume in 2022, Brazil, India, and Russia led sequentially among the original BRICS members, underscoring the efficacy of their trade policies. Regarding trade potential, Brazil, South Africa, and India ranked highest in 2022, emphasizing their robust demand for agricultural goods and extensive trade capacity. Brazil, as a primary export destination, exhibits significantly greater trade potential and advantages compared to other nations. Following are Ethiopia, the United Arab Emirates, and Iran, indicating China’s limited agricultural trade demand with these countries. In terms of expandable trade space, Saudi Arabia, South Africa, and Iran had the highest figures in 2022, at $1.768 billion, $1.688 billion, and $1.661 billion, respectively. This suggests considerable opportunities for expanding agricultural trade with these partners. Conversely, Brazil, Russia, and the United Arab Emirates ranked lowest at $41 million, $99 million, and $173 million, respectively, indicating relatively limited prospects for agricultural trade expansion with China. To maximize trade opportunities, it is crucial to stabilize trade volumes while continually optimizing trade structures and enhancing technological sophistication and value addition in commodities. This approach will help unlock new avenues for expanding trade.
4.2.5 Robustness tests
Considering the potential bidirectional causality between the explanatory variables—namely infrastructure, regulatory environment, economic level, business environment, and technological research and development—and agricultural trade, we address this issue by employing first-order lagged terms of these variables as instrumental variables for a robustness test (Sha et al., 2020). Our findings reveal that the sign and significance of the coefficients for the main explanatory variables remain largely unchanged compared to the benchmark regression model. This consistency indicates that the estimation results presented in this paper are both robust and reliable (Table 5).
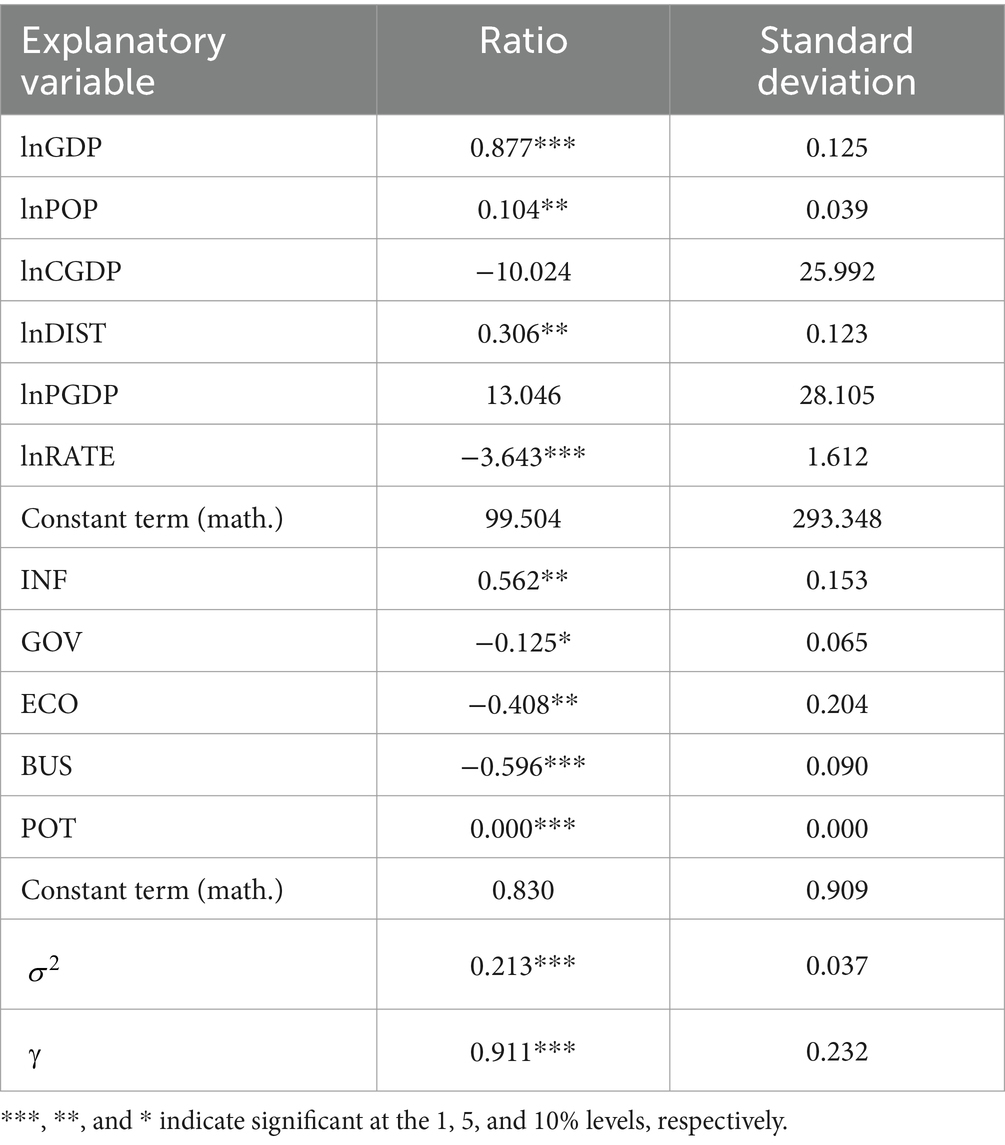
Table 5. Robustness test results.
5 Conclusion
The preceding discussion yields the following conclusions. First, there is a significant disparity in trade facilitation levels among the BRICS countries, ranked as follows: United Arab Emirates, Saudi Arabia, Russia, South Africa, Egypt, Iran, Brazil, India, and Ethiopia. Second, the empirical results from the time-varying model demonstrate that the gross domestic product (GDP) of BRICS member countries and the distance between their capitals significantly hinder the import and export of China’s agricultural products. This indicates that China’s current trade infrastructure is insufficient to meet the demands of high-income countries. Additionally, transportation costs, as represented by distance, are a critical factor in China’s agricultural trade. Conversely, factors such as total population, China’s GDP, the host country’s per capita GDP, and exchange rates have no significant impact on the import and export of China’s agricultural products. Consistent with (Lewis, 1958), higher per capita GDP in the host country correlates with higher labor costs and a greater likelihood of labor cost constraints. Third, the trade inefficiency model results show that economic level, business environment, and technological research and development have significant negative effects on the import and export efficiency of China’s agricultural products, suggesting these factors enhance trade efficiency. Smooth financing channels, a free business environment, and a sound industrial structure are beneficial for a country to cope with complex trade risks and uncertainties, reduce losses in trade efficiency, and tap into greater trade potential. Unlike previous studies, infrastructure has a significant positive effect on agricultural trade efficiency. This may be because more comprehensive infrastructure increases the likelihood of BRICS countries importing and exporting agricultural products. At the same time, the more complete China’s transportation infrastructure is, the more favorable it is for domestic agricultural product circulation, which in turn affects the import and export trade of agricultural products between China and BRICS countries. The regulatory environment, however, does not significantly impact the import and export of agricultural products in China, which is consistent with the research findings of Kang and Jiang (2012).
As a final point, the empirical results regarding trade efficiency and potential reveal that BRICS countries hold substantial opportunities for agricultural product import and export trade with China. Russia exhibits the highest average trade efficiency, followed by Brazil, India, South Africa, Egypt, Ethiopia, the United Arab Emirates, Saudi Arabia, and Iran. This pattern indicates a strong correlation between trade efficiency and a country’s economic size. However, significant variations in trade potential and expansion space among BRICS members arise due to differences in economic development levels and the categories of agricultural products traded.
Based on our findings, it is recommended that governments of participating countries prioritize economic status, the business environment, and advancements in technology. Specifically, it is essential to leverage resource endowment advantages, support the import of advanced equipment and technology, and systematically expand the import of scarce agricultural products. Furthermore, optimizing the structure of agricultural product import and export trade, and enriching domestic consumer market choices should be emphasized. Continuously improving trade efficiency, promoting diversified trade markets, and enhancing the trade potential of BRICS countries is crucial for effectively exploring trade expansion opportunities. This study presents a new approach to assessing trade facilitation within the expanded BRICS framework, which may apply to other contexts. However, the study is not without limitations, such as incomplete data and potential biases in variable selection that could influence the results. Future research should focus on refining the trade facilitation indicator system and exploring the implications of our model, particularly in the context of the competitive dynamics of BRICS countries in global agricultural markets.
Data availability statement
The raw data supporting the conclusions of this article will be made available by the authors, without undue reservation.
Author contributions
GX: Writing – original draft, Writing – review & editing, Conceptualization, Data curation, Investigation, Methodology, Software. HK: Writing – original draft, Writing – review & editing, Methodology, Validation. XL: Funding acquisition, Resources, Supervision, Writing – review & editing.
Funding
The author(s) declare financial support was received for the research, authorship, and/or publication of this article. This study was funded by The Agricultural Science and Technology Innovation Program (10-IAED-02-2024).
Conflict of interest
The authors declare that the research was conducted in the absence of any commercial or financial relationships that could be construed as a potential conflict of interest.
Publisher’s note
All claims expressed in this article are solely those of the authors and do not necessarily represent those of their affiliated organizations, or those of the publisher, the editors and the reviewers. Any product that may be evaluated in this article, or claim that may be made by its manufacturer, is not guaranteed or endorsed by the publisher.
Supplementary material
The Supplementary material for this article can be found online at: https://www.frontiersin.org/articles/10.3389/fsufs.2024.1397350/full#supplementary-material
References
Anderson, K. (1990). Changing comparative advantages in China: effects on food, feed and fibre markets.
APEC (2002). Trade facilitation: a development perspective in the Asia Pacific region. Asia Pacific Economic Cooperation
Battese, G. E., and Coelli, T. J. (1995). A model for technical inefficiency effects in a stochastic frontier production function for panel data. Empir. Econ. 20, 325–332. doi: 10.1007/BF01205442
Bin, S., and Mingzhong, L. (2004). China's trade flows and export potential: gravity model. World Econ. 2, 3–12.
Chen, W., Liao, S., Wang, Y., and Li, Y. (2023). Importance, implementation path, and suggestions of deepening economic collaboration system construction in BRICS countries. Russian Stud. 6, 20–44.
Cornwell, C., Schmidt, P., and Sickles, R. C. (1990). Production frontiers with cross-sectional and time-series variation in efficiency levels. J. Econ. 46, 185–200. doi: 10.1016/0304-4076(90)90054-W
Cui, R., and Huang, Y. (2016). Research on evaluation indicator system of trade and investment facilitation in countries along the “belt and road”. Int. Trade Issues 9, 153–164. doi: 10.13510/j.cnki.jit.2016.09.014
De Brauw, A., Huang, J., and Rozelle, S. (2004). The sequencing of reform policies in China's agricultural transition. Econ. Transit. 12, 427–465. doi: 10.1111/j.0967-0750.2004.00188.x
Djankov, S., Freund, C., and Pham, C. (2010). Trading on time 'The review of economics and statistics February, The Review of Economics and Statistics. 92.
Dong, L., and Gao, Q. (2020). Trade facilitation, neighborhood effects, and bilateral agricultural exports: an empirical study based on a spatial model of China and neighboring countries. World Agricultur, 4, 66–77. doi: 10.13856/j.cn11-1097/s.2020.04.008
Fan, H., Trinh Thi, V. H., Zhang, W., and Li, S. (2023). The influence of trade facilitation on agricultural product exports of China: empirical evidence from ASEAN countries. Econ. Res. Ekonomska istraživanja 36:2143845. doi: 10.1080/1331677X.2022.2143845
Feng, Y., and Zhang, Q. (2019). Trade facilitation measurement report of the six economic corridors of the "belt and road" (2013-2018). People's Forum Acad. Front. 19, 64–91. doi: 10.16619/j.cnki.rmltxsqy.2019.19.009
Francois, J., and Manchin, M. (2013). Institutions, infrastructure, and trade. World Dev. 46, 165–175. doi: 10.1016/j.worlddev.2013.02.009
Fu, J., Chen, L., and Xue, H. (2023). The impacts of trade facilitation provisions on fresh agricultural products trade between China and the BRI countries. Agriculture 13:272. doi: 10.3390/agriculture13020272
Geng, Y. (2009). Competitiveness analysis of Brazilian agricultural products in the Chinese market. China Rural Econ. 1, 31–38.
Guo, J., and Wu, L. (2015). The impact of trade facilitation in Northeast Asia on China's agricultural exports. World Agric. 5:203. doi: 10.13856/j.cn11-1097/s.2015.05.003
Hertel, T. W., Walmsley, T., and Itakura, K. (2001). Dynamic effects of the “new age” free trade agreement between Japan and Singapore. J. Econ. Integr., 446–484. doi: 10.11130/jei.2001.16.4.446
Jiang, D., and Zhang, Q. (2011). Gravity modeling analysis of U.S. direct investment in China. Global Econ. 34, 26–41.
Jondrow, J., Lovell, C. K., Materov, I. S., and Schmidt, P. (1982). On the estimation of technical inefficiency in the stochastic frontier production function model. J. Econ. 19, –238.
Kang, Y., and Jiang, F. (2012). FDI location choice of Chinese multinationals in East and Southeast Asia: traditional economic factors and institutional perspective. J. World Bus. 47, 45–53. doi: 10.1016/j.jwb.2010.10.019
Khan, H., and Chen, Y. (2024). Identifying the potential trade opportunities in the vegetable market between China and Pakistan. Pakistan Journal of Agricultural Sciences (PAKJAS), 61, 417–428.
Khan, H., Chen, Y., and Lv, L. (2024). Does the China–Pakistan free trade agreement benefit the vegetable exports of Pakistan? A gravity estimation. Front. Sustain. Food Syst. 8:1362910. doi: 10.3389/fsufs.2024.1362910
Lewis, W. A. (1958). Unlimited labour: further notes. Manch. Sch. 26, 1–32. doi: 10.1111/j.1467-9957.1958.tb00922.x
Li, Y., and Chen, D. (2022). A study of the impact of trade facilitation on trade flows in the BRICS countries. Beijing Econ. Trade 9, 13–17.
Li, B., Duan, Y., and Peng, X. (2014). Measurement of trade facilitation and its impact on China's service trade exports: an empirical study based on cross-country panel data. Int. Bus. 1, 5–13. doi: 10.13509/j.cnki.ib.2014.01.001
Li, X., Jin, B., and Li, P. (2020). Analysis of influencing factors on trade facilitation between China and neighboring countries in Northeast Asia. Indus. Technol. Econ. 1, 87–93. doi: 10.3969/j.issn.1004-910X.2020.01.010
Li, Y., and Shuai, L. (2014). An empirical study on the influencing factors of border trade facilitation in Xinjiang, China. Int. Bus. 6, 38–48. doi: 10.13509/j.cnki.ib.2014.06.004
Liu, Y., and Zhao, X. (2021). Investment facilitation in central and Eastern Europe and its impact on China's outward FDI. Quant. Tech. Econ. Res. 1, 83–97. doi: 10.13653/j.cnki.jqte.2021.01.005
Lu, X., and Dai, G. (2005). The impact of fluctuations in the real exchange rate of the renminbi on China's imports and exports. Econ. Res. 5, 31–39.
Minghui, S. (2011). On the BRICS cooperation mechanism——in prospective of cooperation on trade facilitation. Pacific J. 10, 28–35. doi: 10.3969/j.issn.1004-8049.2011.10.004
Ramasamy, B., Yeung, M., Utoktham, C., and Duval, Y. (2017). Trade and trade facilitation along the belt and road initiative corridors. ARTNeT Working Paper Series, No. 172, November 2017, Bangkok, ESCAP.
Safaeimanesh, S., and Jenkins, G. P. (2020). Trade facilitation and its impacts on the economic welfare and sustainable development of the ECOWAS region. Sustain. For. 13:164. doi: 10.3390/su13010164
Sha, W., Qian, Y., and Cheng, X. (2020). Reassessment of the degree of RMB internationalization and research on its influencing factors. Res. Fin. Trade 12:19-35-84. doi: 10.19337/j.cnki.34-1093/f.2020.12.002
Sun, L., and Ni, K. (2013). The impact of ASEAN trade facilitation on China's agricultural exports and international comparison: an empirical analysis based on a panel data model. Int. Trade Issues 4, 139–147. doi: 10.13510/j.cnki.jit.2013.04.011
Tan, J., and Hua, X. (2016). Study on the impact of trade facilitation on China's agricultural product exports: an empirical analysis based on countries along the silk road. Int. Trade Issues 5, 39–49. doi: 10.13510/j.cnki.jit.2016.05.004
Wilson, J. S., Mann, C. L., and Otsuki, T. (2003). Trade facilitation and economic development: a new approach to quantifying the impact. World Bank Econ. Rev. 17, 367–389. doi: 10.1093/wber/lhg027
WTO (2014). Trade facilitation. Available at: https://wto.org/tradefacilitation (Accessed January 17, 2024).
WTO (2017). World Trade Organization. Available at: https://www.wto.org/english/res_e/booksp_e/anrep_e/anrep17_e.pdf (Accessed January 17, 2024).
Xiao-Jing, Z., and Liang, L. (2015). "One belt and one road" and China’s export trade in perspective of trade facilitation. Asia Pacific Econ. Rev.
Xie, J., and Yue, J. (2011). An empirical analysis of the impact of trade facilitation on China-ASEAN trade. World Econ. Res 8, 81–86.
Xu, X., Yuan, X., Wang, Y., Wang, C., Wang, L., Xu, F., et al. (2024). BRICS expansion: facts, challenges, and prospects. Int. Econ. Cooperat. 2:13-31, 91. doi: 10.20090/j.cnki.gjjh.2024.2.2
Yang, G., and Du, H. (2015). The impact of RMB exchange rate changes on China's export trade: a study based on the panel data of 79 countries and regions along the "belt and road" route. Economist 11, 43–50. doi: 10.16158/j.cnki.51-1312/f.2015.11.006
Yin, W., and Fan, Y. (2016). Characteristics of agricultural trade between China and other BRICS countries: competitive and complementary analysis. World Agric. 5, 97–109. doi: 10.13856/j.cn11-1097/s.2016.05.019
Zaki, C. (2014). An empirical assessment of the trade facilitation initiative: econometric evidence and global economic effects. World Trade Rev. 13, 103–130. doi: 10.1017/S1474745613000256
Zhang, X. (2015). Analysis of international trade pattern of agricultural products in BRICS countries. World Agric. 8, 57–68. doi: 10.13856/j.cn11-1097/s.2014.08.027
Zhang, S. (2018). Analysis of the impact of trade facilitation in BRICS countries on China's agricultural exports. Econ. Problem 4, 116–122. doi: 10.16011/j.cnki.jjwt.2018.04.019
Zhang, L. (2019). Measurement of trade facilitation level and its influencing factors along the "belt and road" route: a study sample of 22 countries along the route. Bus. Econ. 3, 145–153. doi: 10.13529/j.cnki.enterprise.economy.2019.03.018
Zhang, J., and Zhang, L. (2022). The impact of trade facilitation on China's export of poultry meat products: an empirical analysis based on 38 importing countries. China Food Nutr. 1, 29–33. doi: 10.19870/j.cnki.11-3716/ts.20210902.005
Zhang, G., and Zong, Y. (2018). Analysis of intra-industry trade in agricultural products between China and other BRICS countries and its influencing factors. Stat. Decisi Mak 9, 143–146. doi: 10.13546/j.cnki.tjyjc.2018.09.033
Zhao, P., and Mu, Y. (2018). Analysis of China's agricultural trade with other BRICS countries and its potential. Agric. Outlook 7, 75–82. doi: 10.3969/j.issn.1673-3908.2018.07.016
Zheng, W., Huang, J., Dong, J., and Xu, J. (2019). An empirical study on the impact of trade facilitation on China's livestock product exports in selected SCO countries: taking meat product exports as an example. Xinjiang Soc. Sci. 6, 46–51.
Zheng, Z., and Xi, Z. (2008a). The evaluating system of trade facilitation and its impact on China’s export. Int. Econ. Trade Res. 10, 4–9.
Zheng, Z., and Xi, Z. (2008b). Trade facilitation measurement system and the impact on China’s exports. Int. Econ. Trade Explor. 125, 4–9.
Zhong-Hai, C., and Pei-Lei, S. (2014). Research on the factors influencing the trade facilitation between China and neighboring countries in Central Asia. Commercial research. Commercial Research.
Zhou, L. (2024). Analysis of BRICS economic and trade cooperation dynamics and the construction of new industrial revolution partnership. Northeast Asian Econ. Res. 8, 107–120. doi: 10.19643/j.cnki.naer.2024.02.009
Zhuang, L., Zheng, X., and Zhong, N. (2015). Empirical analysis of agricultural export growth and competitiveness of BRICS countries gateway. J. Huazhong Agric. Univ. 4, 35–43. doi: 10.13300/j.cnki.hnwkxb.2015.04.006
Keywords: BRICS, trade facilitation, stochastic frontier gravity model, trade efficiency, trade potential
Citation: Xin G, Khan H and Ling X (2024) The impact of BRICS trade facilitation on China’s import and export trade in agricultural products. Front. Sustain. Food Syst. 8:1397350. doi: 10.3389/fsufs.2024.1397350
Edited by:
Jianxu Liu, Shandong University of Finance and Economics, ChinaReviewed by:
Tayyab Raza Fraz, University of Karachi, PakistanHuidan Xue, Beijing University of Technology, China
Copyright © 2024 Xin, Khan and Ling. This is an open-access article distributed under the terms of the Creative Commons Attribution License (CC BY). The use, distribution or reproduction in other forums is permitted, provided the original author(s) and the copyright owner(s) are credited and that the original publication in this journal is cited, in accordance with accepted academic practice. No use, distribution or reproduction is permitted which does not comply with these terms.
*Correspondence: Xin Ling, eGlubGluZ0BjYWFzLmNu