
95% of researchers rate our articles as excellent or good
Learn more about the work of our research integrity team to safeguard the quality of each article we publish.
Find out more
ORIGINAL RESEARCH article
Front. Sustain. Food Syst. , 03 July 2024
Sec. Crop Biology and Sustainability
Volume 8 - 2024 | https://doi.org/10.3389/fsufs.2024.1386823
 Kasi Rao Mediga1,2,3
 Gururaj Sunkad2
 Sandip Shil4Sunil Kulkarni5
 Balanagouda Patil6
 U. S. Sharath Chandran1P. Ashwini1Mamta Sharma1,7*
Sterility mosaic disease (SMD) is an emerging biotic risk to the cultivation of pigeonpea throughout the Indian subcontinent. The prevalence and distribution of SMD documented from diverse agro-climatic zones are still poorly known. In this investigation, we determined the spatial distribution of SMD covering major pigeonpea-growing states of Southern India namely, Karnataka, Telangana, Tamil Nadu, Maharashtra, and Andhra Pradesh by considering 2 years of exploratory survey data. Geospatial approaches were employed to determine the SMD incidence levels at unvisited locations using neighboring observations. The results indicated enormous variability in disease incidence ranging from 0 to 82.64% and 0 to 36.84%, respectively, in Kharif 2021–22 and 2022–23 in pigeonpea-growing states. Spatial autocorrelation analysis and Ripley’s K function established the presence of average clustering over sampling locations. Two main clusters were identified via agglomerative hierarchical cluster analysis. From the Local Moran’s I spatial autocorrelation (LISA) analysis, most of the districts were clustered together at (I<0). From the p-values, Bidar and Krishnagiri districts recorded the highest spatial dependence, while the remaining districts recorded medium spatial dependence (p < 0.05). Based on kriging, the Chittoor district of Andhra Pradesh, Medak and Ranga Reddy districts of Telangana, Bijapur district of Karnataka, and Latur district in Maharashtra states were found to be vulnerable to SMD occurrence in the future. The Matern and Spherical models were shown to be the best of the several semivariogram experimental models tested for spatial patterns of SMD incidence, from which OK and IK maps were created. Based on the interpolation results, the potential SMD hotspots/risk areas were most prominent in Telangana, Andhra Pradesh, Karnataka, and Tamil Nadu states. These identified hotspots for SMD revealed high levels of disease probability rates (>25%) above the threshold level and must be closely monitored to restrict and minimize further disease spread across the studied areas in Southern India. In pigeonpea, this is the first study in India that attempted to understand the spatial pattern of SMD using geostatistical methodologies. The results of the study will aid in the design and dissemination of specific management practices and curb the further spread of SMD.
Pigeonpea (Cajanus cajan L. Huth), commonly known as Redgram, Tur, and Arhar, is one of the most significant drought-resistant grain legume crops grown mainly for its high protein seeds (18–22%) in the Indian subcontinent, the Americas, the Caribbean, Southeast Asia, and East Africa. Globally, it occupies an area of 7.02 million hectares under cultivation with a production of 6.80 million tonnes in 22 countries. However, India alone covers 5.23 million hectares (>75–80%) with a yearly production of 4.32 million tonnes and productivity of 825.70 kg/ha among all pigeonpea-growing countries (FAOSTAT, 2021). It is largely grown in diverse ecological conditions ranging from irrigated to rainfed circumstances. More than 100 diseases caused by fungi, bacteria, viruses, and phytoplasma affect pigeonpea production in mild to severe forms (Nene et al., 1996). Among these, sterility mosaic disease (SMD) is reported to be an important hindrance to pigeonpea farming among several agroclimatic zones of India (Singh et al., 2013; Sharma et al., 2015; Ghosh et al., 2023), resulting in a yearly loss of US$ >300 million (Reddy et al., 1990).
Although the occurrence of SMD was initially discovered from Pusa in Bihar state of India (Mitra, 1931), its biology remained a puzzle for 70 years until Kumar et al. (2000) and Elbeaino et al. (2015) identified the inciting agents for pigeonpea SMD as Pigeonpea sterility mosaic virus-I and II (PPSMV-I and PPSMV-II), a putative multipartite, negative sense RNA virus. SMD is semi-persistently spread by the eriophyid mite vector, Aceria cajani (Seth, 1962; Kulkarni et al., 2002). SMD is commonly known as “green plague,” because the infected plants remain green with unwanted vegetative growth, lack flowers/pods, and the disease spreads quickly under compatible circumstances, leading to serious outbreaks (Singh et al., 1999).
The disease symptoms of SMD infection can vary depending on the pigeonpea variety, weather conditions, and the PPSMV strain. Initial symptoms include light green and yellow specks on the leaves with mottling appearances, often develop into prominent distinct light and dark green mosaic patterns. As the disease progresses, the leaves may become distorted, shortening of internodes, and reducing the photosynthetic capacity. Infected plants also produce small leaves with bushy appearance along with clustering of leaves without flowers and pods. In severe cases, complete sterility can occur, drastically affecting crop yield and quality (Figures 1A–F) (Pande et al., 2012; Sharma et al., 2012; Mediga et al., 2023). Recent reports point out an increase in the incidence of SMD in recent years (Sayiprathap et al., 2020). This could be due to shifts in the cropping systems, the rapid spread of viruliferous mites that transmit virus inoculum, the adjacency of new fields to already infected fields, and conducive environmental factors supporting eriophyid mite development and cultivar susceptibility, resulting in extreme economic yield losses (Kumar et al., 2008). Moreover, infection predisposes the crop to successive infection by pathogenic fungus and establishment by tetranychid spider mites. Due to SMD, crop losses vary largely and further depend on the cultivar and infection phase, i.e., SMD infection at the vegetative phase can lead to a yield loss of between 26 and 97% (Kannaiyan et al., 1984). Although there are conflicting ideas about the impact of climate factors on SMD distribution, plants grown under irrigation are highly susceptible to initial stage infection by SMD because of high colonization of eriophyid mites (Dharmaraj et al., 2004).
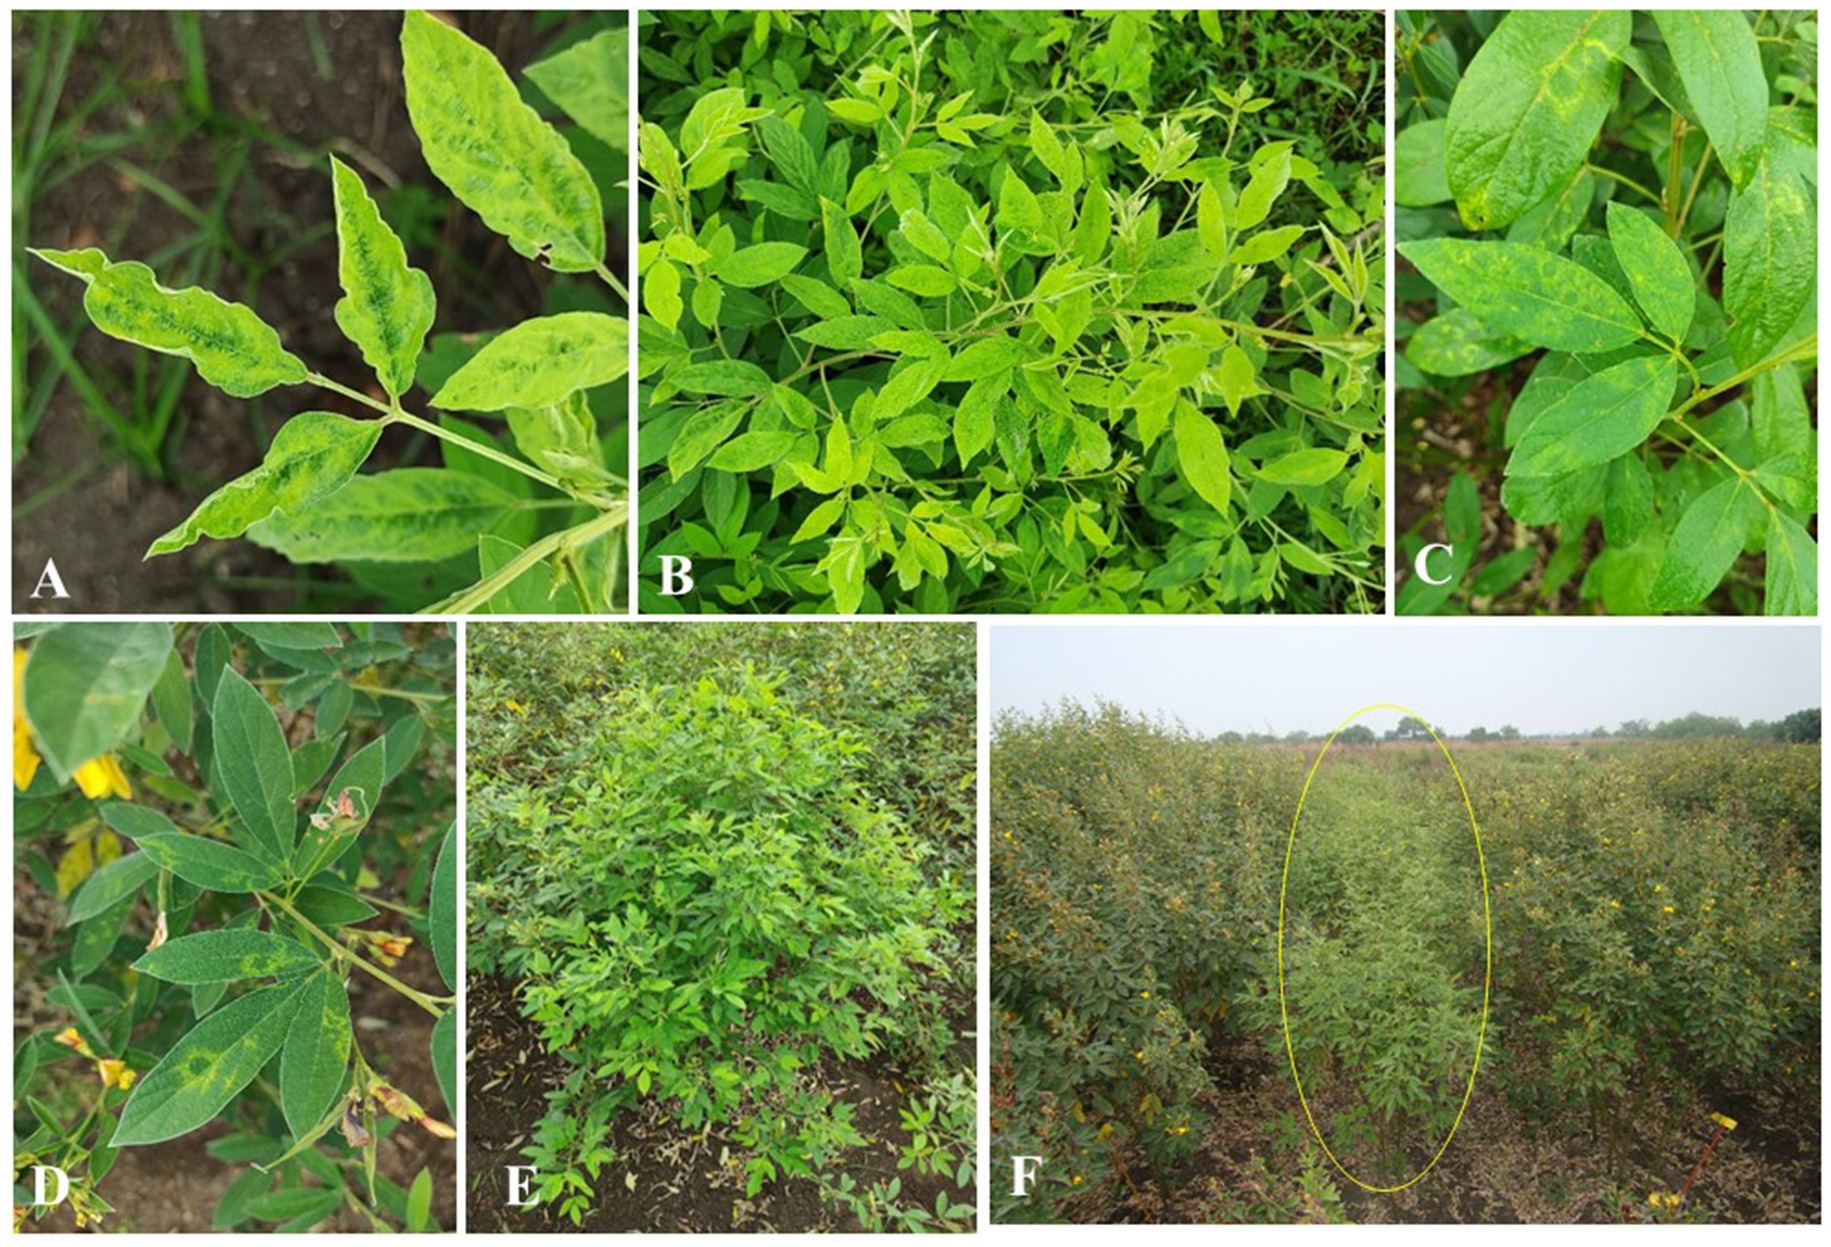
Figure 1. Symptoms of SMD of pigeonpea. (A,B) Mosaic patterns. (C,D) Chlorotic ring spots. (E) Stunted growth with little leaf symptoms. (F) Complete sterility.
In India, SMD has been reported to be extensively prevalent in Telangana, Andhra Pradesh, Tamil Nadu, Karnataka, Maharashtra, Bihar, Uttar Pradesh, and West Bengal (Kannaiyan et al., 1984; Narayana et al., 2000; Singh and Raghuraman, 2011; Sayiprathap et al., 2020). Therefore, it is essential to comprehend the distribution of SMD across pigeonpea-growing states and to determine the potential risk linked with SMD. Until now, spatial information has been the most important aspect in developing and maintaining SMD monitoring systems. It is important for the estimation of the risks connected with the disease and is considered a basic criterion for understanding the consequences of disease establishment, monitoring and designing proper management strategies (Chellemi et al., 1988).
The spatial distribution of a disease reflects information about the initial inoculum source, the modes of dispersal, and the variables causing epidemics, all of which are useful for modifying disease surveillance and management tactics (Kumar et al., 2008; Patil and Kumar, 2015; Freitas et al., 2016). Several techniques have been exploited to explore the spatial distribution of pathogens and the locations of diseased fields (Balanagouda et al., 2021; Amoghavarsha et al., 2022; Huded et al., 2022), among which, geostatistical techniques are frequently employed to classify the potential risk- contributing components of epidemics and describe the spatial distribution of plant diseases (Byamukama et al., 2014; Freitas et al., 2016).
Currently, the integration of a geographical information system (GIS) into geostatistical approaches provides a platform to integrate plant disease status and meteorological data along with geographical information into one system, thereby enabling the study of the relationship between plant disease progress and the environment (Savary et al., 2012). The GIS aids in the identification of SMD infected fields. Using GIS, geostatistical, hotspot analysis, interpolation, semivariogram interpretation, and other modeling can be applied to understand the progression of diseases in plants at spatial level (Yuen and Mila, 2015).
To establish the association between spatial data at various distance intervals and to develop spatial dependence, spatial autocorrelation is typically used (Reynolds and Madden, 1988; Oro et al., 2012). Using these data, a model has to fit to the sampled points for forming empirical semivariogram. Semivariogram modeling is a key step between spatial description and spatial prediction through which the disease rates without bias and with the least variance can be assessed (Viggiano et al., 2019). The kriging method was employed and it is a widely used interpolation method for the prediction of attribute values at unsampled locations or to estimate unknown values based on known neighbors and found to be a reliable tool for estimating the disease distribution at spatial levels (Koch and Smith, 2008).
To date, no prior studies have focused on the geostatistical estimation of pigeonpea SMD incidence and associated potential risk regions. Therefore, the current investigation aimed to determine the present status and spatial establishment of SMD across pigeonpea-growing regions in Southern India, to ascertain the SMD hotspots or clusters by point pattern analysis, and to estimate the potential risk linked with SMD in Southern India by means of interpolation approaches.
The present study was carried out in the five major pigeonpea-growing states in Southern India namely, Andhra Pradesh, Karnataka, Maharashtra, Telangana, and Tamil Nadu during two consecutive Kharif or monsoon seasons in 2021–22 and 2022–23 (Figure 2). A total of 5 states with 29 administrative districts comprising 58 taluks and 116 villages were covered during the exploratory surveys. At each village, two pigeonpea fields were selected and surveyed for the incidence of SMD.
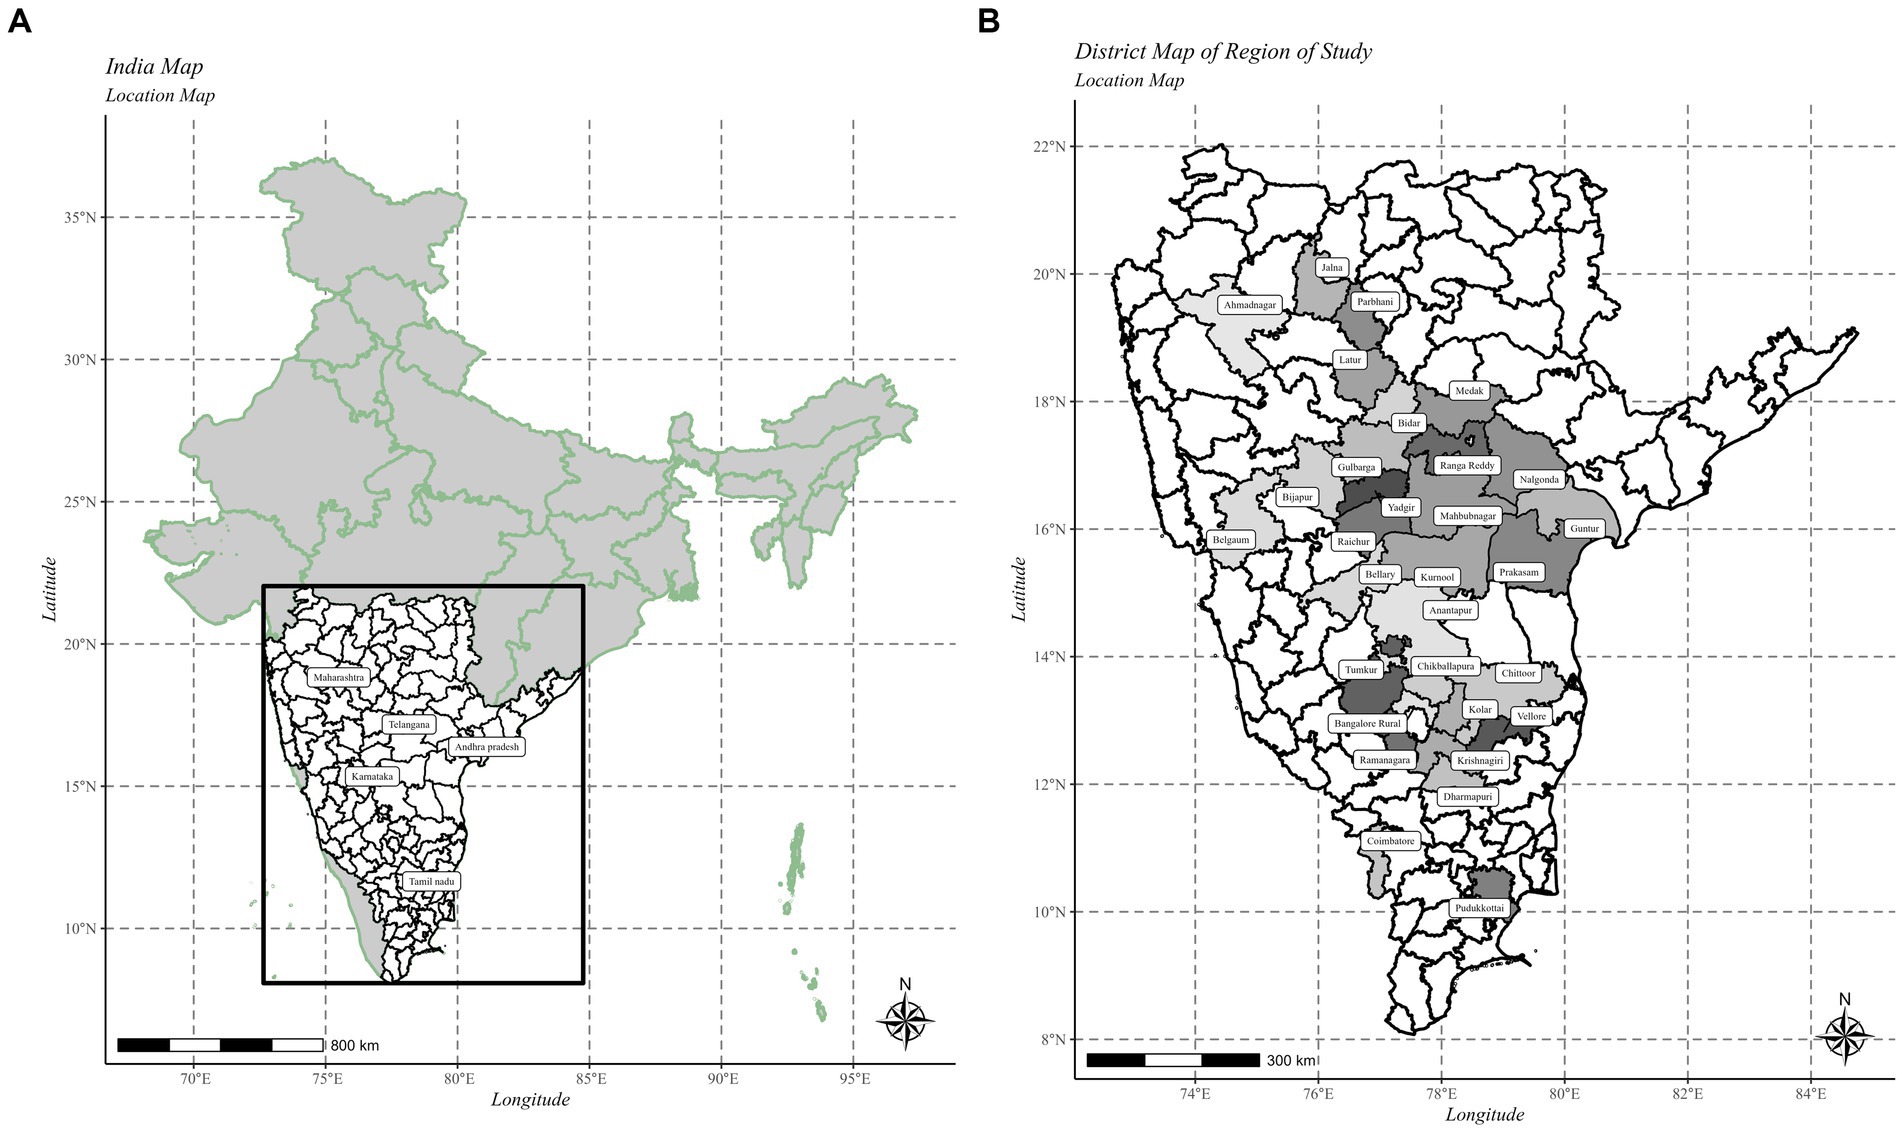
Figure 2. (A) India map showing different Southern states surveyed for incidence of SMD of pigeonpea during Kharif 2021–22 and 2022–23. (B) SMD surveyed states and districts. The maps were created using R software (Version R-4.0.3).
During the investigation, pigeonpea plants showing SMD symptoms namely leaf mosaic, mottling, stunting, and reduced leaf size were taken into account and the disease incidence of SMD in individual fields was computed as the number of diseased plants out of 500 plants selected at randomly throughout the field. The percent SMD incidence was determined using the following Eq. (1):
Before performing geostatistical techniques, the data normality is a key assumption. Hence, initially, by using the Kolmogorov–Smirnov test, the normality of the dataset collected was measured (Vannini et al., 2010). Then, histograms followed by standard Quantile-Quantile (QQ) plots were constructed to eliminate the slight global trend identified in the dataset. Furthermore, to determine the significant difference in SMD incidence among the surveyed areas, the percent SMD incidence recorded from all five states was subjected to the Kruskal-Wallis test in statistical R software version R-4.0.3 (R Core Team, 2020). By using the average linkage approach, agglomerative hierarchical cluster analysis was accomplished based on the geographical positions and SMD incidence to determine the distances among the surveyed districts (Kaufman and Rousseeuw, 2009). All the above computation is done using base packages of R.
Moreover, utilizing the R software version R-4.0.3, the ‘hclust’ function method was employed to perform data optimization and clustering analysis. Within the context of hierarchical average linkage clustering, the distance (L) between two clusters (r, s) symbolizes the separation between individual points of one cluster and individual points of the other cluster. This relationship can be expressed using Eq. (2):
where X and Y are the observations from clusters r and s, respectively.
The spatial distribution pattern of SMD incidence across the examined districts of Southern India was investigated using two widely employed geospatial methodologies, namely point pattern analysis and surface interpolation techniques. Through the utilization of Ripley’s K functional analysis and the point-pattern-optimized hotspot approach, significant clusters of SMD areas were identified and verified within the analyzed regions. Additionally, in order to create spatial maps depicting the probable surface and risk linked to SMD prevalence across the surveyed areas, the inverse distance weighted (IDW), indicator kriging (IK), and ordinary kriging (OK) interpolation techniques were employed utilizing ‘raster’, ‘sp’ and ‘gstat’ R packages (Pebesma, 2001).
For assessing the point-pattern distribution of SMD across the surveyed regions of Southern India, the degree of spatial dependency between neighboring plots consisting of SMD plants was taken into account. This involved the application of spatial autocorrelation analysis utilizing Local Moran’s I spatial autocorrelation (LISA) statistics along with ‘spdep’ R package, followed by optimized hotspot analysis as outlined by Bivan et al., 2008. In this analysis, the optimization of datasets was executed by considering adjacent sampling fields, following the approach proposed by Reynolds and Madden, 1988. LISA statistics indicated the presence of spatial clustering, and the significance of the results was gauged using the p-value. To compute Moran’s I statistic for areal unit ‘i’, Eq. (3) was employed.
where I is the statistic for district i; Zi is the deviation from the mean for unit i; Zj is measured as the deviation from the mean for a neighbor j; W is the spatial weights matrix, and j and n represent constants, i.e., j corresponds to a neighbor of unit I within a defined neighborhood n. The positive values of Ii that surpass the threshold p-value = 0.05 imply positive spatial autocorrelation, in which similar values, either high or low values, are spatially grouped around point i. The negative values of Ii lower the threshold p-value = 0.05 and specify a negative spatial autocorrelation, in that the closest values are dissimilar or dispersed relative to the value at point i, whereas the remaining case represents the existence of randomness. Hence, in particular sampling locations with higher incidence (%) of SMD and where the adjacent fields also possess higher disease incidence values, the particular site is taken into account as a hotspot or potential risk area (Yavuzaslanoglu et al., 2012).
Furthermore, the significant clustering and spatial patterns of SMD were confirmed by using Ripley’s K(r) function (Dixon, 2002) analysis. In environmental and epidemiological investigations, this function is commonly utilized to study distances at which spatial clustering takes place (Oro et al., 2012). Hence, we used this function to examine the point processes at different distances, and to estimate the spatial pattern of SMD in Southern India. The function is represented as K(r) = λ − 1E, where K(r) indicates the features of point events over a range of scales; E(r) is the predicted mean number of points within a distance r of arbitrarily selected points, and λ is the SMD incidence of the surveyed areas.
The utilization of spatial interpolation aims to predict established spatial data values at locations that have not been sampled. The occurrences of SMD at the designated sampling fields (X1, X2, …, Xn) are represented by corresponding values (Z1, Z2, …Zn). The calculation of Z values for a new field X involves surface interpolation techniques. The SMD infected surfaces across the study areas were estimated by employing the IDW and OK approaches (Burrough, 1986). Eq. (4) can express the IDW at an unsampled field i.
where p = parameter; and m = denotes the number of neighboring points considered at a certain cutoff distance r. The interpolated values are then compared with the actual values from the omitted point via leave-one-out cross-validation. The interpolated performance is summarized by determining the root mean square residuals from the error (RMSE).
Theoretically speaking, kriging stands as an interpolation technique designated to provide precise estimates of variables at spatial locations where SMD sampling has not occurred (Santra et al., 2008). In kriging methodology, the experimental variogram is employed to ascertain the spatial correlation of the random function Z(XO). This correlation information is then leveraged to compute an estimate of the variable Z at an unsampled point XO (Mardikis et al., 2005).
By using the OK approach, surface maps of the SMD incidence were created by means of Eq. 5:
where Z = variable of interest sited X0 at spatial coordinates (x, y); n = total number of neighboring known sample points connected to X0; and λi = is the weights associated with Xi (the known sampling points connected to unkown sampling point X0) and the ith observation point (Stein, 2012).
Before conducting the kriging analysis, histograms and standard QQ plots were employed to confirm the SMD dataset distribution. Measurement error arises due to inherent inaccuracies in measuring instruments. Spatial sampling locations can differ across various scales. Microscale variations, occurring at distances smaller than the sampling intervals, can be managed by employing diverse semivariogram models to identify the most appropriate fit. Hence, several semivariogram models namely spherical, exponential, Matern and Gaussian were employed for fitting with the SMD dataset. The best fit model was used to generate the OK maps.
The semivariogram is a plot of semivariance which determines the nearest neighbor index taking into account both the average spatial variability and the percent SMD incidence for each feature at a given distance, h, apart (Mardikis et al., 2005; Ten Hoopen et al., 2009). A semivariogram at a given distance h is estimated simply as the average of the squared difference between all observations separated by that distance and which is expressed by the following Eq. (6):
where γ(h) = semivariance for the interval distance class h; N(h) = number of data pairs of as given lag interval distance h and direction; Z (Xi) = measured sample value at point i; Z(Xi + h) = measured sample value at position i + h.
Values of the semivariogram are fitted with spherical, exponential, Matern, and Gaussian models, with Eq. (7, 8, 9, and 10) as follows:
Spherical model:
Exponential model:
Matern model:
Gaussian model:
In the above semivariogram models, C0 = nugget; (C + C0) = sill; a = range. For exponential and Gaussian models, the theoretical range is represented by “a.” In the case of the Matern model, >0 = variance; α > 0 = scale/range parameter; 𝝂>0 = shape parameter; 𝜞(.) = gamma function; K𝝂(.) = modified Bessel function of the second kind and (integer) order 𝝂; |h| = norm of vector h.
To evaluate the precision of the estimates over the employed models and methodologies used, the observed and estimated data were compared using a set of accuracy measures such as mean square error (MSE), RMSE, mean absolute percentage error (MAPE), and mean absolute error (MAE). Finally, the percent incidence of the kriged maps of SMD was constructed and represented accordingly.
IK method was utilized to identify the disease-prone or uncertain areas where the disease incidence of SMD of pigeonpea was >25% per field (Chiles and Delfner, 1999; Alves and Pozza, 2010). The SMD incidence level of more than 25% was taken into account to create the probability risk maps based on 25% quantile of entire observations. The procedure for IK was executed following a similar process to that of OK, as elucidated earlier. Subsequently, a color-coded kriged map was generated, where contour symbolization was utilized to represent higher SMD risk areas of pigeonpea in Southern India.
During Kharif 2021–22 and 2022–23, the incidence of SMD was observed in all the surveyed areas, with plants displaying significant variations in symptoms across the various districts studied. In the studied areas, pigeonpea was cultivated in diverse soil types, either under irrigated or rainfed situations as the mono crop and intercropped with other legumes, cereals, and commercial crops (Supplementary Tables S1, S2 and Figure 3).
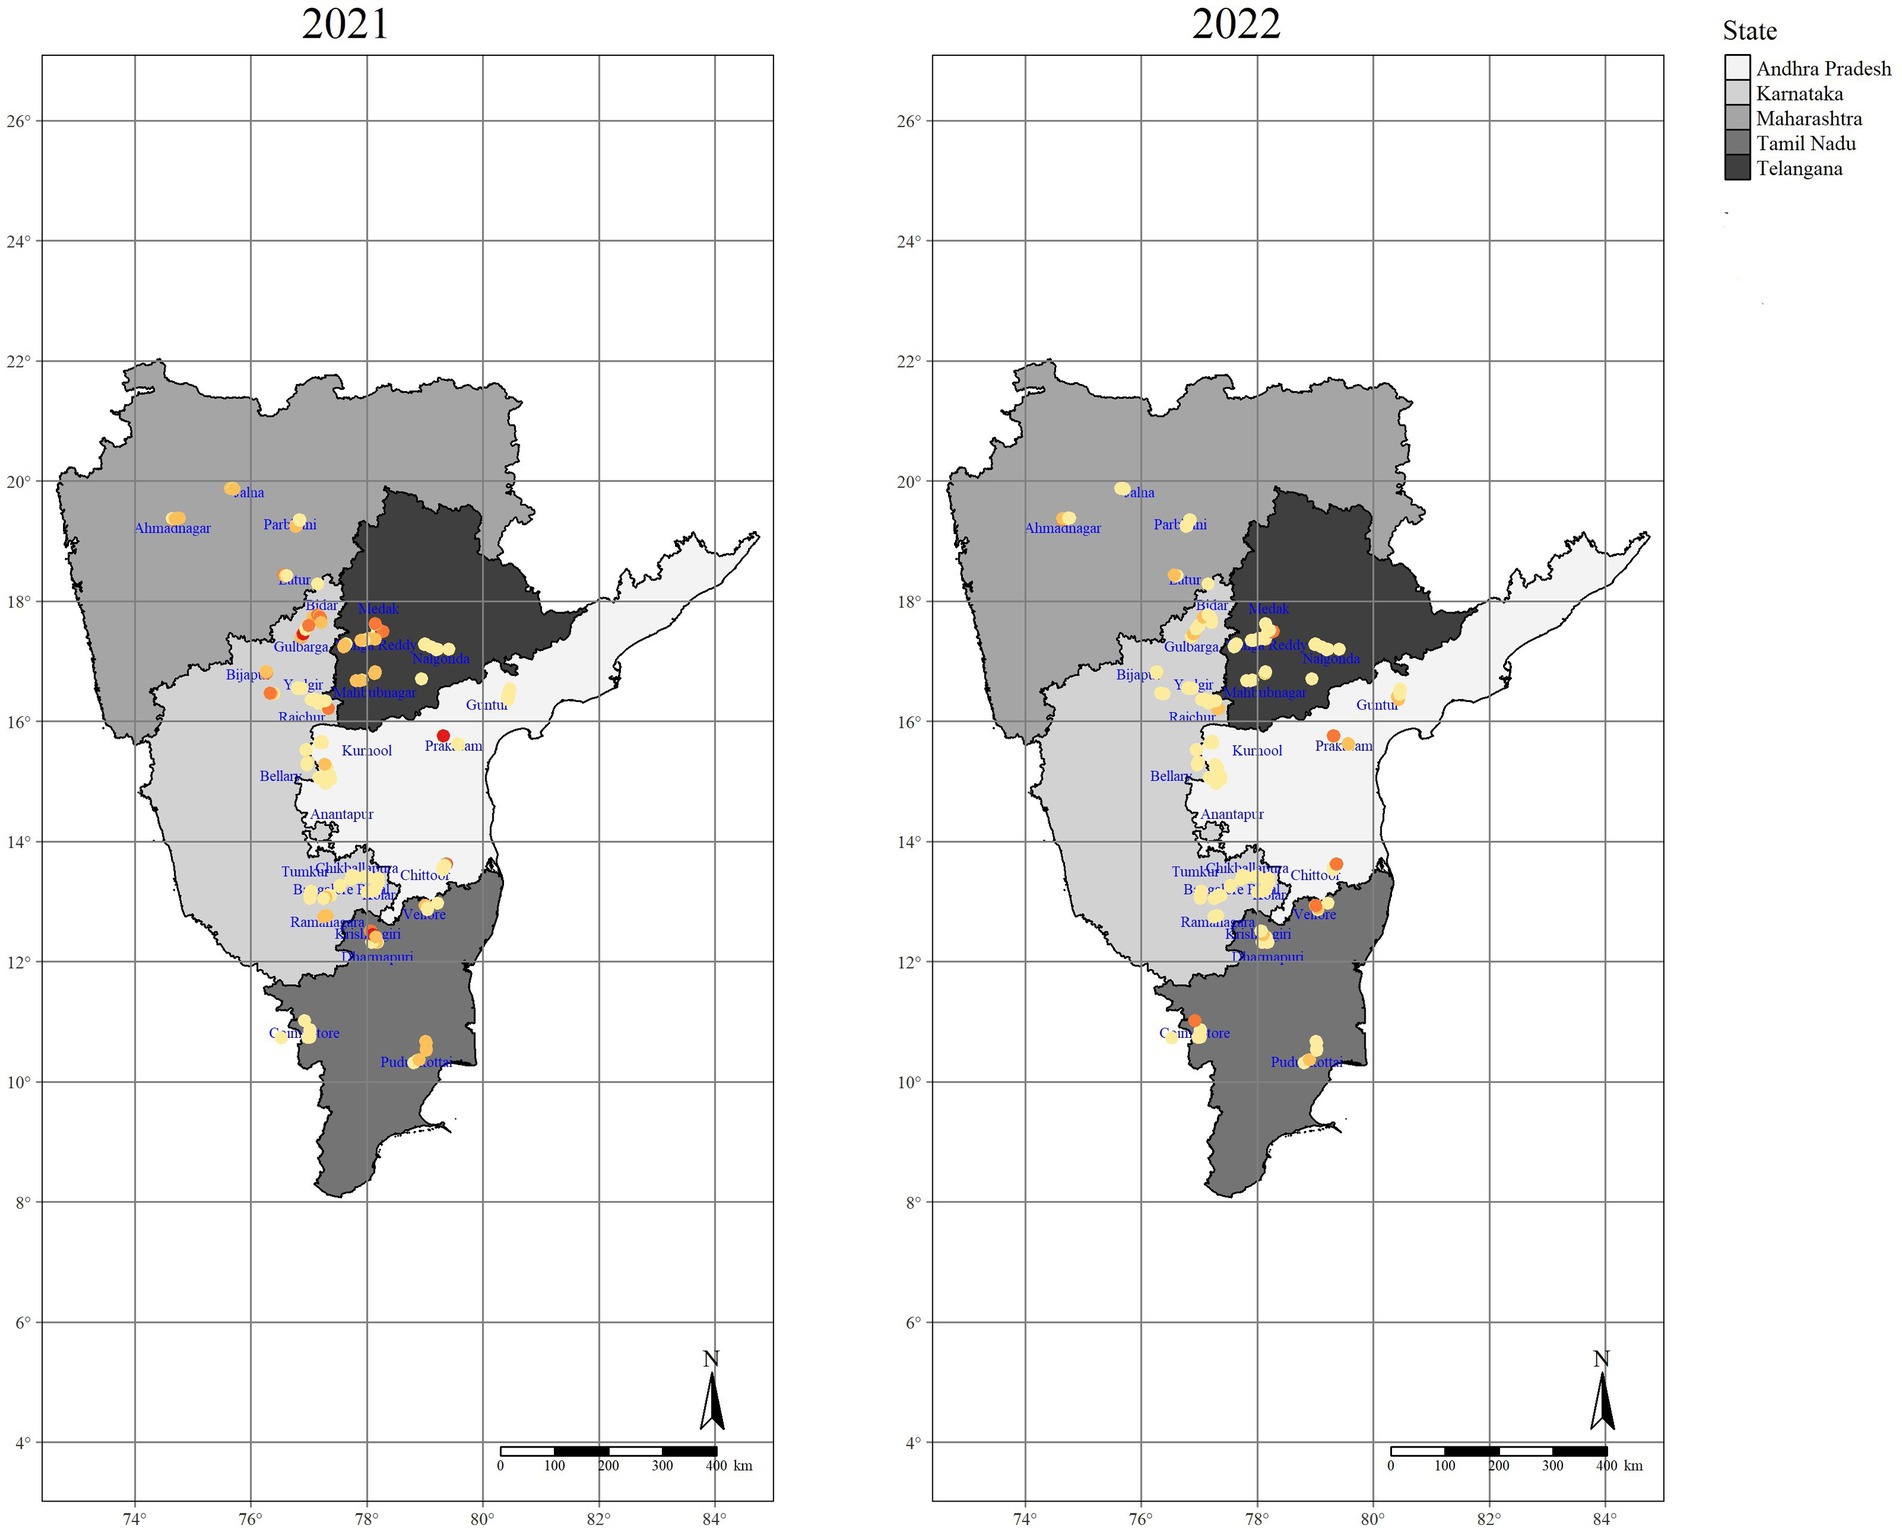
Figure 3. Distribution map for incidence of SMD in surveyed locations of major pigeonpea growing regions of Southern India.
In Andhra Pradesh, pigeonpea cultivation primarily involves intercropping with cotton, groundnut, horsegram, sorghum, finger millet, and chilli. However, in certain areas, it is also grown exclusively as a monocrop. During Kharif 2021–22, the overall SMD incidence in surveyed locations varied from 1.00 to 64.37%. It was shown that the Chittoor district was recorded the highest mean SMD incidence of 15.58% followed by Prakasam district (9.24%) whereas least mean SMD incidence was recorded in Anantapur (4.20%). Similarly, during Kharif 2022–23, the overall SMD incidence in surveyed locations ranged from 0.96 to 32.72%. Interestingly, it was shown that the Prakasam district was recorded the highest mean SMD incidence of 14.62% followed by Chittoor district (10.77%), whereas least mean SMD incidence was observed in Anantapur (3.96%). Overall, Andhra Pradesh state recorded the average SMD incidence of 8.13%, respectively, (Table 1 and Figure 4).
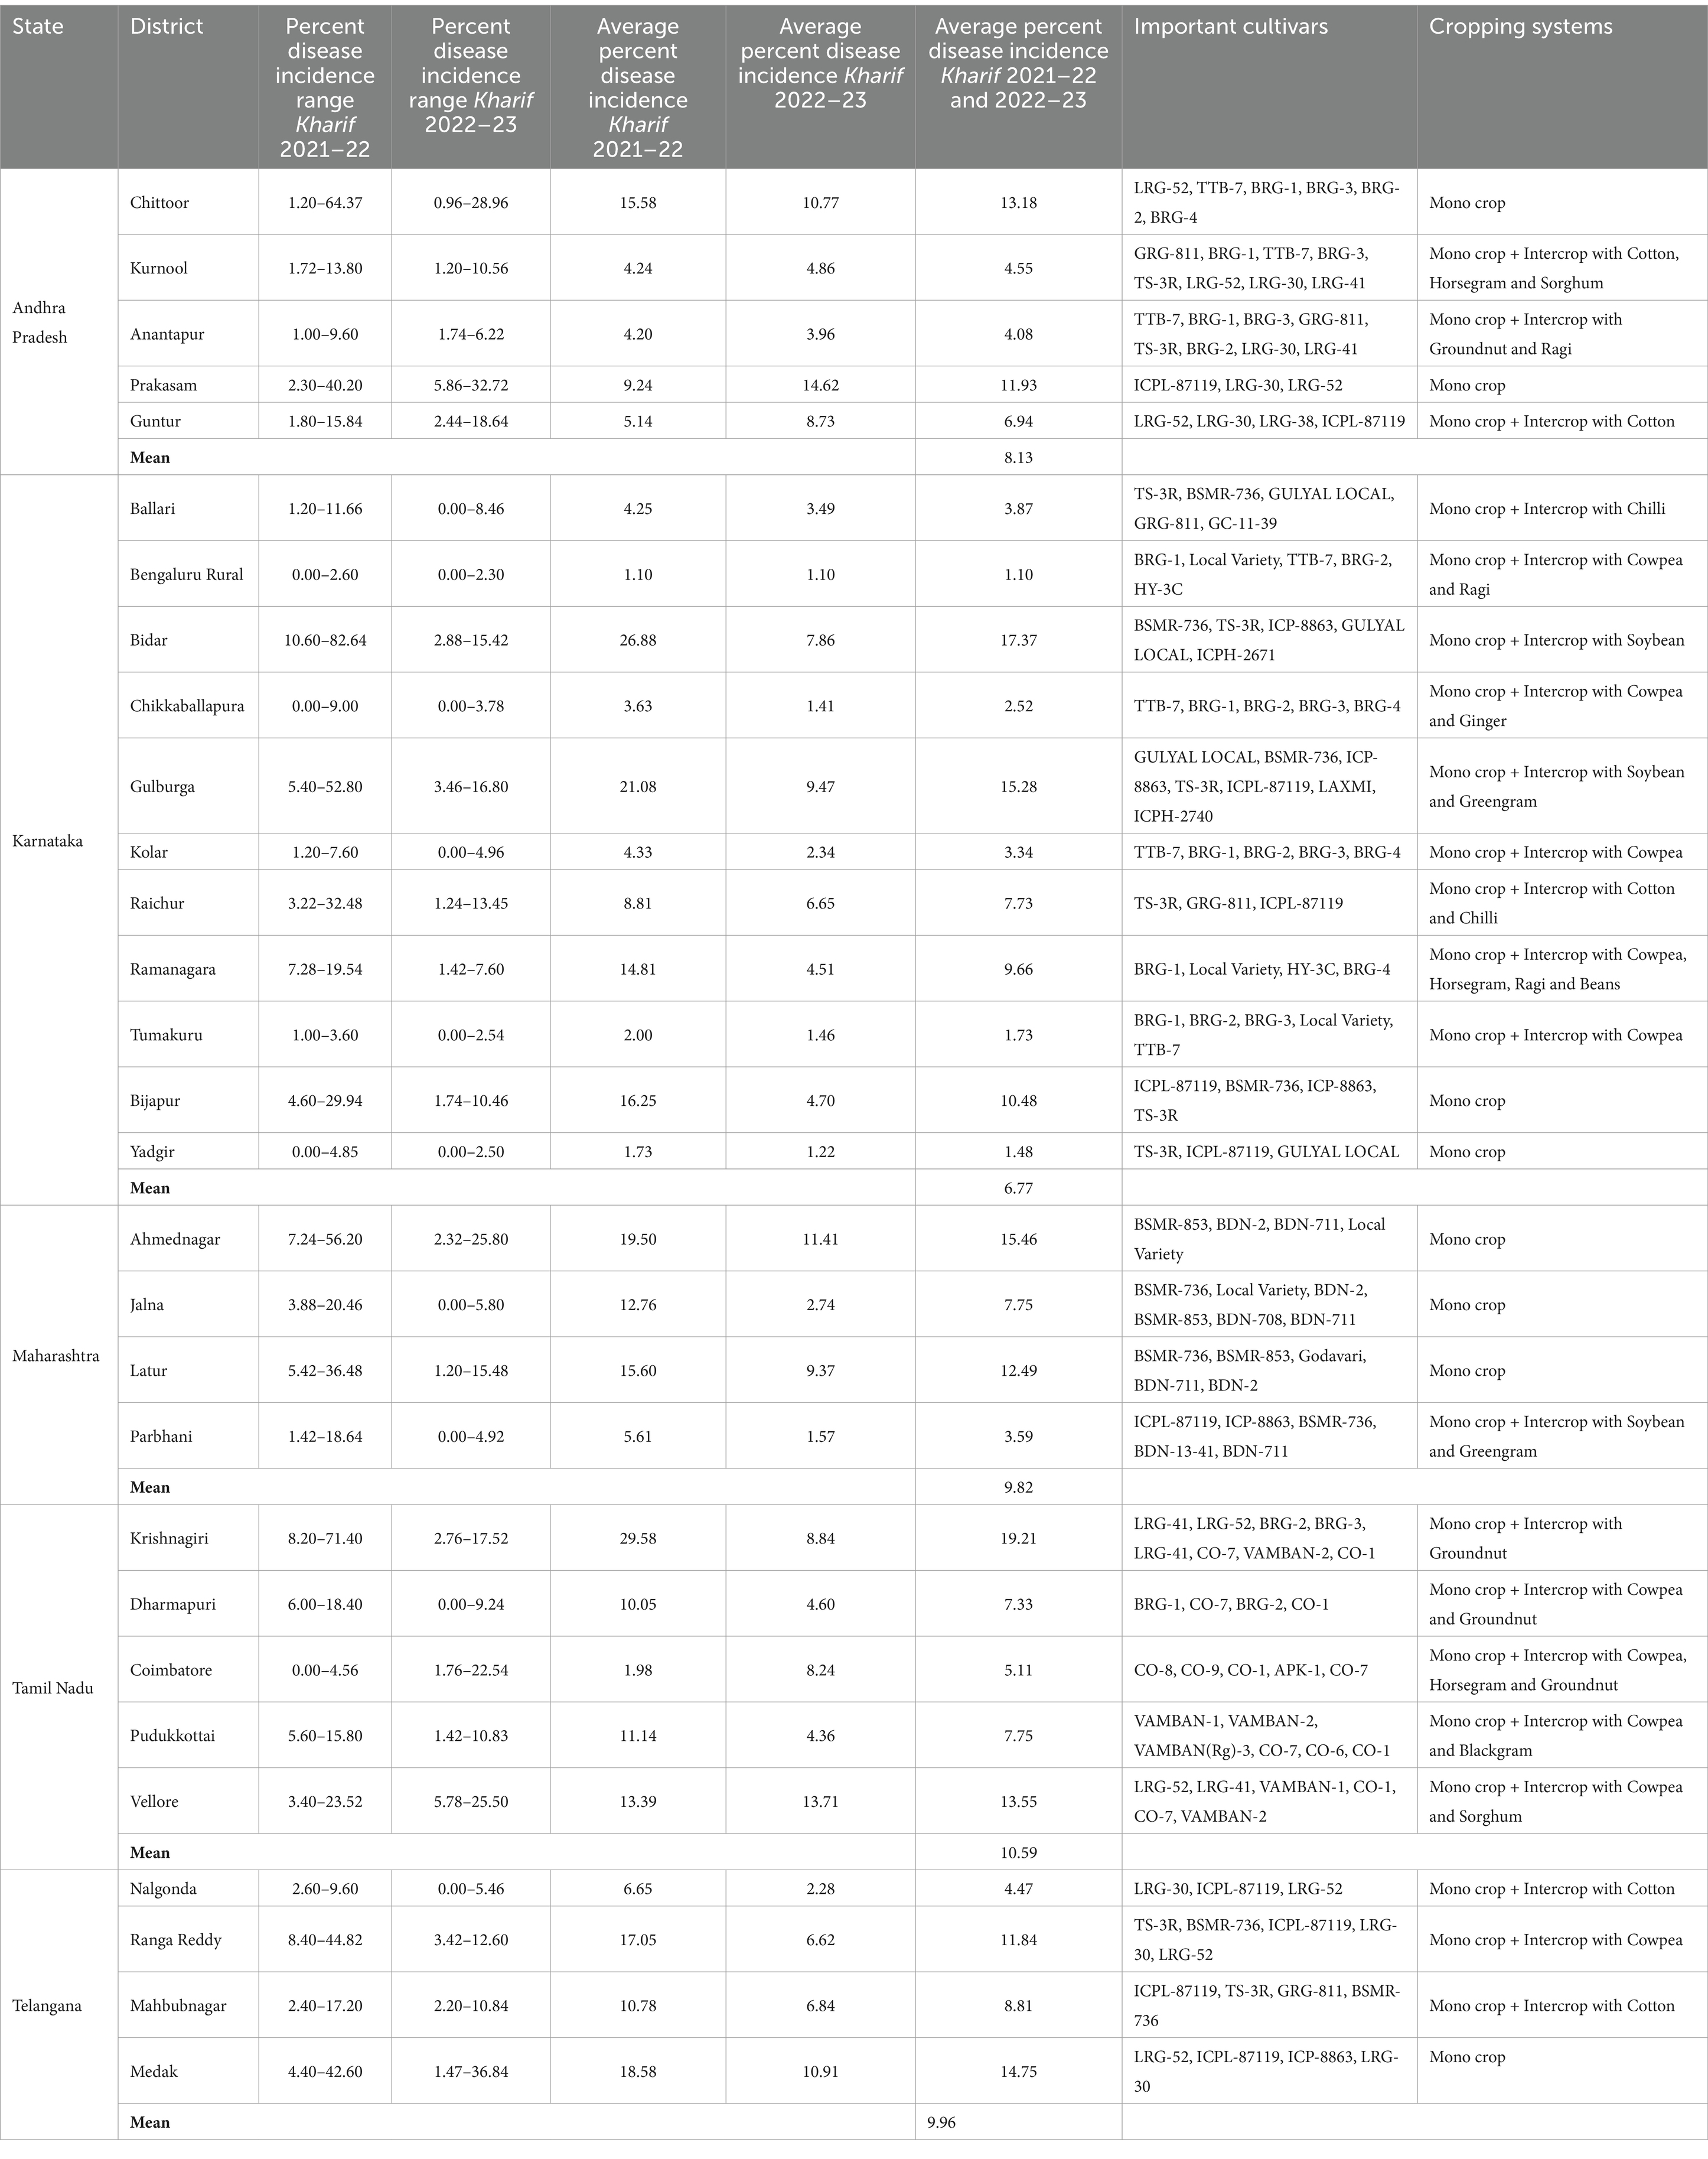
Table 1. State and district wise list of surveyed fields for the SMD incidence during Kharif 2021–22 and 2022–23 in Southern India.
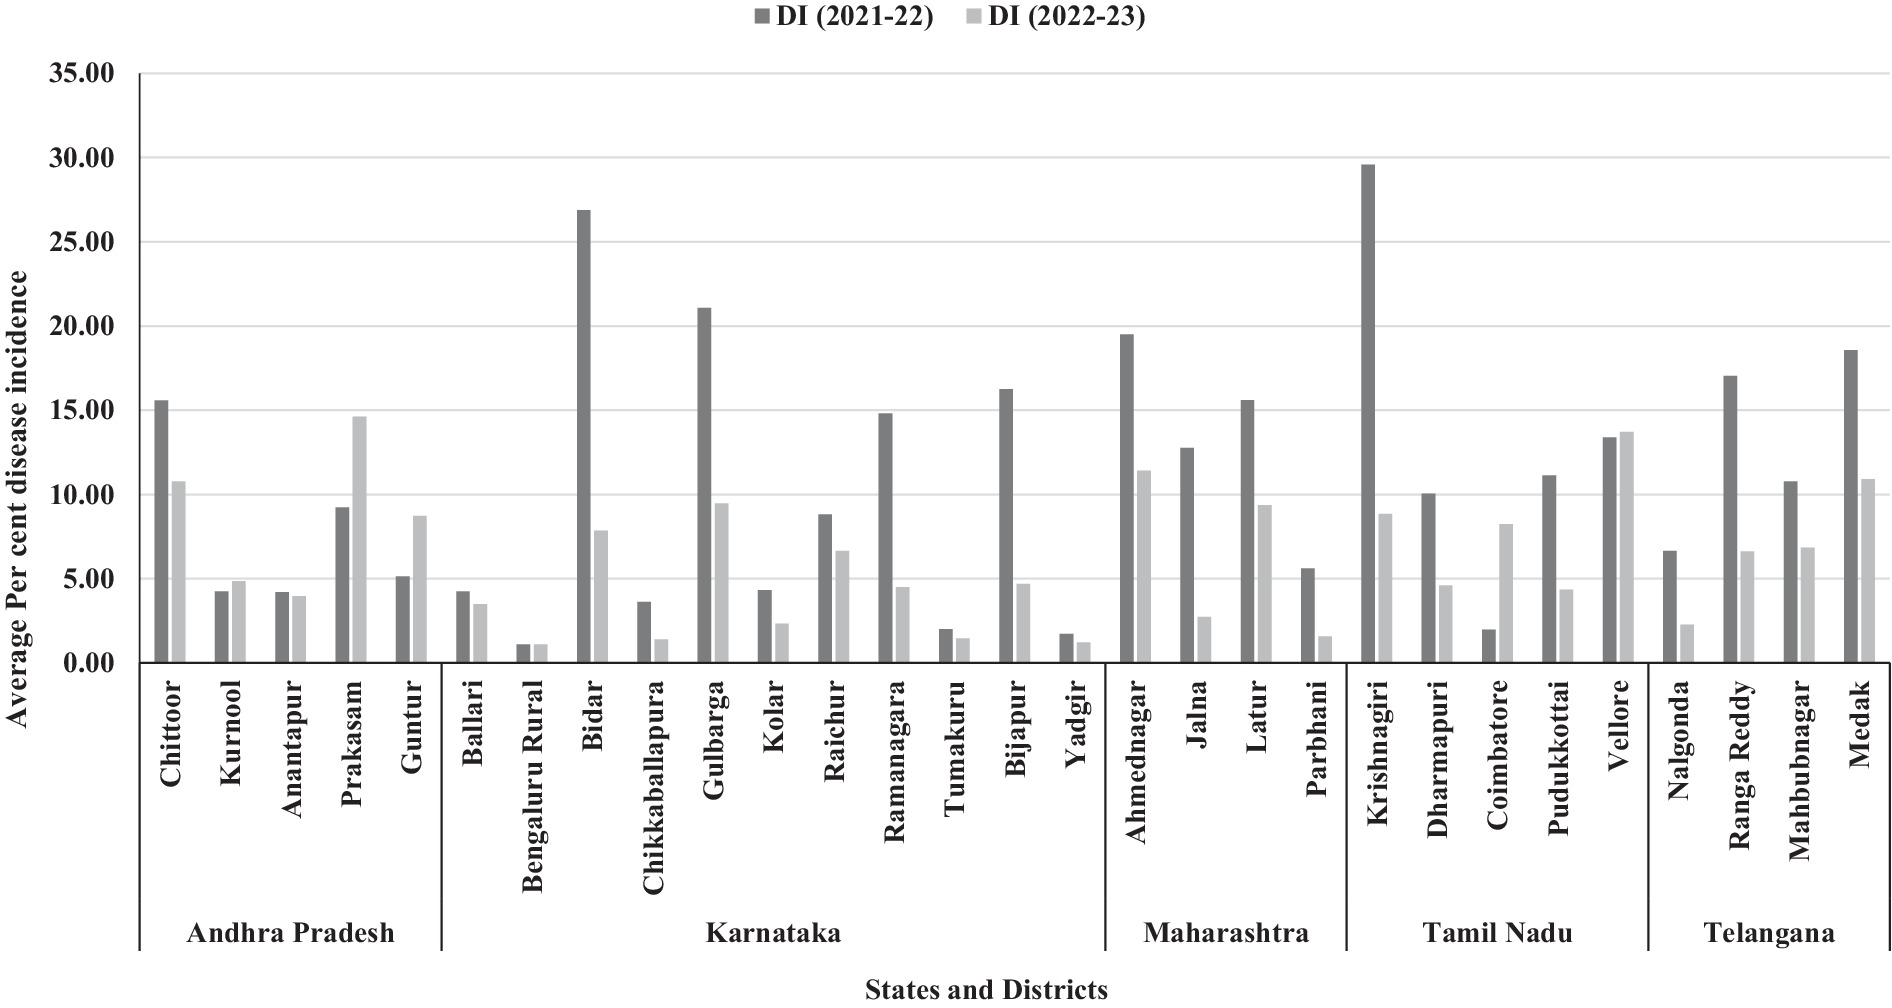
Figure 4. Bar chart representing the incidence of SMD of pigeonpea in Southern India during Kharif 2021–22 and 2022–23.
In Karnataka, pigeonpea was grown both as a monocrop and as an intercrop alongside cotton, groundnut, sorghum, pearl millet, soybean, maize, finger millet, field bean, cowpea, horsegram, foxtail millet, and tomato. SMD was identified as a significant issue across the entire state of Karnataka, with a varying incidence rate during the Kharif 2021–22, ranging from 0 to 82.64%. Among the 11 districts surveyed, less than 10% mean disease incidence was recorded in Ballari, Bengaluru Rural, Chikkaballapura, Kolar, Raichur, Tumakuru, and Yadgir, districts. The highest mean SMD incidence was noticed in Bidar district (26.88%) followed by Gulbarga, Bijapur, and Ramanagara districts it was 21.08, 16.25 and 14.81%, respectively. Similarly, during Kharif 2022–23, the overall SMD incidence in surveyed locations ranged from 0 to 16.80%. Interestingly, all the 11 surveyed districts showed less than 10% mean disease incidence. The highest SMD incidence was recorded in Gulbarga district (9.47%) followed by Bidar (7.86%), and Raichur (6.65%) districts (Table 1 and Figure 4). These abrupt changes in disease incidence during Kharif 2022–23 might be due to changes in environmental conditions, cropping pattern, nature of the genotype etc.
In Maharashtra, the pigeonpea crop was predominantly cultivated as a monocrop. During Kharif 2021–22, the overall SMD incidence in all surveyed locations varied from 1.42 to 56.20%. It was shown that the Ahmednagar district recorded the highest mean SMD incidence of 19.50% followed by Latur district (15.60%), whereas least mean SMD incidence was observed in Parbhani (5.61%). Similarly, during Kharif 2022–23, the overall SMD incidence in surveyed locations varied from 0 to 25.80%. Interestingly, Ahmednagar and Latur districts recorded the highest mean SMD incidence of 11.41 and 9.37% respectively, whereas, least mean SMD incidence was noticed in Parbhani (1.57%) and Jalna (2.74%). Overall, Maharashtra state recorded the average SMD incidence of 9.82%, respectively (Table 1 and Figure 4).
In Tamil Nadu, pigeonpea cultivation occurred both as a monocrop and as an intercrop alongside cotton, groundnut, pearl millet, sorghum, field bean, horsegram, and finger millet. During Kharif 2021–22, the incidence of SMD varied from one location to another, ranging from 0 to 71.40%. Among the five districts where SMD prevalence was surveyed, the lowest disease incidence (1.98%) was observed in Coimbatore district, while Vellore, Pudukkottai, and Dharmapuri districts reported disease incidences of 13.39, 11.14, and 10.05%, respectively. The highest SMD incidence was recorded in the Krishnagiri district (29.58%). Similarly, during Kharif 2022–23, the overall SMD incidence in surveyed locations ranged from 0 to 25.50%. Interestingly, Vellore district recorded the highest mean disease incidence (13.71%) and follows the similar disease incidence levels compared to previous year of study. However, Dharmapuri district recorded the least mean disease incidence of 4.60%. Overall, Tamil Nadu state recorded the average SMD incidence of 10.59%, respectively, (Table 1 and Figure 4).
In Telangana, pigeonpea cultivation was primarily practiced as a monocrop, although in certain areas, it was also grown in combination with cotton, groundnut, and foxtail millet. During Kharif 2021–22, the incidence of SMD varied across all surveyed locations, with incidence ranging from 2.40 to 44.82%. The highest mean SMD incidence was recorded in the Medak district (18.58%) followed by Ranga Reddy (17.05%) respectively, whereas least mean disease incidence was observed in Nalgonda district (6.65%). Similarly, during Kharif 2022–23, the overall SMD incidence in surveyed locations ranged from 0 to 36.84%. Interestingly, similar pattern of SMD incidence was observed in surveyed areas where the highest mean SMD incidence was recorded in the Medak district (10.91%), whereas Nalgonda district recorded the least mean disease incidence (2.28%). This might be due to growing of same cultivars, similar weather conditions etc. Overall, Telangana state recorded the average SMD incidence of 9.96%, respectively, (Table 1 and Figure 4).
The agglomerative hierarchical clustering approach carried by means of the average linkage method for SMD incidence among the 29 administrative districts of different agroclimatic zones of India revealed two main clusters. Cluster I comprised 27 districts, which further had two subclusters consisting of 15 (Medak, Ahmednagar, Gulbarga, Latur, Chittoor, Vellore, Prakasam, Ramanagara, Bijapur, Jalna, Ranga Reddy, Mahabubnagar, Pudukkottai, Dharmapuri, and Raichur) and 12 (Parbhani, Nalgonda, Kolar, Chikkballapura, Ballari, Anantapur, Kurnool, Yadgir, Tumakuru, Bangaluru Rural, Guntur, and Coimbatore) districts. However, two districts namely Krishnagiri and Bidar with the highest SMD disease incidence were grouped into a second cluster (Figure 5).
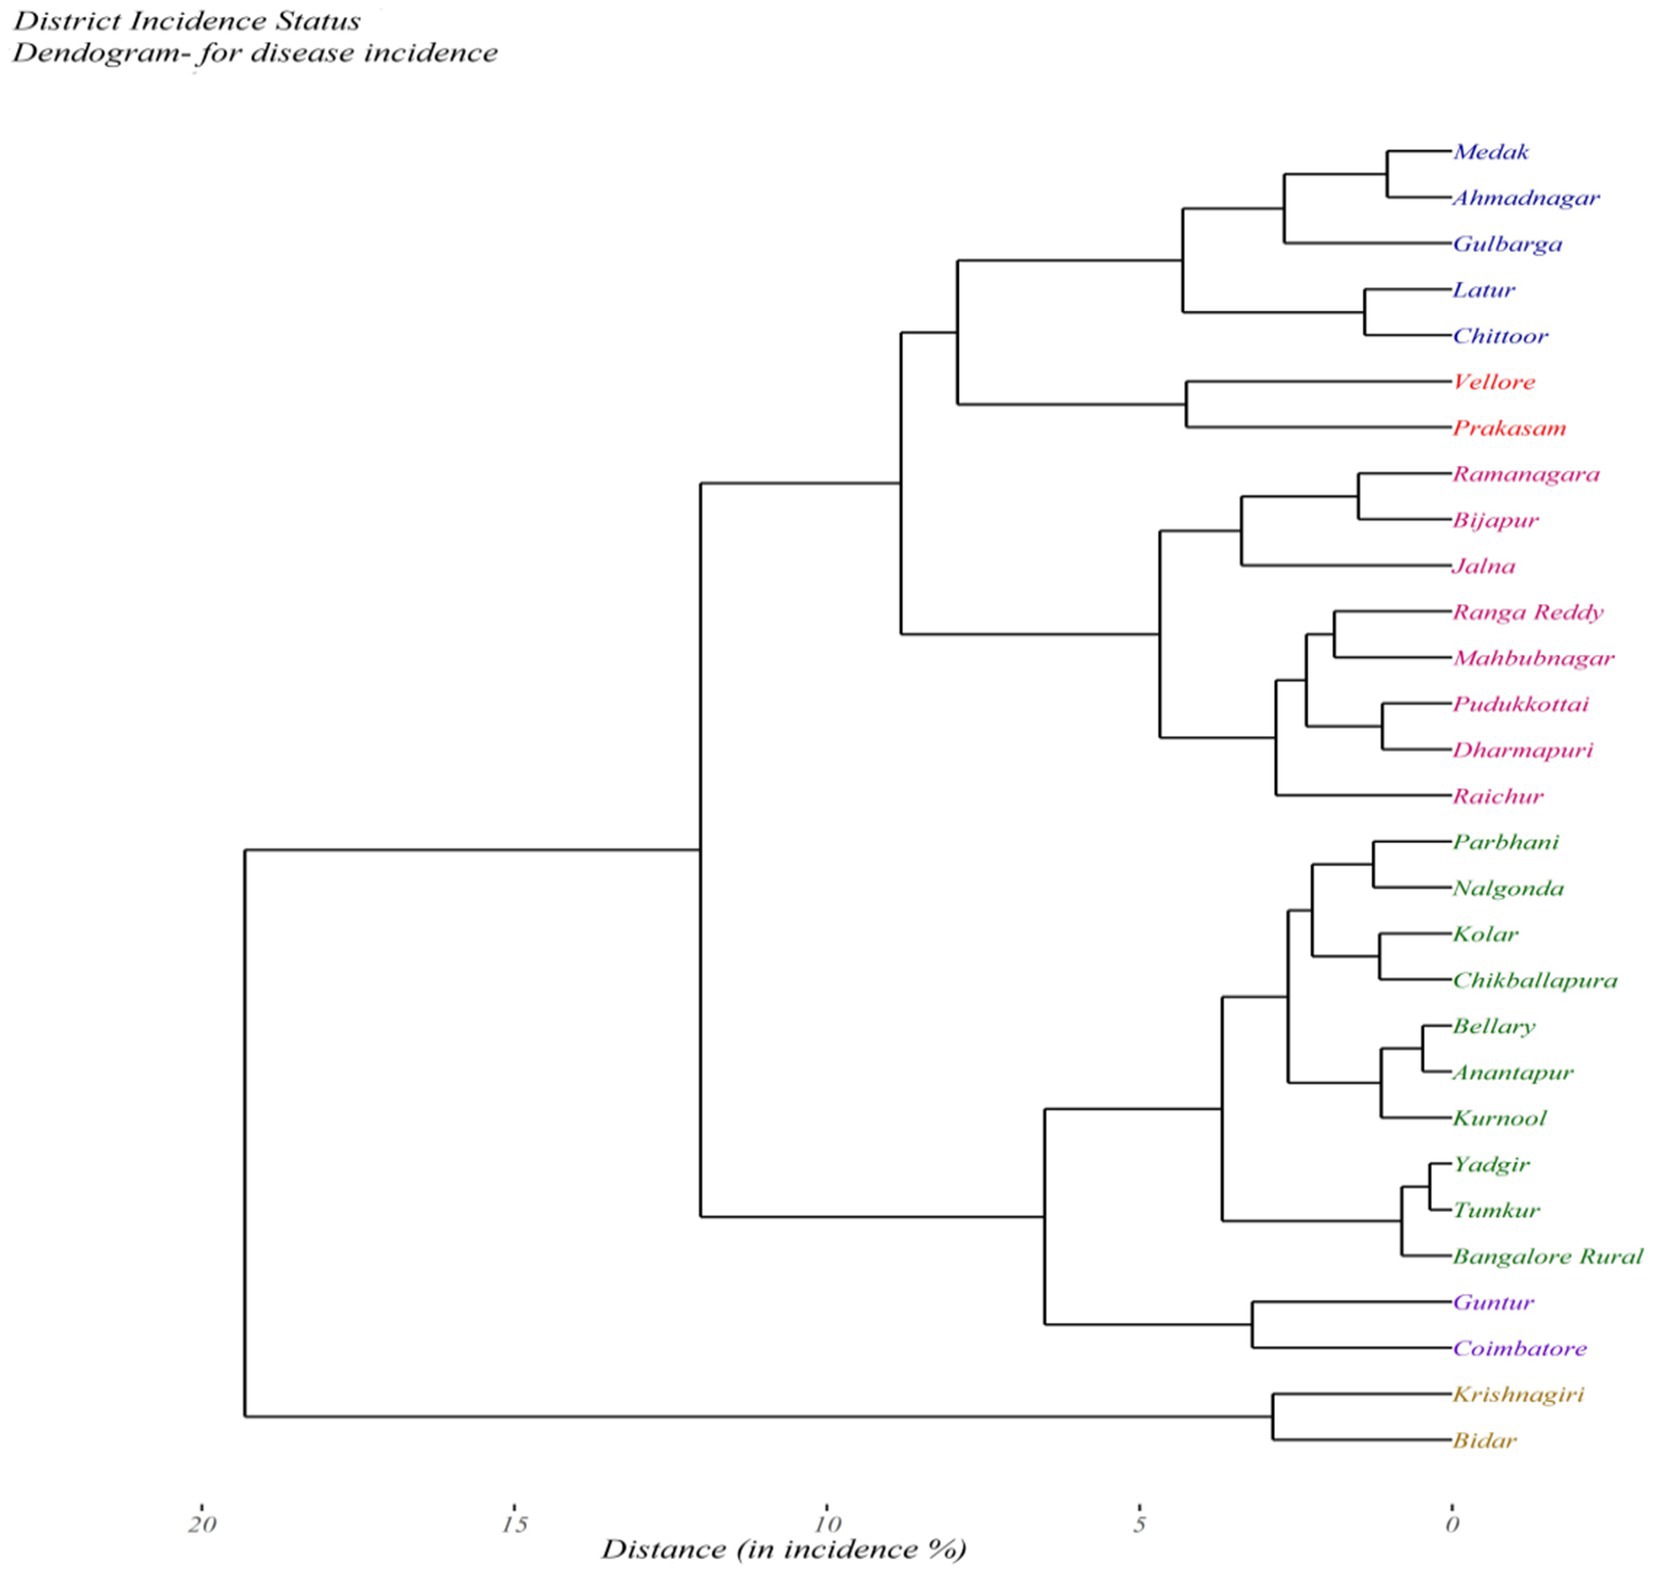
Figure 5. Clustering of districts based on the sterility mosaic disease incidence in different surveyed districts of Southern India by the hclust method.
Local Moran’s I and p-values were used to conducted the outliner and cluster analysis for SMD in pigeonpea. The LISA analysis generated diverse patterns of SMD at the state and district levels during both years, indicating random, dispersed, and aggregated clusters of incidences surrounded by other areas. In both seasons, only two districts namely, Kolar and Ramanagara in Karnataka were clustered together with positive I values (I > 0), while most of the districts that displayed negative I values (I<0) were grouped into another cluster (Figure 6).
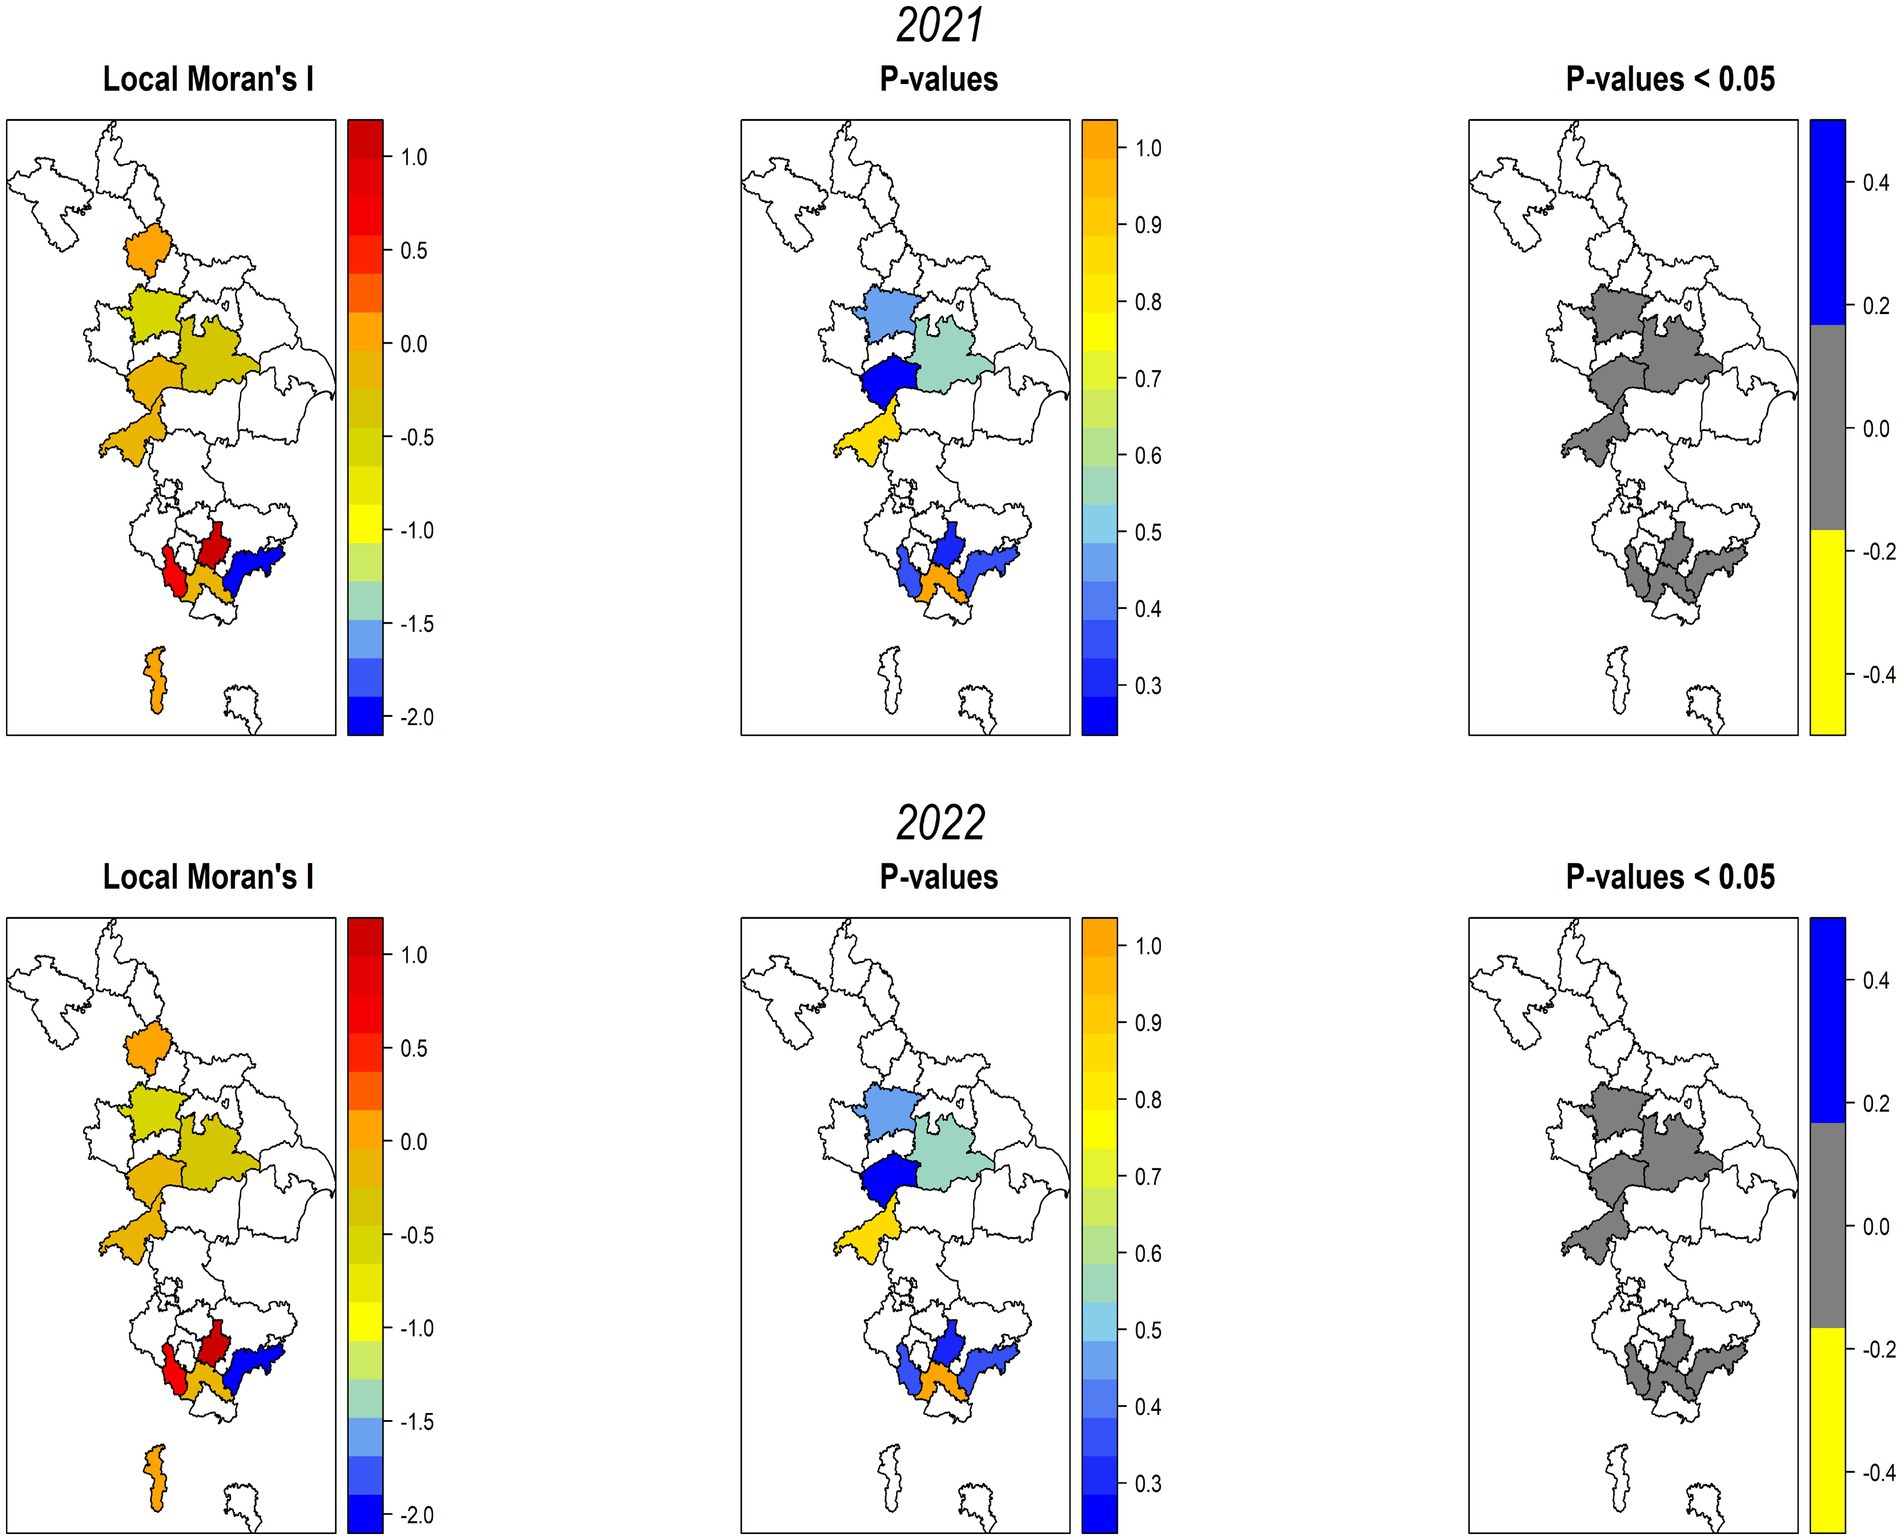
Figure 6. Local Moran’s I clusters across the surveyed areas of Southern India, as inferred from p values (<0.05), portray higher, medium, and lower spatial dependency rates.
In view of the significant p-values, the highest spatial dependence was noticed in Krishnagiri district of Tamil Nadu followed by Bidar district of Karnataka. The Ballari district of Karnataka exhibited medium spatial rates of dependency (non-significant). In contrast, the lowest spatial dependence was observed in the Kolar, Raichur, and Ramanagara districts of Karnataka and the Vellore districts of Tamil Nadu. When the p-values (p<0.05) were considered, all of the studied districts showed moderate spatial dependency (p < 0.05), indicating statistically insignificant clusters with randomness in most of the surveyed locations (Figure 6).
To validate the exact spatial point pattern of SMD, we additionally assessed Ripley’s K function (Figure 7), which considered the point patterns by calculating the average number of neighboring features associated with each feature at particular distances. The red line in Ripley’s K function represents the translation correction, while the blue and black lines denote the theoretical Poisson fitted data (expected), and observed data respectively, portraying the degree of point process clustering for different distance classes. Regarding the presence of infection in Kharif 2021–22 and 2022–23, all distances (in degrees) showed significant positive values, indicating that the observed disease patterns were moderately clustered among the surveyed locations. For every increase in evaluation distances, each point under consideration has a larger number of neighbors. The average number of neighbors was higher at distances of 0.5 and 1.5, indicating a significant cluster distribution.
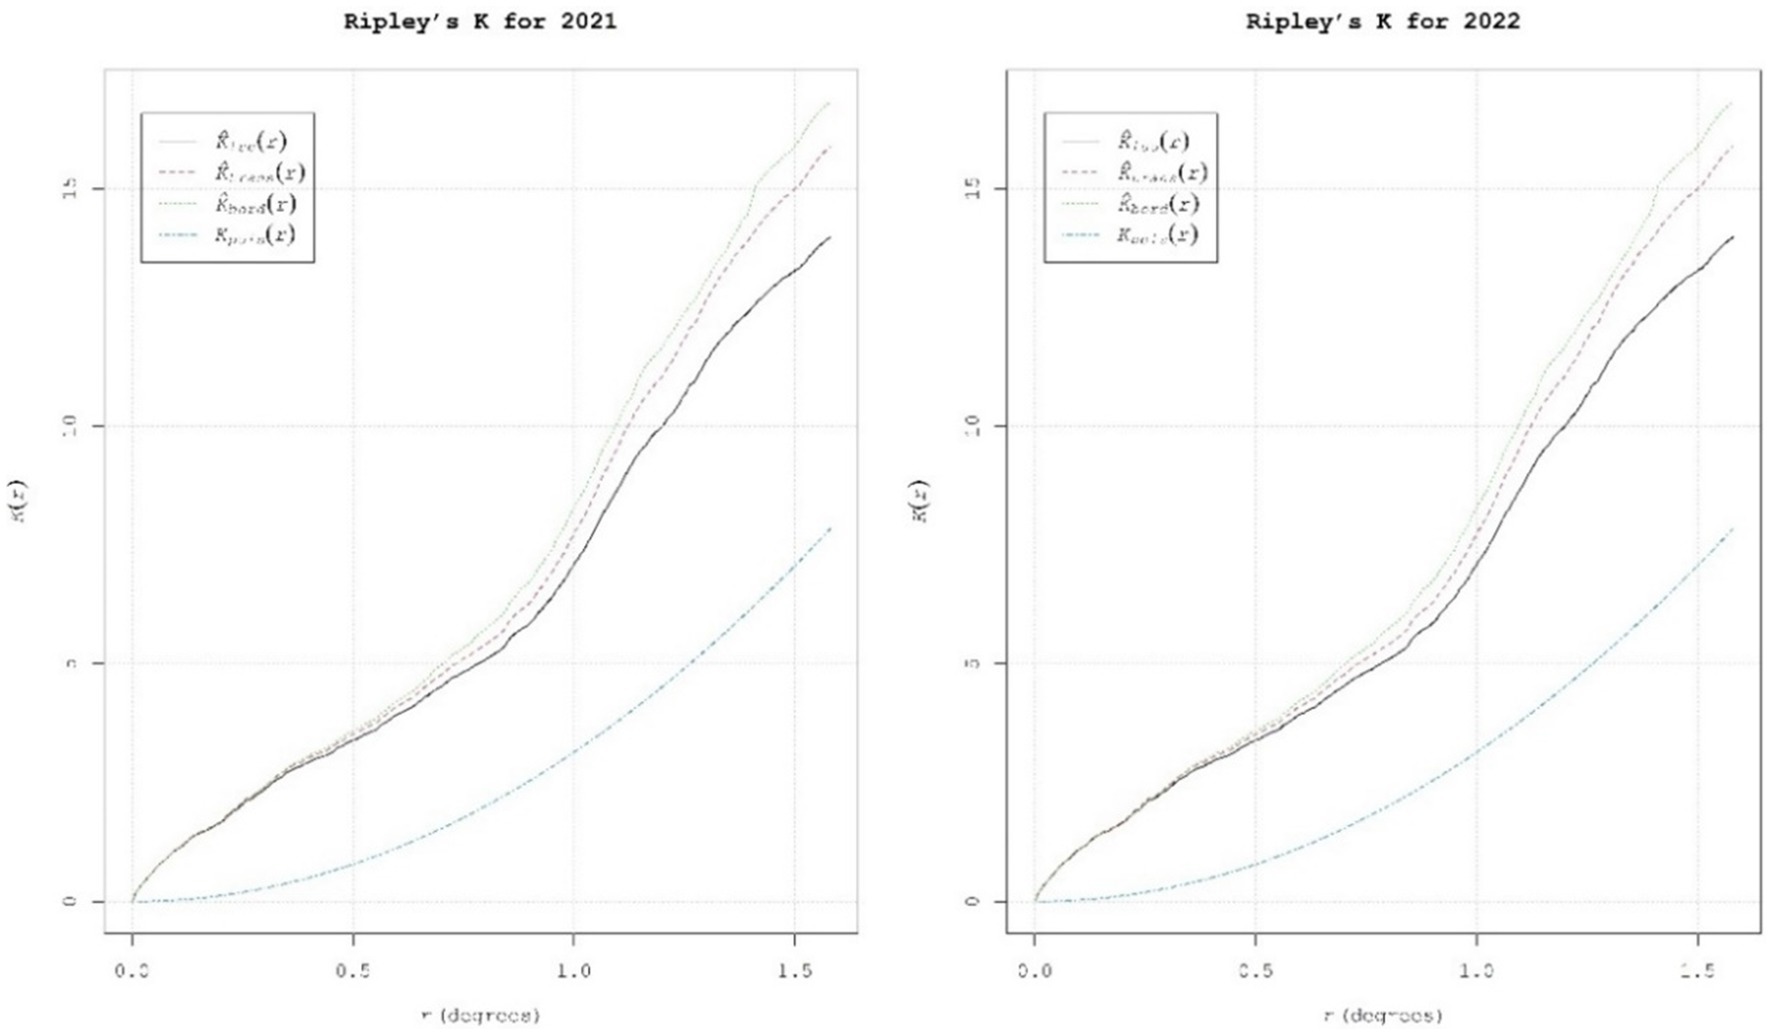
Figure 7. Ripley’s K function values showing the explicit spatial patterns of SMD of pigeonpea in Southern India.
Furthermore, the investigation of SMD point pattern analysis using LISA and Ripley’s K function revealed the existence of major hotspots in Krishnagiri district of Tamil Nadu, Bidar, Ballari, Bijapur, and Gulbarga districts of Karnataka, Chittoor and Prakasam districts of Andhra Pradesh, Ahmednagar district of Maharashtra and Mahbubnagar district of Telangana.
By utilizing a linearly weighted combination of a set of sampled points, IDW interpolation determined the cell values. A complete enumeration of discrete observations characterized the point data, i.e., the SMD incidence levels that occurred at discrete places inside the studied areas. IDW interpolation results were represented using color coded dataset maps with red color on the map portraying high SMD incidence rates (Figure 8). The interpolated surface areas of SMD varied significantly, showing that disease prevalence was not consistent across the surveyed locations during Kharif 2021–22 and 2022–23.
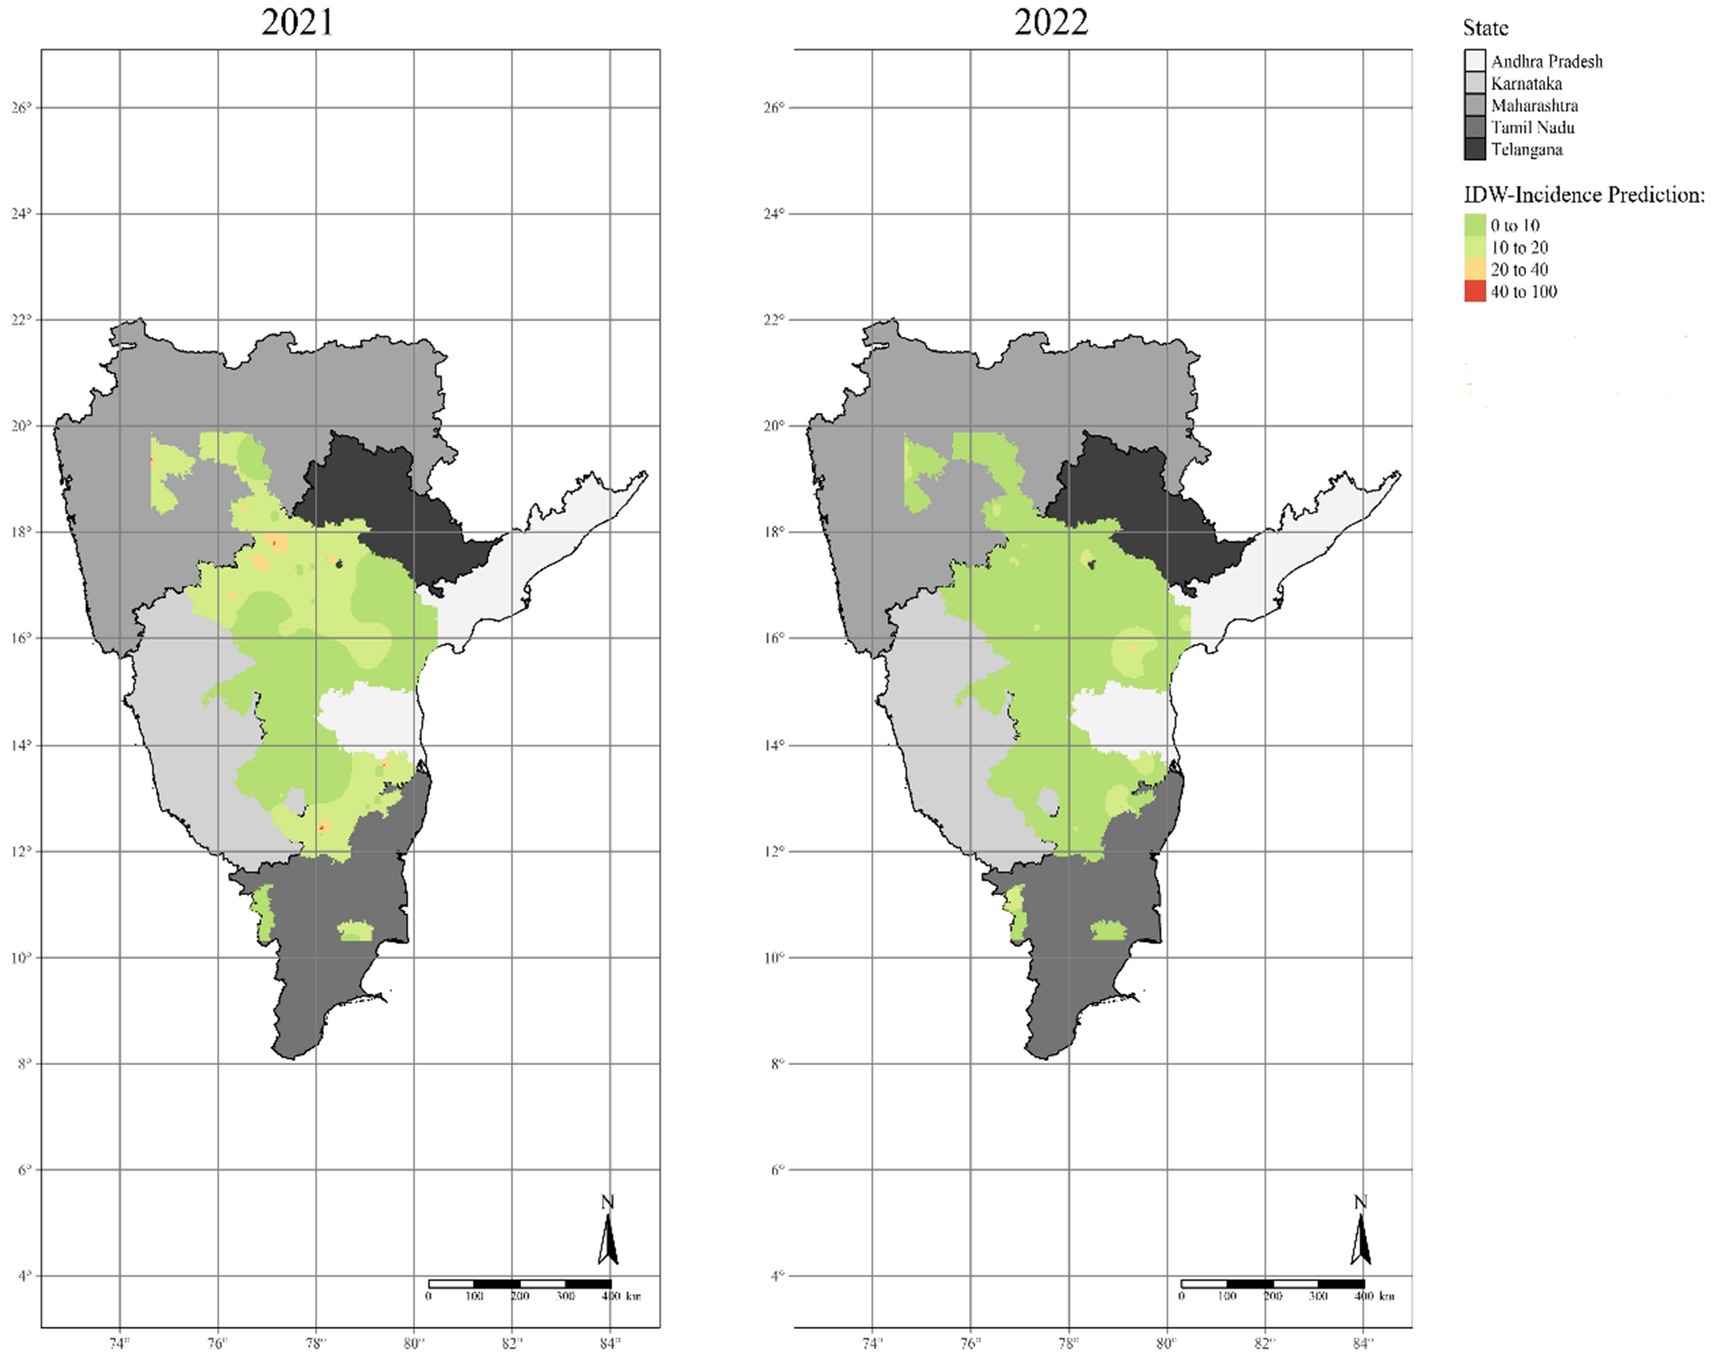
Figure 8. The optimized interpolated maps of sterility mosaic disease incidence created using the Inverse distance weighted (IDW) method.
During the disease assessment of Kharif 2021–22, we observed the highest SMD incidence in Tamil Nadu followed by Karnataka (40–100%), resulting in a potential risk of higher disease proportions at Krishnagiri and Bidar districts as central points. Gulbarga, Bijapur, and Bidar districts of Karnataka, Medak, parts of Mahbubnagar and Ranga Reddy districts in Telangana, Ahmednagar and Latur districts in Maharashtra, parts of Chittoor district in Andhra Pradesh and parts of Krishnagiri district in Tamil Nadu with 20–40% incidence, were represented as major hotspots for SMD. The majority of districts in all five states were low disease-prone regions for SMD with low disease incidence percentages (0–20%), resulting in cold spots. It is apparent from the maps that the SMD hotspots were mostly seen in Karnataka and Telangana states and a few parts of Tamil Nadu state particularly Krishnagiri district. However, in Kharif 2022–23, a different trend was observed in all the surveyed states, where parts of Prakasam district in Andhra Pradesh and Medak district in Telangana recorded the highest SMD incidence (20–40%). Similarly, the majority of districts in all five states were observed to be low disease-prone regions for SMD with low disease incidence rates (0–10%), resulting in cold spots. Moreover, it is noticeable from the maps that the Medak district in Telangana recorded a similar pattern of percent SMD incidence during the past 2 years and was observed as a major hotspot for SMD in the future.
Furthermore, the IDW results from our dataset were validated by generating a scatter diagram of the predicted vs. observed incidence observations of SMD (Figure 9). A solid diagonal line in the diagram indicates the one-to-one slope, while the red dashed line represents the linear fit to the points, which helped to distinguish the pattern created by the points. In the graph, the predicted vs. observed incidences of SMD were plotted along the line, without considering the errors. Later we found the accuracy of the interpolators by calculating the RMSE values of the model. The plotted results of the SMD during Kharif 2021–22 and 2022–23 across the surveyed locations in India varied remarkably, displaying RMSE values of 11.03 and 4.05, respectively. Therefore, the cross-validation results revealed that the IDW interpolation approach employed for the assessment of patterns based on the SMD incidence linked with pigeonpea fields showed a fair amount of under-prediction at larger SMD incidence values.
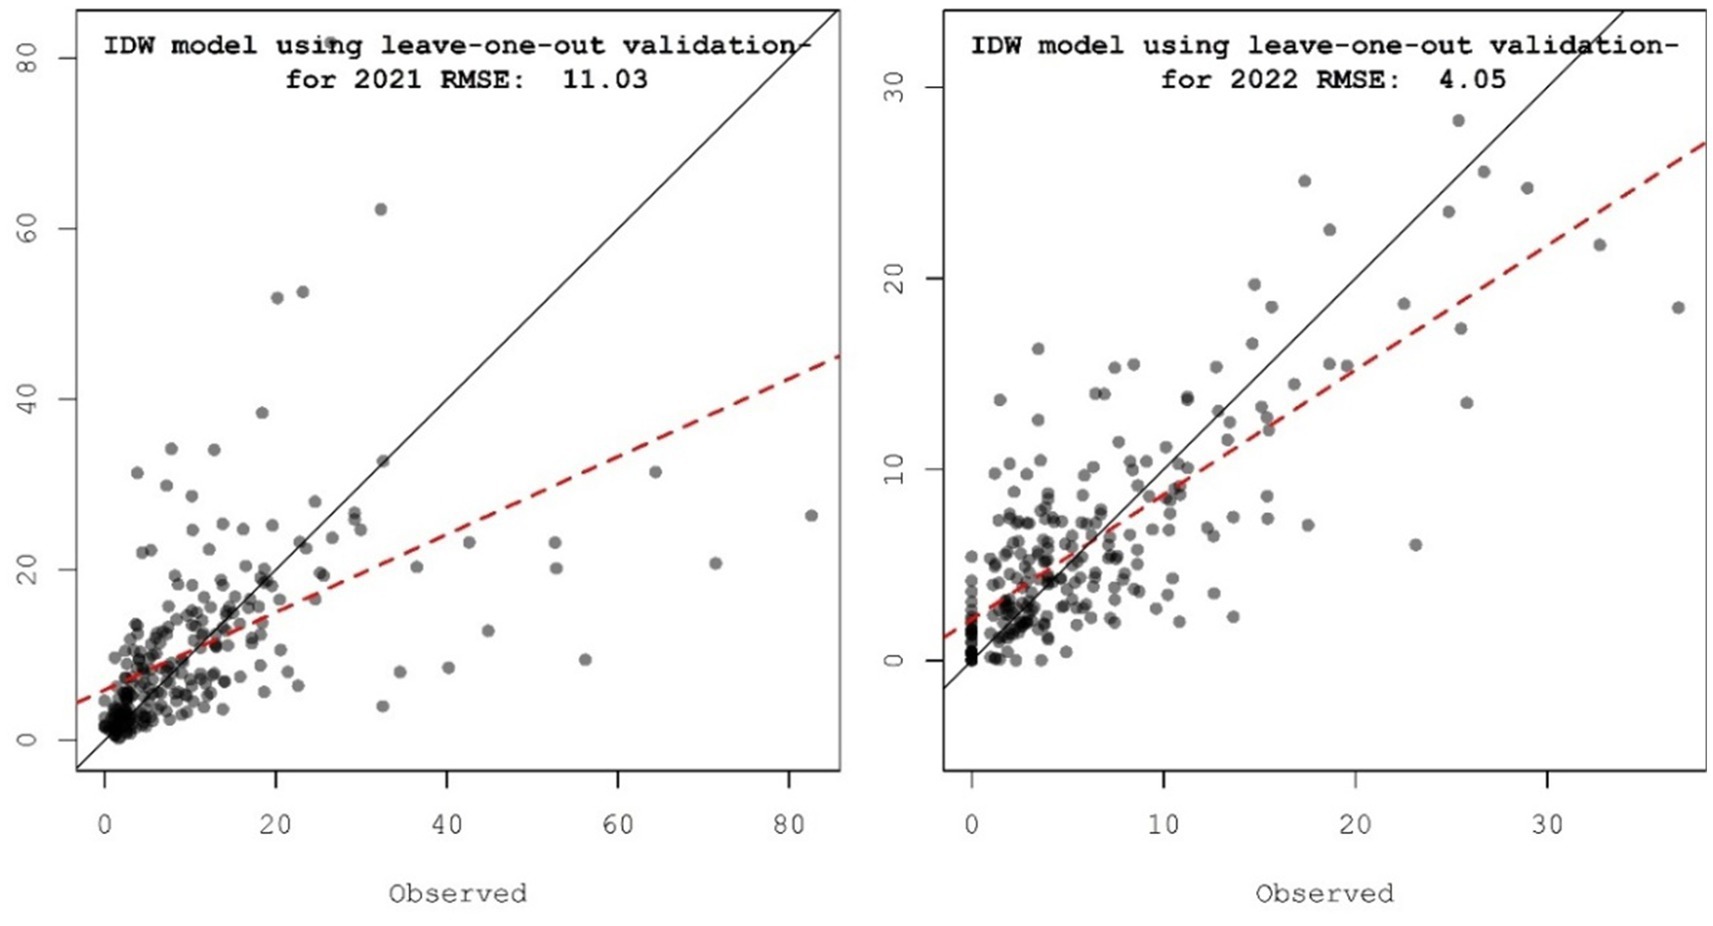
Figure 9. Scatter plot comparing predicted values vs. observed values at the different surveyed locations for SMD of pigeonpea in Southern India.
Various semivariogram experimental models namely spherical, exponential, Matern, and Gaussian models were applied and the SMD incidence dataset was examined at the spatial level. All these semivariogram models revealed that the dataset has no impact due to directional influences, hence, heterogenicity was not considered while carrying out OK.
Of the various semivariogram models employed for the Kharif 2021–22 data (Table 2 and Figure 10), the best fit of the Matern model was due to cross-validation results displaying the lower MSE = 124.0767, RMSE = 13.9646, MAPE = 0.7471, and MAE = 6.1972 values. Similarly, in the Kharif 2022–23 data, the Matern model showed the best fit with lower MSE = 15.4425, RMSE = 3.9297, MAPE = 8.1475 and MAE = 2.7519 values. In both years of data, the values of the nugget and range (in degrees) were shown to be 0.5, and 1.194862 respectively, using a fitted model.
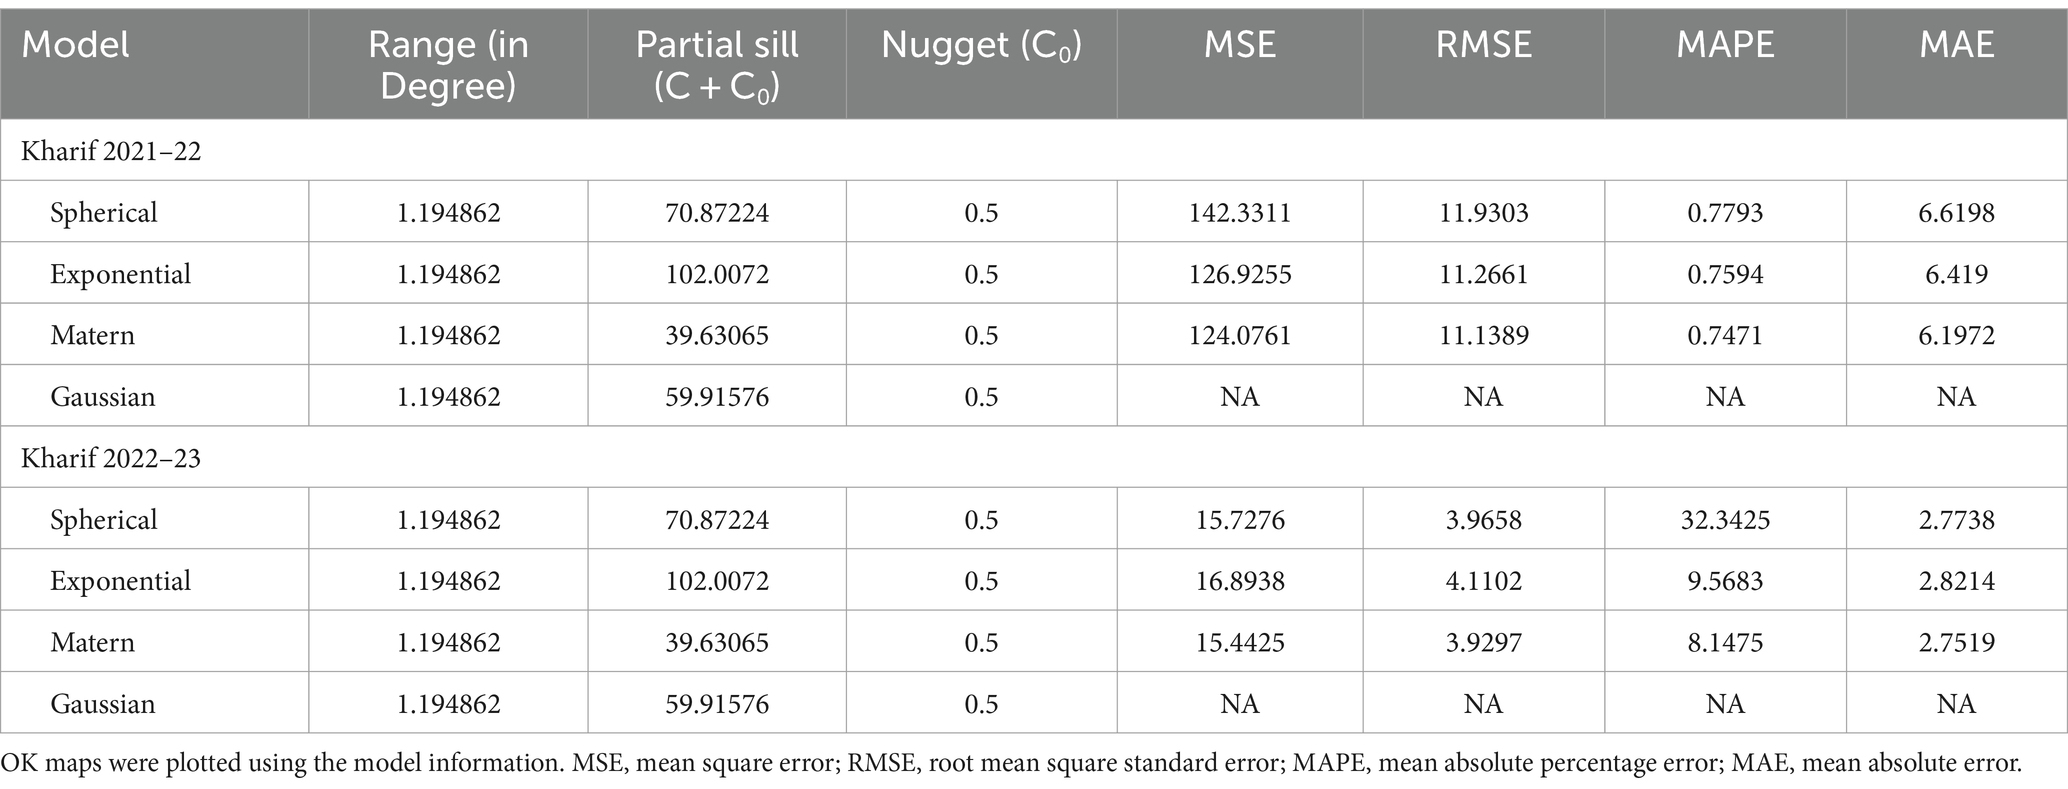
Table 2. Cross-validation results of semivariogram experimental models on SMD disease incidence.
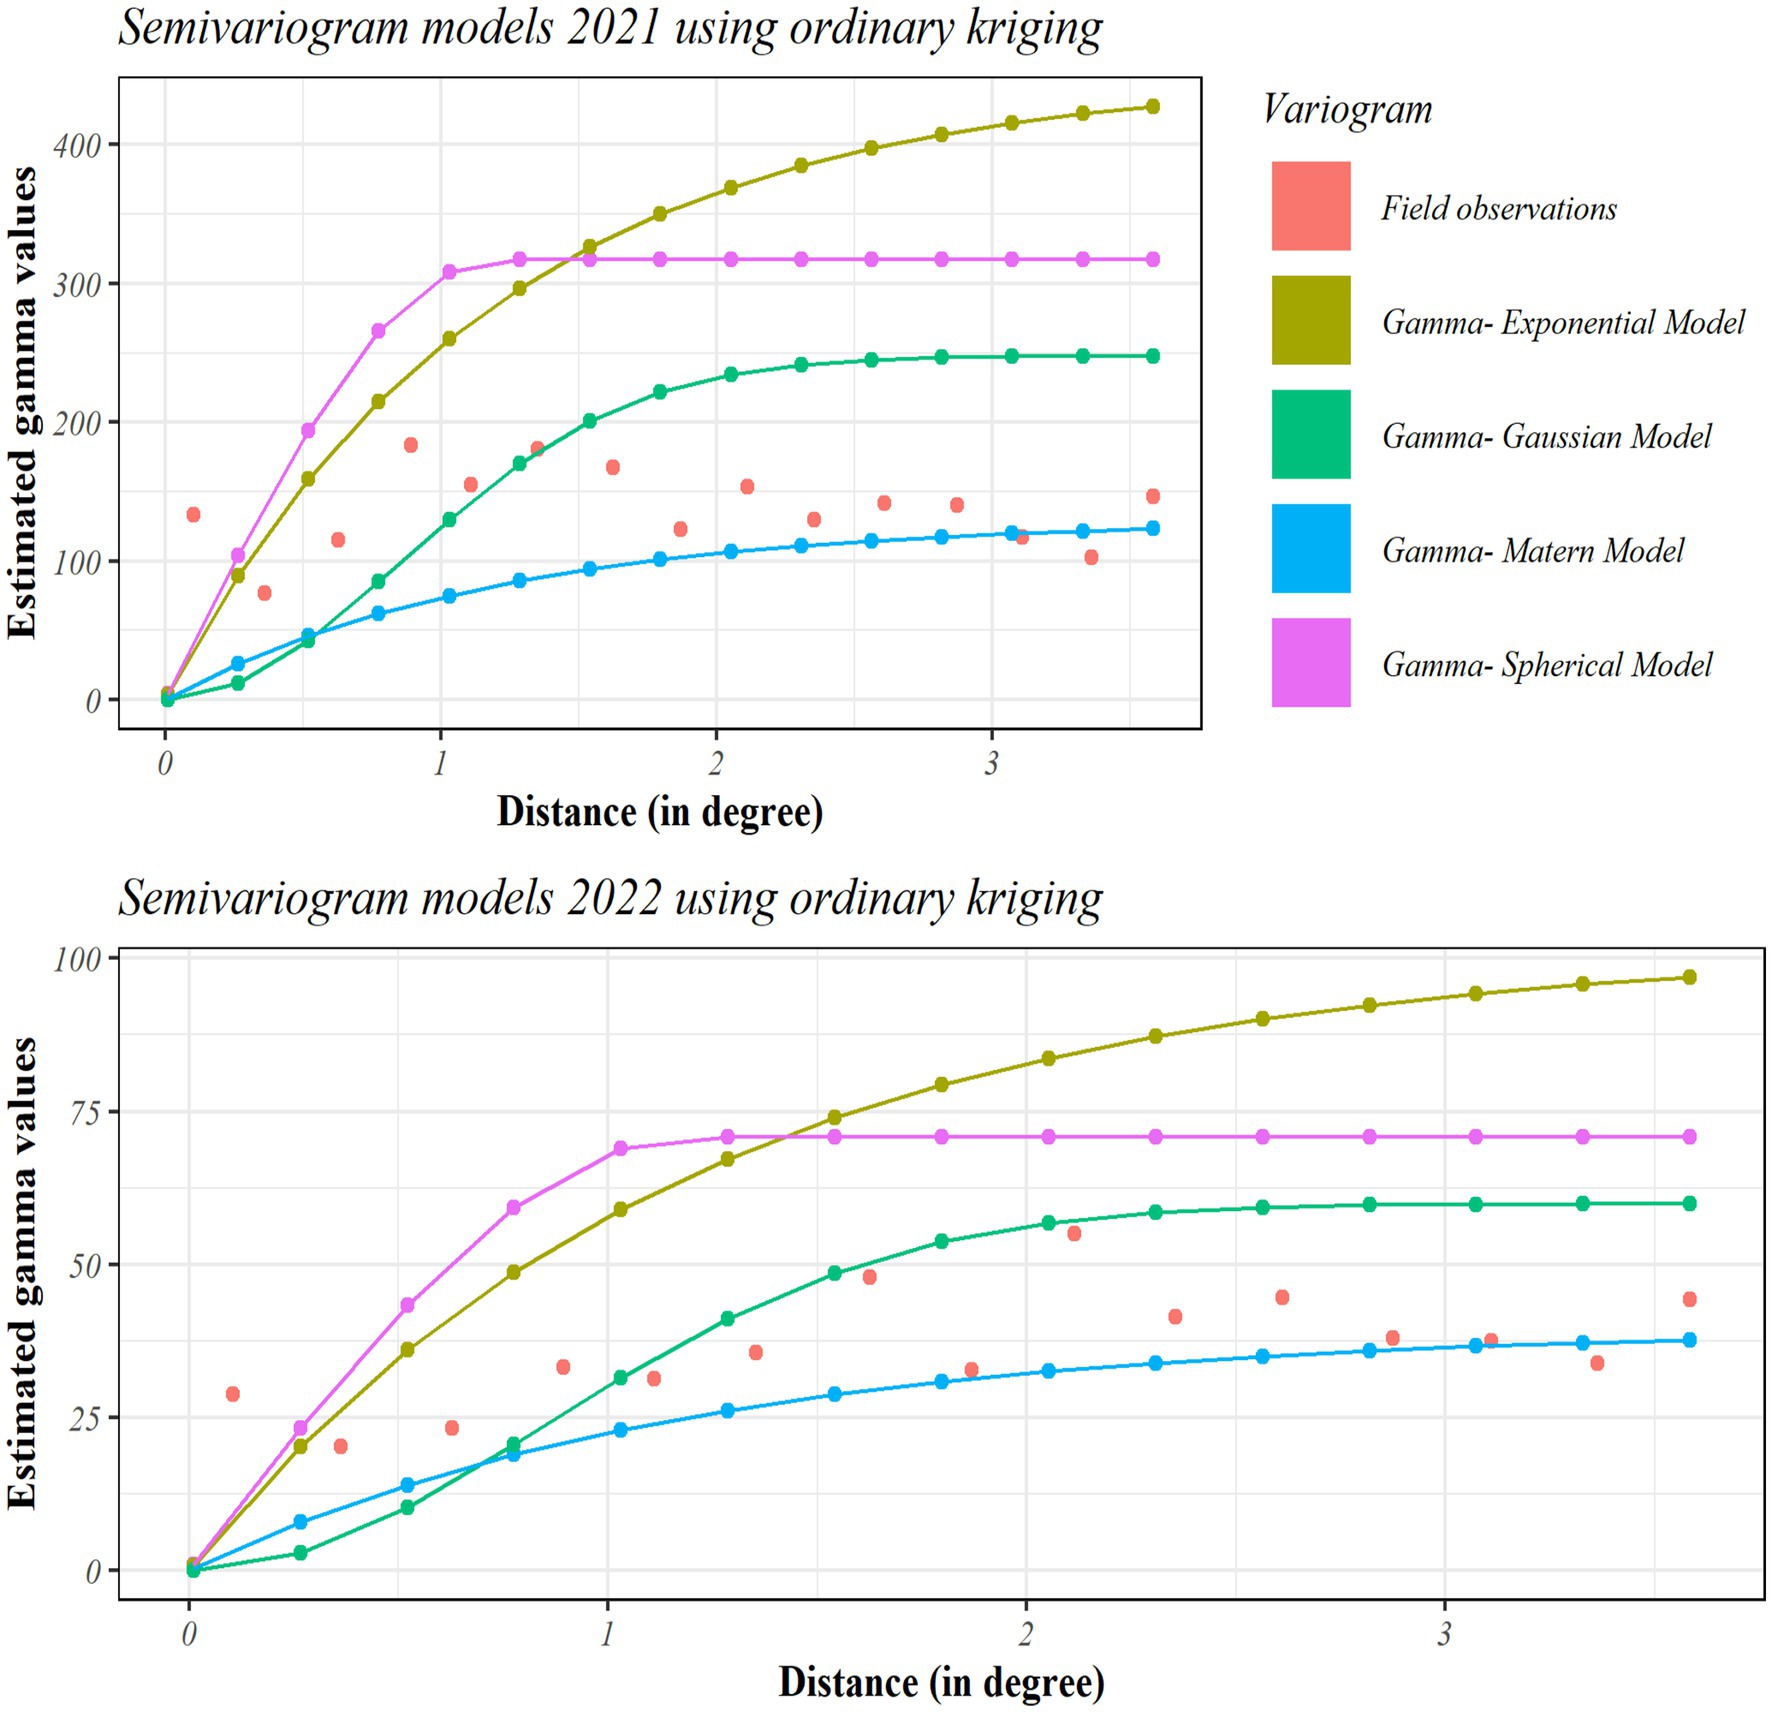
Figure 10. Semivariogram of different experimental models of SMD incidence.
The Kolmogorov–Smirnov test revealed that the mean SMD incidence collected across pigeonpea-growing regions in India during Kharif 2021–22 and 2022–23 followed a normal distribution, which was represented by means of histograms and a standard QQ plot of the dataset (Figure 11).
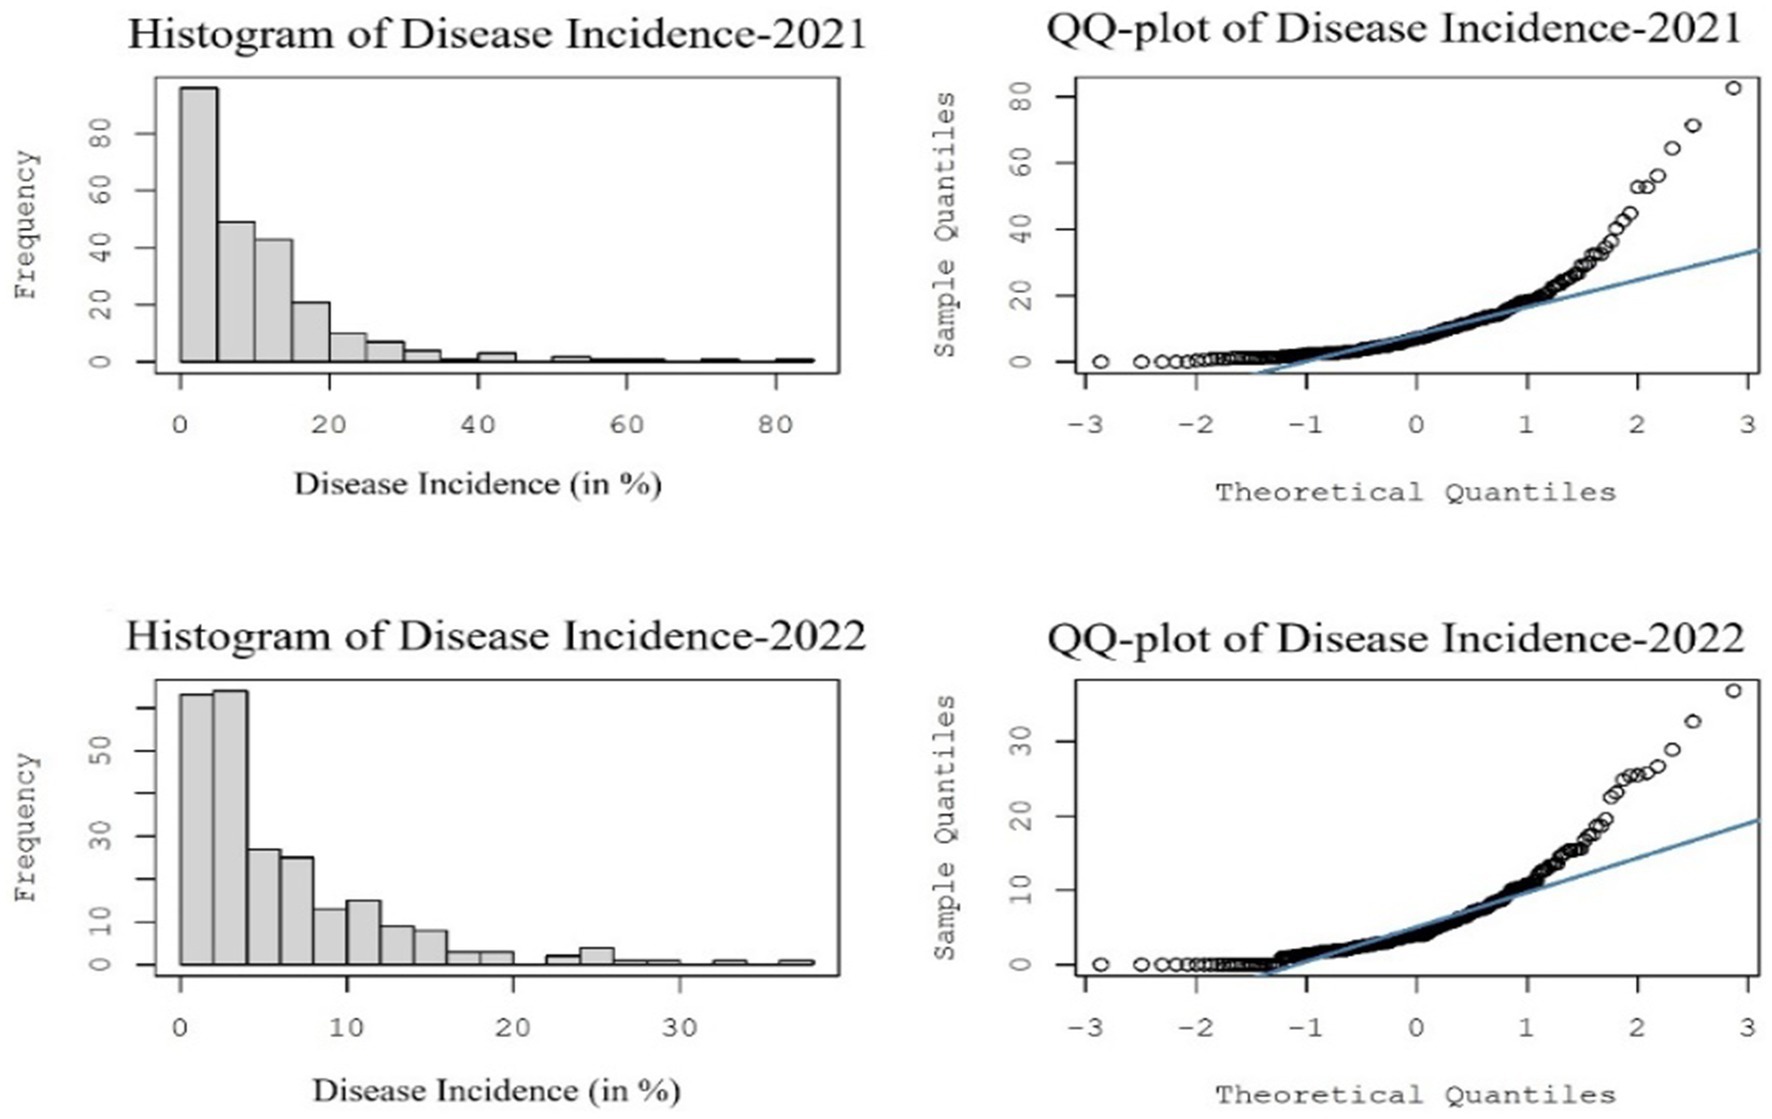
Figure 11. Histograms and normal QQ plots of sterility mosaic disease incidence data used to understand the distribution of the dataset.
Similar to IDW method, OK was utilized to investigate the spatial surface patterns of SMD in various pigeonpea-growing areas by studying disease incidence observations (n = 116). Based on SMD incidences across the surveyed areas in India, the spatial distributions differ mostly from year-to-year and from location-to-location during Kharif 2021–22 and 2022–23. The highest spatial SMD distribution (60–70%) was observed in Krishnagiri district of Tamil Nadu, Bidar district of Karnataka, and Chittoor district of Andhra Pradesh, while medium SMD incidence (30–40%) was observed in parts of Latur district in Maharashtra, Medak and Ranga Reddy districts of Telangana and Prakasam district of Andhra Pradesh. However, the majority of the other districts in all five states showed relatively lower percentages (0–10%) of SMD incidence (Figure 12).
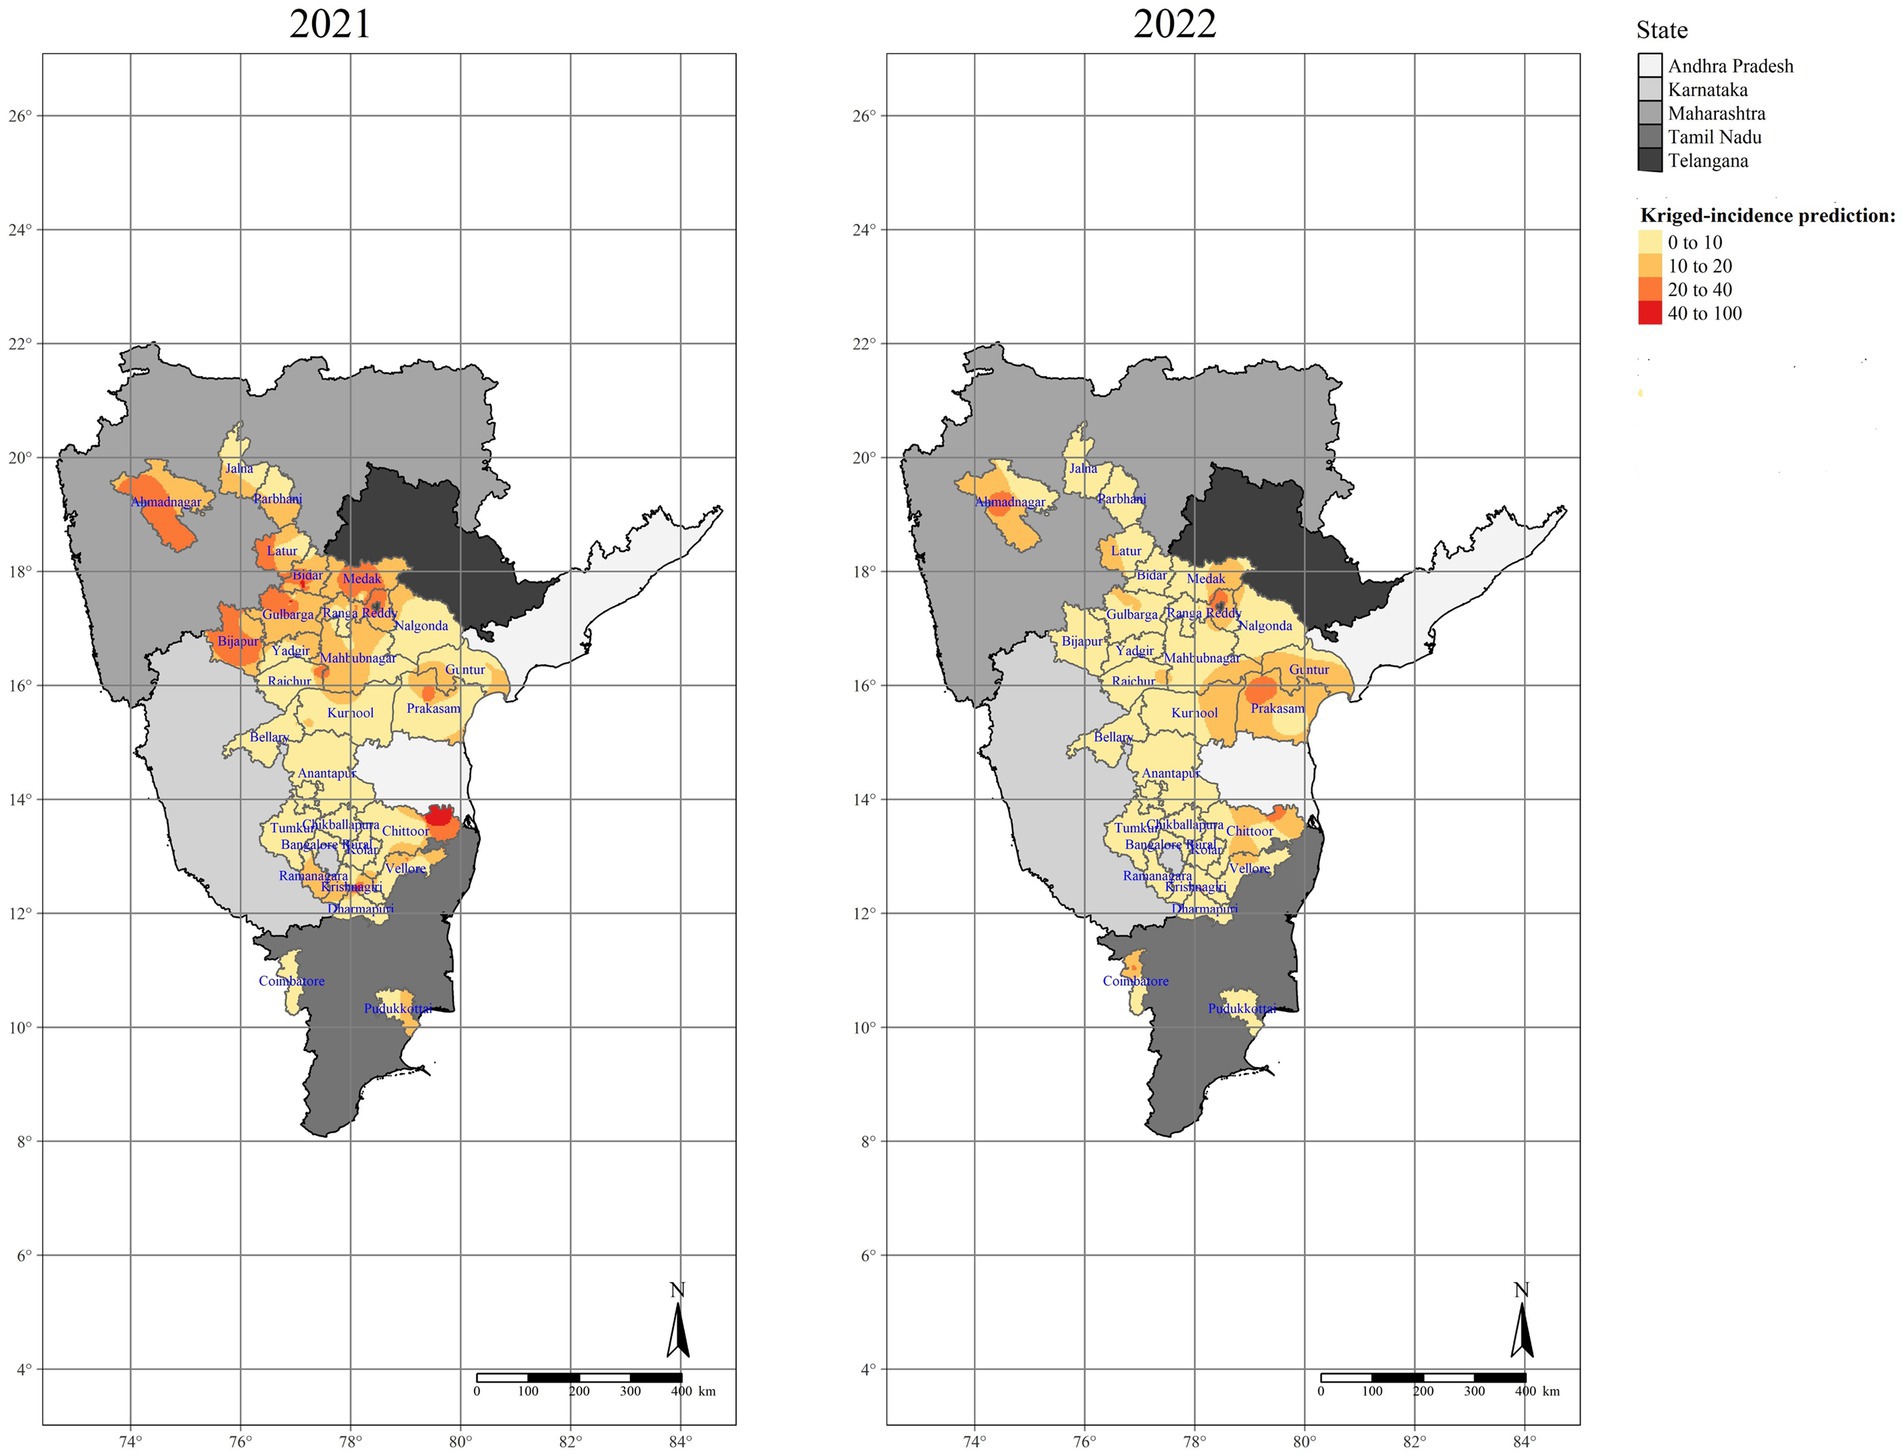
Figure 12. Ordinary Kriging (OK) interpolated maps representing the spatial distribution of SMD in different surveyed locations of Southern India.
Of the various models employed, the spherical model for spatial distribution analysis of the SMD incidence data was found to be the best fit by studying the model parameters and cross-validation results with lower MSE = 25.0609, RMSE = 5.0061, MAPE = 0.5374, and MAE = 4.1459 values. Moreover, in all the models, the values of nugget and range in degrees were found to be similar (Table 3).
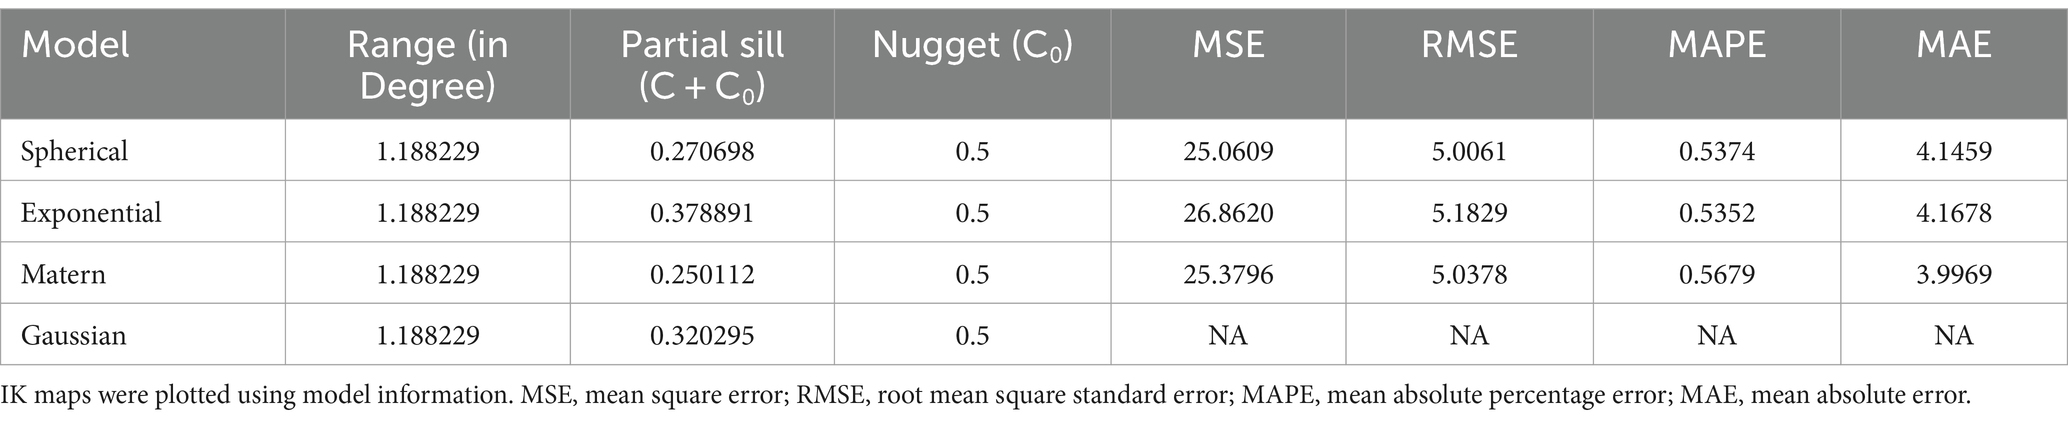
Table 3. Cross-validation results of semivariogram experimental models on SMD disease incidence.
Like OK, IK was investigated in the same way. The probability distribution map (Figure 13) was constructed by taking into account the mean SMD incidence data during Kharif 2021–22 and 2022–23, along with the threshold value (SMD incidence >25%). Based on the IK data map, Chittoor, Prakasam, and Guntur districts of Andhra Pradesh, all districts of Telangana, Bidar, Bijapur, Gulbarga, Ramanagara, parts of Raichur districts of Karnataka, and Latur, parts of Ahmednagar and Jalna districts in Maharashtra states were highly susceptible and high-risk areas for SMD occurrence among the surveyed areas. Of the total interpolated surface area, less than 30% of the studied areas posed a lower probability risk, which mainly included Karnataka districts, 20% posed a medium probability risk, and 50% posed a high probability risk. As a result of the OK and IK results, the Krishnagiri district of Tamil Nadu, Bidar and Bijapur districts of Karnataka, Chittoor district of Andhra Pradesh, Medak and Ranga Reddy districts of Telangana, and Latur district of Maharashtra states were identified as potential SMD risk areas that require immediate action to manage and restrict the further movement to neighboring districts.
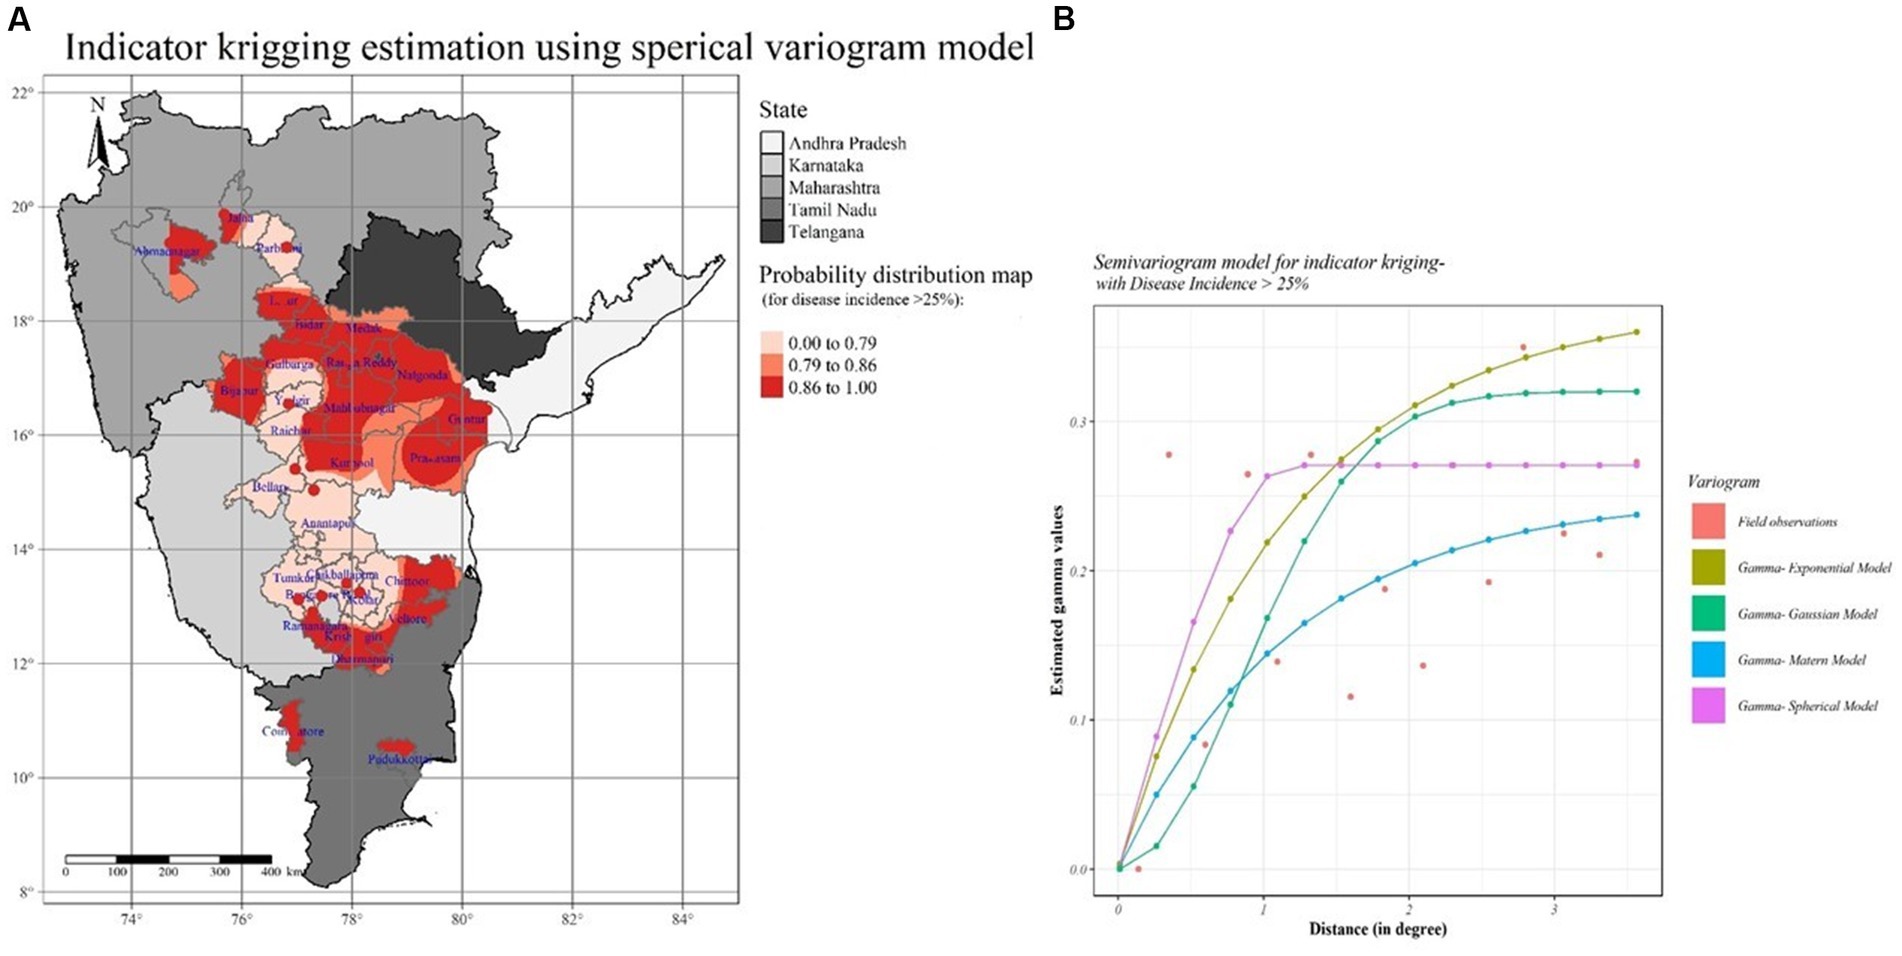
Figure 13. SMD probability distribution map for surveyed locations in Southern India. (A) Semivariogram model information (B) Indicator Kriging (IK).
SMD of pigeonpea is a serious biotic threat to its production worldwide. The epidemic nature of SMD is favored by a congenial environment and leads to the rapid multiplication of viruliferous mites and viruses and congenial environmental conditions favoring eriophyid mite multiplication and genotype susceptibility favor the rapid spread of SMD (Sharma et al., 2015). Hence, it is compulsory to understand the distribution of SMD at spatial level in the major pigeonpea-growing areas of the Indian subcontinent. Although the occurrences of SMD in pigeonpea-growing areas of India are frequent, there is still a lack of systemic studies and information on the prevalence of SMD in recent times (Sayiprathap et al., 2020). For the first time in India, our study determined the present status and explicit spatial distribution of SMD in major pigeonpea-growing states, including Maharashtra, Telangana, Karnataka, Andhra Pradesh, and Tamil Nadu by employing various geostatistical techniques.
The current investigation describes the first attempt to map the current status and to determine the occurrence of SMD in major pigeonpea-growing regions in India. We employed GIS methods in concurrence with spatial pattern and risk assessment methods to assess the discrete patterns of the SMD incidence dataset. A systematic survey on the SMD incidence in pigeonpea in major pigeonpea growing regions of Andhra Pradesh, Karnataka, Tamil Nadu, and Telangana states of Southern India indicated a huge variation in disease incidence ranging from 0 to 82.64% and 0 to 36.84%, respectively, in Kharif 2021–22 and 2022–23.
In Andhra Pradesh, SMD occurrence, ranged from 1.64 to 64.37% in Kharif 2021–22 and 0.96 to 32.72% in Kharif 2022–23. In Karnataka, SMD was found to be a major problem throughout the state and its incidence varied was up to 82.64 and 16.80%, respectively, in Kharif 2021–22 and 2022–23. Kannaiyan et al. (1984) recorded the highest disease incidence (49.70%) in the Bidar district. Whereas, Manjunath et al. (2013) have recorded 29.40 and 21.70% incidence in Kolar and Gulbarga districts respectively, during Kharif 2010 as compared to the present study. Moreover, Sayiprathap et al. (2020) recorded SMD incidence of 19.78% in the Kolar district, followed by 12.33% in Vijayapura and 14.71% in Gulbarga districts, respectively. The higher SMD incidence in Karnataka could be ascribed due to the cultivation of susceptible cultivars such as Gulyal local, TS-3R, ICP 8863 and other local varieties. In Maharashtra, disease incidence ranged from 1.42 to 56.20% in Kharif 2021–22 and upto 25.80% in Kharif 2022–23, respectively. In Tamil Nadu, disease incidence was ranging from 0 to 71.40% in Kharif 2021–22 and 0 to 25.50% in Kharif 2022–23. Nevertheless, previous studies has reported varying incidences of SMD in Tamil Nadu. For example, Kannaiyan et al. (1984) observed the highest incidence at 37.50% in the Pudukkottai district, while Ramakrishnan and Kandaswamy (1972) found a range of 0 to 100% incidences across Tamil Nadu. Sayiprathap et al. (2020) documented the highest SMD incidence in the Krishnagiri district, which stood at 16.25%. In Telangana, incidence of SMD in all surveyed locations ranged from 2.40 to 44.82% in Kharif 2021–22 and 0 to 36.84% in Kharif 2022–23. Our results are in agreements with Kannaiyan et al. (1984) reported a 7.80% SMD incidence in the Nalgonda district and Sayiprathap et al. (2020) who reported 0 to 8.0% in the Telangana state. Two main SMD clusters were formed by agglomerative hierarchical cluster analysis among the 29 surveyed districts, where Bidar and Krishnagiri districts with the highest SMD incidence formed a single cluster. The Bidar and Krishnagiri districts of Karnataka and Tamil Nadu were previously reported to have severe SMD incidence (Manjunath et al., 2013; Sayiprathap et al., 2020).
In the current investigation, we observed moderate SMD spatial clusters through the LISA method. Higher spatially dependent clusters were noticed in Krishnagiri districts of Tamil Nadu, while the remaining districts displayed medium to least spatial dependence, as shown by Ripley’s K function. SMD is a vector-borne disease and could have entered the newly sown fields via the spread of viruliferous eriophyid mites from volunteer plants. Leftover infected pigeonpea plants after harvesting, and the presence of perpetual pigeonpea and crop wild relatives, such as C. scarabaeoides, in the fields might act as possible sources of initial virus infection (Narayana et al., 2000; Kumar et al., 2008), thus providing an opportunity for repeated cycles of SMD infection. Furthermore, the SMD spread within the fields is largely dependent on the proximity to sources of inoculum, the age of the plant, genetic reaction, environmental conditions, and the population of eriophyid vector mites. The clustering of points in various studied areas might be attributed to the rapid spread of the virus inoculum through viruliferous eriophyid mites and the continuous growth of susceptible genotypes throughout the surveyed states of India (Dharmaraj et al., 2004).
Based on the available literature, no studies have employed point pattern and surface prediction analysis to determine the distribution patterns of SMD. From our analysis, hotspots were observed in Bidar, Ballari, and Kolar districts of Karnataka and Krishnagiri district of Tamil Nadu. Therefore, the persistence of considerable SMD clusters or hotspots over different states, with neighboring districts in all five states, might be useful in the future for designing proper control strategies and in the suitable monitoring of SMD. These findings supported with earlier research that used point pattern GIS analysis to identify risk areas of Cacao swollen shoot virus disease (Oro et al., 2012) and Bean pod mottle virus disease epidemics (Byamukama et al., 2014).
During this study, information on SMD incidence was utilized to construct spatial distribution maps across surveyed locations in India. By employing IDW, OK, and IK, datasets at unvisited sites were also generated across India. The per cent SMD incidence semivariogram specified comparatively medium spatial dependency. As demonstrated by the spatial clusters, kriging is a more appropriate interpolation method than IDW, which has numerous limitations associated with distance-dependent interpolation, thus, using OK to build spatial distribution maps of SMD is suggested (Yao et al., 2013; Gong et al., 2014).
The semivariogram experimental models showed the distribution of SMD across the pigeonpea regions in India, as well as the existence of moderate spatial clusters and autocorrelation among pigeonpea fields, indicating significant disease prevalence rates as well as the ease with which it spreads. Additionally, randomization was seen in several tested pigeonpea fields, which might be described by the variations in the stage of the crop. The original virus source existing in the fields would have had time to spread across the pigeonpea fields over the years, giving rise to the random pattern of infected fields. Our results were in agreement with experimental models that showed high variability in Cacao swollen shoot virus disease (Oro et al., 2012) and Bean pod mottle virus disease epidemics (Byamukama et al., 2014).
The shortcoming of OK is that while creating smoothed maps, it does not consider extreme disease incidence observations (Farias et al., 2002). To escape this limitation, the IK method was used to create probability distribution maps of SMD risk areas in different states of India. Similarly, the IK method was used to model probability maps for various crops, identifying regions of uncertainty related to disease presence, as demonstrated in previous works (Chiles and Delfner, 1999; Alves and Pozza, 2010; Balanagouda et al., 2021; Amoghavarsha et al., 2022; Huded et al., 2022). The probability risk maps constructed in the current investigation display potential sites of uncertainty, highlighting the highest probability zones where SMD incidence has surpassed the defined threshold (incidence >25%). Owing to limited dataset availability and uncertainty surrounding the precise SMD incidence threshold, we adopted a disease incidence of greater than 25% as the benchmark for creating these probability risk maps. Therefore, the probability distribution maps developed in this study can assist scientists and farmers in identifying areas of uncertainty owing to SMD in pigeonpea fields across Southern India and indicating where intervention methods could be implemented.
The present investigation showed the widespread prevalence of SMD across the surveyed locations in Southern India. Information on the spatial distribution of SMD and its hotspots will be of considerable importance to all future lines of work under changing climate scenario. Study will guide to understand the pathogenic diversity, host x pathogen interactions as well as developing management strategies to limit the threshold level of disease. The generation of spatially explicit risk estimation and probability distribution maps will aid in providing a structural framework for the dissemination of disease management practices in affected areas. The present study has also enabled us to understand the aggregate patterns of SMD at regional levels and provides an opportunity to assist farmers and other stakeholders in establishing control strategies and preventing the potential spread of SMD to nearby districts, regions, and even states in the times ahead.
The original contributions presented in the study are included in the article/Supplementary material, further inquiries can be directed to the corresponding author/s.
KM: Conceptualization, Data curation, Formal analysis, Investigation, Methodology, Writing – original draft. GS: Conceptualization, Investigation, Methodology, Supervision, Writing – review & editing. SS: Formal analysis, Software, Validation, Visualization, Writing – review & editing. SK: Conceptualization, Investigation, Methodology, Writing – review & editing. BP: Data curation, Formal analysis, Software, Writing – original draft. US: Data curation, Formal analysis, Validation, Writing – original draft. PA: Formal analysis, Writing – original draft. MS: Conceptualization, Funding acquisition, Investigation, Methodology, Project administration, Resources, Supervision, Validation, Visualization, Writing – review & editing.
The author(s) declare that financial support was received for the research, authorship, and/or publication of this article. The research is supported by Climate Change Programme Division, Department of Science and Technology (DST), Government of India performed under the project DST-ICRISAT “Center of Excellence on Climate change research for plant protection: Pest and disease management for climate change adaptation” [Project No: DST/CCP/CoE/142/2018(G)]. The authors are thankful to DST financial assistance to conduct this study.
The authors are thankful to the state agricultural universities (SAUs), research institutions including Krishi Vigyan Kendra (KVK) and Agricultural Research Stations (ARS) and farming communities for supporting us in conducting the surveys during Kharif 2021-22 and 2022-23.
The authors declare that the research was conducted in the absence of any commercial or financial relationships that could be construed as a potential conflict of interest.
All claims expressed in this article are solely those of the authors and do not necessarily represent those of their affiliated organizations, or those of the publisher, the editors and the reviewers. Any product that may be evaluated in this article, or claim that may be made by its manufacturer, is not guaranteed or endorsed by the publisher.
The Supplementary material for this article can be found online at: https://www.frontiersin.org/articles/10.3389/fsufs.2024.1386823/full#supplementary-material
Alves, M. C., and Pozza, E. A. (2010). Indicator kriging modeling epidemiology of common bean anthracnose. Appl. Geomat. 2, 65–72. doi: 10.1007/s12518-010-0021-1
Amoghavarsha, C., Pramesh, D., Sridhara, S., Patil, B., Shil, S., Naik, G. R., et al. (2022). Spatial distribution and identification of potential risk regions to rice blast disease in different rice ecosystems of Karnataka. Sci. Rep. 12:7403. doi: 10.1038/s41598-022-11453-9
Balanagouda, P., Sridhara, S., Shil, S., Hegde, V., Naik, M. K., Narayanaswamy, H., et al. (2021). Assessment of the spatial distribution and risk associated with fruit rot disease in Areca catechu L. J. Fungi 7:797. doi: 10.3390/jof7100797
Bivan, R. S., Pebesma, E. J., and Gomez-Rubio, V. (2008). Applied spatial data analysis with R. Berlin: Springer.
Burrough, A. (1986). Principles of geographical information Systems for Land Resource Assessment. Oxford, UK: Clarendon Press.
Byamukama, E., Eggenberger, S. K., Coelho-Netto, R. A., Robertson, A. E., and Nutter, F. W. (2014). Geospatial and temporal analyses of bean pod mottle virus epidemics in soybean at three spatial scales. Phytopathology 104, 365–378. doi: 10.1094/PHYTO-12-12-0323-R
Chellemi, D. O., Rohrbach, K. J., Yost, R. S., and Sonoda, R. M. (1988). Analysis of the spatial pattern of plant pathogens and diseased plants using geostatistics. Phytopathology 78, 221–226. doi: 10.1094/Phyto-78-221
Chiles, J. P., and Delfner, P. (1999). Geostatistics: Modeling spatial uncertainty. Hoboken: Wiley-Interscience.
Dharmaraj, P. S., Narayana, Y. D., Kumar, P. L., Waliyar, F., and Jones, A. T. (2004). Pigeonpea sterility mosaic disease: an emerging problem in northern Karnataka. Int. Chickpea Pigeonpea Newsl. 11, 47–49.
Elbeaino, T., Digiaro, M., Uppala, M., and Sudini, H. (2015). Deep sequencing of dsRNAs recovered from mosaic-diseased pigeonpea reveals the presence of a novel emaravirus, pigeonpea sterility mosaic virus 2. Arch. Virol. 160, 2019–2029. doi: 10.1007/s00705-015-2479-y
FAOSTAT . (2021). Food and agriculture organization of the United Nations, Available at: http://faostat.fao.org
Farias, P., Sanchez-Vila, X., Barbosa, J., Vieira, S., Ferraz, L., and Solis-Delfin, J. (2002). Using geostatistical analysis to evaluate the presence of Rotylenchulus reniformis in cotton crops in Brazil: economic implications. J. Nematol. 34, 232–238
Freitas, A. S., Pozza, E. A., Alves, M. C., Coelho, G., Rocha, H. S., and Pozza, A. A. A. (2016). Spatial distribution of yellow Sigatoka leaf spot correlated with soil fertility and plant nutrition. Precis. Agric. 17, 93–107. doi: 10.1007/s11119-015-9409-6
Ghosh, R., Tarafdar, A., Rao, M. K., Srinivas, K., and Sharma, M. (2023). Pigeonpea crop improvement: Genomics and post genomics. Cham, Springer Nature Singapore: In Smart Plant Breeding for Field Crops in Post genomics Era, 271–292.
Gong, G., Mattevada, S., and O’bryant, S. E. (2014). Comparison of the accuracy of kriging and IDW interpolations in estimating groundwater arsenic concentrations in Texas. Environ. Res. 130, 59–69. doi: 10.1016/j.envres.2013.12.005
Huded, S., Pramesh, D., Chittaragi, A., Sridhara, S., Chidanandappa, E., Prasannakumar, M. K., et al. (2022). Spatial distribution patterns for identifying risk areas associated with false smut disease of Rice in southern India. Agronomy 12:2947. doi: 10.3390/agronomy12122947
Kannaiyan, J., Nene, Y. L., Reddy, M. V., Ryan, J. G., and Raju, T. N. (1984). Prevalence of pigeonpea diseases and associated crop losses in Asia, Africa and the Americas. Trop. Pest Manag. 30, 62–72. doi: 10.1080/09670878409370853
Kaufman, L., and Rousseeuw, P. J. (2009). Finding groups in data: An introduction to cluster analysis. Hoboken, NJ: John Wiley and Sons.
Koch, F. H., and Smith, W. D. (2008). Spatiotemporal analysis of Xyleborus glabratus (Coleoptera: Circulionidae: Scolytinae) invasion in eastern US forests. Environ. Entomol. 37, 442–452. doi: 10.1093/ee/37.2.442
Kulkarni, N. K., Kumar, P. L., Muniyappa, V., Jones, A. T., and Reddy, D. V. R. (2002). Transmission of Pigeonpea sterility mosaic virus by the eriophyid mite, Aceria cajani (Acari: Arthropoda). Plant Dis. 86, 1297–1302. doi: 10.1094/PDIS.2002.86.12.1297
Kumar, P. L., Jones, A. T., Sreenivasulu, P., and Reddy, D. V. R. (2000). Break-through in the identification of the causal virus of pigeonpea sterility mosaic disease. J. Mycol. Plant Pathol. 30:249.
Kumar, P. L., Jones, A. T., and Waliyar, F. (2008). “Virus diseases of pigeonpea” in Characterization, diagnosis and Management of Plant Viruses (Texas, USA: Studium Press), 235–258.
Manjunath, L., Ramappa, H. K., Byre Gowda, M., Rangaswamy, K. T., and Nagaraju, S. (2013). Prevalence of sterility mosaic disease in Karnataka and its resistance sources. Mysore J. Agric. Sci. 47, 314–319. doi: 10.13140/RG.2.2.28387.81441
Mardikis, M. G., Kalivas, D. P., and Kollias, V. J. (2005). Comparison of interpolation methods for the prediction of reference evapotranspiration— an application in Greece. Water Resour. Manag. 19, 251–278. doi: 10.1007/s11269-005-3179-2
Mediga, K. R., Sunkad, G., Kulkarni, S., Chandran, U. S. S., Ghosh, R., Kshirsagar, D., et al. (2023). Multi-environment testing based G × E interactions reveal stable host-plant resistance against sterility mosaic disease in Pigeonpea. Agronomy 13:2859. doi: 10.3390/agronomy13122859
Mitra, M. (1931). Report of the imperial mycologist. Calcutta: Scientific Reports of the Indian Agriculture Research Institute.
Narayana, Y. D., Mahalinga, D. M., Jayalakshmi, S. K., and Benagi, V. I. (2000). Prevalence of SMD of pigeonpea in northern Karnataka. J. Agric. Sci. 13, 470–472.
Nene, Y. L., Sheila, V. K., and Sharma, S. B. (1996). A world list of chickpea (Cicer arietinum) and Pigeonpea (Cajanus cajan). Pathogens. 5th Edn. Patancheru: ICRISAT Publication.
Oro, Z. F., Bonnot, F., Ngo-Bieng, M. A., Delaitre, E., Dufour, P. B., Ametefe, E. K., et al. (2012). Spatiotemporal pattern analysis of cacao swollen shoot virus in experimental plots in Togo. Plant Pathol. 61, 1043–1051. doi: 10.1111/j.1365-3059.2011.02589.x
Pande, S., Sharma, M., Gopika, G., and Rameshwar, T. (2012). High throughput phenotyping of pigeonpea diseases: Stepwise identification of host plant resistance. Patancheru, AP: International Crops Research Institute for the Semi-Arid Tropics.
Patil, B. L., and Kumar, P. L. (2015). Pigeonpea sterility mosaic virus: a legume-infecting Emaravirus from South Asia. Mol. Plant Pathol. 16, 775–786. doi: 10.1111/mpp.12238
R Core Team (2020). A language and environment for statistical computing. Vienna: R Foundation for Statistical Computing.
Ramakrishnan, K., and Kandaswamy, T. K. (1972). Investigation on virus disease of pulse crops in Tamil Nadu. Coimbatore: Tamil Nadu Agricultural University.
Reddy, M. V., Sharma, S. B., and Nene, Y. L. (1990). “Pigeonpea disease management” in The pigeonpea. eds. Y. L. Nene, S. D. Hall, and V. K. Sheila (Wallingford: CAB International), 303–347.
Reynolds, K. M., and Madden, L. V. (1988). Analysis of epidemics using spatiotemporal autocorrelation. Phytopathology 78, 240–246. doi: 10.1094/Phyto-78-240
Santra, P., Chopra, U., and Chakraborty, D. (2008). Spatial variability of soil properties and its application in predicting surface map of hydraulic parameters in an agricultural farm. Curr. Sci. 95, 937–945.
Savary, S., Nelson, A., Willocquet, L., Pangga, I., and Aunario, J. (2012). Modeling and mapping potential epidemics of rice diseases globally. Crop Prot. 34, 6–17. doi: 10.1016/j.cropro.2011.11.009
Sayiprathap, B. R., Patibanda, A. K., Kumari, V. P., Jayalalitha, K., Rao, S. V., Sharma, M., et al. (2020). Prevalence of sterility mosaic disease (SMD) and variability in Pigeonpea sterility mosaic virus (PPSMV) in southern-India. Indian Phytopathol. 73, 741–750. doi: 10.1007/s42360-020-00246-7
Seth, M. L. (1962). Transmission of pigeonpea sterility by an eriophyid mite. Indian Phytopathol. 15, 225–227.
Sharma, M., Rathore, A., Mangala, U. N., Ghosh, R., Sharma, S., Upadhyay, H. D., et al. (2012). New sources of resistance to fusarium wilt and sterility mosaic disease in a mini-core collection of pigeonpea germplasm. Eur. J. Plant Pathol. 133, 707–714. doi: 10.1007/s10658-012-9949-9
Sharma, M., Telangre, R., Ghosh, R., and Pande, S. (2015). Multi-environment field testing to identify broad, stable resistance to sterility mosaic disease of pigeonpea. J. Gen. Plant Pathol. 81, 249–259. doi: 10.1007/s10327-015-0585-z
Singh, A. K., Agrawal, K. C., and Rathi, Y. P. S. (1999). Sterility mosaic of pigeonpea: a challenge of 20th century. Indian J. Virol. 15, 85–92.
Singh, J., and Raghuraman, M. (2011). Emerging scenario of important mite pests in North India. Zoosymposia 6, 170–179. doi: 10.11646/zoosymposia.6.1.27
Singh, N., Tyagi, R. K., and Pandey, C. (2013). Genetic resources of pigeonpea (Cajanus cajan): Conservation for use. New Delhi: National Bureau of Plant Genetic Resources.
Stein, M. L. (2012). Interpolation of spatial data: Some theory for kriging. New York, NY: Springer Science & Business Media.
Ten Hoopen, G. M., Sounigo, O., Babin, R., Dikwe, G., and Cilas, C. (2009). Spatial and temporal analysis of a Phytophthora megakarya epidemic in a plantation in the Centre of Cameroon. In Proceedings of the 16th international cacao research conference, Bali, Indonesia, 16–21 November.
Vannini, A., Natili, G., Anselmi, N., Montaghiand, A., and Vettraino, A. M. (2010). Distribution and gradient analysis of ink disease in chestnut forests. For. Pathol. 40, 73–86. doi: 10.1111/j.1439-0329.2009.00609.x
Viggiano, M., Busetto, L., Cimini, D., Di Paola, F., Geraldi, E., Ranghetti, L., et al. (2019). A new spatial modeling and interpolation approach for high-resolution temperature maps combining reanalysis data and ground measurements. Agric. For. Meteorol. 276-277:107590. doi: 10.1016/j.agrformet.2019.05.021
Yao, X., Fu, B., Lü, Y., Sun, F., Wang, S., and Liu, M. (2013). Comparison of four spatial interpolation methods for estimating soil moisture in a complex terrain catchment. PLoS One 8:e54660. doi: 10.1371/journal.pone.0054660
Yavuzaslanoglu, E., Elekcioglu, H. I., Nicol, J. M., Yorgancilar, O., Hodson, D., Yildirim, A. F., et al. (2012). Distribution, frequency and occurrence of cereal nematodes on the central Anatolian plateau in Turkey and their relationship with soil physicochemical properties. Nematol. 14, 839–854. doi: 10.1163/156854112X631926
Keywords: geostatistical approaches, pigeonpea, point pattern analysis, SMD, semivariogram, surface interpolation
Citation: Mediga KR, Sunkad G, Shil S, Kulkarni S, Patil B, Sharath Chandran US, Ashwini P and Sharma M (2024) Assessment of the spatial distribution and identification of potential risk areas for the sterility mosaic disease of pigeonpea (Cajanus cajan L. Huth) in Southern India. Front. Sustain. Food Syst. 8:1386823. doi: 10.3389/fsufs.2024.1386823
Edited by:
Matteo Balderacchi, Independent Researcher, Piacenza, ItalyReviewed by:
Marco E. Mng'ong'o, Mbeya University of Science and Technology, TanzaniaCopyright © 2024 Mediga, Sunkad, Shil, Kulkarni, Patil, Sharath Chandran, Ashwini and Sharma. This is an open-access article distributed under the terms of the Creative Commons Attribution License (CC BY). The use, distribution or reproduction in other forums is permitted, provided the original author(s) and the copyright owner(s) are credited and that the original publication in this journal is cited, in accordance with accepted academic practice. No use, distribution or reproduction is permitted which does not comply with these terms.
*Correspondence: Mamta Sharma, bWFtdGEuc2hhcm1hQGljcmlzYXQub3Jn
Disclaimer: All claims expressed in this article are solely those of the authors and do not necessarily represent those of their affiliated organizations, or those of the publisher, the editors and the reviewers. Any product that may be evaluated in this article or claim that may be made by its manufacturer is not guaranteed or endorsed by the publisher.
Research integrity at Frontiers
Learn more about the work of our research integrity team to safeguard the quality of each article we publish.