 Agustin J. Olivo
 Kirsten Workman
 Quirine M. Ketterings
- 1Department of Animal Science, Cornell University, Ithaca, NY, United States
- 2PRO-DAIRY, Department of Animal Science, Cornell University, Ithaca, NY, United States
Corn (Zea mays L.) silage is an important feed ingredient in dairy cow diets in New York (NY). Improving corn nitrogen (N) management will help increase farm profitability while reducing environmental impacts from N losses. The objectives of this study were to (1) characterize field-based N balances and other N use indicators for corn silage, and (2) describe major contributors to high balances and inefficiencies as a first step to understand potential opportunities to improve N management. Field-level N balances (N supply – N uptake) and associated N use indicators were derived for 994 field observations across eight NY dairy farms and 5 years. Available and total N balances per ha, which differed only in the fraction of manure N accounted for (plant-available N or total N, respectively), yield-scaled N balances, and N uptake/N supply were calculated. The median balance across all fields was 111 kg N ha−1 for available N and 245 kg N ha−1 for total N. Median yield-scaled available and total N balances were 2.7 and 6.0 kg N Mg−1, respectively. Median N uptake/N supply was 0.60 for available N and 0.41 for total N. Differences in N use indicators were larger among farms than among years within a farm. The amount of N supply greatly influenced N use indicators, manure N supply explaining the largest portion of the variability. At the whole-farm level, balances per ha were positively related to farm’s animal density and impacted by farm crop rotations and within-farm allocation of manure N. We conclude that farms have opportunities to improve upon N management for corn by adjusting N supply based on realistically attainable yield, fully crediting manure and sod N contributions, improving manure inorganic N utilization efficiency, optimizing animal density, and/or exporting manure. Future work is needed to identify feasible ranges for field-level N balances and incentivize the implementation of this assessment through adaptive nutrient management policies.
1 Introduction
Nitrogen (N) is a critical element for agricultural productivity. Despite improvements over the last few decades, N use efficiency in agricultural systems in many cases remains low (Lassaletta et al., 2014; Zhang et al., 2015). Optimizing N use is particularly challenging in livestock systems given the diversity of N sources producers manage for crop production (manure, legume N fixation, fertilizer) and the uncertainty in nutrient availability. When N inputs surpass plant N needs, it can lead to proportionally larger reactive N losses through volatilization, denitrification, leaching or runoff. These losses are associated with environmental challenges such as groundwater contamination, eutrophication of freshwater, and global warming (Galloway et al., 2003; Lassaletta et al., 2016). On the contrary, sustained N supply below crop N requirements may impact crop yield and quality (Sadeghpour et al., 2017), reduce the uptake efficiency of other nutrients, and lead to soil organic N mining, compromising soil quality (Campbell and Zentner, 1993).
With the intensification of dairy systems across the United States over the last decades, corn silage use in dairy cow diets has grown notably (Martin et al., 2017; Powell et al., 2017). New York, which ranks 5th in milk production in the United States, has not been an exception to this trend. In 2022, 416,826 ha of corn were planted of which 43% were harvested as silage (USDA, 2023). Factors driving the increase in corn silage production include a single harvest system, greater yields and higher energy content compared to other forages (Powell and Rotz, 2015). With the increase in land in corn production by dairies in the Northeast United States, N fertilizer use tends to increase as well (Ros et al., 2023). As large use of external N inputs is linked with higher inefficiencies and reductions in whole-farm N use efficiency of dairies (Martin et al., 2017; Powell et al., 2017), it is imperative to develop tools that aid farmers with better N management.
One strategy to monitor and improve nutrient management in agricultural systems is the use of nutrient balances (Oenema et al., 2003; Sharara et al., 2022). Balances have been used to track nutrient use at the regional (Swink et al., 2011; Zhang et al., 2019; Godber et al., 2024), whole-farm (Cela et al., 2015; Pearce and Maguire, 2020), and field level (Tenorio et al., 2020). Balances are not necessarily an indicator of nutrient losses to the environment. However, surplus N at the field level has been shown to be associated with emissions of nitrous oxide, a global warming gas (Grassini and Cassman, 2012; Eagle et al., 2020; Maaz et al., 2021), surface N runoff, and N leaching (Zhao et al., 2016; Sadeghpour et al., 2017; McLellan et al., 2018; Hanrahan et al., 2019; Tamagno et al., 2022). Ideal field-level N balances are positive, but not excessively large, in order to replenish soil organic N, support the growth of unharvested plant material, and account for nutrients not recovered by plants while growing.
Regulations for Concentrated Animal Feeding Operations (CAFOs) in New York (NY) require producers to have a Comprehensive Nutrient Management Plan (CNMP) and follow land-grant university guidelines for N management in field crops (Ketterings and Workman, 2023). In 2013, an Adaptive Nitrogen Management process was added, allowing producers to apply N at a higher rate than recommended as long as field-based yield records are obtained and an environmental N use efficiency assessment is conducted to assess if the extra N was warranted (Ketterings et al., 2023). Currently, producers who opt for Adaptive Nitrogen Management for a field, can select one of four alternatives to evaluate N use. Options include taking corn stalk nitrate test (CSNT) samples, conducting N rate studies, or putting in test strips to compare the higher rate against the recommended one (Ketterings et al., 2023). A field N balance option was added for fields planted to crops other than corn. However, if feasible balances can be determined, this option can also be added for corn as an alternative to CSNTs that can be spatially variable and labor-intensive. Field-balances can provide farmers with useful information at a scale where improvements can be implemented (Sela et al., 2019; Van Leeuwen et al., 2019; Tenorio et al., 2020).
The objectives of this study are to (1) characterize current N use indicators for corn silage production across eight NY dairy farms, including N balance per ha, yield-scaled N balance, and N uptake/N supply, and (2) describe major drivers of these indicators, as a first step to understand potential opportunities to improve N management for corn silage and relevant aspects to consider when defining feasible N balances.
2 Materials and methods
2.1 Farm characteristics, data collection and quality
Data were collected for eight dairy farms (Table 1), two each in eastern, northern, central, and western NY. Farms 2 and 5 were medium CAFOs (between 300 and 700 mature cows) and the rest were large CAFOs (more than 700 mature cows). General farm information was obtained from the input sheets of the Cornell University Nutrient Management Spear Program whole farm nutrient mass balance project (Cornell NMSP, 2023). For individual corn fields, between 2 and 4 years of data were collected, depending on data availability and quality (growing seasons between 2018 and 2022). Information was retrieved from individual farm records, the farm’s CNMPs, and interviews with farm owners and consultants. Only fields with corn silage as the harvested crop were included (double-cropped fields were excluded due to uncertainty in yield data for winter cereals harvested for forage). Data were checked thoroughly for quality. Fields with incomplete or uncertain/unknown manure application information, and a small number of fields with unrealistic yield or balance data were excluded from the dataset. The latter included four fields with yields equal or below 11.2 Mg ha−1 (5 tons acre−1) and two fields with N balances smaller than −84 kg ha−1 (−75 lbs acre−1). Individual meetings were held with farm owners and consultants to discuss data reliability and preliminary results. After data quality checks were completed, 994 field*year observations (record for an individual field in a specific year) were kept in the dataset (10,048 ha) from 560 individual fields (5,382 ha). Aggregated rainfall during the most relevant months of the cropping season (April 1st to August 31st) and annual average temperature were retrieved from CLIMOD 2 (Supplementary Figure S1; Northeast Regional Climate Center, 2024).
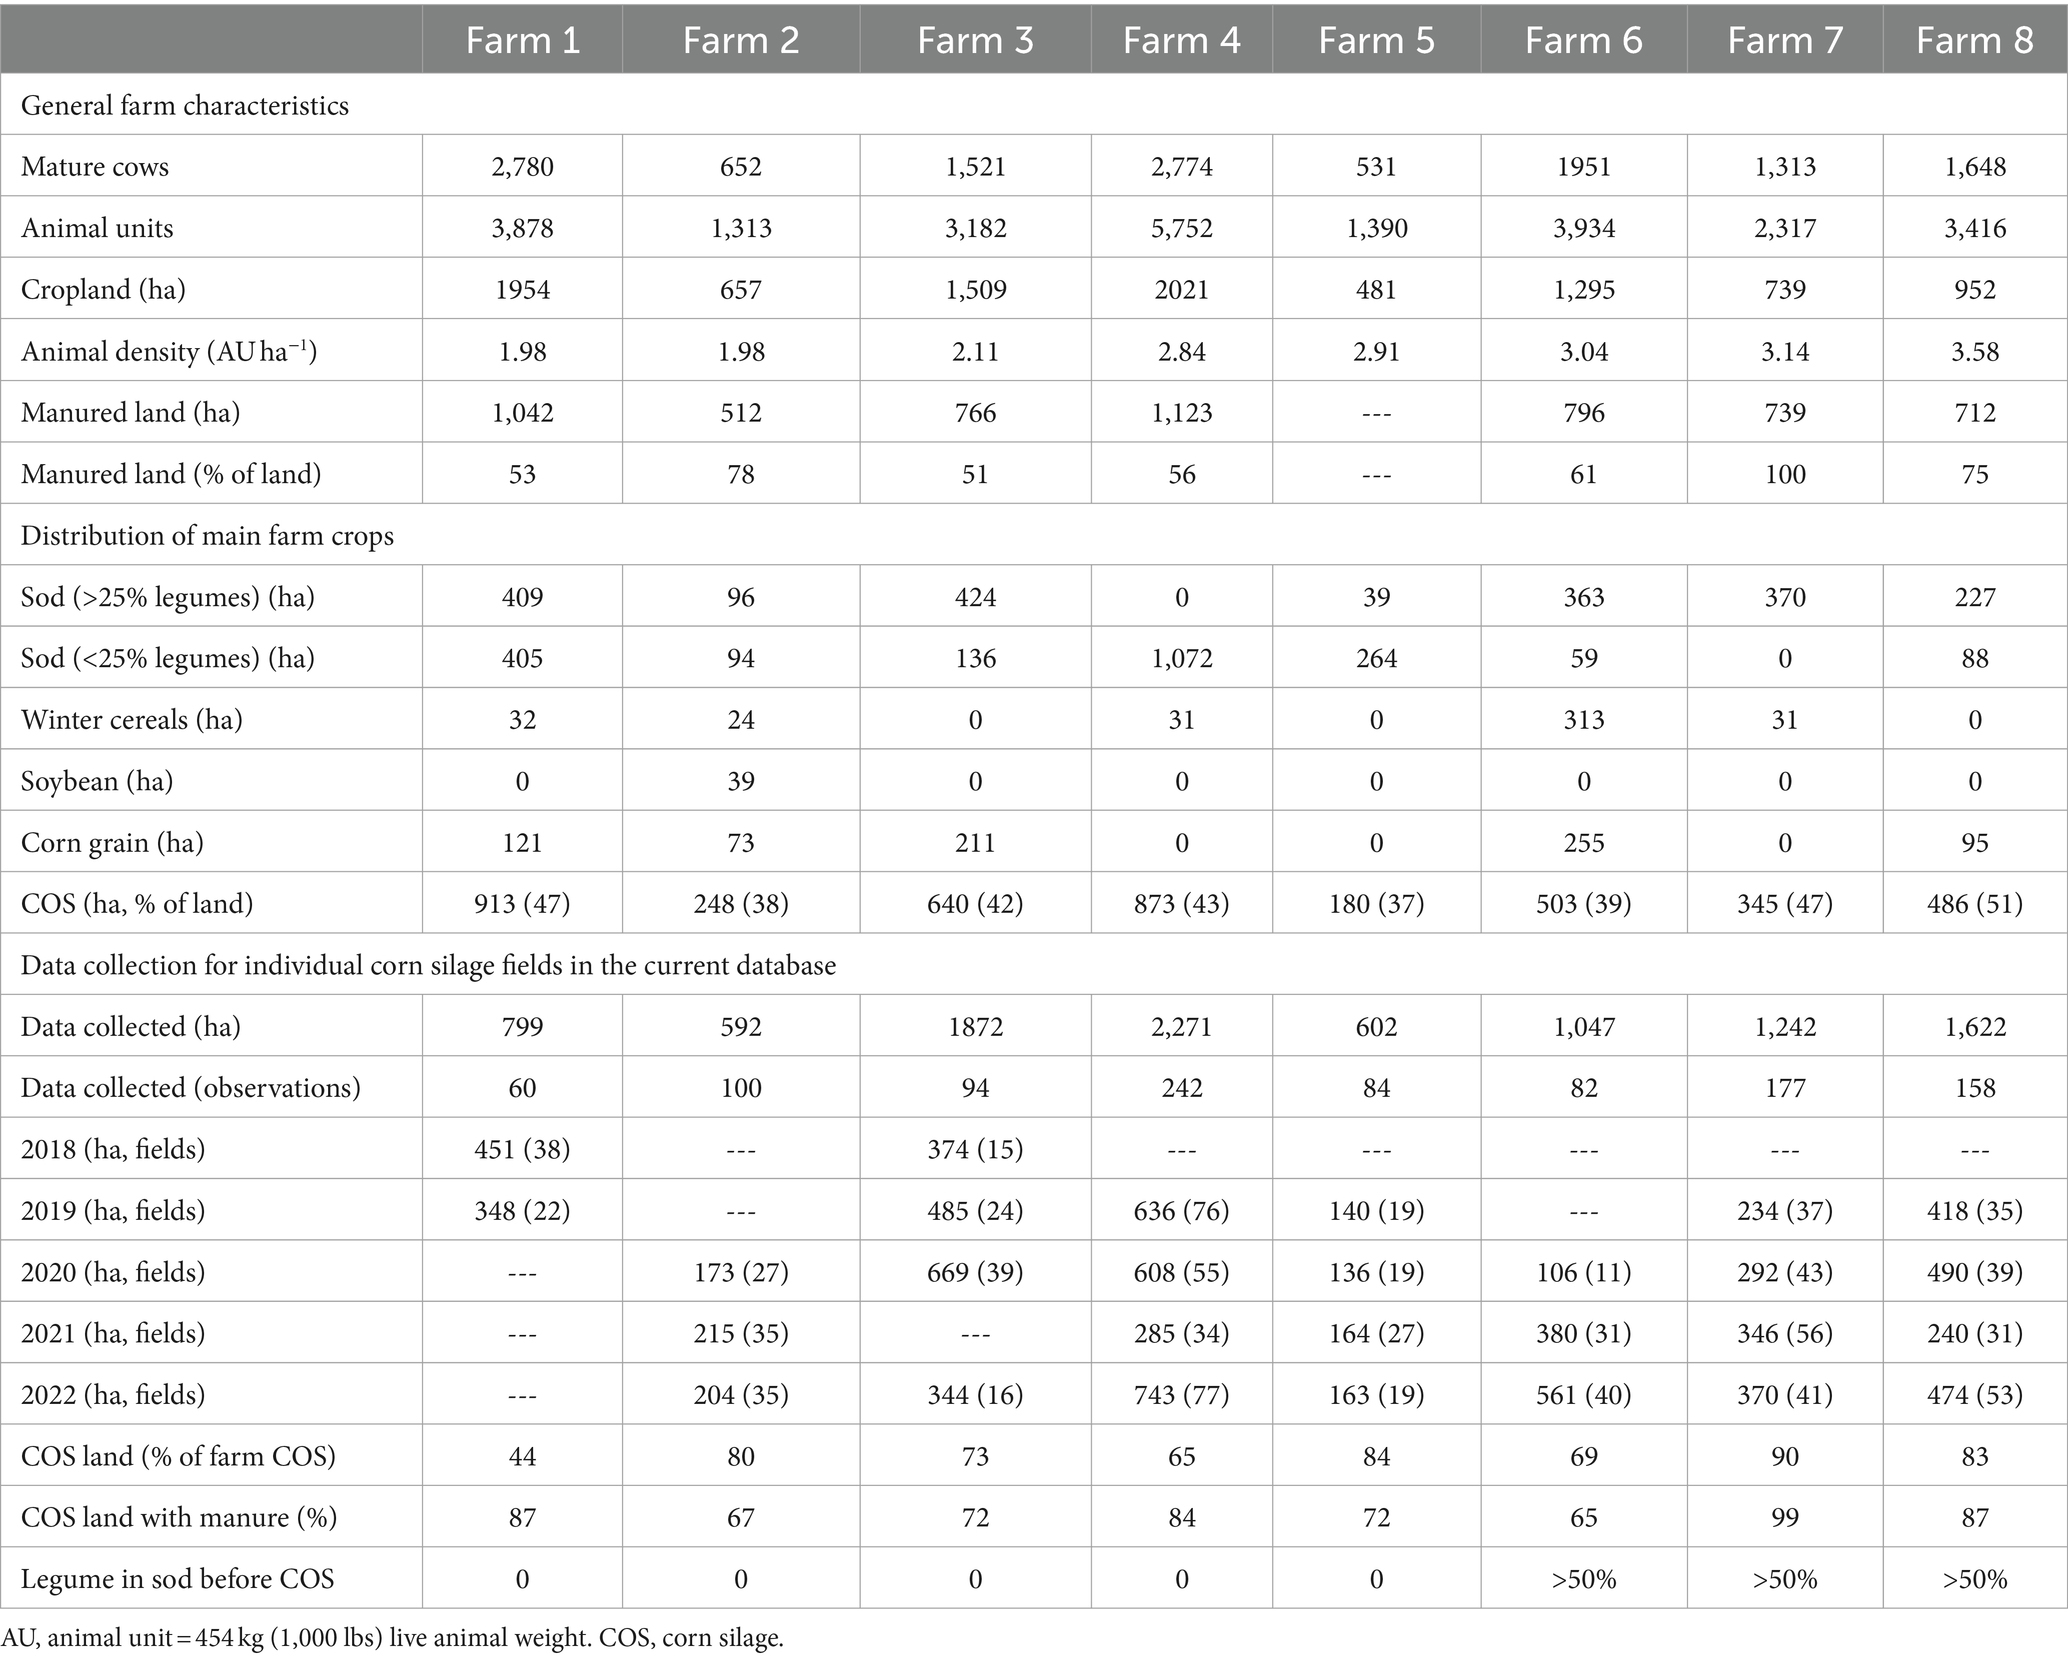
Table 1. Characteristics and data collection aspects for eight New York farms analyzed in the present study.
2.2 Estimation of N use indicators
Field-level N use indicators were derived following the approach described in Berlingeri et al. (2021). Briefly, N removal in individual fields was calculated as the product of N uptake intensity (kg N Mg silage−1 at 35% dry matter), and yield values for individual fields (Mg silage ha−1 at 35% dry matter). Yield was obtained by the farmers using yield monitor systems on choppers. Raw yield monitor data were processed through a standardized, semi-automated data cleaning protocol (Kharel et al., 2018) prior to determining yield per field. Nitrogen uptake intensity was adjusted based on hybrid relative maturity (4.3 kg N Mg−1 for hybrids with ≤95 days to maturity, and 4.1 kg N Mg−1 for hybrids with >95 days to maturity) as determined using corn variety testing results from NY (Berlingeri et al., 2021). When no information was available about hybrids planted in a field, an average of 4.2 kg N Mg−1 was used.
Available and total N supply from different sources in each cropping season (N supply) differed only in the fraction of N in manure considered and were estimated as follows Equations 1, 2:
Where, NSoil = endogenous soil N supply, NSod = N supply from legumes in sod crop (grass, legumes or grass-legume mixes for forage production) prior to corn, NPast_manure = N supply from manure applications in the two previous cropping seasons, NCurrent_manure_av = plant-available N supply from manure applications during the current cropping season, NCurrent_manure_to = total N supply from manure applications during the current cropping season, NFertilizer = N supply with inorganic fertilizer application, NCover_crop = N supply from cover crops prior to corn, NSoybean = N supply from soybean crop prior to corn, and NIdle = additional N supply in corn fields preceded by no other crops.
Manure available N supply (NCurrent_manure_av) and manure total N supply (NCurrent_manure_to) were defined from applications during the current cropping season assuming: (1) N availability as impacted by organic N mineralization rates, affected by timing and method of application (available inorganic N), and (2) no N losses (total N). Manure N credits were calculated based on farmer records for manure nutrient content, rates, timing, and method of application, and N availability factors defined in land-grant university guidelines (Ketterings and Workman, 2023). Nitrogen supply from past manure applications included credits from amendments applied up to two prior cropping seasons. Book values for N supply from soil, sod, cover crop, soybean and idle land were also taken from land-grant university guidelines (Ketterings and Workman, 2023). Soil N supply values were estimated by previous research based on soil organic N mineralization during the cropping season and are specific for each soil type, ranging between 56 and 90 kg N ha−1. Sod N contributions vary according to the proportion of legumes in the sod mix at the time of termination (prior to corn planting) as reported by farmers, and rotation stage (first, second, or third year of corn after sod), resulting in values ranging between 9 and 185 kg N ha−1. An additional N supply of 33 kg N ha−1 was added to observations where corn planting was preceded by a cover crop, soybean crop or no crops (idle land). For the purpose of nutrient application accounting, cropping seasons ranged between September of the calendar year prior to corn planting, and August of the calendar year in which corn was planted (fall and spring).
A total of six N use indicators were derived Equations 3–8:
Each observation in the database was associated with a particular soil type, soil management group (SMG), soil N uptake efficiency category, and drainage class as defined in land-grant university guidelines (Ketterings and Workman, 2023). Briefly, the database included mineral soils from SMGs 1 through 5. The SMGs aggregate fields based on soil texture and parent material. Soil N uptake efficiency categories are soil type and drainage dependent and represents the fraction of the inorganic N applied with external N sources that can be recovered by plants under best management practices. Categories include ≤60, 65, 70, and 75%. For drainage, five classes were considered: poorly or very poorly drained (V + P), somewhat poorly drained (S), moderately drained (M), and well or excessively drained (W + E).
2.3 Statistical analysis
General descriptive statistics were derived for each of the N use indicators considering the entire database, specific groups of fields, or individual farms. Relative frequency distributions were used to initially assess the variability of N supply, yield, N uptake, and N use indicators.
The relationship between N use indicators and potential explanatory variables were investigated using linear mixed effects models in R (lmer function from lme4 package) (Bates et al., 2015). This approach utilizes restricted maximum likelihood to fit the models and helps confidently analyze unbalanced datasets with correlated observations. This was particularly relevant given fields belonged to specific farms, some fields were assessed multiple years, and different operations and years contributed in different proportions to the overall dataset. Field, farm, year, and the farm*year interaction were initially considered random effects in all models and dropped if the variance explained was zero or nearly zero as defined by singularity tests run by the lmer function. Intercept-only models were initially fitted to analyze variables intercept values, and relevance of random effects. Then, a group of parameters of interest were tested as fixed effects, one at a time, for their relationship with the different N use indicators and associated variables. Data transformations (natural logarithm and square root) were applied to yield-scaled N balance and N supply/N uptake to ensure normality of model residuals. For yield-scaled N balance, a constant factor equal to the sum of the minimum value in the dataset plus one was added to all observations to ensure the distribution had no negative values before applying the transformations. After fitting the models, the data were evaluated for assumptions of homogeneity of variances, and normality of residuals using histograms, residuals vs. fitted plots, and QQ-plots. Type III Satterthwaite corrected p values were calculated using lmerTest package in R (Kuznetsova et al., 2020) to define the significance of intercepts and fixed effects in the models. For each model, the goodness of fit was estimated through the coefficient of determination (R2). Marginal R2 (R2m, portion of the variance explained by fixed effects), and conditional R2 (R2c, portion of the variance explained by the entire model, combining fixed and random effects) were calculated in R using the r.squared.GLMM function of the MuMIn package (Nakagawa and Schielzeth, 2013; Nakagawa et al., 2017; Bartoń, 2023). Variables tested as fixed effects that had a significant relationship with the response (p < 0.05) and showed a R2m equal or greater than 0.05 were considered relevant for the analysis.
The effects of categorical variables such as SMG, soil N uptake efficiency categories, soil drainage classes, or rotation stage, on N use indicators or their drivers were examined through an analysis of variance (ANOVA) on the fitted linear mixed model (lmerTest package) (Kuznetsova et al., 2020). If significant, post-hoc contrasts were conducted with the emmeans function (emmeans package, R) to detect differences between estimated marginal means for different levels of the categorical variables using Tukey’s adjustment (Lenth et al., 2023).
Linear models were fitted with the lm function in R (R stats package, R Core Team, 2021), to model the relationship between farm animal density and farm-level area-weighted averages for available N balance, total N balance, total manure N supply, and fertilizer N supply. The coefficient of determination (R2) was estimated as a measure of model fit.
3 Results
3.1 Database characteristics
Median yield across all observations was 40.6 Mg ha−1, with an area-weighted mean of 43.4 Mg ha−1 (Figure 1). Nitrogen uptake ranged from 54 to 309 kg N ha−1, with a median of 170 kg N ha−1 (data not shown). Available N supply ranged from 106 to 613 kg N ha−1, with a median of 278 kg N ha−1, while total N supply ranged from 106 to 958 kg N ha−1, with a median of 426 kg N ha−1. For available N supply, the largest source of N was manure, with 87 kg N ha−1 on average across all observations analyzed (46 and 41 kg N ha−1 from organic and inorganic fractions, respectively), followed by soil N supply (82 kg N ha−1), and fertilizer (71 kg N ha−1) (Figure 1D).
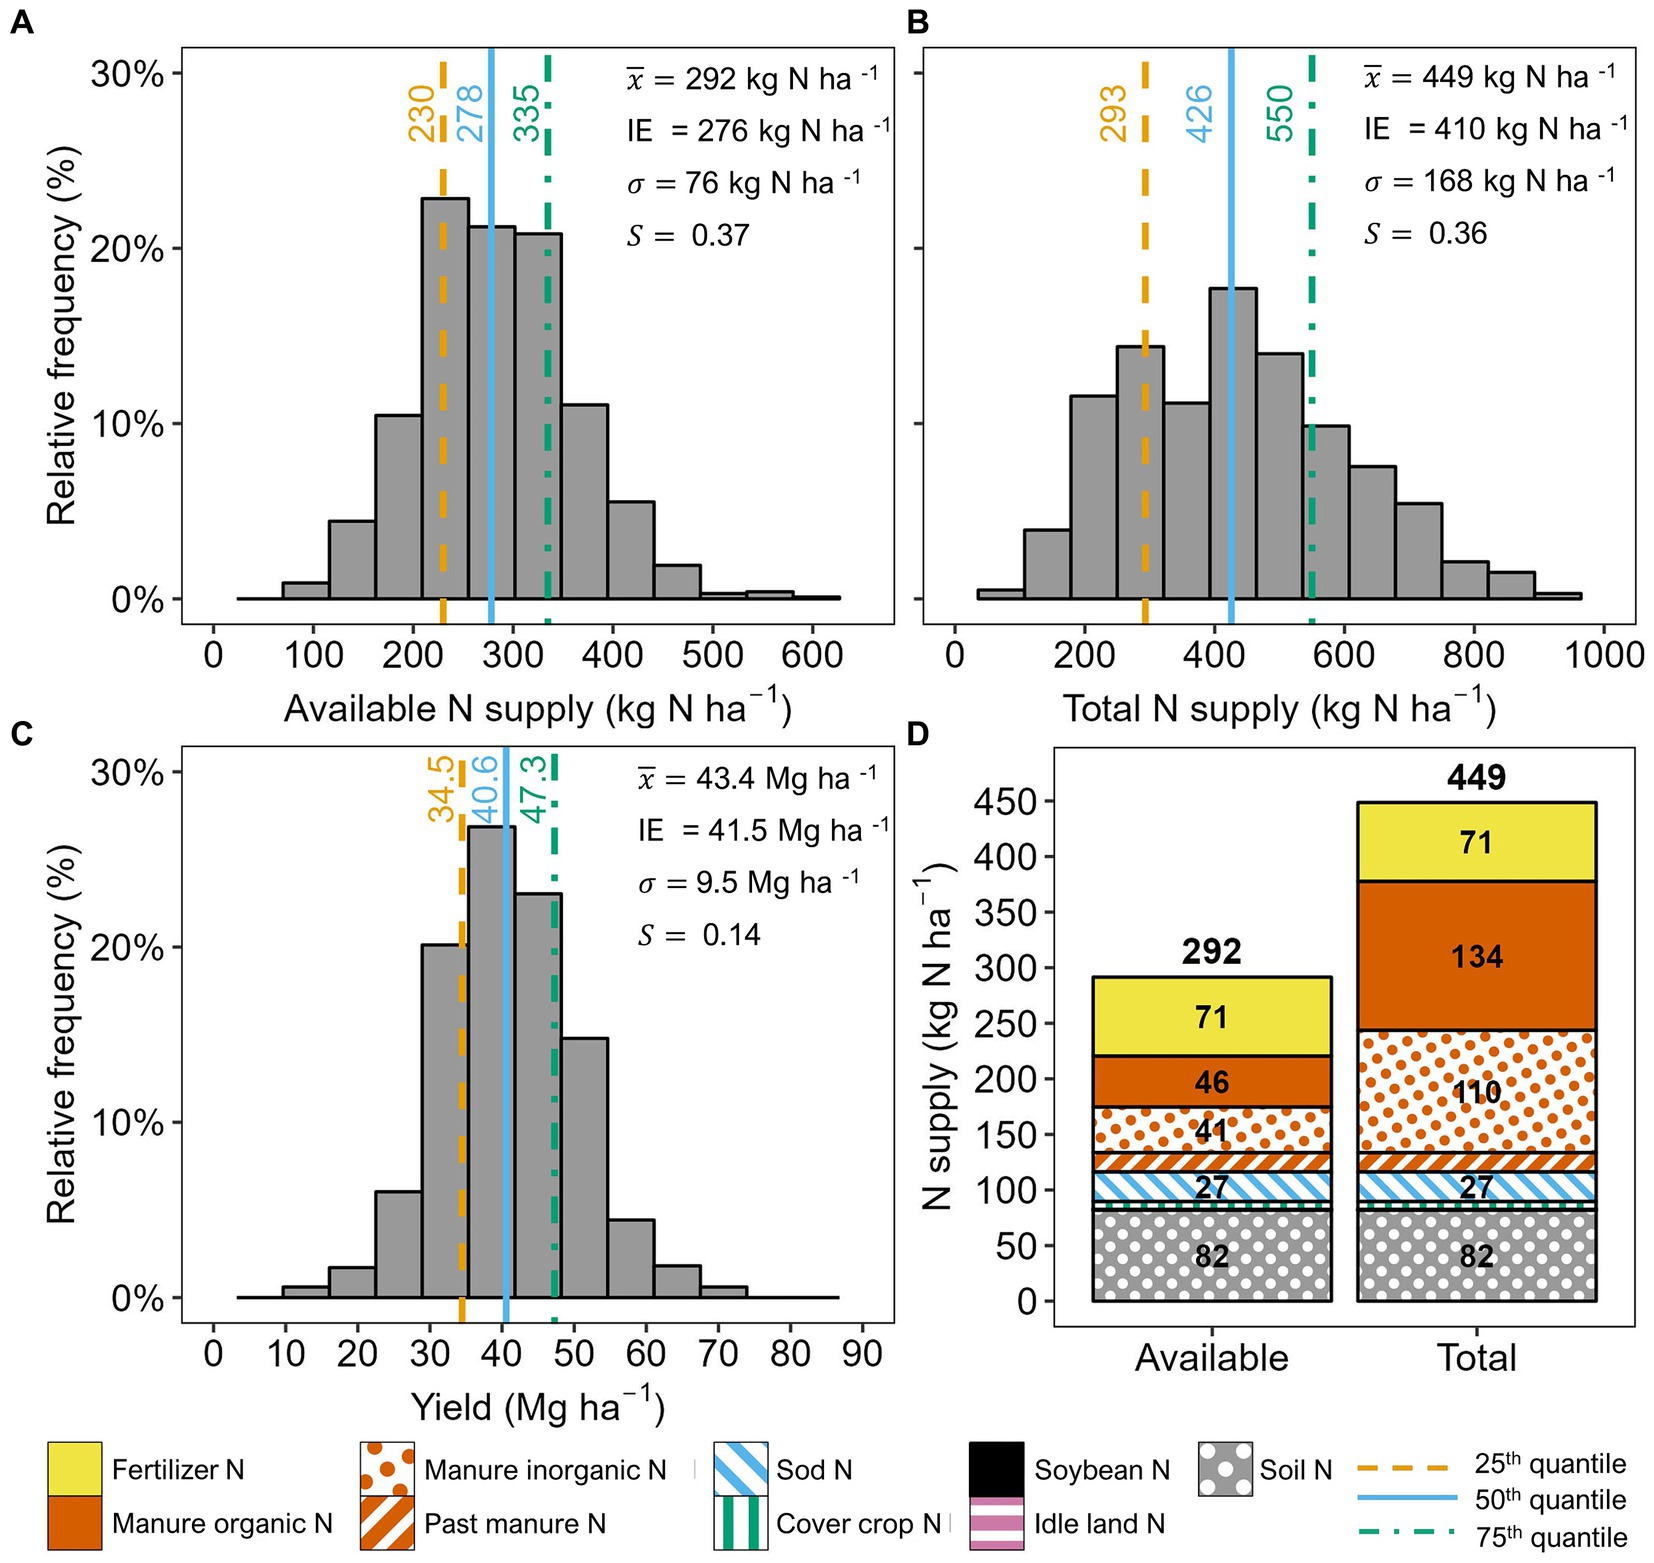
Figure 1. Relative frequency distributions for available nitrogen (N) supply (A), total N supply (B), and corn silage yield (C), and area-weighted average N supply from multiple sources across farms and years (D). In (D), black bolded numbers on top of the bars represent the aggregated N supply from multiple N sources (individual stacked bars). In the same graph, bars with values equal or smaller than 20 kg N ha−1 are not labeled. = area-weighted average, IE = intercept estimate reported by intercept-only linear mixed effect model, = area-weighted standard deviation, = skewness estimated with Pearson’s second coefficient of skewness.
Fertilizer N was applied in 952 observations (96% of the database). Seventy-eight percent of the observations received manure applications during the current cropping season (n = 772) and in 46% (n = 457) of all data points, manure was incorporated or injected in the spring prior to corn planting, resulting in manure inorganic N credits. On average, 34% of the organic N from manure was estimated as available while for inorganic N, an area-weighted average of 37% was plant-available across all fields, farms, and years. Forty-seven percent of observations had N contributions from previous sod (n = 469). From these observations, 32% corresponded to first year corn silage after sod (COS1, with sod N credits between 93 and 185 kg N ha−1), 36% to data points in their second year of corn after sod (COS2, sod N credits between 20 and 40 kg N ha−1), and 32% in their third year after corn (sod N credits between 9 and 17 kg N ha−1). A total of 243 observations (24% of the database) had N contributions from cover crops (33 kg N ha−1). Across all farms, N supply attributed to residual N contributions from soybeans and idle land were low, given dairy farms do not typically grow soybean in rotation and little land is left idle.
3.2 Drivers of yield
Random effects explained 57% of the variability in yield in intercept-only models (Table 2). The factor farm explained the largest portion (22%), followed by the farm*year interaction (19%). Field explained 16% and year 0% of the variability observed in yield. Similarly, SMG, soil N uptake efficiency categories, and drainage classes explained small portions of the changes in yield across observations (R2m = 0.02). However, yield varied significantly across levels in these groups. Fields with soil type(s) in SMG 1, characterized by fine- and medium to fine-textured soils developed from lake sediments, showed significantly lower yields than fields with soil types in other SMGs (Figure 2). Soils for which the current N guidelines for field crops in NY assign higher N uptake efficiency rates (75 and 70%), showed significantly higher yields than those with lower uptake efficiency (≤60%). Fields under the category “well or excessively drained” (W + E), exhibited significantly higher yields than those in other drainage categories.
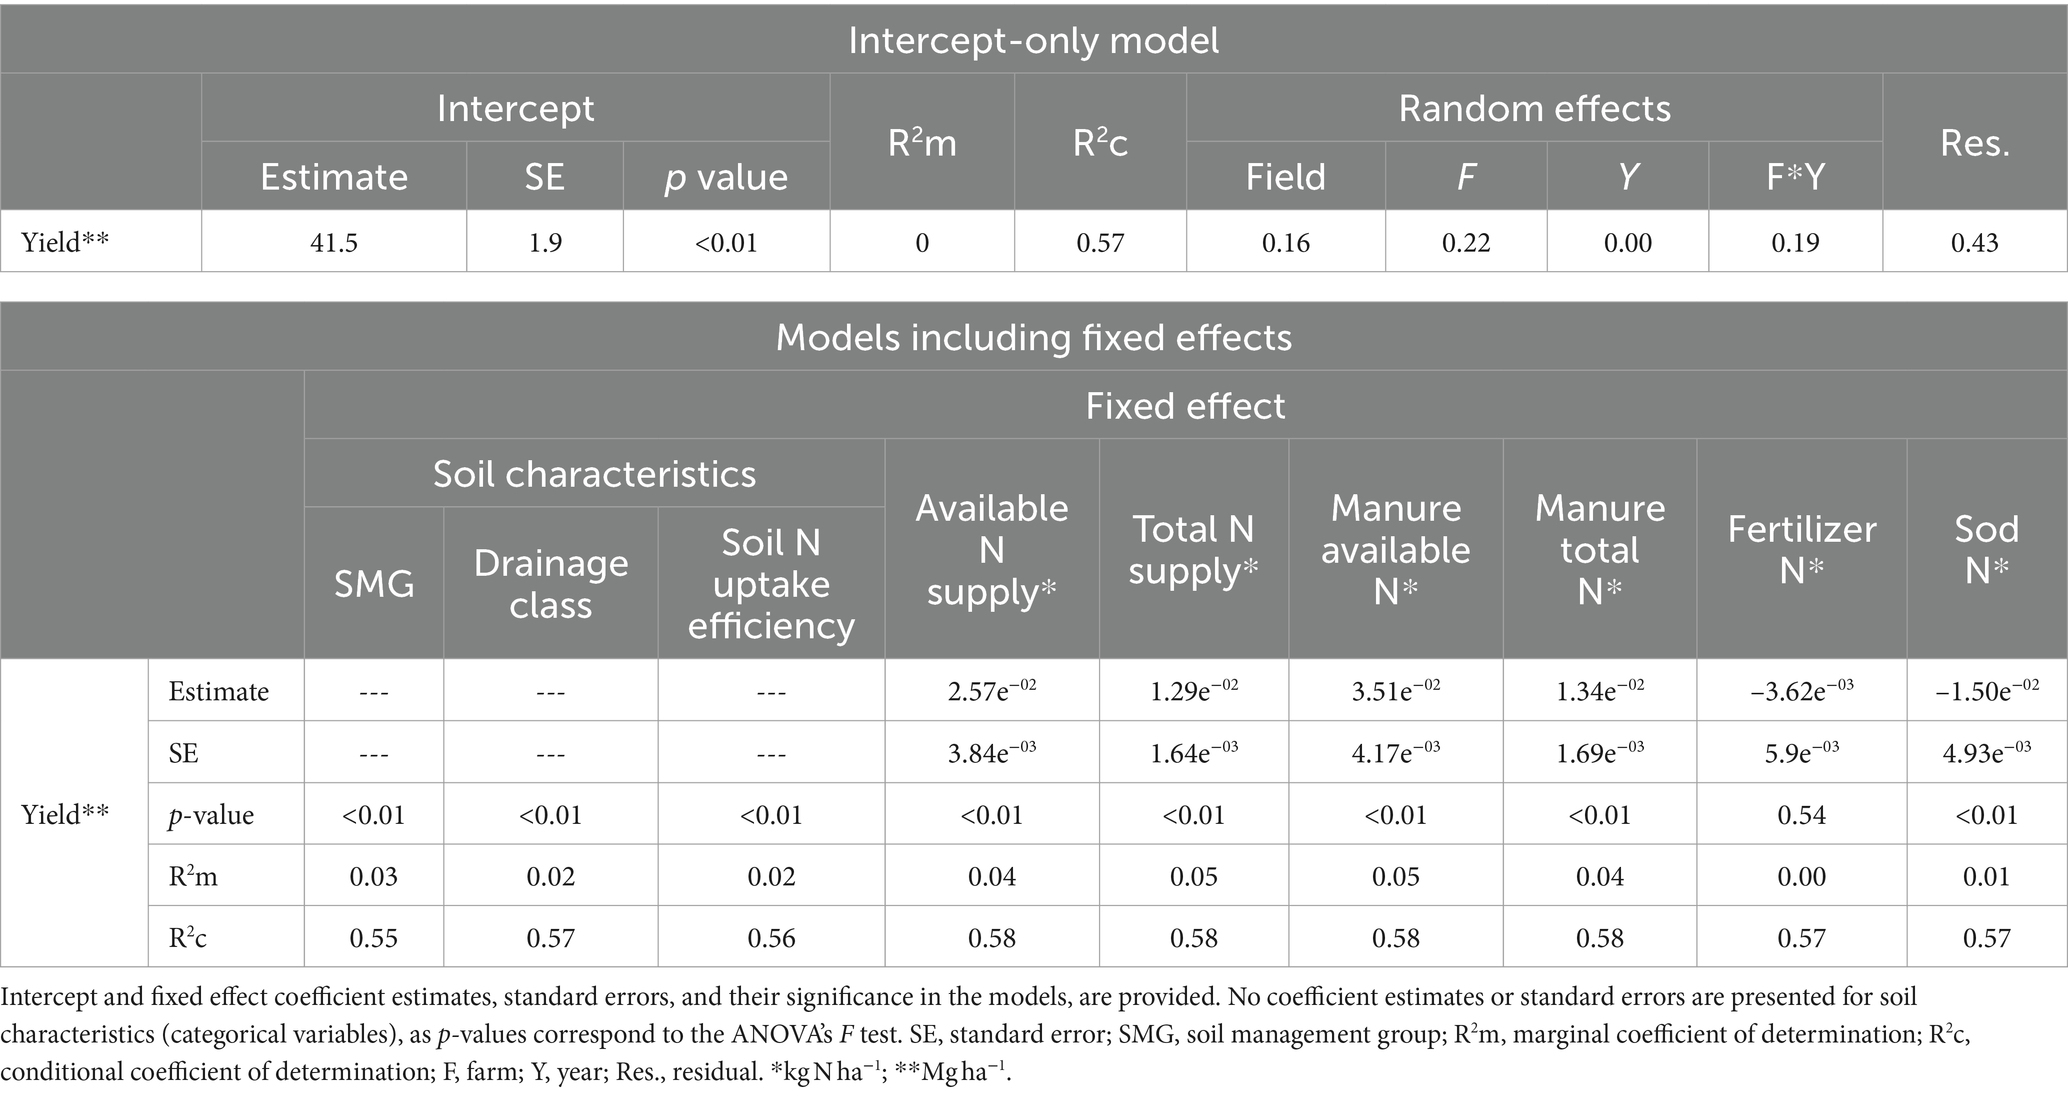
Table 2. Summary statistics for different linear mixed models fitted to explore the relationship between yield, and nitrogen (N) inputs, soil characteristics and model random effects (field, farm, year and farm*year).
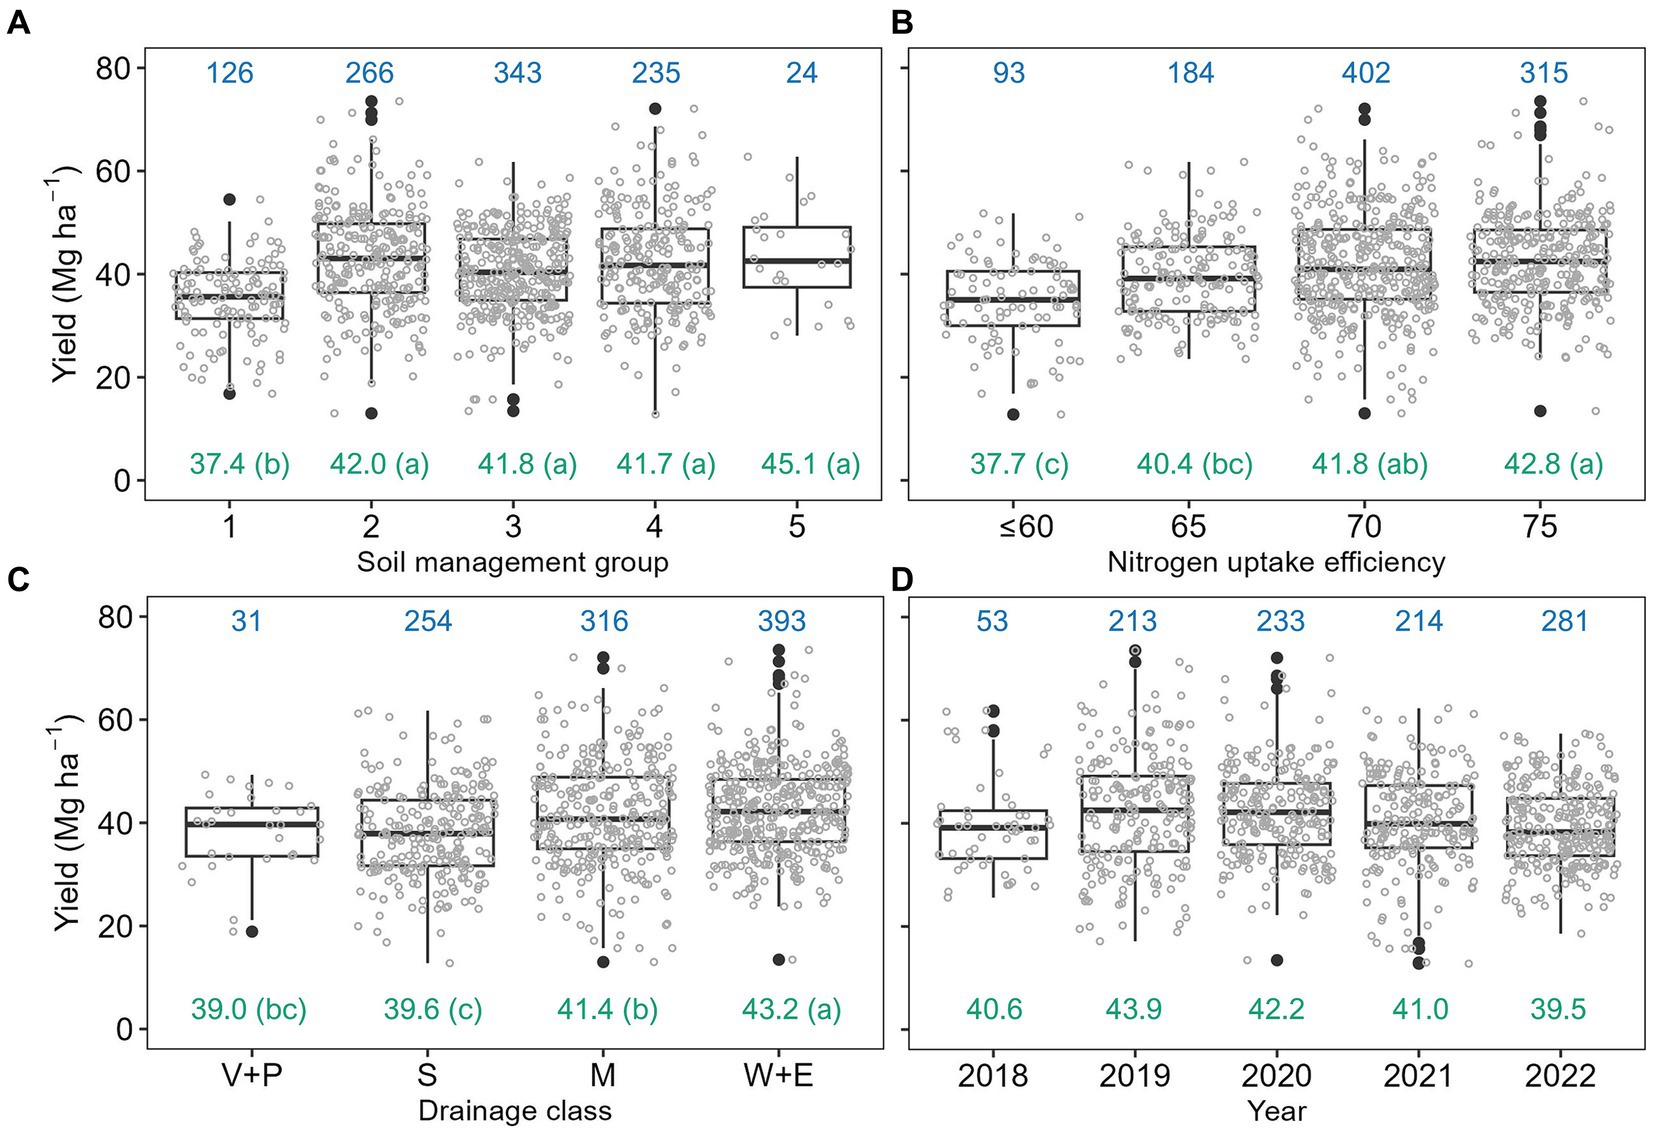
Figure 2. Corn silage yield for different soil management groups (A), soil nitrogen (N) uptake efficiency categories (B), soil drainage classes (C), and years of data collection (D). Gray dots represent individual field*year observations. Numbers above the box plots (blue) indicate number of observations in each category, and numbers below (green) indicate marginal means estimated by linear mixed effect model outputs. Estimated marginal means for independent variables within each panel that share the same letter, are not significantly different at p = 0.05. V + P, very poorly or poorly drained; S, somewhat poorly drained; M, moderately drained; W + E, well or excessively drained.
Manure available N supply and total N supply showed the largest explanatory power for yield (R2m = 0.05), followed by available N supply, and total manure N (R2m = 0.04). Observations with manure applications (n = 772) had an estimated marginal mean 5.5 Mg ha−1 higher than fields with no manure applications (n = 222) (p < 0.05), with an area-weighted average difference of 3.0 Mg ha−1. Observations with manure applications also showed average available and total N supply 60 kg N ha−1 and 255 kg N ha−1 higher, respectively, than observations with no manure applications. Although sod N showed low explanatory power for changes in yield (R2m = 0.01), fields with sod N credits had a significantly lower estimated marginal mean for yield compared to fields without sod grown in the most recent 3 years prior to corn (40.8 vs. 42.1 Mg ha−1).
3.3 Nitrogen use indicators
Available N balances showed a median and area-weighted average of 111 kg N ha−1 (Figure 3A). Total N balances showed a median of 245 kg N ha−1, and an area-weighted average of 268 kg N ha−1 (Figure 3B). The median difference between available and total N balances was 134 kg N ha−1, while the difference between area-weighted averages was 157 kg N ha−1. Median values for yield-scaled available and total N balances were 2.9 and 6.6 kg N Mg−1, respectively (Figures 3C,D). For N uptake/available N supply the median value was 0.60 (Figure 3E) and for N uptake/total N supply, 0.47 (Figure 3F). Not considering soil N contributions, available N balances ranged from −158 to 309 kg N ha−1, with a median of 29 kg N ha−1 (data not shown). Total N balances had a median of 163 kg N ha−1, and ranged from −150 kg to 735 kg N ha−1. Medians for N uptake/available N supply and N uptake/total N supply were 0.85 and 0.51, respectively, when not including soil N supply. All variables showed different degrees of positive skewness due a small subset of observations with high values.
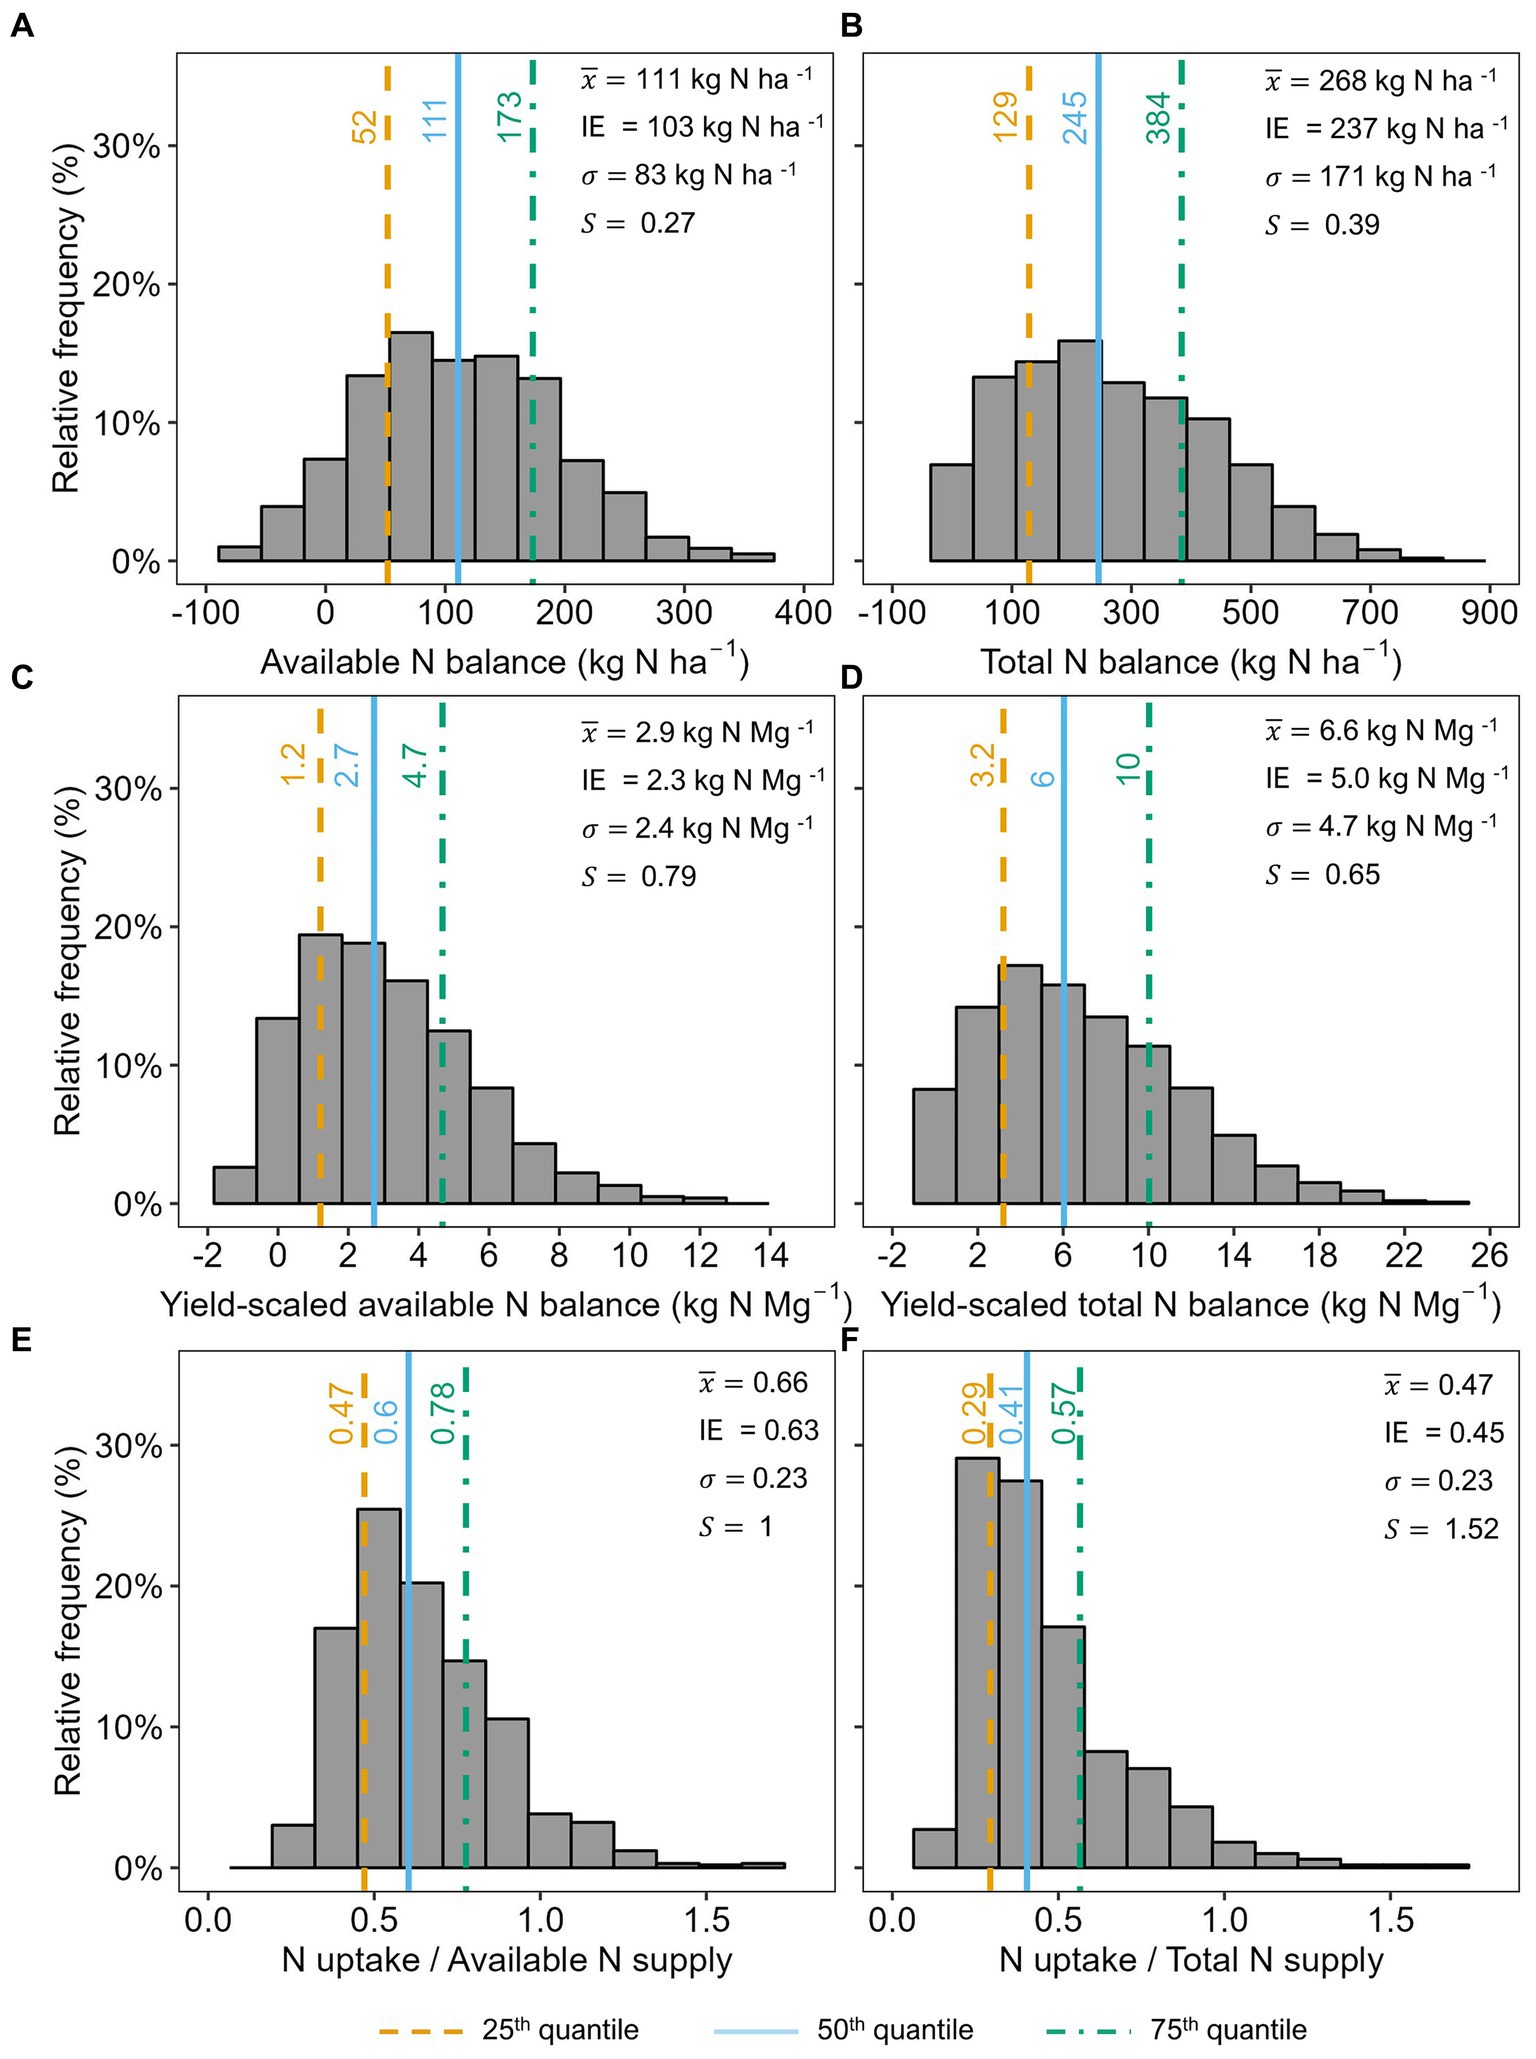
Figure 3. Relative frequency distributions for available nitrogen (N) balances per ha (A), total N balances per ha (B), yield-scaled available N balances (C), yield-scaled total N balances (D), N uptake/available N supply (E), and N uptake/total N supply (F), for all observations across farms and years. Area-weighted average, IE = intercept estimate reported by intercept-only linear mixed effect model, area-weighted standard deviation, skewness estimated with pearson’s second coefficient of skewness.
A total of 77 observations had negative balances (8% of the total database), and 137 observations (14% of the database) showed N uptake/available N supply above 90%. Thirteen, 13, 28, 24, 10, 3, 2, and 7% of these high efficiency observations were from Farms 1–8, respectively. Seventy-eight percent of the observations with N uptake/available N supply above 90% belonged to Farms 1–4, the operations with the lowest animal densities (AU ha−1, Table 1). Overall, available and total N supply for these fields were 84 and 149 kg N ha−1 lower, respectively, than the average for the database, with reduced N contributions from fertilizer, manure, and sod (similar soil N supply, and past manure application N credits). This resulted in an average available N balance of −5 kg N ha−1, and a total N balance of 87 kg N ha−1. The high efficiency data points were similarly distributed across soil drainage and soil N uptake efficiency categories, compared to the entire database, but had a larger proportion of soil types in SMG 4 (50% vs. 24%). Soil management group 4 clusters coarse- to very coarse-textured soils, formed from gravelly or sandy glacial outwash or glacial lake beach ridges or deltas (Ketterings and Workman, 2023). Observations with N uptake/available N supply >90% also showed an average yield of 50.8 Mg ha−1, 7.4 Mg ha−1 higher than the average for the full database.
3.4 Farm, year, and field
Year showed the smallest explanatory power across all N use indicators (5 to 7% of the total variability, Table 3). For available N balances per ha, farm and farm*year explained the largest proportions of the variability. For yield-scaled available N balance, and N uptake/available N supply, farm*year explained the largest portion of the variability, followed by farm and field. Moreover, for total N balances per ha, yield-scaled total N balance and N uptake/total N supply, farm was the largest driver, followed by field. Finally, unexplained field-to-field differences (residual, almost 50% of the variance for all models) were as relevant as all other random factors considered together.
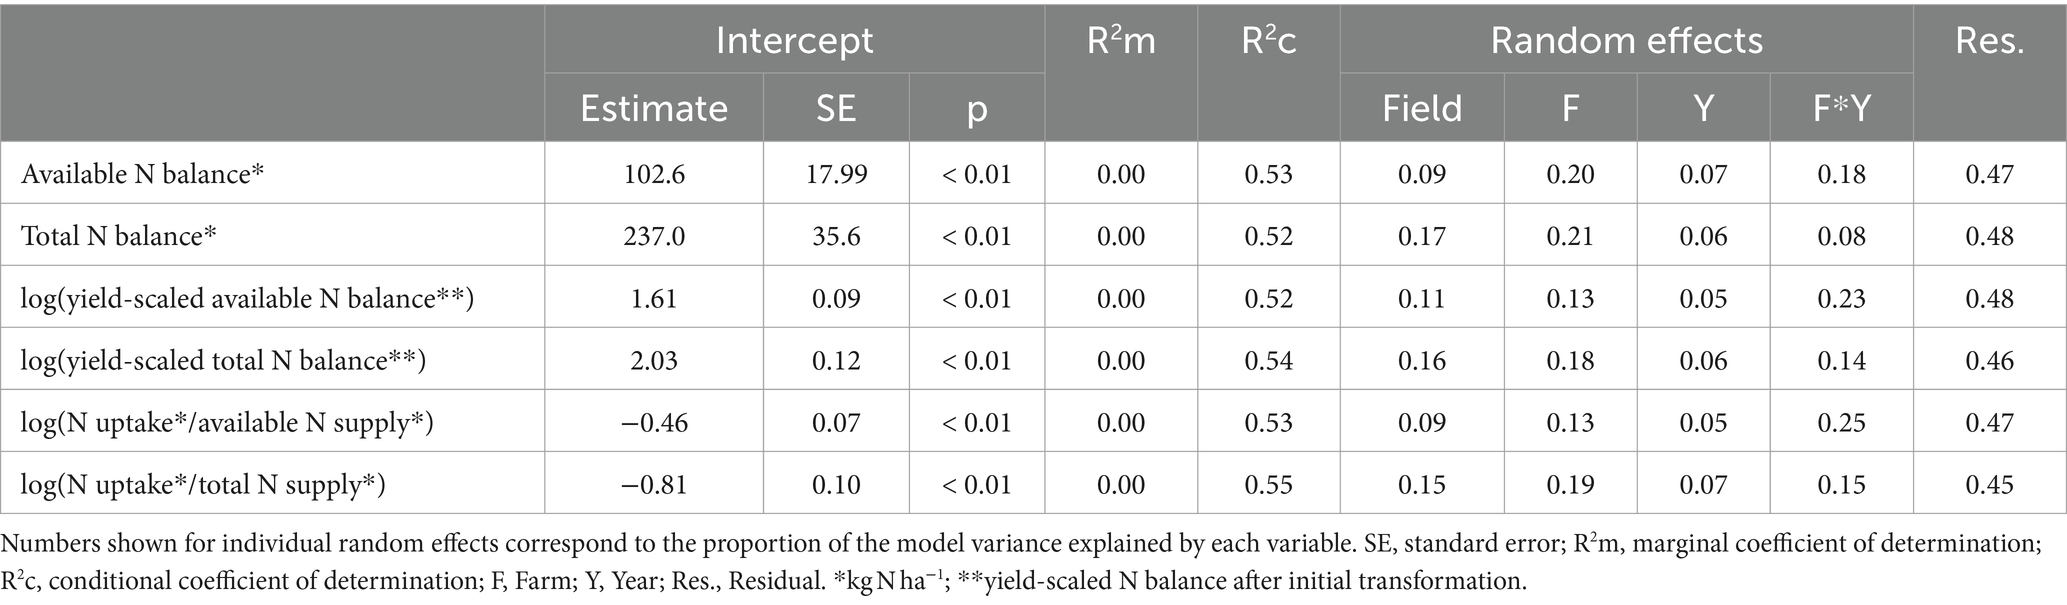
Table 3. Intercept estimates, standard errors, p values and variance components of random effects (field, farm, year, farm*year) from intercept-only linear mixed models, for different nitrogen (N) use indicators.
3.5 N uptake vs. N supply
Marginal R2 results were larger for models including N supply than N uptake, across all N use indicators (Table 4). The difference was particularly relevant for available and total N balances per ha (R2m of 0.75 and 0.94 for N supply in available and total balances per ha, respectively, compared to 0.08 and 0, for N uptake) (Figure 4). Marginal R2 for models including N uptake as the only predictor were larger for yield-scaled N balances, and N uptake/N supply compared to balances per ha.
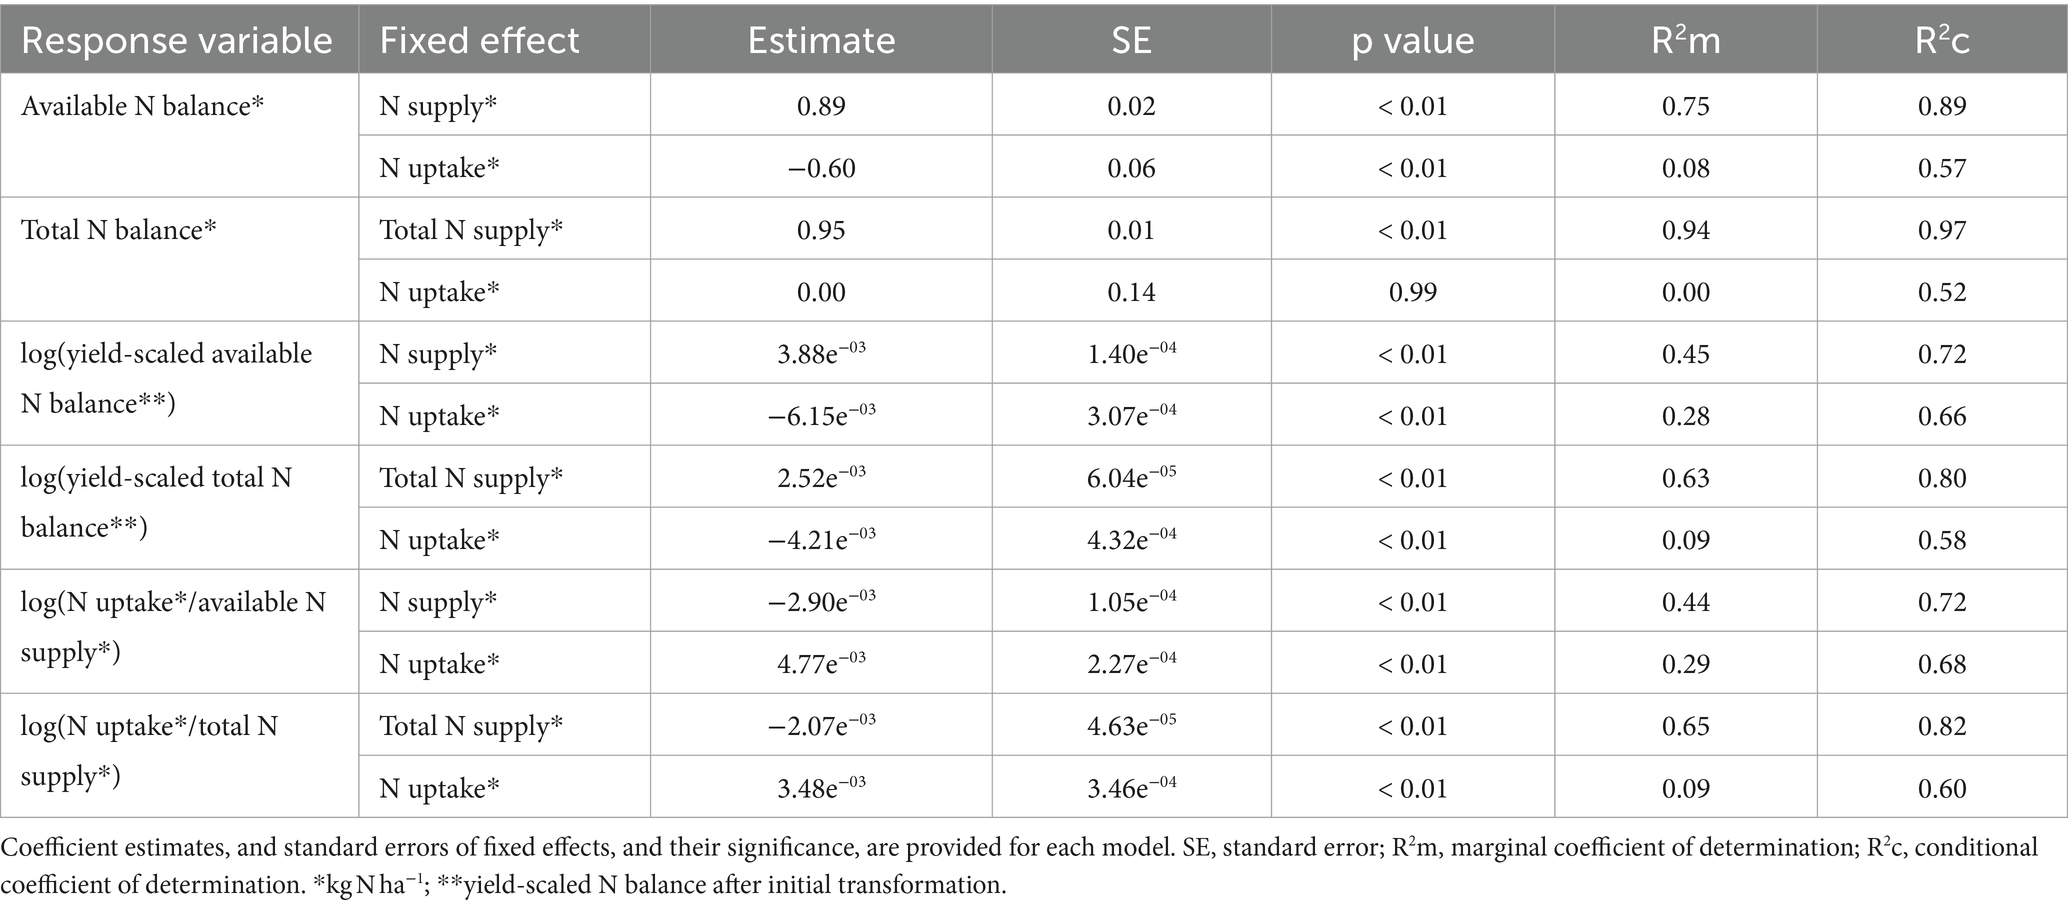
Table 4. Summary statistics for different linear mixed models fitted to explore the relationship between each nitrogen (N) use indicator and N supply and N uptake.
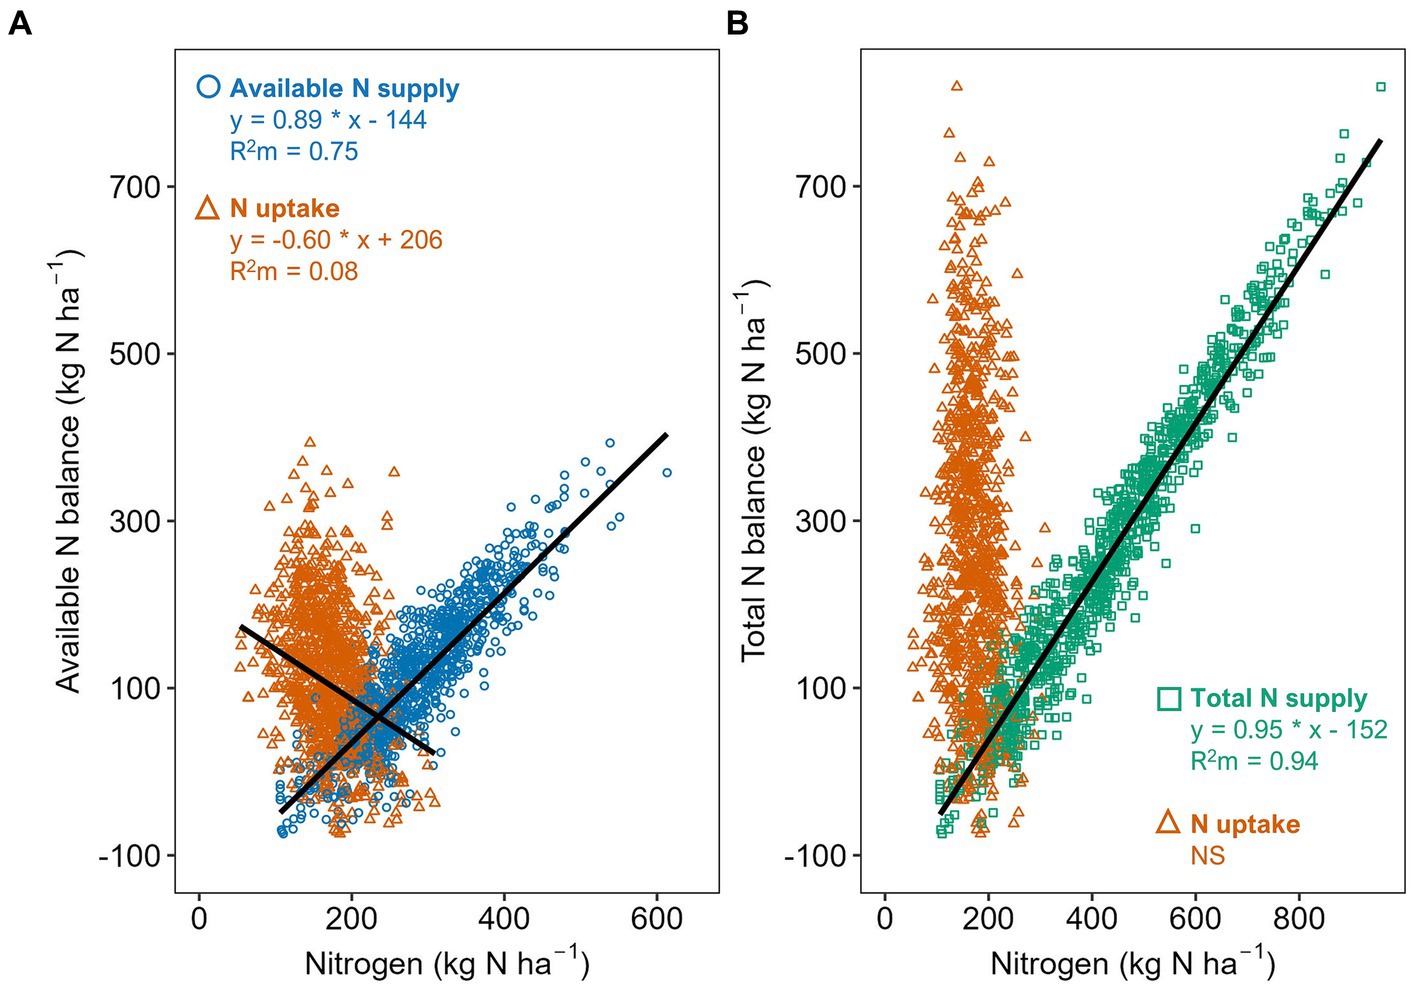
Figure 4. Available (A) and total (B) nitrogen (N) balances per ha, as related to N uptake and N supply (available or total). Each data point represents N uptake or N supply for a field*year observation in the database. Lines and equations correspond to outputs from linear mixed effect models. R2m, marginal coefficient of determination. NS, model not significant.
3.6 Impact of N supply sources and soil characteristics on N indicators
Available manure organic N explained 15% of the variability for available N balances per ha, 5% for yield-scale available N balances, and 6% for N uptake/available N supply (Table 5). Total manure organic N supply explained 88% of the variability for total N balances per ha. Manure N contribution was the single largest driver of changes in all indicators modeled among the N sources analyzed. Estimates for model coefficients were positive for all balances, indicating increases in manure N supply, resulted in higher balances. For N uptake/available N supply, the relationship was negative. Congruent with this finding, fields with manure applications showed significantly higher available N balances per ha than fields receiving no manure (estimated marginal means of 110 kg N ha−1 vs. 82 kg N ha−1, respectively). Similarly, available manure inorganic N explained 12 and 65% of the variability in available and total balances per ha. Balances increased with higher manure inorganic N supply. Fertilizer N application explained 5 to 6% of the variability in available balances per ha, yield-scaled available N balance and N uptake/available N supply. Similar to manure N, higher N supply with fertilizer resulted in a higher available N balance and yield-scaled N balance, and lower N uptake/N supply.
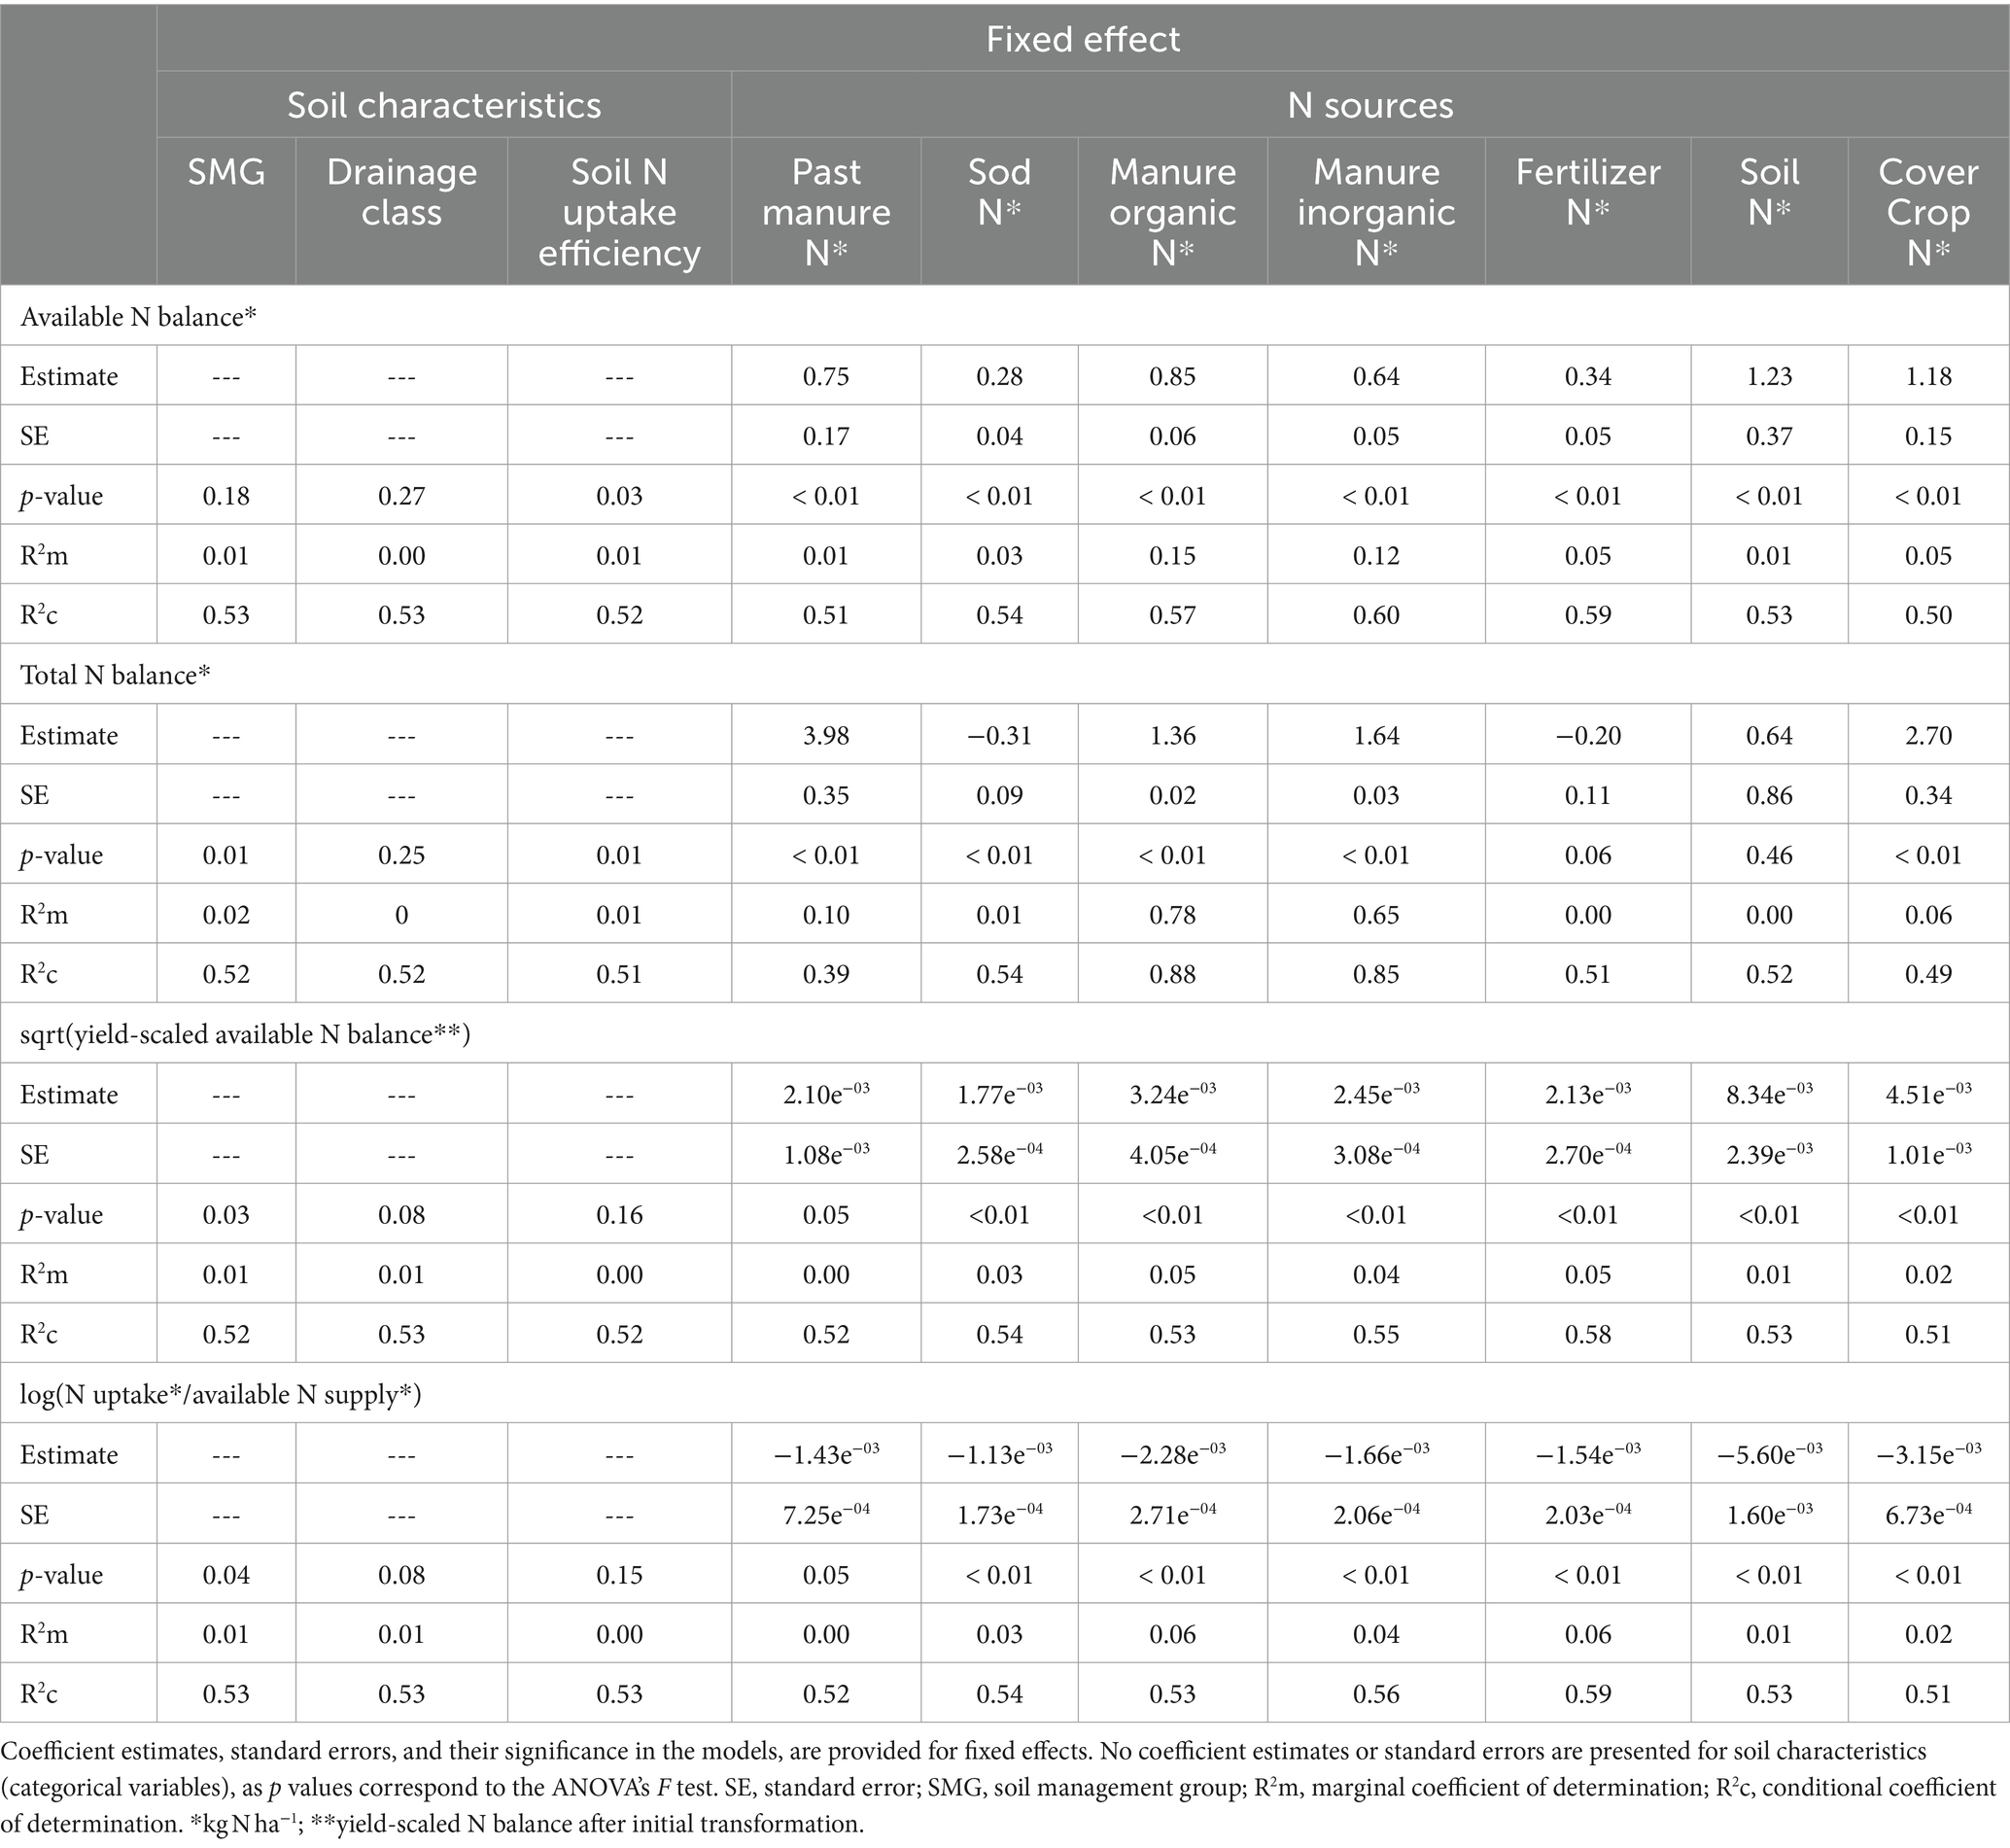
Table 5. Summary statistics for different linear mixed models fitted to explore the relationship between nitrogen (N) use indicators, and N inputs, and soil characteristics.
There was a negative relationship between fertilizer N and manure available N application (coefficient = −0.2, R2m = 0.06) (Table 6). On average across all farms and years, fertilizer N applications were reduced by 0.2 units, with a one unit increase in available N from manure (combining organic and inorganic N). Only small portions of the variability in fertilizer N application were explained by changes in N supply from past manure applications (R2m = 0.01) or sod credits (R2m = 0.01). However, fields in the first year of corn silage after sod (COS1) received less fertilizer N than corn in other rotation stages (p < 0.05) (Figure 5). Similarly, available N supply from manure was partially driven by sod N credits (R2m = 0.13), with significantly lower manure N rates in COS1 compared to other stages of the rotation. Results show that N supply from fertilizer and manure together were reduced by 0.64 units with each one unit increase in sod N credits, mostly due to reductions in manure N applications for first year corn fields after sod.
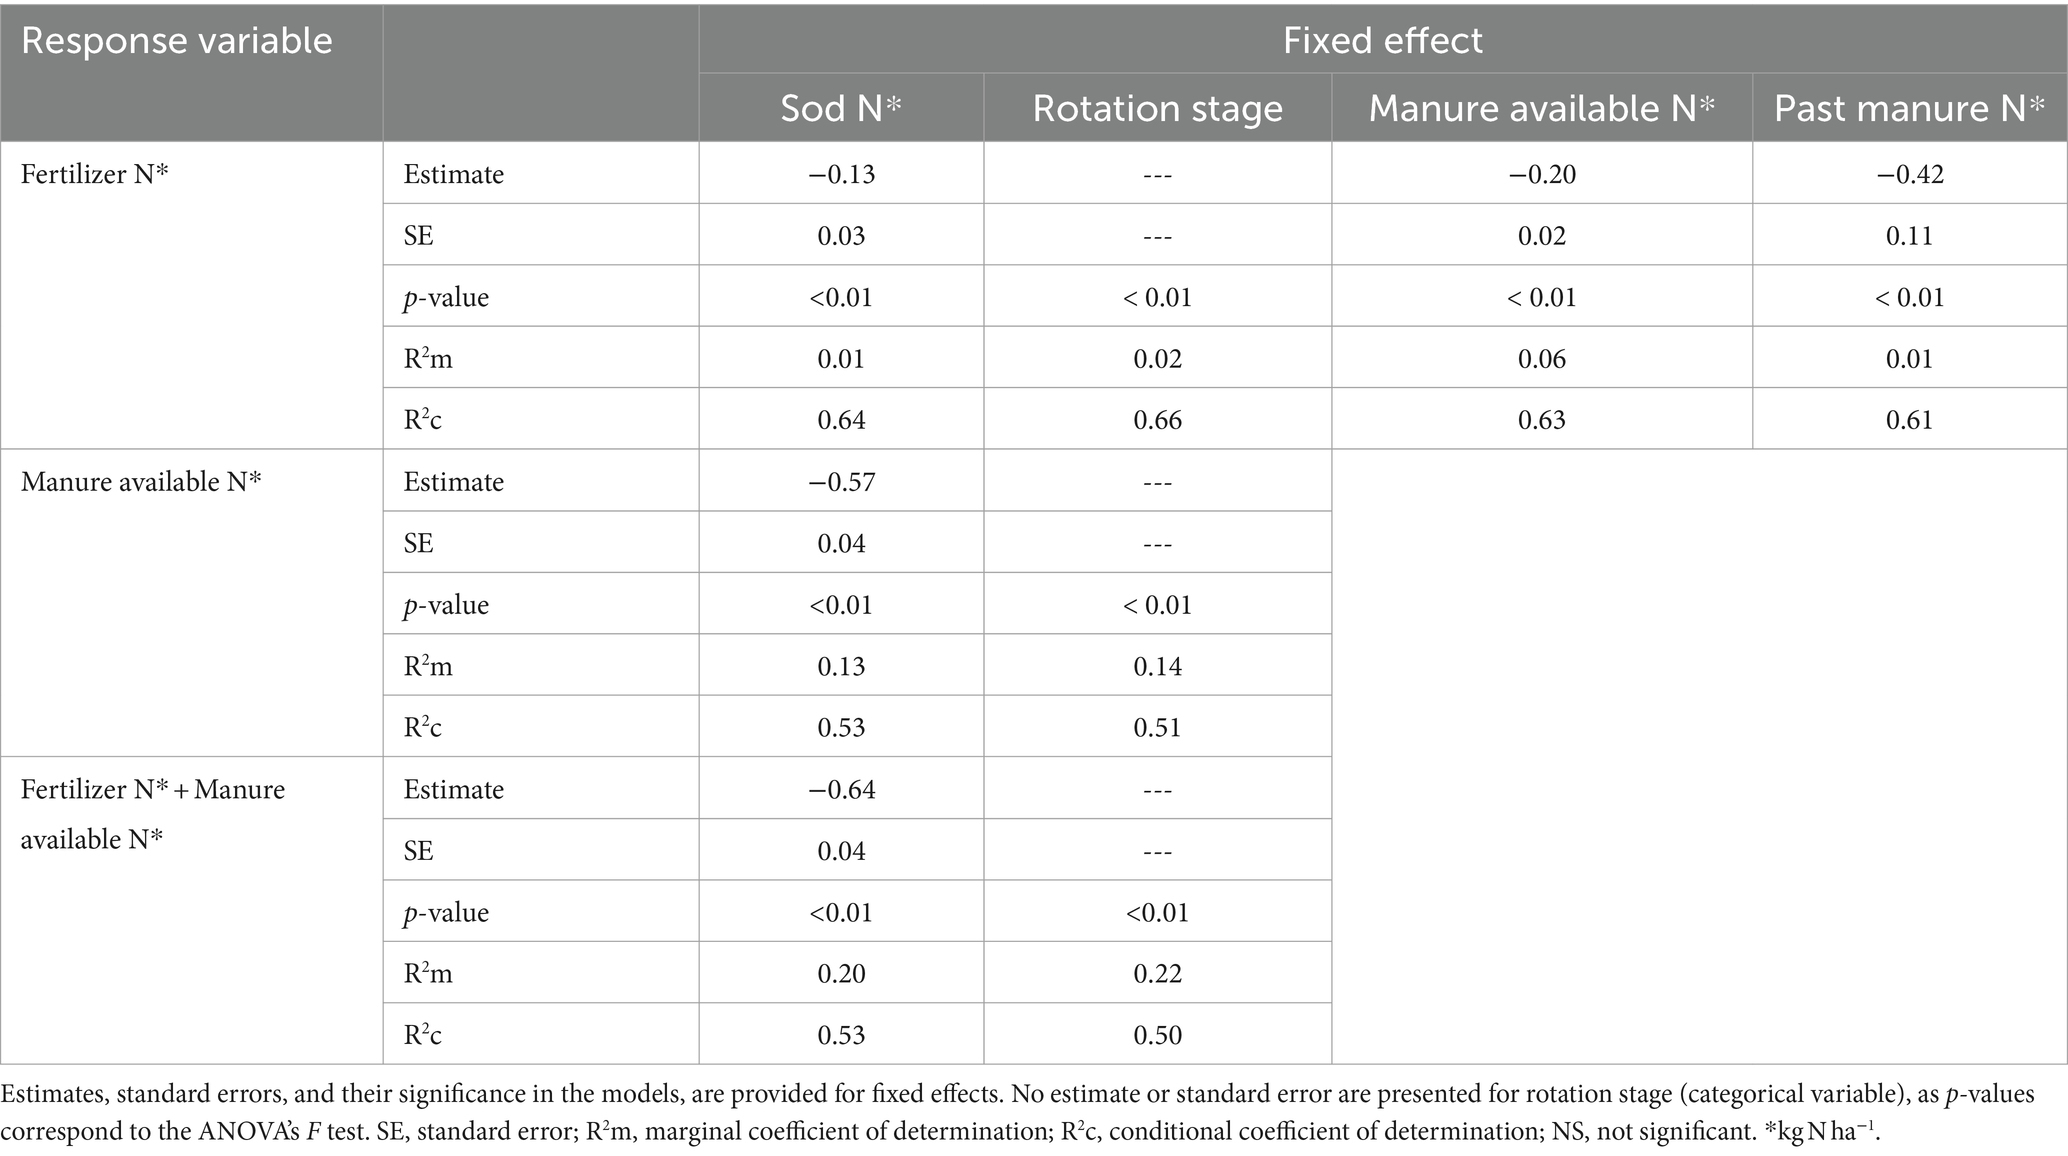
Table 6. Summary statistics for different linear mixed models fitted to explore the relationship between different nitrogen (N) sources and rotation stage.
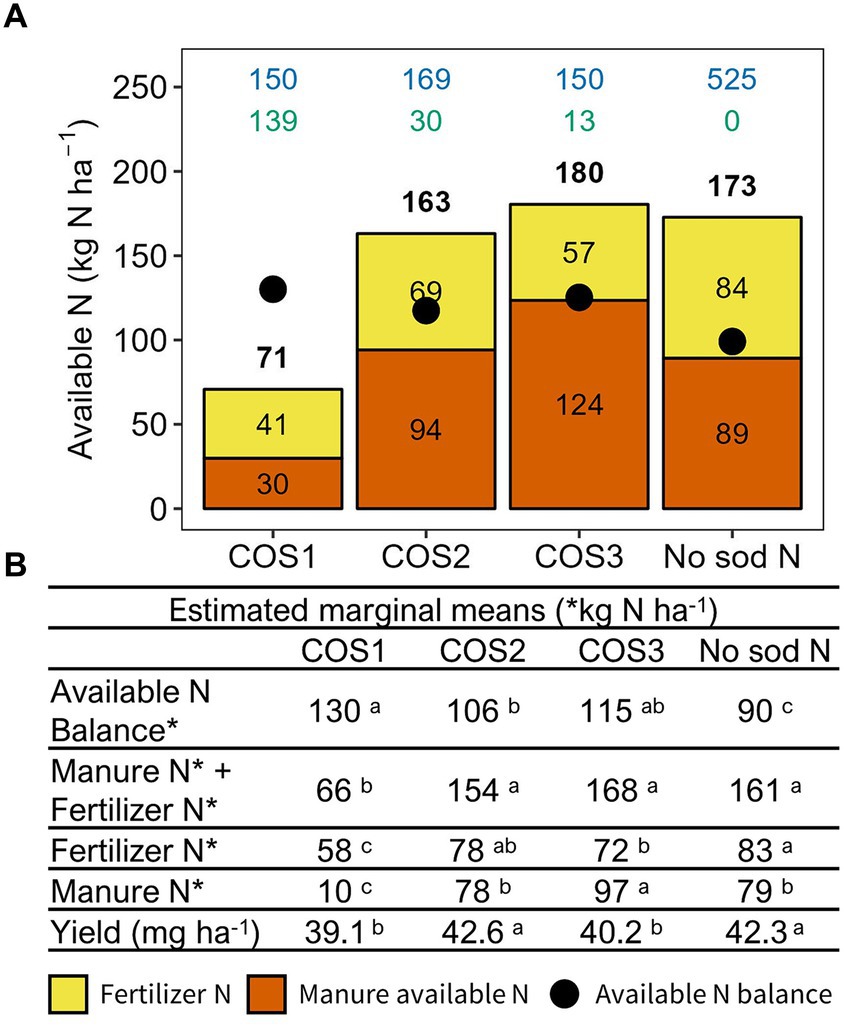
Figure 5. Area-weighted average available nitrogen (N) from fertilizer and manure applications (colored bars, A), and marginal means estimated by linear mixed effect model outputs (B), across all farms and years and for different stages of the crop rotation. In (A), blue numbers (line one) on top of the graph represent number of observations in each category, and green numbers (line two), the area-weighted average N credits from sod for observations in each rotation stage. Black bolded numbers on top of each bar represent the sum of the area-weighted average available N from fertilizer and manure. In (B), values for rotation stages that share the same letter within each row (fertilizer N, manure available N, combined manure available N and fertilizer N, available N balance and yield), have estimated marginal means not significantly different at p = 0.05. COS1, COS2, COS3 = first, second and third crop year of corn silage after sod.
Total N balances per ha, yield-scaled available N balance, and N uptake/available N supply differed among SMGs (Table 5). This was not the case for available N balances per ha. In general, fields in SMGs 3 and 4 showed the lowest balances per ha and per Mg of silage, and highest N uptake/available N supply ratios, whereas fields from SMG 1 showed the highest balances (data not shown). This reflected in part lower yields in SMG 1 (Figure 2) combined with similar or higher total N supply for this group, compared to higher yielding groups. Differences were also observed for available and total balances per ha across soil N uptake efficiency categories, but not for yield-scaled available N balance and N uptake/available N supply. In general, the low soil N uptake efficiency category (≤60%) showed lower balances than other categories, primarily driven by lower available and total N supply. However, despite differences across categories of these variables, SMG, soil N uptake efficiency categories, and drainage class explained a small portion of the variability for most indicators (R2m ≤ 1%, Table 5).
3.7 Farm-level indicators
Nitrogen supply varied considerably at the farm level (Figure 6). Average contributions from sod N ranged from 5 to 74 kg N ha−1 across farms, and average fertilizer use varied from 6 to 134 kg N ha−1. Available N supply from manure ranged from 24 to 72 kg N ha−1 for organic N, and from 1 to 57 kg N ha−1 for inorganic N. Average percent inorganic N availability from manure was 38, 30, 49, 36, 1, 40, 45, and 31 for Farms 1–8, respectively. The difference between available and total N supply ranged from 94 kg N ha−1 for Farm 3 to 219 kg N ha−1 for Farm 8.
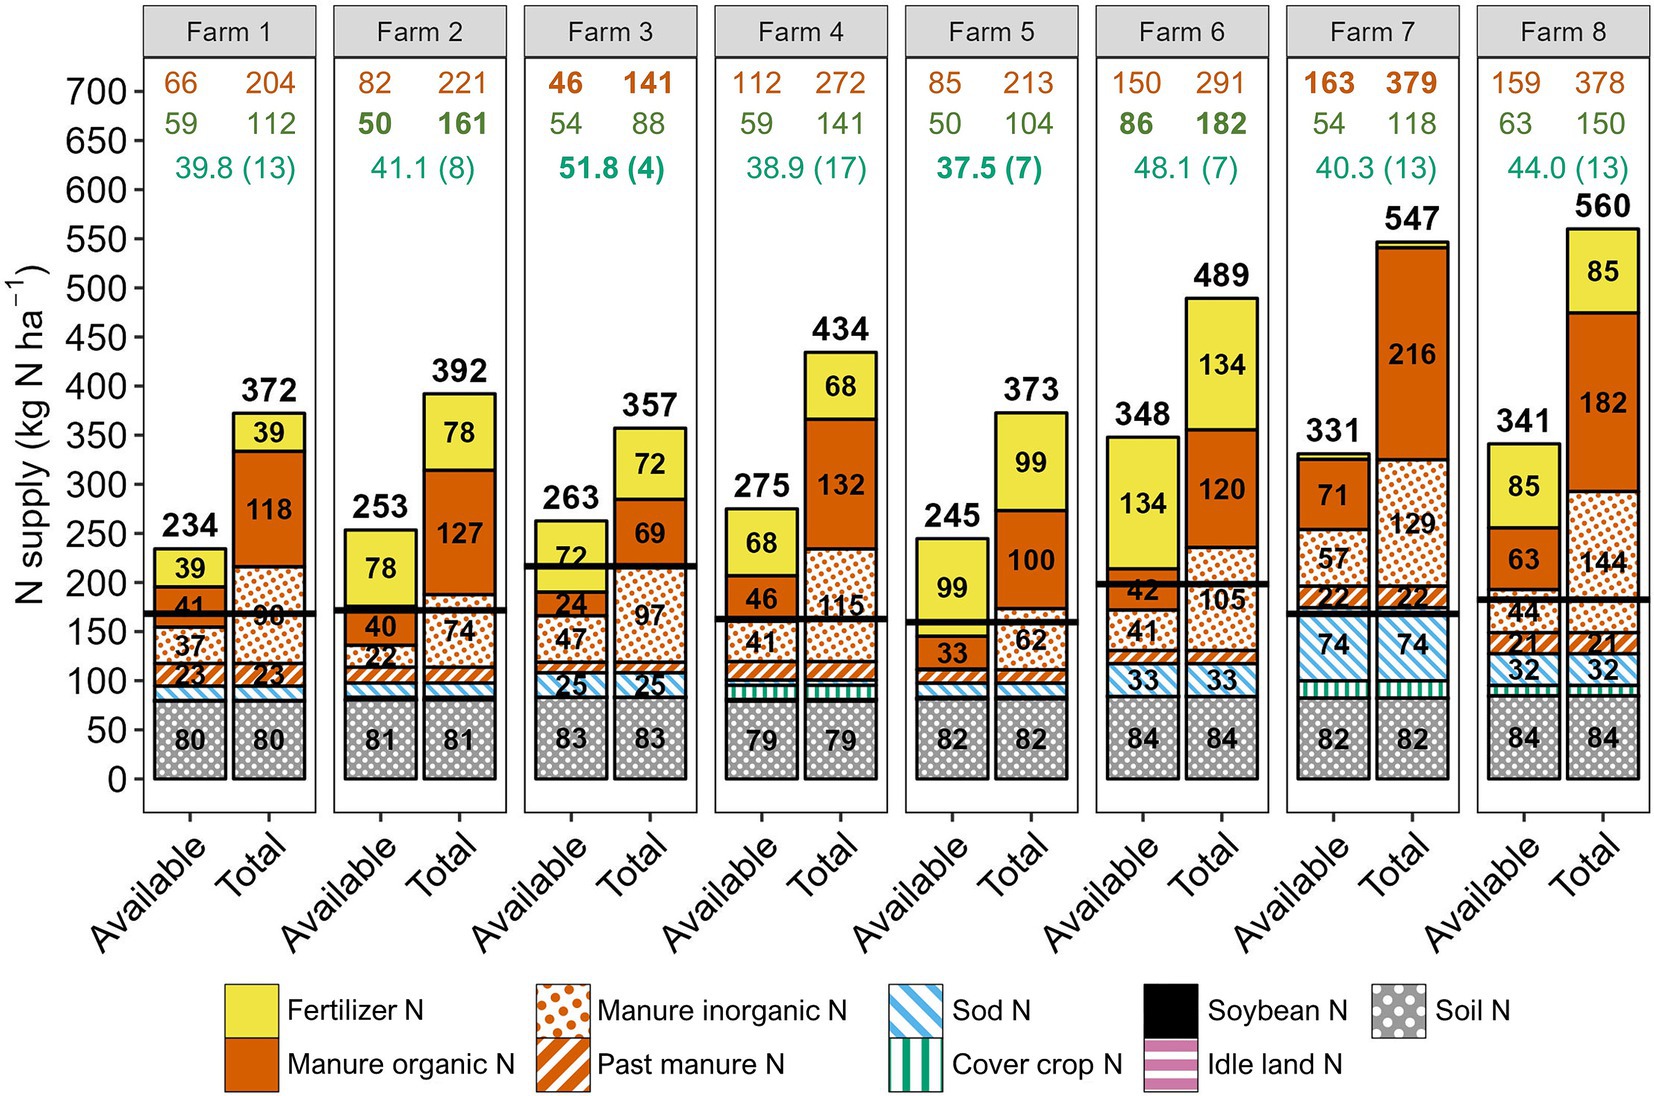
Figure 6. Area-weighted average available and total nitrogen (N) supply from different sources (bars) across all observations in individual farms, and area-weighted average for N uptake (horizontal black line). Black bolded numbers on top of the bars correspond to the addition of individual N sources. Numbers in the upper portion of the figure correspond to area-weighted average available and total N balances (1st line, kg N ha−1), average annual area-weighted standard deviation for available and total N balances across years of data collection (2nd line, kg N ha−1), and area-weighted average yields and coefficient of variation across years of data collection (3rd line, Mg ha−1, %). Bars with values equal or smaller than 20 kg N ha−1 are not labeled.
Farm-level averages for yield varied from 37.5 Mg ha−1 (Farm 5) to 51.8 Mg ha−1 (Farm 3). The largest variability in yield from year to year was observed for Farms 1, 7, and 8 (coefficient of variation = 13%) while Farm 3 showed the lowest variability (coefficient of variation = 4%).
Averaged at the farm level, available N balances ranged from 46 kg N ha−1 (Farm 3) to 163 (Farm 7) kg N ha−1. Total N balances ranged from 141 kg N ha−1 (Farm 3) to 379 kg N ha−1 (Farm 7). Mean annual standard deviation for each of the farms for available N balance ranged from 50 kg N ha−1 (Farm 2 and 5) to 86 kg N ha−1 (Farm 6). A lower standard deviation indicates all fields in the farm have similar balances, and a more even allocation of N resources. Average yield-scaled available N balances were 1.8, 2.2, 1.0, 3.2, 2.7, 3.4, 4.4, and 3.9 kg N Mg−1 for Farms 1–8, respectively. Average N uptake/available N supply values were 0.78, 0.71, 0.85, 0.63, 0.69, 0.60, 0.53, and 0.56 for Farms 1–8, respectively.
Animal densities across farms ranged from 1.98 AU ha−1 for Farm 1 to 3.58 AU ha−1 for Farm 8 (Table 1). Linear models testing the relationship between farm animal density, and average available N balances per ha, total N balances per ha, and total manure N supply showed p values ≤0.07 (Figure 7). All these indicators increased with higher farm animal densities. This was not the case for the relationship between farm animal density and average fertilizer N application.
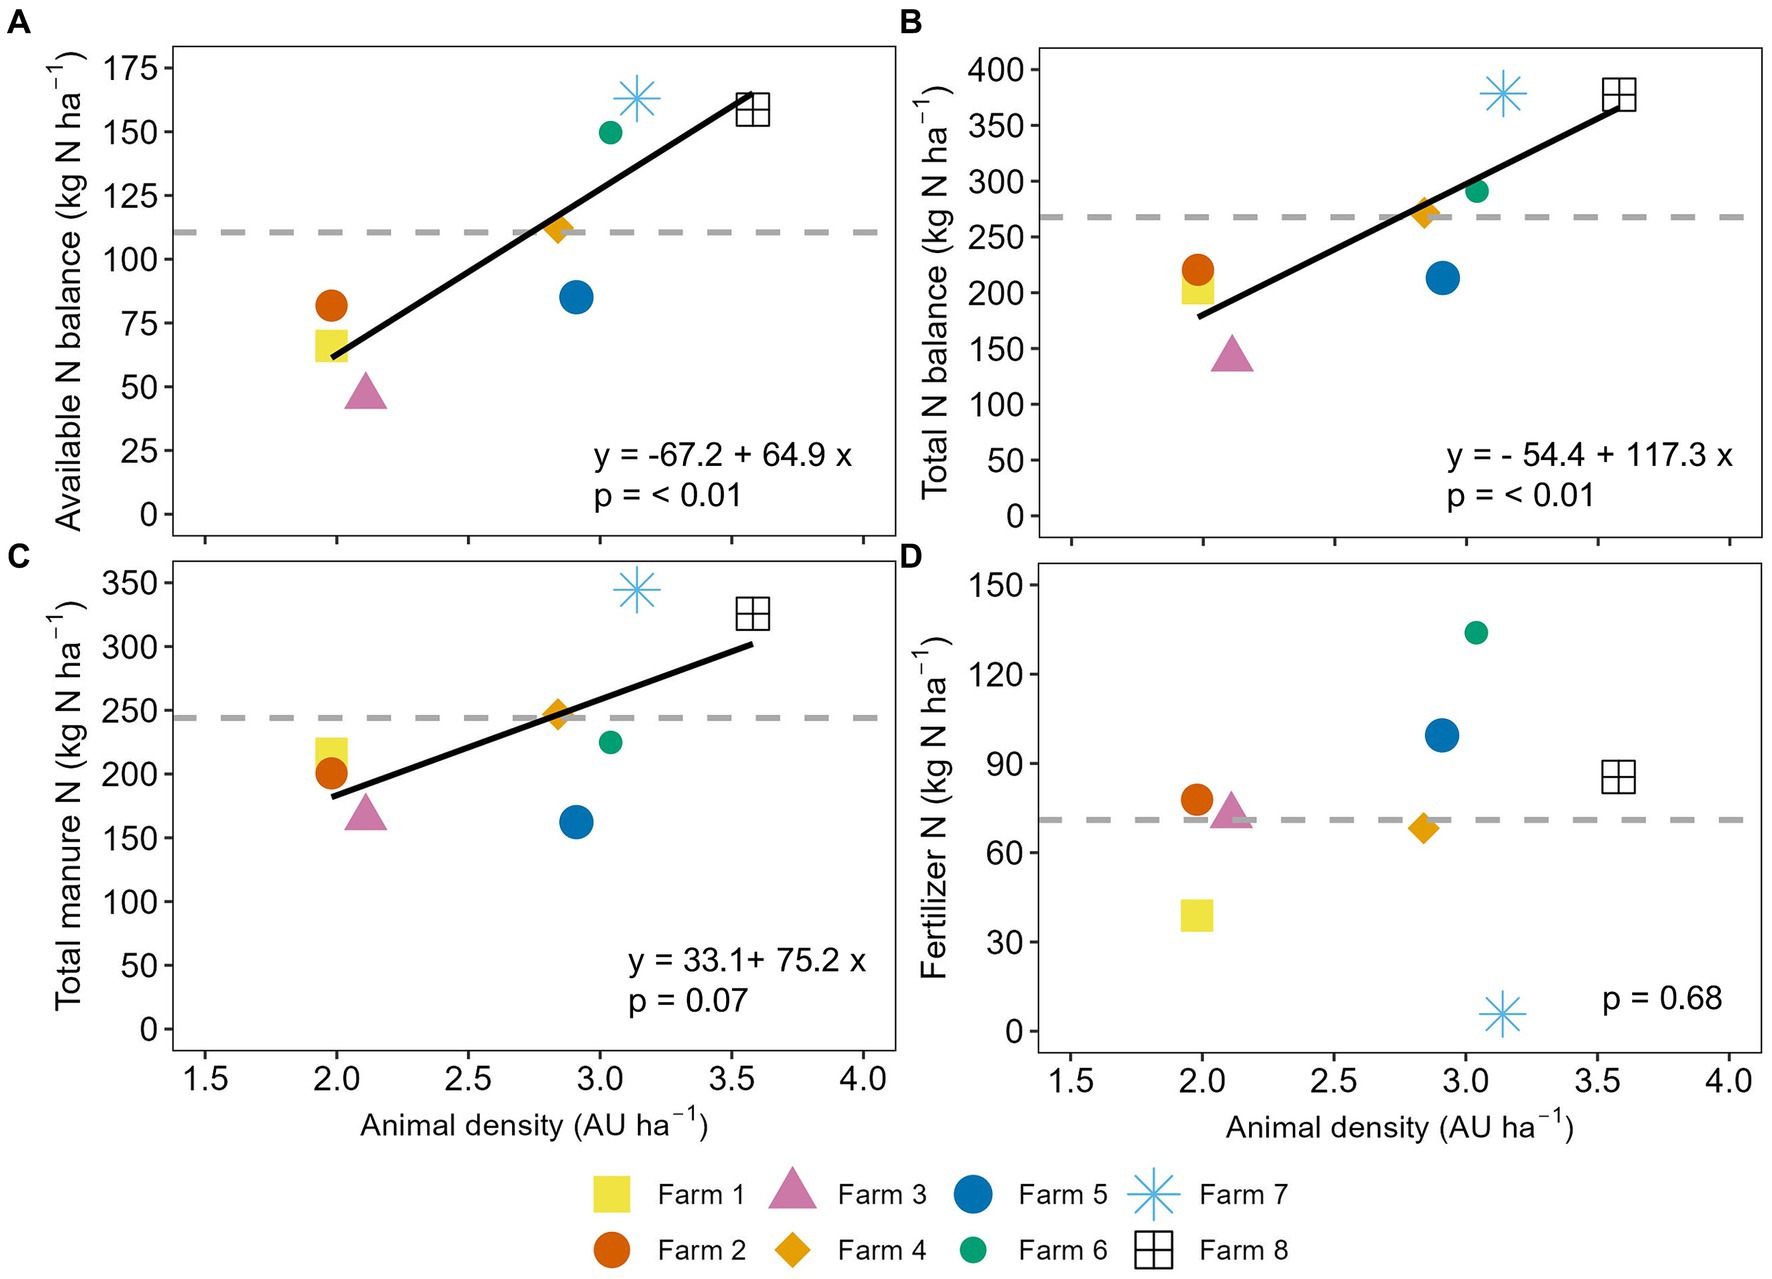
Figure 7. Relationship between farm animal density, and (A) area-weighted farm averages for available nitrogen (N) balance, (B) total N balance, (C) total manure N supply, and (D) fertilizer N supply. Formulas listed correspond to the linear model explaining the relationship between the two variables plotted. p-values for each predictor tested are listed. Dotted horizontal gray lines represent the area-weighted average for each dependent variable across farms and years. AU, animal unit = 454 kg (1,000 lbs) of live animal weight.
4 Discussion
4.1 Nitrogen use indicators varied widely
Available N balances in the present dataset showed a median of 111 kg N ha−1. In NY and Vermont (VT) corn silage variety trials, available N balances derived using the same methods as the current study, ranged from −46 to 69 kg N ha−1 across the six locations in 2021, from −26 to 90 kg N ha−1 in 2022, and from −78 to 57 kg N ha−1 in 2023 (Lawrence et al., 2021, 2022, 2023). The balances were lower than the median and area-weighted average of the current dataset, mostly reflecting that the average yield in the variety trials was above the median and area-weighted average of our database resulting in lower available N balances (median of 40.6 Mg ha−1 in the present study, versus site*year averages ranging between 44.6 and 80.5 Mg ha−1 in NY and VT corn variety trials). The lower balances and higher yields for the variety trials suggest that for many of the fields in the current database, N may have not been limiting yield.
Sela et al. (2018) reported N balances ranging between 47 to 148 kg N ha−1 for a dataset including 127 on-farm field trials across several US states, where 9% of the observations were corn silage, and 20% included manure applications. Although this study included manure and previous crop N credits, it did not consider soil N contributions. The median available N balance for the current dataset without considering soil N contributions (29 kg N ha−1) was lower than the lowest record reported by Sela et al. (2018).
Median values for N uptake/available N supply and N uptake/total N supply in the present dataset were 0.60 and 0.41, respectively. An evaluation of N uptake/N supply across Wisconsin ranked fields as “low efficiency” when below 0.92, “mid efficiency” from 0.92 to 1.29 and “high efficiency” when larger than 1.29 (Augarten et al., n.d.). However, no soil, cover crop or past manure N credits were considered in the N supply estimations, which results in higher efficiencies than the present study, and in some cases larger than one. In comparison, if those N credits were not taken into account, median N uptake/available N supply and N uptake/total N supply would be 0.96 and 0.54, respectively, in the current database.
Although most of N sources were accounted for in the estimations from the present study, 14% of the observations had N uptake/available N supply values above 90, and 8% had negative available N balances. Balances below zero can occur when the crop is more efficient at utilizing available N than what current N supply estimates give it credit for, or when a specific N supply pool is underestimated. Larger quantities of N could be available from (1) manure (higher N content in manure than the one reported in the laboratory analysis, due to variability attributed to sampling and analyses, and/or higher plant N availability than what is currently stipulated by book values), (2) sod N credits (in situations where percentage of legumes in the sod mix was higher than estimated, or environmental conditions favored higher N mineralization from plant biomass than what estimated through book values), (3) soil N supply (fields with long history of manure application, high levels of soil organic matter, and/or favorable conditions for mineralization of soil organic N may result in higher soil N supply than what was defined through book values), and (4) atmospheric N deposition, although contributions should be minor (9 kg N ha−1) (Baumgardner et al., 2002).
In general, farms with lower average available N balances across their land base exhibited the largest proportion of high efficiency fields in the current dataset. A total of 40% of fields in Farm 3 had N uptake/available N supply of 90% or higher. This farm was characterized by lower average N supply and higher yields than other farms. Fields with higher N uptake/available N supply were also higher yielding. This is consistent with the current N guidelines for corn silage in NY that recognize lower N needs per Mg of silage produced in higher-yielding fields to account for a potential underestimation of N supply from soil with use of book values in conditions of high productivity (Ketterings and Workman, 2023). Higher yielding observations are then more prone to show lower or negative N balances due to larger N removal, and higher likelihood of underestimation of N supply with use of book values for some sources of N.
Consistent year to year differences explained small portions of the variability in N use indicators compared to farm to farm and field to field differences. Farm was the single most relevant driver across model random effects, and particularly important to explain the variability in available balance per ha, and all indicators involving total N supply (total N balances per ha, yield-scaled total N balances, and N uptake/total N supply). For this last group, field also explained a large portion of the variability. For yield-scaled available N balance, and N uptake/available N supply farm*year explained the largest portion of the variability. These results suggest the indicators effectively point at farm-to-farm differences, and therefore, opportunities for improvement in management. Furthermore, as the different N indicators show slightly different drivers, combining several indicators in a single evaluation can help assess different aspects of farm management (i.e., N supply, field productivity).
Some of the N balance indicators varied across different SMGs and soil N uptake efficiency categories in this study (not drainage classes). Similarly, Sela et al. (2018) found soil texture to be a significant predictor of N surplus when analyzing corn fields in multiple locations across the US. On the contrary, N uptake/N supply documented for corn grain and silage fields in Wisconsin did not significantly differ by soil type (Augarten et al., n.d.). Although significant differences existed, the explanatory power of these soil characteristics for the variance across indicators was lower than other factors analyzed. Differences in performance across SMGs, with fields in SMGs 3 and 4 showing lower balances than fields in SMG 1, can be partially attributed to higher yields in SMGs 3 and 4 and in part to management. Fields in SMG1 are generally expected to attain lower yields than other soil management groups, but they had a similar level of N supply to fields in other SMGs resulting in larger N balances (data not shown). This points at the opportunity of reducing N application in SMG 1 fields according to realistically attainable crop yields.
4.2 Corn yield impacted N use indicators less than N supply, but varied by farm and soil characteristics
Farm-to-farm differences explained the largest portion of the variance in yield. Different environmental conditions and management strategies associated with each farm have an influence on yields achieved. The farm*year interaction showed the second largest explanatory power for yield across random effects. This could be explained by (1) variation in management among farms for different years, or (2) inconsistent variation of weather patterns across farms, from year to year that impacted yields differently. Precipitation patterns during the years analyzed varied across Farms and years, particularly for farms 1, 3 and 5, located in the northern and northeastern part of the state, compared to the rest of the dataset (Supplementary Figure S1). Similarly, different patterns existed for yield variations across farms and years. The relevance of the farm*year interaction to explain the variance in yield, likely also explains the relevance of this factor for explaining the variability in yield-scaled available N balance, and N uptake/available N supply, for which N uptake (yield), played a larger role than for balances per ha. Field to field differences explained 16% of the variance in yield, while consistent year-to-year differences did not explain any of the variance in yield. Similarly, Tenorio et al. (2021) reported larger variations in yield and N inputs across fields than across years.
In general, fields from SMGs 2–5, generally associated with higher pre-defined soil N uptake efficiency and better drainage showed overall enhanced yields. This is not surprising as fields with better drainage systems tend to show better yield performance in humid climates such as NY.
Nitrogen supply, and particularly manure N supply had an impact on yield. Manured fields showed higher N supply, which may have ensured no N limitations. Farmers may also choose to apply manure nutrients in higher-yielding fields. Another potential explanation is that manure applications can increase yields beyond its nutrient value, via improved soil biological activity, nutrient cycling, soil pH and increased soil organic carbon (Cai et al., 2019; Ramos Tanchez et al., 2023). Neither fertilizer applications nor sod N contributions explained large portions of the variation in yield in the current database, although fields with sod N contributions showed lower productivity (estimated marginal means of 40.8 vs. 42.1 Mg ha−1, respectively).
4.3 Nitrogen supply considerably affected N use indicators
Nitrogen supply was a larger driver for all N use indicators compared to N uptake. This is consistent with previous studies in Nebraska (Grassini and Cassman, 2012; 60% of the variability explained by N supply), Ohio (Hanrahan et al., 2019; 67% of the variability in agronomic N balances explained by N applications), and across the US (Sela et al., 2018). Tenorio et al. (2021) also documented a larger influence of N inputs than yield in defining field-level N balances for corn fields in Nebraska (88% of the variability in balances was explained by N inputs, and only 12% by yield). These results suggest that producers’ decisions on N inputs influence N use indicators more than yield affected by weather variation across years.
Farm to farm differences explained more of the variation in available N supply (28%) than field to field differences (13%), year to year differences (4%), or the farm*year interaction (10%) (data not shown). A relatively steady manure N supply (animal units in the farm not varying drastically from year to year) and similar management strategies within each operation across years may explain why N supply was highly associated with individual dairies and less impacted by year to year or field to field management differences. Similarly, little variation in N supplied to corn across years was seen in field-level N balances in Nebraska (Tenorio et al., 2021).
Larger balances per unit of land were associated with high N supply and low-yielding fields (Figure 4) which suggests that factors other than N supply limited yield. These could be in-season factors that prevent a field from achieving its yield potential (rainfall, pest pressure), or (semi) permanent limitations in certain environments (soil type, depth to bedrock, compaction, drainage) not acknowledged in N application planning. Consistent with our findings, Tenorio et al. (2021) showed that fields with largest balances were lowest yielding and experienced no additional benefit from large N supply. The same study showed that fields with consistently high balances across years had higher fertilizer N applications (no manured fields were considered), and a larger mismatch between N inputs and economic optimum N rate. Ranking of fields on a farm from lowest to highest available N balances and representing N uptake and N supply for each field will allow for quick identification of fields where N was unlikely to limit yield, and may have been over applied (see an example for Farm 8 in Figure 8). Fields on the right-hand side of the graph show high available N balances. Fields with larger unavailable manure inorganic N than available manure inorganic N indicate inefficient use of this N fraction.
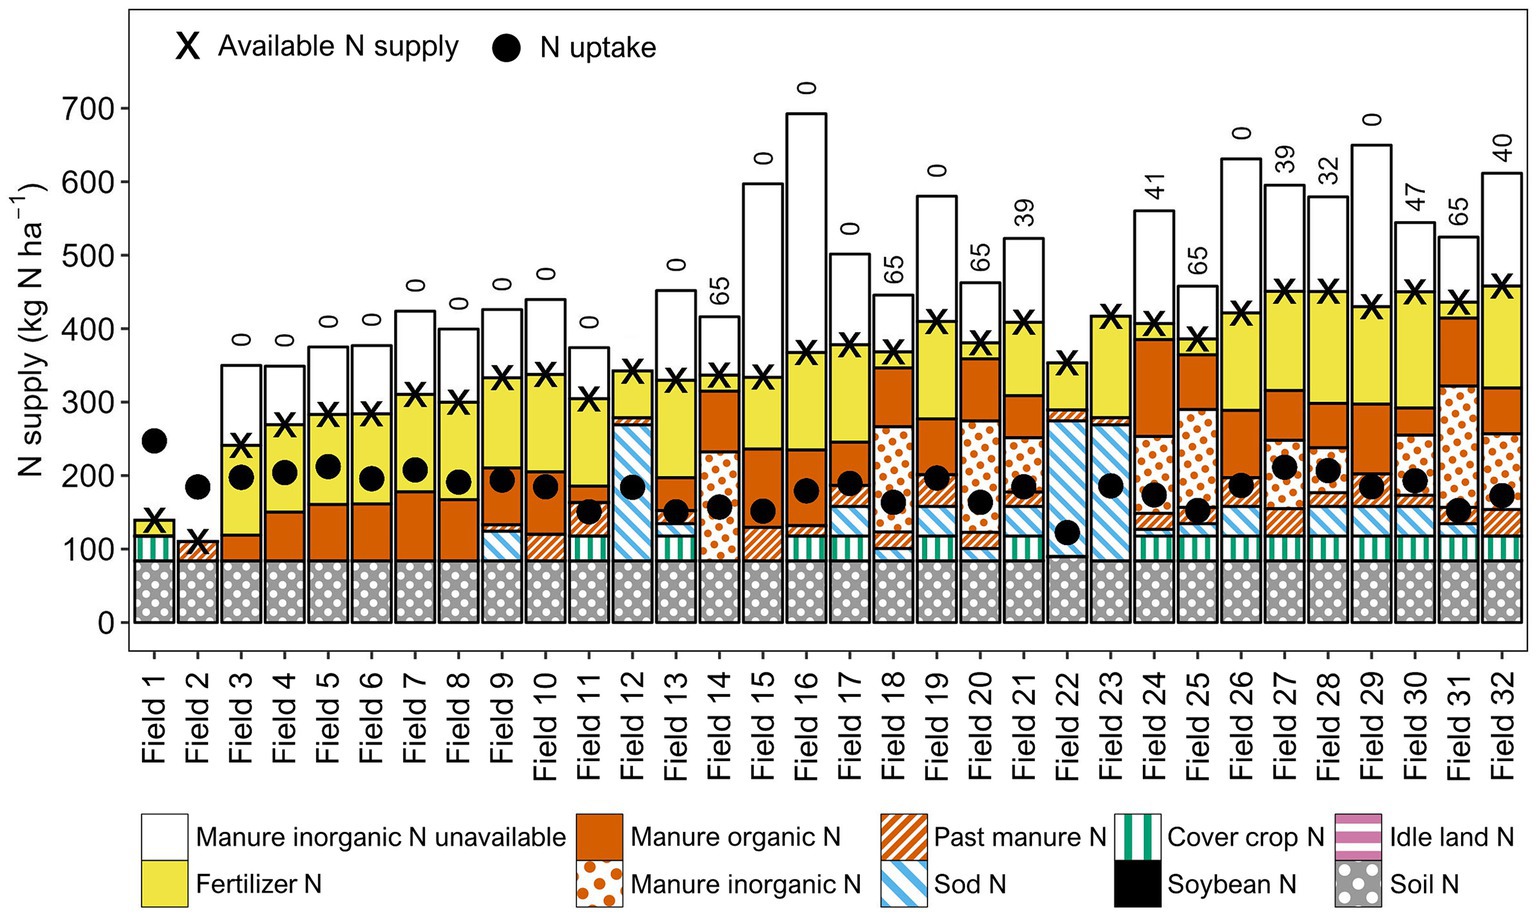
Figure 8. Nitrogen (N) supply in individual corn silage fields from different sources (bars), available N supply (black cross), and N uptake (black dot), in Farm 8 during the 2021 crop year. Fields are arranged according to increasing available N balances from left to right (larger gap between black cross and black dot). Numbers on top of the bars represent the net manure inorganic-N utilization efficiency for individual fields.
4.4 Manure-N and Sod-N nutrient replacement value impacted N use efficiency
Farms showed a wide range for manure and fertilizer N supply, reflecting differences in manure availability and management strategies. Available manure organic and inorganic N played the largest roles in explaining the variability of N use indicators, with available N balances increasing and N uptake/available N supply decreasing with an increase in manure N supply. Furthermore, balances in manured fields were significantly higher than in fields not receiving manure. Fertilizer was also relevant to explain variability in available N balances per ha, yield-scaled available N balances and N supply/available N uptake, but to a smaller degree. These findings are similar to previous research that showed larger N balances in areas with manure N applications, compared with others receiving only inorganic N fertilizer (Khanal et al., 2014; Sela et al., 2018; Hanrahan et al., 2019). Improving manure N utilization can then help enhance N use efficiency in these farms. Opportunities to reduce large balances in cropping systems where manure nutrients are available may differ from those where only fertilizer nutrients are applied, given the complexities associated with manure distribution, application, and nutrient value assigned by producers. Access to manure storage, availability of application equipment and their operation costs, and number of days suitable for manure application all affect a farmer’s ability to deliver manure nutrients with the right rate, at the right time and application method (Ribaudo et al., 2011). In addition, uncertainty in manure nutrient content and release and the availability of land for manure spreading can contribute to a larger mismatch between crop N requirements and N applied. The 0.2 unit decrease in fertilizer N application in corn fields with a 1 unit increase in available N from manure documented in the present study suggests that manure is valued as an N source but uncertainty about the amount by which fertilizer N could be reduced exists. Considering all these possibilities, identifying farm-specific management strategies (infrastructure, equipment, land availability, nutrient management planning, labor, farmer perception) that can yield the largest return in manure nutrient utilization is necessary to advance N use efficiency.
Large reductions in manure and fertilizer N applications were documented with increases in N availability from sod, mostly driven by lower manure N applications for first year corn silage after sod in a rotation (COS1). This shows that farmers valued sod N credits, consistent with research that showed external N application can be reduced to starter N fertilizer only when corn is grown in rotation with sods (Lawrence et al., 2008; Yost et al., 2014a). However, despite this reduction in fertilizer and manure N applied to first year corn, the average available N supply remained substantial (71 kg N ha−1), which resulted in average available N balances for COS1 higher than for fields with no sod N credits. This could indicate farmers in the current study valued sod N credits less than the value assigned in land-grant university guidelines (Ketterings and Workman, 2023), and/or that producers applied manure beyond crops N needs, to supply nutrients such as P and K depleted under sod years, limiting N use efficiency. Similarly, previous work in Minnesota showed limited adoption of proper rotation (alfalfa) and manure N crediting by growers (Yost et al., 2014b). Furthermore, in the present study N applications from manure and fertilizer did not differ significantly between fields in second or third corn crop after sod (COS2, COS3), and those with no sod N credits. This would indicate there is no crediting of sod N contributions beyond the first year after switching from sod to corn silage in the rotation, similar to findings from Yost et al. (2014b).
The current database showed large farm-to-farm differences between available and total N supply, mostly driven by manure rates used in fields, and the percent of total land base for which spring injection/incorporation was done. Total N balances will always be larger than available N balances due to unavoidable losses of manure N. However, a greater adoption of spring manure injection or incorporation, or in-season manure injection will aid in reducing inorganic N volatilization and can enhance N use efficiency of manure (Ketterings and Workman, 2023). This would then reduce the gap between available and total N balances, as long as farms have the land base to optimally distribute the N. This is particularly relevant for Farms 5, 2, and 8 that showed the lowest average percentage of manure inorganic N availability across all farms (1, 30, and 35%, respectively). Technologies that allow in-season manure application may help increase N use efficiency from manure beyond the best results documented in this study (49% average, Farm 3) (Sela et al., 2018, 2019).
4.5 Farm animal density was associated with N use indicators
Nitrogen use indicators showed large ranges when averaged at the farm level. This highlights the opportunity of those operations with higher N balances and lower N uptake/N supply to work on optimizing N management. Moreover, within-farm variability of N balances differed. Farms with high average standard deviations for N balances may have opportunities to better distribute their N sources across fields. However, animal density played a significant role and can limit what efficiency levels a farm may reach. Animal densities tended to correlate with greater availability of manure N per unit of corn silage land unless a portion of the manure was used for other crops on the farm. Multiple studies reported in the past the relationship between farm-level N balances, and farm animal density (Cela et al., 2015; Ros et al., 2023). Ros et al. (2023) showed, for 47 farms in the northeastern US, a higher likelihood of surpassing feasible whole-farm N balances of 118 kg N ha−1 when animal densities exceeded 1.95 AU ha−1. Farms 7 and 8, with densities considerably higher than this threshold, showed the highest available and total N supply, as well as total manure N supply. Farms 4, 5 and 6 also had animal densities larger than 1.95 AU ha−1 but their average total manure N contributions in corn silage fields were not considerably larger than Farms 1–3, with lower animal densities. One possible explanation is that these farms had a relatively larger area devoted to crops with large N requirements, other than corn silage (Table 1), providing alternative options for manure allocation, such as sod land with low legume content, winter cereals, or corn grain. This was not the case for Farms 7 and 8, which had a smaller proportion of land that could demand high N applications. This factor, paired with low or no manure exports, would explain why increases in animal density in Farms 7 and 8 were associated with high N balances in corn silage fields.
These results suggest that effectively managing farm animal density, considering farm N needs according to crop rotations (sod N contributions varied largely by farm) and the ability of the land base to recycle manure nutrients, may help improve corn silage and whole-farm N use indicators. The results for the higher animal density farms also show that when manure N supply surpasses farm N needs after accounting for other N sources, manure exports need to be considered.
4.6 Adaptive management should consider field balances for corn silage
State policy in NY allows producers to opt for an Adaptive Management Process and experiment with higher N application rates than recommended by land-grant university guidelines, given field yield is measured and an environmental assessment is conducted to evaluate if the extra N was needed (Ketterings et al., 2023). The results presented suggest field balances for corn silage can be an effective N use efficiency metric in those scenarios, and when conducting general nutrient use efficiency assessments. Balances are sensitive to farm management changes and can point towards opportunities for improvement. However, such an option should include estimation of multiple field N use indicators, and will require the setting of feasible limits.
5 Conclusion
Variability in N use indicators for corn silage fields was primarily driven by N supply. Farm-to-farm differences explained the largest portions of the variability in N supply, yield and N use indicators, and year-to-year changes, the lowest. Manure organic and inorganic N played the largest roles in explaining the variability in N use indicators, with balances increasing and N uptake/N supply decreasing as manure N supply increased. Balances increased with animal density. Properly crediting sod and manure N contributions, increasing manure inorganic N utilization efficiency, reducing animal densities or exporting manure, can aid in improving field N use indicators. Future work is needed to identify feasible ranges for field-level N balances and incentivize the implementation of this assessment through adaptive nutrient management policies.
Data availability statement
The datasets presented in this article are not readily available because they are owned by the farmers participating in the project. Requests to access the datasets should be directed to QK, cW1rMkBjb3JuZWxsLmVkdQ==.
Author contributions
AO: Conceptualization, Methodology, Writing – review & editing, Formal analysis, Investigation, Project administration, Writing – original draft. KW: Writing – review & editing. QK: Writing – review & editing, Conceptualization, Funding acquisition, Methodology, Supervision.
Funding
The author(s) declare that financial support was received for the research, authorship, and/or publication of this article. This research was funded by a USDA-NIFA grant, funding from the Northern NY Agricultural Development Program (NNYADP), and contributions from the NY Corn Growers Association (NYCGA) managed by the NY Farm Viability Institute (NYFVI). The lead author was funded by a graduate teaching assistantship supplied by the Department of Animal Science, Cornell University.
Acknowledgments
We thank farmers and their certified crop advisors who shared farm data, were involved with data quality checks, and discussed findings with our team. We also extend our gratitude to undergraduate students William Salamone, Joseph Kelly, and Skylar Cooper, and Cornell Nutrient Management Spear Program staff members Manuel Marcaida III and Abraham Hauser, who helped with data collection and processing. We thank Joe Guinness and Erika Mudrak, from the Cornell Statistical Consulting Unit for their help with the statistical analysis. We also appreciate the feedback provided by Kristan Reed and Daryl Van Nydam during the execution of the project.
Conflict of interest
The authors declare that the research was conducted in the absence of any commercial or financial relationships that could be construed as a potential conflict of interest.
Publisher’s note
All claims expressed in this article are solely those of the authors and do not necessarily represent those of their affiliated organizations, or those of the publisher, the editors and the reviewers. Any product that may be evaluated in this article, or claim that may be made by its manufacturer, is not guaranteed or endorsed by the publisher.
Supplementary material
The Supplementary material for this article can be found online at: https://www.frontiersin.org/articles/10.3389/fsufs.2024.1385745/full#supplementary-material
Abbreviations
AU, animal unit; CAFO, Concentrated Animal Feeding Operations; CNMP, Comprehensive Nutrient Management Plan; COS, corn silage; CSNT, corn stalk nitrate test; SMG, soil management group.
References
Augarten, A., Radatz, A., Ruark, M., and Olson, E. (n.d.). Nitrogen use efficiency: Statewide NUE benchmarking for corn grain and silage. University of Wisconsin Discovery Farms. Available at: https://uwdiscoveryfarms.org/articles/statewide-nitrogen-use-efficiency-benchmarking-for-corn-grain-and-corn-silage/discoveryfarms-nue-foronline/
Bartoń, K. (2023). Package ‘MuMIn’: multi-model inference. Available at: https://cran.r-project.org/web/packages/MuMIn/index.html
Bates, D., Mächler, M., Bolker, B., and Walker, S. (2015). Fitting linear mixed-effects models using lme4. J. Stat. Softw. 67, 1–48. doi: 10.18637/jss.v067.i01
Baumgardner, R. E., Lavery, T. F., Rogers, C. M., and Isil, S. S. (2002). Estimates of the atmospheric deposition of sulfur and nitrogen species: clean air status and trends network, 1990−2000. Environ. Sci. Technol. 36, 2614–2629. doi: 10.1021/es011146g
Berlingeri, J. M., Lawrence, J. R., Sunoj, S., Czymmek, K. J., and Ketterings, Q. M. (2021). Nitrogen and phosphorus balances vary at the whole-farm, field, and within-field scales. Front. Sustain. 2, 1–12. doi: 10.3389/frsus.2021.747883
Cai, A., Xu, M., Wang, B., Zhang, W., Liang, G., Hou, E., et al. (2019). Manure acts as a better fertilizer for increasing crop yields than synthetic fertilizer does by improving soil fertility. Soil Tillage Res. 189, 168–175. doi: 10.1016/j.still.2018.12.022
Campbell, C. A., and Zentner, R. P. (1993). Soil organic matter as influenced by crop rotations and fertilization. Soil Sci. Soc. Am. J. 57, 1034–1040. doi: 10.2136/sssaj1993.03615995005700040026x
Cela, S., Ketterings, Q. M., Czymmek, K., Soberon, M., and Rasmussen, C. (2015). Long-term trends of nitrogen and phosphorus mass balances on New York state dairy farms. J. Dairy Sci. 98, 7052–7070. doi: 10.3168/jds.2015-9776
Cornell, NMSP. (2023). Whole-farm nutrient mass balance and carbon footprint assessment project. Available at: http://nmsp.cals.cornell.edu/NYOnFarmResearchPartnership/MassBalances.html
Eagle, A. J., McLellan, E. L., Brawner, E. M., Chantigny, M. H., Davidson, E. A., Dickey, J. B., et al. (2020). Quantifying on-farm nitrous oxide emission reductions in food supply chains. Earth’s Future 8. doi: 10.1029/2020EF001504
Galloway, J. N., Aber, J. D., Erisman, J. W., Seitzinger, S. P., Howarth, R. W., Cowling, E. B., et al. (2003). The nitrogen Cascade. Bioscience 53:341. doi: 10.1641/0006-3568(2003)053[0341:TNC]2.0.CO;2
Godber, O. F., Workman, K., Reed, K., and Ketterings, Q. M. (2024). New York state, regional and county level nitrogen and phosphorus balances for harvested cropland. Front. Sustain. Sec. Circular Economy 5. doi: 10.3389/frsus.2024.1352296
Grassini, P., and Cassman, K. G. (2012). High-yield maize with large net energy yield and small global warming intensity. Proc. Natl. Acad. Sci. USA 109, 1074–1079. doi: 10.1073/pnas.1116364109
Hanrahan, B. R., King, K. W., Williams, M. R., Duncan, E. W., Pease, L. A., and LaBarge, G. A. (2019). Nutrient balances influence hydrologic losses of nitrogen and phosphorus across agricultural fields in northwestern Ohio. Nutr. Cycl. Agroecosyst. 113, 231–245. doi: 10.1007/s10705-019-09981-4
Ketterings, Q. M., and Workman, K. (2023). Nitrogen guidelines for field crops in New York. Ithaca, NY: Cornell University.
Ketterings, Q. M., Workman, K., Gates, D., Hornesky, J., Latessa, S., Bush, R., et al. (2023). Adaptive nitrogen Management for Field Crops in New York. Ithaca NY: Cornell University.
Khanal, S., Anex, R. P., Gelder, B. K., and Wolter, C. (2014). Nitrogen balance in Iowa and the implications of corn-Stover harvesting. Agric. Ecosyst. Environ. 183, 21–30. doi: 10.1016/j.agee.2013.10.013
Kharel, T., Swink, S., Youngerman, C., Maresma, A., Czymmek, K., Ketterings, Q., et al. (2018). Processing/cleaning corn silage and grain yield monitor data for standardized yield maps across farms, fields, and years : Cornell University, Nutrient Management Spear Program, Department of Animal Science. Available at: http://nmsp.cals.cornell.edu/publications/extension/ProtocolYieldMonitorDataProcessing1_15_2020.pdf (Accessed July 26, 2024).
Kuznetsova, A., Brockhoff, P. B., Bojesen Christensen, R. H., and Jensen, S. P. (2020). Package “lmerTest”: tests in linear mixed effects models. Available at: https://cran.r-project.org/web/packages/lmerTest/lmerTest.pdf
Lassaletta, L., Billen, G., Garnier, J., Bouwman, L., Velazquez, E., Mueller, N. D., et al. (2016). Nitrogen use in the global food system: past trends and future trajectories of agronomic performance, pollution, trade, and dietary demand. Environ. Res. Lett. 11:095007. doi: 10.1088/1748-9326/11/9/095007
Lassaletta, L., Billen, G., Grizzetti, B., Anglade, J., and Garnier, J. (2014). 50 year trends in nitrogen use efficiency of world cropping systems: the relationship between yield and nitrogen input to cropland. Environ. Res. Lett. 9:105011. doi: 10.1088/1748-9326/9/10/105011
Lawrence, J., Kerwin, A., Overton, T., Darby, H., Smith, M., Amburgh, M. V., et al. (2021). New York and Vermont corn silage hybrid evaluation program. College of Agriculture and Life Sciences, Cornell University.
Lawrence, J., Kerwin, A., Overton, T., Darby, H., Smith, M., Amburgh, M. V., et al., (2022). New York and Vermont corn silage hybrid evaluation program. College of Agriculture and Life Sciences, Cornell University.
Lawrence, J., Kerwin, A., Overton, T., Darby, H., Smith, M., Amburgh, M. V., et al. (2023). New York and Vermont corn silage hybrid evaluation program. College of Agriculture and Life Sciences, Cornell University.
Lawrence, J., Ketterings, Q., and Cherney, J. (2008). Effect of nitrogen application on yield and quality of silage corn after forage legume-grass. Agron. J. 100, 73–79. doi: 10.2134/agronj2007.0071
Lenth, R., Bolker, B., Buerkner, P., Gine-Vazquez, I., Herve, M., Jung, M., et al. (2023). Package “emmeans”: estimated marginal means, aka least-squares means. Available at: https://cran.r-project.org/web/packages/emmeans/index.html
Maaz, T. M., Sapkota, T. B., Eagle, A. J., Kantar, M. B., Bruulsema, T. W., and Majumdar, K. (2021). Meta-analysis of yield and nitrous oxide outcomes for nitrogen management in agriculture. Glob. Chang. Biol. 27, 2343–2360. doi: 10.1111/gcb.15588
Martin, N. P., Russelle, M. P., Powell, J. M., Sniffen, C. J., Smith, S. I., Tricarico, J. M., et al. (2017). Invited review: sustainable forage and grain crop production for the US dairy industry. J. Dairy Sci. 100, 9479–9494. doi: 10.3168/jds.2017-13080
McLellan, E. L., Cassman, K. G., Eagle, A. J., Woodbury, P. B., Sela, S., Tonitto, C., et al. (2018). The nitrogen balancing act: tracking the environmental performance of food production. Bioscience 68, 194–203. doi: 10.1093/biosci/bix164
Nakagawa, S., Johnson, P. C. D., and Schielzeth, H. (2017). The coefficient of determination R2 and intra-class correlation coefficient from generalized linear mixed-effects models revisited and expanded. J. R. Soc. Interface. 1420170213. doi: 10.1098/rsif.2017.0213
Nakagawa, S., and Schielzeth, H. (2013). A general and simple method for obtaining R2 from generalized linear mixed-effects models. Methods Ecol. Evol. 4, 133–142. doi: 10.1111/j.2041-210x.2012.00261.x
Northeast Regional Climate Center (2024). Northeast Regional Climate Center CLIMOD 2 weather station data. Available at: https://www.nrcc.cornell.edu/ (Accessed June 8, 2024)
Oenema, O., Kros, H., and De Vries, W. (2003). Approaches and uncertainties in nutrient budgets: implications for nutrient management and environmental policies. Eur. J. Agron. 20, 3–16. doi: 10.1016/S1161-0301(03)00067-4
Pearce, A., and Maguire, R. (2020). The state of phosphorus balance on 58 Virginia dairy farms. J. Environ. Qual. 49, 324–334. doi: 10.1002/jeq2.20054
Powell, J. M., Barros, T., Danes, M., Aguerre, M., Wattiaux, M., and Reed, K. (2017). Nitrogen use efficiencies to grow, feed, and recycle manure from the major diet components fed to dairy cows in the USA. Agric. Ecosyst. Environ. 239, 274–282. doi: 10.1016/j.agee.2017.01.023
Powell, J. M., and Rotz, C. A. (2015). Measures of nitrogen use efficiency and nitrogen loss from dairy production systems. J. Environ. Qual. 44, 336–344. doi: 10.2134/jeq2014.07.0299
R Core Team. (2021). R: a language and environment for statistical computing. [computer software]. R foundation for statistical computing. Vienna, Austria. Available at: https://www.R-project.org/
Ramos Tanchez, J. C., Workman, K., Wilder, A., Degni, J., and Ketterings, Q. (2023). Manure can offset nitrogen fertilizer needs and increase corn silage yield—value of manure project 2022 update. Available at: https://blogs.cornell.edu/whatscroppingup/2023/02/
Ribaudo, M., Hansen, L. R., Livingston, M. J., Mosheim, R., Williamson, J., and Delgado, J. (2011). Nitrogen in agricultural systems: implications for conservation policy (ERR-127). Soc. Sci. Electron. doi: 10.2139/ssrn.2115532
Ros, M. B. H., Godber, O. F., Olivo, A. J., Reed, K. F., and Ketterings, Q. M. (2023). Key nitrogen and phosphorus performance indicators derived from farm-gate mass balances on dairies. J. Dairy Sci. 106, 3268–3286. doi: 10.3168/jds.2022-22297
Sadeghpour, A., Ketterings, Q. M., Godwin, G. S., and Czymmek, K. J. (2017). Under‐ or over‐application of nitrogen impact corn yield, quality, soil, and environment. Agron. J. 109, 343–353. doi: 10.2134/agronj2016.06.0355
Sela, S., Woodbury, P. B., Marjerison, R., and van Es, H. M. (2019). Towards applying N balance as a sustainability indicator for the US Corn Belt: realistic achievable targets, spatio-temporal variability and policy implications. Environ. Res. Lett. 14:064015. doi: 10.1088/1748-9326/ab1219
Sela, S., Woodbury, P., and Van Es, H. (2018). Dynamic model-based N management reduces surplus nitrogen and improves the environmental performance of corn production. Environ. Res. Lett. 13:054010. doi: 10.1088/1748-9326/aab908
Sharara, M., Kolesch, R. K., Cortus, E. L., Larson, R. A., Classen, J. J., and Janni, K. A. (2022). Addressing nutrient imbalances in animal agriculture systems. J. ASABE 65, 235–249. doi: 10.13031/ja.14661
Swink, S. N., Ketterings, Q. M., Chase, L. E., Czymmek, K. J., and Amburgh, M. E. V. (2011). Nitrogen balances for New York state. Implic. Manure Fertilizer Manag. 66, 1–17. doi: 10.2489/jswc.66.1.1
Tamagno, S., Eagle, A. J., McLellan, E. L., van Kessel, C., Linquist, B. A., Ladha, J. K., et al. (2022). Quantifying N leaching losses as a function of N balance: a path to sustainable food supply chains. Agric. Ecosyst. Environ. 324:107714. doi: 10.1016/j.agee.2021.107714
Tenorio, F. A. M., McLellan, E. L., Eagle, A. J., Cassman, K. G., Andersen, D., Krausnick, M., et al. (2020). Benchmarking impact of nitrogen inputs on grain yield and environmental performance of producer fields in the western US Corn Belt. Agric. Ecosyst. Environ. 294:106865. doi: 10.1016/j.agee.2020.106865
Tenorio, F. A. M., McLellan, E. L., Eagle, A. J., Cassman, K. G., Krausnick, M., Thorburn, J., et al. (2021). Luck versus skill: is nitrogen balance in irrigated maize fields driven by persistent or random factors? Environ. Sci. Technol. 55, 749–756. doi: 10.1021/acs.est.0c05655
USDA. (2023). USDA-NASS QuickStats. Available at: https://quickstats.nass.usda.gov/
Van Leeuwen, M. M. W. J., Van Middelaar, C. E., Oenema, J., Van Dam, J. C., Stoorvogel, J. J., Stoof, C. R., et al. (2019). The relevance of spatial scales in nutrient balances on dairy farms. Agric. Ecosyst. Environ. 269, 125–139. doi: 10.1016/j.agee.2018.09.026
Yost, M. A., Coulter, J. A., Russelle, M. P., and Davenport, M. A. (2014b). Opportunities exist to improve alfalfa and manure nitrogen crediting in corn following alfalfa. Agron. J. 106, 2098–2106. doi: 10.2134/agronj14.0212
Yost, M. A., Russelle, M. P., and Coulter, J. A. (2014a). Field-specific fertilizer nitrogen requirements for first-year corn following alfalfa. Agron. J. 106, 645–658. doi: 10.2134/agronj2013.0416
Zhang, X., Davidson, E. A., Mauzerall, D. L., Searchinger, T. D., Dumas, P., and Shen, Y. (2015). Managing nitrogen for sustainable development. Nature 528, 51–59. doi: 10.1038/nature15743
Zhang, C., Ju, X., Powlson, D., Oenema, O., and Smith, P. (2019). Nitrogen surplus benchmarks for controlling N pollution in the Main cropping Systems of China. Environ. Sci. Technol. 53, 6678–6687. doi: 10.1021/acs.est.8b06383
Keywords: field balance, dairy, New York, nutrient budget, manure conceptualization, formal analysis, investigation, methodology
Citation: Olivo AJ, Workman K and Ketterings QM (2024) Enhancing nitrogen management in corn silage: insights from field-level nutrient use indicators. Front. Sustain. Food Syst. 8:1385745. doi: 10.3389/fsufs.2024.1385745
Edited by:
Amir Sadeghpour, Southern Illinois University Carbondale, United StatesReviewed by:
Heather Karsten, The Pennsylvania State University (PSU), United StatesCurtis Dell, United States Department of Agriculture, United States
Resham Thapa, Tennessee State University, United States
Copyright © 2024 Olivo, Workman and Ketterings. This is an open-access article distributed under the terms of the Creative Commons Attribution License (CC BY). The use, distribution or reproduction in other forums is permitted, provided the original author(s) and the copyright owner(s) are credited and that the original publication in this journal is cited, in accordance with accepted academic practice. No use, distribution or reproduction is permitted which does not comply with these terms.
*Correspondence: Quirine M. Ketterings, cW1rMkBjb3JuZWxsLmVkdQ==