 Weikun Zhang
 Zheng Li
 Shoaib Ahmed Wagan3,4
- 1School of Public and Social & Administration, Lingnan Normal University, Zhanjiang, China
- 2Innovation and Entrepreneurship Center, Applied Technology College of Soochow University, Suzhou, China
- 3Faculty of Social Sciences, ISRA University, Sindh, Pakistan
- 4School of Economics and Management, South China Agriculture University, Guangzhou, China
- 5Business School, Lingnan Normal University, Zhanjiang, China
Introduction: The primary function and spatial layout of agriculture are essential foundations and prerequisites for achieving green development. This paper explores the growth drivers for the green transformation of agricultural production in Guangdong, China, aiming to guide the continuous green and low-carbon development of agricultural productivity in Guangdong.
Methods: Based on the panel data of 21 prefecture-level cities in Guangdong, China, from 2004 to 2022, this paper uses DEA-BCC and DEA-Malmquist to measure the agricultural green total factor productivity (AGTFP) and its decomposition efficiency in Guangdong China. The SDM is employed to analyze its spatial spillover roles of the agricultural industrial structure (AIS) innovation.
Results: The results show that the AGTFP varies with an overall fluctuating upward trend, but the imbalance of regional differences still exists, characterized as “Pearl River Delta > Eastern Wing > Western Wing > Mountainous Area,” indicating the siphoning role from Pearl River Delta. There is a strong spatial correlation between the AGTFP and the AIS.
Discussion: Our evidence suggests that the AIS innovation improves the AGTFP and can have positive spatial consequences in neighboring areas. Besides, human capital hinders AGTFP, accounting for the self-exploitation in agricultural production driven by the excessive labor force input. Our findings highlight the spatial impact of the AIS innovation on the AGTFP when greening agricultural production.
1 Introduction
Agriculture has experienced a glorious development process in developing countries like China and has remarkable historical achievements. In China, not only has it fed nearly 20% of the world’s population with less than 9% of the world’s arable land, but it has also realized the green transformation from traditional agriculture dominated by crop cultivation to modern agriculture with comprehensive development of agriculture, forestry, animal husbandry, and fishery. The central contradiction of agriculture has changed from insufficient total output to structural contradiction, and agricultural development has shifted from increasing production to improving quality (Yan, 2019). While earning outstanding achievements, problems such as land occupation, external and internal pollution, water shortage, and so on cannot be ignored and gradually become factors restricting the sustainable development of China’s agricultural economy that land abandonment, rural hollowing out, and aging of the agricultural labor force is becoming increasingly prominent. Out of the severity of the high level of fertilizer and pesticide application, the overall situation of performing in an environment-friendly way in agricultural production is pessimistic, as most farmers have not adopted green technology in the cultivation process.
The “Opinions on Innovating System and Mechanism to Promote Green Development of Agriculture” is the first document of the CPC Central Committee on Green Development of Agriculture, which proposes for the first time the system of agricultural primary function and spatial layout, agricultural productivity layout, agricultural industrial structure (AIS), agricultural industry establishment of resource and environmental protection and utilization management and control, and agricultural green circular low-carbon production (Wang et al., 2023). Zhang and Li (2022) pointed out that agriculture’s primary function and spatial layout are essential foundations and prerequisites for achieving green development. The high-tech information industry becomes the core technological force of economic growth, absorbs comprehensive talents, vigorously strengthens talent team building, increases people’s income and productivity, and provides help and support for the rational transformation of industrial development. In China’s AIS, creating a modern agricultural industrial technology innovation mode is the basic idea and best means to drive the transformation and development of the AIS (Jakku et al., 2022).
An essential controversial debate on the role of the AIS is how to effectively promote agriculture-economic growth with less input of fertilizers and pesticides and less undesired carbon emission output, which has always been the focus. Adopting technology from the AIS innovation improves agriculture efficiency through the innovation of technology and management, as well as urbanization and financial help, which positively affects long-term prospects (Ahmad et al., 2023). Whether clean or non-clean, technology has been seen as a valuable means with different significances. In contrast to non-clean technology, clean one is the primary factor responsible for reducing agricultural carbon emissions and improving agriculture efficiency following the environment-friendly benefits in the operation process (Awosusi et al., 2022). The achievements in the growth of agricultural green production are derived from the grain industrial agglomeration and the human capital via knowledge transfer (Gu et al., 2024; Wang and Long, 2024). In terms of the lifecycle of the agricultural production process, the promotion effect is weak in the early stage, slowly in the growth stage, and declining after the maturity stage (Wang F. et al., 2022).
Conversely, the negative externalities of the AIS have received relative research attention concerning resource loss (Wang F. et al., 2022; Wang J. et al., 2024). For instance, the technology adoption following the AIS produces resource usage consumption and increases the carbon emission from agricultural cultivation, thus resulting in a rebound effect (Wang Y. et al., 2022). Although the debate has highlighted the “green paradox” by the AIS, an emerging line of research has begun to assess the change and regional features of agriculture production efficiency and its spatial driver determinants.
As shown in the following, prior research exploring agricultural production efficiency has generally focused on the calculation method, index framework, and functional factors. Firstly, data envelopment analysis (DEA) is the most widely used method regarding the agricultural production efficiency evaluation method. For example, Yang (2021) analyzed the spatio-temporal evolution trend of water resource utilization efficiency in grain production in China based on the Malmquist index model; Cheng et al. (2022) measured the grain production efficiency in Shaanxi Province based on the DEA-BCC model; Chen et al. (2022) evaluated China’s agricultural production efficiency by using a gray correlation degree. Secondly, the evaluation index system is constructed from the perspective of agricultural input–output, with different viewpoints. Regarding input index selection, crop sown area, total agricultural machinery power, fertilizer application amount, irrigation area, and agricultural workers are included. Besides, output indexes commonly used include grain total output representing social benefits, total agricultural output value representing economic benefits, and carbon emission representing environmental benefits. Thirdly, the research on the factors affecting agricultural production efficiency mainly focuses on external factors. For example, Yang and Li (2022) analyzed the impact of agricultural socialized service connotation characteristics and related policy evolution on agricultural production efficiency improvement and agricultural reform development; Liu et al. (2019) examined the effect of farmland transfer on technical efficiency in grain production. (4) Research object of agricultural production efficiency.
The existing research perspectives are diverse and rich in content, but some shortcomings have not been addressed. First, the widely used DEA-BCC model can only distinguish between effective and ineffective DMUs and cannot further measure the efficiency value of effective DMUs. Second, the research scope is concentrated on the macro and meso levels, and there is insufficient analysis of the efficiency differences of prefecture-level cities within the province, which weakens the practical guidance significance of the research results; finally, the research on the factors affecting agricultural production efficiency mainly focuses on external factors, and there is a lack of research on internal factors. This paper employed prefecture-level cities in Guangdong, China, as the research object and used DEA-Malmquist to analyze the redundancy situation of agricultural production factors and the internal differences in agricultural production efficiency based on the DEA-BCC model. Thirdly, in terms of identifying the spatial structure effect, the Spatial Durbin Model was used to analyze the internal factors affecting agricultural production efficiency to provide practical guidance for improving the green transformation of agricultural production in Guangdong, China.
There are more macro-level studies on the national and provincial levels and less analysis on the efficiency differences of prefecture-level cities within the province, which weakens the practical guidance significance of the research results. Our study fills this gap based on our knowledge of Guangdong, China, where AIS innovation was created to allocate agricultural resources. Unlike most studies that compare agricultural TFP among 31 provinces in China, the 21 prefecture-level cities in Guangdong were assessed as the research object with the measurement of the agricultural production efficiency of each city more objectively. Beyond the previous studies that used a single method to calculate agricultural production efficiency and inspected the relationships among various research topics, both DEA-BCC and DEA-Malmquist were used to jointly analyze the agricultural production efficiency of Guangdong and evaluate the efficiency of each city as well as the progress regulation space and angle. The most notable difference between the prior works exploring agriculture production and the prior works exploring agriculture production is that spatial geographic factors were considered for analyzing the possible spatial correlation and spillover effects of agricultural production efficiency among cities in Guangdong using the spatial Durbin Model.
The rest of this paper is constructed into four aspects. Section 2 is the literature review. Next is the theory model. The following is the empirical method and data source. The results and discussions are reflected in Sections 5 and 6. Section 7 provides the conclusions, recommendations, and limitations.
2 Literature review
There is wide attention on agricultural productivity focused by scholars, including the characteristics of agriculture production, the involvement of agricultural input and output, the economic growth of the agricultural sector, and the measurement of agricultural productivity or its determinant (Qiao et al., 2019; Chen et al., 2020; Chen Y. et al., 2021; Praveen et al., 2022). According to the endogenous growth theory, which takes total factor productivity (TFP) or green total factor productivity (GTFP) as the backbone of agriculture-economic growth (Alzeban, 2018), agricultural productivity is characterized by TFP or GTFP. The former measurement omits more environment-related elements in the production, which cannot identify the undesirable output. In contrast to TFP, GTFP can accurately reflect the green transformation of agricultural production.
Agricultural GTFP (AGTFP) can generally be understood as agricultural TFP calculated by adding environmental factors, where environmental factors are mainly undesirable outputs, such as agricultural non-point source pollution or agricultural carbon emission (Wang H. et al., 2022; Xu et al., 2022; Wang et al., 2023). Huang and Rozelle (2018) found that China’s agricultural TFP grew 5.3 percent from 1978 to 2017. Fuglie and Rada (2018) found that agricultural TFP accounts for 61.4 percent of agricultural economic output based on the estimation of provincial data from 1978 to 2013 in China. For China, the data assessment from 1978 to 2016 shows that agricultural production slowed after 2009, suggesting emerging challenges exist (Sheng et al., 2019). Chen Y. et al. (2021) suggested that slower AGTFP is due to the superior external environment’s restriction of poor management efficiency. Along with this, governance management involves the process of agricultural operations in China.
As environmental degradation can threaten agricultural production, numerous studies have shown that governance management can decrease resource use efficiency (Ma et al., 2023; Zhang et al., 2023). Due to the constraints of agricultural methane emission, despite the benefit for agricultural efficiency from fertilizer use and farm machinery, effective management and agri-policy can be implemented (Praveen et al., 2022; Hamid et al., 2023), which is an essential factor (Xie and Huang, 2021). Although agricultural governance management has risen as a national strategy, the specific practice has not achieved the expected results. The reason for this is that the rural living environment is relatively closed, and the cultural quality of farmers is not high, which leads to limited access to information and understanding of farmers and insufficient knowledge of environmental regulatory policies and green production technology (Li et al., 2020). And the “acquaintance society” naturally forms social connections. The interaction between farmers creates a relatively stable social system. It provides the action function of “herd (imitation) effect” and “mutual protection,” which avoids the external supervision and accountability of environmental pollution to a large extent and then adopts the extensive production mode, curbing the performance of the environment-friendly way in rural areas (Zheng and Luo, 2022; Zhang et al., 2023).
The research on greening agricultural production related to the AIS can be rooted in two-strand literature. One is the technological advancement that performs the roles to achieve a leap forward for agriculture operations (Xiao et al., 2022; Baig et al., 2024). Evidence from wheat production in India shows that technological factors, especially technological innovation, dominate agricultural production and can mitigate the adverse effects of climate change (Baig et al., 2020, 2023). The argument that technological innovation positively impacts AGTFP using provincial data in China has also been verified (Liu D. et al., 2023). Another is the industrial structure that generates the “Green Paradox” (Wang X. et al., 2022). For instance, the industrial structure performs the catalytic effect on the AGTFP yet decreases agricultural efficiency through the increase in energy consumption (Wang X. et al., 2022). When the industrial structure reaches the maturity stage, agricultural efficiency will exist (Wang X. et al., 2022). In general, most studies emphasize the driver determinants of AGTFP, such as governance management, technological innovation, and industrial structure, yet the analysis on the linkage between the AIS and the AGTFP.
As this brief review indicates, the studies highlight the change for the AGTFP and the need to transform from extensive to intensive. There is a lack of attention on the consideration of East China, such as Guangdong, given the role of the AIS despite the achievement of green production from industrial structure regulation. Due to the spatial heterogeneity in regional areas, the change for the AGTFP in Guangdong China is not equaled to that in the provincial dimension across China. Respectively, the spatial effect of the AIS on the AGTFP has received limited attention in previous studies (Wang F. et al., 2022; Liu D. et al., 2023). Hence, there is room for improving the accuracy of identifying the role of the AIS. Our study revisited the regional change of the AGTFP and the spatial effect of the AIS using the prefecture-level city data in Guangdong, China, with the Malmquist-DEA method and the Spatial Durbin Model, thus providing the practices on greening the agricultural production and shapes the structure dimension of the change of the agriculture efficiency.
3 Theory model
The two-sector growth model was built considering the urban and rural sectors, meeting the Cobb–Douglas production functions. If time is uninterrupted and , the households’ preferences with the consumption of agricultural goods, , and non-agriculture ones, are reflected as , where with the rate of the preference , the weight of agricultural goods , and the subsistence of ones . Considering the production meets Cobb–Douglas technology, no matter whether urban sector or rural one, the sectorial function can be denoted in Equations (1–3):
where and are the depreciation rate and the growth rate of labor; the capital share and its ratio are accessed; is the employment share, .
Consider the choice made by policymakers based on the sequences , given and , the Equation 4 imply:
Assess the allocation between the consumption and capital ratio for the urban sector meets the standard Euler equation:
The normalization of non-agriculture goods consumption and the assessment of capital ratio is and . The AIS in the urban sector is exogenous compared to that in rural area, . Let , then we get the Equation 6:
In the steady state, the Equation 5 is that:
So, the rural employment share is that:
Combined with Equations 7, 8, due to , the growth rate of agricultural production increases at a level when the AIS is innovated. When the clean technology by the AIS is adopted, increases, which determines the green transformation of agricultural production. It is mentioned that AIS leads to different sub-sectors within the industry, drastic changes in product structure among enterprises, and changes in the input structure of production factors (Alhassan, 2021; Liu et al., 2021; Tillaguango et al., 2021; Qin et al., 2022). In the process of AIS innovation, especially in structural upgrading, sectors or products with high added value and high technology intensity will occupy a favorable position, driving the technological progress of other sub-industries and improving agricultural efficiency.
4 Empirical method and data source
To estimate the agricultural efficiency, the input on capital and labor can be reflected and . With the above construction, the places are more significant on the change of the AIS. Agricultural efficiency is characterized by the AGTFP using the DEA Model following the Solow residual approach (Solow, 1957). A few studies calculated the change in agricultural technology and ATFP using the stochastic frontier approach (SFA) as a parametric method (Wang Q. et al., 2012; Zhang, 2021). Compared with the SFA, the DEA does not set a production function as is suitable for the multi-input and –output, a nonparametric method, modeling the production frontier for the productivity efficiency referring to the Malmquist index by Chung and Fare (1997) with the consideration for the undesirable output such carbon emission (Zhang, 2021).
4.1 Agricultural total factor productivity estimation model
A Malmquist index is an indicator based on the input–output relationship, which uses panel data to calculate total factor productivity change ( ), technological change ( ), pure technical efficiency change ( ), and scale efficiency change ( ) (Li et al., 2015). Combined with DEA, it is widely used to evaluate industrial and agricultural production productivity changes. Assuming that is the input and output in period t, and is the input and output in period t + 1, the change of input–output from period t to period t + 1 is the total factor productivity change ( ); the ratio of two different distances between the decision making unit (DMU) production frontier and the actual output is the Malmquist index, which is also the total factor productivity change ( ). When the scale returns are constant, the Malmquist index of real factor productivity change ( ) can be expressed as:
If the Malmquist index is greater than 1, the improvement in total factor productivity is evident. If the index is less than 1, the deterioration of total factor productivity emerges; if the index is equal to 1, total factor productivity remains unchanged. To illustrate the contribution of technical efficiency change and technological change to total factor productivity, Equation 9 can be decomposed as follows:
The first term in Equation 10 is the technical efficiency change, and the second is the technological change. When the scale returns are variable, the total factor productivity change ( ) also has the contribution of scale economy, and the Malmquist index further develops as follows:
The first and second terms in Equation 11 are the decomposition of the first term in Equation 10, which shows that when the scale returns are variable, the change in technical efficiency is caused by the joint effect of pure technological efficiency change ( ) and scale efficiency change ( ), which can be called comprehensive efficiency change ( ). Therefore, total factor productivity change ( ) can be decomposed into pure technical efficiency change ( ), scale efficiency change ( ), and technological change ( ), expressed by the formula as denoted in the Equation 12:
The Malmquist index in the DEA method is a crucial method widely used in the nonparametric DEA method to measure total factor productivity. Therefore, this paper mainly uses DEA-Malmquist to measure the utilization efficiency of an agricultural green total factor in Guangdong Province.
4.2 Spatial Durbin Model
Based on the measurement of the AGTFP of each city in Guangdong, China, this paper selects the innovation of AIS in Guangdong Province as the explanatory variable and studies the impact of the AIS innovation in Guangdong China on the AGTFP in the province. The econometric equation is as denoted in the Equation 13:
where the is the agricultural production efficiency, the agricultural industrial structure change, the control variable; , , and are the parameters to be estimated, and the residual term of the OLS model.
The spatial commonality of adjacent regions is greater than that of distant areas, and there are spatial interactions and spillover effects. The correlation coefficient between the error term and the explanatory variable of the OLS model is not equal to 0, which will cause bias in the OLS regression coefficient. The spatial weight is added to the econometric model to correct the classical regression model, and the model expression is as denoted in the Equation 14:
where is the spatial distance standardized weight matrix, the unit matrix, the standard deviation of the residual, the dimension of the spatial matrix, and the parameter the spatial lag coefficient. The is the transpose matrix of the spatial distance standardized weight matrix, the transpose matrix of the column matrix of the observed values of AGTFP of prefecture-level cities, and the parameter estimated by the Equation 15:
The function is constructed by using the maximum likelihood estimation method as presented in the Equation 16:
Where is the transpose matrix of , and the estimate of the independent variable can be obtained by finding the maximum value of the function. The Spatial Lag Model (SLM) and the Spatial Error Model (SEM) can eliminate the spatial interaction. However, the SLM and SEM may exist simultaneously in the regression model, affecting the estimation of the relevant parameters of the regression model. The Spatial Durbin Model (SDM) is constructed to test the spatial spillover effect of AIS innovation on AGTFP of prefecture-level cities. The model is as presented in Equations 17 and 18:
where , , and are the parameters to be estimated; and the residual term following a standard normal distribution. The model evolves spatial fixed effects and time fixed effects ; subscript denotes the prefecture-level administrative region, subscript denotes the prefecture-level administrative area, and subscript t represents the year. By decomposing the estimation results of AIS innovation on AGTFP of prefecture-level cities into direct effect, indirect effect, and total effect, they are, respectively, , , and .
4.3 Variable
This paper takes 2004–2022 as the research period, and the data are from the Guangdong Rural Statistical Yearbook (2005–2023), Guangdong Statistical Yearbook (2005–2023), China City Statistical Yearbook (2005–2023), and Statistical Yearbooks of various cities in Guangdong Province (2005–2023). The data from multiple statistical yearbooks are matched and merged by city name, and the samples with more missing indicator values are deleted. Some missing data are supplemented by the linear interpolation method, and panel data of 21 cities in Guangdong Province from 2004 to 2022 are obtained.
Dependent variable: AGTFP. Based on the research of Praveen et al. (2022) and Baig et al. (2024), environmental pollution, energy consumption, cultivated land area, and total water consumption are evolved in the total factor productivity accounting framework system, and the DEA-Malmquist productivity index method in data envelopment analysis is used to measure the AGTFP index in Guangdong Province. In this paper, the total factor productivity is calculated by cumulative value. First, the total factor productivity value in 2002 is set at 1, then used as the benchmark value. Each year’s total factor productivity values are multiplied by the Malmquist index value of the previous year and then converted into cumulative values as empirical data, which is also the common practice of existing literature (Wang Y. et al., 2022).
The selection of input and output indicators is defined as follows: (1) Input variables: taking agriculture as the research object, seven input indicators are selected: agricultural machinery, land, fertilizer, irrigation, labor force, pesticide, and agricultural film. Among them, the agricultural machinery indicator is the total power of agricultural machinery, and the unit is ten thousand kilowatts; the land indicator is cultivated land area, the unit is a thousand hectares; the fertilizer indicator is annual fertilizer application amount (pure amount), the unit is ten thousand tons; irrigation indicator is annual actual effective irrigation area, the unit is a thousand hectares; labor force indicator is agricultural workers, considering that official statistical data do not provide agricultural labor force data, according to the common practice in academia, it is represented by multiplying the number of workers in agriculture, forestry, animal husbandry, and fishery by the proportion of agricultural output value in agriculture, forestry, animal husbandry, and fishery, the unit is ten thousand people; pesticide indicator is pesticide consumption, unit is ton; agricultural film indicator is agricultural film consumption, unit is ton. Considering the data availability and the decreasing role of draft animals, the input indicators do not include draft animals’ input. (2) Output variables: including expected output and unexpected output. The expected output variable is the total agricultural output value, and the unit is $13.79 million. As carbon emission represents the output of agricultural cultivation on the environment (Gu et al., 2024), the unexpected output is measured by agricultural carbon emission in units of ten thousand tons. Agricultural carbon emission sources are diversified and complex. The carbon emission directly generated by six categories of fertilizer, pesticide, agricultural film, agricultural irrigation, agricultural tillage, and diesel in the agricultural production process is mainly calculated.
The core explanatory variable is the proportion of the primary industry GDP structure (ind). The AIS is explained from the perspectives of rationalization and advancement. The former claims the resource allocations of various sectors in the agricultural industry chain, and the latter focuses on the structure transformation of the agricultural sector (Wang F. et al., 2022). When selecting the indicators of AIS innovation, this paper considers that the agricultural carbon emissions measured in this paper mainly come from the planting industry, and the scope of labor input and output statistics is the primary industry, so it chooses the output structure of the primary sector as the explained variable, that is, it selects the output of the primary sector and its proportion in the total production of the three industries.
The studies on the determinants of the AGTFP have found that natural resource endowment, government industrial policy, agricultural technology diffusion, and spillover are vital factors (Polyzos et al., 2007; Han et al., 2018; Wang X. et al., 2022). Referring to a large number of literature studies (Shao et al., 2023), this paper selects the control variables according to their methods and combines them with the research content of this paper. The control variables we focused on are government intervention, economic development, information level, education, regional openness, scientific technology, and human capital. The reason for the chosen government intervention is that the Chinese government emphasizes the decisive role of the market in resource allocation, and the objective existence of local government “GDP competition” will inevitably impact economic growth. Hence, the proportion of government fiscal expenditure to GDP is selected to denote government intervention ( ) in the economy. Regarding economic development ( ), each prefecture-level city’s real per capita GDP is selected. In response to the information that promotes the exchange between industries, the per capita postal and telecommunication volume is used to measure the information level ( ) of each prefecture-level city’s administrative region. Out of the prefecture-level city’s culture, education ( ), regional openness ( ), scientific technology ( ), and human capital ( ) are the significant factors affecting the production (Gu et al., 2024). Fiscal input and expenditure on education were selected. The regional openness is characterized by foreign capital that year and scientific technology by fiscal spending on scientific and technological innovation. Additionally, the proportion of employed persons in the primary industry and the total number of employed persons in three sectors is selected as the indicator of human capital.
5 Results
5.1 Analysis of AGTFP in Guangdong, China
The AGTFP of each city in Guangdong Province from 2004 to 2022 was calculated as shown in Figure 1. The AGTFP of Guangdong Province from 2004 to 2022 showed a wave-like superimposed trend. The lowest productivity in the measured period was 0.952 in 2008–2009, followed by three consecutive years of rising from 2009 to 2012, reaching the second highest point of 1.159. After that, it has been showing a “decrease–increase-decline-slow” state, and it was 1.077 in 2022, slightly improved compared with 1.021 in 2003. The AGTFP has varied at an approximate rate of 2 percent a year since 2012. The average AGTFP of 1.064 is lower than that of 1.165 measured by Peng et al. (2020), which may be mainly due to the large outflow of agricultural workers and the reduced cultivated area (Table 1).
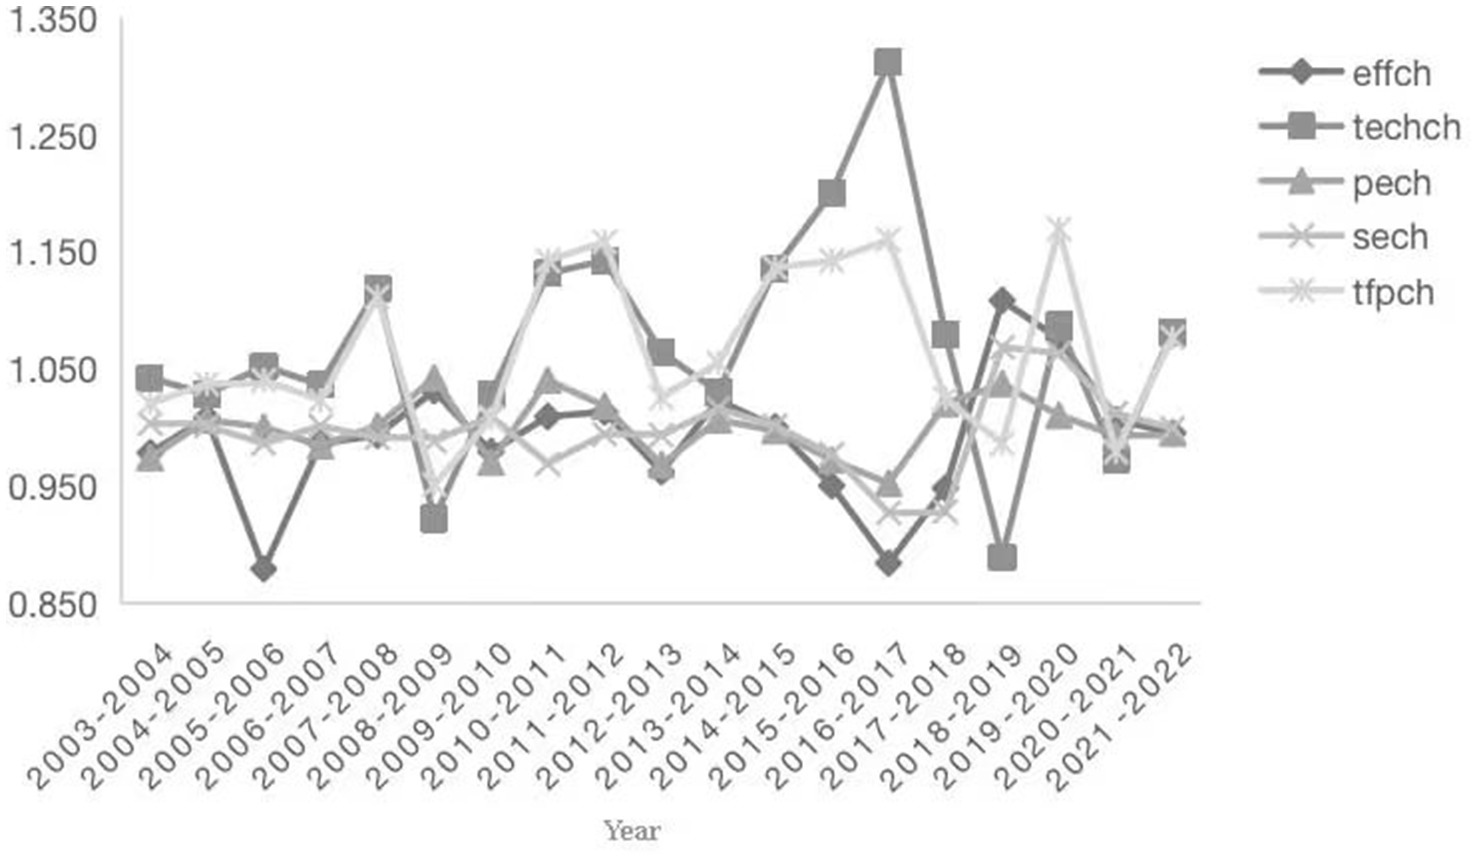
Figure 1. Changes in the AGTFP in various cities of Guangdong, China, from 2004 to 2022.
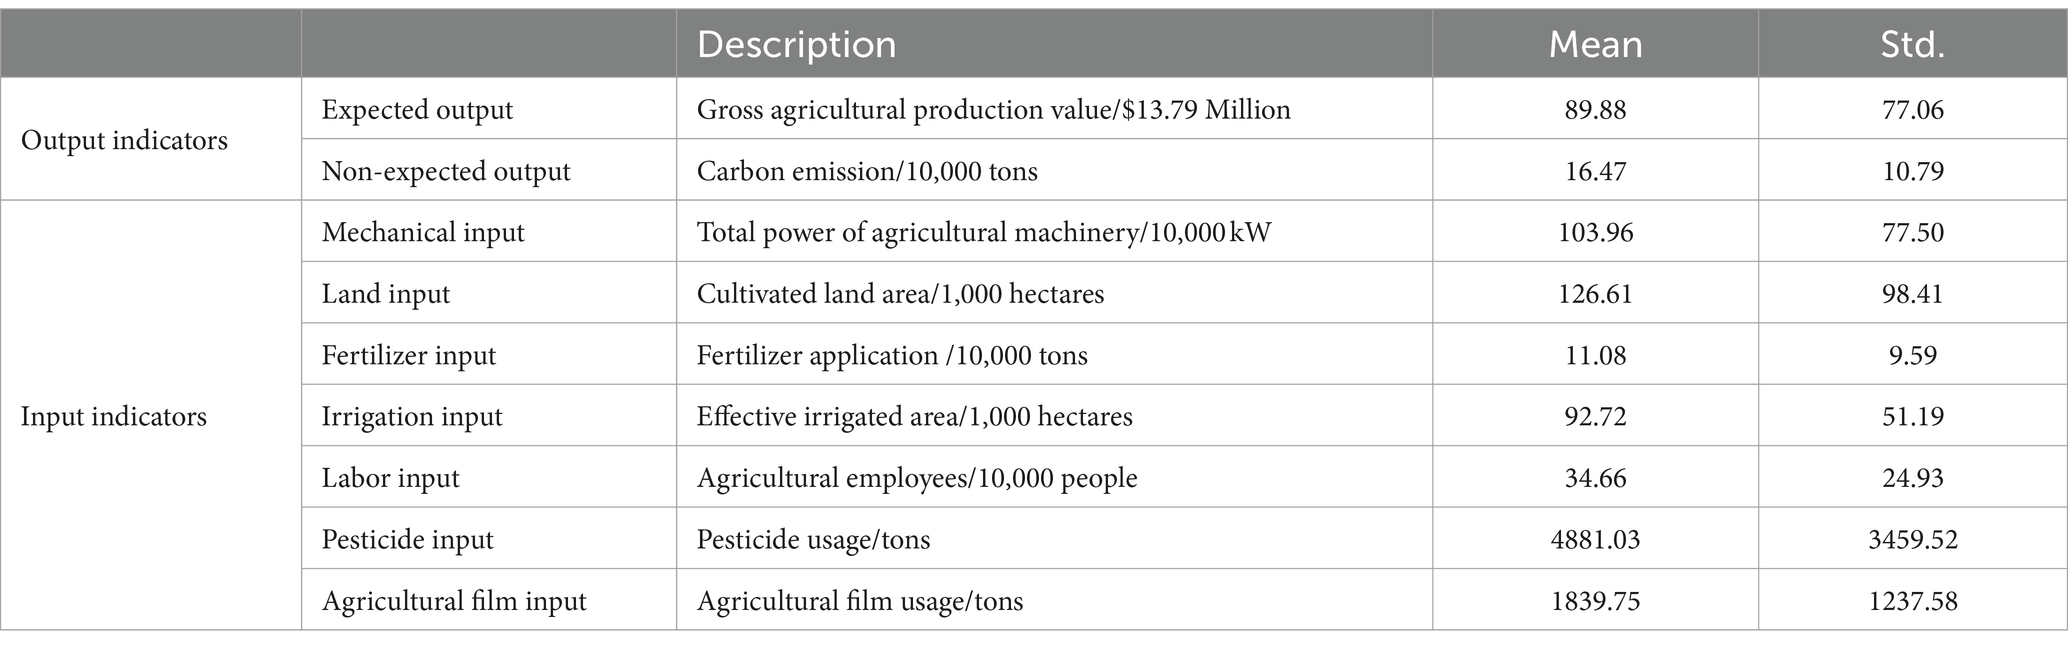
Table 1. Input–output indicators of AGTFP.
The DEA-BCC and DEA-MALMQUIST methods were applied to measure the AGTFP of each city in Guangdong, China, from 2013 to 2022. The results are shown in Table 2. Overall, the average AGTFP in each town in Guangdong, China, is 1.065, which is higher than 1, indicating that the overall AGTFP of Guangdong, China is relatively high. Among them, the average pure technical efficiency is 0.963, higher than the average scale efficiency of 0.845. From the perspective of coefficient of variation, the “SE < PTE < TE” indicates less difference in scale efficiency among regions, while there is more difference in comprehensive technical efficiency.
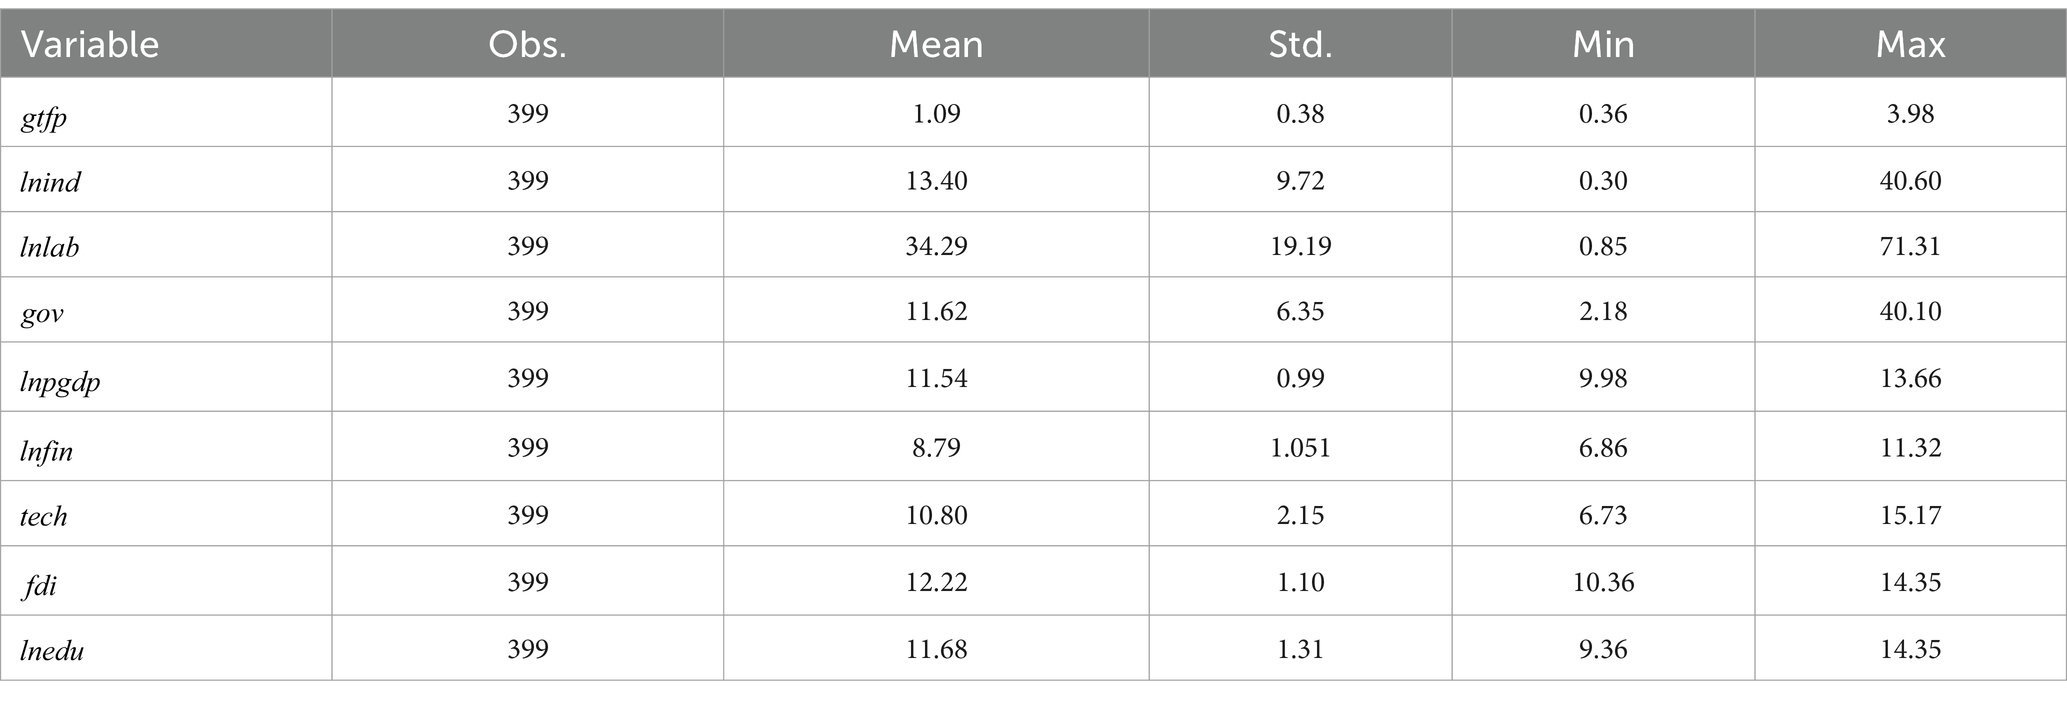
Table 2. Descriptive statistics of variables.
The agricultural productions of eight cities consisting of Shenzhen, Zhuhai, Shantou, Foshan, Dongguan, Zhaoqing, Chaozhou, Jieyang, and Yunfu have reached DMU total efficiency, which can fully utilize the input factors in terms of agricultural production scale and technology level. As for the inefficient DMU, Shaoguan, Heyuan, and Zhongshan have scale efficiencies close to or equal to 1. In contrast, their pure technical efficiencies are low, indicating that the low level of technology is the main factor leading to the low efficiency of agricultural production in these three regions. Improving agricultural production technology and management should be their future direction. Guangzhou, Maoming, and Zhongshan have pure technical efficiencies close to or equal to 1, but their scale efficiencies are low (Figure 2).
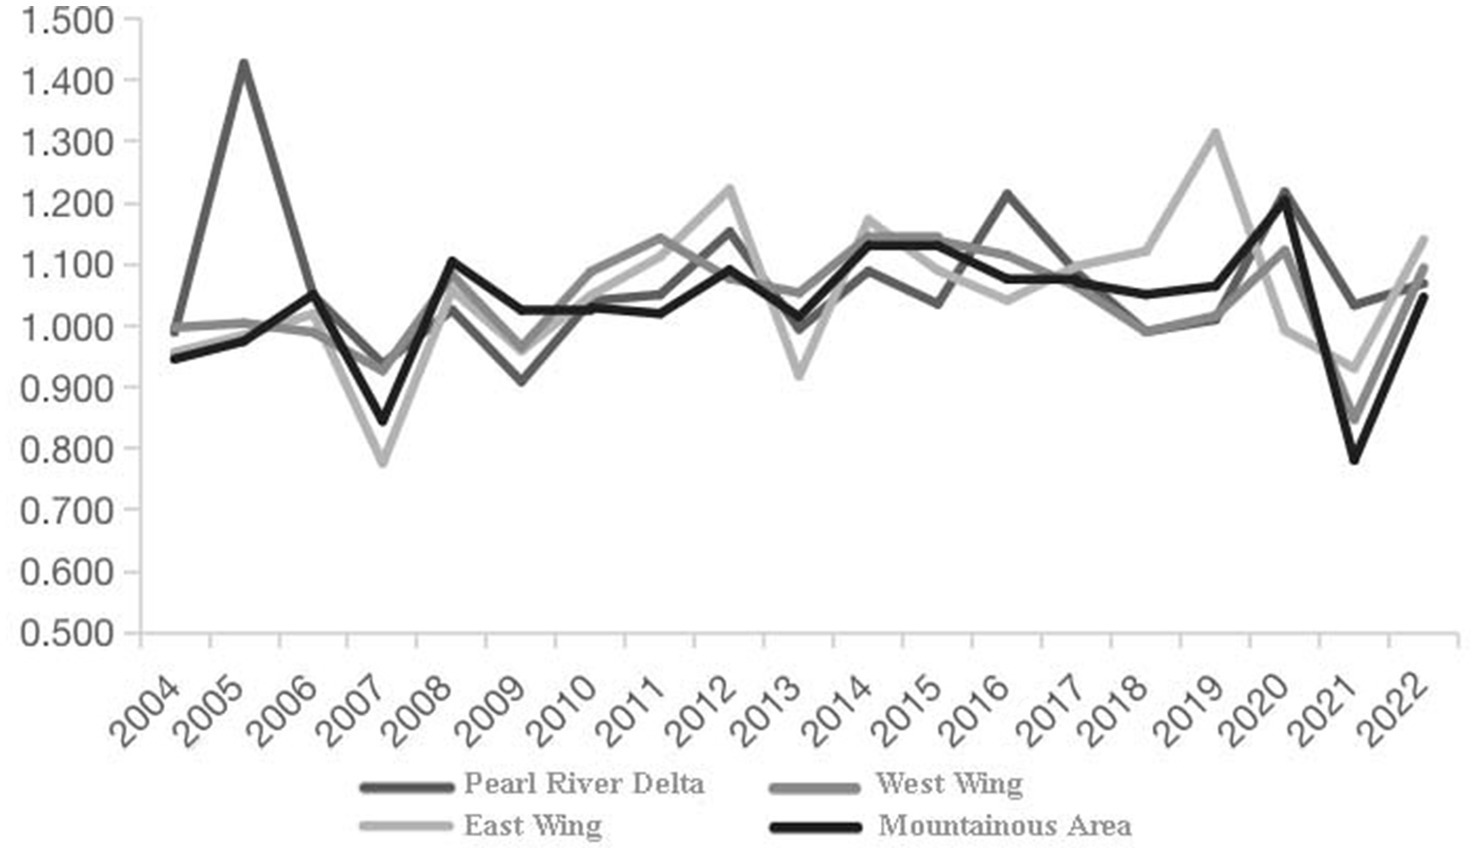
Figure 2. Decomposition and index of green total factor productivity of agriculture in four regions of Guangdong Province from 2004 to 2022.
To clearly show the regional differences of AGTFP in Guangdong China, we divide Guangdong China into four regions: Pearl River Delta, Eastern Wing, Western Wing, and Mountainous Area. Among them, the Pearl River Delta region includes Guangzhou, Shenzhen, Foshan, Dongguan, Huizhou, Jiangmen, Zhongshan, Zhuhai, and Zhaoqing; the Eastern Wing region includes Shantou, Chaozhou, Jieyang and Shanwei; Western Wing region includes Maoming, Yangjiang and Zhanjiang; Mountainous Area region includes Shaoguan, Meizhou, Qingyuan, Heyuan and Yunfu. As can be seen from Table 3, the regional imbalance of AGTFP in Guangdong China is not apparent, and the overall AGTFP shows a pattern of “Pearl River Delta region > Eastern Wing region > Western Wing region > Mountainous Area region.” Among them, the AGTFP of the Pearl River Delta region shows a slightly downward fluctuating trend; the AGTFP of the Mountainous Area and Eastern Wing regions shows a somewhat upward fluctuating trend; the overall fluctuation trend of AGTFP in the Western Wing region remains unchanged. However, the growth level of AGTFP in the Mountainous Area and Eastern Wing regions is lagging behind the provincial average level, and the improvement of green technical efficiency is still not ideal.
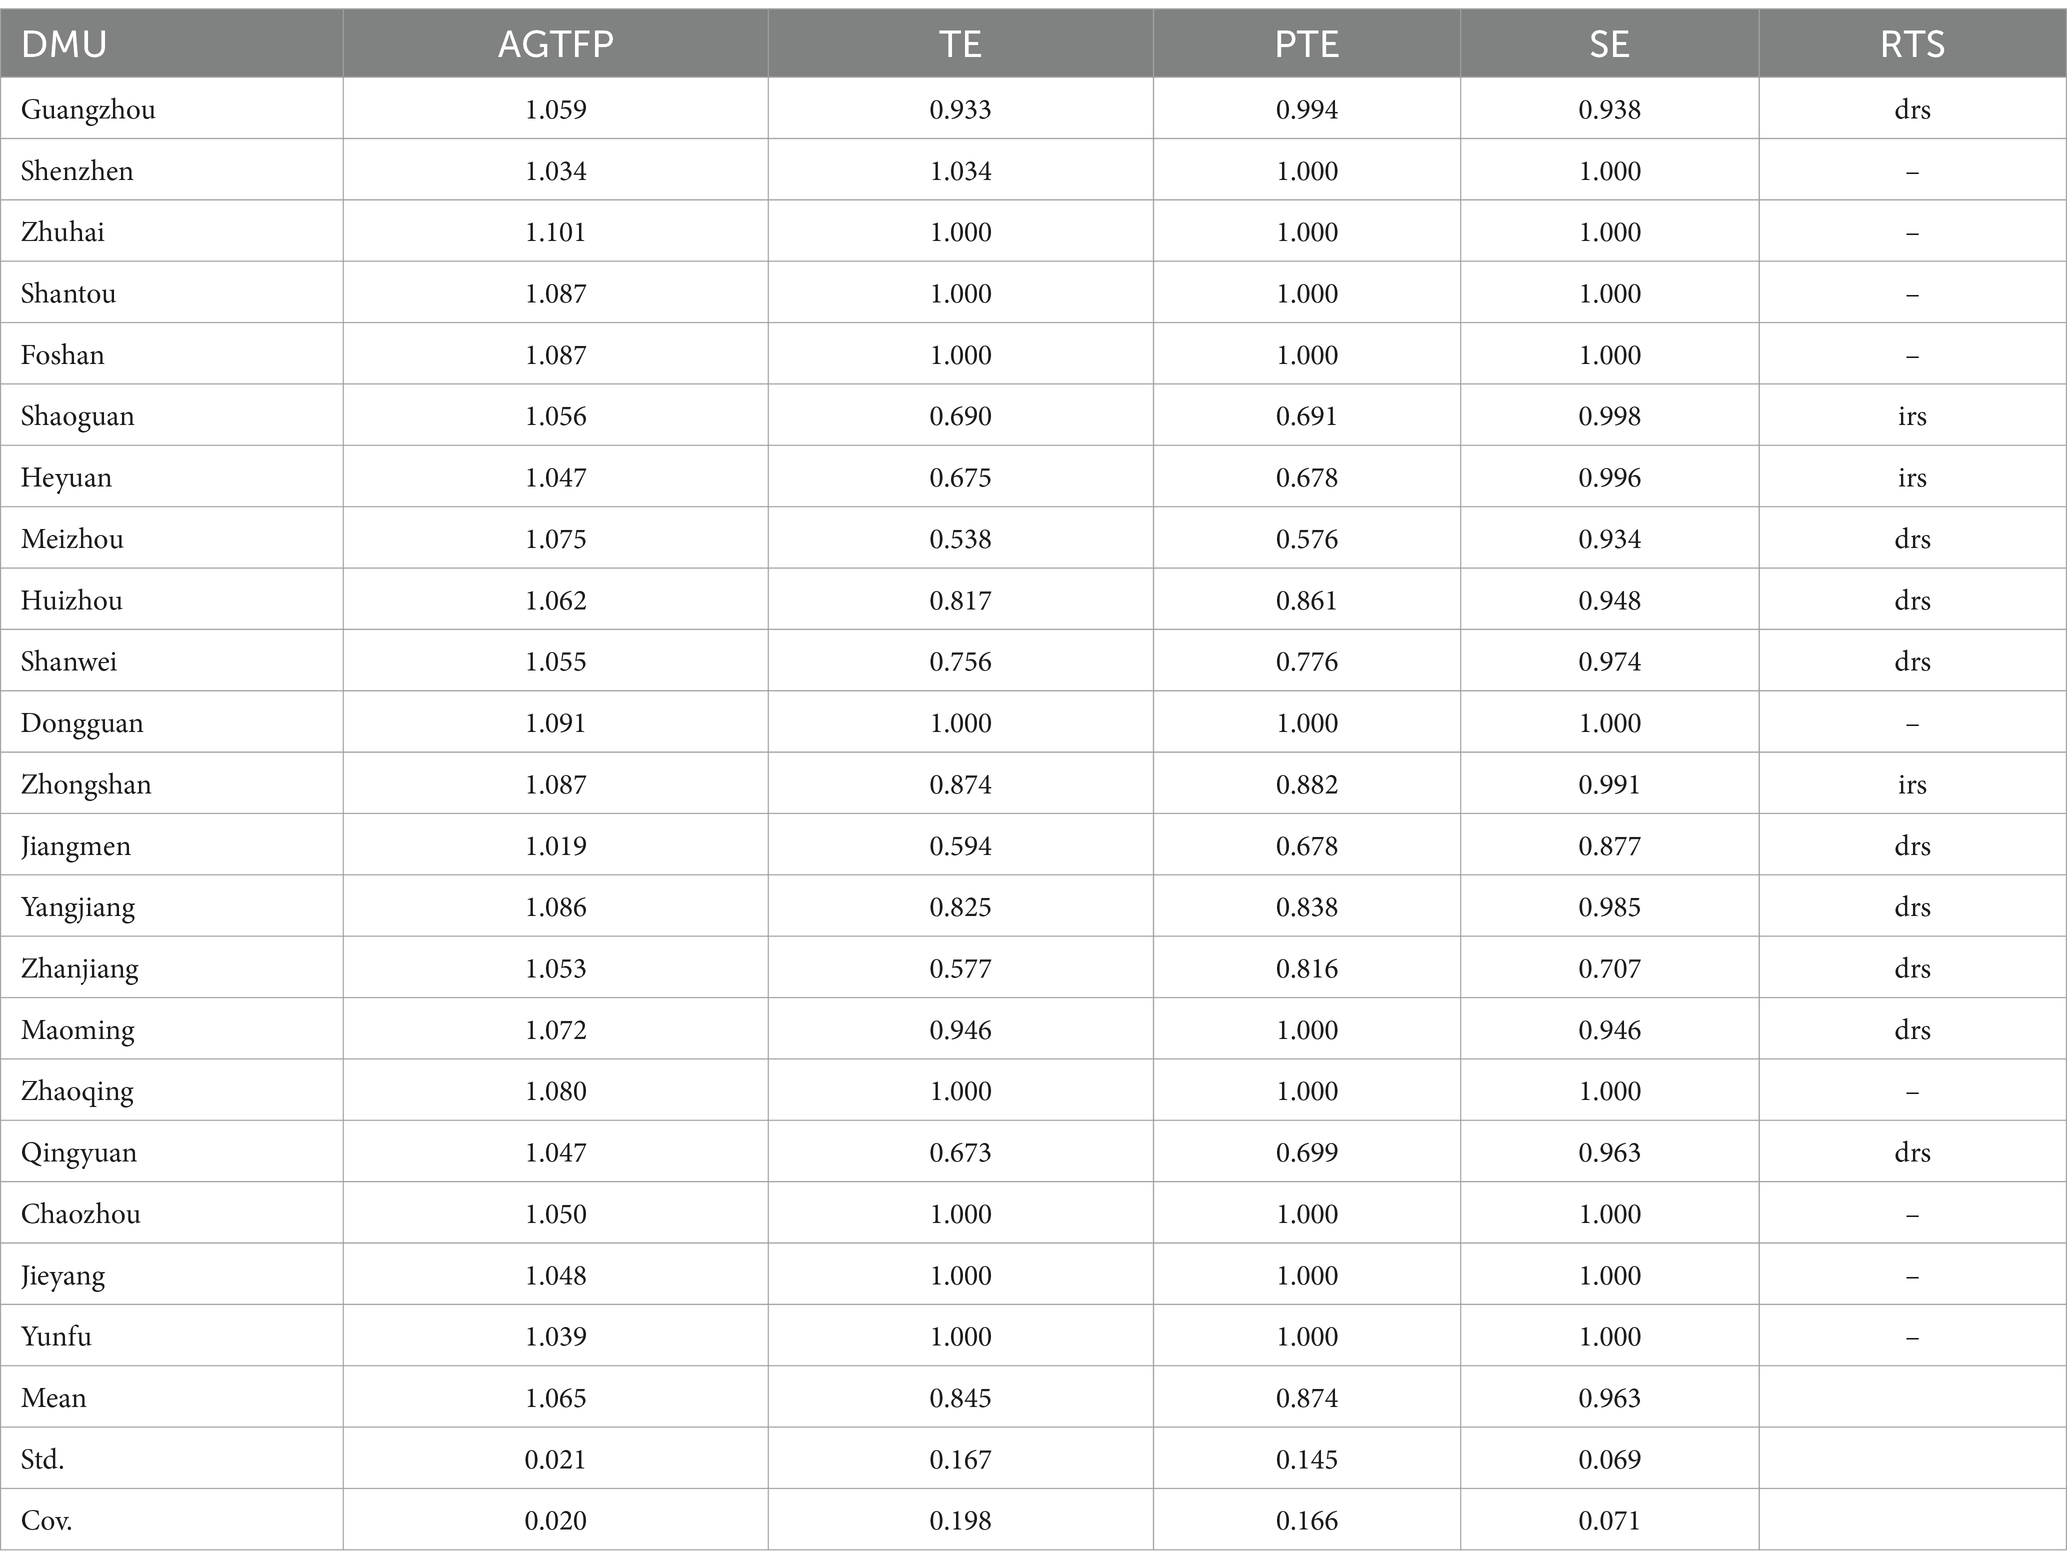
Table 3. Results of agricultural production efficiency measurement of 21 cities in Guangdong, China, from 2013 to 2022.
5.2 Spatial autocorrelation test
The selection of the spatial weight matrix is based on the spatial weight matrix embedded in economic geography, and the spatial weight matrix is row-standardized. The relevant data are from 21 cities in Guangdong Province, and the related operations are performed.
To analyze whether AGTFP has spatial dependence, the LM test was employed to inspect its spatial correlation. The Global Moran’s I index of AGTFP from 2004 to 2022 is 10.963, and the p value is 0.000, which significantly rejects the null hypothesis at the 1% confidence level, indicating that it has a spatial error. The LM index is 3.149, and the p value is 0.076, rejecting the null hypothesis at the 10% confidence level, indicating that it has spatial lag; both the SEM and SAR models are suitable, so the SDM is applied to conduct comprehensive test. The global Moran’s I homogenizes the differences among cities and cannot reflect the local spatial correlation of AGTFP in each city. Therefore, a regional spatial correlation analysis is conducted. We selected the annual data from 2004 to 2022 and calculated the local Geary’s C to obtain each year’s local spatial correlation situation. The test results are shown in Table 4. The Geary’s C are all significant. Therefore, the test results preliminarily indicate spatial autocorrelation among AGTFP in various cities in Guangdong, China.
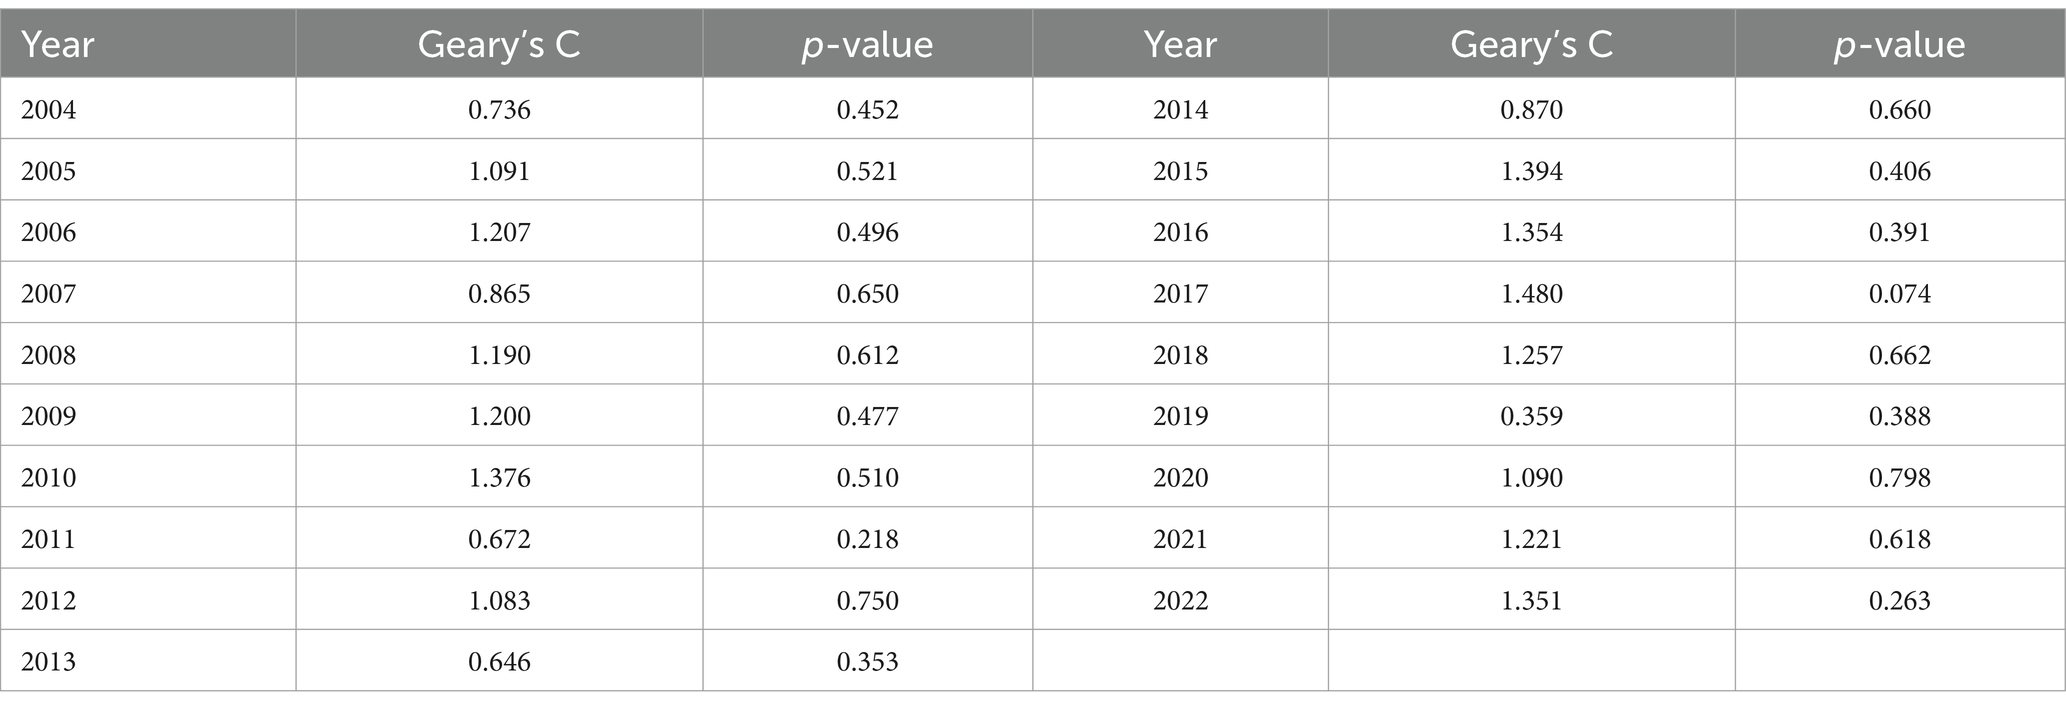
Table 4. Results of Geary’s C test from 2004 to 2022.
5.3 Spatial Durbin Model spatial effect results
The SDM is used to analyze the spatial spillover effect of AGTFP in Guangdong, China, for regression operation. The regression results are shown in Table 5.
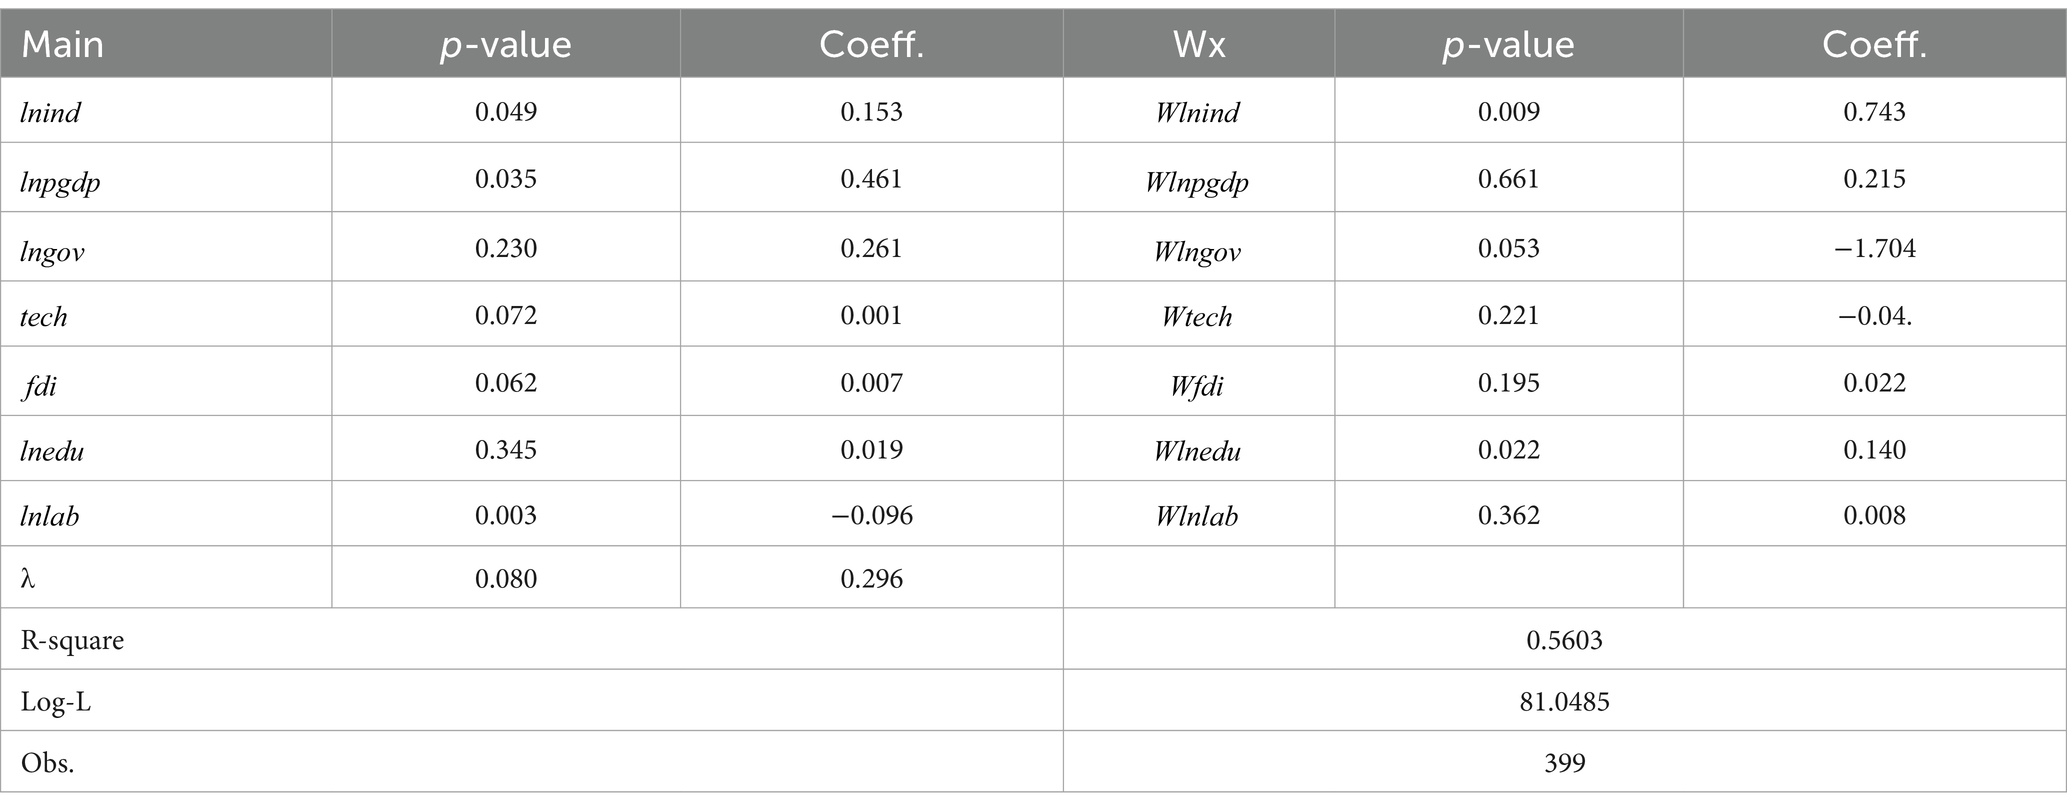
Table 5. SDM model based on the regression results of AGTFP in Guangdong, China.
According to the estimation results in Table 5, the R-square result is 0.5603, and the log-likelihood value is significant, indicating the model has high fit and reliability. The p-value of the spatial autoregressive coefficient λ is 0.080, compelling at the 10% level, and its coefficient is 0.296, which is positive. The study shows regional externalities impact AGTFP, while previous studies often ignore regional externalities (Liu Y. et al., 2023). When studying AGTFP in Guangdong Province, location factors and the influence of spatial effects cannot be ignored. From the β values statistically in Main, the p-value of is significant at the 1% level. Apart from these, the , , and are effective at the 5% level, while , , and are not substantial. The coefficient of is −0.096, indicating that harms AGTFP while the rest performs a positive effect. The term can better explain the spatial transmission effect than the coefficient of a local variable. The p-values of , , and are 0.009, 0.022, and 0.053, respectively, indicating they are significant at the 1, 5, and 10% levels. The coefficients are 0.743, 0.140, and −1.704, respectively, meaning that and have positive spatial spillover effects, and the surrounding areas have a positive transmission effect on the locally explained variable AGTFP. The coefficient of is negative. As a result, the AIS innovation and the expenditure on education have a positive spatial effect on AGTFP’s economic development. Regarding the direct effect, AIS, technology, economic development, regional openness, and education expenditure can positively affect the AGTFP, whereas human capital transfer negatively affects AGTFP.
6 Discussion
The AGTFP was calculated using Malmquist-DEA with the data covering Guangdong from 2004 through 2022, showing a fluctuating growth trend with an average value of 1.068 from 2004 to 2022. Technological progress is the main driving force behind the improvement of AGTFP in Guangdong, China. Among them, before 2007, the inter-annual changes in the technological progress index were relatively smooth, and after 2007, especially from 2013 to 2019, the inter-annual differences in the technological progress index fluctuated wildly. On the contrary, the overall fluctuation of technical efficiency is relatively smooth, with an average annual growth of 1.74%. Generally speaking, at this stage, the growth of agricultural GTFP in Guangdong Province is continuously improving, and its growth mainly depends on technological progress. The inhibitory effect of technical efficiency is pronounced, which is consistent with the research results (Wang Y. et al., 2019; Wei et al., 2021; Yang et al., 2022).
Presenting the regional change of each prefecture-level city toward the AGTFP is an essential issue in identifying the regional balance of agricultural efficiency with the method of DEA-BCC. It is noted that Zhongshan is in the stage of increasing returns to scale, while Guangzhou and Maoming are in decrease, indicating that Zhongshan can appropriately expand the scale of agricultural production to improve efficiency. At the same time, Guangzhou and Maoming need to reduce their agricultural output’s scale adequately. Respectively, Jiangmen and Zhanjiang have low pure technical and scale efficiency and need to improve from both aspects of improving technology level and appropriately expanding agricultural production scale. Regarding the spatial distribution of agricultural production efficiency, DMU effective regions are primarily concentrated in eastern Guangdong and Pearl River Delta regions, while the production efficiency in western Guangdong and northern Guangdong areas still needs improvement.
Furthermore, the regional imbalance heterogeneity in Guangdong has been verified, characterized as “Pearl River Delta > Eastern Wing > Western Wing > Mountainous Area.” The reason for this can be attributed to the “dual-wheel” drive of green frontier technological progress and green technical efficiency that leads to the mismatch with the agricultural production resources in the distribution of regional areas (Li et al., 2023). Out of the advantageous locater nearer to Hong Kong and Macao, the achievement of agricultural production has formed an outward-oriented green technology-driven management model. However, the agriculture-economic scale of Eastern Wing, Western Wing, and Mountainous is relatively tiny and poses severe constraints on greening the agricultural production, especially from the siphoning effect in the Pearl River Delta Area.
Using the Spatial Autocorrelation Test, we validated the spatial existence of the AGTFP. The changes in AGTFP are not randomly distributed but have a specific spatial dependence, accounting for the spatial proximity of geographical location. Due to geographical proximity, adjacent counties have similar natural resource conditions for agriculture, thus showing similar characteristics of agricultural production factor input, which promotes the existence of spatial correlation in AGTFP growth.
Assessments of the consequences of agricultural efficiency and its determinants following the perspective of the AIS using SDM have been designed. The AIS innovation has a positive effect on the AGTFP, as consistent with the finding that AIS reduces agricultural carbon emissions caused by raw materials (such as chemical fertilizer, pesticides, irrigation, etc.) (Liu et al., 2021; Hua et al., 2022; Yang et al., 2022). With the emergence of new industries and new technologies through AIS, energy saving and emission reduction are promoted, improving agricultural productivity (Robertson and Swinton, 2005; Laborde et al., 2021; Raihan et al., 2022). Respectively, the AIS innovation can improve the AGTFP indirectly through the technology diffusion in neighbor areas, as found from the spatial positive effect of AIS in Table 5, indicating that AIS enhances network connection among neighboring regions (Chen A. et al., 2021; Jiang et al., 2022; Wu et al., 2022). For agriculture that highly depends on natural resources, its consequence is that a change in AIS in an area will not only cause a change in local AGTFP but also form a competitive and cooperative interaction relationship within the agriculture industry between regions and surrounding regions (Duranton and Puga, 2000; Chang et al., 2022; Liu D. et al., 2023), then neighboring regions’ AGTFP will also change accordingly.
Apart from the promotion effect of the AIS innovation, the adoption of technology, economic level, and regional openness also improve the AGTFP. This finding also provides evidence for the agglomeration effect expounded by the central place theory and the new economic geography to some extent. Additionally, human capital transfer significantly inhibits local AGTFP, indicating that excessive labor force input might lead to self-exploitation in agricultural production, thus showing a sharp decline in marginal productivity. This spatial influence effect is positive but insignificant due to agricultural productive services being restricted by regional agricultural production factor market transaction costs and regional geographical barriers, affecting the efficiency of agricultural production factor allocation in various cities in Guangdong, China.
7 Conclusion, recommendations, and limitation
7.1 Conclusion
We revisit the change in agricultural efficiency and its determinants by considering the spatial features, emphasizing the innovative role of the AIS in the green transformation of agriculture cultivation. Following the existing literature on greening agricultural production, concerns are addressed about the adjusted change of agricultural efficiency, the driving force of the AIS, and the factors that help in neighboring areas. Our data allow us to address these concerns, assess the driving role of AGTFP, and thus identify the regional imbalance in greening agricultural production. Based on the panel data of 21 prefecture-level cities in Guangdong, China, from 2004 to 2022, this paper calculates the AGTFP using DEA-BCC and Malmquist-DEA and studies the spatial spillover effect and regional difference of AIS innovation on AGTFP exploiting the Spatial Durbin Model.
The main findings are as follows: First, the AGTFP of Guangdong China from 2004 to 2022 shows a fluctuating trend and remains the steady growth line overall. The AGTFP of Guangdong Province increased from 0.968 in 2004 to 1.078 in 2022, with an average annual growth rate of 0.537%. After 2012, the AGTFP varies a “decrease–increase-decline-slow” state and grows at 2 percent yearly. Moreover, the growth of AGTFP in Guangdong, China, is continuously improving, and its growth mainly depends on technological progress. The inhibitory effect of technical efficiency is noticeable.
Second, from the perspective of regional distribution, DMU effective regions are primarily concentrated in the eastern wing and Pearl River Delta regions, while the production efficiency in the western wing and mountainous areas still needs to be improved. From 2004 to 2022, there has been a regional imbalance in the AGTFP within Guangdong, China, characterized as “Pearl River Delta > Eastern Wing > Western Wing > Mountainous Area.” The reason for the highest AGTFP of the Pearl River Delta region is its agricultural-economic scale, which is relatively more significant than other areas in Guangdong and plays a siphoning role due to its location nearer to Hong Kong and Macao.
Third, the estimation results of the spatial Durbin model show that the direct impact of agricultural the AIS innovation on agricultural GTFP in Guangdong Province is significantly positive at the 1% statistical level, indicating that AIS innovation can substantially improve the factor allocation efficiency of AGTFP among prefecture-level cities in Guangdong China. From the perspective of spatial econometrics, neighboring cities’ AIS innovation has a significant spatial spillover effect on the agricultural production efficiency of local counties.
Apart from the increase in the role of AIS innovation, economic development, technology usage, and regional openness have a significant positive effect on AGTFP. Besides, human capital has a significant inhibitory impact, attributed to the self-exploitation in agricultural production that excessive labor force input brings. In neighboring cities, government intervention harms AGTFP, which could be promoted by spending on education.
7.2 Recommendations and limitation
The AIS innovation can be paid attention to while emphasizing the inter-industry change within the primary industry and the synchronous growth of corresponding labor productivity. The combination of market demand and policy guidance can be encouraged to ensure the reasonable development and structure optimization of each agriculture sub-sector and avoid the restriction of AGTFP improvement due to the self-exploitation from the excessive labor force input in agricultural operations. While promoting the refinement of local AIS, the complementary and coordinated development of AIS in neighboring areas can be encouraged to avoid unreasonable competition and spatial negative externalities caused by adjustment and a unified coordination mechanism among local governments to ensure a broader range of industrial structure macro-control jointly.
To improve technology support and fiscal transfer payment, a new mechanism for communicating and coordinating government interests between regions needs to be established. Due to the distinctive characteristics of “Pearl River Delta > Eastern Wing > Western Wing > Mountainous Area,” various measures to clarify the cities’ positioning in the green transformation of agricultural production are adopted to adapt to local conditions, namely weakening the “siphon effect” in the Pearl River Delta region and ensure the sustainable development of small and medium-sized cities. Because of the similarity of AGTFP between Eastern Wing and Western Wing, the exchanges between the two regional areas are strengthened to improve agriculture resource allocation and promote the AGTFP through the free flow of production factors. For the Mountainous Area, the support of the Pearl River Delta is enhanced to provide clean technological assistance for agricultural efficiency.
For most areas of agricultural green production, technological innovation can be strengthened to optimize the allocation of input factors, reduce agricultural carbon emissions, and increase the contribution rate of the AIS. Out of the positive spatial effect of AIS innovation, policymakers are advised to create practical institutional arrangements to deepen the promotion of technology and spillover. Technological innovation is encouraged to be accelerated for ineffective areas of agricultural green production via the technical efficiency to promote intensive input factor utilization, reduce carbon emissions, and increase agricultural desirable output value.
Although we tried to assess the calculation of the AGTFP, its change features, and its determinants following the perspective of AIS innovation as comprehensively as possible, the current study has certain limitations that should be noted. Due to the cultural difference and regional heterogeneity, our estimates focus on the changing trend of the AGTFP, on which the AIS innovation has, and fail to provide valuable information about other areas. According to the Rice Theory proposed by Talhelm et al. (2014), collectivism in southern China and individualism in the northern part shape different production behaviors and have differentiated demands for division of labor and cooperation in agricultural operations. Future work will consider the potential effects of cultural differences, such as collectivism and individualism, on the AGTFP to validate the kinds of greening of agricultural production that can be drawn from this study.
Data availability statement
The original data supporting the conclusions of this article will be made available by the corresponding authors, without undue reservation, to whom further inquiries can be directed.
Author contributions
WZ: Funding acquisition, Supervision, Writing – review & editing. ZL: Conceptualization, Data curation, Formal analysis, Writing – original draft. SW: Validation, Writing – original draft. ST: Funding acquisition, Writing – review & editing.
Funding
The author(s) declare financial support was received for the research, authorship, and/or publication of this article. This work was supported by the Ministry of Education Humanities and Social Sciences Youth Project (23YJC630235), Guangdong Provincial Ordinary University Characteristic Innovation Project (2023WTSCX060), Guangdong Province Philosophy and Social Science Youth Project (GD22YGL19), and Guangdong University Student Climbing Plan Social Survey Report on Philosophy and Social Science and General Project of Academic Papers (pdjh2023b0329).
Conflict of interest
The authors declare that the research was conducted in the absence of any commercial or financial relationships that could be construed as a potential conflict of interest.
Publisher’s note
All claims expressed in this article are solely those of the authors and do not necessarily represent those of their affiliated organizations, or those of the publisher, the editors and the reviewers. Any product that may be evaluated in this article, or claim that may be made by its manufacturer, is not guaranteed or endorsed by the publisher.
References
Ahmad, Z., Baig, I. A., Husain, S., Khan, Z. A., Rana, M., Azam, K., et al. (2023). How technological innovation and electricity consumption affect environmental quality? A road map towards achieving environmental sustainability. Environ. Sci. Pollut. Res. 28055, 1–18. doi: 10.1007/s11356-023-28055-1
Alhassan, H. (2021). The effect of agricultural total factor productivity on environmental degradation in sub-Saharan Africa. Sci. Afr. 12:e00740. doi: 10.1016/j.sciaf.2021.e00740
Alzeban, A. (2018). The relationship between internal audit and foreign direct investment. Asia Pacifc J. Account. Econ. 27, 173–194. doi: 10.1080/16081625.2018.1517602
Awosusi, A. A., Adebayo, T. S., Kirikkaleli, D., and Altuntaş, M. (2022). Role of technological innovation and globalization in BRICS economies: policy towards environmental sustainability. Int. J. Sustain. Dev. World Ecol. 29, 593–610. doi: 10.1080/13504509.2022.2059032
Baig, I. A., Ali, M. S., Salam, A., and Shah, M. K. (2020). Agriculture, manufacturing and economic growth in India: a co-integration analysis. J. Econ. Bus. 3:255. doi: 10.31014/AIOR.1992.03.03.255
Baig, I. A., Irfan, M., Aarif, M., Husain, S., and Sulaiman, M. (2023). How agricultural technologies and climatic factors affect India's crop production? A roadmap towards sustainable agriculture. Sustain. Dev. 31, 2908–2928. doi: 10.1002/sd.2558
Baig, I. A., Mohammad, S., Akram, V., Chandio, A. A., and Gupta, Y. (2024). Examining the impacts of climatological factors and technological advancement on wheat production: a road framework for sustainable grain production in India. Environ. Dev. Sustain. 26, 12193–12217. doi: 10.1007/s10668-023-03746-4
Chang, X., Su, J., and Yang, Z. (2022). The effect of digital economy on urban green transformation—an empirical study based on the Yangtze River Delta City cluster in China. Sustain. For. 14:13770. doi: 10.3390/su142113770
Chen, A., Li, Y., Ye, K., Nie, T., and Liu, R. (2021). Does transport infrastructure inequality matter for economic growth? Evidence from China. Land 10:874. doi: 10.3390/land10080874
Chen, Y., Miao, J., and Zhu, Z. (2021). Measuring green total factor productivity of China's agricultural sector: a three-stage SBM-DEA model with non-point source pollution and CO2 emissions. J. Clean. Prod. 318:128543. doi: 10.1016/j.jclepro.2021.128543
Chen, T., Rizwan, M., and Abbas, A. (2022). Exploring the role of agricultural Services in Production Efficiency in Chinese agriculture: a case of the socialized agricultural service system. Land 11:30347. doi: 10.3390/land11030347
Chen, X., Shuai, C., Zhang, Y., and Wu, Y. (2020). Decomposition of energy consumption and its decoupling with economic growth in the global agricultural industry. Environ. Impact Assess. Rev. 81:106364. doi: 10.1016/j.eiar.2019.106364
Cheng, L., Song, S., and Xie, Y. (2022). Evaluation of water resources utilization efficiency in Guangdong Province based on the DEA–Malmquist model. Front. Environ. Sci. 10:819693. doi: 10.3389/fenvs.2022.819693
Chung, Y., and Fare, R. (1997). Productivity and undesirable outputs: a directional distance function approach. Microeconomics 51, 229–240. doi: 10.1006/jema.1997.0146
Duranton, G., and Puga, D. (2000). Diversity and specialisation in cities: why, where and when does it matter? Urban Stud. 37, 533–555. doi: 10.1080/0042098002104
Fuglie, K. O., and Rada, N. (2018). International agricultural productivity database. Washington, DC: ERS, USDA.
Gu, X. Y., Baig, I. A., Shoaib, M., and Zhang, S. (2024). Examining the natural resources-ecological degradation nexus: the role of energy innovation and human capital in BRICST nations. Resour. Policy 90:104782. doi: 10.1016/j.resourpol.2024.104782
Hamid, I., Alam, M. S., Baig, I. A., and Jena, P. K. (2023). Nexus between institutional quality and foreign direct investment infows: panel data analysis of SAARC countries. J. Knowl. Econ. 15, 7993–8019. doi: 10.1007/s13132-023-01252-6
Han, F., Xie, R., and Fang, J. (2018). Urban agglomeration economies and industrial energy efficiency. Energy 162, 45–59. doi: 10.1016/j.energy.2018.07.163
Hua, J., Zhu, D., and Jia, Y. (2022). Research on the policy effect and mechanism of carbon emission trading on the Total factor productivity of agricultural enterprises. Int. J. Environ. Res. Public He. 19:7581. doi: 10.3390/ijerph19137581
Huang, J., and Rozelle, S. (2018). “China’s 40 years of agricultural development and reform” in China’s 40 years of reform and, development 1978–2018. eds. R. Garnaut, F. Cai, and L. Song (Canberra, Australia: The ANU Press), 487–506.
Jakku, E., Fielke, S., Fleming, A., and Stitzlein, C. (2022). Reflecting on opportunities and challenges regarding implementation of responsible digital agri-technology innovation. Sociol. Ruralis. 62, 363–388. doi: 10.1111/soru.12366
Jiang, Q., Li, J., Si, H., and Su, Y. (2022). The impact of the digital economy on agricultural green development: evidence from China. Agriculture 12:1107. doi: 10.3390/agriculture12081107
Laborde, D., Mamun, A., Martin, W., Piñeiro, V., and Vos, R. (2021). Agricultural subsidies and global greenhouse gas emissions. Nat. Commun. 12:2601. doi: 10.1038/s41467-021-22703-1
Li, M., Wang, J., Zhao, P., Chen, K., and Wu, L. (2020). Factors affecting the willingness of agricultural green production from the perspective of farmers’ perceptions. Sci. Total Environ. 738:140289. doi: 10.1016/j.scitotenv.2020.140289
Li, J., Zhang, J., Gong, L., and Miao, P. (2015). Research on the total factor productivity and decomposition of Chinese coastal marine economy: based on DEA-Malmquist index. J. Coast. Res. 73, 283–289. doi: 10.2112/SI73-050.1
Li, E., Zhang, M., Li, R., and Deng, Q. (2023). Influencing factors and improvement suggestions for agricultural green development performance: empirical insights from China. Chinese Geogr. Sci. 33, 917–933. doi: 10.1007/s11769-023-1385-6
Liu, D., Li, Y. S., You, J., Balezentis, T., and Shen, Z. (2023). Digital inclusive finance and green total factor productivity growth in rural areas. J. Clean. Prod. 418:138159. doi: 10.1016/j.jclepro.2023.138159
Liu, Y., Ma, C., and Huang, Z. (2023). Can the digital economy improve green total factor productivity? An empirical study based on Chinese urban data. Math. Biosci. Eng. 20, 6866–6893. doi: 10.3934/mbe.2023296
Liu, Y., Yan, B., Wang, Y., and Zhou, Y. (2019). Will land transfer always increase technical efficiency in China?—a land cost perspective. Land Use Pol. 82, 414–421. doi: 10.1016/j.landusepol.2018.12.002
Liu, D., Zhu, X., and Wang, Y. (2021). China's agricultural green total factor productivity based on carbon emission: an analysis of evolution trend and influencing factors. J. Clean. Prod. 278:123692. doi: 10.1016/j.jclepro.2020.123692
Ma, G., Li, M., Luo, Y., and Jiang, T. (2023). Agri-ecological policy, human capital and agricultural green technology progress. Agriculture 13:941. doi: 10.3390/agriculture13050941
Peng, Y., Chen, Z., and Lee, J. (2020). Dynamic convergence of green Total factor productivity in Chinese cities. Sustain. For. 12:4883. doi: 10.3390/su12124883
Polyzos, S., Minetos, D., and Sdrolias, L. (2007). Productivity and spatial diffusion of technology in Greece: an empirical analysis. J. Int. Bus. Econ. 8, 105–124. doi: 10.51240/jibe.2007.1.8
Praveen, B., Kumar, P., Baig, I. A., Bhardwaj, M., Singh, K., and Yadav, A. K. (2022). Impact of environmental degradation on agricultural efficiency in India: evidence from robust econometric models. J. Bioecon. 24, 203–222. doi: 10.1007/s10818-022-09327-1
Qiao, H., Zheng, F., Jiang, H., and Dong, K. (2019). The greenhouse effect of the agriculture-economic growth-renewable energy nexus: evidence from G20 countries. Sci. Total Environ. 671, 722–731. doi: 10.1016/j.scitotenv.2019.03.336
Qin, S., Han, Z., Chen, H., Wang, H., and Guo, C. (2022). High-quality development of Chinese agriculture under factor misallocation. Int. J. Environ. Res. Public He. 19:9804. doi: 10.3390/ijerph19169804
Raihan, A., Muhtasim, D. A., Pavel, M. I., Faruk, O., and Rahman, M. (2022). An econometric analysis of the potential emission reduction components in Indonesia. Clean. Prod. Lett. 3:100008. doi: 10.1016/j.clpl.2022.100008
Robertson, G. P., and Swinton, S. M. (2005). Reconciling agricultural productivity and environmental integrity: a grand challenge for agriculture. Front. Ecol. Environ. 3, 38–46. doi: 10.2307/3868443
Shao, W., Yang, K., and Jin, Z. (2023). How the carbon emissions trading system affects green total factor productivity? A quasi-natural experiment from 281 Chinese cities. Front. Energy Res. 10:895539. doi: 10.3389/fenrg.2022.895539
Sheng, Y., Tian, X., Qiao, W., and Peng, C. (2019). Measuring agricultural total factor productivity in China: pattern and drivers over the period of 1978-2016. Aust. J. Agr. Resour. Ec. 64, 82–103. doi: 10.1111/1467-8489.12327
Solow, R. M. (1957). Technical change and the aggregate production function. Rev. Econ. Stat. 39, 312–320. doi: 10.2307/1926047
Talhelm, T., Zhang, X., Oishi, S., Shimin, C., Duan, D., Lan, X., et al. (2014). Large-scale psychological differences within China explained by rice versus wheat agriculture. Science 344, 603–608. doi: 10.1126/science.1246850
Tillaguango, B., Alvarado, R., Dagar, V., Murshed, M., Pinzón, Y., and Méndez, P. (2021). Convergence of the ecological footprint in Latin America: the role of the productive structure. Environ. Sci. Pollut. Res. 28, 59771–59783. doi: 10.1007/s11356-021-14745-1
Wang, H., Fang, L., Mao, H., and Chen, S. (2022). Can e-commerce alleviate agricultural non-point source pollution?—a quasi-natural ex-periment based on a China's E-commerce Demonstration City. Sci. Total Environ. 846:157423. doi: 10.1016/j.scitotenv.2022.157423
Wang, H., Liu, C., Xiong, L., and Wang, F. (2023). The spatial spillover effect and impact paths of agricultural industry agglomeration on agricultural non-point source pollution: a case study in Yangtze River Delta, China. J. Clean Prod. 401:136600. doi: 10.1016/j.jclepro.2023.136600
Wang, J. Z., and Long, F. (2024). Grain industrial agglomeration and grain green total factor productivity in China: a dynamic spatial durbin econometric analysis. Heliyon 10:e26761. doi: 10.1016/j.heliyon.2024.e26761
Wang, Q., Wang, H., and Chen, H. (2012). A study on agricultural green TFP in China: 1992-2010. Econ. Rev. 5, 24–33. doi: 10.19361/j.er.2012.05.003
Wang, F., Wang, H., Liu, C., Xiong, L., and Kong, F. (2022). Does economic agglomeration improve agricultural green total factor productivity? Evidence from China’s Yangtze river delta. Sci. Prog. 105, 1–27. doi: 10.1177/00368504221135460
Wang, Y., Wu, Q., and Song, J. (2022). Spatial network structure characteristics of green total factor productivity in transportation and its influencing factors: evidence from China. Front. Environ. Sci. 10:982245. doi: 10.3389/fenvs.2022.982245
Wang, Y., Xie, L., Zhang, Y., Wang, C., and Yu, K. (2019). Does FDI promote or inhibit the high-quality development of agriculture in China? An agricultural GTFP perspective. Sustainability 11:4620. doi: 10.3390/su11174620
Wang, X., Zhang, Q., and Chang, W.-Y. (2022). Does economic agglomeration affect haze pollution? Evidence from China’s Yellow River basin. J. Clean. Prod. 335:130271. doi: 10.1016/j.jclepro.2021.130271
Wang, X., Zhou, D., and Telli, Ş. (2022). The impact of semi-urbanization on carbon emissions: a spatial econometric perspective. Environ. Sci. Pollut. Res. Int. 29, 54718–54732. doi: 10.1007/s11356-022-19709-7
Wei, X., Hu, Q., Shen, W., and Ma, J. (2021). Influence of the evolution of marine industry structure on the green total factor productivity of marine economy. Water 13:1108. doi: 10.3390/w13081108
Wu, S., Wang, P., and Sun, B. (2022). Can the internet narrow regional economic disparities? Reg. Stud. 56, 324–337. doi: 10.1080/00343404.2021.1942444
Xiao, S., He, Z., Zhang, W., and Qin, X. (2022). The agricultural green production following the technological progress: evidence from China. Int. J. Env. Res. Pub. He. 19:9876. doi: 10.3390/ijerph19169876
Xie, H., and Huang, Y. (2021). Influencing factors of farmers' adoption of pro-environmental agricultural technologies in China: Meta-analysis. Land Use Policy 109:105622. doi: 10.1016/j.landusepol.2021.105622
Xu, B., Niu, Y., Zhang, Y., Chen, Z., and Zhang, L. (2022). China’s agricultural non-point source pollution and green growth: interaction and spatial spillover. Environ. Sci. Pollut. Res. 29, 60278–60288. doi: 10.1007/s11356-022-20128-x
Yan, S. (2019). Analysis of ways to increase farmers’ income in China under new circumstances. World Sci. Res. J. 5, 46–50. doi: 10.6911/WSRJ.201909_5(9).0006
Yang, Y. (2021). Evaluation of China's water-resource utilization efficiency based on a DEA-Tobit two-stage model. Water Suppl. 21, 1764–1777. doi: 10.2166/ws.2020.349
Yang, S., and Li, W. (2022). The impact of socialized agricultural machinery services on land productivity: evidence from China. Agriculture 12:2072. doi: 10.3390/agriculture12122072
Yang, H., Wang, X., and Bin, P. (2022). Agriculture carbon-emission reduction and changing factors behind agricultural eco-efficiency growth in China. J. Clean. Prod. 334:130193. doi: 10.1016/j.jclepro.2021.130193
Zhang, D. (2021). Marketization, environmental regulation, and eco-friendly productivity: a Malmquist–Luenberger index for pollution emissions of large Chinese firms. J. Asian Econ. 76:101342. doi: 10.1016/J.ASIECO.2021.101342
Zhang, W., Gao, P., Chen, Z., and Qiu, H. (2023). Preventing agricultural non-point source pollution in China: the effect of environmental regulation with digitization. Int. J. Env. Res. Pub. He. 20:4396. doi: 10.3390/ijerph20054396
Zhang, S., and Li, Z. (2022). Research and prospect of the spatial system structure layout of villages and towns. Int. J. Soc. Sci. Educ. Res. 5, 216–222. doi: 10.6918/IJOSSER.202203_5(3).0038
Keywords: green transformation, agricultural production, agricultural green total factor productivity, agricultural industrial structure innovation, spatial spillover roles, regional difference
Citation: Zhang W, Li Z, Wagan SA and Tan S (2024) The green transformation of agricultural production: evaluating the spatial role of agricultural industrial structure innovation in Guangdong, China. Front. Sustain. Food Syst. 8:1384358. doi: 10.3389/fsufs.2024.1384358
Edited by:
Xiong Zhou, Beijing Normal University, ChinaReviewed by:
Martinson Ankrah Twumasi, Sichuan Agricultural University, ChinaImran Ali Baig, National Institute of Technology Hamirpur, India
Copyright © 2024 Zhang, Li, Wagan and Tan. This is an open-access article distributed under the terms of the Creative Commons Attribution License (CC BY). The use, distribution or reproduction in other forums is permitted, provided the original author(s) and the copyright owner(s) are credited and that the original publication in this journal is cited, in accordance with accepted academic practice. No use, distribution or reproduction is permitted which does not comply with these terms.
*Correspondence: Weikun Zhang, d2Vpa3VuekBsaW5nbmFuLmVkdS5jbg==
†These authors have contributed equally to this work