- 1College of Food Science and Technology, Guangdong Ocean University, Guangdong Provincial Key Laboratory of Aquatic Product Processing and Safety, Guangdong Province Engineering Laboratory for Marine Biological Products, Guangdong Provincial Engineering Technology Research Center of Seafood, Guangdong Provincial Engineering Technology Research Center of Prefabricated Seafood Processing and Quality Control, Zhanjiang, China
- 2Collaborative Innovation Center of Seafood Deep Processing, Dalian Polytechnic University, Dalian, China
- 3Key Laboratory of Tropical Crop Products Processing of Ministry of Agriculture, Agricultural Products Processing Research Institute, Chinese Academy of Tropical Agricultural Sciences, Zhanjiang, China
- 4Institute of Applied Chemistry, Jiangxi Academy of Sciences, Nanchang, China
- 5Department of Food Science, Stocking Hall, Cornell University, Ithaca, NY, United States
With the increasing demand for nutrition and health, many researchers are trying to develop a rice product with lower aging rate and convenient nutrient fortification. Being composed of high amylopectin content, cassava starch (CS) shows a lower retrogradation tendency compared to rice starch. So, it has a broad application prospect to partially replace rice starch with CS in rice by extrusion technology. In this study, a new extruded rice (ER) was prepared by broken rice flour and CS using single-screw extruder through “improved extrusion cooking technology,” and the maximum addition level of CS in ER was 30%. Color parameters and texture profile analysis showed that ER was a little darker in appearance with lower hardness, adhesiveness and chewiness. Rapid visco analysis demonstrated that the viscosity of ER paste appeared earlier during the initial heating phase and displayed a lower retrogradation trend than normal rice in the cooling process. The gelatinization temperature and gelatinization enthalpy decreased with the increasing CS in ER, while the degree of gelatinization increased to 76.36% when the content of CS was 30% after extrusion. The X-ray diffraction patterns of control was typical A-type structure, while ER changed to V-type structure with a lower degree of crystallinity. The microstructure observation showed that ER exhibited a looser and more porous structure with increasing the content of CS, which facilitated easier cooking and nutritional enhancement.
1 Introduction
Rice is the most common food in Asia, serving as the primary dietary source of carbohydrates and energy, and comprises half of the world’s main food supply. In comparison to brown rice, white rice exhibits a superior appearance, with higher swelling ratio and peak viscosity (Wu et al., 2017). However, the milling process of white rice results in a considerable loss of nutrients, encompassing proteins, lipids, vitamins, and minerals. Furthermore, cooked white rice has a higher tendency toward retrogradation, which would have a negative impact on the taste (Xiao et al., 2023). With the increasing demand for nutrition and health, many researchers are trying to develop a rice product with lower aging rate and convenient nutrient fortification.
Extrusion is a very common food processing technology that involves high heat, high pressure, and high shear forces, in which various physical and chemical changes occur. Recently, a new gelatinization technology called “improved extrusion cooking technology (IECT)” was proposed. In comparison with traditional extrusion cooking, the screw used in the extruder is longer (1,950 cm), which makes the material stay longer in the extruder. In addition, the screw speed and temperature of the extruder are lower (Liu et al., 2017). Zhang et al. (2014) showed that after IECT treatment, the aging rate of high amylose rice starch decreased and the structure became loose. We also found that the low setback value and better water solubility of rice starch might be observed by controlling the moisture content, which was related to the molecular properties (Liu et al., 2017). The temperature and screw speed are also two important parameters of IECT, which can significantly impact on the structure and properties of extrudate. Therefore, IECT has a good prospect in the production of starch products with different aging degree and structure.
Cassava starch (CS), derived from plant roots, is widely produced in Latin America. It has a wide range of applications in various fields, including as a thickener or gelling agent, as well as in the preparation of low-fat frozen desserts, helping to achieve a smooth and creamy taste. A previous study showed that partially replacing rice starch with CS can alter the rheological, thermal, and gelling properties of the system, depending on the mixing ratio of CS and the physical properties of the two starch components (Sun and Yoo, 2015). What’s more, being composed of high amylopectin content (approximately 80%), CS shows a lower retrogradation tendency compared to rice starch. Consequently, there is a wide range of potential applications for partially replacing rice starch with CS in rice through extrusion technology. Currently, approximately 14% of the grains are broken during rice processing, often considered to be a low-value waste (Moraes et al., 2014). Hence, utilizing these broken rice grains and CS as raw materials and controlling the mixing ratio between them to prepare extruded rice might be a good choice.
To the best of our knowledge, there are no comprehensive reports on the utilization of CS in extruded rice (ER) by IECT. We hope to develop a new ER with lower aging rate and convenient nutrient fortification. A new extruded rice using cassava starch and broken rice flour by IECT was proposed, and the physicochemical properties of ER were studied through scanning electron microscopy (SEM), color parameters analysis, differential scanning calorimetry (DSC), rapid visco analyzer (RVA), texture profile analysis (TPA), and x-ray diffraction (XRD).
2 Materials and methods
2.1 Materials
Broken rice (Ganzaoxian-974) was acquired from a factory (Nanchang, Jiangxi province) during the process of polishing brown rice, which was used as a control. On a dry weight basis, the levels of amylose content, lipid, protein and moisture in broken rice were determined to be 25, 0.56, 12.58, and 13.31% correspondingly. The broken rice was subsequently milled using a hammer mill (manufactured by Jiangxi Hongxing Machinery Limited Liability Company, Hongxing, China). The moisture of all the samples was determined by the oven method (AOAC, 2005; Methods 934.01), and the resulting ground rice flour had a moisture content of 12.0% on a dry weight basis. CS was purchased from a food manufacturing facility located in Thailand, and the content of protein, lipid, amylose and moisture in the CS were 0.13, 0.25, 17 and 14.8%, respectively, on a dry weight basis. Before use, both CS and broken rice flour were passed through a 0.25 mm mesh screen and then packaged and sealed in polyethylene bags.
2.2 Sample blending and IECT treatment procedure
IECT was carried out on a single-screw extruder (designed by our team, and manufactured by Jinan Saixin Machinery Ltd., China). All raw materials were weighed in batches of 8 kg, and four samples were prepared: one sample with 100% rice flour; one sample with 90% rice flour and 10% CS; one sample with 80% rice flour and 20% CS; the last one sample with 70% rice flour and 30%. Taking into account the moisture content of both CS and rice flour, the desired feed moisture content (30%) could be obtained by adding enough water. Subsequently, the prepared samples were thoroughly mixed in a high-speed mixer at 365 rpm for 20 min to ensure homogeneity before extrusion. The extruder was a single-screw (SX3000-100, manufactured by Jinan SaiXin Machinery Ltd., China). The screw has a length of 195 cm and a diameter of 10 cm. The depth of the screw thread gradually changes from 20 mm to 6 mm from the feeding port to the die head direction, with no change in thread spacing. The die head seat has 16 holes, each with a diameter of 2.2 mm and a compression ratio of 2.84:1. The extrusion process was carried out based on the method described by Zhang et al. (2014) with minor modifications. The screw speed was set at 17 rpm, the feed screw rate at 25 rpm, and the temperature settings for the feed, mix, screw conveyor, shearing compression metering, and die head zones were 50°C, 65°C, 85°C, 100°C, and 95°C, respectively. After being left at room temperature for 2 h, the ER were stored in a refrigerator at 4°C for 24 h. After that, all the ER were dried to the same final moisture content (12%) at 30°C and a humidity of 75%, and then packed in polyethylene bags. Part of the samples were powdered for the following experiment (DSC, RVA, XRD and SEM).
2.3 The color and dimension analysis
The color parameters were determined based on the method described by Pongjaruvat et al. (2014) with minor modifications. Three replicate measurements were conducted using a spectrophotometer (MiniScan EZ, Hunter Associates Laboratory Inc., United States) with D65 illuminant and a standard observer of 10° to measure both normal rice (control) and ER placed on a desktop. The dimension of normal rice and ER were measured by micrometer.
2.4 SEM analysis
The samples were coated with platinum using an Ion Sputter E-100 coating system (manufactured by Hitachi High-Technologies, Tokyo, Japan). Microstructural images of the samples were then acquired using a scanning electron microscope (S-4800, Hitachi Limited, Tokyo, Japan) at a magnification of 50X and an acceleration voltage of 3.0 kV.
2.5 RVA analysis
Using a RVA (Newport Scientific, Warriewood, NSW, Australia), 2.8 g of samples (with 12% moisture content) were measured and mixed with 25 mL of distilled water. The parameter settings were based on the method described by Xia et al. (2019). The parameters were set as follows: the paddle speed was set to 160 revolutions per minute; the temperature was maintained at 50°C for a duration of 1 min, subsequently raised to 95°C after 3.75 min. Following this, it was sustained for 2.5 min, subsequently lowered to 50°C within 3.75 min, and then held for an additional 5 min. The resulting pasting temperature (PT), peak viscosity (PV), breakdown (BD), setback (SB), and final viscosity (FV) values were recorded.
2.6 XRD analysis
X-ray diffraction analysis was conducted using a Siemens D5000 instrument (manufactured by Rigaku Corporation, Japan) in the 2θ range of 5–40° at a scanning rate of 6°/min. The resulting x-ray diffraction pattern was obtained.
2.7 DSC analysis
The samples were analyzed using a DSC (Q2000, TA Corp., New Castle, United States) following the method described by Zhang et al. (2014) with minor modifications. The samples were heated from 20°C to 100°C at a rate of 10°C/min, and a nitrogen flush of 50 cm3/min was used. The resulting onset temperature (To), peak temperature (Tp), conclusion temperature (Tc), and gelatinization enthalpy (ΔHg) were recorded.
The degree of gelatinization change (DG) was calculated using the following equation (Xia et al., 2015):
2.8 Cooking
Cooked ER was prepared by the method of Wu et al. (2017) with some modifications. Soak time-precook, rice/water volumetric ratio, and cook time were considered in this study. According to the package directions, cooked normal rice was used for TPA measurements. Based on preliminary experiment, the optimized cooking conditions of normal rice and ER using a rice cooker are listed in Table 1.
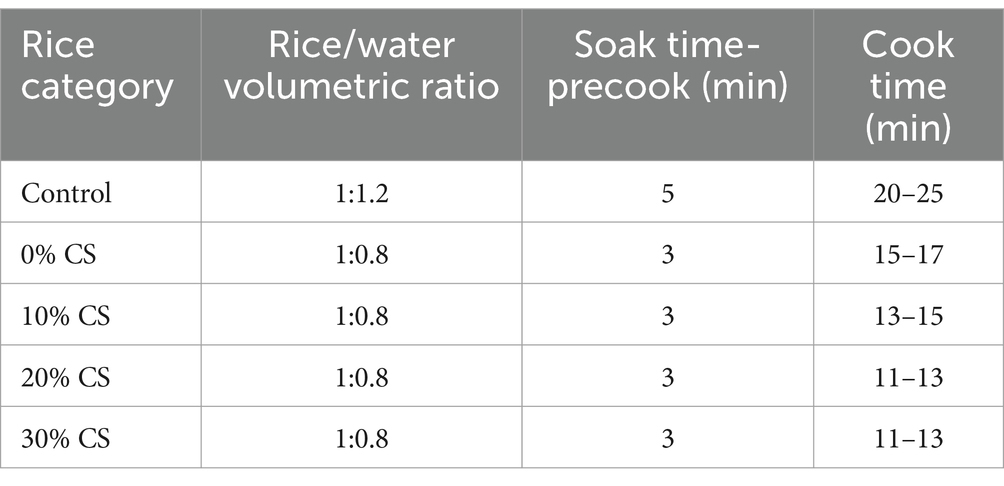
Table 1. The optimized cooking conditions for normal rice (control) and extruded rice in a rice cooker.
2.9 Texture profile analysis
All cooked rice samples were allowed to cool to 28°C (approximately 30 min) before conducting the TPA test, and then the experiment was carried out according to Tao et al. (2020) with some modifications. TPA was conducted using a texture analyzer (Model CT3, Brookfield Engineering Laboratories, Unites States). A plunger (P 0.5R) was used to compress the sample to 40% of its original height at a test speed of 0.5 mm/s, and the compression process was repeated three times.
2.10 Statistical analysis
The processing of the ER was treated by IECT for once, with triplicate measurements made on each treatment. The data were analyzed using SPSS (SPSS Inc., 1998, Chicago, IL, United States) version 9.0 for Windows. All experiments were conducted in triplicate, and the results were presented as mean values ± standard deviations. The differences between mean values were evaluated using the ANOVA method, followed by Duncan’s multiple comparison post-test. Significance was set at p < 0.05.
3 Results and discussion
3.1 The color and dimension analysis
Color is an intuitive physical property to evaluate the quality of extrudates. The color values of L* value measures the brightness or luminosity/darkness (100 = white, 0 = black) while a* and b* values measures of redness/greenness and yellowness/blueness (Gulzar et al., 2021).
As shown in Table 2, it can be seen that ER expressed a lower b* and L* value but higher a* value compared with the control sample. It suggested that the ER had a darker and lower intensity of ‘yellowness’ color which were in accordance with the observation in Figure 1. From Table 2, it can also be found that when the addition level of CS in ER increased from 0 to 30%, the a* value decreased from −1.4 ± 1.70 to −1.9 ± 0.34, b* value decreased from 12.9 ± 0.42 to 11.2 ± 0.25 and L* value decreased from 63.4 ± 1.40 to 56.2 ± 3.02, respectively. It indicated that the color became darker as the CS content increased, resulting in a lower L* value. Similar conclusion was also obtained by Pongjaruvat et al. (2014) who demonstrated that the substitution of pregelatinized tapioca starch altered the color of gluten-free jasmine rice breads crumb, considering the parameters of a* (from −0.13 ± 0.11 to −0.91 ± 0.04) b* (from 15.10 ± 0.60 to 11.96 ± 0.42) and L* (from 78.09 ± 0.97 to 69.94 ± 1.02).

Table 2. The thermal properties, relative crystallinity, color and dimension analysis of normal rice (control) and extruded rice.
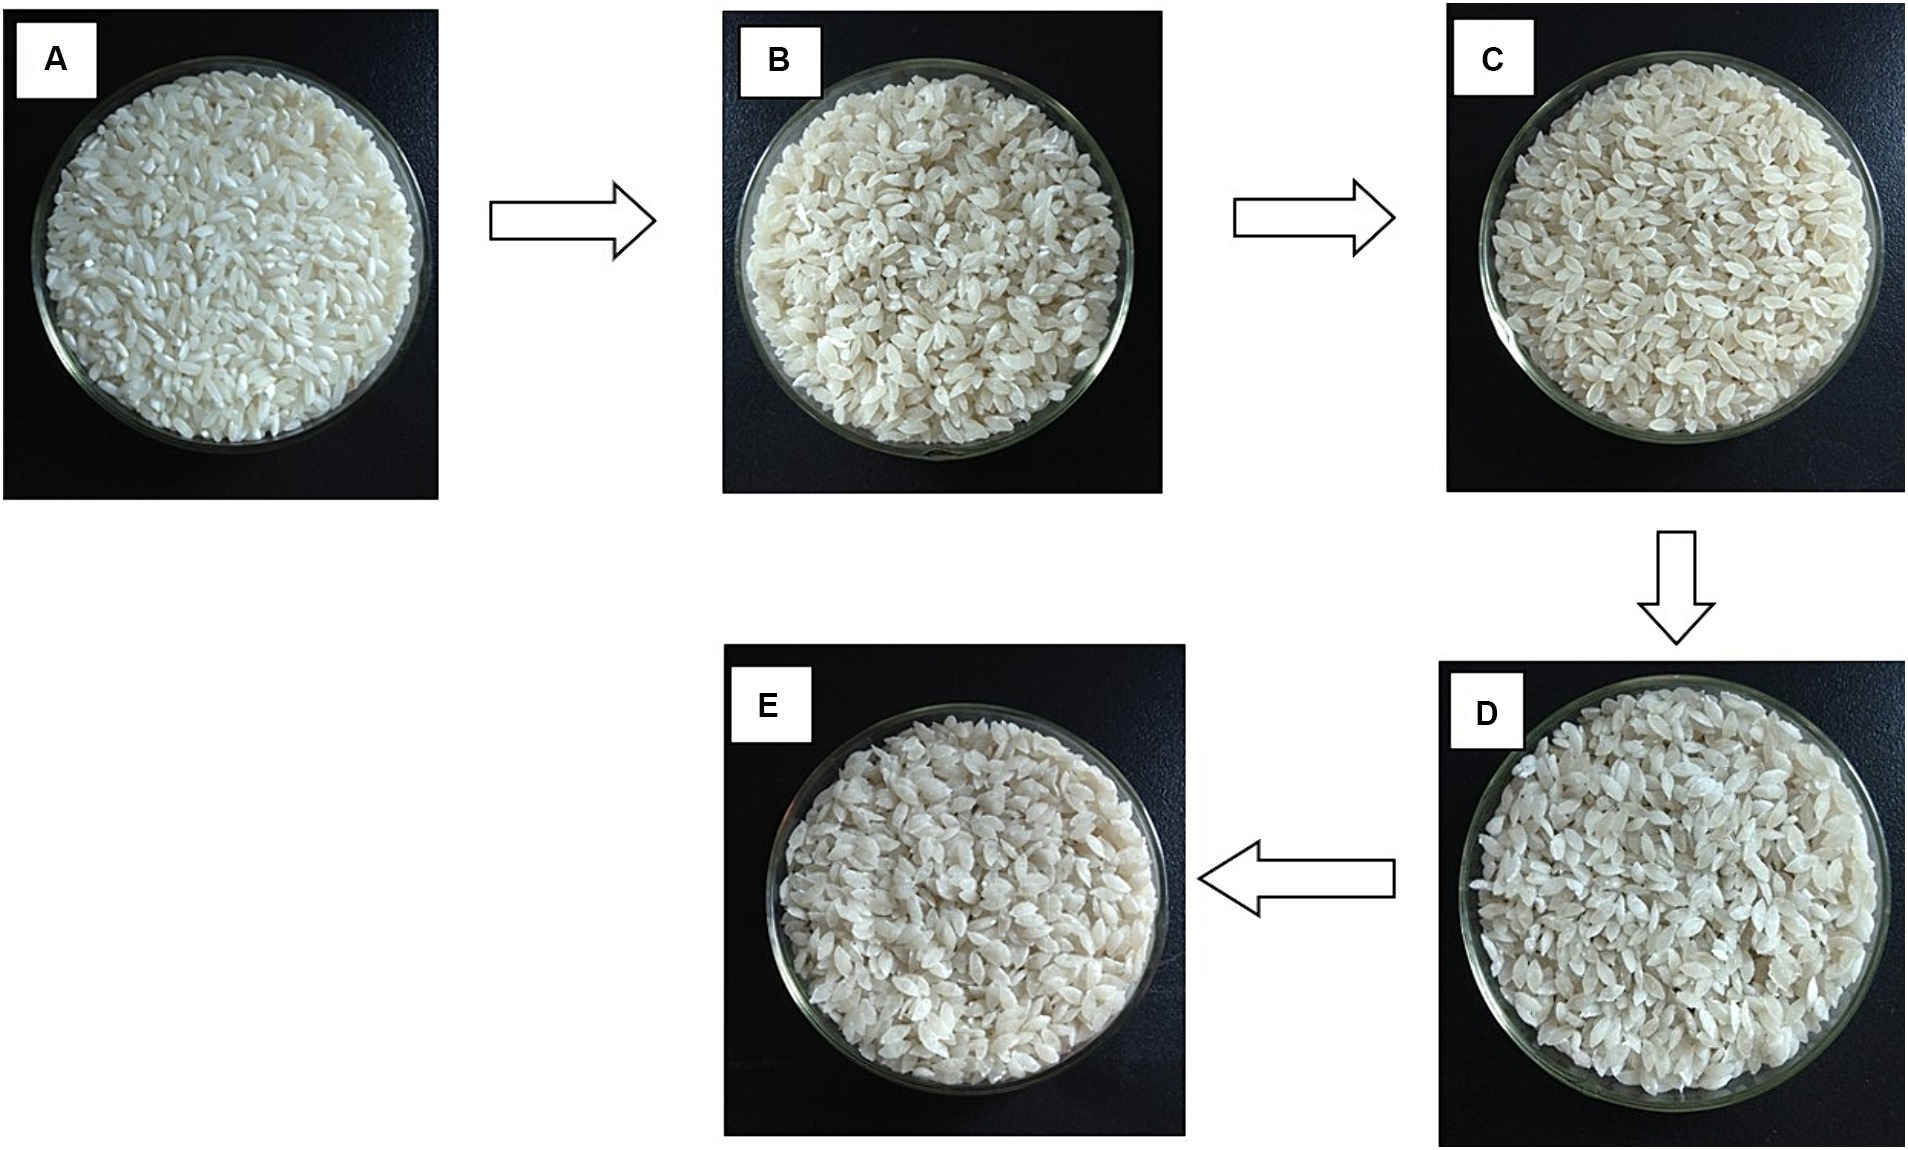
Figure 1. The appearance of normal rice and extruded rice: (A) (control), (B) (0% CS), (C) (10% CS), (D) (20% CS), and (E) (30% CS).
It was found that the dimension of normal rice was the smallest, and the dimension of ER increased with the addition level of CS increasing, and the biggest values obtained when the addition level of CS was 30%. This might be due to the increase in CS addition, which makes the texture of ER softer (section 3.6), resulting in an increase in dimension. When the addition level of CS in ER was beyond 30%, the ER was hard to obtain due to the high viscosity of CS, and also the shape of ER was too flat, which was not acceptable (Data not shown). These observations indicated that the appearance of ER was changed with the substitution of CS. So, in our current study, the maximum addition level of CS in ER was 30%.
3.2 SEM analysis
The microstructures of the samples are depicted in Figure 2. Notably, the control sample (Figure 2A) exhibited a dense and intact structure. Conversely, ER displayed a looser structure with more pores compared to the control group. This observation could be attributed to the extrusion process, which involves high pressure, intense heat, and shear forces. These conditions lead to the gelatinization and degradation of starch, as reported by Gulzar et al. (2021), ultimately resulting in a looser texture within the ER samples.
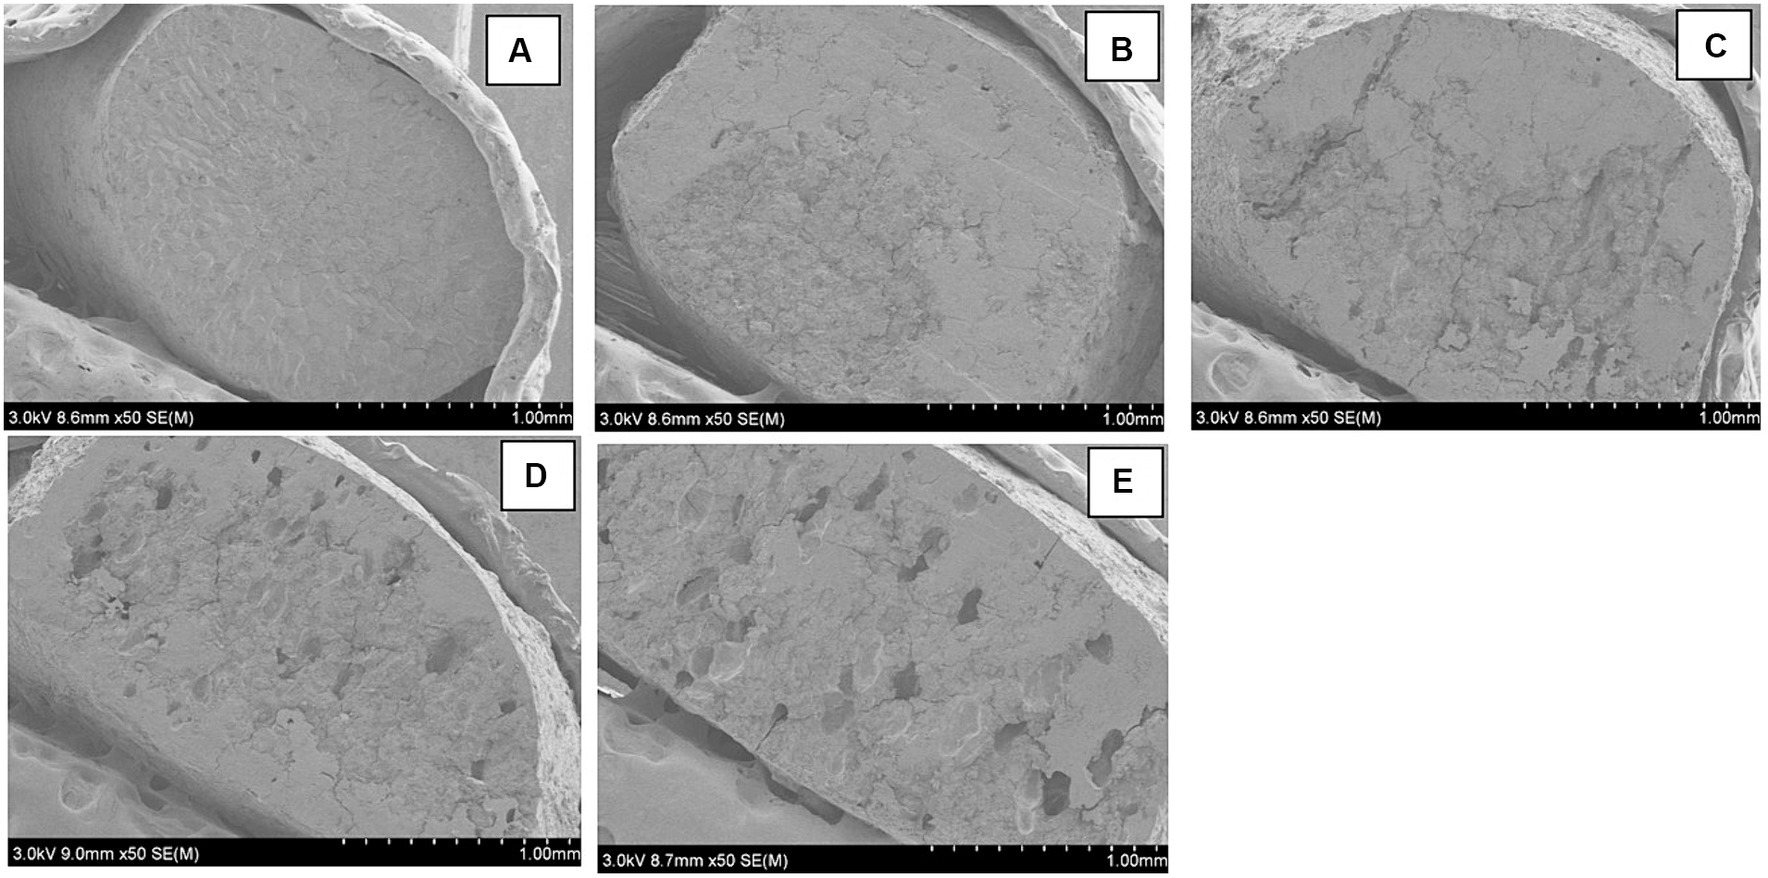
Figure 2. SEM images of normal rice and extruded rice: (A) (control), (B) (0% CS), (C) (10% CS), (D) (20% CS), and (E) (30% CS).
With the increase in CS content, the appearance of ER became looser with more pores (Figures 2B–E). This could be due to the good water-binding capacity of CS (Charoenrein and Preechathammawong, 2012), which retained more water during extrusion. Because amylopectin molecules were more likely to form hydrogen bonds with water molecules, while amylose starch molecules were usually tightly packed and curled, making it easier to form intramolecular hydrogen bonds and preventing water molecules from entering. When samples with similar initial moisture content (30%) were dried to the same final moisture content (12%), more pores were observed with increasing CS content after syneresis during the drying process (Charoenrein and Preechathammawong, 2010). The microstructure implied that the loose structure in ER could afford an opportunity for starch grains to interact with water molecules and to swell better, which would soften the structure of starch matrix and give rise to a softer product. The observations also suggest that ER could be more easily to cook and fortify with functional ingredients through soaking or spraying, which may be more accessible for nutrients (Ayoub et al., 2013) than the control sample.
3.3 RVA analysis
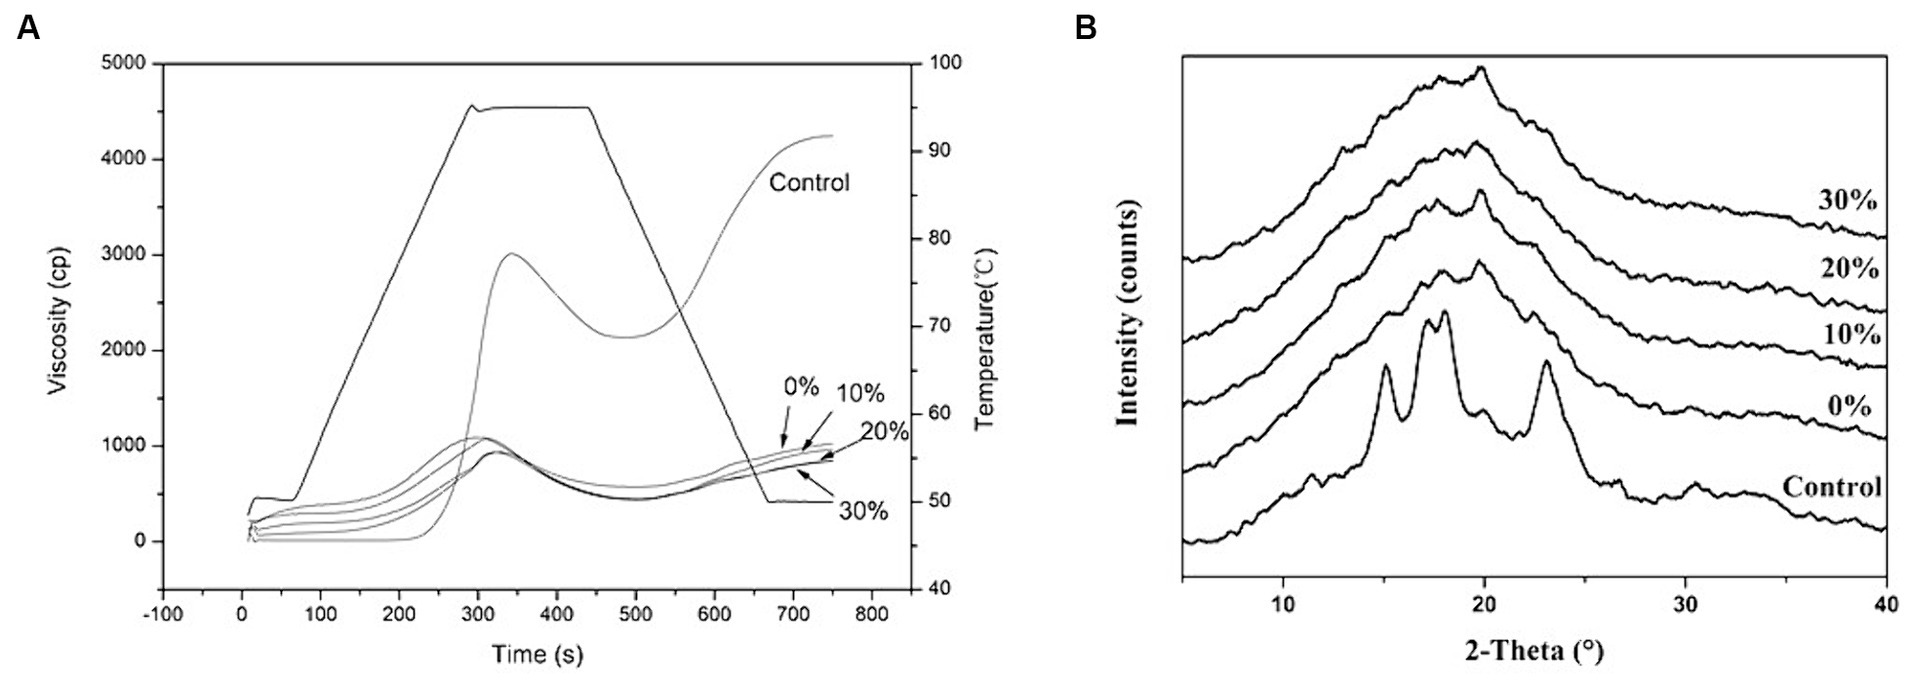
The RVA patterns for all samples are presented in Figure 3A, and the corresponding pasting parameters are listed in Table 3. During the initial heating stage, the viscosity of ER paste appeared earlier and reached its peak faster than the control sample, indicating that ER was more readily accessible to water. Since the initial viscosity measures the starch’s ability to absorb water at room temperature and form a viscous paste or gel (Xia et al., 2019), this characteristic can be attributed to the loose texture of ER observed in SEM results. This loose structure facilitates easier interaction between water molecules and ER, enabling better swelling. The higher the amount of “accessible” water within ER, the more facile its gelatinization becomes. Meanwhile, due to the partial substitution of CS for rice starch, the content of amylopectin in ER is higher, making it easier to form hydrogen bonds with water molecules. This is because amylose molecules are usually tightly packed and curled, making it easier to form intramolecular hydrogen bonds and preventing water molecules from entering.
During the holding temperature of 95°C, the starch granules underwent further disruption, leading to a reduction in the viscosity of all starch pastes. The breakdown (BD) was calculated by determining the difference between the peak viscosity and the minimum viscosity, which occurred approximately at the start of the RVA cooling stage. BD served as a metric to assess the disintegration tendency of gelatinized starch, reflecting the loss of integrity within starch granules and subsequently, the decrease in paste viscosity. As the content of CS increases, the peak and minimum viscosity values of ER samples gradually rise. Previous studies have established a strong correlation between starch viscosity and amylopectin content. Amylopectin, with its intricate, reticulated structure and stronger intermolecular forces compared to amylose, plays a pivotal role in determining viscosity (Dalonso and de Oliveira Petkowicz, 2014). Notably, there were insignificant differences (p>0.05) in BD values among ER samples, indicating that their thermal stability is comparable. However, a significant (p < 0.05) change in BD value was observed between the control and ER samples, decreasing from 876 to 509 cp. These findings suggested that ER exhibited greater stability under isothermal shear conditions compared to the control.
Upon cooling, the control sample exhibited a significant increase in viscosity (p < 0.05), whereas the ER samples displayed a more subtle viscosity increase. This indicated that the starch in ER had undergone partial gelatinization and degradation during the extrusion process, leading to a slight rise in cold paste viscosity. Furthermore, the final viscosity (FV) of ER was consistently lower than that of the control group, suggesting a reduced tendency for retrogradation in ER. The FV serves as an indicator of retrogradation tendency, with higher FV values indicating a greater likelihood of retrogradation (Li et al., 2015). The setback (SB), calculated by subtracting the minimum viscosity from the final viscosity (Kong et al., 2016), provides insights into the starch’s short-term retrogradation. As evident from Table 3, the SB value of the control sample was the highest compared to ER, and it decreased as the CS content in ER increased. This finding supported the observation that ER exhibited a lower retrogradation tendency than the control. Previous studies have shown that amylopectin is more susceptible to degradation during extrusion compared to amylose (Zhang et al., 2020). The shorter chains resulting from this degradation process resemble non-starch polysaccharides, which can delay the re-association of starch molecules and thereby inhibit retrogradation (Liu et al., 2017). Given the lower SB and FV values observed in ER, it is likely that the addition of CS contributed to maintaining a good texture after cooking due to the slow retrogradation tendency.
3.4 XRD analysis
The X-ray diffractograms of the control and ER samples are presented in Figure 3B. The control sample exhibited a typical A-type pattern with peaks at 15°, 17°, 18°, and 23°, while the ER sample displayed a V-type pattern with a small peak at an angle value of 20°. This peak was attributed to the primary formation of amylose-lipid complex (Simsek, 2022), and its intensity decreased with increasing CS content. This reduction in peak intensity could be due to the decrease in amylose content in ER, resulting in a reduction in the formation of the amylose-lipid complex. A similar result was also obtained by Zhou et al. (2024) who declared that the peak intensity of V-type patterns decreased with decreasing amylose content. The transition of the XRD diffractograms of starch from the A-type to the V-type clearly demonstrates a structural alteration in the starch following extrusion. Furthermore, this shift reinforces the finding that ER exhibited a reduced level of short-term retrogradation when assessed using the RVA. Changes in starch structure might be caused by a two-step mechanism of extrusion. The first step was to soften the structure of the amylopectin molecules during extrusion process under high temperature, and high water content. Second, the high shear stress during extrusion may lead to the breakdown of starch molecules. These structural changes might disrupt starch crystalline structures, resulting in the changes of XRD diffractograms. This assumption was supported by Zhang et al. (2014) who claimed that the XRD diffractograms were changed due to the destruction of the crystalline structures after IECT.
The relative crystallinity of all samples is also listed in Table 2. Notably, the relative crystallinity decreased significantly from 32.8% in the control sample to 12.3% in the 0% CS sample, further decreasing to 10.6% for 10% CS, 8.7% for 20% CS, and ultimately reaching 3.31% for 30% CS. This trend indicates that ER exhibited lower relative crystallinity compared to the control, confirming the loss of crystalline structure during extrusion, which was consistent with our observations from XRD diffractograms. Additionally, it was evident that the relative crystallinity of ER decreased proportionally with the increasing amount of CS. This decrease in relative crystallinity can be attributed to the reduction in lipid and protein content in ER as the CS content rises. Consequently, ER may be more prone to gelatinization and degradation during the extrusion process, resulting in a decrease in relative crystallinity.
3.5 DSC analysis
DSC is an useful thermal analysis method to study the gelatinization characteristics of starches, and the results are summarized in Table 2. In comparison with the control, the gelatinization temperatures [Onset temperature (To), Peak temperature (Tp), Conclusion temperature (Tc)] and gelatinization enthalpy were decreased in ER, but the degree change of gelatinization (DG) increased to 76.36% when the content of CS was 30% after extrusion. The results indicated that the thermal properties of ER were different from control, and the pregelatinization of starch during extrusion process, which would lead to the decrease in gelatinization enthalpy (ΔHg) and the increase in DG, respectively. The decrease in ΔHg also proved that the crystalline and helical structures were disrupted, which was consistent with the XRD results. As shown in Table 2, it is evident that the ΔHg of the control sample was 7.15 J/g. Notably, with the increment of CS content from 0 to 30%, the ΔHg values decreased significantly, ranging from 3.85 J/g to 1.69 J/g. This indicated that the loss of ΔHg between the control and ER samples was relatively greater than the loss among different ER samples. The observed increase in ΔHg could be attributed to the presence of native starch granules embedded within the gelatinized matrix of ER, which effectively hinders the swelling of native starch. This observation was in agreement with the previous results of Charoenrein and Preechathammawong (2012) who declared that the highly swollen starch granules of waxy rice flour were distributed and covered rice starch granules, retarding the process of gelatinization. Similar conclusion was also observed by Ayoub et al. (2013).
3.6 Texture profile analysis
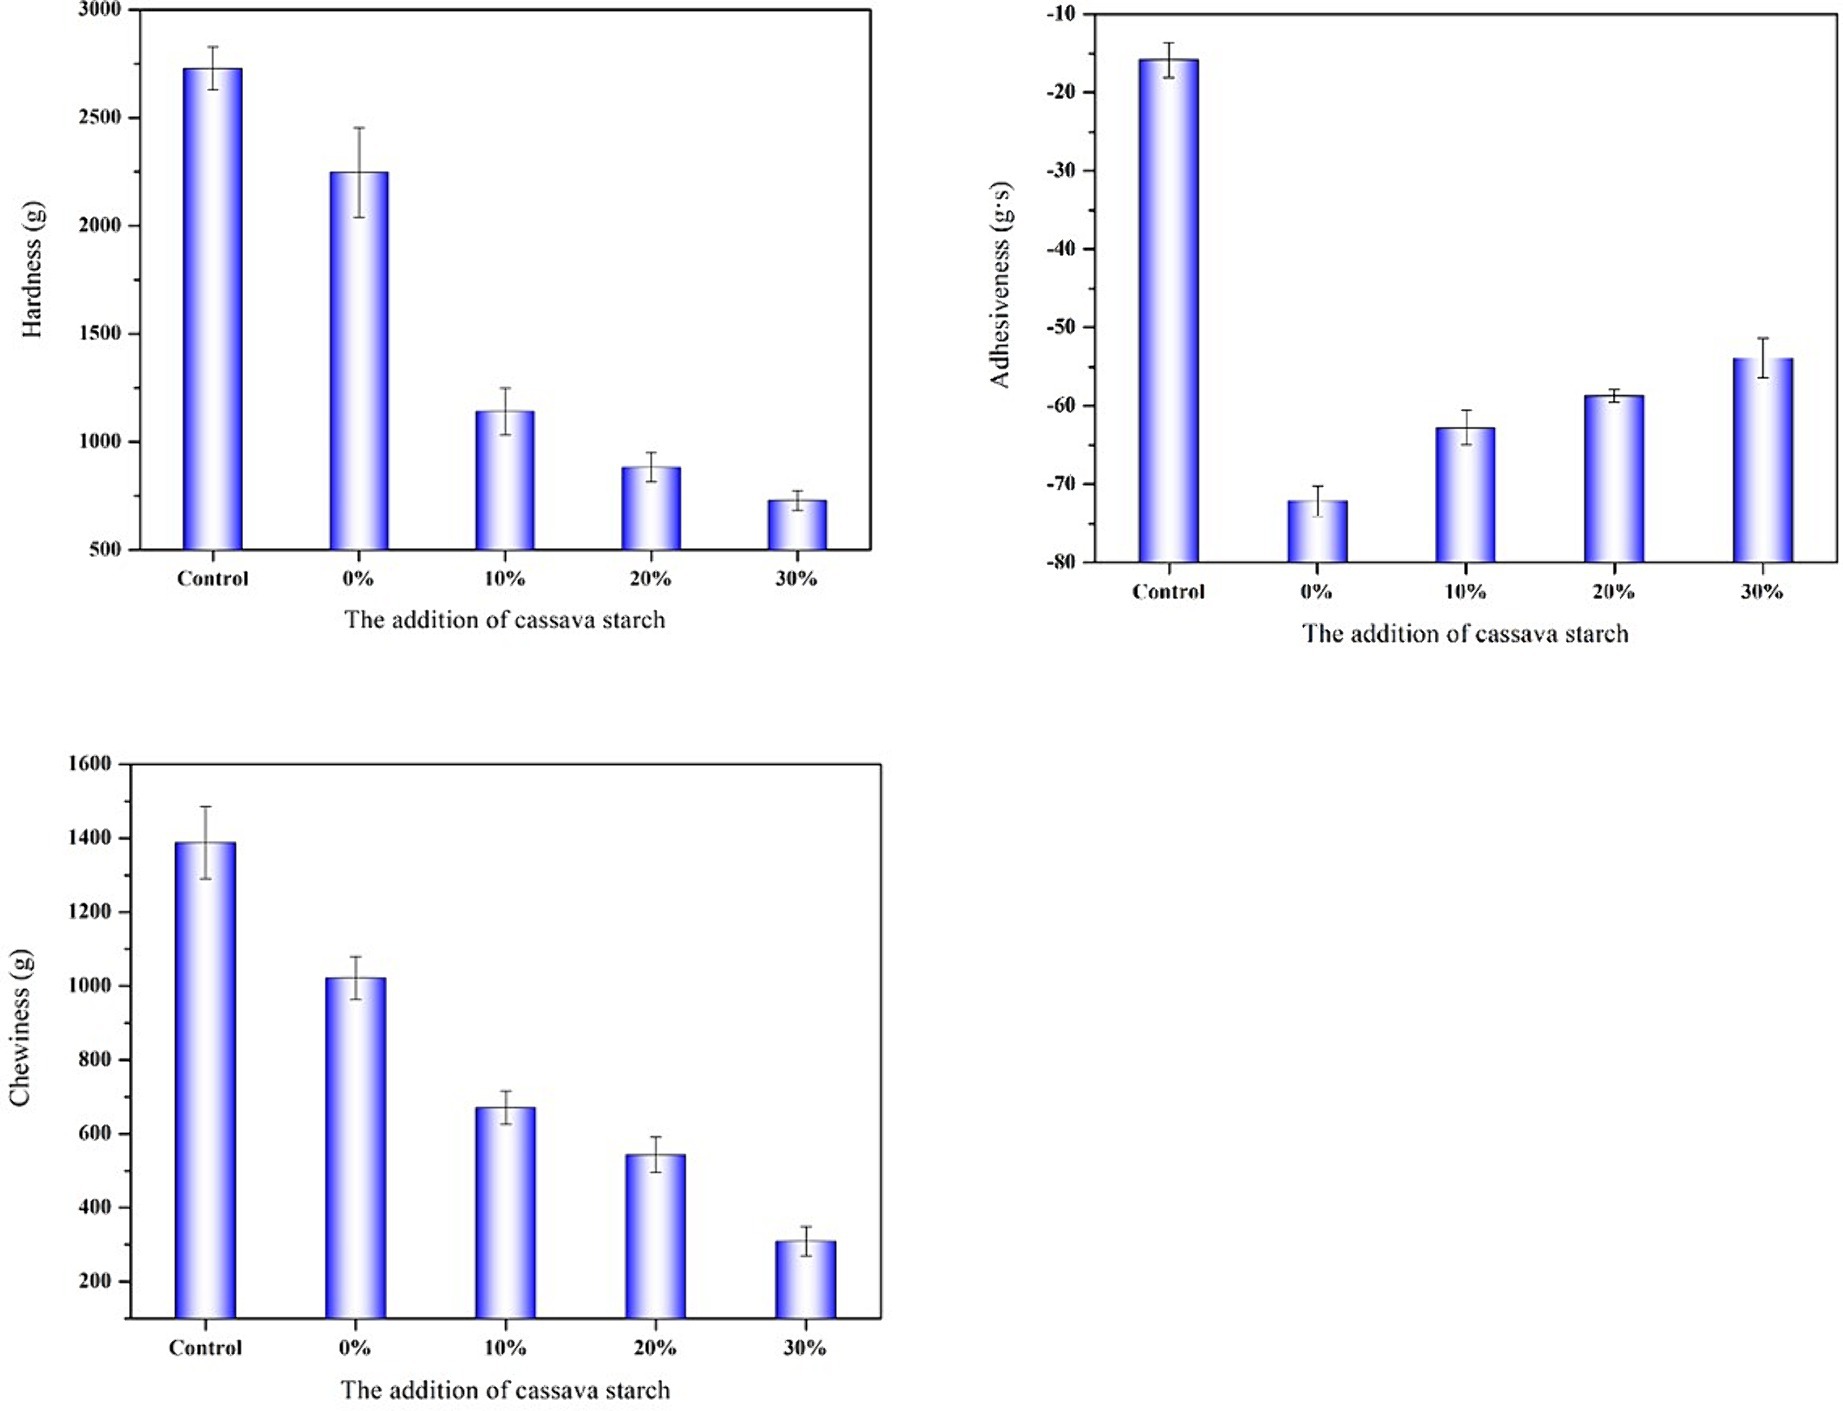
Figure 4 presents the hardness, adhesiveness, and chewiness measurements of the samples. The cooked control sample exhibited a firmer texture compared to all the ER grains. This observation could be attributed to the loose and porous structure of ER, which allowed water molecules to react more easily with starch, resulting in better swelling than the control sample. Consequently, the structure of the ER matrix softens, leading to softer products (Ayoub et al., 2013). However, as the CS content in ER increases, a decrease in hardness is observed. This finding can be explained by the lower retrogradation tendency of ER when CS is substituted, as previously demonstrated through RVA results. A higher degree of retrogradation typically correlates with increased hardness (Xia et al., 2014). Another contributing factor may be the decrease in lipid and protein content with increasing CS in ER. Lipids and proteins form complexes with amylose, stabilizing the structure of starch granules and limiting their swelling, thus enhancing the texture (Pilli et al., 2016).
Chewiness is a parameter that is positively correlated with how easy food can be disintegrated in the mouth (Pongjaruvat et al., 2014). Results showed that the value of ER was consistently lower than control, indicating that control sample was harder to be broken down. Moreover, the value of chewiness decreased with the increasing CS in ER. This observation indicated that ER was easier to be broken down as CS content increased, which was consistent with the results obtained from SEM.
In terms of adhesiveness, which looks at the internal strength of the gelatinized starch matrix (Ayoub et al., 2013). ER showed a lower adhesiveness than control, indicating the internal strength of the gelatinized starch matrix was weaker, which was also confirmed from the previous result of SEM. The adhesiveness of ER increased with the increasing amount of CS which were consistent with the result obtained from RVA. It may be due to high amylopectin content of CS, resulting in an increase of adhesiveness, which agreed with the findings of Dalonso and de Oliveira Petkowicz (2014) who reported that the higher the amylopectin content of starch, the higher viscosity could be obtained. Amylopectin has a complex network structure and stronger intermolecular forces, resulting in greater adhesiveness.
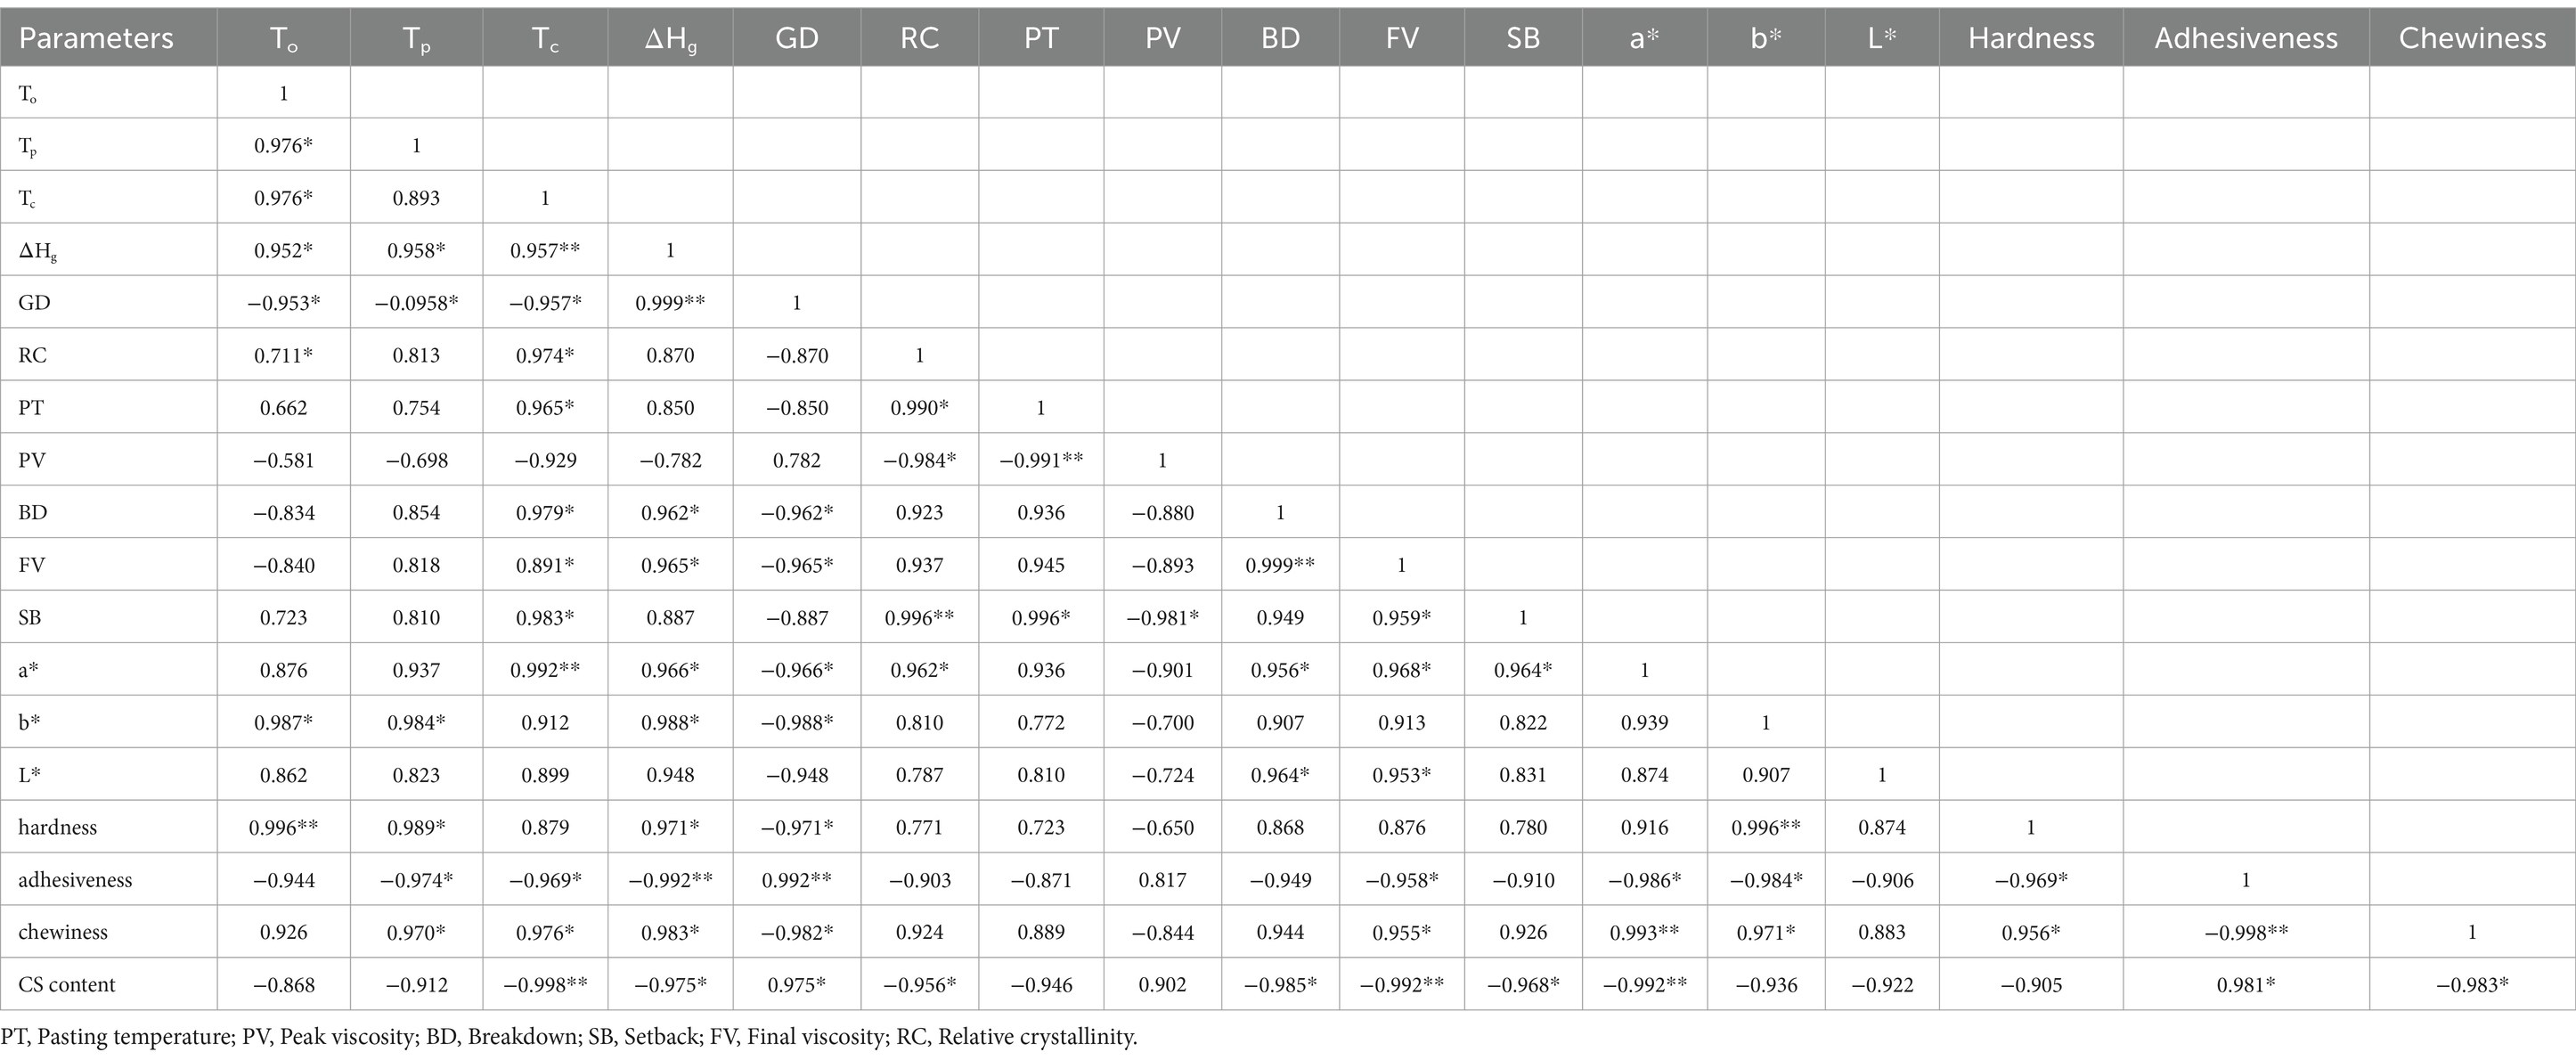
3.7 Pearson correlations among structural and physicochemical properties
We could observe several strong correlations from the Pearson correlation analysis among the 18 structural and physicochemical properties of ER, which were listed in Table 4. Significant and positive correlations were obtained between RC and Tc, PT, a*, and SB; between GD and CS addition amount, adhesiveness, ΔHg; between hardness and T, Tp, ΔHg, and b*; between chewiness and hardness, b*, a*, FV, ΔHg, and Tc. Meanwhile negative and significant correlations were found between adhesiveness and Tp, Tc, ΔHg, FV, a*, b* and hardness; between GD and BD, FV, a*, b*, hardness, chewiness, To, Tp and Tc. Especially, the addition level of CS in ER was significantly and negatively correlated with the RC, PT, Tc, ΔHg, BD, FV, SB, a* and chewiness, while positive and significant correlations were found with GD and adhesiveness, suggesting that the structure and physicochemical properties of ER could be adjusted by simply controlling the amount of CS. This could provide some reference for obtaining ER with different properties in actual production.
4 Conclusion
In this study, a new extruded rice with lower aging rate and convenient nutrient fortification through using cassava starch and broken rice flour was developed, and the physicochemical properties of the ER were also investigated. The results showed that the color of ER was a little darker with the substitution of CS. The gelatinization temperature and ΔHg decreased with the increasing CS in ER. DG increased after extrusion which was in accordance with the results of loss crystallinity obtained from XRD. TPA analysis revealed that ER with the substitution of CS could soften the structure of starch matrix, and give rise to a softer product. RVA analysis suggested that the FV and SB decreased with the increasing of CS in ER, which indicated a lower tendency towards retrogradation in comparison with the control. With an increase in CS content, the microstructure of ER exhibited a looser and more porous structure. This suggested that ER would be more easily to cook and could fortify with functional ingredients through spraying nutrients, such as calcium, iron, zinc, selenium, to raise its nutritional value and bring about potential health benefits than normal rice grains. These observations indicated that ER grains with a promising potential for fortification because of the porous structure of the grains. Also, ER grains showed good cooking quality including quick cooking property which could saving energy for cooking and maintenance of good texture after cooking because of slow retrogradation due to CS added. High amylose rice varieties easily harden upon cooling, so maintaining a soft texture at room temperature, is an ideal attribute. In addition, it is probable that the required structural and physicochemical properties of ER might be predicted by controlling the addition level of CS in ER as described by Pearson correlation analysis. In the future, we would conduct further research, such as nutritional enhancement and quality evaluation of this ER.
Data availability statement
The original contributions presented in the study are included in the article/supplementary material, further inquiries can be directed to the corresponding authors.
Author contributions
WX: Conceptualization, Data curation, Methodology, Writing – original draft, Writing – review & editing. YaL: Data curation, Methodology, Writing – review & editing. FW: Conceptualization, Supervision, Writing – review & editing. YuL: Visualization, Writing – review & editing. RL: Supervision, Writing – review & editing.
Funding
The author(s) declare financial support was received for the research, authorship, and/or publication of this article. The authors thanks for the financial support provided by the program for scientific research start-up funds of Guangdong Ocean University (Grant No. 060302042309), Guangdong Basic and Applied Basic Research Foundation (Grant No. 2020A1515011376), the National Natural Science Foundation of China (No. 31601397).
Conflict of interest
The authors declare that the research was conducted in the absence of any commercial or financial relationships that could be construed as a potential conflict of interest.
Publisher’s note
All claims expressed in this article are solely those of the authors and do not necessarily represent those of their affiliated organizations, or those of the publisher, the editors and the reviewers. Any product that may be evaluated in this article, or claim that may be made by its manufacturer, is not guaranteed or endorsed by the publisher.
References
AOAC (2005). Official methods of analysis of the AOAC international. Methods 934.01, 968.06, 920.39 and 942.02, 18th Association of Official Analytical Chemists, Gaithersburg, MD.
Ayoub, A., Liu, Y. K., Miller, D. D., and Rizvi, S. S. H. (2013). The effect of low shear on the development of fortified extruded rice product. Starch-Starke 65, 517–526. doi: 10.1002/star.201200101
Charoenrein, S., and Preechathammawong, N. (2010). Undercooling associated with slow freezing and its influence on the microstructure and properties of rice starch gels. J. Food Eng. 100, 310–314. doi: 10.1016/j.jfoodeng.2010.04.014
Charoenrein, S., and Preechathammawong, N. (2012). Effect of waxy rice flour and cassava starch on freeze-thaw stability of rice starch gels. Carbohyd. Polym. 90, 1032–1037. doi: 10.1016/j.carbpol.2012.06.038
Dalonso, N., and de Oliveira Petkowicz, C. (2014). Guarana powder polysaccharides: characterization and rheological properties of starch. Starch-Starke 66, 914–922. doi: 10.1002/star.201300289
Gulzar, B., Hussain, S. Z., Naseer, B., and Naik, H. R. (2021). Enhancement of resistant starch content in modified rice flour using extrusion technology. Cereal Chem. 98, 634–641. doi: 10.1002/cche.10407
Kong, B. H., Niu, H. I., Sun, F. A., Han, J. C., and Liu, Q. (2016). Regulatory effect of porcine plasma protein hydrolysates on pasting and gelatinization action of corn starch. Int. J. Biol. Macromol. 82, 637–644. doi: 10.1016/j.ijbiomac.2015.10.026
Li, W. H., Tian, X. L., Liu, L. P., Wang, P., Wu, G. L., Zheng, J. M., et al. (2015). High pressure induced gelatinization of red adzuki bean starch and its effects on starch physicochemical and structural properties. Food Hydrocolloid. 45, 132–139. doi: 10.1016/j.foodhyd.2014.11.013
Liu, Y., Chen, J., Luo, S., Li, C., Ye, J., and Liu, C. (2017). Physicochemical and structural properties of pregelatinized starch prepared by improved extrusion cooking technology. Carbohyd. Polym. 175, 265–272. doi: 10.1016/j.carbpol.2017.07.084
Moraes, C. A., Fernandes, I. J., Calheiro, D., Kieling, A. G., Brehm, F. A., Rigon, M. R., et al. (2014). Review of the rice production cycle: by-products and the main applications focusing on rice husk combustion and ash recycling. Waste Manag. Res. J. Int. Solid Wast. Public Clean. Assoc. 32, 1034–1048. doi: 10.1177/0734242x14557379
Pilli, T. D., Giuliani, R., Buléon, A., Pontoire, B., and Legrand, J. (2016). Effects of protein–lipid and starch-lipid complexes on textural characteristics of extrudates based on wheat flour with the addition of oleic acid. Int. J. Food Sci. Tech. 51, 1063–1074. doi: 10.1111/ijfs.13070
Pongjaruvat, W., Methacanon, P., Seetapan, N., Fuongfuchat, A., and Gamonpilas, C. (2014). Influence of pregelatinised tapioca starch and transglutaminase on dough rheology and quality of gluten-free jasmine rice breads. Food Hydrocolloid. 36, 143–150. doi: 10.1016/j.foodhyd.2013.09.004
Simsek, S. T. (2022). Vacuum modification of partial-baked wheat bread: evaluation of the physicochemical, microstructural properties and acrylamide content. J. Cereal Sci. 105:103467. doi: 10.1016/j.jcs.2022.103467
Sun, D., and Yoo, B. (2015). Effect of tapioca starch addition on rheological, thermal, and gelling properties of rice starch. LWT-Food Sci. Technol. 64, 205–211. doi: 10.1016/j.lwt.2015.05.062
Tao, K. Y., Yu, W. W., Prakash, S., and Gilbert, R. G. (2020). Investigating cooked rice textural properties by instrumental measurements. Food Sci. Hum. Well. 9:6. doi: 10.1016/j.fshw.2020.02.001
Wu, K., Gunaratne, A., Gan, R. Y., Bao, J. S., Corke, H., and Jiang, F. T. (2017). Relationships between cooking properties and physicochemical properties in brown and white rice. Starch-Stärke. 70:1700167. doi: 10.1002/star.201700167
Xia, W., Chen, J., He, D. N., Wang, Y. Y., Wang, F., Zhang, Q., et al. (2019). Changes in physicochemical and structural properties of tapioca starch after high speed jet degradation. Food Hydrocolloid. 95, 98–104. doi: 10.1016/j.foodhyd.2019.04.025
Xia, W., Fu, G. M., Liu, C. M., Zhong, Y. J., Zhong, J. Z., Luo, S. J., et al. (2014). Effects of cellulose, lignin and hemicellulose on the retrogradation of rice starch. Food Sci. Technol. Res. 20, 375–383. doi: 10.3136/fstr.20.375
Xia, W., Wang, F., Li, J. H., Wei, X. Y., Fu, T. K., Cui, L. H., et al. (2015). Effect of high speed jet on the physical properties of tapioca starch. Food Hydrocolloid. 49, 35–41. doi: 10.1016/j.foodhyd.2015.03.010
Xiao, Y. W., Jia, F. G., Meng, X. Y., and Han, Y. L. (2023). Breakpoint planning method for rice multibreak milling. Food Secur. 12:1864. doi: 10.3390/foods12091864
Zhang, Y. J., Liu, W., Liu, C. M., Luo, S. J., Li, T., and Liu, Y. F. (2014). Retrogradation behaviour of high-amylose rice starch prepared by improved extrusion cooking technology. Food Chem. 158, 255–261. doi: 10.1016/j.foodchem.2014.02.072
Zhang, Y. J., Zuo, H. Y., Xu, F., Zhu, K. X., and Wu, G. (2020). The digestion mechanism of jackfruit seed starch using improved extrusion cooking technology. Food Hydrocolloid. 110:106154. doi: 10.1016/j.foodhyd.2020.106154
Keywords: extruded rice, cassava starch, broken rice flour, porous structure, retrogradation
Citation: Xia W, Lin Y, Wang F, Liu Y and Liu RH (2024) Preparation and physicochemical properties: a new extruded rice using cassava starch and broken rice flour. Front. Sustain. Food Syst. 8:1383012. doi: 10.3389/fsufs.2024.1383012
Edited by:
Elena Velickova, Saints Cyril and Methodius University of Skopje, North MacedoniaReviewed by:
Mishela Temkov, Saints Cyril and Methodius University of Skopje, North MacedoniaAsad Mohammad Amini, University of Kurdistan, Iran
Copyright © 2024 Xia, Lin, Wang, Liu and Liu. This is an open-access article distributed under the terms of the Creative Commons Attribution License (CC BY). The use, distribution or reproduction in other forums is permitted, provided the original author(s) and the copyright owner(s) are credited and that the original publication in this journal is cited, in accordance with accepted academic practice. No use, distribution or reproduction is permitted which does not comply with these terms.
*Correspondence: Fei Wang, cmFpbi13ZkAxNjMuY29t; Rui Hai Liu, cmwyM0Bjb3JuZWxsLmVkdQ==
 Wen Xia
 Yanyun Lin3
