 Fang Xu
 Xiaoyong Ni
 Kai Liu
 Ming Wang1,3
 Kangye Tan
 Jun Hu
- 1Joint International Research Laboratory of Catastrophe Simulation and Systemic Risk Governance, Beijing Normal University, Zhuhai, China
- 2School of National Safety and Emergency Management, Beijing Normal University, Zhuhai, China
- 3School of National Safety and Emergency Management, Beijing Normal University, Beijing, China
- 4School of Business, Macau University of Science and Technology, Taipa, Macau SAR, China
Introduction: Emergent crises can have a catastrophic impact on regional economic systems. The concurrent outbreaks of African Swine Fever (ASF) and the COVID-19 pandemic have severely affected Macau’s pork industry, making it an interesting case study for analyzing the effects of simultaneous emergent crises on food prices.
Methods: The study utilized a comprehensive dataset spanning from March 30, 2018, to April 15, 2022. The analysis employed the Ensemble Empirical Mode Decomposition (EEMD) method to decompose the pork price data into high-frequency, low-frequency, and trend components, while the Bai-Perron test pinpointed key events and regulatory interventions affecting pork prices.
Results: The findings revealed that short-term market fluctuations had a limited impact on pork price dynamics, with primary drivers being long-term and low-frequency emergencies. The Bai-Perron test identified four significant emergencies or regulatory policies as critical turning points, segmenting the price series into five distinct phases. The results highlight the importance of considering long-cycle emergencies when assessing their impact on food prices and underline the need for more resilient agricultural supply chains.
Discussion: The study provides insights into how compounded emergent crisis threats impact market behavior and offers policy recommendations for enhancing market stability. Recommendations include strengthening cross-regional epidemic control, investing in vaccine research, optimizing cold chain logistics, updating legal frameworks, and improving emergency preparedness. The implications of these findings are relevant for similar regions facing concurrent health and economic crises, contributing to a better understanding of crisis management and market stability maintenance.
1 Introduction
The fluctuation of food prices bears considerable implications for socioeconomic stability, as irregular price dynamics can detrimentally affect societal welfare and productivity, ultimately leading to issues such as soaring inflation and social unrest. Historical instances, including the French Revolution (Rudé, 1964), the collapse of the Confederacy (Smith, 2011), the Russian Revolution (Wade, 2017), and the collapse of British India (Arnold, 1979), have been attributed to food riots. In the cases of recent times, a notable example is the emergence of Bovine Spongiform Encephalopathy (BSE) in Canada in May 2003, which precipitated a precipitous decline in the value of beef cattle from May to July, with stability only regained by August 2003 (Saha and Mitura, 2008). Similarly, the outbreak of the Highly Pathogenic Avian Influenza (HPAI) strain H5N1 in Indonesia in January 2004 had a profound impact on broiler and poultry meat markets, leading to a stark depreciation in sales prices, ranging from 50% to 85%, and persisting unabated until April of the same year, followed by a gradual recovery to 50% of pre-outbreak levels within the subsequent four months (Otte et al., 2009).
Within the framework of the global industrial chain, the repercussions of food price fluctuations exhibit unique characteristics when considered in the context of specific countries or regions. Macau, as a Special Administrative Region of China, possesses distinct development trajectories and attributes in politics, economy, and societal dimensions (Li and Zeng, 2015). Furthermore, Macau’s peculiar geographical location and its mono-structural economic system, which is heavily reliant on tourism, especially the gambling sector, render it particularly susceptible to the impact of exigencies (Lim and To, 2022). The concurrent occurrence of ASF and the COVID-19 pandemic in Macau, China, presents a unique case of the study period. The ASF virus, which significantly impacted swine populations across Asia before the advent of COVID-19, has been a major disruptor of pork supply chains (Ortega et al., 2009; Wang et al., 2014; Yu and Abler, 2014; Azzam and Dhoubhadel, 2022). The ramifications of ASF alone have resulted in substantial swine population reductions, subsequently compelling pork price hikes due to supply constraints (Ramsey et al., 2021). This market volatility has been exacerbated by the concurrent emergence of COVID-19, which introduced additional complexities into the economic landscape, affecting both supply-side logistics and consumer demand patterns (Holt and Craig, 2006; Wang et al., 2020). The ASF and COVID-19 crises have underscored vulnerabilities within agricultural supply chains, particularly in regions that are relatively independent in both geography and supply chain structure, highlighting the significance of fostering a more resilient agricultural system (Ma et al., 2021).
Epidemics and public health events, such as African Swine Fever (ASF) and COVID-19, present unique challenges to global supply chains, with particular implications for the global meat price market (Zhuang and Abbott, 2007; De and Koemle, 2015; Vatsa, 2022). This study is motivated by the need to address a research gap by analyzing the distinct impact of the simultaneous presence of ASF and COVID-19 on pork prices in Macau. By integrating the effects of these dual crises, this research aims to provide a more comprehensive understanding of the underlying dynamics, thus offering deeper insights into market behavior under compounded health threats. Furthermore, it seeks to illuminate the response mechanisms and experiences of special administrative regions during emergencies, offering valuable insights for other similar regions to draw upon. Specifically, our study addresses three pivotal areas that contribute to the understanding of pork price fluctuations during the concurrent occurrence of African Swine Fever (ASF) and the COVID-19 pandemic in Macau, China. (1) We systematically explore the combined effects of ASF and COVID-19 on pork price volatility. This dual focus is scarce in the existing literature, which often examines the economic impacts of health crises in isolation. By integrating these concurrent factors, our study provides a more holistic perspective on the impacts of the crises on agricultural markets. (2) This study represents the first endeavor to address the stability issues within the supply chain and industrial chain of Special Administrative Regions (SARs). Given the disparities in political, economic, and social systems between SARs and other regions, the challenges they face and the strategies they use may vary significantly. Our research not only bridges a gap in this field but also furnishes SAR governments, businesses, and pertinent stakeholders with valuable references and decision support. (3) By mapping out the interconnections between these health and economic crises, our research contributes valuable insights into effective policy and market strategies. These insights can aid in mitigating similar crises in the future, providing a foundation for more robust agricultural and economic systems.
This study is structured to explore the intricacies of analyzing pork price fluctuations during concurrent health crises. Section 2 gives a comprehensive literature review. Section 3 elaborates on the research methodology, with a particular emphasis on time-series analysis techniques. Section 4 outlines the study area, discussing the data selection and processing procedures in detail. In Section 5, the results are presented, with a specific focus on the application of the Ensemble Empirical Mode Decomposition (EEMD) and the Bai-Perron multiple structure breakpoint test. Section 6 and Section 7 discuss and conclude the study, respectively, synthesizing the insights obtained from the analysis and offering a comprehensive understanding of the subject matter.
2 Literature review
2.1 Characteristics of pork price fluctuations
The swine industry constitutes a cornerstone of rural development and income generation for farmers in China. Scholars have introduced the renowned “hog cycle” theory, an exemplary framework, to elucidate the cyclical fluctuations in pork prices (Coase and R. F., 1935). This theory posits that these fluctuations are intricately intertwined with the cyclical nature of swine production and the dynamic interplay of market supply and demand forces. While the “hog cycle” theory prevails, it is imperative to acknowledge that pork prices also exhibit subtle seasonal variations (Utnik-Banas et al., 2022). Furthermore, the pricing domain of pork encounters sporadic disruptions when confronted with external emergencies. A notable work elucidates how apparent animal epidemic outbreaks not only affect pork supply but also exert similar impacts through the dynamics of pork demand (Mason-D'Croz et al., 2020). This intricate interplay can largely be attributed to a decline in consumer confidence in pork quality and safety—a matter of profound significance. Additionally, government policy interventions often aim to address external emergencies, serving as pivotal factors influencing pork price fluctuations (Zhao and Xiong, 2017). Despite some examinations of the macroscopic aspects of pork price fluctuations, these inquiries primarily rely on qualitative methods to explore the phenomenon. Therefore, conducting a systematic investigation of this intricate issue and devising a quantitative framework holds considerable relevance in contemporary discourse.
2.2 Impact of emergencies on pork prices
Previous research has extensively investigated the impact of epidemic outbreaks on markets. Some scholars have pointed out that disease outbreaks can significantly affect swine production (Tian et al., 2007; Wang et al., 2020). Additionally, epidemic outbreaks have been found to influence pork trade (Niemi et al., 2006) and lead to biases against the origin of products (Kawashima and Puspito Sari, 2010), while prolonged trade bans can reduce pork supply (Niemi and Lehtonen, 2011). In August 2018, African Swine Fever (ASF) first emerged in multiple regions of China. Measures such as infection culling, disease-related mortality, and inter-provincial transport bans severely disrupted the pork market, resulting in significant supply–demand imbalances and profoundly affecting the swine industry (Hu and Guo, 2018). When COVID-19 emerged in December 2019, the continued impact of ASF had not yet been alleviated, exacerbating the effects on swine production, consumption, and pricing. The dual external shocks of ASF and COVID-19 are bound to bring a series of severe impacts to the pork market.
Furthermore, there are notable differences in the impact of ASF and the COVID-19 pandemic on pork market prices. In terms of scope and target, ASF primarily affects the production and supply of pigs, leading to a reduction in pig inventory and directly impacting the supply and price of pork. On the other hand, the COVID-19 pandemic mainly affects humans, especially the labor market and consumer behavior, thereby indirectly affecting the demand and supply of pork (Ma et al., 2022; Luo et al., 2023). In terms of response measures, ASF typically necessitates measures such as slaughtering infected pigs, isolating infected herds, and strengthening supervision to control the epidemic, which may lead to a short-term decrease in pork supply, thus affecting prices. Conversely, the COVID-19 pandemic usually requires restrictive measures to curb the spread of the virus (Mallory, 2021; Yang et al., 2021).
2.3 Practical methods for pork price fluctuation analysis
Currently, numerous studies use time series processing methods to analyze price fluctuations in the agricultural primary sector. However, there is a notable lack of empirical evidence provided for complex emergency situations, which is particularly evident in research that systematically addresses the intricate interactions between these fluctuations and multiple emergent factors. Furthermore, it is widely accepted that market turmoil is often manifested in the fluctuations of agricultural product prices, which inherently exhibit temporal variations. Consequently, time series processing methods offer a robust approach for quantitatively analyzing these complex temporal fluctuations.
Within this methodological scope, Variational Modal Decomposition, Wavelet Transformation, Fourier Transformation, and other classical signal processing techniques have garnered considerable acclaim for their proven effectiveness (Mijović et al., 2010; Lahmiri, 2014; Jianwei et al., 2017; Huang and Deng, 2021). Among these, Empirical Mode Decomposition (EMD) has emerged as a powerful contender. Distinct from other methods, EMD eliminates the necessity of predefined base functions, demonstrating significant advantages in deciphering non-linear and non-stationary signals or series (Huang et al., 1998). Since 2001, the EMD method has found widespread application in studying time series datasets across economic and social domains (Lu et al., 2016; Xue et al., 2019; Nie et al., 2020). Its applications encompass a broad range of functionalities, including the calculation of returns, examination of price trajectories, and exploration of economic indicators (Wang et al., 2020; Vatsa, 2022).
In addition to the EMD approach, the Ensemble Empirical Modal Decomposition (EEMD) method proposed in 2024 introduces a crucial enhancement approach (Wu and Huang, 2004). By introducing controlled white noise into the EMD process, the EEMD technique has demonstrated comparable mode decomposition performance to its predecessor, thereby gaining widespread adoption (Qin et al., 2019; Li et al., 2020; Liu et al., 2020). Furthermore, the EEMD method exhibits the potential for symbiotic integration with traditional models to improve predictive accuracy. For instance, the EEMD-FFH model coordinates EEMD with the multidimensional k-nearest neighbor method, autoregressive moving average models, and the quadratic regression models (Li et al., 2020). This synthesis results in greater robustness and superior performance. Similarly, the EEMD method can be combined with the wavelet neural network to integrate into a random time-effective function (Yang and Wang, 2021). This integration achieves more accurate predictive capabilities, particularly evident in the prediction of new energy prices (Chen and Huang, 2022).
2.4 Synthesis remarks and prospects
The extant literature has yielded a substantial corpus of research findings pertaining to the patterns of pork price fluctuations, the impact of sudden events on pork prices (Luo et al., 2023), and related facets, including the effectiveness of governmental policies in stabilizing markets (Hamilton and Kastens, 2000), the role of technological innovations in tracking and managing disease outbreaks in livestock (Chen et al., 2016), and the consumer psychology driving meat consumption patterns during health crises (Fliessbach and Ihle, 2020). Nevertheless, these studies are not without limitations. First, the investigation of pork price fluctuation patterns predominantly relies on traditional econometric models, including HP filtering (Utnik-Banas et al., 2022), regression models (Chen and Yu, 2018), and moving averages (Zhu et al., 2022), with scant exploration of the non-stationary and non-linear characteristics inherent in pork price sequences. Second, the extant analyses of pork price fluctuations primarily concentrate on factors such as costs and production levels, while scant attention is given to the ramifications of dual sudden event shocks.
In view of the above limitations and to address the uncertainty in the pork price problem gap, the primary aim of this study is to empirically investigate the complex relationship between fluctuations in pork prices and potential prolonged emergencies, utilizing the sophisticated EEMD methodology. This research seeks to uncover the underlying mechanisms of key turning points in pork price trends, employing the Bai-Perron multiple structure breakpoint test as a principal analytical tool. This method not only highlights the connections between price variations and evolving emergency scenarios but also provides valuable insights into the critical events that coincide with these pivotal changes. Such endeavors are crucial for enhancing our understanding of the intricate interactions between pork price dynamics and external crises.
3 Methodology
3.1 Overall structure
The overall structure of this study is shown in Figure 1. This study uses a multifaceted methodological approach, integrating four distinct methods to comprehensively analyze the time series data. The methods used are the Augmented Dickey–Fuller (ADF) test, the Ensemble Empirical Mode Decomposition (EEMD), the Fine-To-Coarse Reconstruction (FTC) method, and the Bai-Perron Multiple Structure Breakpoint Test (BP). Each method serves a unique purpose and contributes to the overall understanding of the data in a logical and sequential manner.
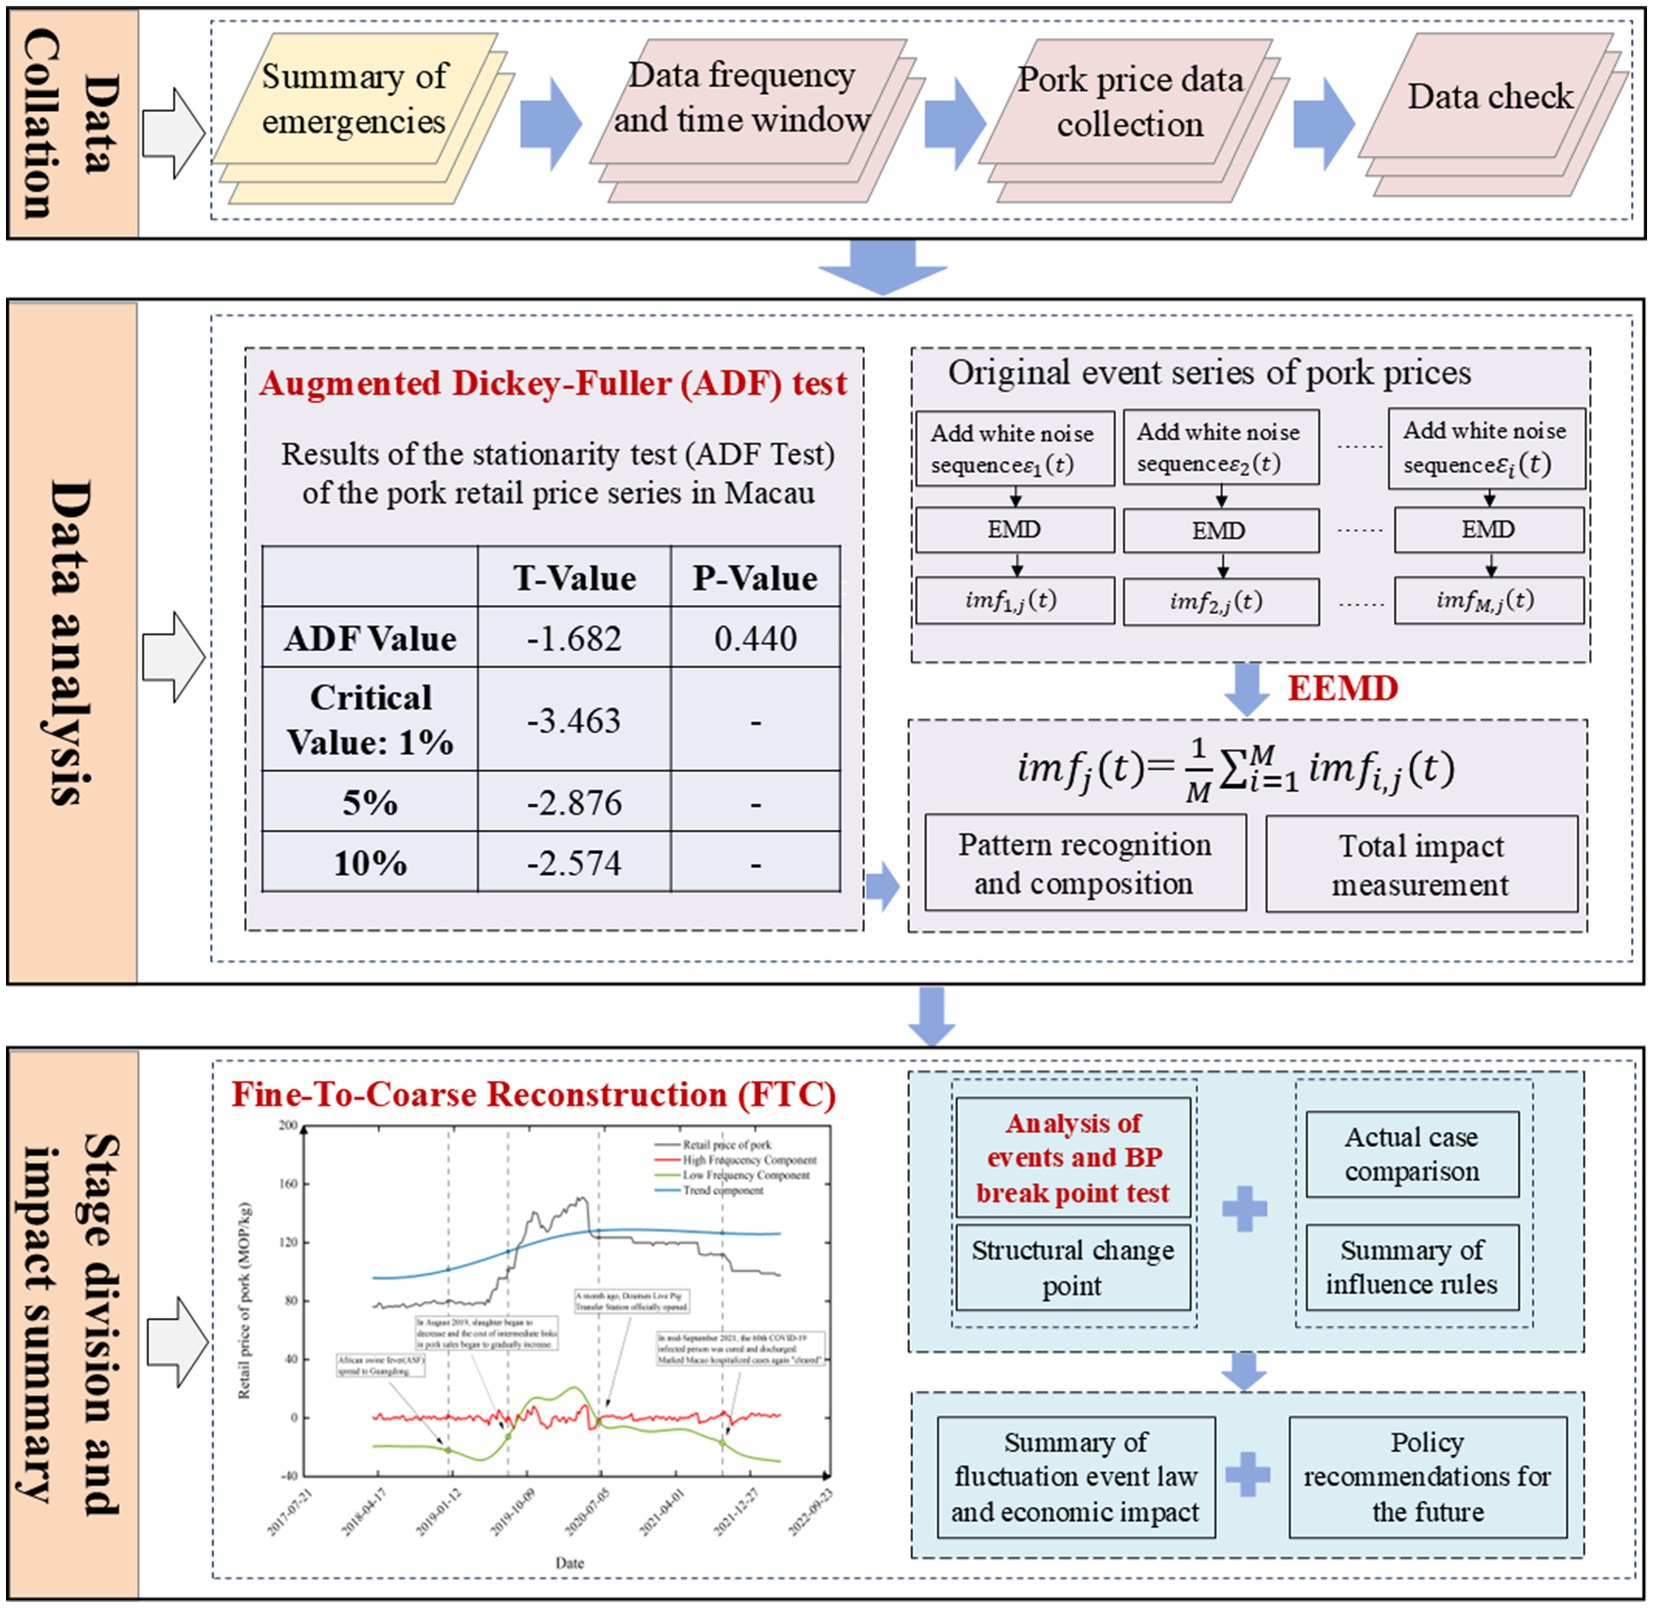
Figure 1. The overall structure of this study.
First, the ADF test is used to assess the stationarity of the data. This initial step is crucial as it determines whether the data are non-stationary, which is a fundamental assumption for many time series models. If the data are found to be non-stationary, further analysis is warranted to understand its underlying dynamics.
Subsequently, the EEMD method is applied to decompose the original time series into its intrinsic components. This process yields Intrinsic Mode Functions (IMFs) and one residual component. Descriptive statistics are then performed on these sequences to identify the dominant modes within the data, providing insights into the key drivers of variability.
Following the EEMD decomposition, the FTC method is utilized to reconstruct the sequences into distinct components: high-frequency, low-frequency, and trend components. Descriptive statistics are used to analyze these reconstructed components, revealing a high correlation between the low-frequency component and the original time series. This finding underscores the significance of the low-frequency dynamics in shaping the overall behavior of the data.
Finally, the BP breakpoint test is applied to the low-frequency component to identify statistically significant structural breakpoints. This step is crucial as it allows for the segmentation of the original time series into distinct phases, each with its own unique characteristics. The identification of such breakpoints leads to the division of the time series into several stages, facilitating a more nuanced understanding of its temporal evolution.
In summary, the methodology used in this study combines the ADF test, EEMD, FTC method, and BP breakpoint test in a logical sequence. Each method contributes to a deeper understanding of the data, from assessing its stationarity to identifying dominant modes, reconstructing components, and ultimately segmenting the time series into meaningful phases. This comprehensive approach enables a thorough analysis of the dynamics and characteristics of the data.
3.2 Multiscale analysis method
3.2.1 Examination of data stationarity: ADF test
The purpose of the Augmented Dickey–Fuller (ADF) test is to evaluate the stationarity of time series data pertaining to pork prices (Chen, 2014). This method extends the Dickey-Fuller (DF) test by addressing the issue of residual autocorrelation through the inclusion of lagged terms. Given that pork price data may exhibit trends and autocorrelation, the ADF test helps determine whether differencing the data is necessary to attain stationarity. Stationary time series data facilitate subsequent analysis using the EEMD method, providing a more accurate description of the underlying nature and patterns of price fluctuations. Hence, conducting the ADF test serves as an essential preprocessing step before applying the EMD method.
The ADF test is performed using the following three models, as shown in Equation (1–3) respectively:
Where Δyt = yt – yt-1, denotes the first difference of the time series yt, α denotes the constant term, βt denotes the time trend term, δ denotes the coefficient to be tested, θi denotes the lagged term coefficient, εt denotes the white noise error term, t denotes the time variable representing the trend of the time series. The difference between Equation (1–3) lies in whether a constant term and a trend term are included. In the ADF test:
H0: =0 (the series has a unit root; the series is non-stationary).
H1: <0 (there is no unit root in the series; the series is stationary).
The testing procedure begins with model (3) by comparing the absolute value of the ADF statistic with the critical value. If the calculated absolute value of the ADF statistic is less than the critical value, the model is simplified and the ADF statistic is recalculated, proceeding to test models (2) and (1). If the null hypothesis is rejected, the original series does not have a unit root and is considered stationary, and the testing stops. Otherwise, the testing continues until model (1) is tested.
3.2.2 Data decomposition: EEMD
Empirical Mode Decomposition (EMD), introduced by Huang et al. (1998), is a novel adaptive time-frequency signal processing method developed collaboratively at NASA and elsewhere. It is particularly well suited for analyzing and processing non-linear and non-stationary signals. On the other hand, EEMD addresses the shortcomings of the EMD approach by proposing a noise-assisted data analysis method (Wu and Huang, 2004, 2009).
The essence of the EEMD method lies in the repeated empirical mode decomposition with the addition of Gaussian white noise. Leveraging the statistically uniform frequency distribution characteristic of Gaussian white noise, this approach modifies the extreme point characteristics of the sequence by introducing different white noises with equal amplitudes into each iteration. Subsequently, the obtained IMFs from multiple EMD iterations are collectively averaged to counterbalance the added white noise, thereby effectively suppressing the generation of mode mixing.
The steps of the EEMD decomposition are outlined as follows.
Step1: Add a white noise sequence with a standard normal distribution to the original pork price time series to generate a new time series, as shown in Equation (4).
Step 2: Perform EMD decomposition separately for the sequences containing noise , resulting in multiple IMFs and one residual component, as shown in Equation (5).
In the equation, denotes the -th IMF obtained from the decomposition after adding white noise for the -th iteration, while denotes the residual function, reflecting the average trend of the pork price time series. denotes the total number of IMFs. In EMD, each IMF represents inherent oscillatory modes at different scales or frequencies within the original time series. Each IMF captures local features and oscillatory behavior in the data, and the summation of all IMFs reconstructs the original time series.
Step 3: Repeat Step 1 and Step 2 for iterations, each time decomposing the time series with white noise sequences of varying amplitudes to obtain a collection of IMFs, as shown in Equation (6).
Step 4: Utilize the principle of statistical averaging with zero-mean uncorrelated sequences, perform ensemble averaging on the corresponding IMFs obtained above, resulting in the final IMFs after EEMD decomposition, denoted as follows in Equations (7, 8):
where denotes the j-th IMF from the EEMD decomposition, where , and .
The reason for choosing EMD over other decomposition methods lies first in its suitability for non-linear and non-stationary data, and characteristics are exhibited by pork price data. Second, this method decomposes signals based on the inherent time scale features of the data, without the need to predefine any basis functions. This method stands in stark contrast to Fourier decomposition and wavelet decomposition methods, which rely on predetermined harmonic or wavelet bases. It is precisely due to this characteristic that each extracted oscillatory sequence can be interpreted in terms of specific factors or events in the real world. Compared with other methods, EEMD demonstrates superior capability in describing local time scale variations, which is crucial for characterizing the features and fluctuations of pork price data.
3.2.3 Sequence restructuring: FTC
Each IMF carries specific real-world implications, representing one component of the original pork price time series. Generally, the impact of sudden events on product prices is composed of several IMFs, with the sum of these IMFs regarded as the primary pattern for analysis (Zhang et al., 2008). Therefore, by eliminating the disruptive factors contained in the original time series and the long-term trends observed in reality, we observe the impact of sudden events on market prices and assess the extent of price changes in response to sudden event shocks.
Furthermore, determining the specific meaning of an IMF involves examining its average period and further analysis through statistical methods, spectral analysis, or the FTC method. It is important to note that adjacent IMFs with different time scales may express similar information. In cases where sudden events impact price sequences at different time scales, these IMFs with different time scales should be combined (Zhang et al., 2008). Consequently, several adjacent IMFs with higher frequencies form high-frequency components. In time series, high-frequency components correspond to rapid fluctuations and small-amplitude changes, which may reflect short-term market volatility and immediate supply–demand changes, typically representing short-term supply–demand equilibrium in the market. Conversely, several adjacent IMFs with lower frequencies form low-frequency components. Low-frequency components correspond to slow fluctuations and large-amplitude changes, which may reflect long-term market trends and the impact of significant events on the market, typically representing the influence of significant events. The residual sequence typically becomes the trend component, describing the long-term trend of pork prices, primarily determined by the macroeconomic environment.
The low-frequency IMFs obtained from EEMD decomposition exhibit strong periodic oscillations, whereas the high-frequency IMFs demonstrate random disorderliness. To identify the IMF at which the nature undergoes a fundamental change, we used the Fine-To-Coarse (FTC) recombination algorithm based on the work ofstudy by Zhang et al. (2008).
The steps of the FTC reconstruction method are as follows:
Step 1: After decomposing the original time series by EEMD, IMFs and a residual term are obtained, as shown in Equation (9). These IMFs and the residual term together represent all the information of the time series.
Step 2: Compute cumulative sums of the IMFs to obtain cumulative components , as shown in Equation (10).
Here, denotes the cumulative sum of the first IMFs. For example, , , and so on, .
Step 3: Perform a T-test on each to determine whether its mean significantly deviates from zero, as shown in Equation (11). This helps in classifying the cumulative components into high-frequency or low-frequency components.
Step 4: Based on the T-test results, classify IMFs into high-frequency and low-frequency components. The high-frequency component is denoted by , and the low-frequency component is denoted by , as shown in Equations (12, 13).
Here, denotes the index separating high-frequency and low-frequency components based on statistical testing results.
3.3 Phase segmentation: Bai-Perron multiple structure breakpoint test
The Traditional Chow test is based on the assumption of structural change points in the original time series and involves subjective identification of the number of such points, which may affect the credibility of the results (Chow, 1960). Hence, this study adopts the Bai-Perron structural break test method proposed by Bai and Perron as shown in Equation (14) (Bai and Perron, 1998, 2003). This method inserts BP structural breakpoints into the time series data to monitor gradients of price changes, dividing them into different time periods or intervals.
Here, denotes the explained variable. and denote the explanatory variable without structural change. and denote the corresponding regression coefficient. denotes the random error term. means that mutation points divide the observed sample series into sub-sample intervals.
Suppose there is an observable threshold variable q t that divides the subsamples as described above, and the threshold is increasing, that is, . An indicator function is defined. When the value of falls in the interval , , otherwise, . The number of breakpoints is unknown, and the estimated values of and are obtained by minimizing the sum of residual squares, as shown in Equation (15), so as to obtain the optimal number of breakpoints.
4 Study area and data
4.1 Study area
In the context of the global pork market, Macau, a region with a distinct status and economic backdrop, may exhibit unique dynamics within its pork market due to specific influencing factors. As shown in Figure 2, Macau, situated on the southeast coast of mainland China at the mouth of the Pearl River Delta, encompasses a total area of 33.0 square kilometers and hosts a population of 683,200. It stands as one of the two Special Administrative Regions (SARs) of the People’s Republic of China, alongside Hong Kong.
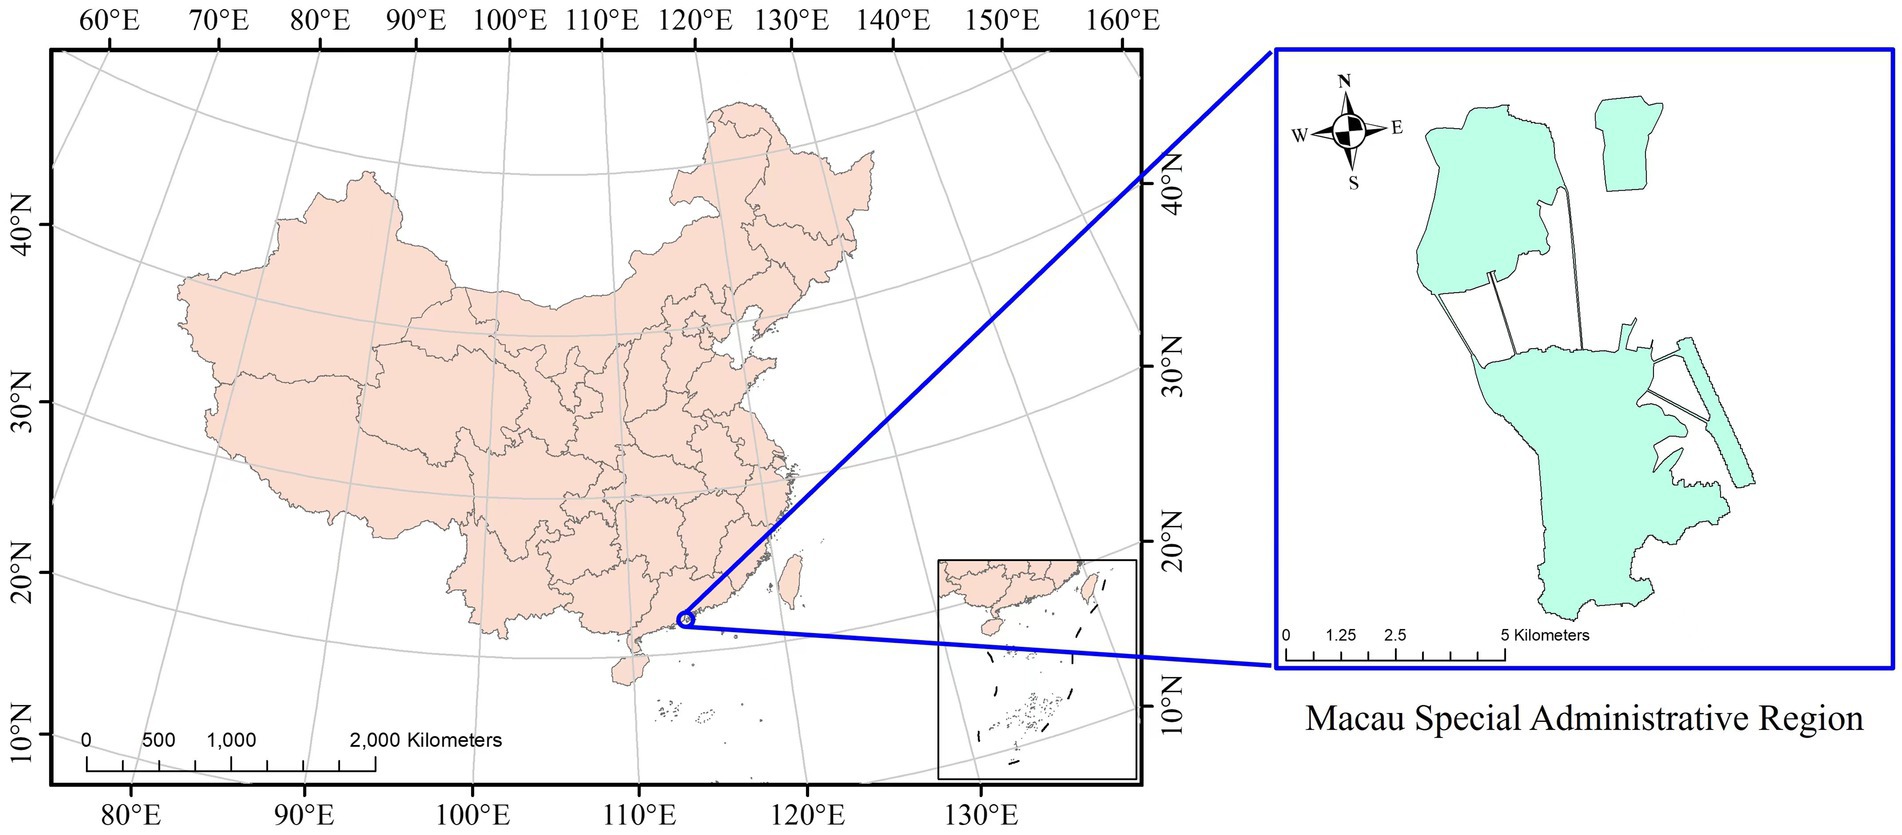
Figure 2. Geographical location of Macau Special Administrative Region of China.
Since its reversion from Portugal to China in 1999, Macau has maintained relatively stable economic exchanges with neighboring countries and Portuguese-speaking nations, as facilitated by its low tax system and policies promoting the free flow of funds. This economic environment has contributed to the relative stability of pork prices in Macau over the past 20 years before 2019 albeit with a gradual upward trend. However, the pork market in Macau underwent significant transformations following the outbreak of African Swine Fever (ASF) in China, which led to a 21.6% decrease in live pig sales and a 27.5% reduction in live pig inventory in 2019 (see Figure 3). Furthermore, the emergence of COVID-19 in early 2020 exacerbated these challenges. Specifically, in the first quarter of 2020, the number of slaughtered live pigs in Macau was 16,976 (see Figure 4), marking a decline of over 40% compared with the same period in the preceding year. Under the dual impact of these crises, pork prices in Macau experienced substantial volatility within a short timeframe, a phenomenon deserving close attention (see Figure 5).
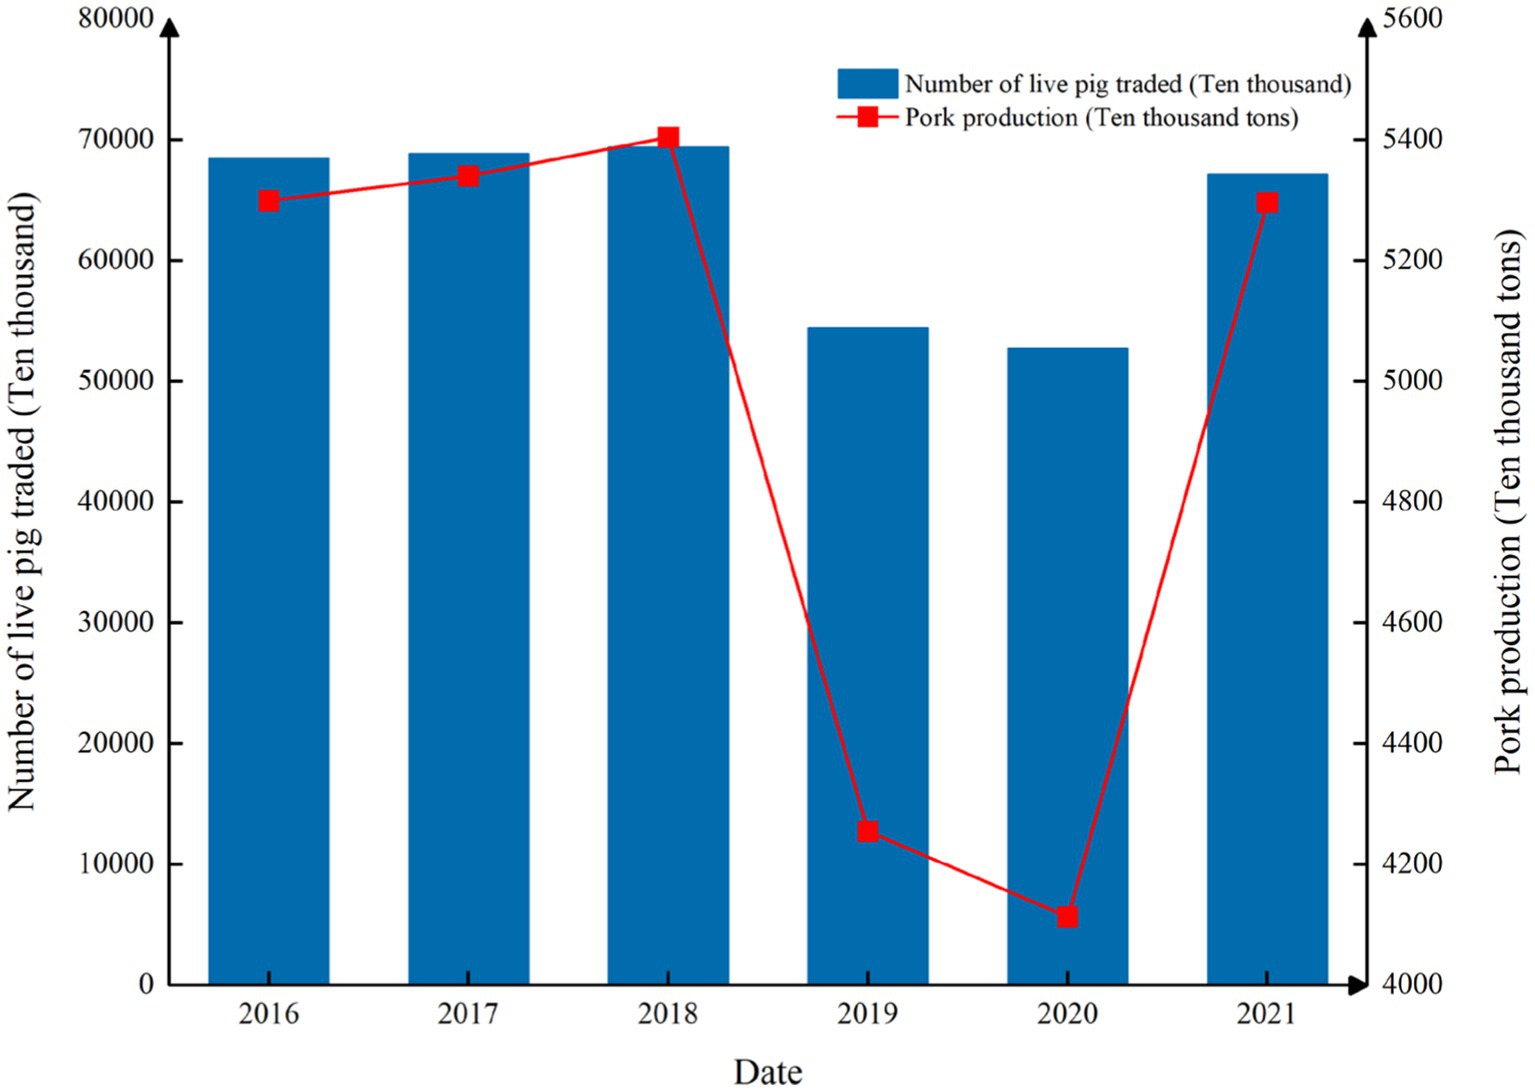
Figure 3. Annual live pig trade and pork production in Mainland China (referring to National Bureau of Statistics of China).
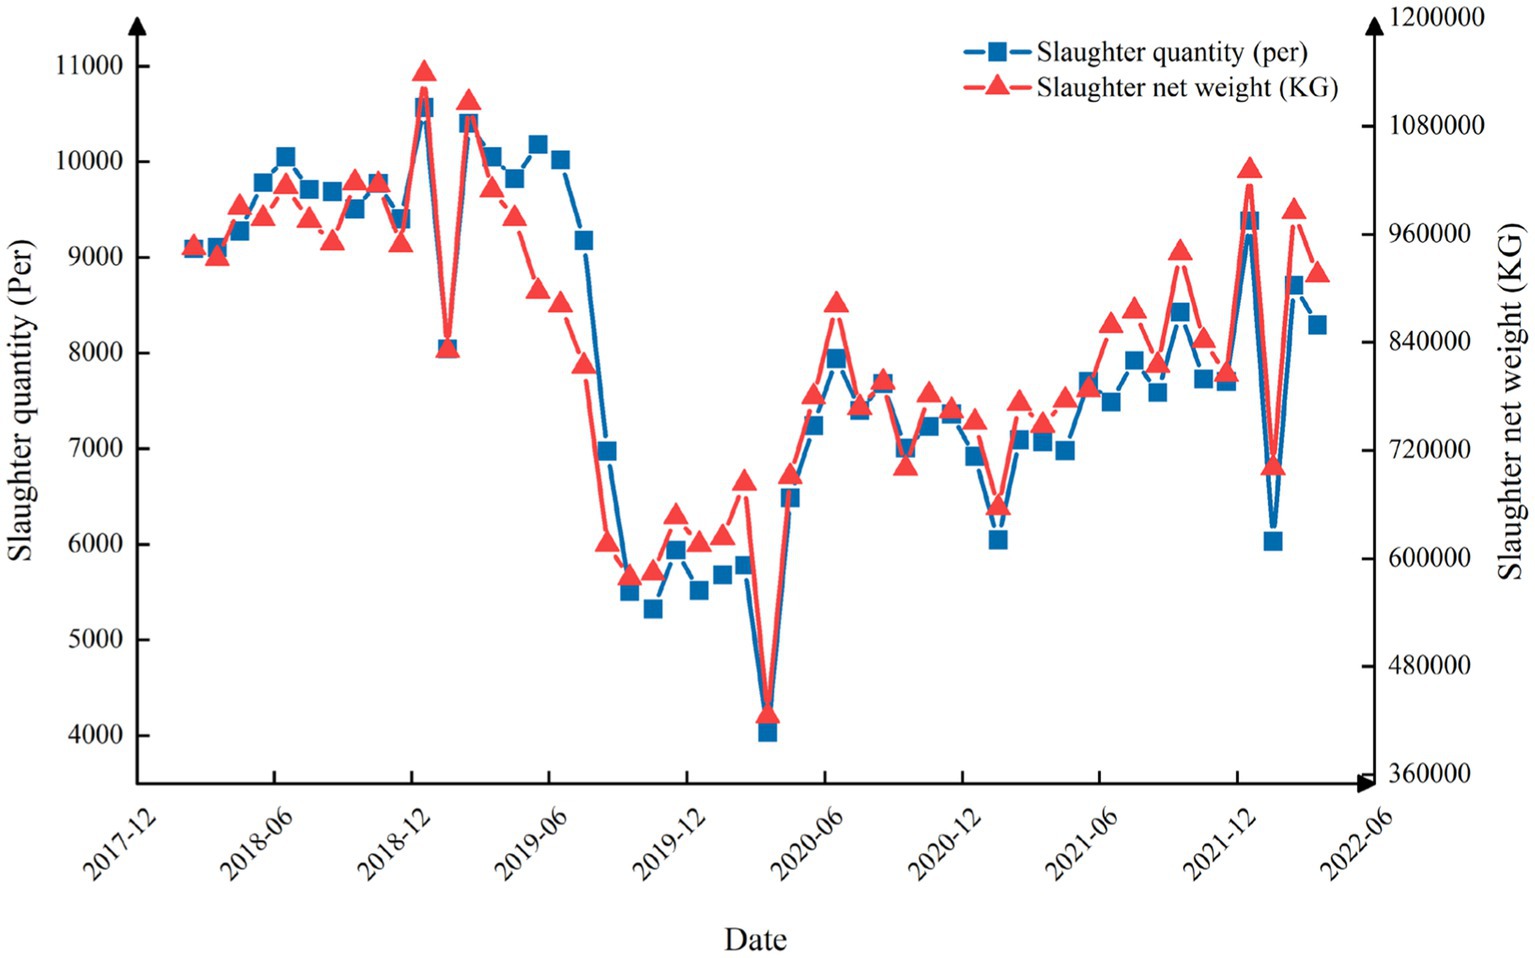
Figure 4. Monthly slaughter volume and slaughter weight in Macau (referring to Macau Monthly Bulletin of Statistics).
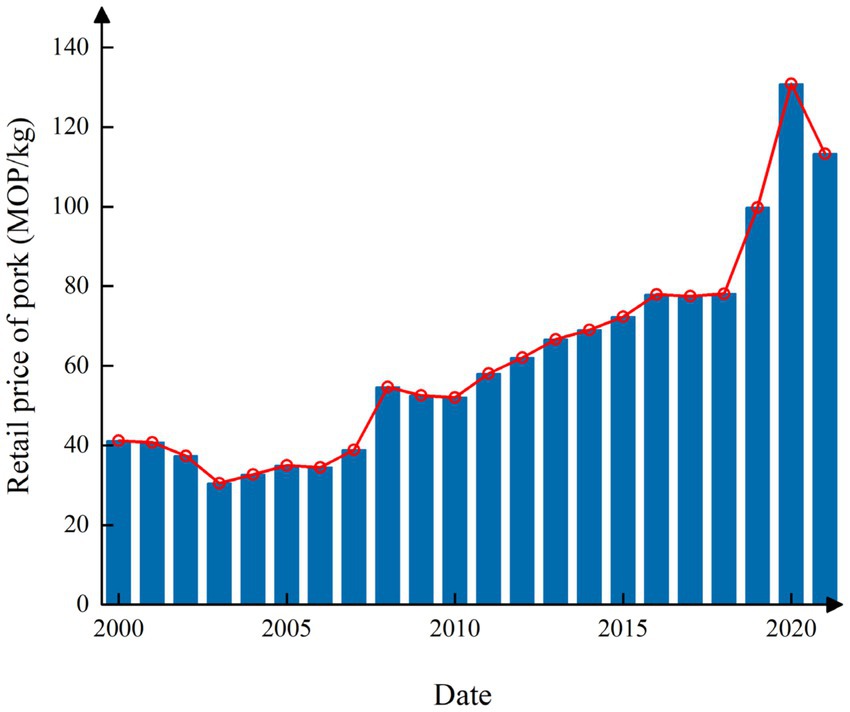
Figure 5. Pork retail price from 2000 to 2021 in Macau (referring to Macau SAR Government Consumer Council).
While the preceding analysis suggests a strong correlation between pork price fluctuations and market supply and demand dynamics, the quantitative relationship between pork price variability and societal emergencies remains unclear. Relevant research in this area is scarce, and societal occurrences can significantly influence pork supply, demand, and price fluctuations. From a quantitative analysis perspective, further investigation is necessary. Moreover, selecting Macau as the subject of this study offers valuable insights into the response mechanisms and experiences of special administrative regions during emergencies.
4.2 Data description and preprocess
4.2.1 Data description
Figure 6 depicts the process of ASF and COVID-19 pandemic. On 3 August 2018, the first case of ASF was reported in Shenyang City, Liaoning Province, China. Subsequently, as pigs were transported between provinces in China, ASF began to spread nationwide. On 15 December 2021, the last recorded outbreak of ASF was marked according to publicly available data from the Ministry of Agriculture and Rural Affairs. Therefore, the study period for ASF is defined from 3 August 2018 to 15 December 2021. Second, on 22 January 2020, the first confirmed case of COVID-19 was detected in Macau. By 2 December 2021, Macau had experienced 54 consecutive days without any new confirmed cases, and the social life gradually returned to normal as the COVID-19 situation eased. Hence, the study period for COVID-19 is defined from 22 January 2020 to 2 December 2021. Considering the two significant events, the study period for both events is set from 3 August 2018 to 15 December 2021. To further assess the impact of these events on the data and compare data trends and characteristics before and after the events, the author extended the time series to 4 months before and after each event. Consequently, the final analysis period for the impacts of ASF and COVID-19 is set from 30 March 2018 to 15 April 2022.
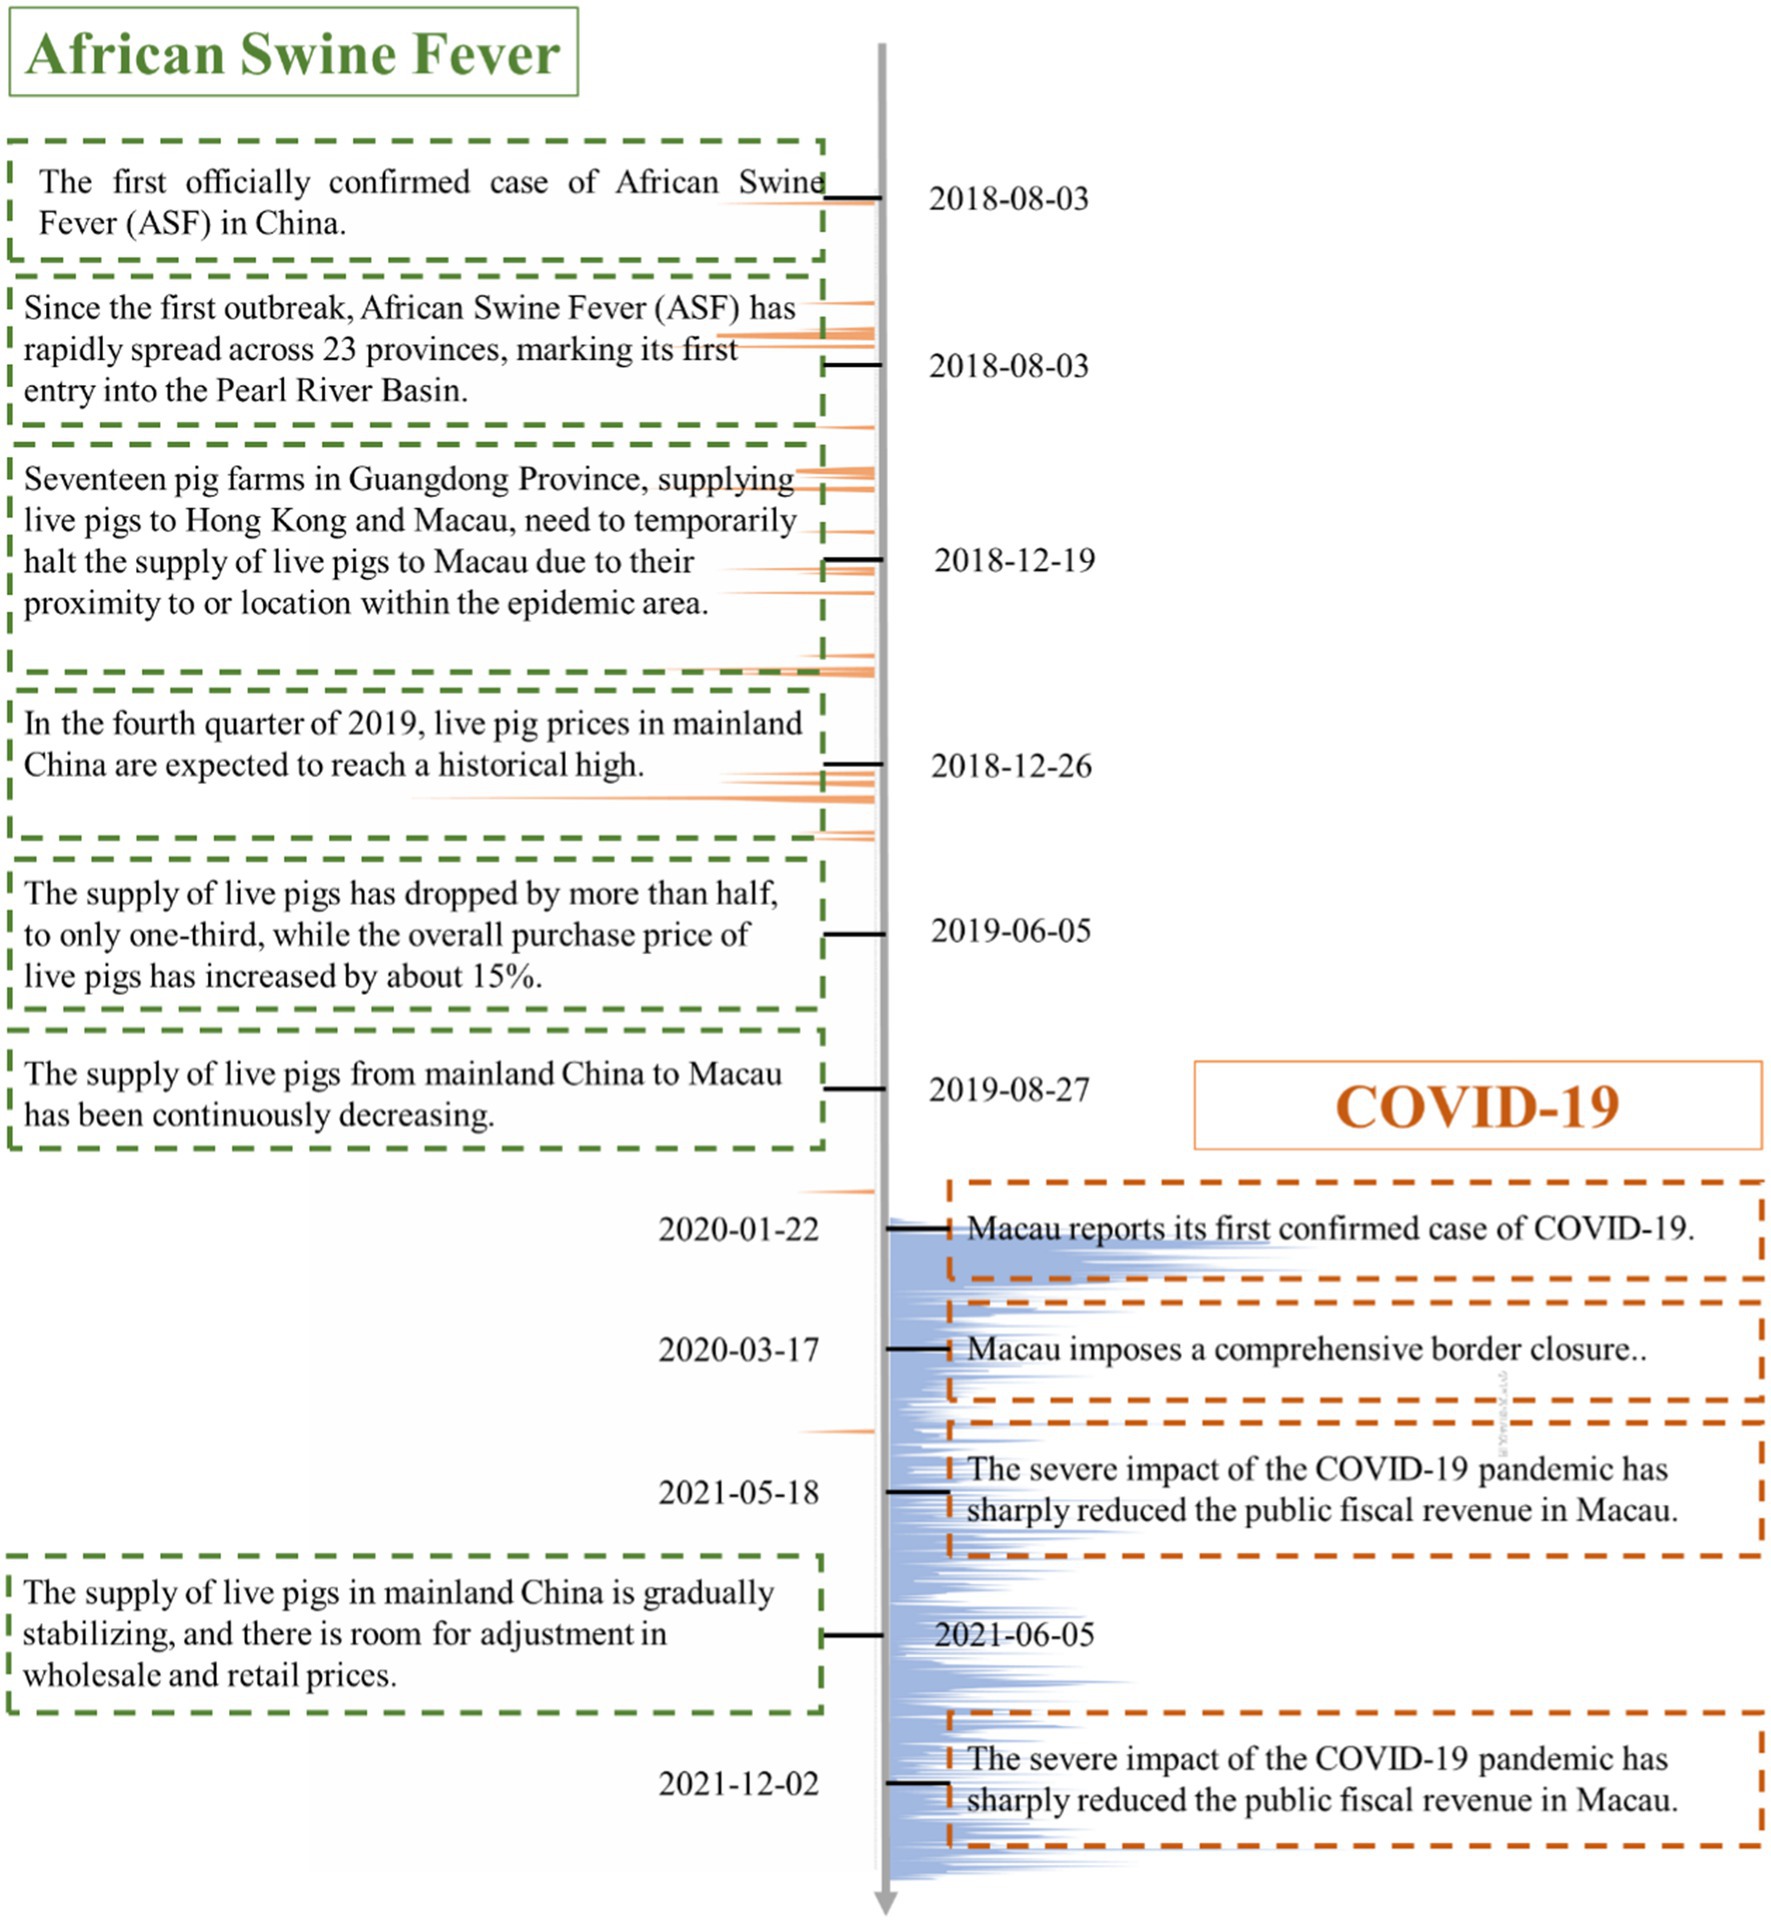
Figure 6. Process of ASF and COVID-19 pandemic and news popularity.
There are 208 weekly pork prices crawled from the website of the Macau SAR Government Consumer Council during the analysis window (Macao SAR Government Consumer Council, 2024). Due to COVID-19 development and other reasons, the public sector is exempted from working for some periods, and then, there are four missing records found. Based on cubic spline interpolation, the missing data have been supplemented and the total number of final sample data records is 212. The currency for pork price in data records is Macau Pataca (MOP), so MOP/kg is used as the unit in this study. Figure 7 depicts the weekly Macau pork retail price during the analysis window. In Figure 7, some critical events that occurred before and after the sudden increase of the pork price are also labeled. As shown in Figure 7, the pork retail price in Macau fluctuated sharply during the analysis window with the lowest price being 74.9 MOP/kg and the highest price being 150.9 MOP/kg.
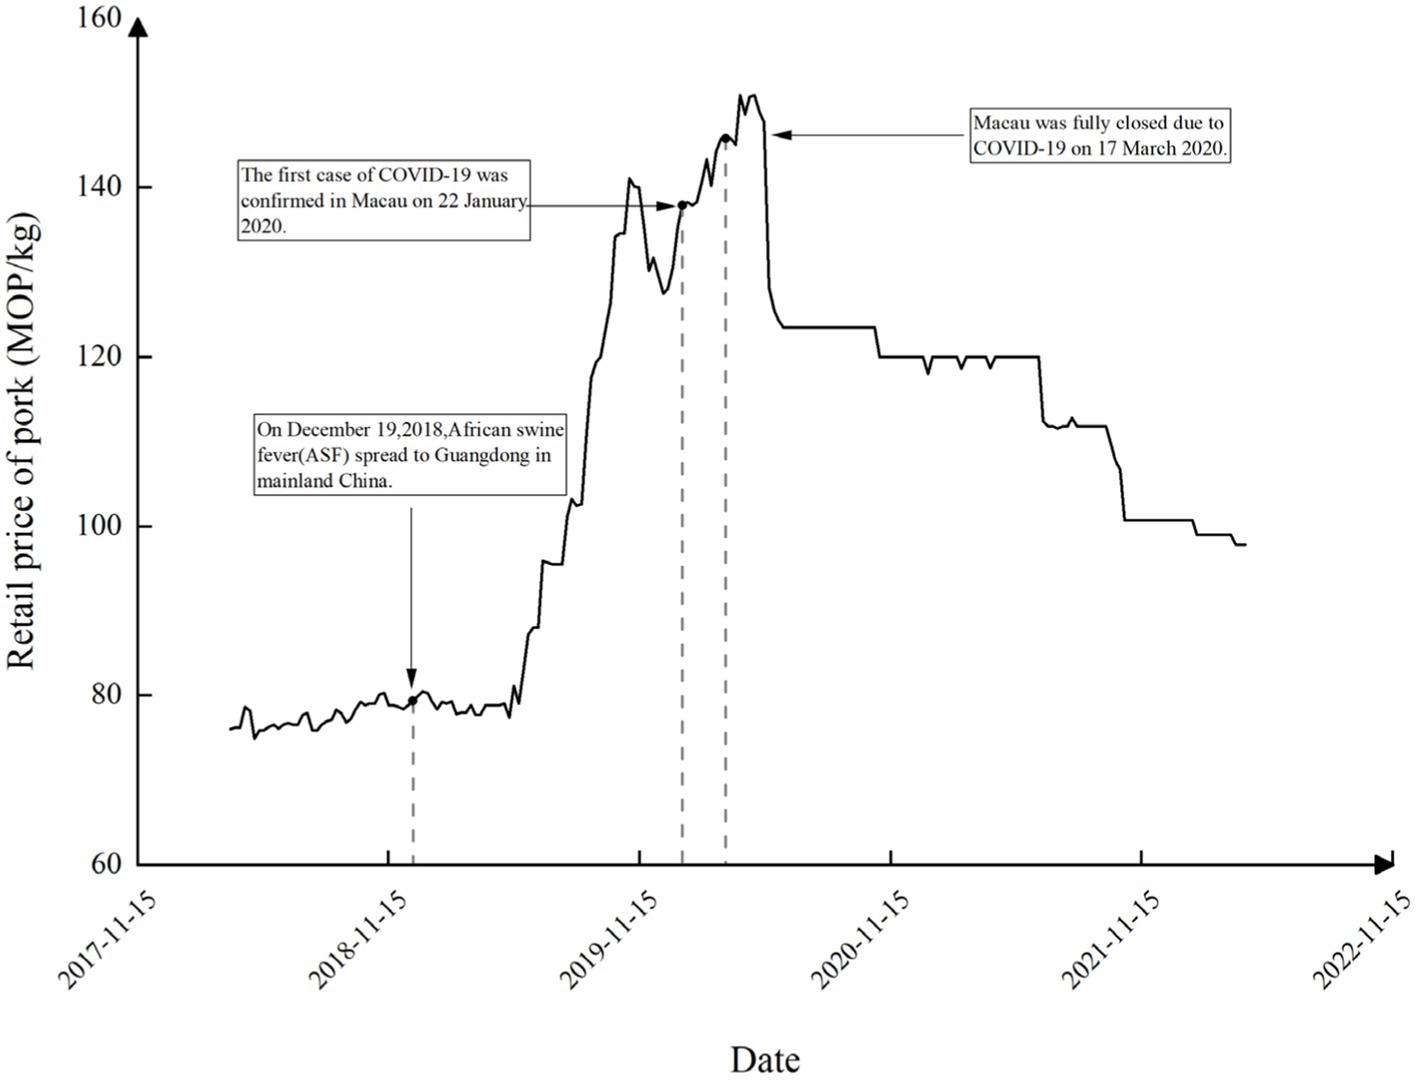
Figure 7. Weekly pork retail price during the analysis window (referring to Macau SAR Government Consumer Council).
4.2.2 Data preprocess
The Augmented Dickey–Fuller (ADF) Test was used to detect the stability of the weekly pork retail price series, and the result is shown in Table 1. It can be observed from the test result that the ADF test value is −1.682, which is greater than the critical value of 1%, 5%, and 10% significance levels. At the same time, the p-value is greater than 0.05. It indicates that the time series of the weekly pork retail price is non-stationary. Based on this, the EEMD decomposition method could be utilized to deal with the non-stationary time series and comprehensively explore the multi-scale fluctuation characteristics of pork retail prices.
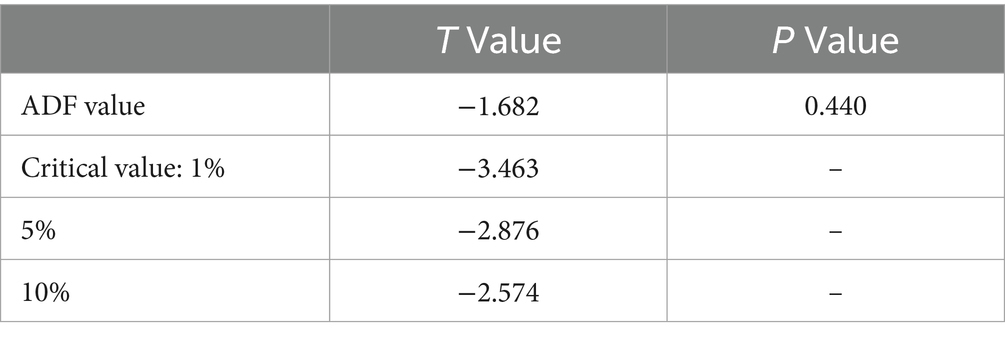
Table 1. Results of the stationarity test (ADF Test) of the pork retail price series in Macau.
5 Results of empirical analysis
5.1 Data decomposition by EEMD
The EEMD method was applied to decompose the weekly price series of live pigs, which consisted of 212 data points. Therefore, the participation was set to . The original data were decomposed using Matlab2020a. The standard deviation ratio of added noise in the program was set to , and the integration number of average signals was set to . Here, the parameter denotes the number of noises added in the EEMD method. After sufficient training, we find that its optimal value is 200, so it is set to 200 in this study. denotes the number of components of the original signal after EEMD decomposition. The final decomposition yielded , consisting of 5 IMF and 1 trend component arranged from high to low frequencies, as shown in Figure 8.
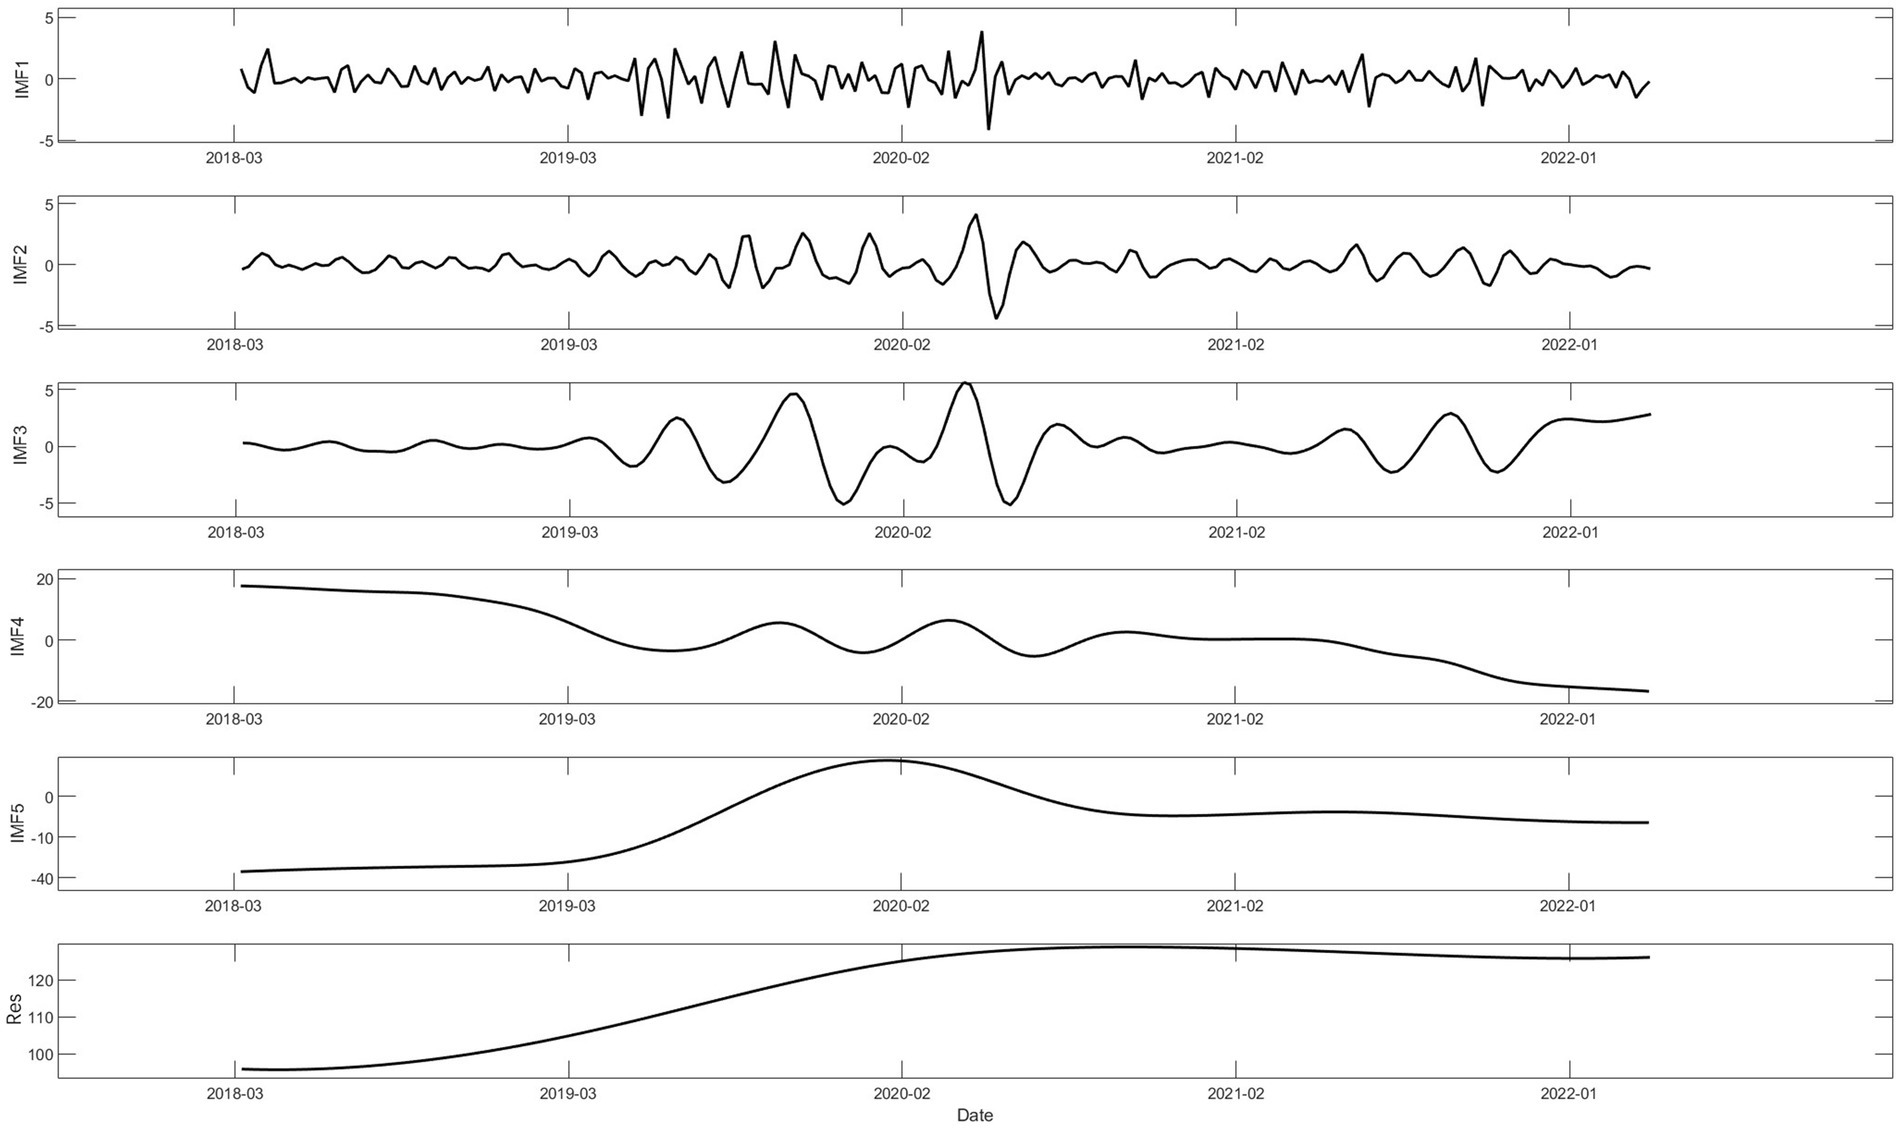
Figure 8. The IMFs and the residual term after EEMD decomposition.
To obtain the dominant mode of Macau’s weekly pork retail price series, the mean periods, correlation coefficients, and variance contribution ratios of the IMFs and the residual term were calculated. The results are shown in Table 2. Here, the mean period can be calculated as the ratio of the sample number of a specific IMF to the number of its maximum (or minimum) points and is a vital index to indicate the difference between high-frequency components and low-frequency components. Both the Pearson Coefficient and the Kendall Coefficient measure the correlation degree between each IMF/residual term and the original data series. The closer the correlation coefficient is to plus or minus one, the stronger the correlation between IMF/residual term and the original data series is. The variance contribution ratio is calculated as the ratio of IMF/residual term variance to the variance of original data series, which describes the contribution rate of each IMF/residual term component to the original data series fluctuation, so the variance contribution ratio is another important index to characterize the impact of different periodic components on the formation of the original data series.

Table 2. Measures of IMFs and the residual term for the Macau’s pork retail price.
The high-frequency IMFs represent short-term fluctuations in pork prices. IMF1 identifies fluctuations with approximately 3 weeks, implying that pork market prices undergo short-term self-adjustment approximately every 3 weeks to alleviate supply–demand imbalances. Similarly, IMF2 identifies fluctuations with approximately 6 weeks, while IMF3 identifies fluctuations with approximately 14 weeks. The short periods and frequent fluctuations of the high-frequency IMFs result in their relatively low correlation coefficients and small variance contributions, with the minimum variance contribution being only 0.183%. The first three IMFs not only exhibit very low correlation coefficients with the original sequence but also account for less than 11% of the total variance, indicating the limited influence of high-frequency IMFs on pork price fluctuations. As shown in Figure 8, prior to the outbreaks of ASF and COVID-19, high-frequency IMFs displayed regular fluctuations without significant oscillations. However, before and after the outbreaks of ASF and COVID-19, drastic increases or decreases in pork prices were captured by IMF1 to IMF3. Moreover, high-frequency components sharply declined (increased) immediately after a sharp increase (decrease), indicating a tendency for a mean reversion in the pork market in the short term.
On the other hand, IMF4 identifies fluctuations with approximately 53 weeks, while IMF5 identifies fluctuations with approximately 116 weeks. The long periods and slow fluctuations of the low-frequency IMFs result in their higher correlation coefficients with the original sequence. IMF4 and IMF5 contribute 17.07 and 53.106% to the variance, respectively, suggesting that long-term cyclical components may dominate the pattern of pork price fluctuations. Among all the IMFs and residual terms, IMF 5 is evidently the most significant component of the original price sequence. The dominant component IMF 5 and the original retail pork price sequence are normalized and plotted together in Figure 9. As shown Figure 9, it can be observed that IMF 5 closely aligns with the original price sequence, demonstrating a relatively consistent trend.
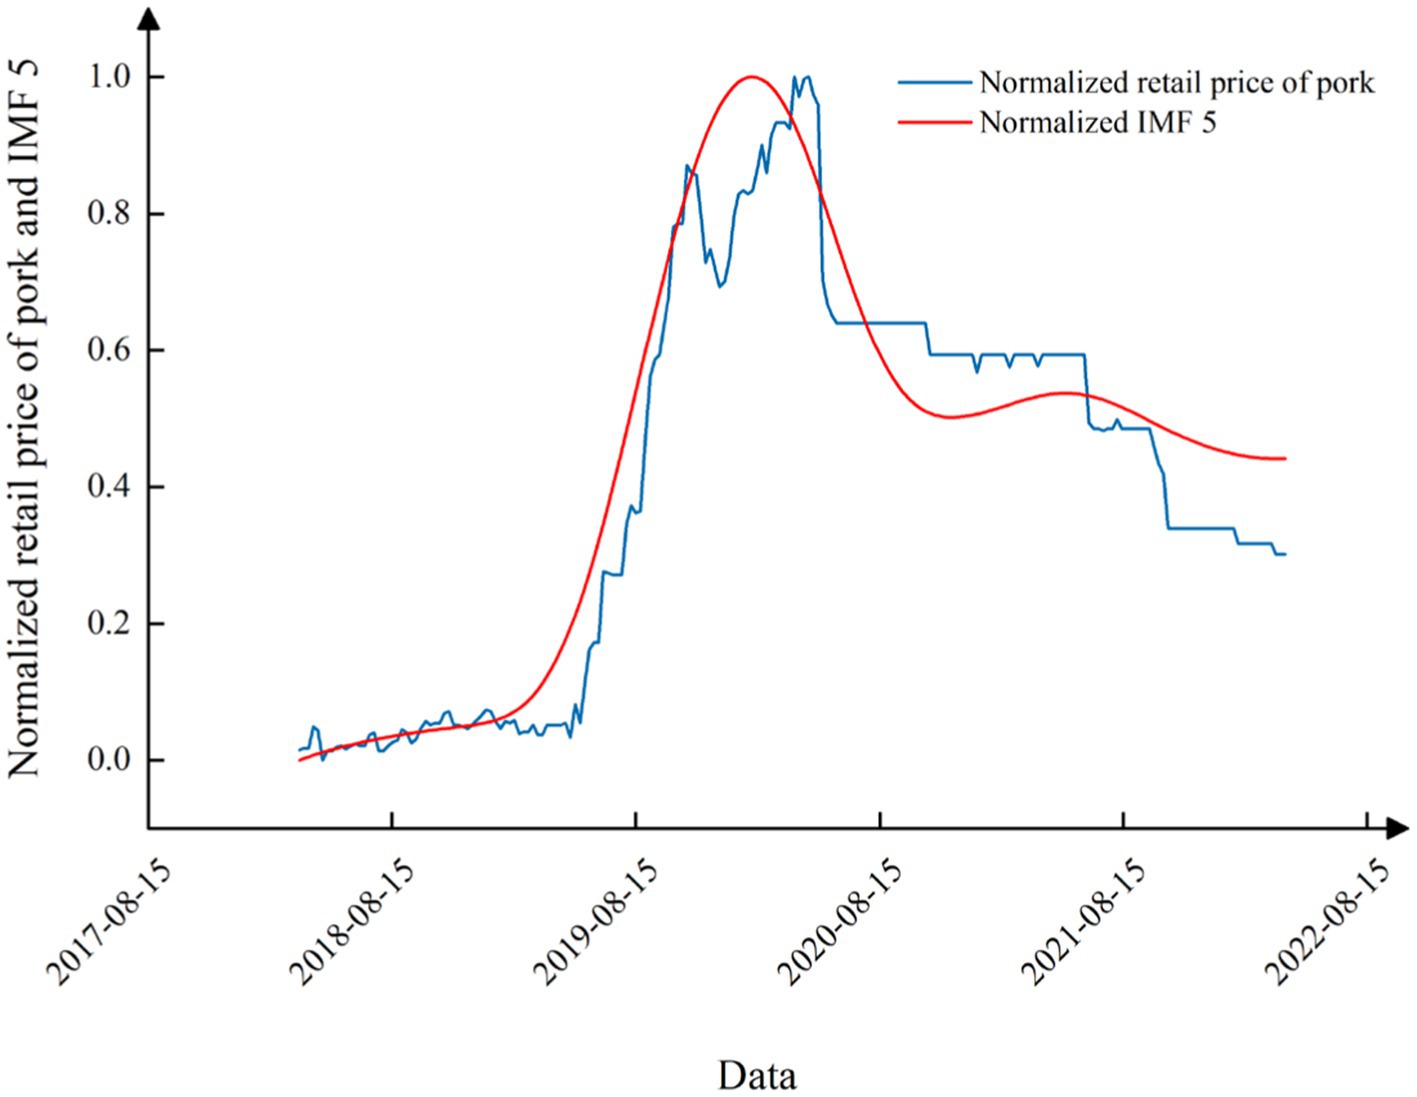
Figure 9. The normalized port price and IMF 5 derived from EEMD.
5.2 IMFs reconstruction
As mentioned above, neighboring IMFs with different time scales may express similar information, and if there are impacts of sudden events on price sequences at different time scales, these IMFs with different time scales should be combined (Zhang et al., 2008). Therefore, the FTC method is used to recombine the IMFs obtained from EEMD decomposition, ultimately yielding high-frequency components, low-frequency components, and trend components (see Figure 10). The results indicate that IMF 1, IMF 2, and IMF 3 are combined into high-frequency components, while IMF 4 and IMF 5 are combined into low-frequency components. The remaining residual terms are typically considered trend components.
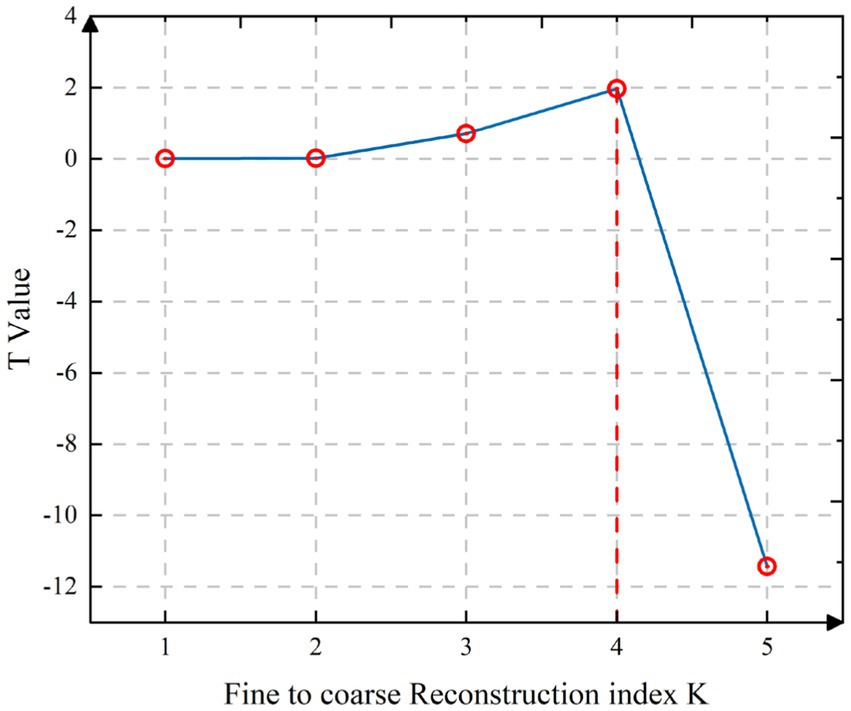
Figure 10. High-frequency and low-frequency component segmentation judgment map based on FTC method.
Figure 11 shows the high-frequency component, low-frequency component, and trend component in the form of time series. Table 3 shows the statistical characteristics of the pork price series after reconstruction, mainly including the correlation coefficients and variance contribution ratios of the three components.
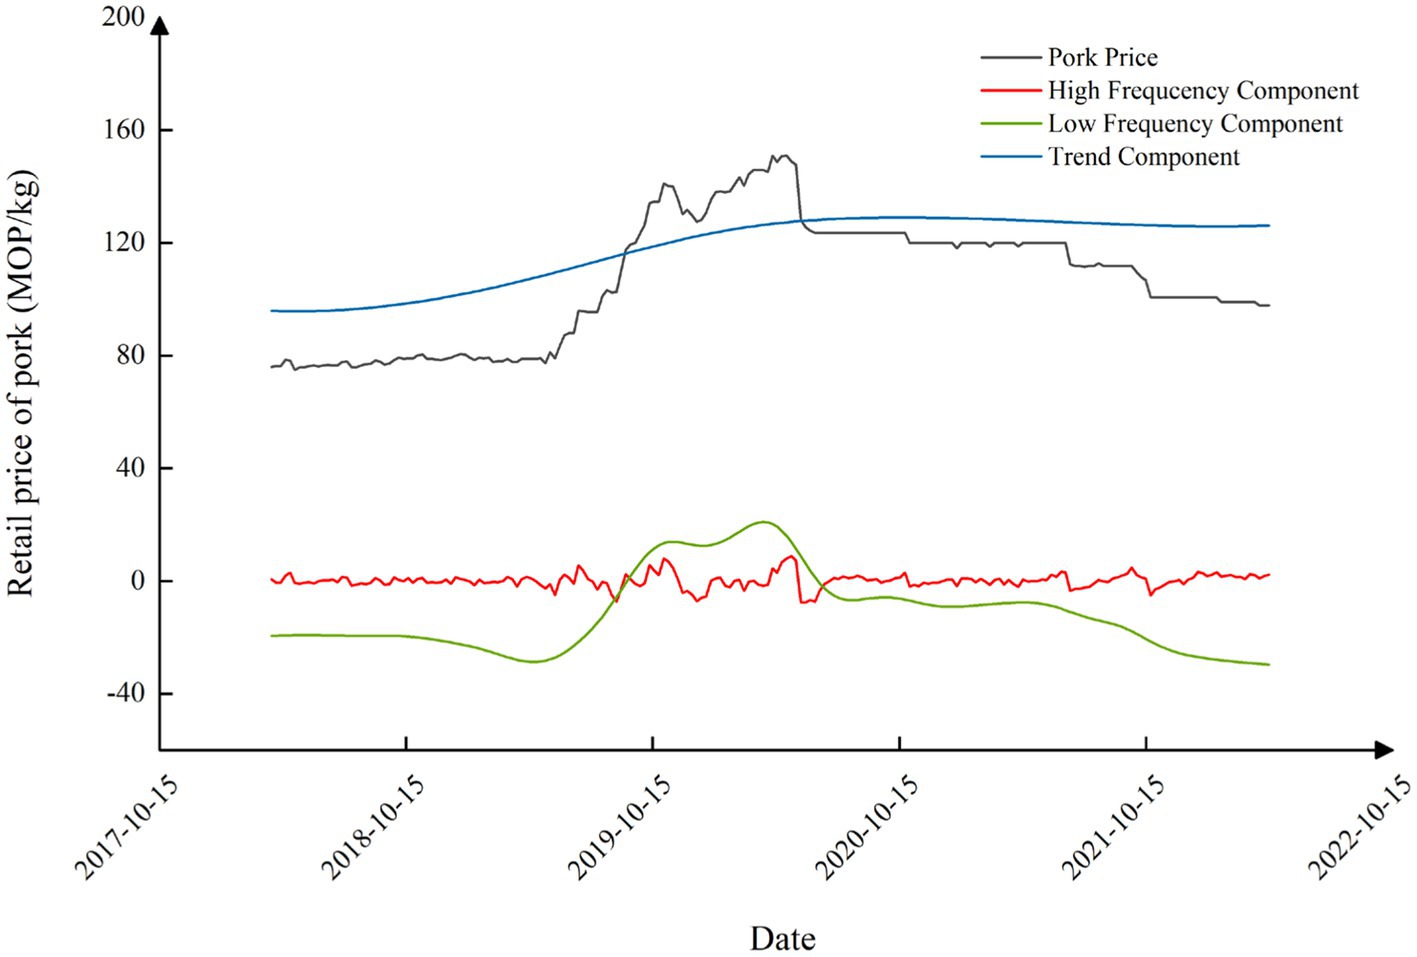
Figure 11. Three components after reconstruction.
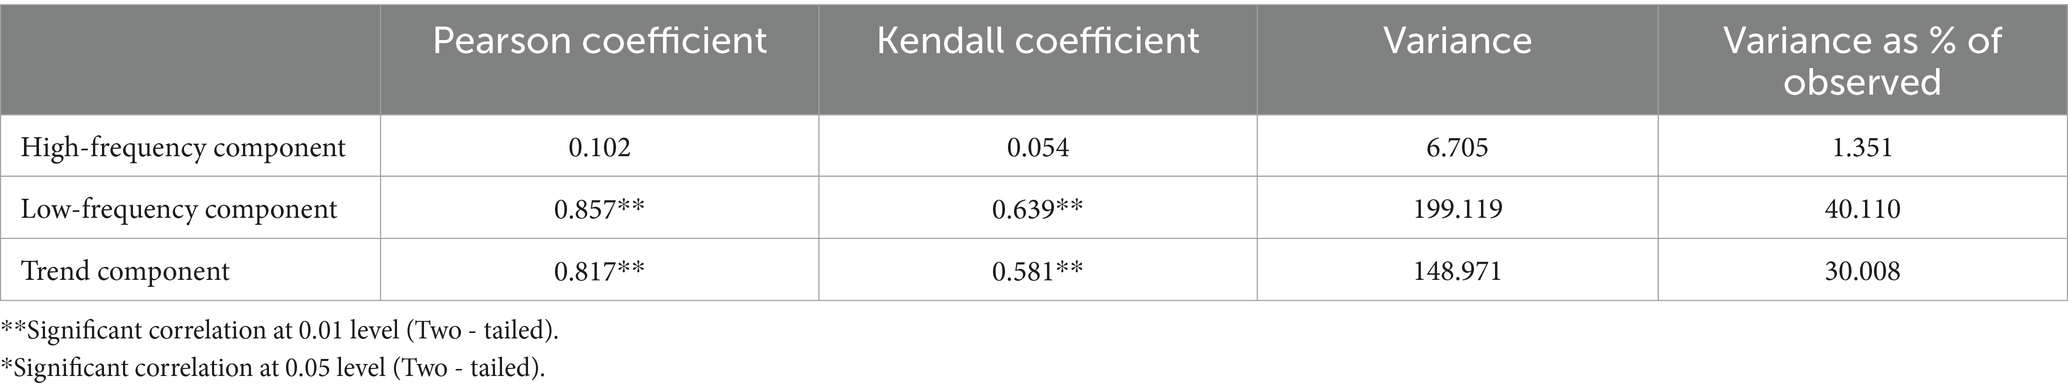
Table 3. Measures of three component for the Macau’s pork retail price.
Table 3 presents the statistical indicators related to the three recomposed components. It is evident that the low-frequency component exhibits the highest correlation with the original price sequence and contributes the most to the volatility of pork prices, with a variance contribution rate of 40.110%. The trend component ranks second, accounting for 30.008% of the original price sequence. Both components have higher proportions compared with the high-frequency component, indicating that the recomposed low-frequency component plays a dominant role in pork price fluctuations.
According to a previous study by Zhang et al. (2008), recomposed IMFs at different frequencies typically carry strong economic significance, with each component revealing distinct economic implications that illuminate the inherent characteristics of pork price fluctuations. Therefore, it is inferred that the high-frequency component represents short-term supply–demand imbalances in the Macau pork market, where pork prices exhibit sharp high-frequency fluctuations, indicating the ability of the market for short-term self-adjustment to mitigate the effects of supply–demand imbalances. Furthermore, calculations reveal that the amplitude of the high-frequency component is 10.82 MOP/kg, indicating that Macau’s local pork prices fluctuate within a range of ±10.82 MOP due to short-term supply–demand imbalances in the market. Additionally, Table 3 indicates that the variance contribution of the high-frequency component is very small, suggesting that the impact of the high-frequency component on pork price fluctuations can be practically disregarded.
On the other hand, the low-frequency component typically corresponds to the impact of special emergencies or critical events in real-life scenarios. As shown in Figure 11 and Table 3, the low-frequency component exhibits a significant correlation with the pork price series, accounting for 40% of the total variance. Additionally, the range of fluctuations in the low-frequency component reaches 18.27 MOP/kg, indicating its predominant role in pork price fluctuations. This suggests that emergent situations or critical events may have been the main drivers of pork price fluctuations in Macau over the past few years.
Furthermore, the trend component represents the long-term trajectory of pork prices, with a correlation coefficient of 0.817 with pork prices and accounting for approximately 30% of the variance in pork prices. According to Table 3, it is evident that the long-term factors represented by the trend component have a lower impact on pork prices compared with the low-frequency component, with a difference in variance contribution of approximately 10% between the two components. This indicates that the trend component remains an important driver of pork price fluctuations in Macau. As shown in Figure 9, the trend in pork prices shows a slow upward tendency. From March 2018 to September 2018, the range of fluctuations in the trend component reached 37.90 MOP/kg, with an increase of up to 200%. However, the range of fluctuations began to show a downward trend.
5.3 Structure breakpoint analysis
The Bai-Perron multiple structure breakpoint test was conducted for the reconstructed low-frequency component to find out the potential emergencies highly related to the key turning points of the pork price fluctuations. Finally, four statistically significant turning points are obtained, which are 28 December 2018, 2 August 2019, 26 June in 2020, and 17 September 2021. Combined with the actual state of the society and situation of the pork market, the emergencies or major regulatory policies that may cause the key turning points are sorted out, and the following four corresponding emergencies or key events are obtained (See Figure 12).
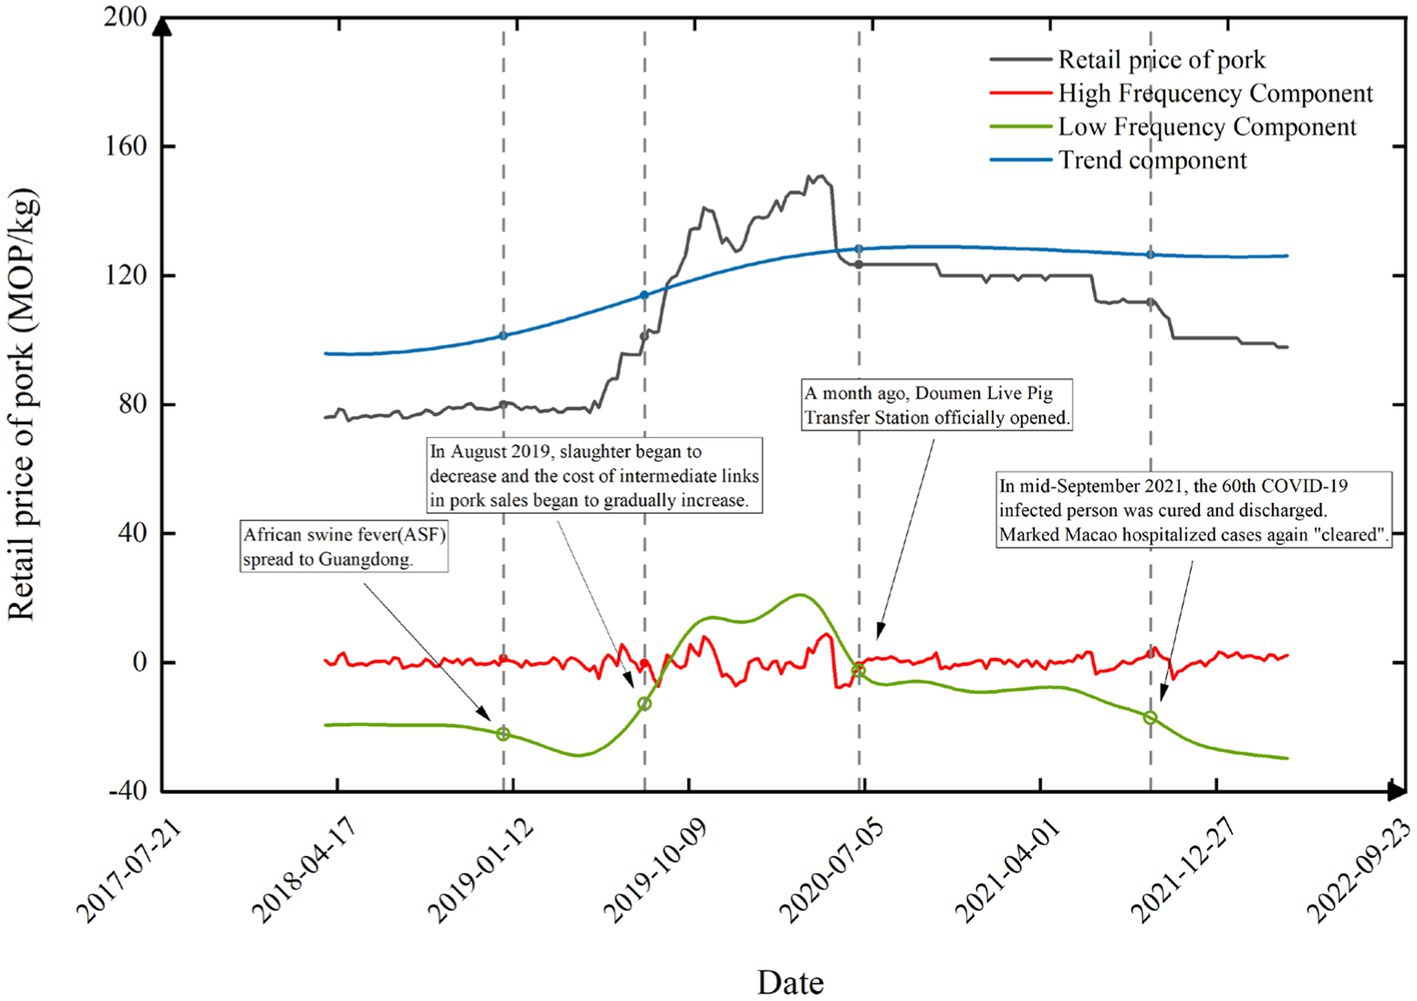
Figure 12. Turning points found on the low-frequency component based on Bai-Perron multiple structure breakpoint test.
The first turning point was found on 28 December 2018, just 1 week after ASF first spread to Guangdong on 19 December 2018. It is found that the curve of the low-frequency component shows a slight drop. Benefiting from the slight rise of the trend term in the long term, the overall pork price at that time is generally stable. It indicates that an animal infectious disease such as ASF could easily impact people’s willingness to consume and further cause fluctuations in the pork market.
The second turning point was found on 2 August 2019 when the total supply of live pigs to Macau declined significantly due to the tight supply of live pigs in mainland China under the impact of ASF. At that time, the supply of live pigs in Macau reduced from 300 live pigs per day under normal condition to just over 100 live pigs per day. According to the principle of scarcity (Robbins, 1934) that a thing is precious when it is scarce, the pork price shows a significant increase.
The third turning point was found on 26 June 2020, approximately 1 month after the opening of the Doumen Live Pig Transfer Station for Macau on 25 May 2020. After the Doumen Live Pig Transfer Station opened, there was a huge expansion of source channels for pork. Through the transit function of Doumen Live Pig Transfer Station, the Pork to Macau can also be provided by Hunan province, Jiangxi province, and Guangxi province, in addition to Guangdong province. The broadened source channels of live pigs and increased supply of pork promote the decrease in pork price.
The fourth turning point was found on 17 September 2021, when the spread of the COVID-19 has been effectively controlled in Macau. On 13 September 2021, the Novel Coronavirus Infection Response Coordination Centre in Macau announced that the 60th COVID-19-infected patient had been cured and discharged, and also there are no new infection cases in Macau. 13 September 2021 is treated as the key time point that the present round of COVID-19 epidemic was brought under control. This promotes the continuous decline in pork price.
The afore-mentioned four turning points cut the time series of pork price into five segments. The statistical characteristics of these five segments are shown in Table 4.
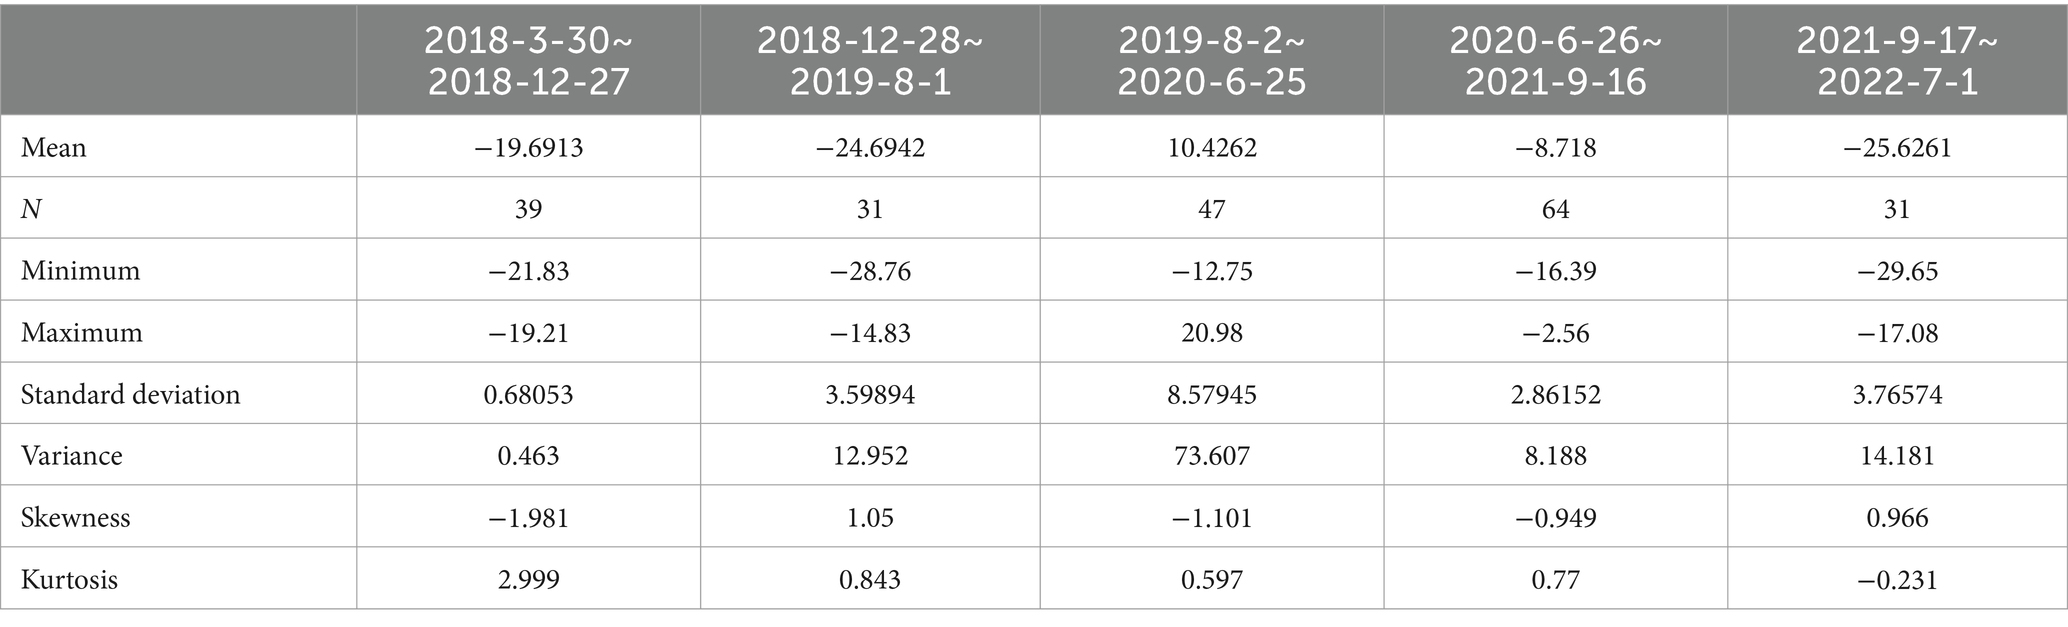
Table 4. Statistical description of the five segments segmented by the detected four turning points.
As shown in Table 4, the first segment from 30 March 2018 to 27 December 2018 is a relatively stable period for the pork price. Despite that the low-frequency component has small fluctuations, the standard deviation and variance of the low-frequency component during this period are relatively small, indicating that the public sentiment of ASF first spreading to Guangdong affected the pork market, but the influence is relatively limited when compared with other emergencies or key events corresponding to other turning points.
The second segment is from 28 December 2018 to 1 August 2019 when the pork price showed a general rising trend. During this period, the Chinese Mainland imposed strict policies on trans-provincial transportation of live pigs due to the spread of ASF all over the country, which induced a nationwide pork supply shortage. Among all the provinces in China, the declines in pig production capacity in Guangdong province and Guangxi province, which were the main areas of live pig supply in Macau, were particularly prominent. For example, seventeen live pig farms in Guangdong province needed to temporarily stop live pig supply due to their proximate location to the epidemic area. As a result, it was found that the pork retail price rose rapidly from 79 MOP/kg to 95.5 MOP/kg from May to November 2019. At the same time, the low-frequency component also observed a 13.93 MOP/kg rise in pork retail price during 4 months.
The third segment is a severe oscillation period for pork price from 2 August 2019 to 25 June 2020. During this period, the low-frequency component has the largest amplitude and variance among all the periods. Several important emergencies and social events contributed to the price fluctuations during this period. First, the supply of live pigs from the Chinese mainland began to increase in late December 2019. Therefore, the import price of live pigs to Macau declined slightly, which then leads to a decrease of pork retail price by an average of 1.43 MOP/kg. Second, there had been only two farms remaining the pork supply capacity to Macau due to the combined influence of outbreak of COVID-19 and the impact of ASF after the Spring Festival in 2020. Only approximately 105 live pigs were available daily in early April 2020, which equals to just one-third of the normal supply level. As a result, pork retail price reaches its peak at approximately 145.8 MOP/kg in April 2020 and is the highest retail price ever recorded. Third, the first round of the COVID-19 epidemic in Macau was brought under control in May 2020, which had also been the turning point when the pork retail price began to decrease.
The fourth segment is from 26 June 2020 to 16 September 2021, which is a pork price decline period. With the opening of the Doumen Live Pig Transfer Station, the stable supply of the pork to Macau’s market had been effectively guaranteed. In addition, it should be noted that the Macau SAR government strengthened its supervision and adopted a series of measures to regulate the operation order of the pork market, to prevent merchants from speculating and bidding up the pork price in June 2020. Both the stable pork supply and the effective government regulation contribute to keep the pork price stable.
The fifth segment is from 17 September 2021 to 15 April 2022, which is also a pork price decline period. The number of COVID-19 infection cases had been cleared for on 13 September 2021, which means that the epidemic had been effectively controlled during this period. The government’s relevant policy may also be another key reason for the continued decrease in pork retail price. On 7 September 2021, the Guangdong Provincial Government issued the “The 14th Five-Year Plan for Promoting Agricultural and Rural Modernization in Guangdong Province.” In that plan, the ratio of the large-scale pig breeding farm was committed to reach more than 80%, and the pig production capacity was committed to return to the normal condition, with more than 33 million pigs becoming full grown and ready for slaughter and more than 2.45 million tons of pork for sale per year. Based on the co-effect of COVID-19 epidemic control and policy promotion, the pork price in Macau has been declining.
6 Discussion
Both ASF and COVID-19 events are characterized by rapid transmission, wide-ranging impacts, and high mortality rates among affected individuals. The effects of these events can be categorized into three components, namely, high-frequency components, low-frequency components, and trend items. According to the findings of this study, the low-frequency component plays a dominant role in these events and demonstrates a good fit with the original price series. Although both events are classified as disease-related emergencies, their pathways of impact are markedly different. Analyzing pork price fluctuations reveals several key insights into the effects of various regulatory measures and market conditions on both supply and demand. The results from the Bai-Perron multiple structural break test indicate that the critical turning points in pork prices are closely associated with major socioeconomic events and regulatory interventions.
To further enhance the stability of Macau’s pork market and the security of the supply chain, this study proposes future policy recommendations from the perspectives of control and detection systems, supply chain optimization, policy and legal frameworks, and emergency preparedness, as shown in Figure 13.
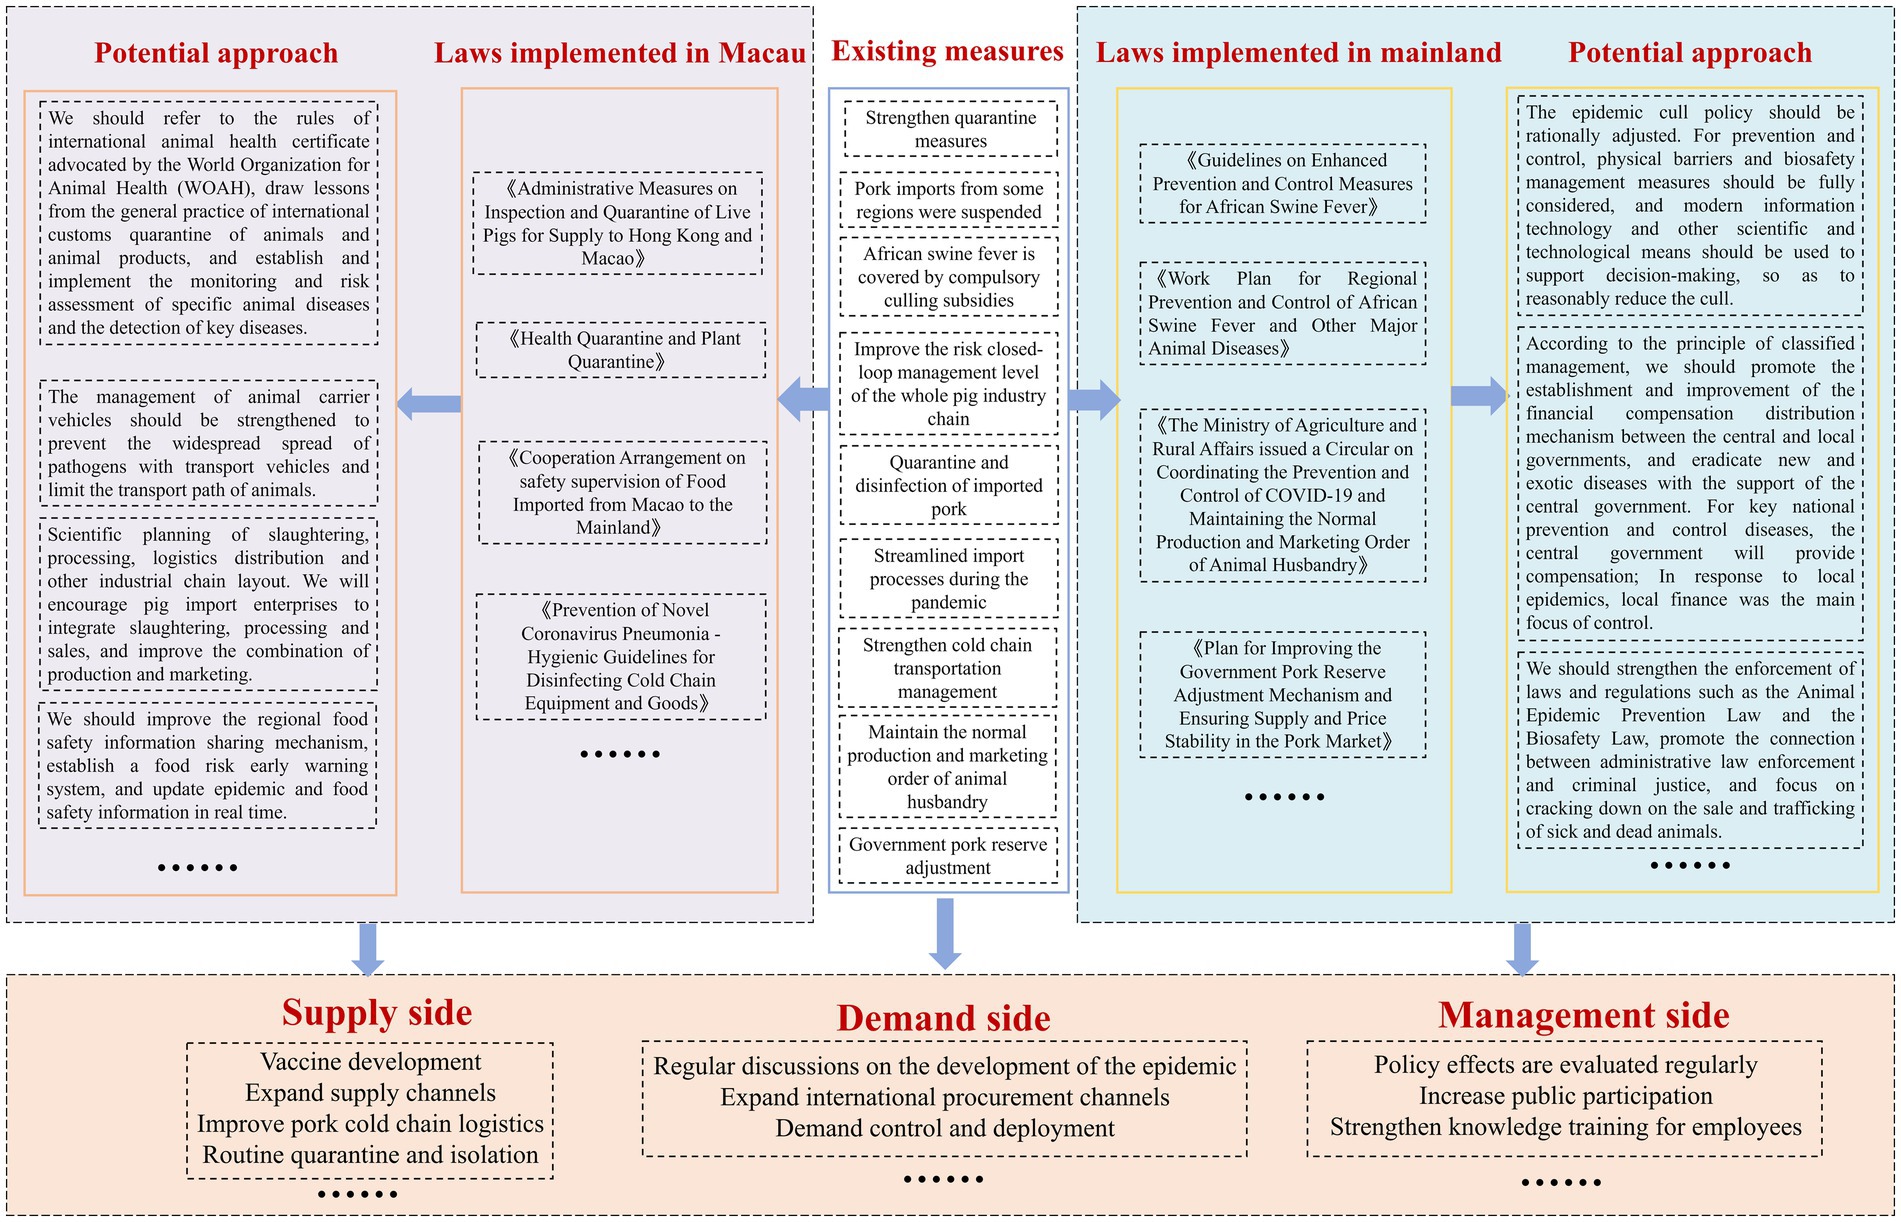
Figure 13. Future policy recommendations on Macau’s pork market security.
Control and detection systems: Macau and mainland China should foster a tight cross-regional epidemic prevention and control cooperation mechanism to ensure prompt sharing of epidemic information and formulate and implement unified prevention and control strategies. Regular cross-regional epidemic prevention meetings and an information-sharing platform will facilitate swift coordination among regions.
Increased investment in vaccine research and development, along with enhanced vaccine reserves, is recommended. Establishing specialized research funds to support universities and research institutions in vaccine development will empower Macau to respond promptly to epidemics and guarantee a stable pork supply.
Supply chain optimization: Efforts should focus on upgrading cold chain logistics facilities and reinforcing the management of animal transport vehicles to prevent the widespread dissemination of pathogens via transportation, thereby confining animal transport routes.
Given Macau’s geographical layout, scientific planning of slaughtering, processing, and logistics distribution chains is imperative. Encouraging pig import enterprises to integrate slaughtering, processing, and sales operations will enhance the coherence between production and sales.
Policy and legal support: Macau should establish a legal review committee to periodically review and update public health and epidemic prevention laws, ensuring the timeliness and effectiveness of legal regulations through dynamic adjustments.
The outbreaks of ASF and COVID-19 have heightened public concerns about pork market volatility and food safety, especially regarding pork as a staple meat product. Therefore, it is crucial to crack down on improper practices by market operators during price fluctuations and enhance information disclosure and transparency to alleviate public concerns.
Emergency preparedness: Adequate emergency reserve supplies, including vaccines and protective equipment, should be established to provide timely material support during emergencies. A dedicated emergency reserve warehouse for “meat, eggs, and dairy” products should be established, with regular inspections and updates of supplies.
Regular emergency plan drills and related training should be conducted to enhance the emergency response capabilities and professional knowledge of relevant personnel.
7 Conclusion
In this study, we have focused intently on the volatility of pork prices within the unique temporal framework defined by the concurrent occurrence of the ASF and the COVID-19 pandemic in recent years. Notably, we observe a significant transformation in the pork price landscape of Macau, a region traditionally synonymous with price stability for nearly two decades, now experiencing marked fluctuations. This emergent phenomenon underscores the urgent need for thorough investigation.
Utilizing the extensive and accessible public data provided by the Macau government, we have carefully curated a comprehensive dataset spanning from 30 March 2018 to 15 April 2022, enabling an empirical exploration of the underlying dynamics of pork price fluctuations. Our analytical approach, centered on the EEMD method and FTC reconstruction, yields intriguing findings. Specifically, our results indicate that short-term market fluctuations exert limited influence on pork price dynamics, highlighting the inherent resilience of the pork market and its capacity for self-regulation in counteracting transient market imbalances. Conversely, our analysis posits that the primary drivers of pork price fluctuations in Macau are likely to originate from long-term and low-frequency emergencies or decisive events.
To enrich our analysis, we applied the Bai-Perron Multiple Structure Breakpoint Test, an instrumental tool for identifying pivotal junctures in the pork price series. Our comprehensive investigation revealed four significant emergencies or influential regulatory policies, each serving as a key turning point within the pork price series. This demarcation led to the segmentation of the original price series into five distinct segments, each characterized by unique features and trajectories. Furthermore, upon closer examination, we substantiated the profound impact of factors such as animal-borne infectious diseases, the spread of epidemics within human society, governmental policy interventions, and socially relevant events. These elements collectively emerge as critical determinants, exuding an undeniable influence over the pivotal turning points within the series of pork prices. In conclusion, this study provides profound insights into the impact of multiple unexpected events on the pork price market.
Moving forward, our research agenda aims to delve deeper into the intricate interplay between unexpected events and pork price dynamics, particularly focusing on the nuanced mechanisms through which long-term and low-frequency emergent events exert their influence. We intend to refine our analytical models, incorporating additional variables such as consumer behavior patterns, supply chain disruptions, and international trade dynamics, to gain a more holistic understanding of the pork market’s response to multifaceted shocks. Furthermore, we plan to extend our empirical investigation to other regions, allowing for a comparative analysis that could unveil regional specificities in pork price volatility patterns. Ultimately, our aspiration is to contribute to the development of a framework that can anticipate and mitigate the impact of unforeseen events on pork prices, thereby fostering greater stability within the global pork market.
Data availability statement
The datasets presented in this study can be found in online repositories. This data can be found here: https://doi.org/10.17632/24hhdyfphv.2.
Author contributions
FX: Conceptualization, Data curation, Formal analysis, Investigation, Methodology, Resources, Validation, Visualization, Writing – original draft, Writing – review & editing. XN: Conceptualization, Funding acquisition, Methodology, Project administration, Supervision, Visualization, Writing – review & editing. KL: Project administration, Supervision, Writing – review & editing. MW: Project administration, Supervision, Writing – review & editing. KT: Data curation, Methodology, Writing – review & editing. JH: Writing – review & editing.
Funding
The author(s) declare that financial support was received for the research, authorship, and/or publication of this article. This study was supported by the National Natural Science Foundation of China under Grant No. 72304038, Guangdong Basic and Applied Basic Research Foundation under Grant No. 2022A1515110049, Young Innovative Talents Project from Department of Education of Guangdong Province under Grant No. 2022KQNCX157, and China Association for Science and Technology (CAST) Science and Technology Think Tank Youth Talent Program under Grant No. XMSB20240710035.
Conflict of interest
The authors declare that the research was conducted in the absence of any commercial or financial relationships that could be construed as a potential conflict of interest.
Publisher’s note
All claims expressed in this article are solely those of the authors and do not necessarily represent those of their affiliated organizations, or those of the publisher, the editors and the reviewers. Any product that may be evaluated in this article, or claim that may be made by its manufacturer, is not guaranteed or endorsed by the publisher.
References
Arnold, D. (1979). Dacoity and rural crime in Madras, 1860–1940. J. Peasant Stud. 6, 140–167. doi: 10.1080/03066157908438071
Azzam, A., and Dhoubhadel, S. (2022). COVID-19, beef price spreads, and market power. J. Agric. Resour. Econ. 47, 462–476. doi: 10.22004/ag.econ.313309
Bai, J. S., and Perron, P. (1998). Estimating and testing linear models with multiple structural changes. Econometrica 66, 47–78. doi: 10.2307/2998540
Bai, J., and Perron, P. (2003). Computation and analysis of multiple structural change models. J. Appl. Econ. 18, 1–22. doi: 10.1002/jae.659
Chen, Q. (2014). Advanced econometrics and Stata applications. 2nd Edn. Beijing: Higher Education Press.
Chen, D., Abler, D., Zhou, D., Yu, X., and Thompson, W. (2016). A meta-analysis of food demand elasticities for China. Appl. Econ. Perspect. Policy 38, 50–72. doi: 10.1093/aepp/ppv006
Chen, X. X., and Huang, X. X. (2022). Application of Price competition model based on computational neural network in risk prediction of transnational investment. Comput. Intell. Neurosci. 12, 2022:6385. doi: 10.1155/2022/8906385
Chen, Y., and Yu, X. (2018). Does the centralized slaughtering policy create market power for pork industry in China? China Econ. Rev. 50, 59–71. doi: 10.1016/j.chieco.2018.03.005
Chow, G. C. (1960). Tests of equality between sets of coefficients in two linear regressions. Econometrica 28, 591–605. doi: 10.2307/1910133
Coase, R. H., and Fowler, R. F. (1935). Bacon production and the pig-cycle in Great Britain. Economica (London). Economica 2, 142–167. doi: 10.2307/2548676
De, Z., and Koemle, D. (2015). Price transmission in hog and feed markets of China. J. Integr. Agric. 14, 1122–1129. doi: 10.1016/S2095-3119(14)60995-3
Fliessbach, A., and Ihle, R. (2020). Cycles in cattle and hog prices in South America. Aust. J. Agric. Resour. Econ. 64, 1167–1183. doi: 10.1111/1467-8489.12392
Hamilton, S. F., and Kastens, T. L. (2000). Does market timing contribute to the cattle cycle? Am. J. Agric. Econ. 82, 82–96. doi: 10.1111/0002-9092.00008
Holt, M. T., and Craig, L. A. (2006). Nonlinear dynamics and structural change in the US hog—corn cycle: a time-varying STAR approach. Am. J. Agric. Econ. 88, 215–233. doi: 10.1111/j.1467-8276.2006.00849.x
Hu, X., and Guo, S. (2018). Influences of major epidemic on pig market price—analysis of industrial shocks of African swine fever and the countermeasures. Price 12, 51–55. doi: 10.19851/j.cnki.cn11-1010/f.2018.12.011 [in Chinese]
Huang, Y. S., and Deng, Y. (2021). A new crude oil price forecasting model based on variational mode decomposition. Knowl.-Based Syst. 213:106669. doi: 10.1016/j.knosys.2020.106669
Huang, N. E., Shen, Z., Long, S. R., Wu, M. L. C., Shih, H. H., Zheng, Q. N., et al. (1998). The empirical mode decomposition and the Hilbert spectrum for nonlinear and non-stationary time series analysis. Proceed. Royal Soc. Math. Physic. Eng. Sci. 454, 903–995. doi: 10.1098/rspa.1998.0193
Jianwei, E., Bao, Y., and Ye, J. (2017). Crude oil price analysis and forecasting based on variational mode decomposition and independent component analysis. Physica A 484, 412–427. doi: 10.1016/j.physa.2017.04.160
Kawashima, S., and Puspito Sari, D. A. (2010). Time-varying Armington elasticity and country-of-origin bias: from the dynamic perspective of the Japanese demand for beef imports. Aust. J. Agric. Resour. Econ. 54, 27–41. doi: 10.1111/j.1467-8489.2009.00477.x
Lahmiri, S. (2014). Wavelet low- and high-frequency components as features for predicting stock prices with backpropagation neural networks. J. King Saud Univ. Comp. Inform. Sci. 26, 218–227. doi: 10.1016/j.jksuci.2013.12.001
Li, S. Q., Liu, X. M., and Lin, A. J. (2020). Paper fractional frequency hybrid model based on EEMD for financial time series forecasting. Commun. Nonlinear Sci. Numer. Simul. 89:105281. doi: 10.1016/j.cnsns.2020.105281
Li, B., and Zeng, Z. (2015). Social policy in Macau. Asia Pacific Policy Stud. 2, 383–398. doi: 10.1002/app5.80
Lim, W. M.To, W.-M (2022). The economic impact of a global pandemic on the tourism economy: the case of COVID-19 and Macao’s destination- and gambling-dependent economy. Curr. Issue Tour. 25, 1258–1269. doi: 10.1080/13683500.2021.1910218
Liu, G., Xiao, F. Y., Lin, C. T., and Cao, Z. H. (2020). A fuzzy interval time-series energy and financial forecasting model using network-based multiple time-frequency spaces and the induced-ordered weighted averaging aggregation operation. IEEE Trans. Fuzzy Syst. 28, 2677–2690. doi: 10.1109/tfuzz.2020.2972823
Lu, W. Q., Liang, W., Zhang, L. B., and Liu, W. (2016). A novel noise reduction method applied in negative pressure wave for pipeline leakage localization. Process Saf. Environ. Prot. 104, 142–149. doi: 10.1016/j.psep.2016.08.014
Luo, Q., Liu, P., and Li, Z. (2023). The influence of African swine fever information on consumers’ preference of pork attributes and pork purchase. Can. J. Agric. Econ. 71, 49–68. doi: 10.1111/cjag.12324
Ma, M., Wang, H. H., Hua, Y., Qin, F., and Yang, J. (2021). African swine fever in China: impacts, responses, and policy implications. Food Policy 102:102065. doi: 10.1016/j.foodpol.2021.102065
Ma, L., Wang, Y., and Teng, Y. (2022). Decision-making behaviour evolution among pork supply and demand subjects under normalisation of COVID-19 prevention and control: a case study in China. Front. Public Health 10:784668. doi: 10.3389/fpubh.2022.784668
Macao SAR Government Consumer Council . (2024). Available at: https://www.consumer.gov.mo/commodity/price_station.aspx?lang=zh, (Accessed July 1, 2024).
Mallory, M. L. (2021). Impact of COVID-19 on medium-term export prospects for soybeans, corn, beef, pork, and poultry. Appl. Econ. Perspect. Policy 43, 292–303. doi: 10.1002/aepp.13113
Mason-D'Croz, D., Bogard, J. R., Herrero, M., Robinson, S., Sulser, T. B., Wiebe, K., et al. (2020). Modelling the global economic consequences of a major African swine fever outbreak in China. Nature Food 1, 221–228. doi: 10.1038/s43016-020-0057-2
Mijović, B., De Vos, M., Gligorijević, I., Taelman, J., and Van Huffel, S. (2010). Source separation from single-channel recordings by combining empirical-mode decomposition and independent component analysis. IEEE Trans. Biomed. Eng. 57, 2188–2196. doi: 10.1109/TBME.2010.2051440
Nie, Z. H., Shen, F., Xu, D. J., and Li, Q. H. (2020). An EMD-SVR model for short-term prediction of ship motion using mirror symmetry and SVR algorithms to eliminate EMD boundary effect. Ocean Eng. 217:107927. doi: 10.1016/j.oceaneng.2020.107927
Niemi, J. K., and Lehtonen, H. (2011). Modelling pig sector dynamic adjustment to livestock epidemics with stochastic-duration trade disruptions. Eur. Rev. Agric. Econ. 38, 529–551. doi: 10.1093/erae/jbq047
Niemi, J. K., Lehtonen, H., and Pietola, K. (2006). Effects of an animal disease shock on meat markets and producer income. Acta Agriculturae Scand Section C 3, 138–150. doi: 10.1080/16507540601127789
Ortega, D. L., Holly Wang, H., and Eales, J. S. (2009). Meat demand in China. China Agricult. Econom. Rev. 1, 410–419. doi: 10.1108/17561370910989248
Otte, J., Hinrichs, J., Rushton, J., Roland-Holst, D., and Zilberman, D. (2009). Impacts of avian influenza virus on animal production in developing countries. CABI Rev., 1–18. doi: 10.1079/PAVSNNR20083080
Qin, Q. D., Xie, K. Q., He, H. D., Li, L., Chu, X. H., Wei, Y. M., et al. (2019). An effective and robust decomposition-ensemble energy price forecasting paradigm with local linear prediction. Energy Econ. 83, 402–414. doi: 10.1016/j.eneco.2019.07.026
Ramsey, A. F., Goodwin, B. K., Hahn, W. F., and Holt, M. T. (2021). Impacts of COVID-19 and price transmission in US meat markets. Agric. Econ. 52, 441–458. doi: 10.1111/agec.12628
Robbins, L. (1934). An essay on the nature and significance of economic science. J. R. Stat. Soc. 97:343.
Rudé, G. F. E. (1964). The crowd in history: A study of popular disturbances in France and England, 1730–1848. New York: John Wiley and Sons. doi: 10.1086/ahr/71.1.161
Saha, B., and Mitura, V. (2008). Price transmission along the Canadian beef supply chain and the impact of BSE. Agricult. Rural Work. Paper Ser. 21-601-M2008091, 1–39. doi: 10.22004/ag.econ.54823
Smith, A. F. (2011). Starving the south: How the north won the civil war. St. Martin's Publishing Group. Available at: https://books.google.com/books?id=wcAf7HzaShYC
Tian, K., Yu, X., Zhao, T., Feng, Y., Cao, Z., Wang, C., et al. (2007). Emergence of fatal PRRSV variants: unparalleled outbreaks of atypical PRRS in China and molecular dissection of the unique hallmark. PLoS One 2:e526. doi: 10.1371/journal.pone.0000526
Utnik-Banas, K., Schwarz, T., Szymanska, E. J., Bartlewski, P. M., and Satola, L. (2022). Scrutinizing pork Price volatility in the European Union over the last decade. Animals 12:100. doi: 10.3390/ani12010100
Vatsa, P. (2022). Do crop prices share common trends and common cycles? Aust. J. Agric. Resour. Econ. 66, 363–382. doi: 10.1111/1467-8489.12464
Wang, J., Chen, Y., Zheng, Z., and Si, W. (2014). Determinants of pork demand by income class in urban western China. China Agricul. Econ. Rev. 6, 452–469. doi: 10.1108/CAER-08-2012-0090
Wang, Y., Wang, J., and Wang, X. (2020). COVID-19, supply chain disruption and China’s hog market: a dynamic analysis. China Agricul. Econ. Rev. 12, 427–443. doi: 10.1108/CAER-04-2020-0053
Wu, Z. H., and Huang, N. E. (2004). A study of the characteristics of white noise using the empirical mode decomposition method. Proceed. Royal Soc. Math. Phys. Eng. Sci. 460, 1597–1611. doi: 10.1098/rspa.2003.1221
Wu, Z., and Huang, N. E. (2009). Ensemble empirical mode decomposition: a noise-assisted data analysis method. Adv. Adapt. Data Anal. 1, 1–41. doi: 10.1142/S1793536909000047
Xue, Y. J., Cao, J. X., Wang, X. J., Li, Y. X., and Du, J. (2019). Recent developments in local wave decomposition methods for understanding seismic data: application to seismic interpretation [review]. Surv. Geophys. 40, 1185–1210. doi: 10.1007/s10712-019-09568-2
Yang, Y., Cheng, J., and Zhang, K. (2012). An ensemble local means decomposition method and its application to local rub-impact fault diagnosis of the rotor systems. Measurement 45, 561–570. doi: 10.1016/j.measurement.2011.10.010
Yang, J., Tang, K., Cao, Z., Pfeiffer, D. U., Zhao, K., Zhang, Q., et al. (2021). Demand-driven spreading patterns of African swine fever in China. Chaos 31:061102. doi: 10.1063/5.0053601
Yang, Y., and Wang, J. (2021). Forecasting wavelet neural hybrid network with financial ensemble empirical mode decomposition and MCID evaluation. Expert Syst. Appl. 166:114097. doi: 10.1016/j.eswa.2020.114097
Yu, X., and Abler, D. (2014). Where have all the pigs gone? Inconsistencies in pork statistics in China. China Econ. Rev. 30, 469–484. doi: 10.1016/j.chieco.2014.03.004
Zarzoso, V., and Comon, P. (2009). Robust independent component analysis by iterative maximization of the kurtosis contrast with algebraic optimal step size. IEEE Trans. Neural Netw. 21, 248–261. doi: 10.1109/TNN.2009.2035920
Zhang, X., Lai, K. K., and Wang, S.-Y. (2008). A new approach for crude oil price analysis based on empirical mode decomposition. Energy Econ. 30, 905–918. doi: 10.1016/j.eneco.2007.02.012
Zhao, J. C., and Xiong, T. (2017). A hybrid analysis model and an empirical study on fluctuation Characterstics and regulatory policies of hog Price under a multi-scale perspective. Syst. Eng. 35, 93–104.
Zhu, H., Xu, R., and Deng, H. (2022). A novel STL-based hybrid model for forecasting hog price in China. Comput. Electron. Agric. 198:107068. doi: 10.1016/j.compag.2022.107068
Keywords: regional economic systems, pork price fluctuations, ensemble empirical mode decomposition, Bai-Perron multiple structure breakpoint test, impact of emergent crises
Citation: Xu F, Ni X, Liu K, Wang M, Tan K and Hu J (2024) Analysis of pork price fluctuations during the special era when African swine fever and COVID-19 epidemic coexisted: an empirical study in Macau, China. Front. Sustain. Food Syst. 8:1370726. doi: 10.3389/fsufs.2024.1370726
Edited by:
Nan Zhang, Beijing University of Technology, ChinaCopyright © 2024 Xu, Ni, Liu, Wang, Tan and Hu. This is an open-access article distributed under the terms of the Creative Commons Attribution License (CC BY). The use, distribution or reproduction in other forums is permitted, provided the original author(s) and the copyright owner(s) are credited and that the original publication in this journal is cited, in accordance with accepted academic practice. No use, distribution or reproduction is permitted which does not comply with these terms.
*Correspondence: Xiaoyong Ni, bml4aWFveW9uZ0BibnUuZWR1LmNu