 Hedyeh Pouryazdankhah1
 Ali Shahnazari1*
 Mirkhalegh Z. Ahmadi1
 Mohammadreza Khaledian2,3
 Mathias N. Andersen4
- 1Water Engineering Department, Sari Agricultural Sciences and Natural Resources University, Sari, Iran
- 2Water Engineering Department, Faculty of Agriculture Sciences, University of Guilan, Rasht, Iran
- 3Department of Water Engineering and Environment, Caspian Sea, Basin Research Center, Rasht, Iran
- 4Department of Agroecology, Aarhus University, Tjele, Denmark
The objective of this study was to develop a crop model for sunflower in Daisy. For this intent, the field experiment data of two full irrigation treatments for 2 years, 2012 and 2013, were used to develop the crop model. The average RMSE of the dry matter (DM), leaf area index (LAI), height of plant (H), and water content parameters in the treatments utilized for calibration was calculated 0.093 Ton/ha, 0.198 cm2/cm2, 2.25 cm, and 1.035%, respectively. The average RMSE of the parameters of DM, LAI, H, and water content in the treatments utilized for validation were estimated 0.207 Ton/ha, 0.272 cm2/cm2, 4.22 cm, and 1.123%, respectively. The results of the validation showed that the developed crop model had good accuracy making it useful for simulation of sunflower agroecology. It is suggested to use the developed crop model in the information library of Daisy and survey and calibrate it for other areas with different climates and sunflower varieties.
Introduction
Field experiments have been widely used in traditional research methods to evaluate appropriate agricultural management practices such as tillage, plowing, sowing, harvesting, fertilization, and irrigation (Plauborg et al., 2010). Due to limitations in traditional agricultural research, the necessity of conducting the experiments using these methods is not negligible. Distinguishing the impacts of different management practices on the environment and crop yield in agriculture has prompted researchers to conduct surveys at the field scale. Therefore, simulation models are commonly used to support experimental projects (Hansen et al., 1990). Also, the necessity of establishing stable agriculture has prompted researchers, policymakers, and farmers to utilize crop simulation models (Oteng-Darko et al., 2013). The widespread evolution of computers since the 1960s has enabled researchers to illustrate plant physiological processes as functions. Subsequently, the mathematical equations were included in models to simulate crop growth. As a result, crop simulation models are now applied as advanced tools in agricultural research (Choudhary, 2018). In fact, a plant–soil system model can integrate existing information and simulate performance by considering the relationship between the cycles of energy, water, and nitrogen (N) under different external and bordering conditions (Hansen et al., 1990). Crop modeling is one of the most significant issues in agriculture that needs to be addressed in three key areas: research, crop system management, and policy analysis. One of the significant applications in research is identifying and monitoring the factors that influence plant growth, improving experimental documentation, and organizing the required data, especially when there is a lack of measured input data for analyzing crop yields. For this reason, crop modeling has increased appreciably in recent decades (Murthy, 2004; Di Paola et al., 2016).
In general, many models have been developed for simulating the soil–plant system, some of them are based on soil hydrology, such as HYDRUS and SWAT, which just consider the environmental stress (water, nutrients, and heat), and many others are based on the physiology of plants (such as APSIM and WOFOST), which consider the crop growth process and pay less attention to the applied stress on plants (Zhu et al., 2018). The plant growth modeling requires the initial parameters of the plants as inputs. Crop simulated models mimics the actual behavior of the plant by predicting the growth of plant components such as leaves, roots, stems, and seeds. These models contain quantitative information on major processes involved in crop growth and predicting the amount of final crop or harvestable crop (Oteng-Darko et al., 2013). One of the required options in crop models in simulating plant growth is selecting various plants and subsequently applying their input parameters or calling them from the database. Accordingly, it is necessary to survey the efficiency of the simulator models for multiple plants in the researches, which can be referred to some investigations about evaluating the different models, including WOFOST, CropSyst, EPIC, SWAT, AquaCrop, and DSSAT, to simulate the growth of some plants such as cotton, peanut, maize, and wheat (Thorp et al., 2014; Yuan et al., 2019; Gul et al., 2020; Karki et al., 2020).
The sunflower (Helianthus annuus L.) is a heat-loving annual plant (Ghadami Firouzabadi, 2015). Sunflowers can be classified into three groups according to their fatty acid profile. Meanwhile, the sunflower seeds have higher oleic acid and higher economic importance (Munder et al., 2017). Global food security ranked the sunflower fifth among the 13 most dominant crops from 1980 to 2005, and its economic value was estimated 267–384 million dollars per year (Seiler et al., 2017). Therefore, the sunflower is an essential crop in the production cycle of agricultural yield, and several studies have been carried out to develop and run the models simulating sunflower growth. According to a study conducted in a Mediterranean environment in the south of Italy, the models of WOFOST, CropSyst, and AquaCrop were evaluated based on considering three water regimes, including deficit irrigation, regulated deficit irrigation, and rain-fed since 2005 and 2007, for simulating the biomass and yield at the harvesting of sunflower. The results showed that despite the lower required input data in AquaCrop, the result of simulated yields was similar to the simulated yields in CropSyst and WOFOST, which were proposed to promote simpler models for managerial purposes, and in terms of limited input information, it was suggested to encourage the simpler models for the conditions of limited input data and management purposes (Todorovic et al., 2009). In a study conducted in China, it was detected that the WOFOST model failed to simulate the sunflower growth accurately. Therefore, they developed WOFOST-ES by considering general environmental stress (ES), which was calibrated by two-year data of micro-plot experiments and then validated by one-year field experiments. The measured and simulated parameters of leaf area index (LAI) and yield were compared by the statistical indicators, which showed high accuracy in simulating the yield (R2 = 0.99 and RMSE = 56 kg/ha) and the LAI (R2 = 0.86 and RMSE = 0.44) (Zhu et al., 2018). Another study was carried out on an experimental farm in Baghdad, Iraq, under different irrigation treatments to evaluate the AquaCrop model for simulating the yield and biomass of sunflower. The model was calibrated and validated based on the observed data during the cultivation seasons 2009 and 2010. The result showed a high agreement between observed and simulated data. The model was validated according to the obtained data from another field experiment in Ishaqi in 2005, and the result was acceptable by good agreements of R2 = 0.96 for biomass and R2 = 0.95 for yield (Sheet et al., 2019).
Daisy is one of the most successful models in scrutinizing the agricultural management issues in the agroecosystem (Manevski et al., 2016). Daisy is a flexible model in the soil–plant-atmosphere system that can simulate the components during the plant growth and development, yield, and the balance of water, heat, and salinity under different management in the conditions of one-dimensional (1D) and two-dimensional (2D). The model as well as is able to apply the scenarios of complex agricultural managements (Hansen, 2002). In a study, Daisy simulated crop rotation, especially the soil microbial biomass N and N-mineralization/immobilization. It was concluded that Daisy was only able to simulate the soil mineral N after incorporating the crop residues to some extent. Therefore, first, the dry matter produced on the surface was successfully adapted for pea, and the amount of N was calculated before incorporating it into the soil. Then, the plant modules for oil radish, rape, grass, and winter canola were fitted to the amount of the plant N and dry matter before and after winter. Hence, the residues of the plant decomposed at low temperature by considering the linkage of carbon (C) and N transfer and the function of temperature modifier, and finally, the model was developed according to a reliable criterion for dividing the green plant residues into a more recalcitrant pool and an easily decomposable pool (Müller et al., 2006). According to an investigation, the Daisy model was run based on the collected data from the semi-field experiment, the measured leaf gas exchange, and the soil water dynamics during the potato growth under different irrigation regimes in the project. Improving and developing the Daisy model included; modeling the 2D soil water flow, measuring the abscisic acid (ABA) signaling to identify its effect on stomatal conduction and subsequently the amount of transpiration and assimilation and the crop yield in partial root-zone drying irrigation. The measured and simulated data were compared. The results showed that the enhanced Daisy model was able to simulate the mechanisms underlying the water-saving effects of PRD irrigation compared to full irrigation (Plauborg et al., 2010). In another study, the Daisy model was run according to the data obtained from 2011 to 2013 from three experimental sites under the maize cultivation and one under the native annual prairie in the Mediterranean region of central Chile. Accordingly, four different treatments were considered based on the different irrigation methods, N management regimes, and crop rotation. Measured and simulated parameters, including the soil moisture at three depths and the content of soil mineral N at the top layer of soil, were statistically compared. The result presented a satisfactory agreement between the simulated and measured soil water content. The calculated coefficient efficiency (E) for the treatments ranged between 0.60 and 0.92. In terms of simulating the mineral N content, the E values were obtained, ranging from −0.93 to 0.81 for nitrate-N and from 0.36 to 0.77 for ammonium-N. Dispersivity was mentioned as the most sensitive parameter in nitrate simulation. The overall results showed that the Daisy model was acceptable for simulating water and nitrogen dynamics in coarse-textured soils (Salazar et al., 2017).
There is some stored information in the Daisy model as the library files, which can be set up and called into the model by a simple reference (Abrahamsen and Hansen, 2000). This facility for the various crops is accessible, the storing crop parameterization can be referred to based on the name of the crop in library files (Hansen, 2002). However, these stored files are available in the set-up of the Daisy model for many plants, such as maize, spring and winter rape, potato, onion, pea, rye, and white cabbage. However, no crop parameterization exists for sunflower as a library file (Abrahamsen and Hansen, 2000).
The significance of this work lies in addressing a critical gap in agricultural research by developing a tailored crop model specifically for sunflower (Helianthus annuus L.). Despite its economic importance and role in global food security, existing crop simulation models have not adequately captured the complexities of sunflower growth and yield dynamics. This manuscript proposes to fill this void by systematically assembling and refining the necessary parameters for sunflower crop modeling. Furthermore, existing models like Daisy have been successful in simulating agricultural management scenarios but lack comprehensive parameterization for sunflower. While some crops have dedicated parameterization files within the Daisy model, sunflower parameters have not been adequately addressed. Hence, the purpose of this study was to develop a crop model for sunflower. For achieving it, the main issues addressed in this paper are: (a) Classifying the required parameters and assembling the crop parameterization for sunflower, (b) Setting and modifying the parameters that were unavailable in reliable sources by using trial and error according to the obtained data from 2012 and 2013, and (c) Validating the developed crop model based on the data from six treatments in 2014 and 2015. In this study, we examined the following hypotheses; (1) The validation results will show the optimal performance of the Daisy model in simulating the growth of sunflower; (2) By modifying both the soil water model and the plant growth model and incorporating them into the Daisy model, the model can effectively simulate data associated with sunflower plants. Due to the application of the Daisy model as a management tool for irrigation and fertilization, the validated crop model can be set as a beneficial and practical file in the library of the Daisy model, which can be used as a database for applying the various agricultural management.
Materials and methods
Due to the importance of sunflower cultivation in most parts of the world as an oilseed, for developing a crop model for sunflower, the data obtained from 8 treatments of full irrigation (FI) 4-year cultivations (Ghadami Firouzabadi, 2015; Cheraghizadeh et al., 2018) and a 2D simulation of the soil water content and the growth conditions were performed by Daisy model. The simulated values of the physiological indicators, including the dry matter above the ground (DM), the height of plant (H), and the leaf area index (LAI) during the end of cultivation and as well as the simulated amount of soil water content in 3 depths of the root zone in soil profile were compared with the measured ones. The experimental station was located at the Sari Agricultural Sciences and Natural Resources University (SANRU).
The study area and cultivation condition
A study field with an area of 824 m2 was considered in the north of Iran, Sari (36° 39′ 36″ N and 53°4′ 3″ E), and the sunflower was cultivated in the rows with a distance of 75 cm for 4 years of 2012, 2013, 2015, and 2016. Before each annual cultivation, the topsoil was plowed to a depth of 30 cm. The irrigation tapes with the discharge of 2 L/h/m were set a at distance of 20 cm on both sides of each row, and the drippers of the tapes were 2 cm apart from each other. The TDR soil moisture sensor probes were installed between the plant rows and at three points on the farm to measure the soil water content (Figure 1).
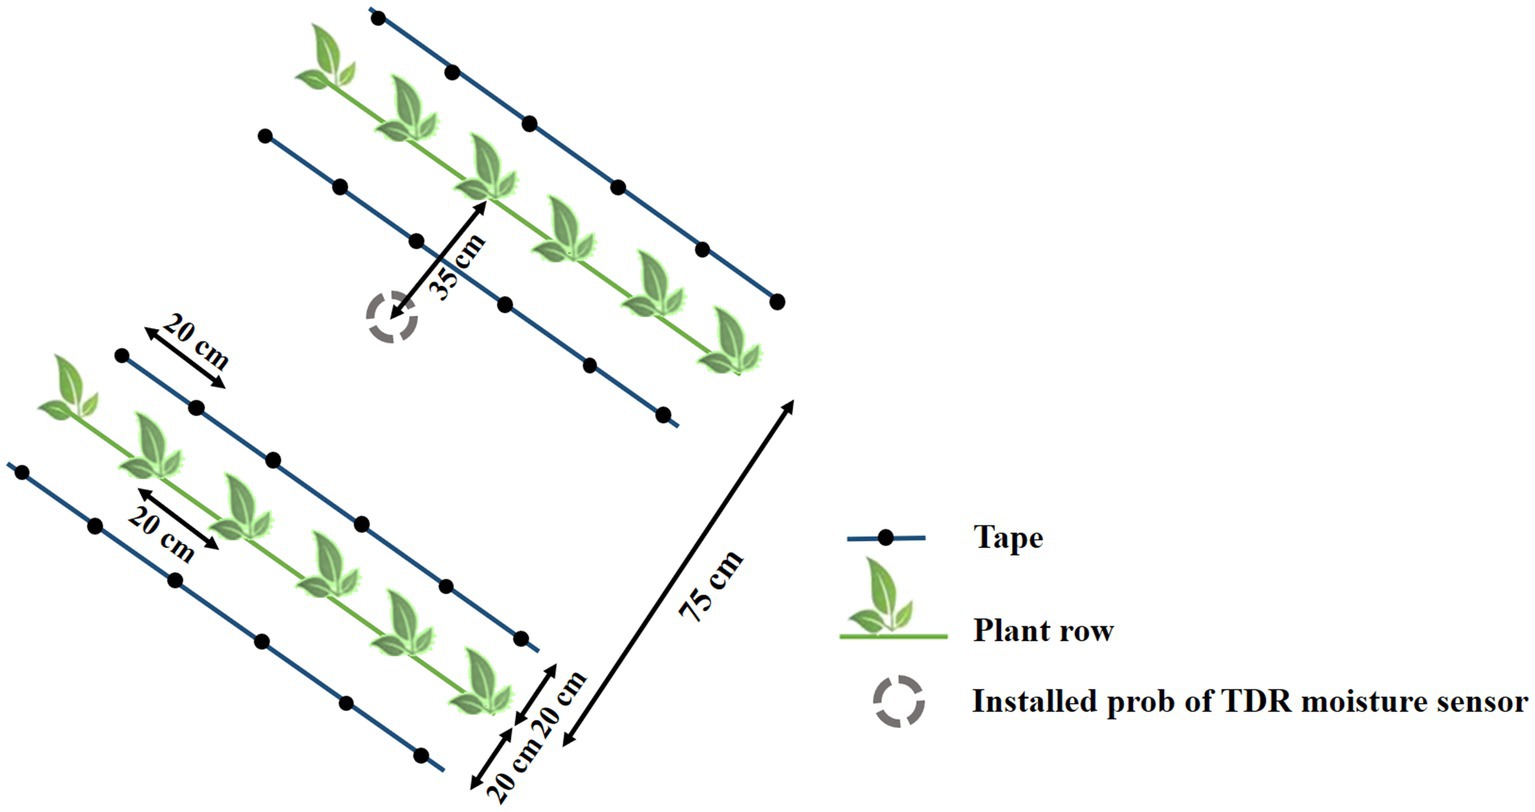
Figure 1. A schematic of the cultivation, irrigation tape row, and installed probe of TDR moisture sensor.
Climate data
The Daisy model requires the daily values of average temperature, precipitation, and global radiation for a continuous period of time, including the growth period for simulating. The daily climate data were received from Dasht-e-Naz meteorological station in Sari, which was the closest meteorological station to the study field (SANRU). The daily global radiation was calculated from the daily sun hours based on the relationship and coefficients obtained from tables (2–6) and (2–7) in FAO 56 (Allen et al., 1998) from 2011 to 2017. Then the daily data were defined as the inputs of the weather file for the Daisy model.
Properties and geometry of soil profile
The texture of the soil under cultivation was sandy-loam at a depth of 0–20 cm and was sandy-clay at the lower depths. The physical properties and soil hydraulic parameters of the study area are presented in Table 1. The soil profile was classified into three layers, and the properties of each layer were given to the model as input. The geometry of the soil profile was defined according to Figure 2 for the Daisy model. The soil water content at the center of each layer was measured from 40 days after sowing to the harvest time every 2 days by the TRIME-FM. Finally, 80 measured points obtained from the averaging of three probes were compared with simulated ones.
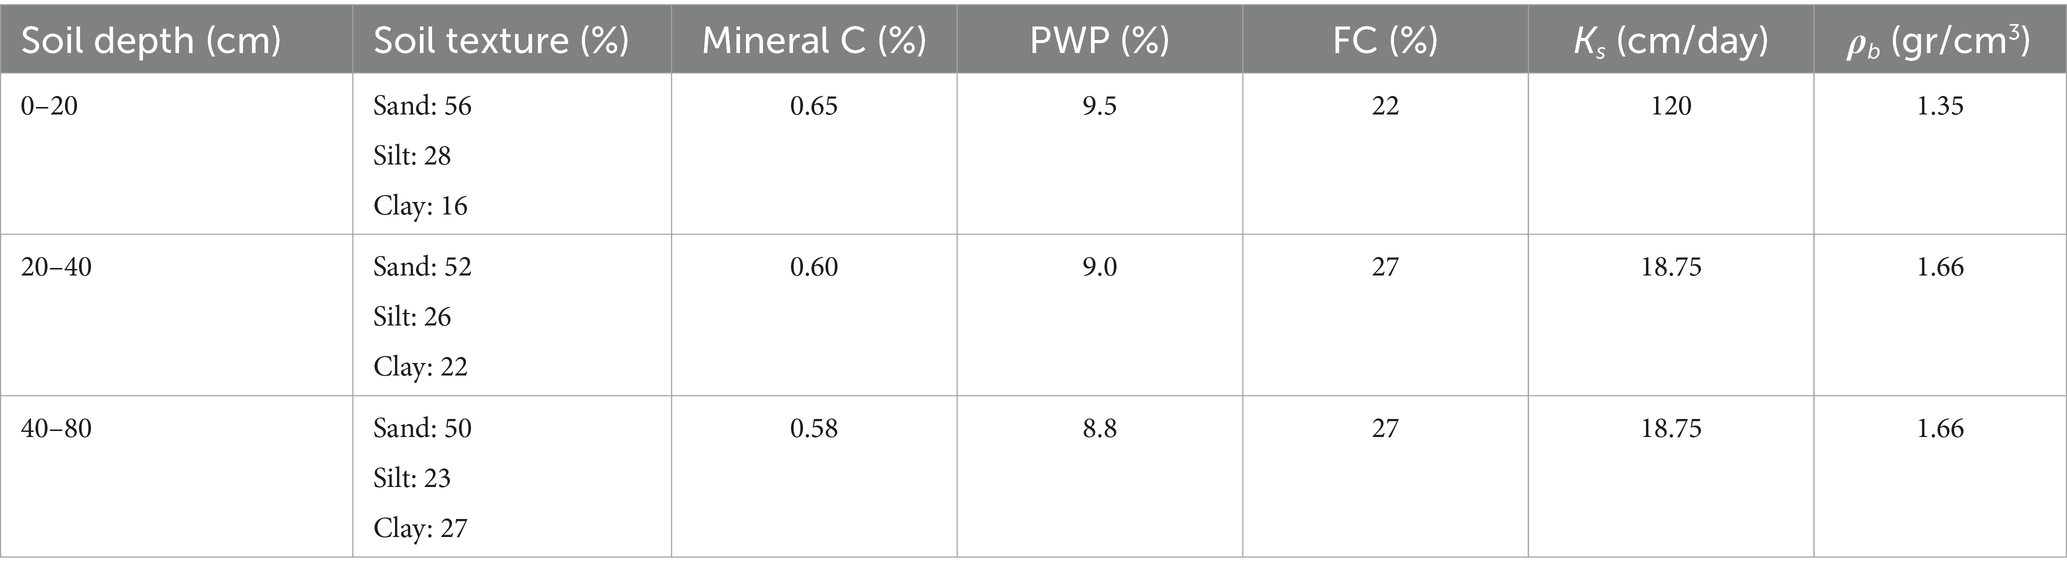
Table 1. Physical properties and soil hydraulic parameters.
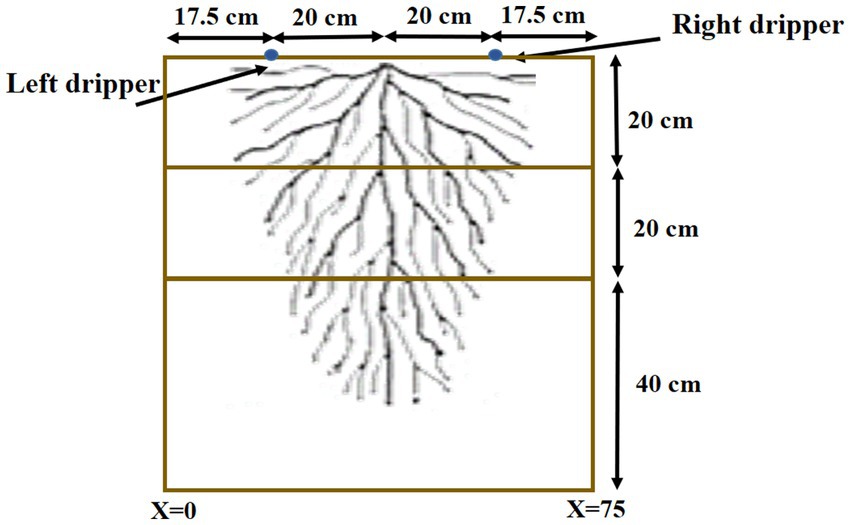
Figure 2. The defined geometry of soil profile for Daisy.
Farm management
The farm management carried out and the date of applying them, including irrigation, fertilization, plowing, preparing the cultivation bed, seed sowing depth, and the time of harvest, was defined as the inputs of the management file for the Daisy model. In this study, the soil fertilization including 100 kg/ha of potassium sulfate, 100 kg/ha of triple superphosphate, and 100 kg/ha of urea, were applied three times per year during the growing season, which was defined as the mineral fertilizers for the model.
Irrigation treatments
The Daisy model is able to simulate the yield at three levels based on the input parameters: (1) potential yield, (2) the yield limited by water stress, and (3) the yield limited by water and nitrogen stresses (Hansen, 2002). It is needed to define the condition without any stresses to develop the crop model, so simulation at the level of potential yield should be considered. The data were collected over 2012, 2013, 2015, and 2016 (Ghadami Firouzabadi, 2015; Cheraghizadeh, 2018). Azargol and Haisan varieties of sunflower were cultivated for two consecutive years, 2012–2013 and 2015–2016, respectively. The irrigation water requirements were calculated for the treatments of FI2012, FI2013, FI2015-20, FI2015-35, FI2015-50, FI2016-20, FI2016-35, and FI2016-50. The treatments of FI2012 and FI2013 were applied equally on both sides of each plant row every other day, and during each irrigation, the soil reached to field capacity limit (Ghadami Firouzabadi, 2015). The numbers 20, 35, and 50 at the end of naming the other treatments indicate the difference in irrigation interval, as described that the irrigation interval was defined as 3, 7, and 10 days _It means the next irrigation in scheduling was considered after 20, 35, and 50 mm evaporation from Class A evaporation pan_, respectively. During each irrigation, the soil reaches the field capacity limit so that the plants do not fact to any water stress (Cheraghizadeh, 2018). The LAI, H, and DM parameters of each treatment were measured in six stages at the end of crop growth. The measurings were conducted once a week until the harvest time by sampling from three random points in the field, and their average was estimated each time.
Crop model
There are the databases of crop model for many plants, such as maize, potato, onion, pea, etc., which can be referred to and calibrated for the various varieties of plants. But there is no crop parameterization for sunflower as a crop model in the library of Daisy (Abrahamsen and Hansen, 2000). Hence, it is necessary to develop a crop model for sunflower. To develop the model, first, it is needed to determine the required crop parameterization. Since the sunflower is a C3 plant, the file related to the winter rape in the Daisy model (wrap.dai), which is similarly a C3 plant, was chosen and analyzed. C3 plants produce 3-phosphoglycerate through photosynthesis and the assimilation of carbon dioxide (CO2) composed of three Carbon atoms (Fu et al., 2021). Then, the required parameters were arranged in four groups, which are described in detail as follows:
- First group: the required parameters in the crop model, which were obtained either directly or calculated based on the measured values and were defined as the input parameter in the crop model, such as developed stage (DS), development rate in the vegetative and reproductive stages (DSRate1 and DSRate2), crop height as a function of DS (HvsDS), maximum penetration depth (MaxPen) and specific leaf weight (SpLAI).
- Second group: the parameters obtained by trial and error and repeated run of the model for the two treatments of FI2012 and FI2013. So that after each run, the results of the measured parameters of the plant, including DM, H, and LAI, were compared with the simulated ones during the plant growth and fitted together to obtain a high correlation. Such as maximum assimilation CO2 rate (Fm), the death rate of roots and leaves (RtDR and LfDR), and specific leaf weight modifier used after the initial phase (LeafAIMod).
- Third group: the parameters whose default values were available in the Daisy Program Reference Manual (Abrahamsen, 2014) or the parameters applied to winter rape as a C3 plant. Such as, development stage at emergence (DS_Emr), DS at Crop Area Index (CAI) = 0.5 for initial phase (DSLAI05), relative CAI distribution at DS = 0 and DS = 1 (LAIDist0 and LAIDist1), temperature factor for assimilate production (TempEFF), specific storage organ weight (SpSOrgAI), specific stem weight (SpStemAI), factor defining maximum specific leaf weight (SPLAIfac), PAR reflectance (PARref), PAR extinction coefficient (PARext), quantum efficiency at low light (Qeff), penetration at emergence (DptEmr), penetration rate parameter which is a coefficient and threshold, respectively (PenPar1 and PenPar2), root radius (Rad), matrix potential at wilting point (h_wp), transport resistance in xylem (Rxylem), maximum NH4 uptake per unit root length (MxNH4UP), maximum NO3 uptake per unit root length (MxNO3UP), upper limit, critical limit, and non-functional limit for N-concentration (Pt, Cr and Nf), valuable fraction of storage organ (DM and N), e.g., grain or tuber (EconomicYield_W and EconomicYield_N).
- Fourth group: the required parameters which are specific to sunflower and were taken from valid references. Such as soil temperature sum at emergence (EmrTSum), which is referred to WOFOST model (Boogaard et al., 1998), temperature effect at vegetative and reproductive stages, respectively (TempEff1, TemEff2), and photoperiod effect at vegetative stage (PhotoEff1) (Dyer et al., 1959) and assimilate partitioning (Partit) (Conner and Conner and Hall, 1997), the last one was calibrated again like the parameters in the second group.
Finally, given that the data of at least 2 years to develop the model was required, the data collected in 2012 and 2013 were utilized, and thereafter, the developed model was validated according to the six treatments in 2015 and 2016.
Trial and error method of the parameters
First, all the values of the parameters in the first, third, and fourth groups were applied to the model. Sensitivity analysis was performed for four parameters of the second group (Fm, LeafAIMod, LfDR, and RtDR). For this purpose, the defined numbers for winter rape were considered, and each time, the values of the three parameters were kept constant, and one parameter was varied in the range of ±10%. The changes in the two output parameters of DM and LAI were compared with the initial value during each variation. The sensitivity analysis results illustrated that the most sensitive parameters were ranked as; Fm, LeafAIMod, LfDR, and RtDR, respectively. Accordingly, the two parameters Fm and LeafAIMod, were prioritized for trial and error. Since the two pairs of data defined for the LeafAIMod in the crop model of winter rape [for the crop developed stage (DS) of 1 and 2], the function was not able to simulate the output LAI values, especially in the last half of the crop growth period. For this purpose, seven pairs of data of DS were recounted; 0, 1, 1.16, 1.33, 1.5, 1.65, and 2. For distinguishing the optimum value of both Fm and LeafAIMod parameters, at least 5 × 5! the run was performed for trial and error. After each trial and error, the simulated and measured values of LAI and DM were compared based on the 2012 and 2013 treatments with the statistical index of RMSE; root mean square error (Willmott, 1982) in Excel. Finally, the functions of LfDR and RtDR were modified, and due to the low sensitivity of these parameters in simulating LAI and DM, the optimum values were estimated by a limited number of trial and error. Thus the optimum values were identified after about 50 times of running the model.
Statistical indices
In the present study, the simulated parameters of LAI, H, DM, and water content were compared with measured ones by statistical indices after each time of trial and error and as well as for validation. The statistical indices utilized are as follows; R2: coefficient of determination (Wang et al., 2006), RMSE (Willmott, 1982), NRMSE: Normalized Root Mean Square Error (Jamieson et al., 1991; Bannayan and Hoogenboom, 2009), and EF: Efficiency Factor (Nash and Sutcliffe, 1970). R2 can take on any value between 0 and 1. R2 and EF, approaching 1 and RMSE close to zero, indicate a high correlation and accuracy between simulated and measured values. NRMSE in the ranges of 0–10, 10–20, and 20–30% indicates the model’s excellent, good, and medium performance, respectively. If NRMSE is calculated at more than 30%, it means that the model’s performance is unacceptable. Finally, the T-test for paired samples was used in the SPSS (version 22) to determine the significance of the difference between the simulated and measured values.
Results and discussion
The parameters of the first, third, and fourth groups in the crop model were applied directly. For determining the optimum values of the parameters of the second group, after performing the sensitivity analysis and prioritizing the most sensitive parameters, trial and error were manually tried about 650 times. After each trying, the outputs of the Daisy model (LAI and DM) were compared with the collected data of FI2012 and FI2013 treatments by RMSE. After applying the optimal values, the model was calibrated according to the physiological indicators of the plant, including LAI, H, DM, and water content by statistical indices, and as well as the significance of their differences was examined by the T-test for paired samples in SPSS. Ultimately, the final crop model was developed based on the approved crop parameterization, which obtained the best results of statistical indices. The details of which are presented in Supplementary Appendix 1 in the format of (.dai) for the Daisy model, which can also be run by the TexPad software.
The results of RMSE, NRMSE, and EF, obtained from running the final approved crop model to compare the observed and simulated physiological indicators and water content, are presented in Table 2. The correlation between the simulated and measured parameters (R2) and the significance of the difference between them are presented in Table 3. To compare the simulated and observed data, one to one line was used, the diagrams related to the parameters of LAI, H, DM, are shown in Figure 3 and the diagrams for comparing the simulated and measured water content are presented in Figure 4.
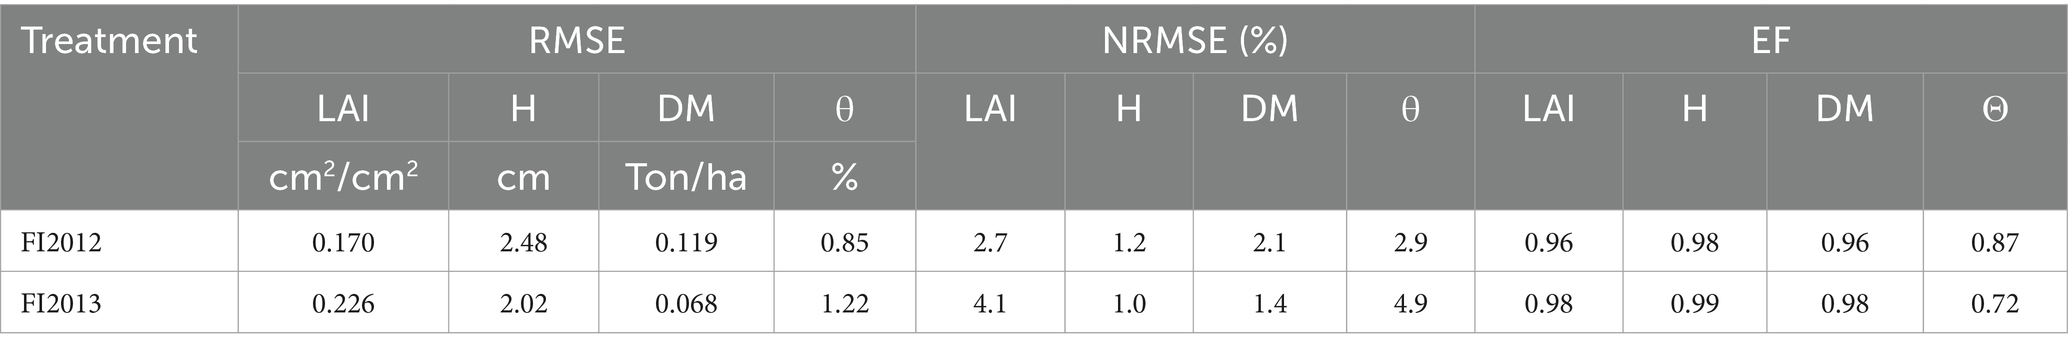
Table 2. Comparison of the simulated and measured parameters by statistical indices according to the final approved crop model for 2012 and 2013.
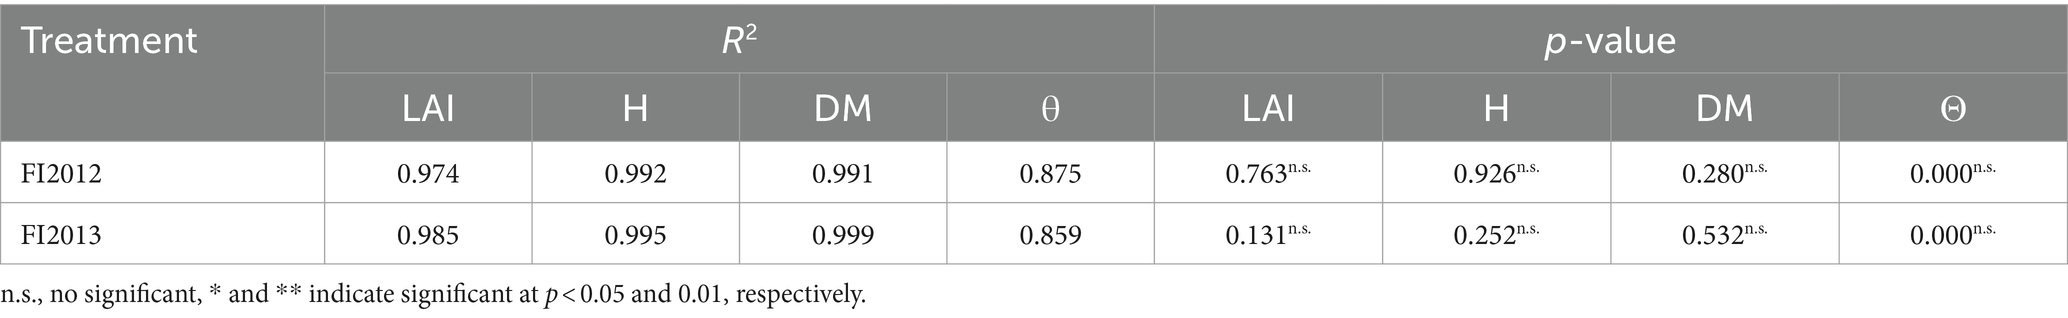
Table 3. Results of T-test for paired-samples in SPSS and the correlation (R2) of simulated and measured values of parameters for 2012 and 2013.
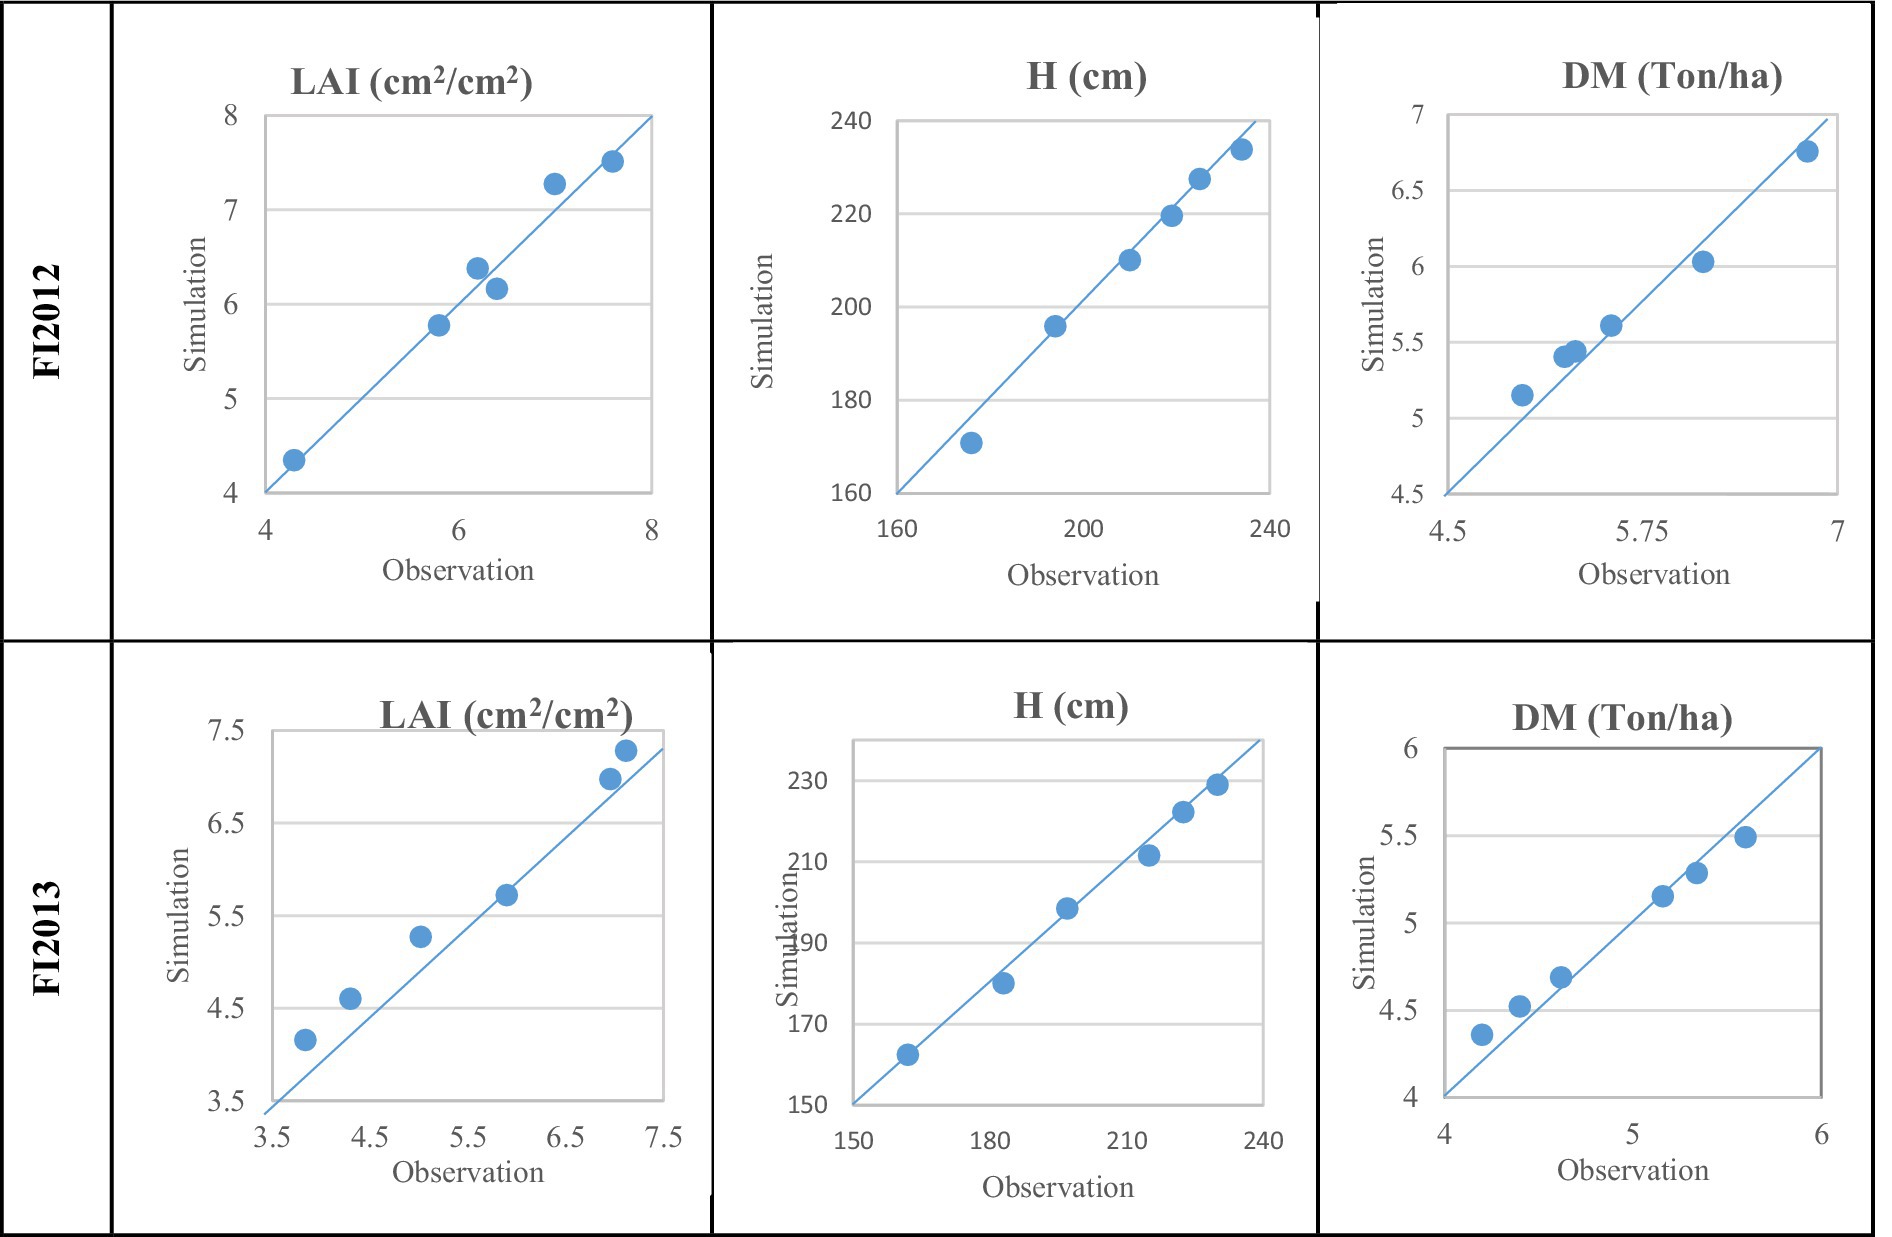
Figure 3. Compration of simulated and measured values of Leaf Area Index (LAI), Height of plant (H), and above-ground Dry Matter (DM) for FI2012 and FI2013 treatments based on one-to-one line.
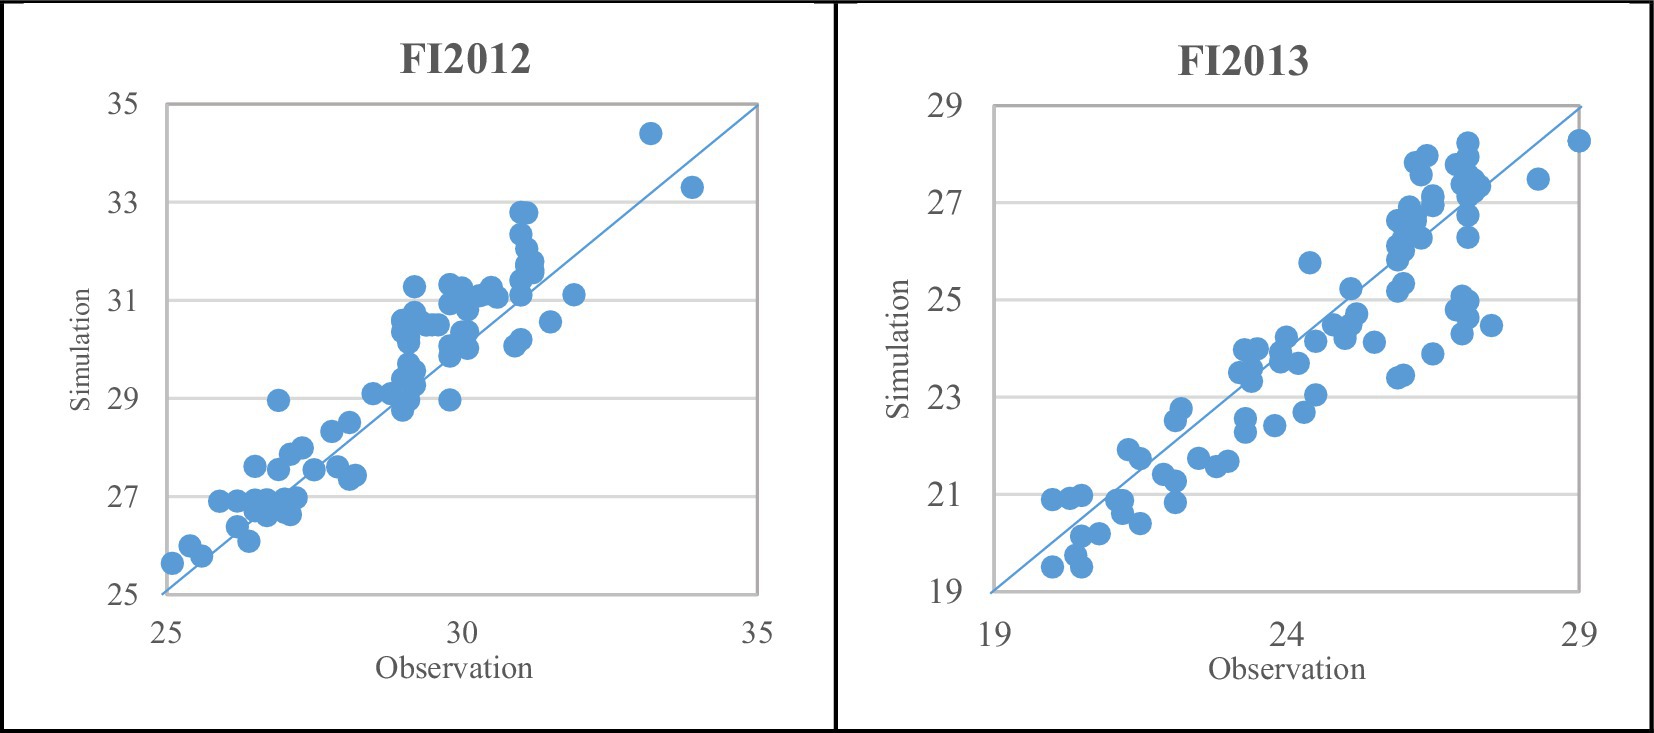
Figure 4. Compration of simulated and measured values of water content (%) for FI2012 and FI2013 treatments based on one-to-one line.
The results of statistical indices in Table 2 denote that the final considered crop parameterization for sunflower was acceptable for the Daisy model because the obtained values of RMSE and NRMSE show that the model was able to simulate the physiological indicators of the plant and water content of the soil profile with the least error. In order that the average value of RMSE of the parameters of LAI, H, DM, and water content in 2012 and 2013 was obtained 0.198 cm2/cm2, 2.25 cm, 0.093 Ton/ha, and 1.03%, respectively. The average value of NRMSE over 2 years for LAI, H, DM, and water content were calculated 3.4, 1.1, 1.7, and 3.9%, respectively, which are classified in the excellent range of the model performance (Jamieson et al., 1991; Bannayan and Hoogenboom, 2009).
The average EF for the physiological indicator of the plant was close to 1, estimated in the range of 0.96–0.99 and for the water content was estimated 79% over 2 years of 2012 and 2013. The results of R2 in Table 3 show that there is a great correlation between the simulated and observed parameters of each treatment (R2 = 0.859–0.999). Similarly, the results of the T-test for paired samples in Table 3 show that there was no significant difference between the simulated and measured parameters in treatments FI2012 and FI2013. In another investigation, with the aim of site-specific calibrating the Daisy model for potato and introducing the sensitive parameters of the crop model, the field data of seven varieties of potato were collected from six sites over Europe for 3 years, so that field data of 2 years were used for calibration and the collected data of last year were used for validation. Six parameters of the crop model, including PenPar1, DSLAI05, SpLAI, Fm, DSRate1, and DSRate2 were determined as the sensitive parameters. Calibration and validation of potato parameterization in the crop model were performed according to NRMSE in order to compare the measured and simulated parameters of DM and the total N content of stems, leaves, and tubers (Heidmann et al., 2008). In the present investigation, the measured parameters of LAI, DM, H, and water content were considered and compared with the simulated ones to develop a crop model for sunflower based on the data generated over 2 years. The statistical indices showed that the developed crop model was acceptable. Attributable to the fact that the crop parameterizations of the first group were calculated according to the measurements of these 2 years, validation was performed to evaluate the developed crop model for sunflower.
For validating the developed crop model, each of the six treatments in 2015 and 2016 was run by the Daisy model. Thereafter, the simulated values of LAI, H, DM, and water content were compared with the measured ones during the crop season by statistical indices, and also the significance of their differences was distinguished by a T-test for paired samples in SPSS, the results of which are presented in Tables 4, 5.
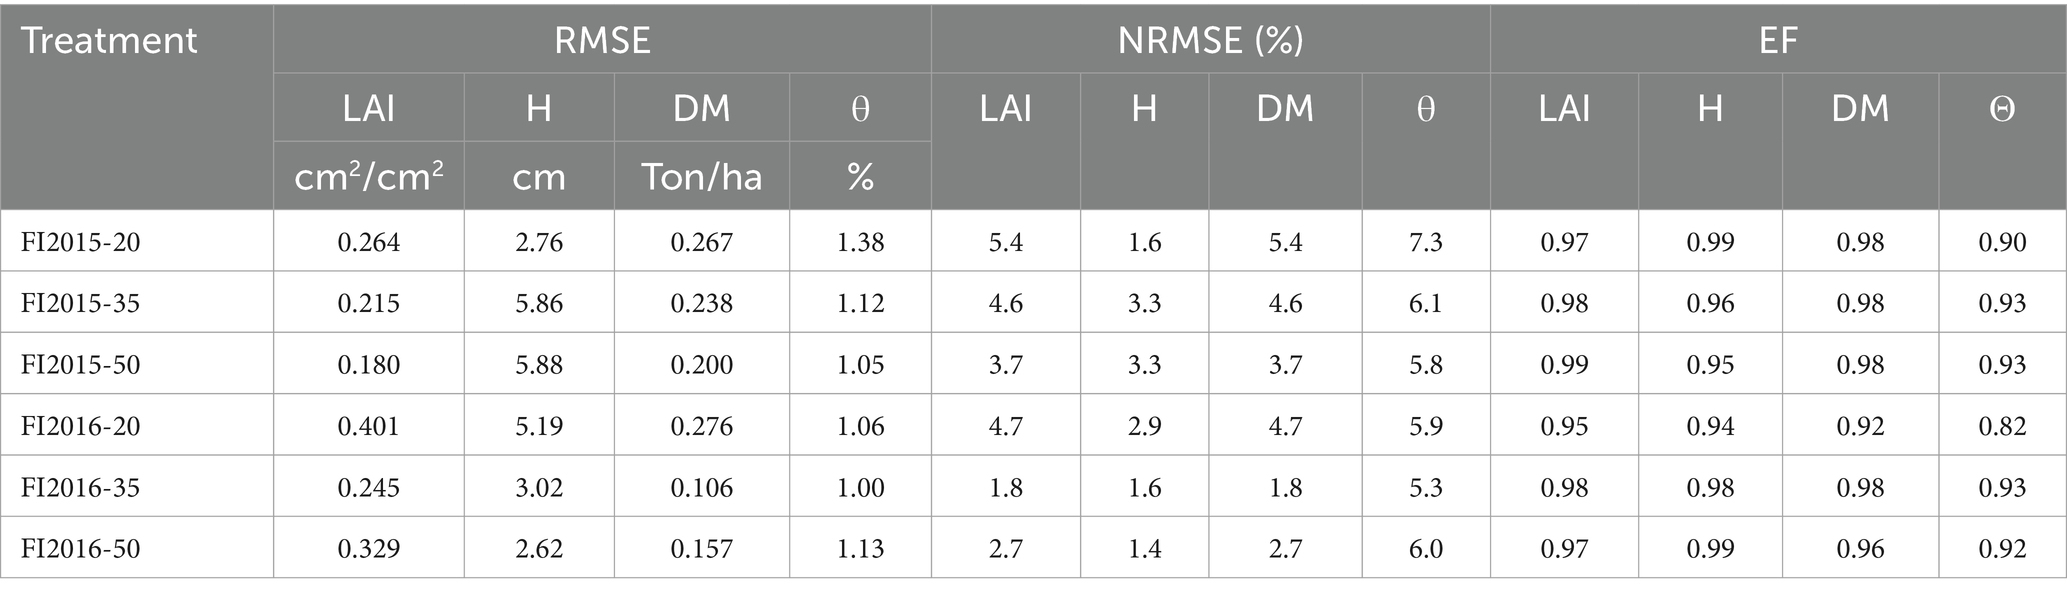
Table 4. The result of validation showed the comparison of the simulated and measured parameters by statistical indices for 2015 and 2016.
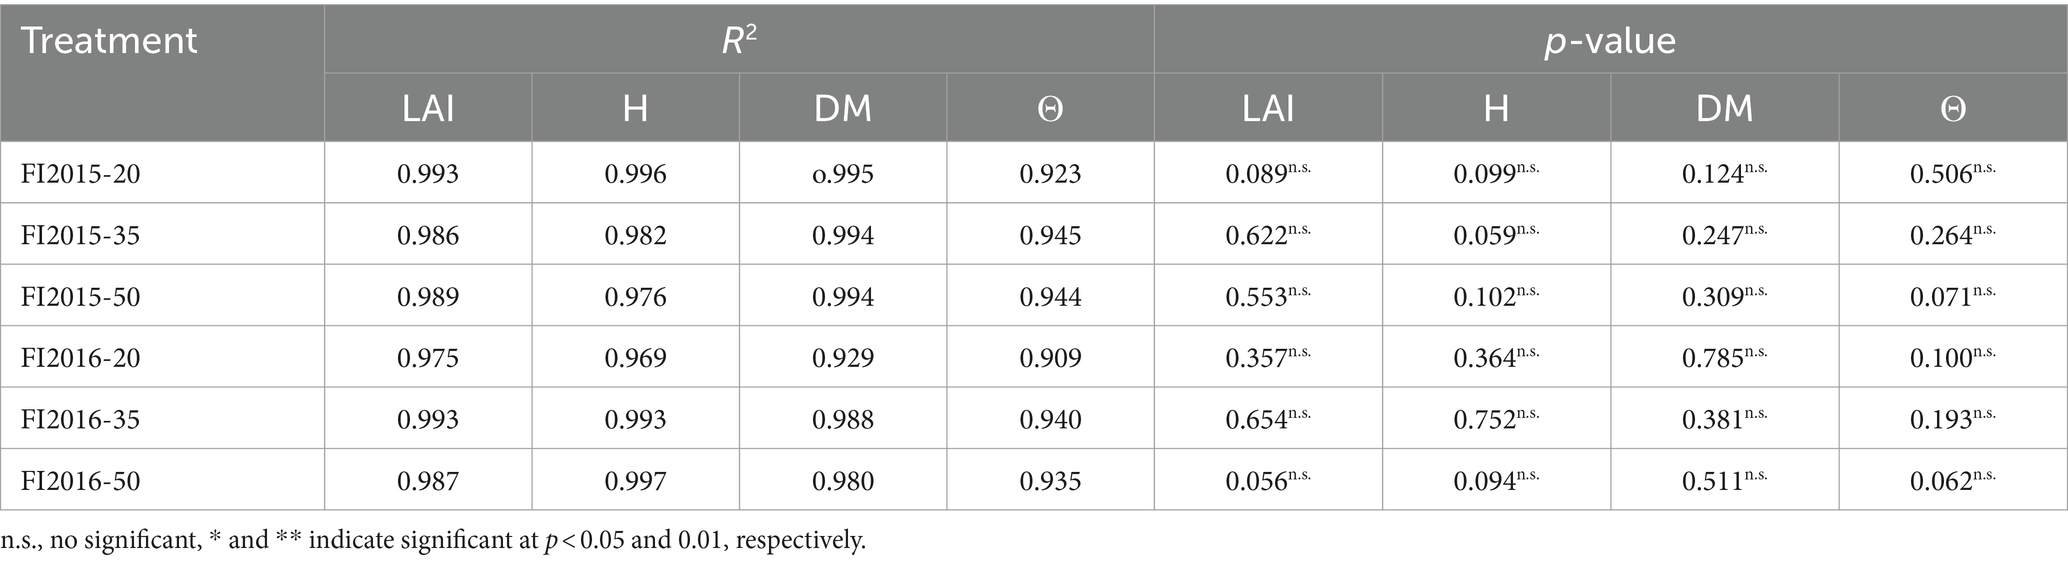
Table 5. Results of T-test for paired-samples in SPSS and the correlation (R2) of simulated and measured values of parameters for 2015 and 2016.
Some diagrams are presented in Figure 5, denoting the comparison between the simulated and observed parameters of LAI, H, DM, and water content for three treatments in 2015 and 2016 as the samples, and one to one line was used to evaluate the correlation between them. The results in Table 4 show that the EF values were in the range of 0.82–0.99, which indicates that the Daisy model is able to simulate admissibly the physiological parameters and water content by considering the developed crop model for sunflower.
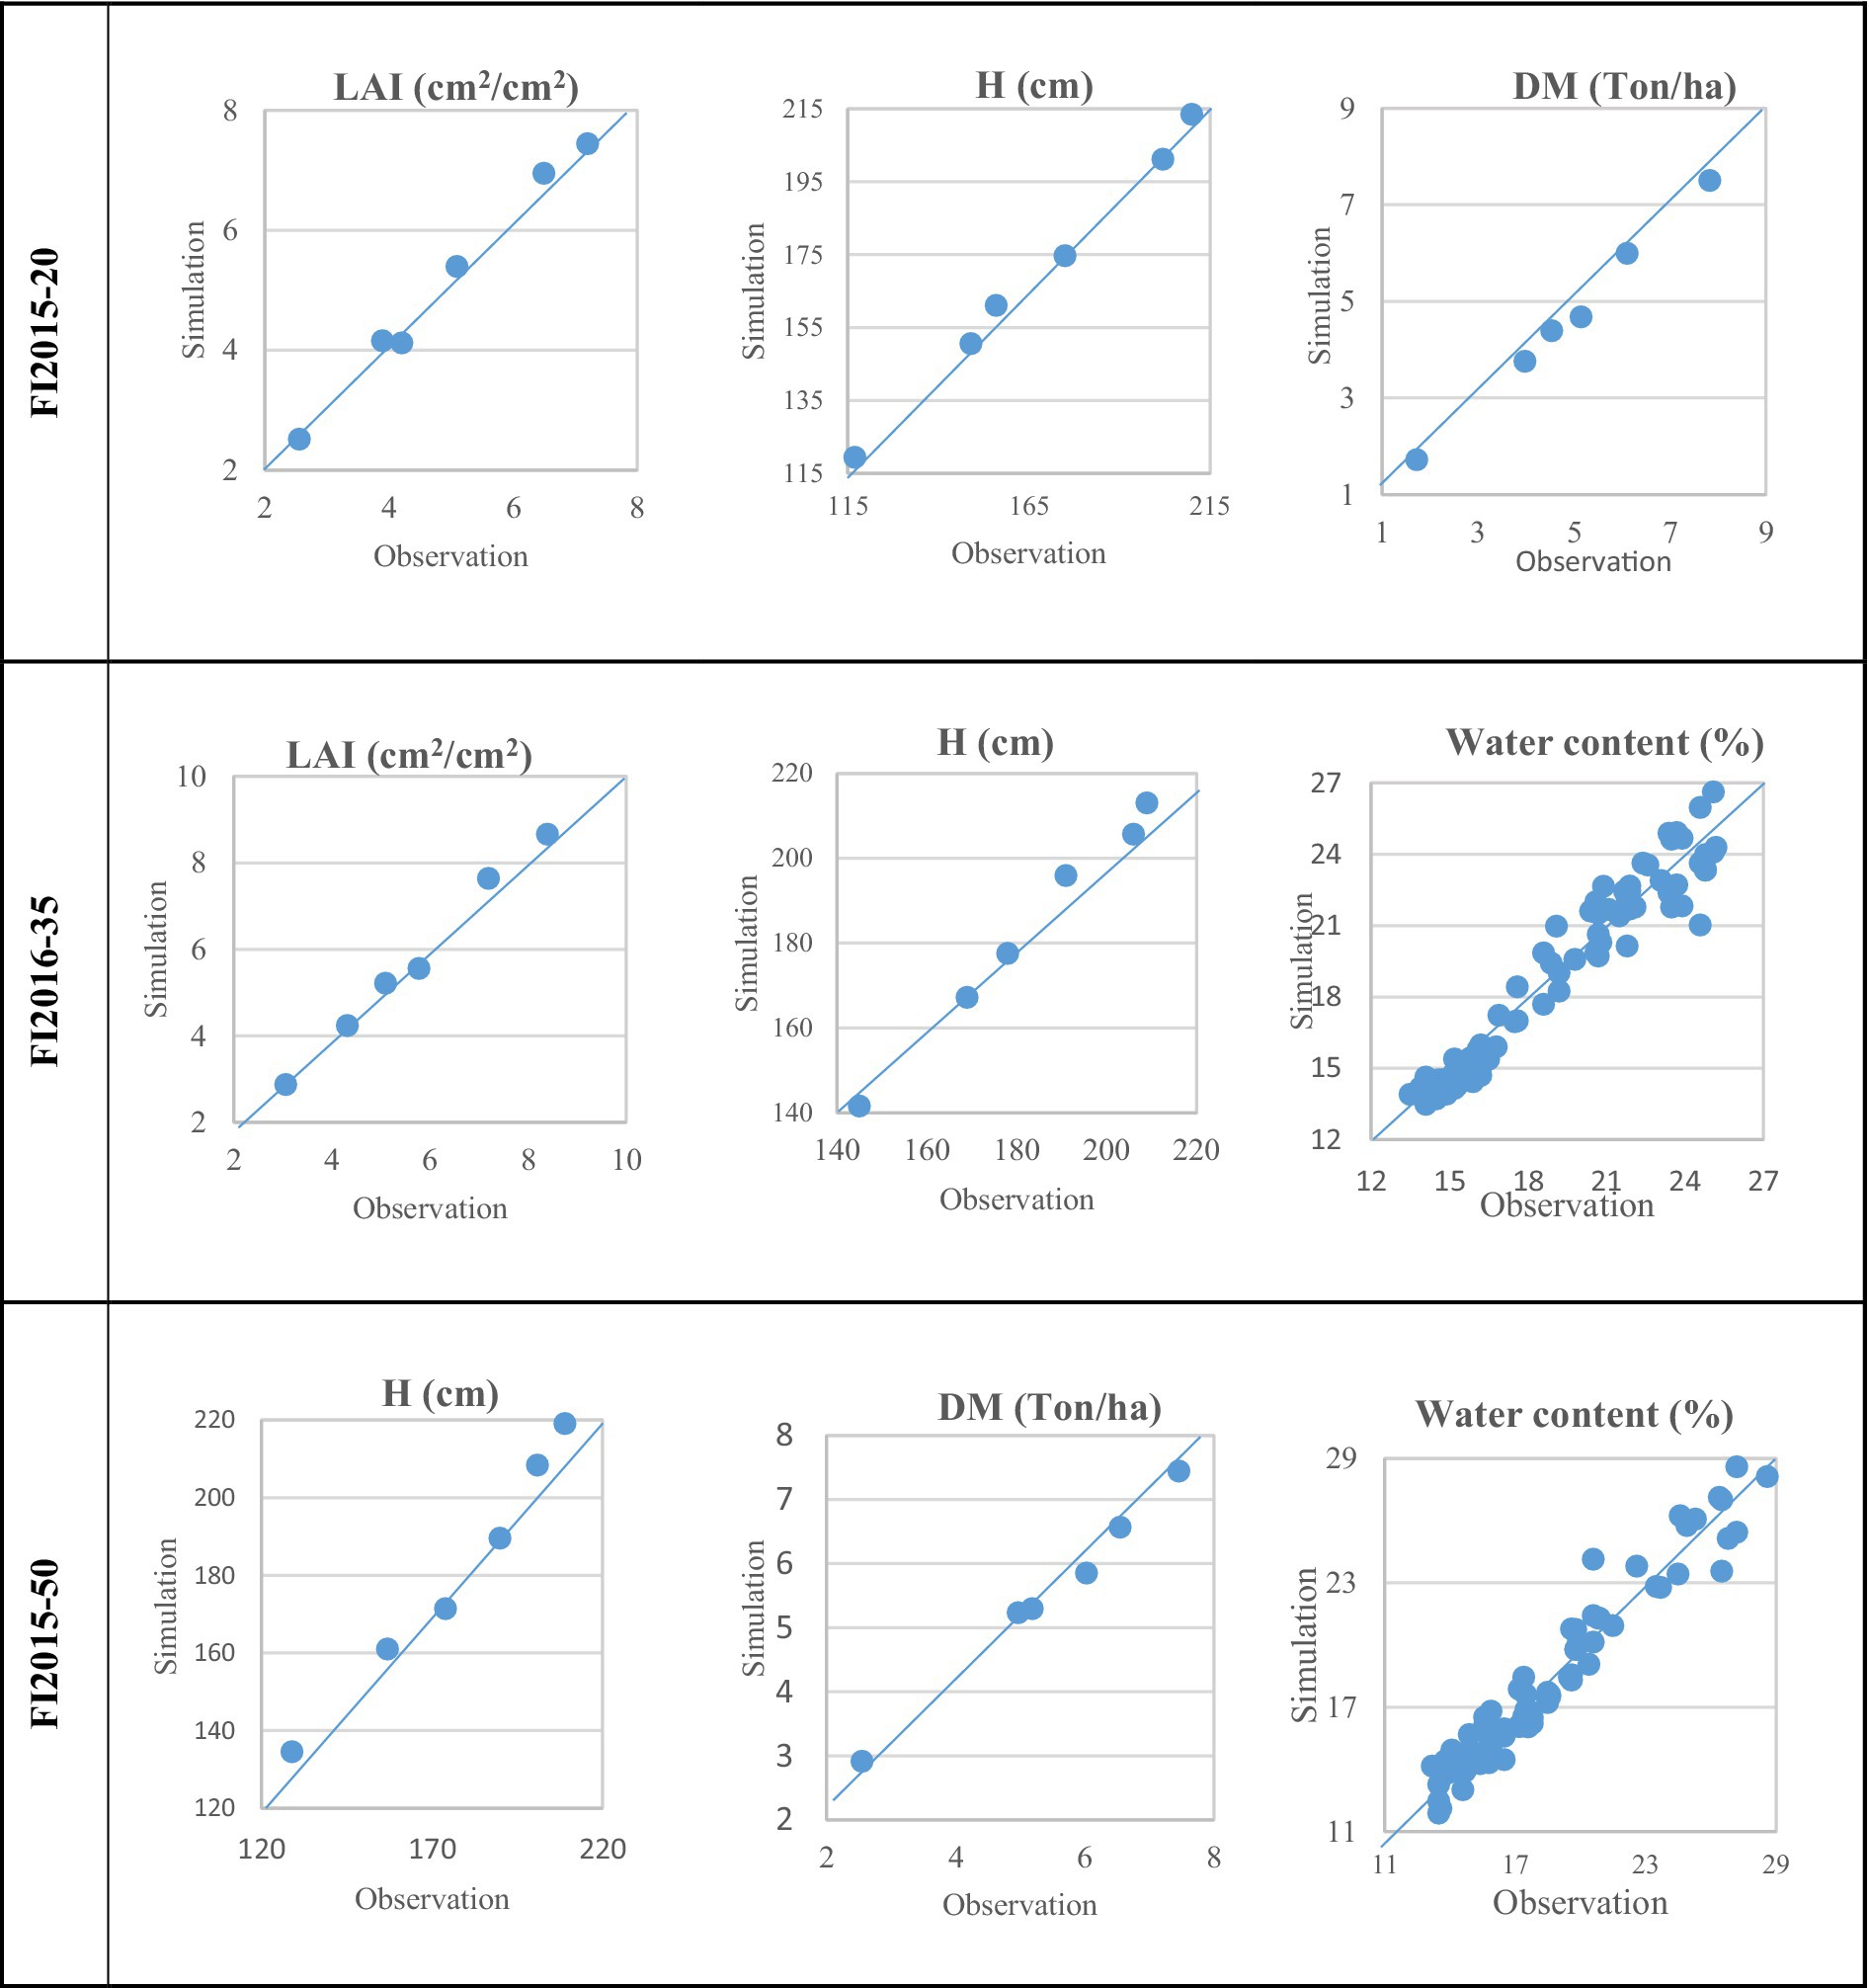
Figure 5. Samples of the diagrams, denoted the simulated and measured parameters of Leaf Area Index (LAI), Height of plant (H), Dry Matter (DM), and water content for three treatments of FI2015-20, FI2015-50, and FI2016-35 in 2015 and 2016 according to the one-to-one line.
The calculated NRMSEs in all treatments and mentioned parameters were in the range of 1.4–7.7%, which is in the excellent range based on the classification offered by Jamieson et al. (1991) and Bannayan and Hoogenboom (2009) and showed that the Daisy model had an acceptable performance in the running of six FI treatments. The mean RMSE values of the six FI treatments for the parameters of LAI, H, DM, and water content were estimated 0.272 cm2/cm2, 4.23 cm, 0.207 Ton/ha, and 1.12%, respectively. The crop height as a function of DS (HvsDS) and the maximum highest of sunflower were defined in the crop model according to the average of the collected data in 2012 and 2013, subsequently, the average error for simulating the crop height was estimated 2% of the maximum crop height (235 cm), which can be neglected.
The T-test results for paired samples in Table 5 show that there was no significant difference between the simulated and measured parameters of LAI, H, DM, and water content in the treatments related to validation. The R2 calculated for the treatments of validation indicated the high correlation obtained near one. In a similar study, the crop model OILCROP-SUN was calibrated and evaluated according to the experimental data of two sunflower genotypes cultivated under semi-arid conditions, and the measured and simulated parameters of growth components and crop phenology were compared by RMSE (Leite et al., 2014). The aggregate result of the statistical indices for validation in the present study illustrated that the developed crop model applied for sunflower in the Daisy model qualified for simulating the plant physiological indicators and the soil water content of the FI treatments. However, further study on evaluating and calibrating the developed crop model in the diverse cultivation conditions, including the different climatic and various varieties of sunflower, is therefore recommended because this study set out to develop a new crop model. As mentioned in an investigation, the effect of input data related to the different management strategies and climate change were surveyed on the crop model outputs during a 9-year period. For the evaluation, the measured yield of winter wheat and spring barley was compared with the outputs of the DSSAT crop growth model. The highest variance was observed in the light-texture soils in the driest area (Thaler et al., 2018). In the present study, although varieties of cultivated sunflower differed from developing and validating the crop model, the experimental field and the climate were the same for both.
The comparison of measured and simulated soil water content indicated the acceptable performance of the soil water model and the accuracy of the input data about the herbal parameters related to sunflower in the crop model of Daisy so that the average RMSE, NRMSE, and EF were obtained 1.1, 5.52, and 87.75%, respectively. Gardner (1964) stated that the water retaining, the relative distribution of roots with depth, and transmitting properties of the soil are the main factors of the water uptake pattern, and he also expressed that the total number of roots is virtually unimportant. These main features in the water uptake are estimated according to the calculation of the input data in the soil water model and crop model in Daisy. Hence, MaxPen and Partit in the crop model can be the effective parameters in estimating the water uptake and, subsequently, the soil water content. Guswa (2010) surveyed the effect of various factors, including vegetation type, climate, soil properties, and nutrients, on the depth of plant roots and stated that the water-optimal root depth depends on the factors of the potential transpiration and climate, especially precipitation, and thus, the root depth is shallower in the wet regions rather than the dry regions. In this study, the maximum penetration depth of root for sunflower was defined as 70 cm in the crop model, based on the field measurements in 2012 and 2013, while the root depth for sunflower, was mentioned 80–150 cm according to FAO56 (Allen et al., 1998) and was mentioned 150 cm according to the WOFOST model (Boogaard et al., 1998). The MaxPen, is considered equal to 70 cm in the developed crop model, makes the satisfactory amount of water content to the Daisy model, which is an the acceptable estimate of water uptake by the root system in the model. Given that the study region has a humid climate (Khalili and Rahimi, 2018), considering shallower depth of root in this study is justifiable, but it is recommended for further investigations, the real MaxPen can be considered in further study regions with the different climates.
In this study, developing a crop model for the sunflower was the principal goal, thus, the simulation scale was a 2D soil profile, including a plant of sunflower and the drippers around it to consider the condition in detail. But one of the basic scales of the Daisy model’s application is the field, which can operate in the management unit and as well as in the distributed mode of the several fields (Hansen et al., 2012). Although field-scale simulation needed multiple substructures to apply to the Daisy model, the development of the new crop model for sunflower, conducted in the present study, could be practical in simulating sunflower under various agricultural managements for field-scale. Hence, it is suggested to evaluate the efficiency and accuracy of the developed crop model for different climates and varieties, and then to apply for simulating the fields of sunflower in order to survey the field managements.
Conclusion
This study aimed to develop a crop model for sunflower, carried out according to the field measurements data collected in 2012 and 2013, and thereafter the developed crop model was validated based on six treatments of FI in 2015 and 2016 by comparing the measured and simulated parameters of LAI, H, DM, and soil water content. The validation results according to the plant’s physiological parameters indicated that the developed crop model for the sunflower was approved. The MaxPen was considered 70 cm in the crop model, which was shallower than the presented maximum depth of the root penetration in other valid references (WOFOST and FAO56), but it was justifiable for humid regions similar to the study region. The Daisy model was able to satisfactorily simulate the soil water content, which indicated the accuracy of the input crop parameterization, especially the relevant parameters; MaxPen and Partit. Since the Daisy model can simulate the conditions under complex management at the field level, it is recommended that the crop model for sunflower be investigated for the various regions, including the different climates, soil textures, and the varieties of sunflower, and then be applied to the different agricultural management at the field level. The implications of the current study include advancing sunflower cultivation practices, supporting adaptation to climate change, and informing decision-making in agriculture. Future works should focus on expanding the model’s applicability, validating it across diverse environments, and integrating it into decision support systems for practical use by farmers and agricultural stakeholders.
Data availability statement
The original contributions presented in the study are included in the article/supplementary material, further inquiries can be directed to the corresponding author.
Author contributions
HP: Conceptualization, Data curation, Investigation, Methodology, Software, Writing – original draft, Writing – review & editing. AS: Methodology, Project administration, Supervision, Writing – original draft, Writing – review & editing. MZA: Supervision, Writing – review & editing. MK: Supervision, Validation, Writing – review & editing. MNA: Software, Supervision, Writing – review & editing.
Funding
The author(s) declare that no financial support was received for the research, authorship, and/or publication of this article.
Conflict of interest
The authors declare that the research was conducted in the absence of any commercial or financial relationships that could be construed as a potential conflict of interest.
The author(s) declared that they were an editorial board member of Frontiers, at the time of submission. This had no impact on the peer review process and the final decision.
Publisher’s note
All claims expressed in this article are solely those of the authors and do not necessarily represent those of their affiliated organizations, or those of the publisher, the editors and the reviewers. Any product that may be evaluated in this article, or claim that may be made by its manufacturer, is not guaranteed or endorsed by the publisher.
Supplementary material
The Supplementary material for this article can be found online at: https://www.frontiersin.org/articles/10.3389/fsufs.2024.1370063/full#supplementary-material
References
Abrahamsen, P. (2014). Daisy program reference manual : University of Copenhagen, Department of Basic Sciences and Environment, Environmental Chemistry and Physics (March 26, 2014, 558). Frederiksberg, Copenhagen: University of Copenhagen.
Abrahamsen, P., and Hansen, S. (2000). Daisy: an open soil-crop-atmosphere system model. Environ. Model. Softw. 15, 313–330. doi: 10.1016/S1364-8152(00)00003-7
Allen, R. G., Pereira, L. S., Raes, D., and Smith, M. (1998). Crop evapotranspiration: Guidelines for computing crop requirements, FAO irrigation and drainage paper 56. Rome: FAO.
Bannayan, M., and Hoogenboom, G. (2009). Using pattern recognition for estimating cultivar coefficients of a crop simulation model. Field Crop Res. 111, 290–302. doi: 10.1016/j.fcr.2009.01.007
Boogaard, H. L., van Diepen, C. A., Rötter, R. P., Cabrera, J. M. C. A., and van Laar, H. H. (1998). User’s guide for the WOFOST 7.1 crop growth simulation model and WOFOST Control Center 1.5. Tech. Doc. 52. Wageningen: DLOWinand Staring Centre.
Cheraghizadeh, M. (2018). Evaluation of the effect of irrigation interval by conducting partial rootzone drying (PRD) deficit irrigation and full irrigation (FI) on sunflower plant (Hysun25) and its simulation by using HYDRUS-2D model. Ph.D. dissertation, Sari Agricultural Sciences and Natural Resources University, Sari. (In Persian).
Cheraghizadeh, M., Shahnazari, A., and Ziatabar Ahamadi, M. (2018). Evaluation of the effect of irrigation interval by conducting partial rootzone drying (PRD) deficit irrigation and full irrigation (FI) on sunflower plant. Iran. J. Soil Water Res. 49, 439–451. doi: 10.22059/jiswr.2017.236874.667715, (In Persian)
Choudhary, D. (2018). Crop growth simulation model for agriculture. Assignment. 22. doi: 10.13140/RG.2.2.35505.28008
Conner, D. J., and Hall, A. J. (1997). “Sunflower physiology” in Sunflower technology and production, monograph no. 35. ed. A. A. Schneiter (Madison: ASA, CSSA, SSSA), 113–182.
Di Paola, A., Valentini, R., and Santini, M. (2016). An overview of available crop growth and yield models for studies and assessments in agriculture. J. Sci. Food Agric. 96, 709–714. doi: 10.1002/jsfa.7359
Dyer, H. J., Skok, J., and Scully, N. J. (1959). Photoperiodic behavior of sunflower. Botanical Gazette 121, 50–55. doi: 10.1086/336042
Fu, P., Meacham-Hensold, K., Siebers, M. H., and Bernacchi, C. J. (2021). The inverse relationship between solar-induced fluorescence yield and photosynthetic capacity: benefits for field phenotyping. J. Exp. Bot. 72, 1295–1306. doi: 10.1093/jxb/eraa537
Gardner, W. R. (1964). Relation of root distribution to water uptake and availability. Agron. J. 56, 41–45. doi: 10.2134/agronj1964.00021962005600010013x
Ghadami Firouzabadi, A. (2015). The water use management and soil changes by full irrigation and partial rootzone drying (PRD) in sunflower. Ph.D. dissertation. Sari Agricultural Sciences and Natural Resources University, Sari. (In Persian).
Gul, F., Ahmed, I., Ashfaq, M., Jan, D., Fahad, S., Li, X., et al. (2020). Use of crop growth model to simulate the impact of climate change on yield of various wheat cultivars under different agro-environmental conditions in Khyber Pakhtunkhwa, Pakistan. Arab. J. Geosci. 13:112. doi: 10.1007/s12517-020-5118-1
Guswa, A. J. (2010). Effect of plant uptake strategy on the water− optimal root depth. Water Resour. Res. 46:W09601. doi: 10.1029/2010WR009122
Hansen, S. (2002). Daisy, a flexible soil-plant-atmosphere system model. The Royal Veterinary and Agricultural University, Department of Agriculture Science, Laboratory for Agrohyrology and Bioclimatology, 47.
Hansen, S., Abrahamsen, P., Petersen, C. T., and Styczen, M. (2012). Daisy: model use, calibration, and validation. Trans. ASABE 55, 1317–1335. doi: 10.13031/2013.42244
Hansen, S., Jensen, H. E., Nielsen, N. E., and Svendsen, H. (1990). DAISY: Soil Plant Atmosphere System Model. NPO Report No. A 10. Copenhagen: The National Agency for Environmental Protection, 272 Available at: http://daisy.ku.dk/publications/A10.pdf.
Heidmann, T., Tofteng, C., Abrahamsen, P., Plauborg, F., Hansen, S., Battilani, A., et al. (2008). Calibration procedure for a potato crop growth model using information from across Europe. Ecol. Model. 211, 209–223. doi: 10.1016/j.ecolmodel.2007.09.008
Jamieson, P. D., Porter, J. R., and Wilson, D. R. (1991). A test of the computer simulation model ARC-WHEAT on wheat crops grown in New Zealand. Field Crop Res. 27, 337–350. doi: 10.1016/0378-4290(91)90040-3
Karki, R., Srivastava, P., Bosch, D. D., Kalin, L., Lamba, J., and Strickland, T. C. (2020). Multi-variable sensitivity analysis, calibration, and validation of a field-scale SWAT model: building stakeholder Trust in Hydrologic/water quality modeling. Trans. ASABE 63, 523–539. doi: 10.13031/trans.13576
Khalili, A., and Rahimi, J. (2018). “Climate” in The soils of Iran. eds. M. Roozitalab, H. Siadat, and A. Farshad, World Soils Book Series (Cham: Springer).
Leite, J. G. D. B., Silva, J. V., Justino, F. B., and Ittersum, M. K. V. (2014). A crop model-based approach for sunflower yields. Sci. Agric. 71, 345–355. doi: 10.1590/0103-9016-2013-0356
Manevski, K., Børgesen, C. D., Xiaoxin, L., Andersen, M. N., Abrahamsen, P., Chunsheng, H., et al. (2016). Integrated modelling of crop production and nitrate leaching with the daisy model. Methods X 3, 350–363. doi: 10.1016/j.mex.2016.04.008
Müller, T., Thorup-Kristensen, K., Magid, J., Jensen, L. S., and Hansen, S. (2006). Catch crops affect nitrogen dynamics in organic farming systems without livestock husbandry—simulations with the DAISY model. Ecol. Model. 191, 538–544. doi: 10.1016/j.ecolmodel.2005.05.026
Munder, S., Argyropoulos, D., and Mueller, J. (2017). Class-based physical properties of air-classified sunflower seeds and kernels. Biosyst. Eng. 164, 124–134. doi: 10.1016/j.biosystemseng.2017.10.005
Murthy, V. R. K. (2004). Crop growth modeling and its applications in agricultural meteorology. In: Satellite remote sensing and GIS applications in agricultural meteorology, 235.
Nash, J. E., and Sutcliffe, J. V. (1970). River flow forecasting through conceptual models part 1. A discussion of principles. J. Hydrol. 10, 282–290. doi: 10.1016/0022-1694(70)90255-6
Oteng-Darko, P., Yeboah, S., Addy, S. N. T., Amponsah, S., and Owusu Danquah, E. (2013). Crop modeling: a tool for agricultural research – a review. J. Agricult. Res. Dev. 2, 1–6
Plauborg, F., Abrahamsen, P., Gjettermann, B., Mollerup, M., Iversen, B. V., Liu, F., et al. (2010). Modelling of root ABA synthesis, stomatal conductance, transpiration and potato production under water saving irrigation regimes. Agric. Water Manag. 98, 425–439. doi: 10.1016/j.agwat.2010.10.006
Salazar, O., Nájera, F., Tapia, W., and Casanova, M. (2017). Evaluation of the DAISY model for predicting nitrogen leaching in coarse-textured soils cropped with maize in the Mediterranean zone of Chile. Agric. Water Manag. 182, 77–86. doi: 10.1016/j.agwat.2016.12.005
Seiler, G. J., Qi, L. L., and Marek, L. F. (2017). Utilization of sunflower crop wild relatives for cultivated sunflower improvement. Crop Sci. 57, 1083–1101. doi: 10.2135/cropsci2016.10.0856
Sheet, E. H., Gazal, E. M., and Sheet, M. H. (2019). Testing the performance of AguaCrop model for sunflower production in the middle of Iraq. J. Duhok Univ. 22, 58–68. doi: 10.26682/avuod.2019.22.1.6
Thaler, S., Brocca, L., Ciabatta, L., Eitzinger, J., Hahn, S., and Wagner, W. (2018). Effects of different spatial precipitation input data on crop model outputs under a central European climate. Atmos. 9:290. doi: 10.3390/atmos9080290
Thorp, K. R., Ale, S., Bange, M. P., Barnes, E. M., Hoogenboom, G., Lascano, R. J., et al. (2014). Development and application of process-based simulation models for cotton production: a review of past, present, and future directions. J. Cotton Sci. Agron. Soil 18, 10–47
Todorovic, M., Albrizio, R., Zivotic, L., Abi Saab, M.-T., Stöckle, C., and Steduto, P. (2009). Assessment of AquaCrop, CropSyst, and WOFOST models in the simulation of sunflower growth under different water regimes. Agron. J. 101, 509–521. doi: 10.2134/agronj2008.0166s
Wang, F. X., Kang, Y., and Liu, S. P. (2006). Effects of drip irrigation frequency on soil wetting pattern and potato growth in North China plain. Agric. Water Manag. 79, 248–264. doi: 10.1016/j.agwat.2005.02.016
Willmott, C. J. (1982). Some comments on the evaluation of model performance. Bull. Amer. Meteorol. Soc. 63, 1309–1313. doi: 10.1175/1520-0477(1982)063<1309:SCOTEO>2.0.CO;2
Yuan, C., Feng, S., Huo, Z., and Ji, Q. (2019). Simulation of saline water irrigation for seed maize in arid Northwest China based on SWAP model. Sustain. For. 11:4264. doi: 10.3390/su11164264
Keywords: crop growth modeling, leaf area index, drought stress, Mazandaran, Daisy model
Citation: Pouryazdankhah H, Shahnazari A, Ahmadi MZ, Khaledian M and Andersen MN (2024) Development and validation of a sunflower crop growth module for the Daisy model. Front. Sustain. Food Syst. 8:1370063. doi: 10.3389/fsufs.2024.1370063
Edited by:
Muhammad Qadir, Abdul Wali Khan University Mardan, PakistanReviewed by:
Xunfeng Chen, Jiangsu University, ChinaMohammad Valipour, Metropolitan State University of Denver, United States
Copyright © 2024 Pouryazdankhah, Shahnazari, Ahmadi, Khaledian and Andersen. This is an open-access article distributed under the terms of the Creative Commons Attribution License (CC BY). The use, distribution or reproduction in other forums is permitted, provided the original author(s) and the copyright owner(s) are credited and that the original publication in this journal is cited, in accordance with accepted academic practice. No use, distribution or reproduction is permitted which does not comply with these terms.
*Correspondence: Ali Shahnazari, YWxpcG9uaEB5YWhvby5jb20=