 Rashmita Sharma
 Usha Mina
 Ashalata Devi
 B. Mohan Kumar
94% of researchers rate our articles as excellent or good
Learn more about the work of our research integrity team to safeguard the quality of each article we publish.
Find out more
ORIGINAL RESEARCH article
Front. Sustain. Food Syst., 18 July 2024
Sec. Agroecology and Ecosystem Services
Volume 8 - 2024 | https://doi.org/10.3389/fsufs.2024.1366499
This article is part of the Research TopicConservation Agriculture for Sustainable Food Production SystemsView all 21 articles
Introduction: Homegardens are one of the oldest agroforestry systems reported around the world. These agroforestry systems are often reported as harbingers of plant biodiversity conservation. However, a comprehensive understanding of these systems from the perspective of species level agrobiodiversity conservation is often missing.
Methodology: This study first visualizes the comprehensive role of homegardens in species level agrobiodiversity conservation and then assesses any variation in agrobiodiversity along diverse Socio-ecological Zones (SEZs) in the study site. The prominent SEZs identified in the study site were Protected Area (PA), Riverine (RI), Rural Market (RM), and Tea Estate (TE). Eight ethnic/linguistic groups were also identified at the study site. Agrobiodiversity inventorying of 192 homegardens from 16 villages was done.
Results: The results of the study highlight that homegardens in the study site have high species level agrobiodiversity concentration (101 total tree species reported, 39.58% of homegardens (HGs) had more than 10 varieties of vegetables, 68% had atleast one variety of bamboo, 76% had atleast one banana variety, 20.83% had pond). A total of 64% of HGs had livestock and around 85% had poultry. Moreover, this agrobiodiversity distribution also varied along different SEZs. The livestock diversity indices ranged from 0.49 (TE) to 1.04 (PA). The average plant diversity among homegarden was found to be in the range of 1.09 (PA) to 1.48 (TE) for Shannon, 0.45 (PA) to 0.66 (TE) for Simpson, 0.31 (PA) to 0.71 (TE) for Pileou evenness and 2.39 (PA) to 2.76 (RM) for Margalef. The plant composition reflected the dominance of the food species i.e. an average of 37% in each SEZ. Sorenson similarity index among different SEZs for plant and livestock was found to be highest between the HGs of the PA and RM (0.82). Among the ethnic/linguistic groups, the highest mean number of plant species (51) was found among the Mishing tribe. Also, high similarity index (0.78) was found in plant and livestock composition among the Mishing and the Bodo tribes.
Discussion: The findings imply that HGs exemplify diversified and integrated systems, showcasing their potential to play a crucial role in the development of sustainable food systems.
Agrobiodiversity, or Biodiversity for Food and Agriculture (BFA), is defined as a subset of biodiversity that relates to agriculture and food production (FAO, 2019). Agrobiodiversity can be broadly defined at three levels, i.e., genetic, species, and ecosystem levels (FAO, 2004). At a time when agrobiodiversity loss from the agricultural landscape is a major concern (Pilling, 2019), an integrated food system that can also help in agrobiodiversity conservation is of interest to one and all (IFPRI, 2021). Homegarden agroforestry, which is one of the earliest systems of food production both in tropical and temperate countries (Kumar and Nair, 2006; EURAF, 2021; Sharma et al., 2022), is also often referred to as the system that can also play an important role in agrobiodiversity conservation (Galluzzi et al., 2010; Galhena et al., 2013). An attempt to link homegardens for agrobiodiversity conservation has been reported from around the world (Wiehle et al., 2014). However, a comprehensive description of all species-level agrobiodiversity and management practices in homegardens (HG) has been scarcely reported. For example, though HG is often reported as a very important type of agrosilvopastoral system (FAO, 2015; Nair et al., 2021), the literature mentioning characteristic livestock species in HGs is limited (Soler et al., 2018). This study, by analyzing the species-level agrobiodiversity of all components of HG, including livestock and diverse management practices, along with major challenges faced in homegardening, tries to fill in this gap. Furthermore, taking on the framework of socio-ecological systems, which, as defined by Ostrom (2009) and Berkes et al. (2000) consist of social and ecological systems, this study tries to draw inferences on how HG structure and agrobiodiversity distribution are influenced by them.
HGs of Brahmaputra Valley, situated in the north-eastern state of Assam in India, were analyzed in this study. This part of the Brahmaputra Valley lying in the north-eastern state of India, i.e., Assam, was selected as the study site as it reports among the highest number of HGs (Sharma et al., 2022). In addition, according to an ICAR report, there are about 6.4 million HGs in Assam, which is about 85% of the total households in the state (Barua et al., 2019), making it a crucial land management practice in the region. In addition, specifically, Sonitpur district in the Brahmaputra Valley of Assam was chosen for this study because of its location in the foothills of the Eastern Himalayas and the occurrence of diverse types of habitations with different social and ecological structures juxtaposed to each other (Srivastava et al., 2002), which makes it an ideal location to perform a comparative study based on the SES framework. Although the National Bureau of Soil Survey and Land Use Planning, Nagpur, based on soil, bioclimatic, and physiographic features (Sehgal et al., 1992), classified Assam and the adjoining areas into warm humid to per humid (Assam and North Bengal Plains) and warm per humid (North Eastern Hills, Purvanchal) agro-ecological regions, detailed socio-ecological classification schemes are not available for this region. With the help of suggested literature, satellite data, and land holding patterns, we classified the study site into four major socio-ecological zones (SEZs). These SEZs were protected areas (PA), riverine (RI), rural market (RM), and tea estate (TE). Moreover, though the major objective of the study was to analyze the role of homegarden in agrobiodiversity conservation, it also tries to compare and contrast the agrobiodiversity pattern in HG situated in diverse SEZs and also among the major ethnic/linguistic groups in the study. The main hypothesis of the study is that the PA HG would have a large size and high plant and livestock diversity as they are situated away from the major commercial areas and close to the forest. HG in RI zones would be more disaster-prone as these areas are periodically flooded; HG in RM would represent more modern trends in homegardening and TE HG represents the very small HGs with a restricted and limited scope of expansion. HGs are often the personal space maintained by individuals based on their cultural beliefs, needs, and traditions (Mazumdar and Mazumdar, 2012).
Therefore, we also looked into the comparative assessment of HGs belonging to different ethnic/cultural groups inhabiting our study area. And hypothesize that tribal HGs would have more agrobiodiversity concentration as compared to the non-tribal ones. This study has two major contributions: first, it will enable policymakers to make decisions regarding the importance of HGs as diversified, integrated, and conservation-based agriculture systems for all. Secondly, it would help in better policy formulation for all major types of HGs lying in varying SEZs and ethnic/linguistic groups. Understanding the comprehensive agrobiodiversity composition of homegardens would not only help in their better conservation but could also support efforts in the direction of developing sustainable food systems.
The location of the study is the Brahmaputra Valley in Assam. The Brahmaputra valley has a total drainage area of 580,000 km2 (Debnath et al., 2023) and encompasses an area of 70,634 km2 in Assam (GOA, 2023). For this study, we specifically focused on the Sonitpur district of Assam, which is part of the northern bank plains of the Brahmaputra (Chaturvedi et al., 2021). Apart from its location in the foothills of the Eastern Himalayas and the occurrence of diverse types of habitations (Srivastava et al., 2002), this district of Sonitpur is categorized as highly vulnerable to climate change (Ravindranath et al., 2011), which was one of the design criteria. The erstwhile Sonitpur district, with an area of 5,105 km2 (Srivastava et al., 2002), was, however, bifurcated around the same time when this study was planned (between May 2021 and April 2022). Hence, the new Sonitpur district with an area of 2,109 km2 (Assam, 2022) was selected for this study.
For demarcating different SEZs, we first performed a Land Use and Land Cover (LULC) classification using the satellite images Sentinel 2 (10 m resolution) of 19 November 2020 (less cloud cover) using the supervised classification (Campbell and Wynne, 2011) in ArcGIS version 10.8. The major land use types identified were river, protected/plantation area, builtup/settlement area, and arable land. Based on field verification (December–February 2020) and further literature review (Srivastava et al., 2002; NRSC, 2019; Chaturvedi et al., 2021; Mahato et al., 2021), four prominent SEZs, i.e., PA, RI, RM, and TE, were demarcated. The PA in the study site refers to three major classes, viz., the national parks (IUCN Category II), the wildlife sanctuary (IUCN Category IV), and the reserve forest (forests accorded a certain degree of protection according to the Indian Forest Act 1927) and comprises 45% of the study area (NRSC, 2019; Assam, 2022). The RI SEZs form another major dominant feature of the district, with three major rivers, i.e., Brahmaputra, Kameng, and Gabharu, and about 18% of the area of the district (NRSC, 2019). The TE SEZs are the areas under a larger tea estate plantation in the district. Tea cultivation started during the British colonial period in Assam, and at present, there are 799 TE in Assam and about 59 in Sonitpur district (DOTTAA, 2023). The current tea labor force in Assam is primarily composed of the descendants of people who were brought over from the areas that now constitute the tribal dominant states of Jharkhand, Orissa, and Chhattisgarh to work there during the colonial era. These individuals are now collectively referred to as tea tribes or Adivasis (Mahanta et al., 2015; DOTTAA, 2023). The cities (major built-in areas) were excluded as the study focused on HGs in rural areas. To commensurate with this, the RM zone was considered an important feature; the villages that had at least one major market a week, had facilities for banks or post offices, and were in close proximity to the National Highway (2 km) were considered as RM.
The SEZs PA, RI, and TE comprise 45, 18, and 12% of the total area of Sonitpur district (Census, 2011; Assam, 2022). A total of four replicate villages were then selected from each SEZ, i.e., 16 villages in total. The villages for PA were selected from the vicinity of Nameri National Park (Sonai Miri, Bhalukmari Pathar) and Sonai Rupai Wildlife Sanctuary (Naharani Basti Gaon, Urohiloga). These villages lie on the fringes of PAs (up to 5 km from the PA).
For RI, the villages on the bank or 2 km from the bank of the Brahmaputra River (Sithalmari, Bhomoraguri, Siddeswari) and Kameng or Jia Bharali River (Tow Bhanga) were selected. The villages were selected based on the number of flooding days that they experienced, i.e., a minimum of 60 days. The RM villages were selected based on the classification scheme mentioned earlier, and care was taken to select them from distinct blocks of the district (i.e., Pitha Khowa: Block—Tezpur; Thelamara Ghat: Block—Dhekiajuli; Jamugurihat: Block—Naduar; and Goraimari: Block—Balipara).
The TE-based (inside and around TEs) villages representing the distinctness of the eastern (i.e., Dhekialuji and Singri) and western parts (Phulbarie and Addabarie) of the district were selected for the study. This LULC classification scheme and the villages selected for the HG study are represented in Figure 1. While selecting the villages, it was made sure that they represented distinctive features of the district, i.e., they were selected from different blocks and along different directions. All the villages except the TE villages were revenue villages; the TE villages are generally the inhabitations inside the TE owned by the plantation companies, where respective company rules are followed (Mahanta et al., 2015). The permission to do the agrobiodiversity survey in all these villages was obtained from the District Collector of Sonitpur District. Permission was also obtained from the individual homegardeners in a consent form before participating in the study.
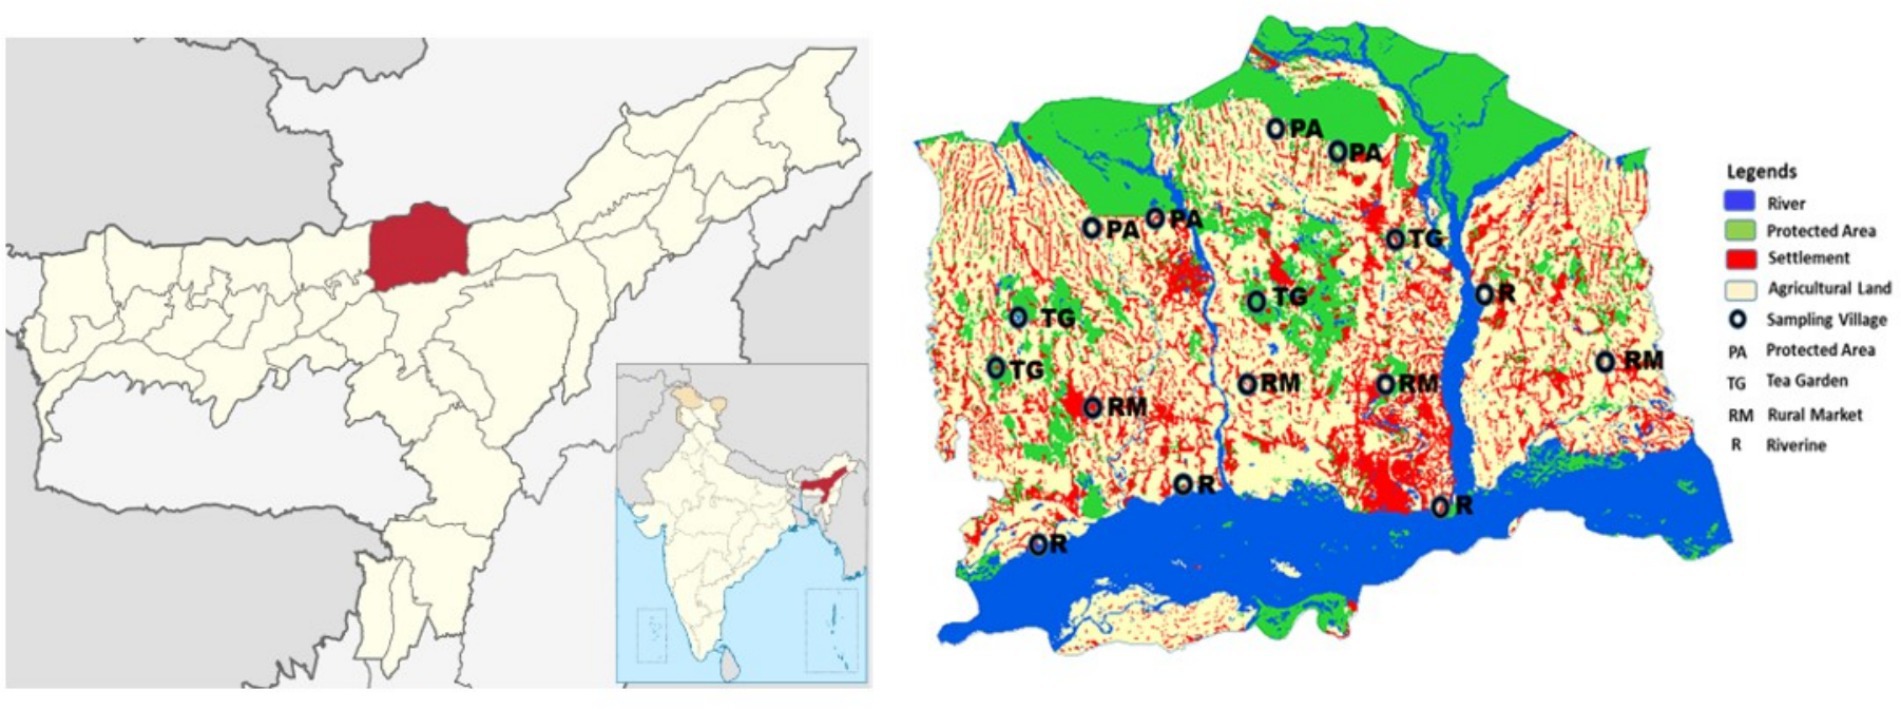
Figure 1. Description of the study site.
The sample size of households in each village was determined using the following formula (Corvar, 1974; Abdoellah et al., 2020):
where n is the total number of samples, N is the population size, zy is the normal distribution in y quantile, π is the proportion of sub-population, and δ is the margin of error. According to the 2011 Census, there are 352,647 rural households in the erstwhile Sonitpur district. Assuming a 7.1% margin of error and a 95% confidence level, 191 households in 16 villages—approximately 192 were surveyed to ensure that the households were distributed equitably among the villages. With 48 villages per SEZ, 12 households per village were selected using the probability sampling technique of simple random sampling. At first, the map of the village with the major feature was obtained from the Gaon Bura (village head). Then the households were randomly selected, starting from one cardinal direction and entering the village.
Agrobiodiversity inventorying was performed by field visits (Avilez-López et al., 2020) between March 2022 and April 2023. For agrobiodiversity inventorying, the questionnaire was administered to the landowners of the HGs, and where they were not present, the questions were asked of the person responsible for most managerial decision-making in the HG (43% of the respondents were women). In addition, a questionnaire method was used to understand the general economic status, management practices followed, challenges in homegardening, and future plans for HGs. Apart from HGs attached to the residential plots, some respondents maintained land parcels away from the households too. However, considering the standard definition of the term (Kumar and Nair, 2004; Galhena et al., 2013), we considered only the cultivation practices within the fenced area of the households or very near the dwelling units. Das and Das (2005) reported that the average size of HGs in Assam ranged from 0.02 ha to 1.20 ha. However, in TE, where the average size of each worker’s quarter is 0.04 ha (Kar, 1984; Ahmmed and Hossain, 2016), we considered anything larger than 0.01 ha as an HG. Since the homegardeners in Sonitpur district generally used separately designated spaces within the HGs for the cultivation of vegetables, cereals, ornamentals, medicinal bamboo, boundary plants, plantation crops (e.g., Betel Nut [Areca catechu], Teak [Tectona grandis], Tea plant [Camellia sinensis], Rubber tree [Hevea brasiliensis], etc.), and livestock, we adopted whole-plot sampling and counted all plant and livestock species and their relative distribution in the HGs (Poot-Pool et al., 2012). All tree and shrub species having diameter at breast height (DBH) of 10 cm or more were enumerated. Since deliberate cultivation of vegetable crops and other herb species was done in land parcels assigned to these crops, their area was measured, and the name and type were noted. The names of various ornamental plants, climbers, and medicinal plants were recorded along with their frequency of occurrence. Homegarden age was recorded as stated by the respondent, which was cross-checked with the village head. The ethnicity/linguistic group to which particular homegardeners belonged was noted based on how they identified themselves and also as per the ethnicity classification given in the Census (2011).
Plant species diversity for each HG was computed using the Shannon diversity index.
where is the proportion of individuals belonging to a specific species determined by dividing the count of individuals from that species (n) by the total number of individuals observed (N). In this context, ln represents the natural logarithm, Σ denotes the summation of these calculations, and S represents the total number of species (Shannon, 1963).
Dominance index (Cd)
where is the proportion of individuals belonging to a specific species determined by dividing the count of individuals from that species (n) by the total number of individuals observed (N) following Simpson (1949).
The species evenness was calculated using the Pielou evenness index using.
where H is the Shannon index, and S is the total number of species (Pielou, 1969).
Species richness was calculated using the Margalef Index.
where S is the total number of species, N is the total number of individuals, and ln is the natural logarithm (Margalef, 1958). The data for herb, shrub, and tree components were pooled to perform the above computations. Apart from the plant diversity estimate, the Margalef Index was also used to estimate the livestock diversification index (Mekuria and Mekonnen, 2018). Whether the difference between variables of HGs of different socio-ecological types was statistically significant was tested by ANOVA followed by the Duncan multiple range test (George and Christopher, 2020). The Sorenson test of similarity (S.I.) using.
where L is the number of species two samples have in common, a is the number of species in the first sample, and b is the number of species in the second sample was used to find the similarity between HG of different ethnicities and different SEZs. Furthermore, cluster analysis was performed on the variables Shannon Index and Livestock Diversification Index. In addition, regression and correlation coefficients were derived to understand the relationship between different variables. All the data analysis is performed in R, Excel, OriginPro2023, and PAST software.
There was a preponderance of HGs in all the SEZs evaluated (Table 1). However, a large variation in size and main purpose was noticed. The preference for different crop types based on the dominant features of the SEZs and the cultural and economic background of the respondents led to four major types of HGs in the study area. The PA-type HG, which were mostly documented from the PA, were HGs with usually large sizes (>0.5 ha) often incorporating plantation species. Here, the size ranged from 0.07 ha to 1.806 ha. These HGs also had the highest number of stems of plants greater than 10 cm DBH. In addition, they had the maximum land, i.e., 53% devoted to plantation crops like Areca catechu, Hevea brasiliensis, and Camellia sinensis, and 47.73% of HG in the PA also had ponds with as many as five varieties of fish. The majority of HGs reported here are old HGs (age > 40 years) and had designated spaces allotted to vegetables, ornamentals, plantation species, and ponds. Intercropping species like pineapple (Ananas comosus) with lemon (Citrus limon) and Areca catechu was fairly common. Seventy-nine percent of HGs had bamboo species, with almost 50% of HGs having more than one species of bamboo. Often, bamboo was planted at the end of HGs, connecting them to the field. These HGs also had a sizeable number of livestock (and a high livestock diversification index) and were also more commercialized. The major characteristics and composition of these HGs are shown in Figures 2A, 3A,B.
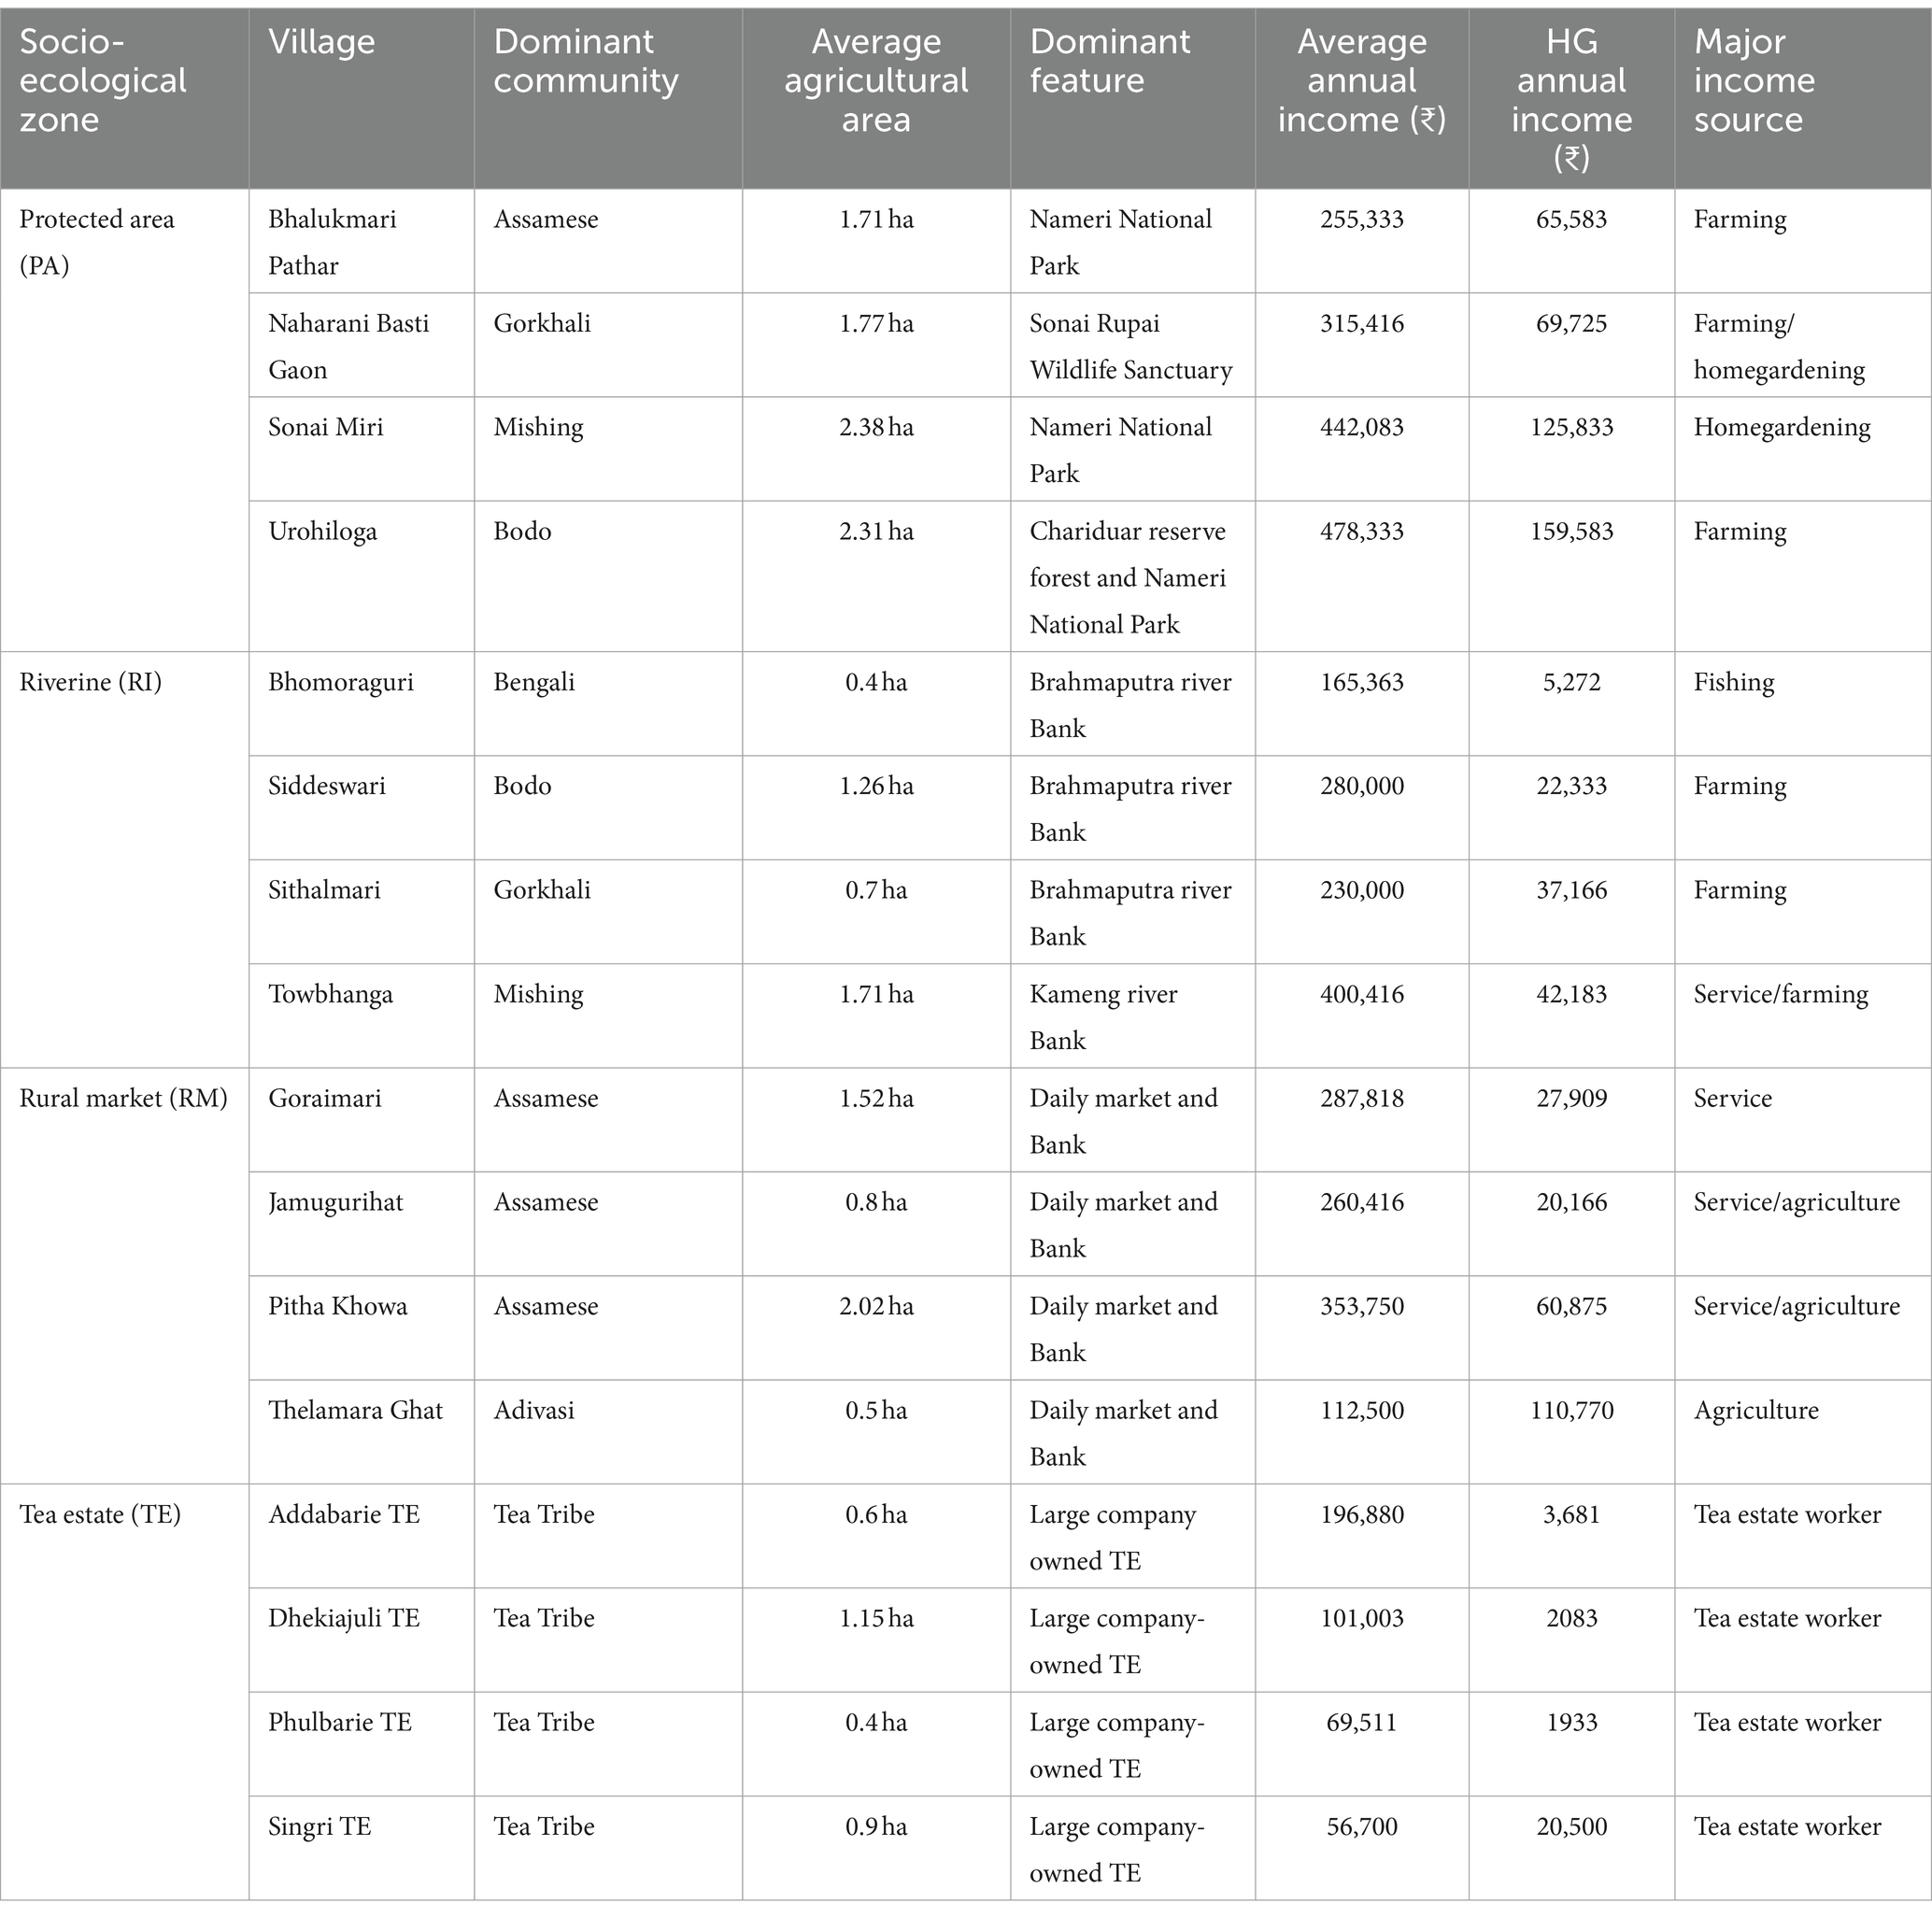
Table 1. General characteristics of villages in the study site.
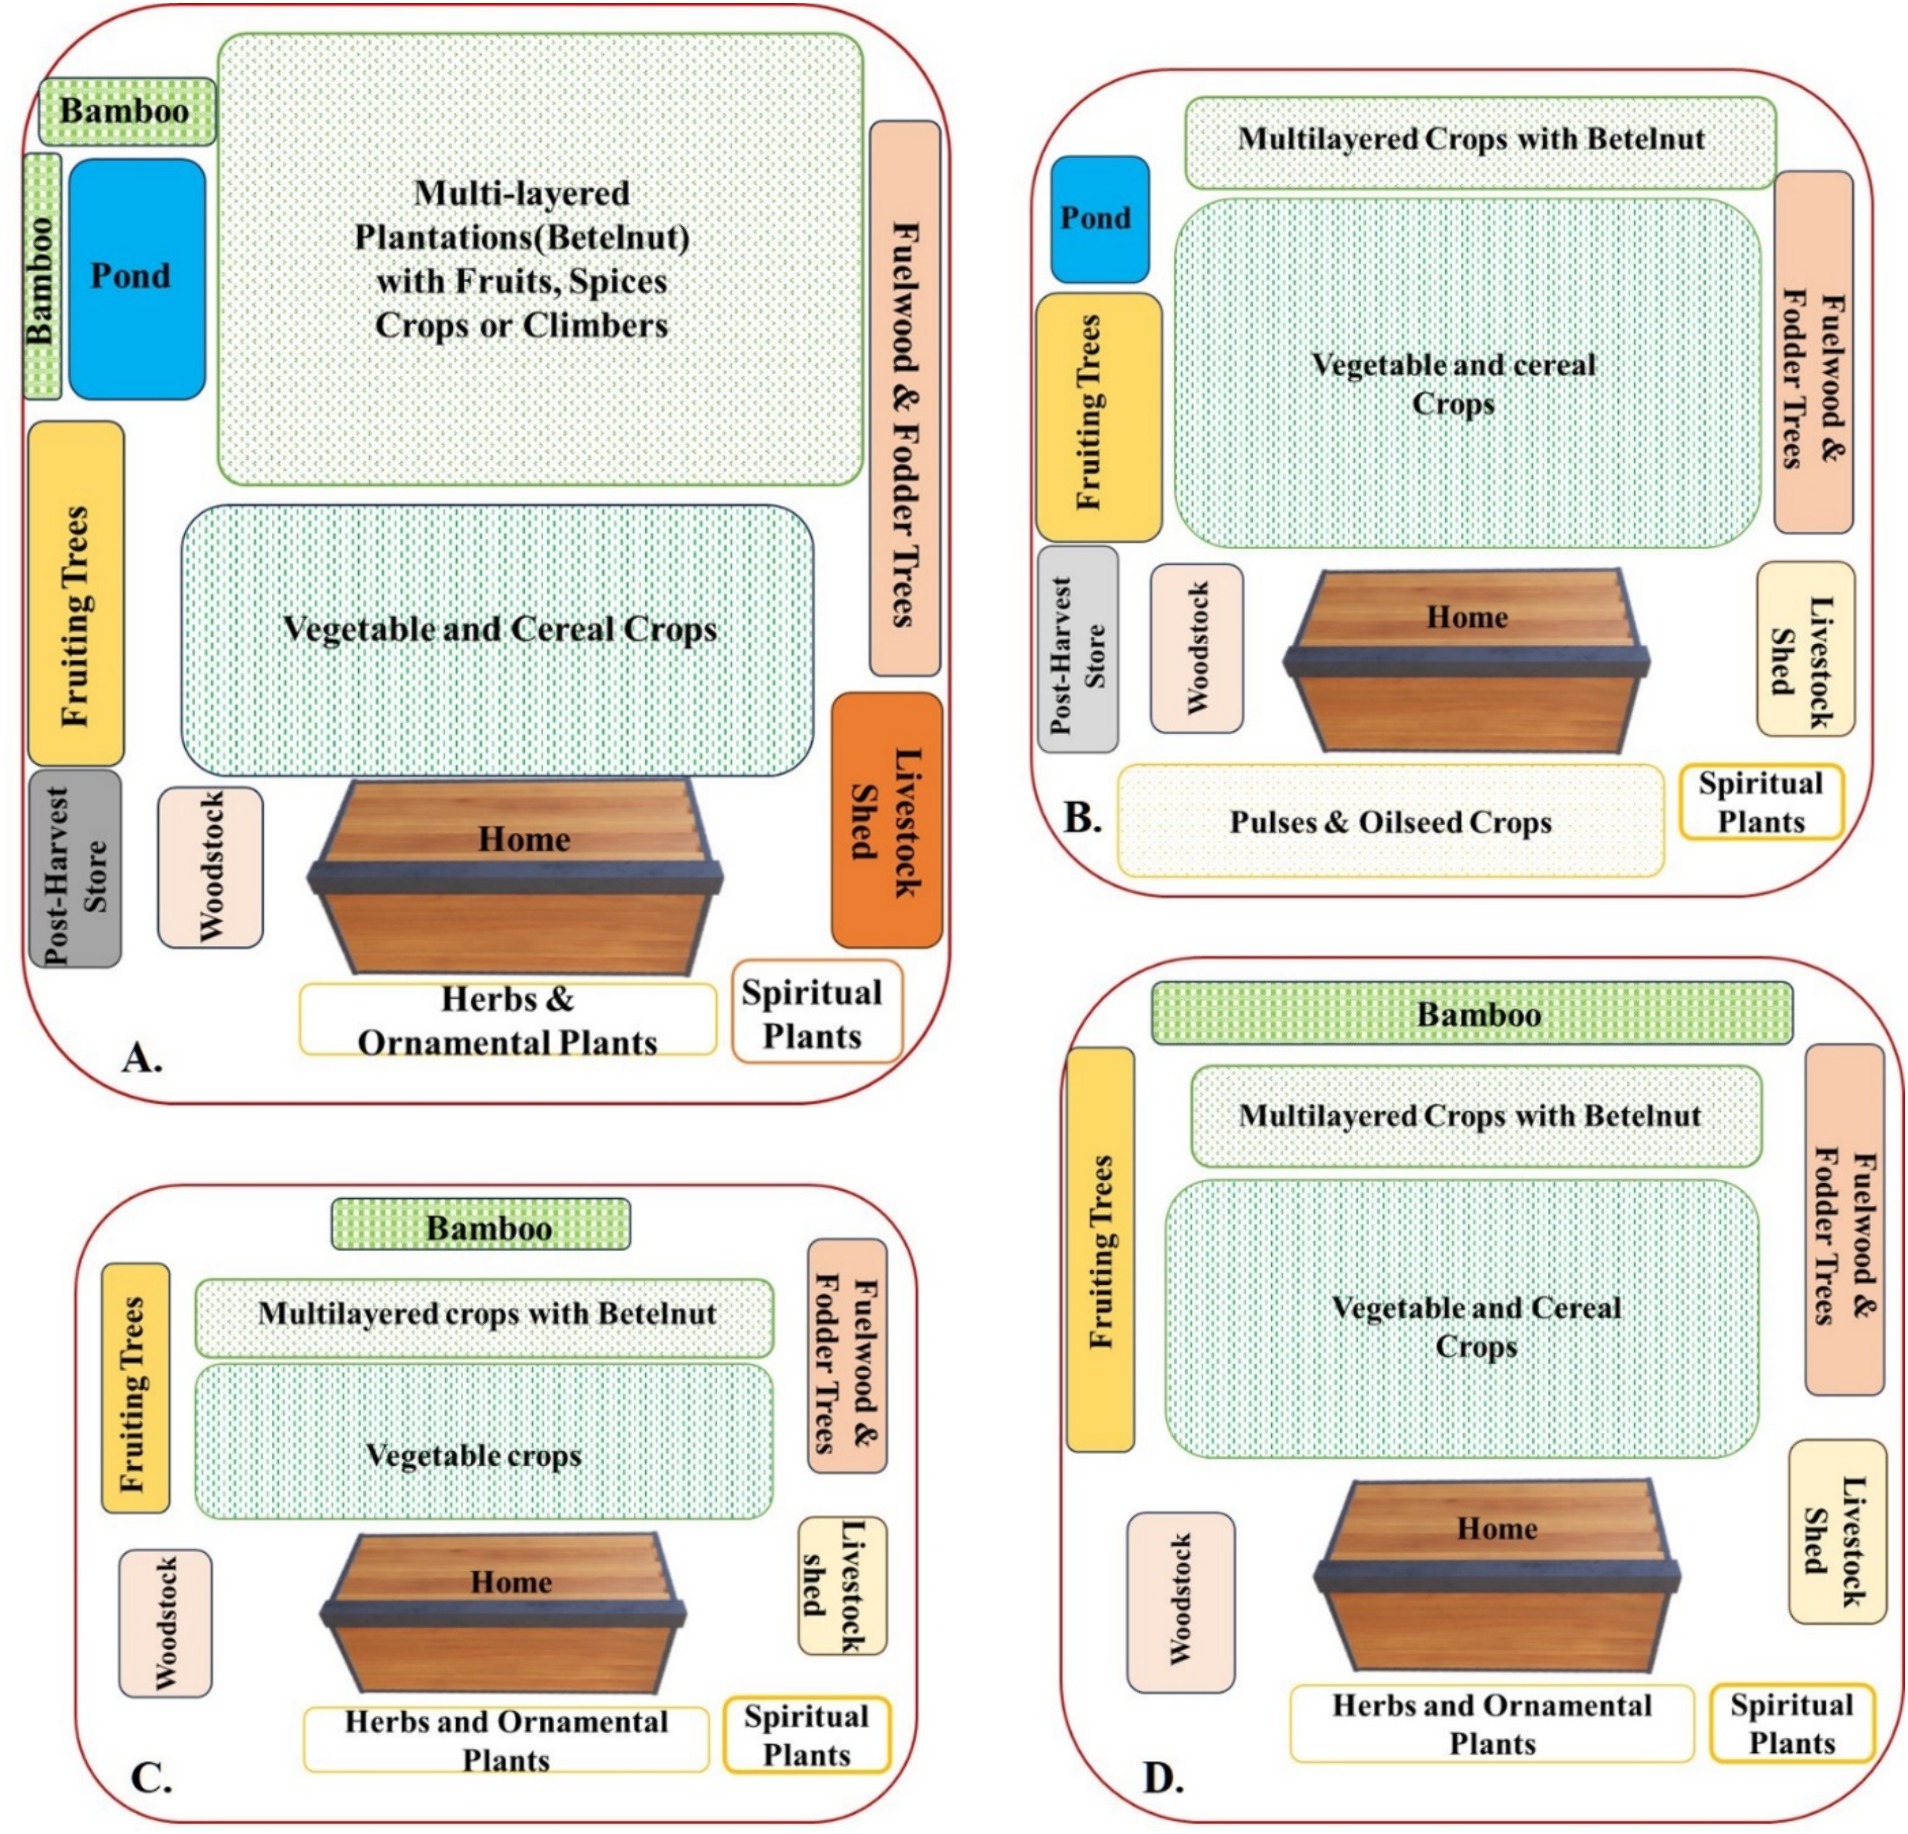
Figure 2. Diagrammatic visualization of homegardens of different socio-ecological zones: (A) homegarden of protected area socio-ecological zone; (B) homegarden of rural market socio-ecological zone; (C) homegarden of tea estate socio-ecological zone; (D) homegarden of riverine socio-ecological zone.
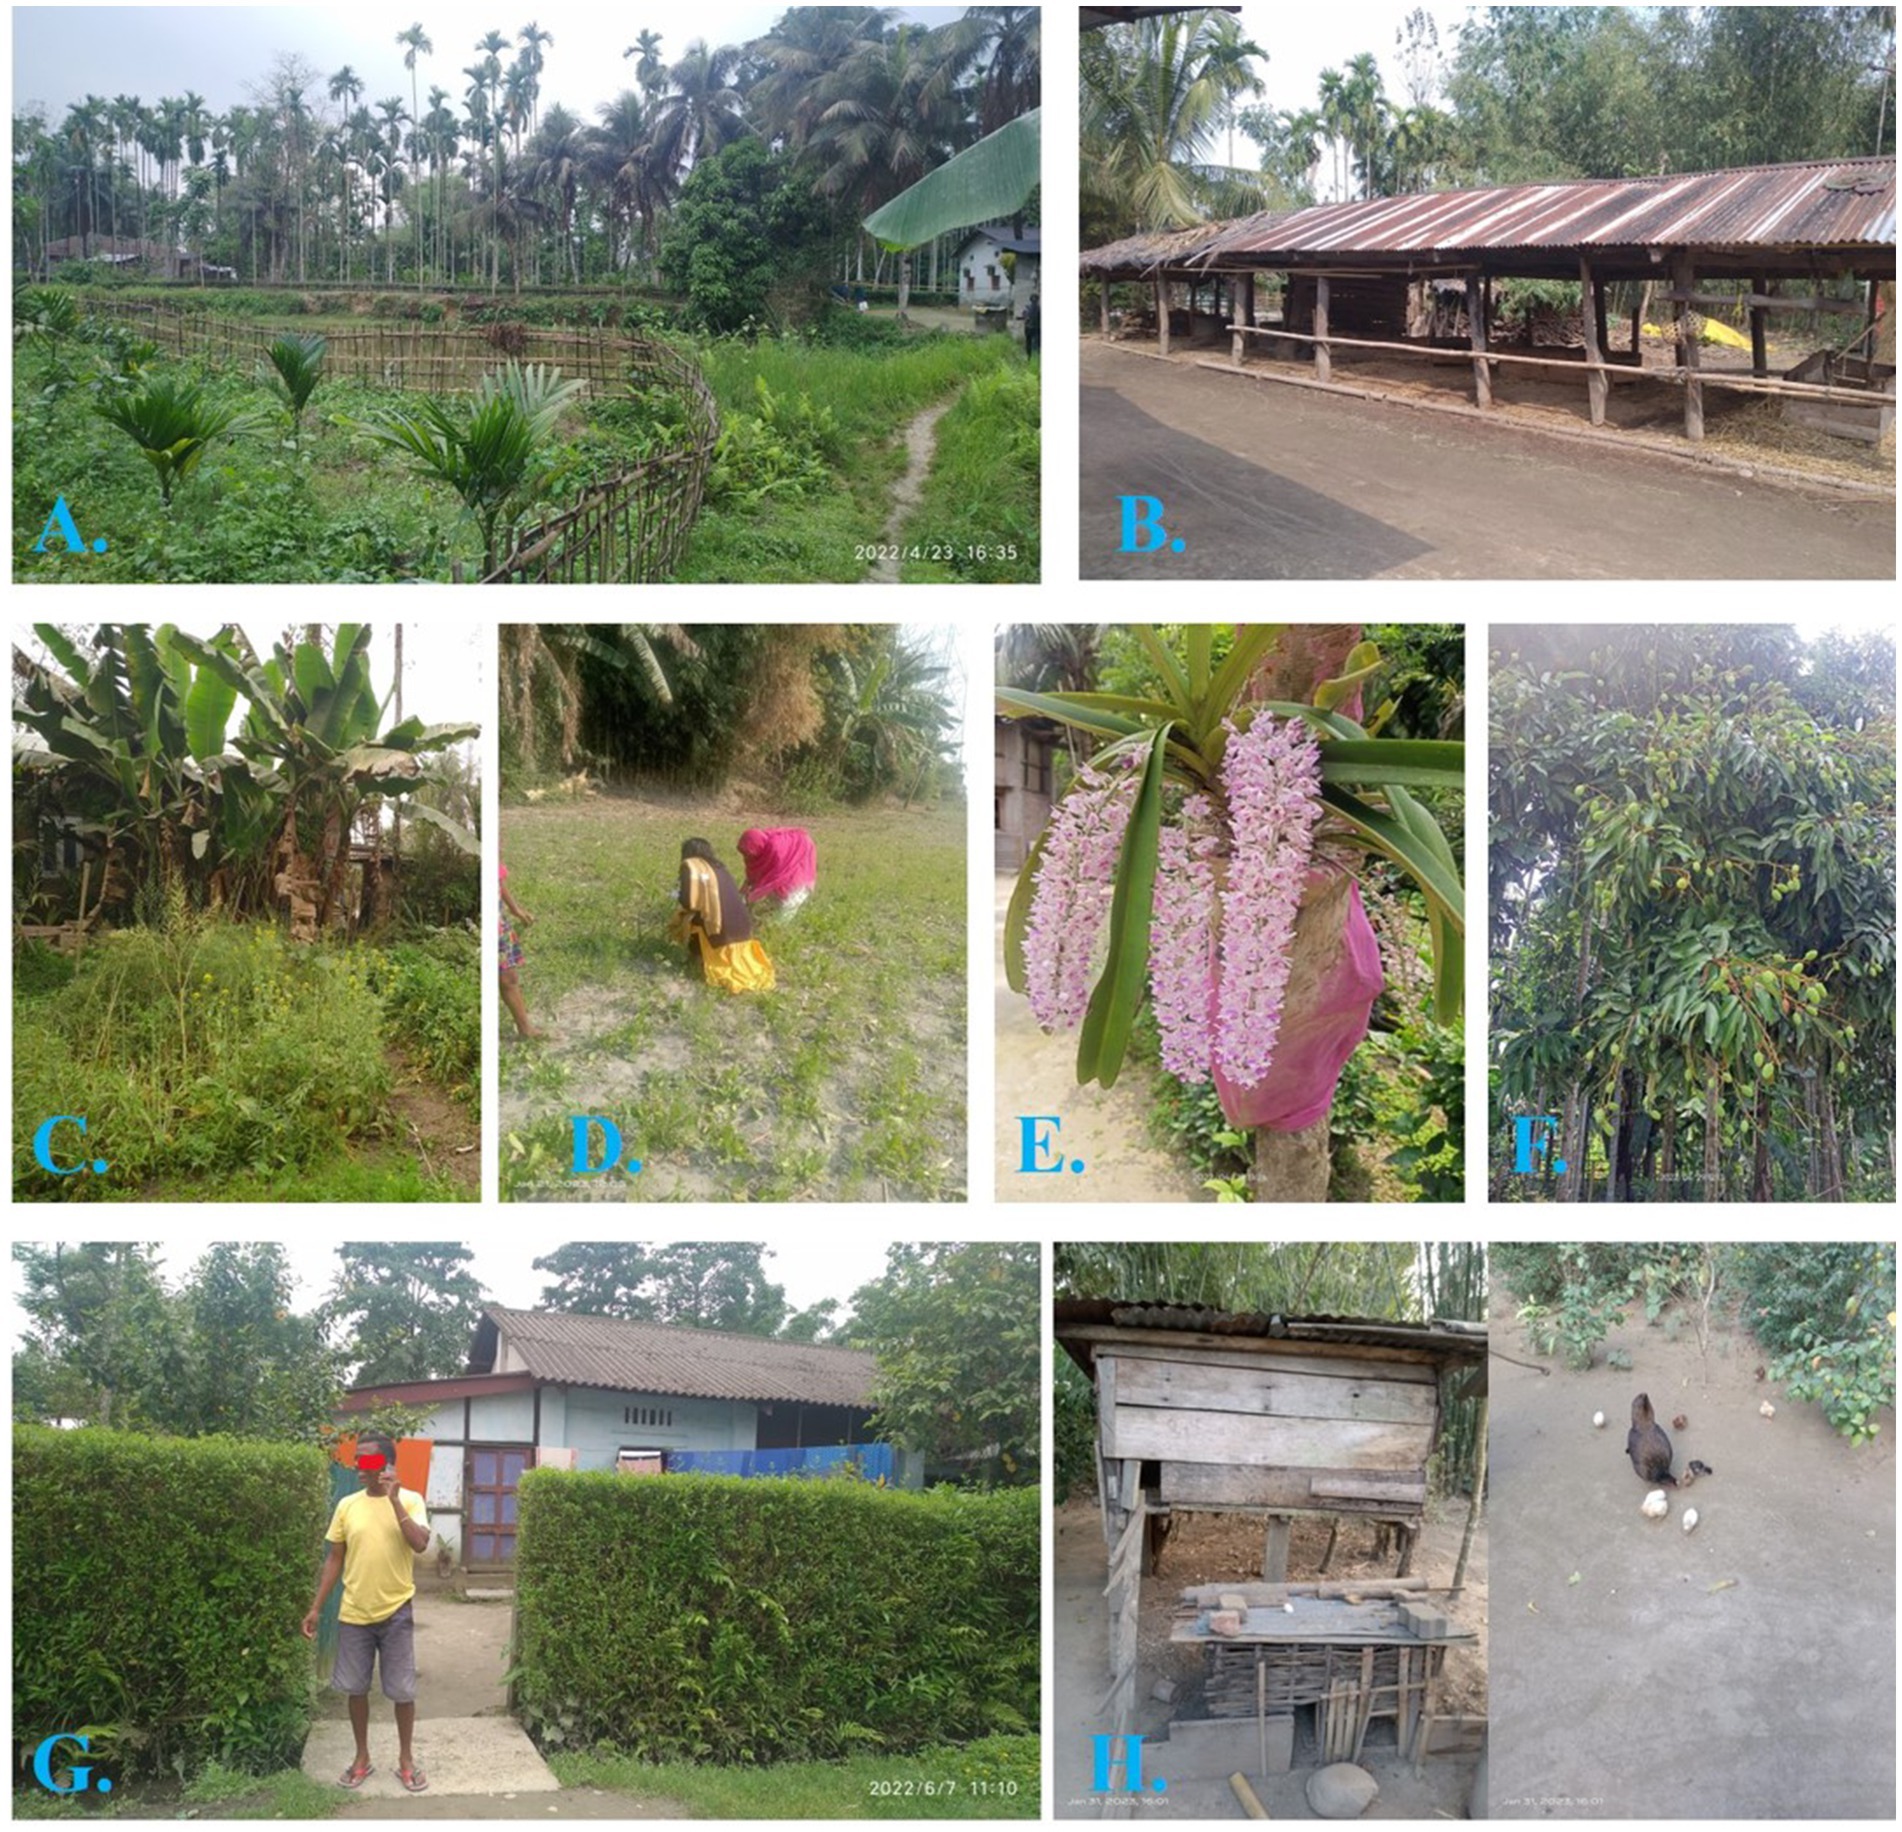
Figure 3. Representation of general characteristics of homegardens: (A,B) large plantation spaces and multiple livestock shed in HG of PA; (C,D) vegetable species cultivation as dominant feature of riverine HG; (E,F) cultural species, i.e., orchid and GI-tagged litchi in RM HG; (G,H) TE HG being small in size support small livestock species and fencing plants.
The RI type HG majorly documented from the RI SEZs were the ones that were more prone to floods (almost 60 days), had large variations in size (ranging from 0.013 ha to 0.67 ha), often had less livestock reared, and had more preference for vegetable cultivation. Although the RI zones were vulnerable and prone to floods, homegardening was enthusiastically pursued by the farmers in this zone. In RI HG, the maximum land is for vegetable cultivation (51%). The major vegetables cultivated were okra (Abelmoschus esculentus), brinjal (Solanum melongena), potato (Solanum tuberosum), radish (Raphanus sativus), cabbage (Brassica oleracea), and cauliflower (Brassica oleracea) as shown in Figures 2D, 3C,D. In the RI zones, apart from the HGs attached to the household, the cultivation was also carried out in the Char (floodplain sediment island) areas. The most widely cultivated plants on the Char lands were jute (Corchorus olitorius), vegetables, and black lentil (Vigna mungo).
The RM type HG had a relatively average size ranging between 0.013 ha and 0.47 ha, and since RM SEZs are multigenerational old (as they are among the oldest habituated areas in the study site), even though they are reduced in size, they represent high cultural values, and they seem to have the highest concentration of culturally important species like Orchid Rhynchostylis retusa (Kopu Ful; Figure 3A); GI-tagged Citrus limon (Kaji nemu); and Litchi chinensis Sonn (Lichu; Figure 3F). In addition, almost 56% of the HGs had more than three varieties of banana. Most common among them were Musa chinensis (Jahaji Kol), Musa champa (Cheni-champa Kol), Musa assamica (Malbhog Kol), Musa paradisiaca (Kach Kol), and Musa gigantea (Bhim Kol). These all play important roles in Assamese cuisine. Vegetable cultivation and plantation were allotted approximately the same extent of land in rural market-based HG, i.e., 45 and 47%, respectively, as shown in Figure 2B. Ponds are present in 21% of RM HGs. In addition to being most proximate to the market, the species diversity was also very dominated by ornamental species.
The TE type HG was the HGs mostly documented among the TE workers were smaller (size <0.03 ha), ranging from 0.013 to 0.134 ha, had few tree species, mostly ornamental, fruit, and vegetable species, and had small places for worship and poultry or small avian species (67% of HGs) reared for meat and eggs; however, the number of large cattle reared were few (15%). In TE-based HGs, the maximum area was used for vegetable and ornamental plant cultivation, as shown in Figure 2C. Ponds were present in less than 5% of HGs in TEs. Since the homegardening area was small, it was therefore judiciously used for ornamental and vegetable cultivation, along with scattered tree species for cultural values and subsistence (Figures 3G,H).
In addition, the mean HG age is found to be 59 years in PA HG, 45 in RI zones, 47.4 in HGs adjacent to RMs, and 34.5 in the TEs. In addition, though the average age of HGs does not seem to be significantly different (p > 0.005) in each SEZ, the oldest HG of 110 years was reported from the RM locations, and the youngest of 5 years was observed in the RI as well as RM types.
The plant composition in the HGs of the PA was found to be very diverse, with an average number of plant species of 43 (range 26–75). The number of plant species was found in the order PA > RM > RI > TE. In addition, the total stems of plants greater than 10 cm DBH were highest in PA and were observed in the same order. Overall, 101 tree species were identified from HGs in the study area. Areca Catechu (betel nut) was the most frequently observed tree species in all SEZs. In addition, three major species of bamboo were observed in our study area, viz., Bambusa balcooa (Bhaluka Bah), Bambusa pallida Munro (Bijuli Bah), and Bambusa nutans (Mokal Banh). Sixty-four percent of HGs surveyed had one or more species of bamboo. Moreover, four varieties of bananas were found to be cultivated, and 76% of HGs were found to have at least one variety of banana. Although diverse functional groups of plants were observed, most of the plant species obtained in the HGs of each SEZ were food plants (36.6, 45.7, 35.8, and 36.5% in the HGs of PA, RI, RM, and TE, respectively). The species classified for food include vegetables, fruits, and other edible species. Figure 4 shows the distribution of plant species in different use categories and their distribution in corresponding SEZs.
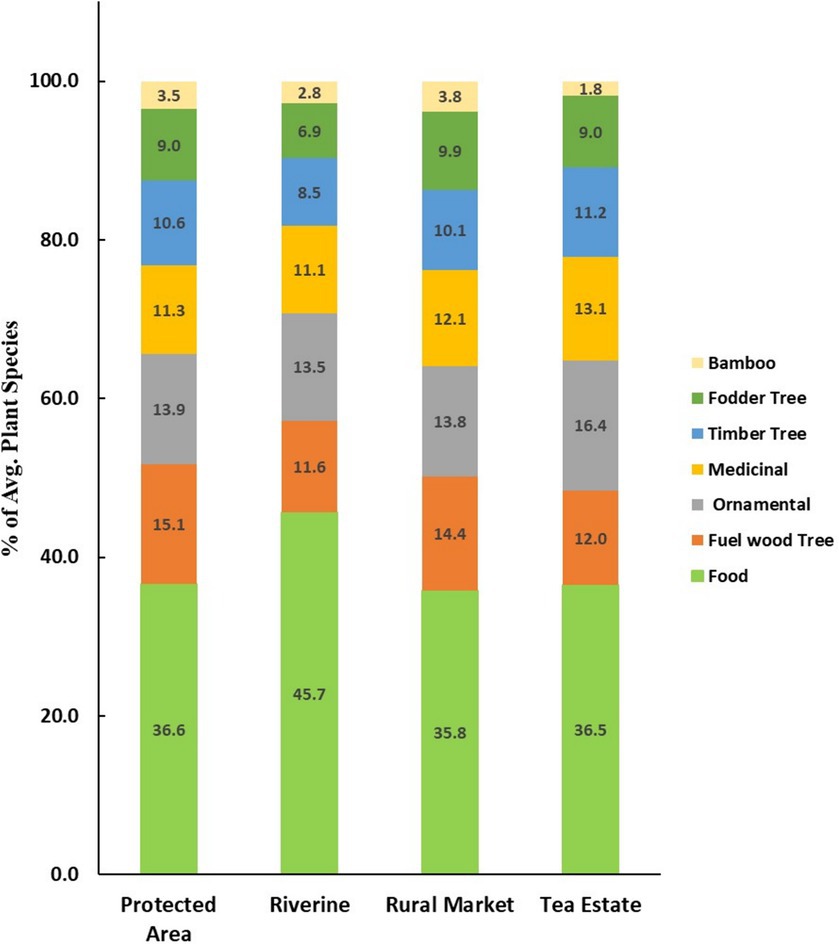
Figure 4. Use category of different plant species in homegarden of different socio-ecological zones.
The statistical distribution of plant species diversity observations in the HG of different villages in diverse SEZs is depicted in Table 2. The Shannon diversity index was estimated to be highest at 1.48 in TE HGs and 1.44, 1.39, and 1.09 in HGs of RI, RM, and PA HG, respectively. The Simpson diversity index was also estimated at the highest values of 0.66 in TEs HG and 0.62, 0.51, and 0.45 in RI, RM, and PA HGs, respectively. The Margalef index was highest at 2.76 in RM and 2.58, 2.57, and 2.39 in TEs, RI, and PA HG, respectively. The Evenness index was highest at 0.70 in TE and 0.61, 0.40, and 0.31 in RI, RM, and PA HG, respectively. Table 2 shows that diversity indices, i.e., Shannon, Simpson, Margalef, or Evenness, were significantly different in each SEZ. However, there were no significant differences among the villages in the same SEZs except for those villages in the TE or RM.
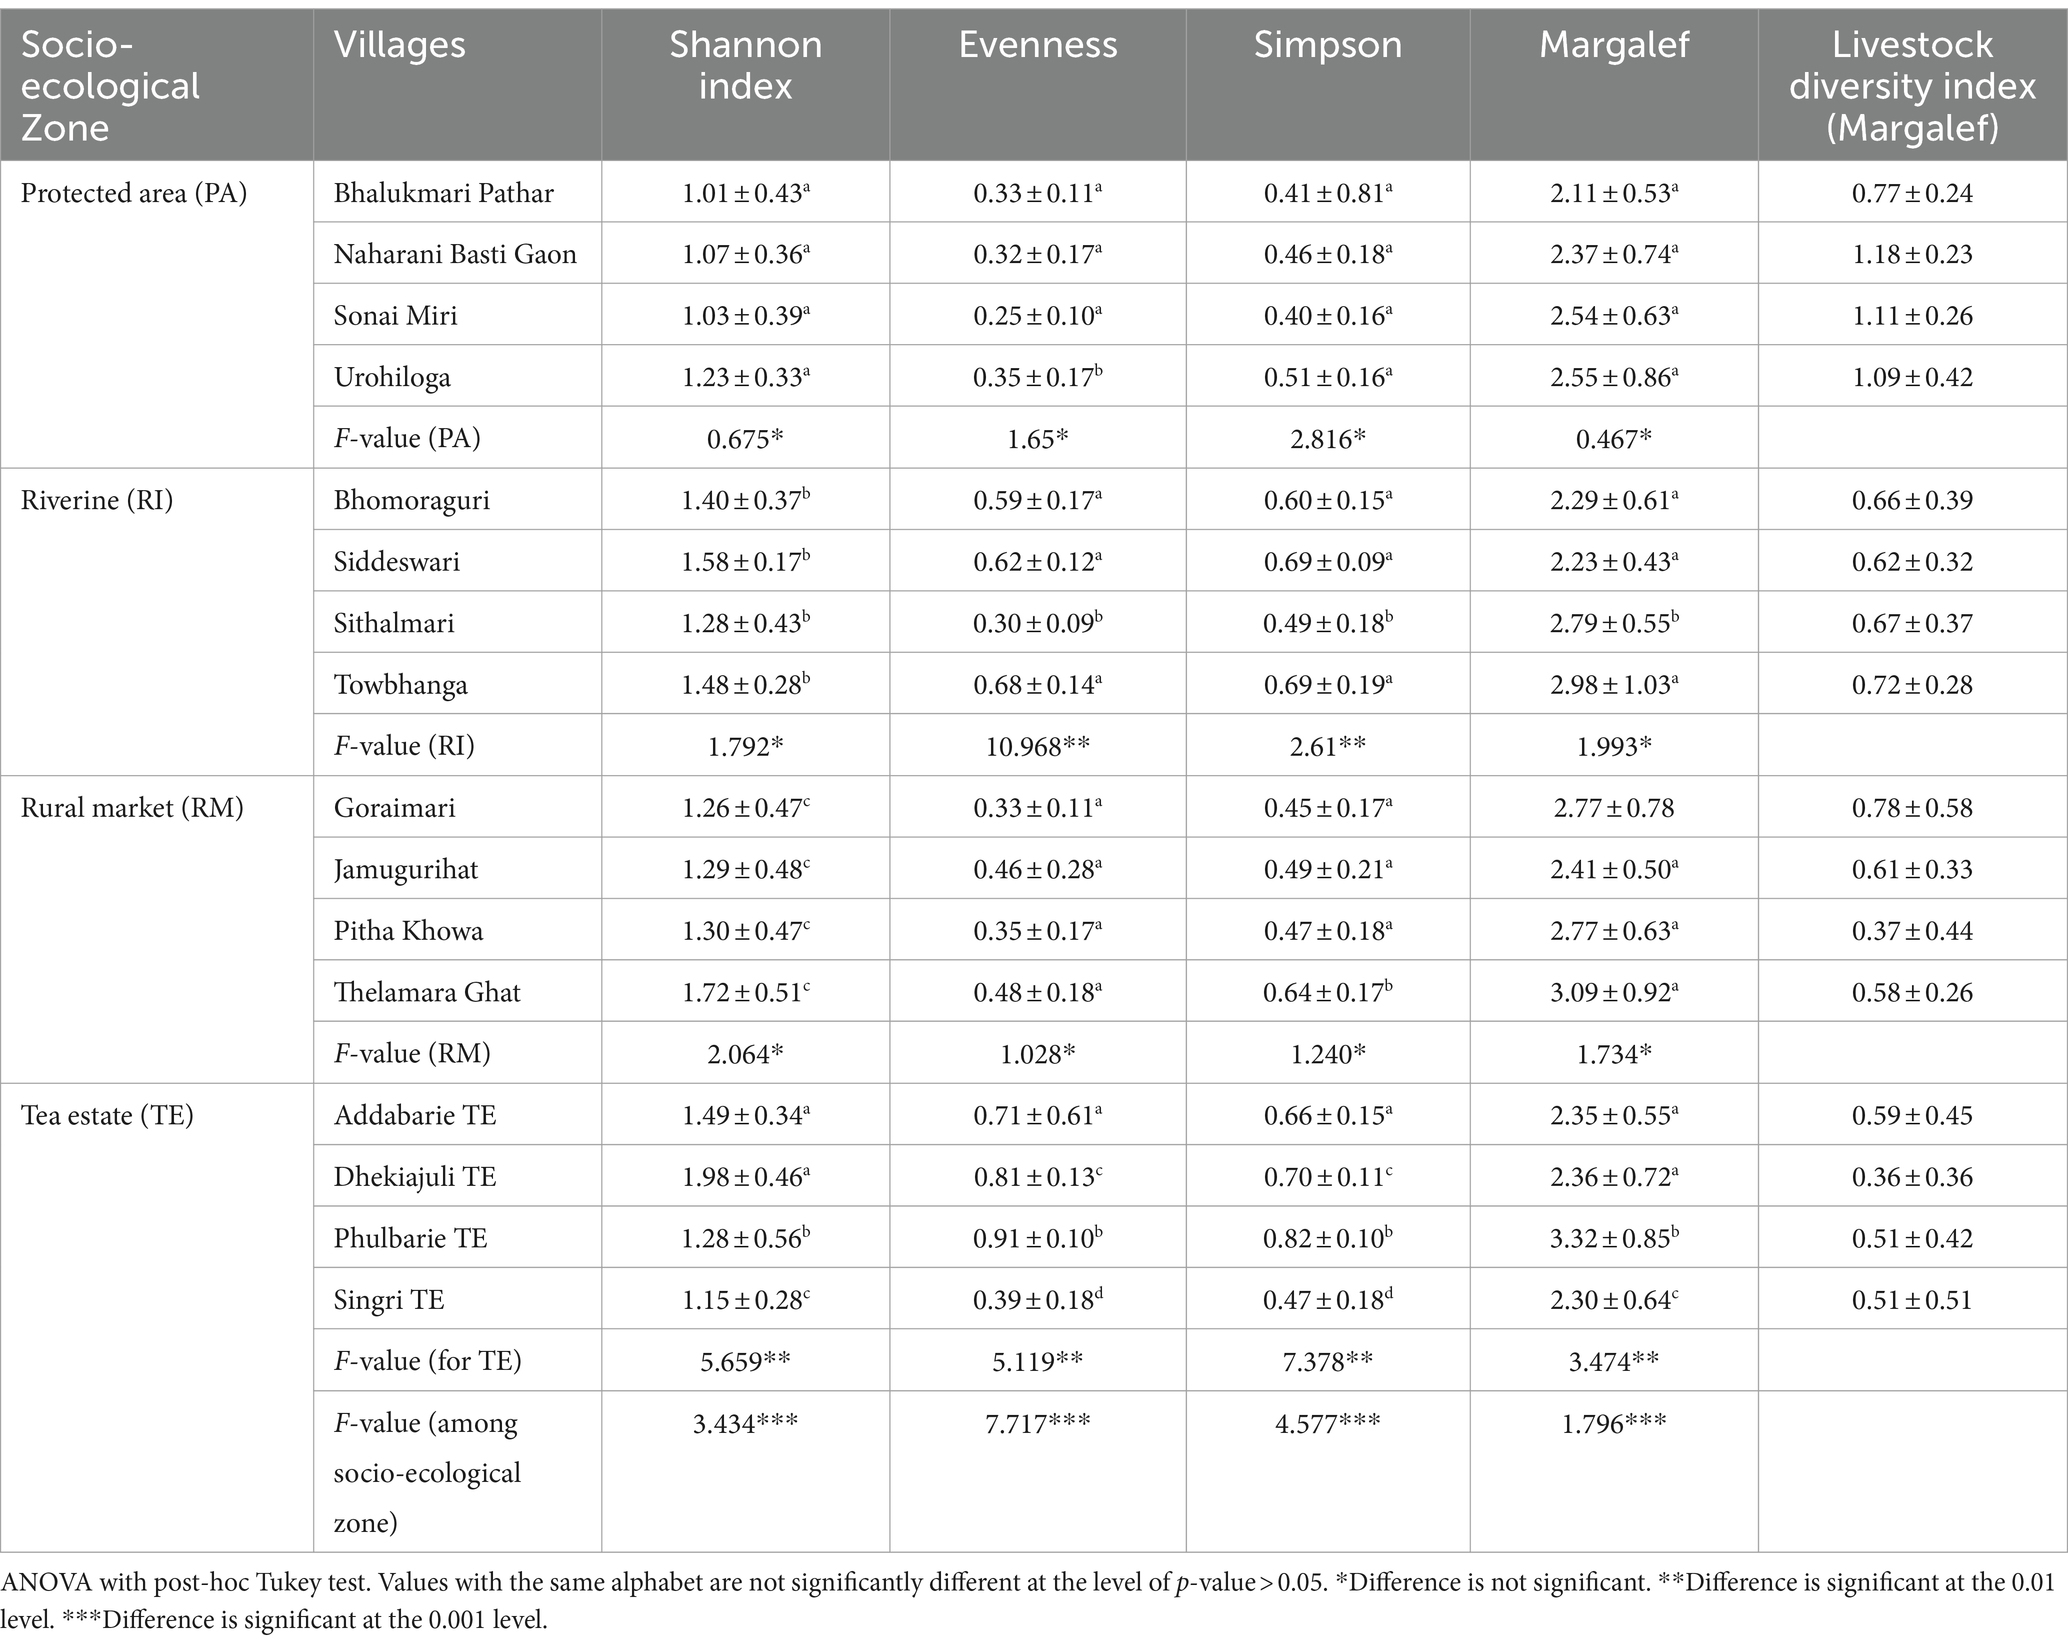
Table 2. Socio-ecological zone-wise average diversity indices in homegardens.
Livestock formed the most important part of 68% of all HGs surveyed; if we also take into consideration poultry farming and rearing avian birds for eggs and meat, this number becomes 85%. The common livestock observed in the field were Bos taurus (cattle), Bubalus bubalis (buffalo), Capra aegagrus hircus (goat), Sus scrofa domesticus (pig), and Ovis aries (sheep). In birds rearing for meat and eggs, the common birds reared were Gallus gallus domesticus (chicken), Anas platyrhyncos (ducks), and Columba livia (domestic pigeon). In addition, 20% of the homegardeners had more than one large animal. The highest average livestock variety and numbers were found in the HGs of PA (range 3–16) and least in the HGs of TE (range 1–3), shown in Table 2. A total of 21.87% of HG had a pond with an average of three fish varieties and a maximum of six varieties. The most common of them are Rohu (Labeo rohita), Catla (Catla catla), Mrigal carp (Cirrhinus cirrhosis), and Bariala (Aspidoparia morar). The SEZ with the highest number of ponds attached to HG is the PA (47.73%). The HG in the study area also reportedly had quite a high average livestock diversity index (0.67), and the PA had the highest (1.04) as shown in Table 3. Often, fodder tree species like Gmelina arborea Roxb were found to be cultivated in the HG to meet the requirements of this livestock. In addition, a small, outside, separated kitchen-like space was found to be present in almost all HGs where the food for livestock was prepared. For preparing the fodder, the fuelwood tree species cultivated in the HGs were used. Table 3 gives the agrobiodiversity distribution in different villages of diverse SEZs. The Sorenson similarity index among different SEZs for plant and livestock diversity was found to be highest between the HGs of the PA and RM (0.82) and least between the HGs of the TE and RI areas (0.58).
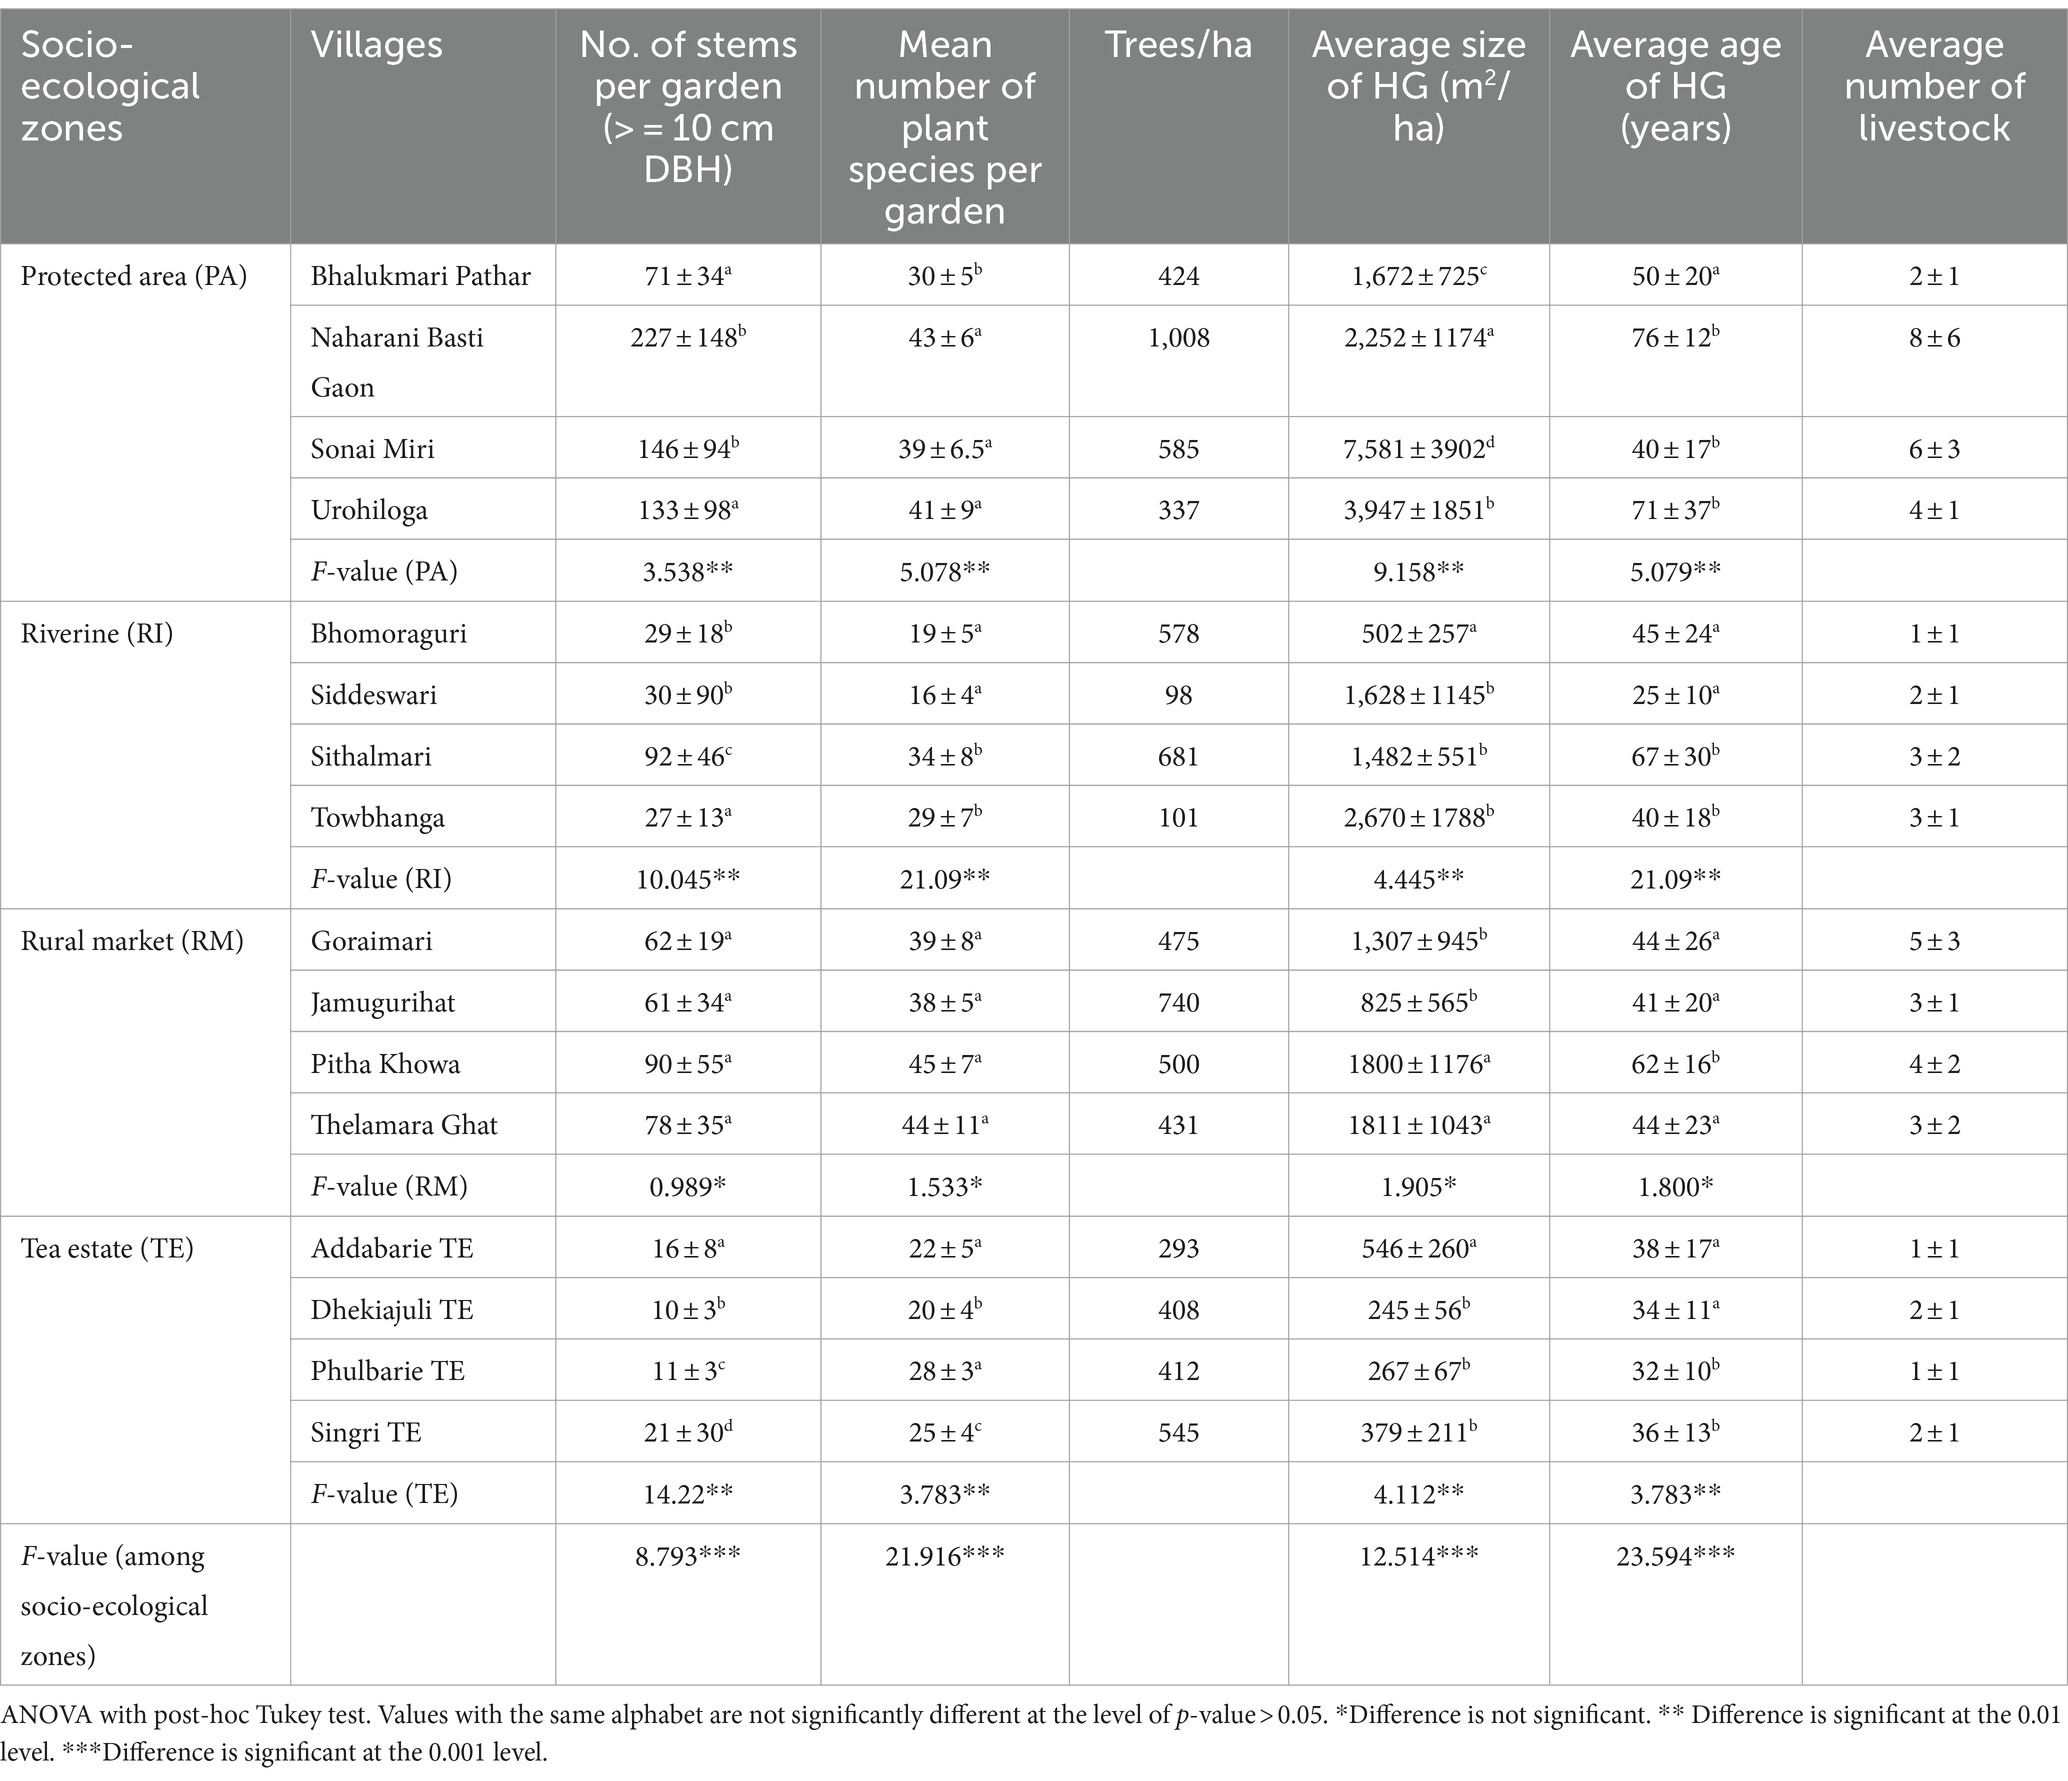
Table 3. Socio-ecological zone-wise average agrobiodiversity distribution in the study site.
In total, we encountered HG of eight linguistic and ethnic groups in the study region: the Assamese, Bodo, Bengali, Hindi Speaking, Mishing, the Gorkhalis, the Tea Tribes or Adivasis (staying outside the TEs), and the Tea Garden Workers (staying inside the TEs). Except for two SEZs, which were dominated by one ethnic group, others were more heterogeneous. The RM area is dominated by Assamese, the TE area is found to be dominated by the tea tribe, and the PA and RI are found to be dominated by a mixture of tribal and non-tribal groups. The largest size of HG was found to be in the Mishing tribe-managed HGs (0.268 ha) and the smallest size was found in the HGs of tea tribes (0.013 ha). The oldest unaltered HG was found in the RM (110 years) in the Assamese household, and the youngest HG was also found in the same zone among the Assamese household (5 years).
The average diversity indices among different ethnic and linguistic groups are shown in Table 4. The Shannon diversity index was found to be highest at 1.56 for the tea tribe. The average Simpson diversity index was also 0.66, with the highest for the tea tribe and the lowest 0.48 for Bengali. The Margalef Index was found to be highest at 3.01 for Adivasi and lowest at 2.43 for the Bengali linguistic group. This tendency to have high diversity indices in TE HG could be because there is no scope for planting plantation species because of their small size. This could be further verified from the observation that though diversity indices are higher for HGs of the tea tribe, the number of plant species observed is the least there (28).
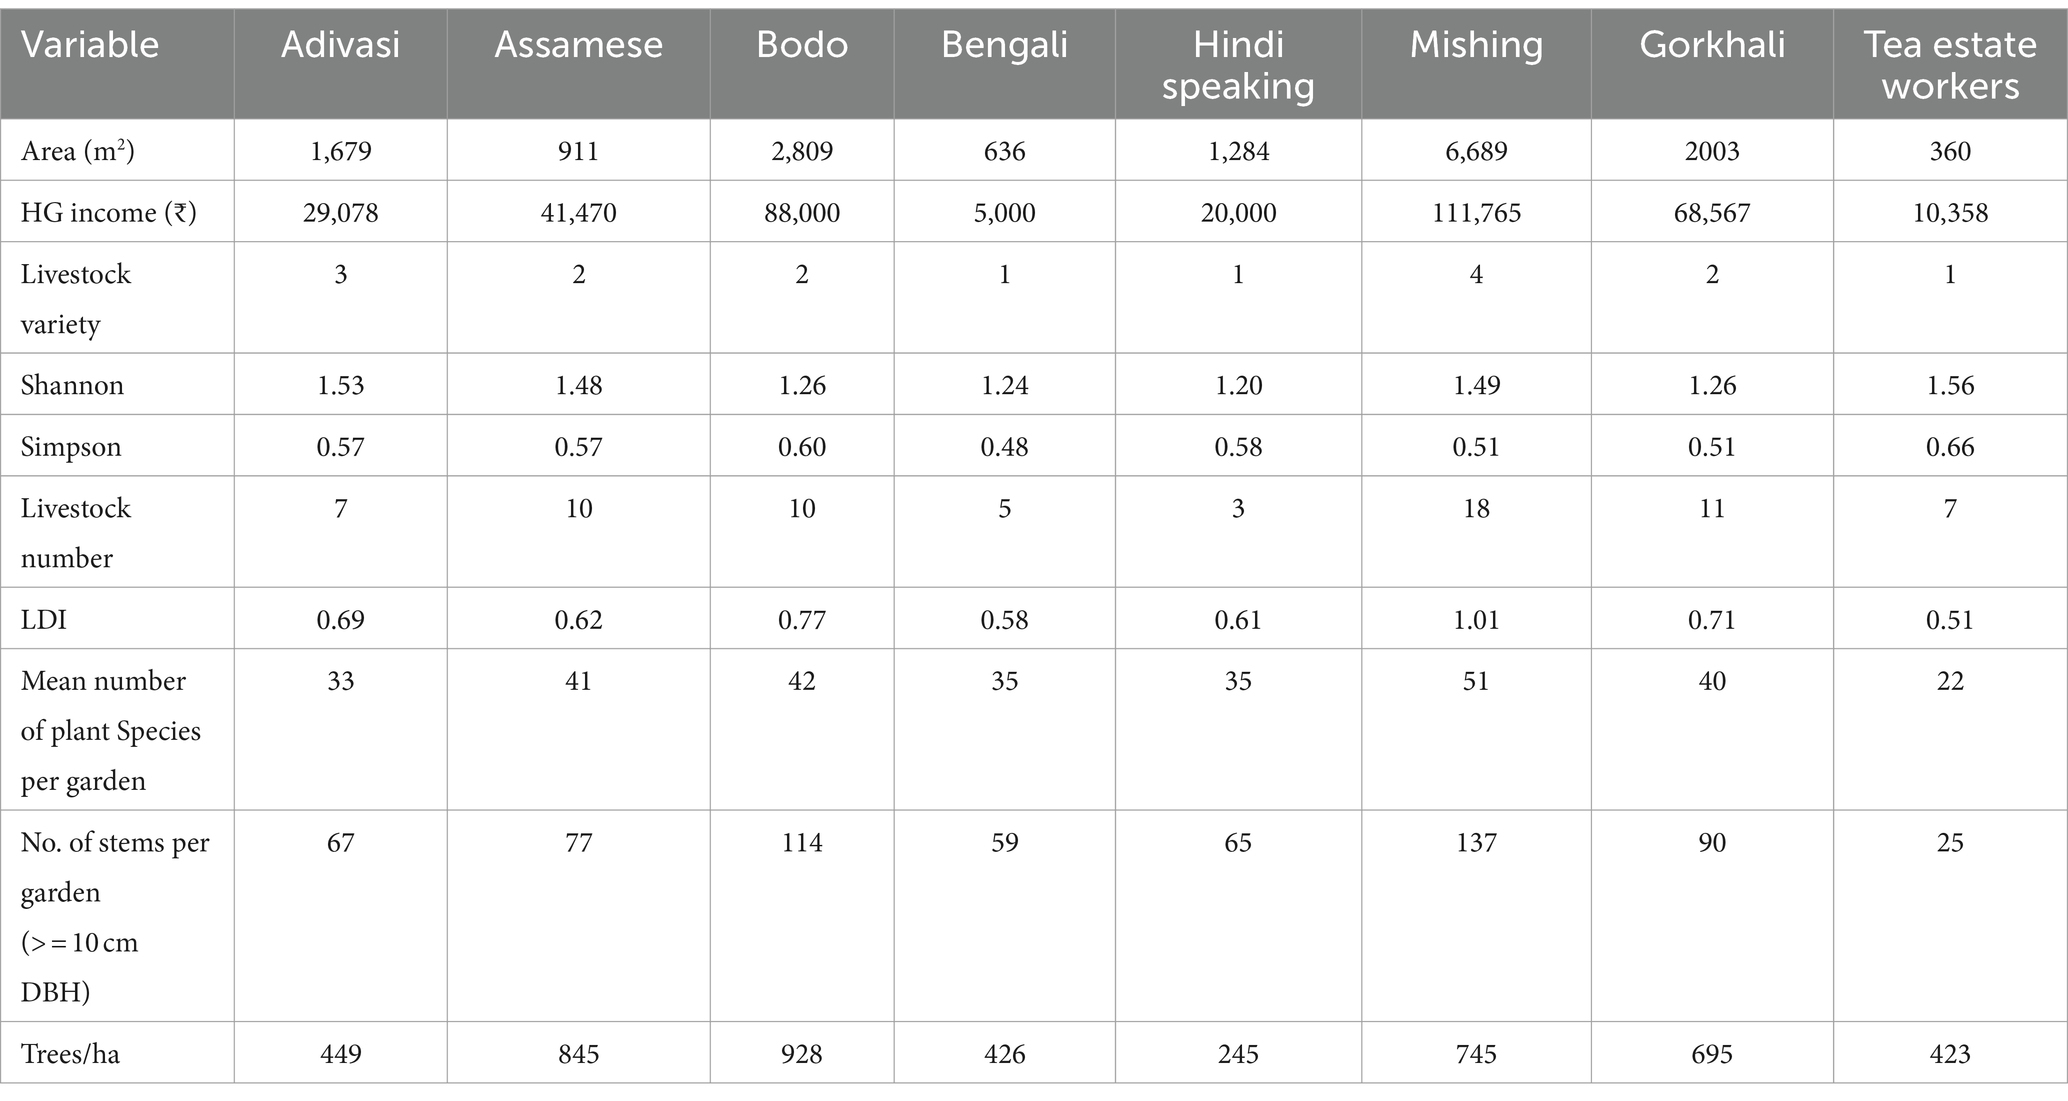
Table 4. Ethnicity-wise average agrobiodiversity distribution in the study site.
The highest mean number of plant species was found in the HGs maintained by Mishing Tribe (51) followed by Bodo Tribe (42), Assamese (41), Gorkhali (40), and Adivasi (33). The highest average variety (up to 4) and several livestock (up to 8) were found to be reared in Mishing HGs. Bos taurus and Capra aegagrus hircus were found to be raised in HGs of all communities, whereas Sus scrofa domesticus was mostly reared in the tribal communities, i.e., Bodo and Mishing HGs. For poultry and bird rearing, it was noticed that Anas platyrhyncos and Columba livia were predominantly reared in the Assamese HGs, and another form of small poultry was predominantly observed in the TE HGs. Though big livestock was comparatively fewer in the TE HGs, however, they had small birds and poultry more frequently. HG age is often reported as an important characteristic that tells about diversity, usage trends, and carbon stock. The highest Sorenson similarity index among plant species of HGs of an ethnic group is between Mishing and Bodo (0.78) and the lowest between Tea Tribe and Mishing (0.41). The comparative difference in these parameters among diverse ethnic groups is shown in Table 4.
HGs as an important site for the conservation of both floral and faunal diversity have been mentioned in the literature (Sharma et al., 2022). Similar to the HG study (Das and Das, 2015; Barbhuiya et al., 2016), we found the critically endangered species Agarwood (Aquilaria malaccensis) to be frequently cultivated in the HGs in all three SEZs except TEs. In addition, the endangered tree species Livistona jenkinsiana Griff (Fan palm) and Mesua ferrea L. (Cobra saffron) were observed. The IUCN-vulnerable species like Canarium strictum Roxb (Black Dhup) was also observed.
Apart from these tree species, many culturally important species like the Orchid Rhynchostylis retusa (Kopo ful; Figure 3E), a very commonly used plant for the Bihu festival (majorly by the Assamese family), Euphorbia splendens (Bathou), a very auspicious tree for the Batho religion (majorly of Bodo people), and Citrus limon (frequently used in Assamese cuisine) were frequently observed. This is similar to literature that mentions HGs as the site for the conservation of culturally important species (Galluzzi et al., 2010).
In addition, unique management practices were observed in the HGs, some of them being the use of homemade biopesticide and fertilizer, mixed cropping, and the use of indigenous seeds. Moreover, the majority of knowledge exchanges for plant species selection and techniques of homegardening were family- or community-based. Only 7% of homegardeners reported having received any formal training.
The findings that HGs were found to be unanimously distributed along the SEZs identified in the study site are consistent with the findings of Barua et al. (2019). They reported that a large majority of households in rural Assam (≈85%) have HGs. The results of the study reflect that the HGs of Brahmaputra Valley are important reserves of plant and livestock agrobiodiversity conservation. This further strengthens the conjecture that HGs worldwide are indeed an important reserve of plant and agrobiodiversity (Galluzzi et al., 2010; Tynsong and Tiwari, 2010). Moreover, the number of standing stock observed in the HG of the study site was quite larger than the HGs of Barak Valley in Assam (Das and Das, 2005) but was lesser than the HGs of Kerala (Kumar, 2023) and Brahmaputra Valley, Assam (Dutta et al., 2023). The lower number could be because of the smaller size classes of trees and shrubs sampled; e.g., in this study, trees and shrubs greater than 10 cm DBH were sampled, while Kumar (2023) sampled trees and shrubs above 5 cm DBH. In addition, the values of diversity indices reflect low diversity (average Shannon index = 1.35) compared to HG plant diversity being mentioned in other parts of the world and even in Brahmaputra Valley, Assam (average Shannon index = 3.48; Dutta et al., 2023). This could be because there is a trend of commercialization incorporating plantation species, especially in the HGs of PA and RM. Moreover, if we compare the species composition, the food plants consisting of vegetables, pulses, cereals, and fruiting trees were most cultivated; this is similar to HGs in different parts of the world where the maximum number of cultivated plants were for food (Vlkova et al., 2011; Panyadee et al., 2018; Whitney et al., 2018). Even in the HGs. of Assam, the food species are most commonly cultivated (Das and Das, 2005). Livestock formed an important part of all HG studies. HGs in this study also had a high livestock diversity index as well as a high livestock number. Livestock forms a very important food source for millions of people around the world, and a large amount of land and resources are often required to manage them; hence, the promotion of natural agrosilvopastoral systems like HG could help in achieving sustainability (Leroy et al., 2022).
Table 5 gives a comparative analysis of HGs at our sites with those reported in the literature. From this table, we can conclude that the features of HGs observed at the study site were similar to those reported in the literature.
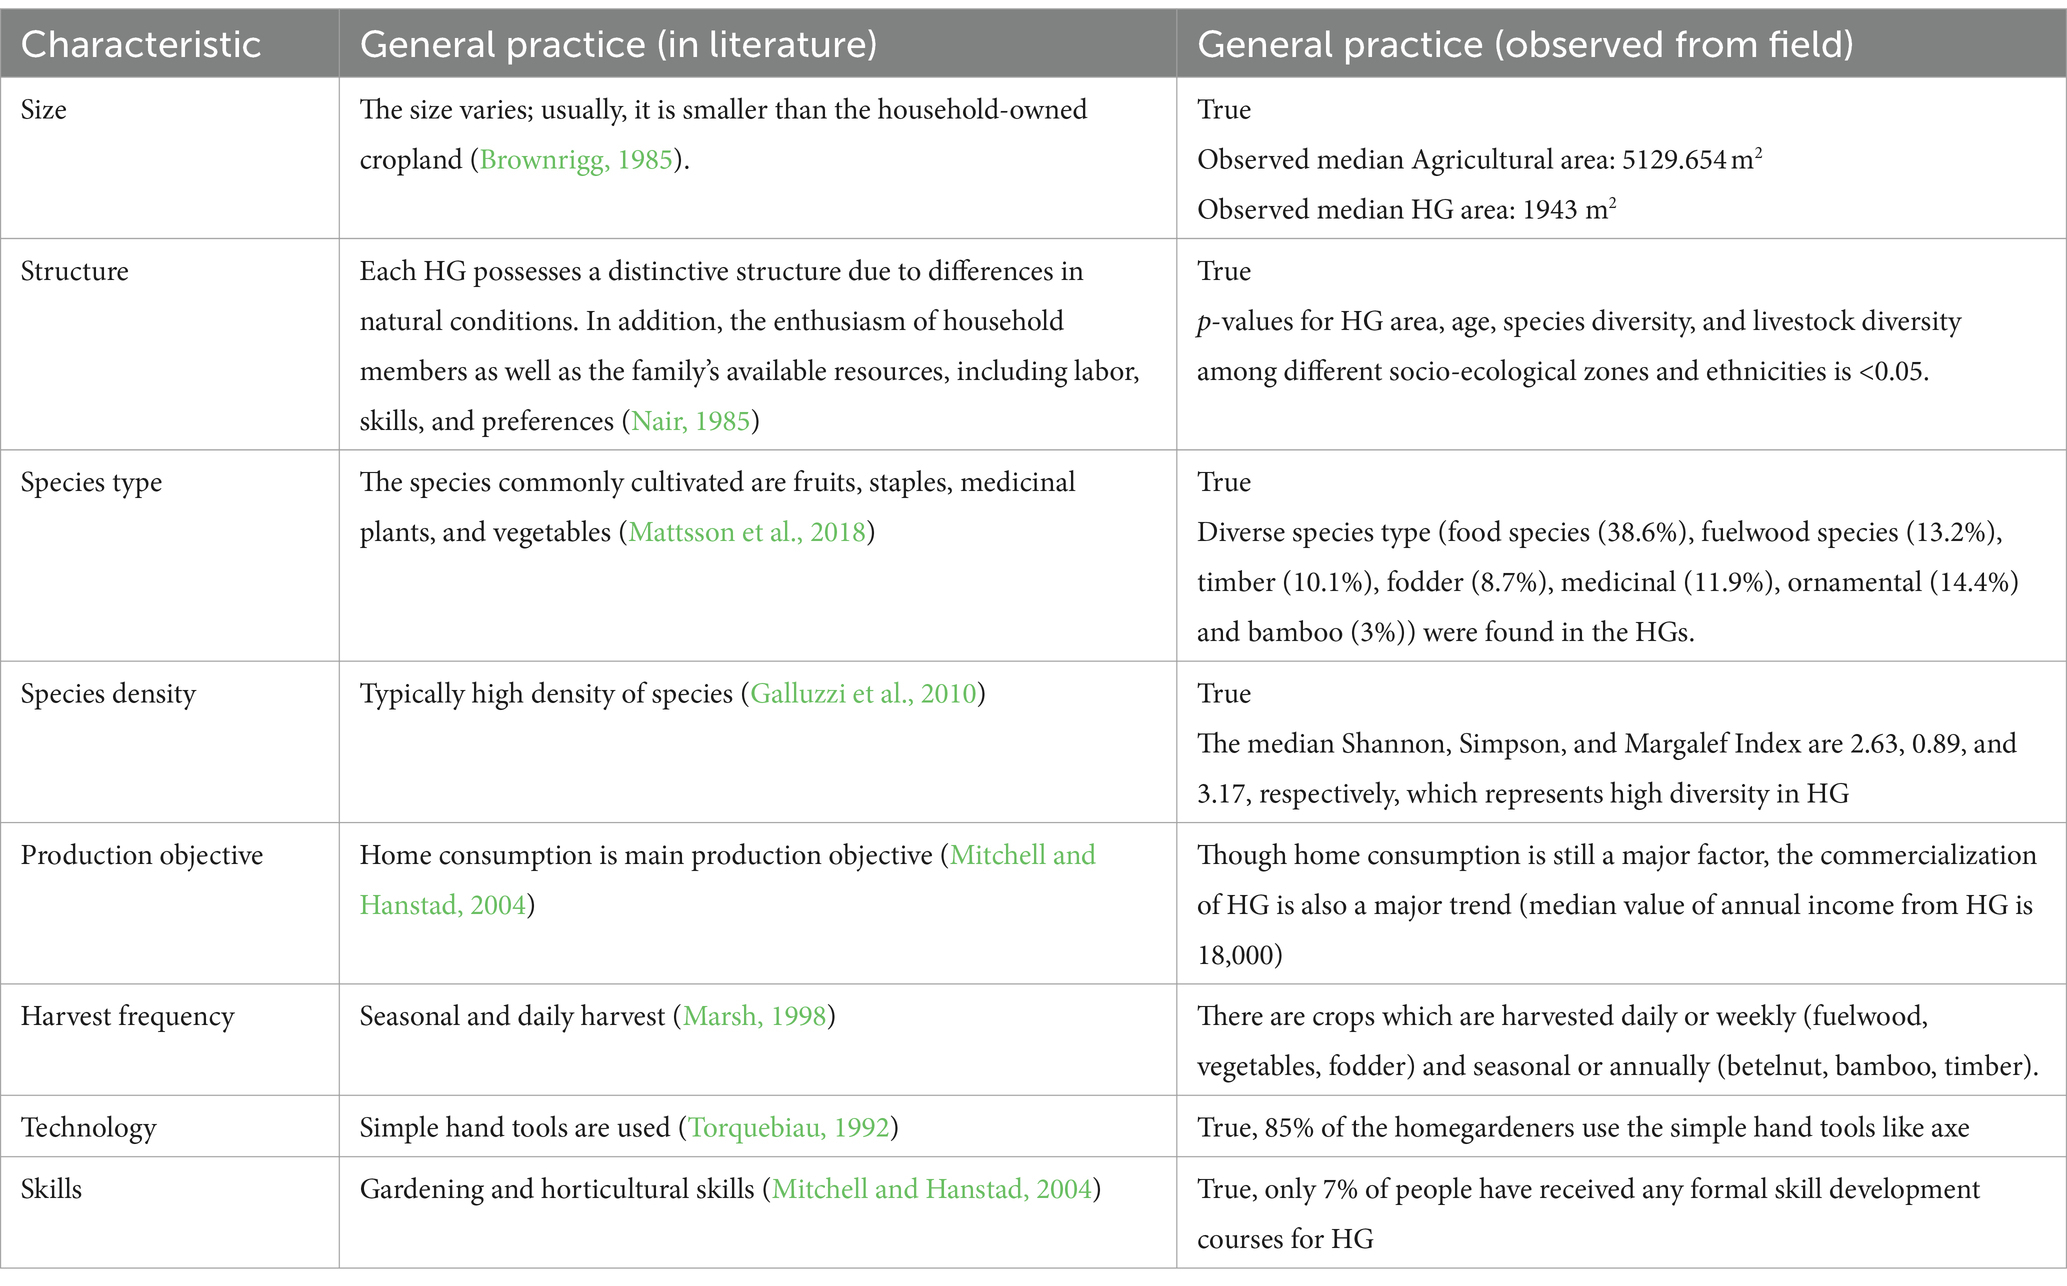
Table 5. Comparative assessment of homegardens observed in the field to that reported in the literature.
In addition, aligned with our hypothesis, we found that PA HG is larger with high plant and livestock species. The largest size of HGs reported from the PA is also similar to that in the literature that reports the largest size of HGs from the indigenous communities, with sizes ranging from 0.045 ha to 3.517 ha (Pinho et al., 2011; Barbhuiya et al., 2016), whereas the size of HGs reported from other SEZs is not that large (Murrieta and WinklerPrins, 2009; Panyadee et al., 2016). As expected, in the RI HG, more focus was on seasonal crops and the cultivation of species that are more flood-resilient. The RI HGs observed in the field are similar to those mentioned earlier in the literature of Assam, where the maximum proportion is of vegetable species (Boruah, 2007); also, they are similar to the HGs of the Amazonian Caboclo Community, which, though smaller in size, had a significant contribution to the cultural and food needs of the community. Though these HGs are periodically washed away by floods, the community again builds them back (Murrieta and WinklerPrins, 2009).
The RM HG, as expected, is on the pedestal of both being ancient and modern and is the traditional HG that needs maximum conservation. These HGs were similar to peri-urban HGs reported from Beijing, which reported the highest number of ornamental and culturally important species (Clarke et al., 2014). The characteristics of the TE HG observed highlight that, despite being smaller in size, the HG could act as an important locus for the cultivation of chosen food and fruit species, highlighting its importance in both food security and food sovereignty. Though these TE workers’ HGs are rarely mentioned in the literature, some studies mention the plant composition (fencing plants) used in the HGs of TEs in Assam (Borkataki et al., 2008). The size and number of plant species present in the HG varied significantly (p<0.05) with both ethnicity and among diverse SEZs (Figures 5A,B).
All HG ages observed in the field except for those in the TE were found to be in the category of old HGs (Pinho et al., 2011). Often, the older HGs are described as the heralds of biodiversity conservation and carbon stocks (Kassa et al., 2022). Even from the field, we found that HG age was directly correlated with HG plant diversity (r2 = 0.73; Figure 5C). In addition, the finding that both the youngest and oldest HG are present in the RM could be because the RM is among the oldest habituated areas in the study site, hence the probability of having older gardens, but also since the commercialization and urbanization-based land fragmentation are very fast in these regions, the land holding size is decreasing. Though HG in the PA area demonstrated high livestock numbers and variety, other SEZs also demonstrated a fair share of livestock numbers and diversity.
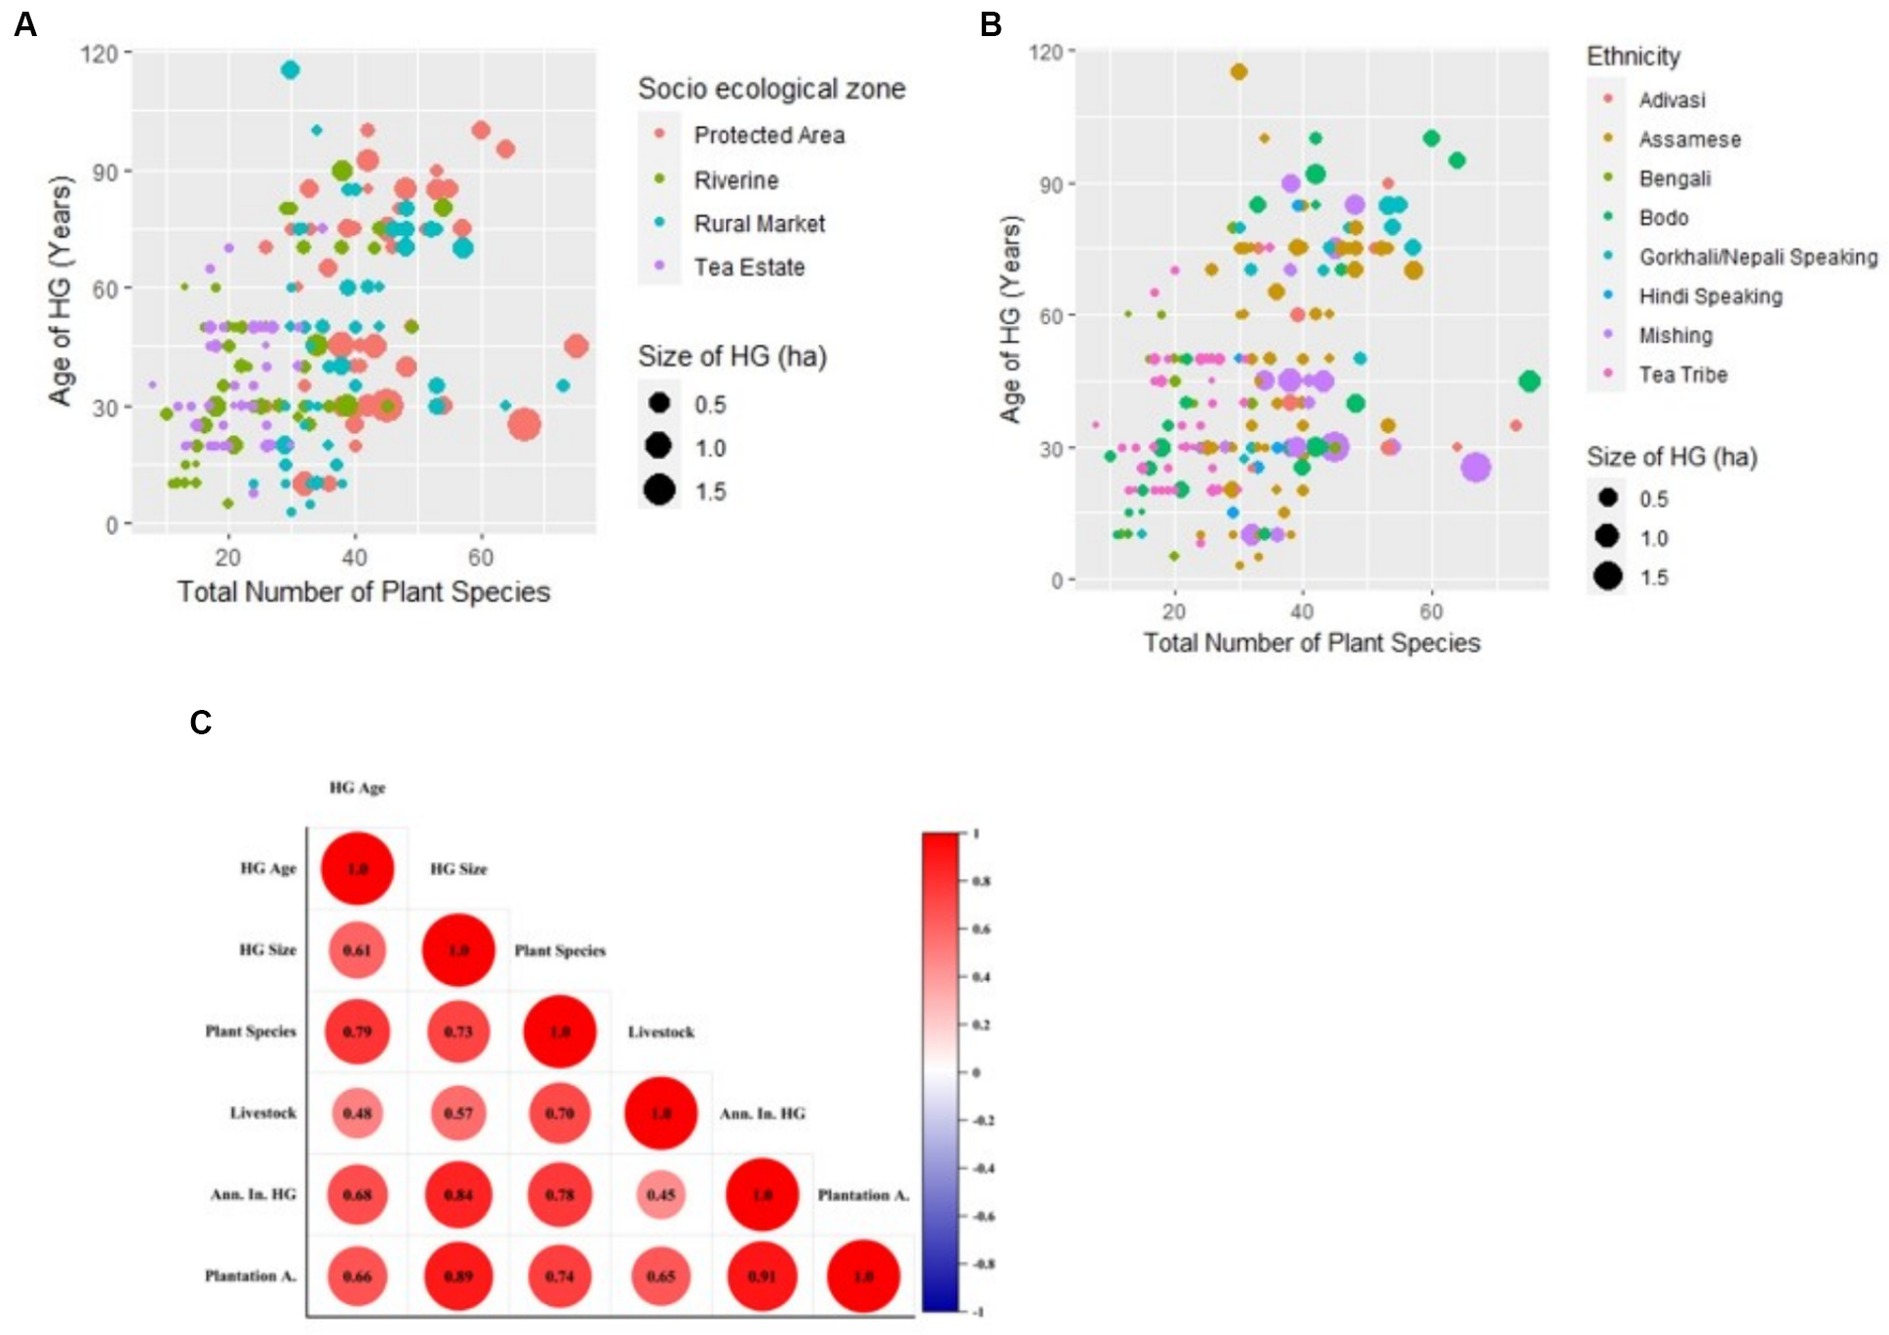
Figure 5. (A) Plot of HG age with total plant species in HG along different socio-ecological zones; (B) plot of HG age with total plant species among different cultural and ethnic groups; (C) correlation plot between HG variables among different socio-ecological zones.
In addition, the HG structure and diversity of plants and livestock varied among different ethnic groups. The highest number of plant species reported as 51 among the Mishing tribe is higher in number than 31.58 among the Sonowal Kachari tribe in Brahmaputra Valley (Dutta et al., 2023). The higher number of plant species in the HG of tribal communities as compared to non-tribal communities reflects the fact that tribal communities are still acting as the custodians of the conservation of agrobiodiversity (George and Christopher, 2020). However, there is an exception for tea tribe workers living inside tea estates because they have a very small area for homegardening. This suggests that HGs vary not only according to linguistic or ethnic groups, but that the total SEZ features influence them more.
Though the HG in each SEZ and ethnicity was different, in each scenario they are playing a significant role in agrobiodiversity conservation. However, the structure and pattern of agrobiodiversity in HGs of all SEZs and ethnicity are undergoing major changes, with the focus being on commercialization. Almost 70% of HG surveyed had Areca Catechu plantation objectives, and 5% of HG have been converted into small-scale tea plantation units. This trend of commercialization observed was similar to those reported in Indonesian homegardens (Abdoellah et al., 2020), where cultivation of commercial crops is becoming more common. Moreover, all homegardeners in the study site seek government and institutional support for better management of their HGs. The major challenges faced by homegardeners in the study site are represented in Figure 6. We can see that almost all SEZs have the major challenge of human–wildlife conflict. This is similar to a study by Yashmita-Ulman et al. (2020), which reported that traditional HGs in the Sonitpur district are at the receiving end of the negative impacts of the human–wildlife conflict. It was also reported that though in other agroforestry systems, the wild animals were killed for meat, in HGs they are mostly chased away (82%; Yashmita-Ulman et al., 2020). Hence, homegardeners can further be given incentives to promote coexistence with wild animals. In this way, HGs could also act as a conservation hotspot for wildlife. In addition, the development of market access to the products of these homegardeners and value addition to these products can strengthen the livelihood opportunities of homegardeners (Sharma et al., 2022). The result highlighting characteristic differences observed in HG among different SEZs and ethnicities in this study suggests HG could be an important contributor toward food sovereignty.
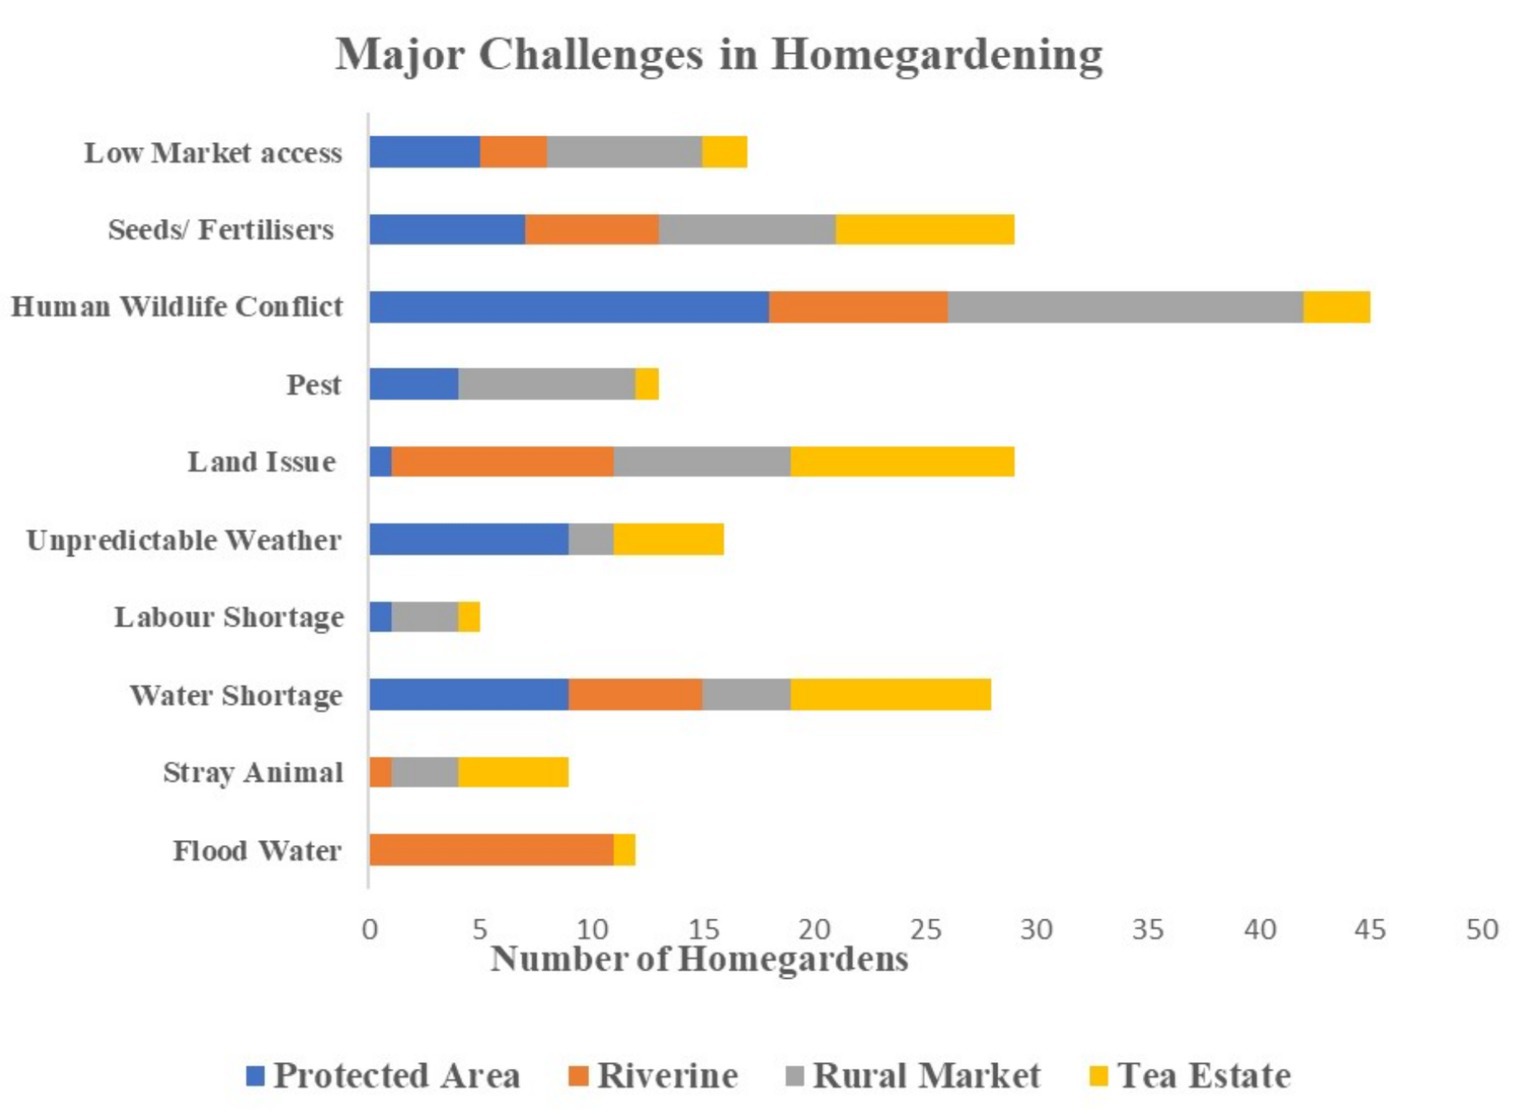
Figure 6. Major challenges in homegardening.
The result of this study highlights that HG in the study site is indeed acting as a high agrobiodiversity hotspot. The study also further strengthens the premise that HGs are a classic example of a diversified and integrated agricultural system. Moreover, though plant and livestock diversity was found to be characteristically different in HGs of different SEZs and ethnicities, the common component among all of them was the high emphasis given on the food species. These results are crucial at a time when the search for sustainable food systems is being given high priority. Promoting an integrated and conservation agricultural system like HG can be a win–win situation for all. However, more studies are required to understand how these differences in agrobiodiversity and management practices in different SEZs and ethnicities can influence the potential of HGs to enhance food security in the region. Furthermore, incentives should be provided for the conservation of traditional HGs. In addition, institutional support is crucial for mitigating the challenges observed by the homegardeners. In addition, a major trend of commercialization was observed in the homegardens; the impact of this commercialization on agrobiodiversity and food security can be the subject of further study.
The raw data supporting the conclusions of this article will be made available by the authors, without undue reservation.
Ethical review and approval were obtained for the study on human participants in accordance with institutional ethics review board of Jawaharlal Nehru University (Reference No: 2022/Ph.D Student/329) and also District Collector of Sonitpur district (Order No: SMJ.29/Misc./2020/244). Furthermore, the consent was also taken from the individual respondent participating in the study.
RS: Conceptualization, Data curation, Formal analysis, Funding acquisition, Investigation, Methodology, Software, Visualization, Writing – original draft, Writing – review & editing, Project administration. UM: Conceptualization, Investigation, Methodology, Project administration, Supervision, Writing – review & editing, Resources, Validation. AD: Investigation, Supervision, Validation, Writing – review & editing, Resources. BK: Formal analysis, Supervision, Validation, Writing – review & editing.
The author(s) declare that financial support was received for the research, authorship, and/or publication of this article. RS would like to express her gratitude to the Ministry of Human Resource Development, Government of India, for providing her with a Prime Minister Research Fellowship (PMRF ID: 3400685) for her PhD work.
The author is also grateful to all the homegardeners and gaon buras who allowed us to study their homegardens. The author is also very thankful to the District Commissioner, Sonitpur District, who allowed her to conduct this study smoothly in all socio-ecological zones of the district. The author would also like to especially thank Ramesh Sharma, Research Associate, ISB, Hyderabad (currently affiliated), and Anurag Verma, TERI, Delhi, for valuable insights for statistical analysis and constructive feedback.
The authors declare that the research was conducted in the absence of any commercial or financial relationships that could be construed as a potential conflict of interest.
The author(s) declared that they were an editorial board member of Frontiers, at the time of submission. This had no impact on the peer review process and the final decision.
All claims expressed in this article are solely those of the authors and do not necessarily represent those of their affiliated organizations, or those of the publisher, the editors and the reviewers. Any product that may be evaluated in this article, or claim that may be made by its manufacturer, is not guaranteed or endorsed by the publisher.
Abdoellah, O. S., Schneider, M., Nugraha, L. M., Suparman, Y., Voletta, C. T., Withaningsih, S., et al. (2020). Homegarden commercialization: extent, household characteristics, and effect on food security and food sovereignty in rural Indonesia. Sustain. Sci. 15, 797–815. doi: 10.1007/s11625-020-00788-9
Ahmmed, F., and Hossain, M. I. (2016). A study report on working conditions of tea plantation workers in Bangladesh. Dhaka: ILO: International Labour Organization, 7–20.
Assam, G. O. (2022). Geography of Sonitpur. Available at: https://sonitpur.assam.gov.in/about-us/geography [Accessed 26-11-2023].
Avilez-López, T., Van Der Wal, H., Aldasoro-Maya, E. M., and Rodríguez-Robles, U. (2020). Home gardens’ agrobiodiversity and owners’ knowledge of their ecological, economic and socio-cultural multifunctionality: a case study in the lowlands of Tabasco, México. J. Ethnobiol. Ethnomed. 16, 1–13. doi: 10.1186/s13002-020-00392-2
Barbhuiya, A. R., Sahoo, U. K., and Upadhyaya, K. (2016). Plant diversity in the indigenous home gardens in the eastern Himalayan region of Mizoram, Northeast India. Econ. Bot. 70, 115–131. doi: 10.1007/s12231-016-9349-8
Barua, J. P., Ahmed, A. A., Gogoi, S., Pathak, S., and Hatibarua, P. (2019). Baree the home garden of Assam. Kahikuchi, Guwahati: Assam Agricultural University.
Berkes, F., Folke, C., and Colding, J. (2000). Linking social and ecological systems: Management practices and social mechanisms for building resilience. Cambridge, United Kingdom: Cambridge University Press.
Borkataki, S., Chutia, M., and Borthakur, S. (2008). Ethnobotany of biofencing among teagarden and ex-teagarden communities of Nagaon district of Assam. Indian Journal of Traditional Knowledge (IJTK).
Boruah, N. (2007). “Rivers and riverine settlements: Interface of environment and emerging agrarian society in early Assam,” in Proceedings of the Indian history congress. JSTOR. 68, 66–80.
Brownrigg, L. (1985). Home gardening in international development: what the literature shows. Washington, DC: The League for International Food Education.
Census (2011). Census of India 2011 provisional population totals. New Delhi: Office of the Registrar General and Census Commissioner.
Chaturvedi, R., Das, B., Banerjee, S., and Bhattacharjee, C. R. (2021). Groundwater quality characterization of North Brahmaputra Basin using positive matrix factorization. Proceedings of the national academy of sciences, India Section A: Physical Sciences 91, 393–404. doi: 10.1007/s40010-020-00712-x
Clarke, L. W., Li, L., Jenerette, G. D., and Yu, Z. (2014). Drivers of plant biodiversity and ecosystem service production in home gardens across the Beijing municipality of China. Urban Ecosyst. 17, 741–760. doi: 10.1007/s11252-014-0351-6
Das, T., and Das, A. K. (2005). Inventorying plant biodiversity in homegardens: a case study in Barak Valley, Assam, north East India. Curr. Sci. 89, 155–163.
Das, T., and Das, A. K. (2015). Conservation of plant diversity in rural Homegardens with cultural and geographical variation in three districts of Barak Valley, Northeast India 1. Econ. Bot. 69, 57–71. doi: 10.1007/s12231-015-9299-6
Debnath, J., Sahariah, D., Lahon, D., Nath, N., Chand, K., Meraj, G., et al. (2023). Geospatial modeling to assess the past and future land use-land cover changes in the Brahmaputra Valley, ne India, for sustainable land resource management. Environ. Sci. Pollut. Res. 30, 106997–107020. doi: 10.1007/s11356-022-24248-2
DOTTAA. (2023). List of Tea Garden at Assam. Tea Tribes and Welfare Department,Govt. of Assam. Available at: https://ttwd.assam.gov.in/frontimpotentdata/list-of-tea-garden-at-assam [Accessed 14-12-2023 2023].
Dutta, M., Deb, P., and Das, A. K. (2023). Factors shaping plant diversity in traditional agroforestry system of dominant ethnic communities of upper Brahmaputra valley regions of Northeast India. Agrofor. Syst. 97, 727–738. doi: 10.1007/s10457-023-00823-5
EURAF. (2021). European Agroforestry Federation. Available at: https://euraf.isa.utl.pt/news/policybriefing2, [Accessed 10-07-2021].
FAO. (2004). Building on gender, agrobiodiversity and local knowledge. 00100 Rome, Italy. Available at: www.fao.org/sd/links [Accessed 2–12 2023].
FAO. (2015). Agroforestry. Available at: https://www.fao.org/forestry/agroforestry/80338/en/ [Accessed 21 June 2021].
FAO (2019). The state of the world’s biodiversity for food and agriculture. Rome, Italy: Food and Agriculture Organization of the United Nations (FAO).
Galhena, D. H., Freed, R., and Maredia, K. M. (2013). Home gardens: a promising approach to enhance household food security and wellbeing. Agric. Food Secur. 2, 1–13. doi: 10.1186/2048-7010-2-8
Galluzzi, G., Eyzaguirre, P., and Negri, V. (2010). Home gardens: neglected hotspots of agro-biodiversity and cultural diversity. Biodivers. Conserv. 19, 3635–3654. doi: 10.1007/s10531-010-9919-5
George, M. V., and Christopher, G. (2020). Structure, diversity and utilization of plant species in tribal homegardens of Kerala, India. Agrofor. Syst. 94, 297–307. doi: 10.1007/s10457-019-00393-5
GOA. (2023). River system of Assam. Water Resources, Government of Assam. Available at: https://waterresources.assam.gov.in/portlet-innerpage/brahmaputra-river-system [Accessed 26-11-2023].
IFPRI (2021). Global food policy report: Transforming food systems after Covid-19. Washington, Dc: International Food Policy Research Institute (Ifpri).
Kar, R. (1984). Labour pattern and absenteeism: a case study in tea plantation in Assam, India. Anthropos. 79, 13–24.
Kassa, G., Bekele, T., Demissew, S., and Abebe, T. (2022). Above-and belowground biomass and biomass carbon stocks in homegarden agroforestry systems of different age groups at three sites of southern and southwestern Ethiopia. Carbon Manag. 13, 531–549. doi: 10.1080/17583004.2022.2133743
Kumar, B. M. (2023). Do carbon stocks and floristic diversity of tropical homegardens vary along an elevational gradient and based on holding size in Central Kerala, India? Agrofor. Syst. 97, 751–783. doi: 10.1007/s10457-023-00821-7
Kumar, B. M., and Nair, P. R. (2004). The enigma of tropical homegardens. Agrofor. Syst. 61, 135–152. doi: 10.1007/978-94-017-2424-1_10
Kumar, B. M., and Nair, P. K. R. (2006). “Introduction” in Tropical Homegardens: A time-tested example of sustainable agroforestry (Dordrecht: Springer Netherlands).
Leroy, F., Abraini, F., Beal, T., Dominguez-Salas, P., Gregorini, P., Manzano, P., et al. (2022). Animal board invited review: animal source foods in healthy, sustainable, and ethical diets–an argument against drastic limitation of livestock in the food system. Animal 16:100457. doi: 10.1016/j.animal.2022.100457
Mahanta, T. G., Mahanta, B. N., Gogoi, P., Dixit, P., Joshi, V., and Ghosh, S. (2015). Prevalence and determinants of anaemia and effect of different interventions amongst tea tribe adolescent girls living in Dibrugarh district of Assam. Clinical Epidemiol. Global Health 3, 85–93. doi: 10.1016/j.cegh.2014.07.003
Mahato, R., Nimasow, G., Nimasow, O. D., and Bushi, D. (2021). Assessing the tropical forest cover change in northern parts of Sonitpur and Udalguri District of Assam, India. Sci. Rep. 11:11170. doi: 10.1038/s41598-021-90595-8
Margalef, R. (1958). “Temporal succession and spatial heterogeneity in natural phytoplankton,” in Perspectives in marine biology. ed. A. Buzzati-Traverso (Berkeley: University of California Press), 323–350.
Marsh, R. (1998). Building on traditional gardening to improve household food security. Food Nutr. Agric. 4–14.
Mattsson, E., Ostwald, M., and Nissanka, S. (2018). What is good about Sri Lankan homegardens with regards to food security? A synthesis of the current scientific knowledge of a multifunctional land-use system. Agrofor. Syst. 92, 1469–1484. doi: 10.1007/s10457-017-0093-6
Mazumdar, S., and Mazumdar, S. (2012). Immigrant home gardens: places of religion, culture, ecology, and family. Landsc. Urban Plan. 105, 258–265. doi: 10.1016/j.landurbplan.2011.12.020
Mekuria, W., and Mekonnen, K. (2018). Determinants of crop–livestock diversification in the mixed farming systems: evidence from central highlands of Ethiopia. Agric. Food Secur. 7, 1–15. doi: 10.1186/s40066-018-0212-2
Mitchell, R., and Hanstad, T. (2004). Small homegarden plots and sustainable livelihoods for the poor. FAO LSP WP 11.
Murrieta, R., and Winklerprins, A. (2009). ‘I love flowers’: home gardens, aesthetics and gender roles in a riverine caboclo community in the lower Amazon, Brazil. Amazon peasant societies in a changing environment: Political ecology, invisibility and modernity in the rainforest, 259–277. doi: 10.1007/978-1-4020-9283-1_12
Nair, P. R. (1985). Classification of agroforestry systems. Agrofor. Syst. 3, 97–128. doi: 10.1007/BF00122638
Nair, P. R., Kumar, B. M., and Nair, V. D. (2021). An introduction to agroforestry-four decades of scientific developments. Switzerland: Springer.
NRSC (2019). Land Use / Land Cover database on 1:50,000 scale, Natural Resources Census Project, LUCMD, LRUMG, RSAA. Hyderabad: National Remote Sensing Centre, ISRO.
Ostrom, E. (2009). A general framework for analyzing sustainability of social-ecological systems. Science 325, 419–422. doi: 10.1126/science.1172133
Panyadee, P., Balslev, H., Wangpakapattanawong, P., and Inta, A. (2016). Woody plant diversity in urban homegardens in northern Thailand. Econ. Bot. 70, 285–302. doi: 10.1007/s12231-016-9348-9
Panyadee, P., Balslev, H., Wangpakapattanawong, P., and Inta, A. (2018). Karen Homegardens: characteristics, functions, and species diversity. Econ. Bot. 72, 1–19. doi: 10.1007/s12231-018-9404-8
Pilling, J. B. D. (2019). The state of the world's biodiversity for food and agriculture. Rome: FAO.
Pinho, R. C., Alfaia, S. S., Miller, R. P., Uguen, K., Magalhaes, L. D., Ayres, M., et al. (2011). Islands of fertility: soil improvement under indigenous homegardens in the savannas of Roraima, Brazil. Agrofor. Syst. 81, 235–247. doi: 10.1007/s10457-010-9336-5
Poot-Pool, W. S., Van Der Wal, H., Flores-Guido, S., Pat-Fernández, J. M., and Esparza-Olguín, L. (2012). Economic stratification differentiates home gardens in the Maya village of Pomuch, México. Econ. Bot. 66, 264–275. doi: 10.1007/s12231-012-9206-3
Ravindranath, N., Rao, S., Sharma, N., Nair, M., Gopalakrishnan, R., Rao, A. S., et al. (2011). Climate change vulnerability profiles for North East India. Curr. Sci. 101, 384–394.
Sehgal, J. M. D., Mandal, C., and Vadivelu, S. (1992). “Agro-ecological regions of India,” in National Bureau for Soil Survey and Land Use Planning, Second Edition. Nagpur, India: CABI Databases, NBSS Publication, 130 p.
Sharma, R., Mina, U., and Kumar, B. M. (2022). Homegarden agroforestry systems in achievement of sustainable development goals. A review. Agron. Sustain. Dev. 42:44. doi: 10.1007/s13593-022-00781-9
Soler, R., Peri, P. L., Bahamonde, H., Gargaglione, V., Ormaechea, S., Herrera, A. H., et al. (2018). Assessing knowledge production for agrosilvopastoral systems in South America. Rangel. Ecol. Manag. 71, 637–645. doi: 10.1016/j.rama.2017.12.006
Srivastava, S., Singh, T., Singh, H., Kushwaha, S., and Roy, P. (2002). Assessment of large-scale deforestation in Sonitpur district of Assam. Curr. Sci. 82, 1479–1484.
Torquebiau, E. (1992). Are tropical agroforestry home gardens sustainable? Agric. Ecosyst. Environ. 41, 189–207. doi: 10.1016/0167-8809(92)90109-O
Tynsong, H., and Tiwari, B. (2010). Plant diversity in the homegardens and their significance in the livelihoods of war khasi community of Meghalaya, north-East India. J. Biodiversity 1, 1–11. doi: 10.1080/09766901.2010.11884713
Vlkova, M., Polesny, Z., Verner, V., Banout, J., Dvorak, M., Havlik, J., et al. (2011). Ethnobotanical knowledge and agrobiodiversity in subsistence farming: case study of home gardens in Phong my commune, Central Vietnam. Genet. Resour. Crop. Evol. 58, 629–644. doi: 10.1007/s10722-010-9603-3
Whitney, C. W., Luedeling, E., Hensel, O., Tabuti, J. R., Krawinkel, M., Gebauer, J., et al. (2018). The role of homegardens for food and nutrition security in Uganda. Hum. Ecol. 46, 497–514. doi: 10.1007/s10745-018-0008-9
Wiehle, M., Goenster, S., Gebauer, J., Mohamed, S. A., Buerkert, A., and Kehlenbeck, K. (2014). Effects of transformation processes on plant species richness and diversity in homegardens of the Nuba Mountains, Sudan. Agrofor. Syst. 88, 539–562. doi: 10.1007/s10457-014-9717-2
Keywords: agroforestry, agrobiodiversity, livestock diversity index, indigenous communities, commercialization
Citation: Sharma R, Mina U, Devi A and Kumar BM (2024) Do homegardens act as agent of agrobiodiversity conservation: a case study of homegardens of diverse socio-ecological zones in the Brahmaputra Valley, Assam. Front. Sustain. Food Syst. 8:1366499. doi: 10.3389/fsufs.2024.1366499
Edited by:
Rishi Raj, Indian Agricultural Research Institute (ICAR), IndiaReviewed by:
Gopal Shankar Singh, Banaras Hindu University, IndiaCopyright © 2024 Sharma, Mina, Devi and Kumar. This is an open-access article distributed under the terms of the Creative Commons Attribution License (CC BY). The use, distribution or reproduction in other forums is permitted, provided the original author(s) and the copyright owner(s) are credited and that the original publication in this journal is cited, in accordance with accepted academic practice. No use, distribution or reproduction is permitted which does not comply with these terms.
*Correspondence: Usha Mina, dXNoYW1pbmFAam51LmFjLmlu
Disclaimer: All claims expressed in this article are solely those of the authors and do not necessarily represent those of their affiliated organizations, or those of the publisher, the editors and the reviewers. Any product that may be evaluated in this article or claim that may be made by its manufacturer is not guaranteed or endorsed by the publisher.
Research integrity at Frontiers
Learn more about the work of our research integrity team to safeguard the quality of each article we publish.