
94% of researchers rate our articles as excellent or good
Learn more about the work of our research integrity team to safeguard the quality of each article we publish.
Find out more
ORIGINAL RESEARCH article
Front. Sustain. Food Syst. , 12 July 2024
Sec. Crop Biology and Sustainability
Volume 8 - 2024 | https://doi.org/10.3389/fsufs.2024.1366387
This article is part of the Research Topic Plant Holobiont Perspective In Plants Disease Management View all 7 articles
 Xuewei Wang
 Jun Liu*
The cucumber disease images obtained from natural environments often contain noise such as variations in lighting and soil conditions, which significantly impact the accuracy of disease recognition. Additionally, existing detection models require large memory footprints, making real-time cucumber disease detection challenging. To address the challenges associated with detecting small targets in cucumber disease images, this study presents an algorithm named CucumberDet, which integrates global information perception and feature fusion. Initially, we employ the Swin Transformer as the backbone network for RetinaNet to augment the primary network’s feature extraction capabilities, thus enhancing its ability to extract information globally. Subsequently, to strengthen the network’s detection capabilities, especially for remote and small targets, we introduce a highly effective Small Target Feature Fusion Module (SFFM) to meticulously integrate detailed data of small targets into shallow feature maps. Finally, to further refine the network’s capability to identify multi-scale targets and facilitate the flow of low-level feature information to high-level features, we introduce a novel Multi-level Feature Adaptive Fusion Module (MFAFM). Encouraging detection results are obtained across three distinct datasets, with experimental findings on a self-compiled cucumber disease image dataset revealing that our proposed algorithm improves detection accuracy by 6.8% compared to the original RetinaNet baseline network. The proposed model achieves an mAP of 92.5%, with a parameter count of 38.39 million and a frame per second (FPS) rate of 23.6, underscoring its superior performance in detecting small targets and demonstrating its effectiveness across various application scenarios.
With the rapid advancement of agricultural technology, the automatic detection and identification of crop diseases using image processing techniques has become a research focus. Among these, cucumbers, as widely cultivated vegetable crops, the automatic identification of their diseases holds significant importance for improving both yield and quality (Abade et al., 2021). However, traditional methods for cucumber disease detection primarily rely on manual experience and professional knowledge, resulting in not only low efficiency but also susceptibility to subjective influences (Zhang et al., 2019; Li et al., 2021).
In recent years, significant progress has been made in the field of agricultural image processing, particularly in the area of object detection, through the application of deep learning techniques (Attri et al., 2023). Convolutional Neural Networks (CNNs) have enabled the automatic recognition and localization of objects by progressively extracting image features (Ashtiani et al., 2021). However, in practical applications, traditional CNN models often encounter challenges in detecting small objects due to the complexity and diversity of disease-related images (Ouhami et al., 2021). Small objects occupy fewer pixels in the image (Hasan et al., 2020), resulting in relatively weak feature information, making them susceptible to being overwhelmed by background noise, consequently leading to reduced detection accuracy (Manavalan, 2020).
Based on the need for region proposals, the current cucumber disease image target detection methods can be divided into two categories: one is based on region proposal, such as Faster R-CNN (Ren et al., 2015), Mask R-CNN (He et al., 2017), Cascade R-CNN (Cai and Vasconcelos, 2018), etc. These algorithms utilize relevant information of candidate regions to classify and regress pre-defined target regions, in order to obtain the position and category information of the targets. The other category is based on single-stage detection cucumber disease image target detection algorithms. These methods directly output the position and category of the targets through the network, with the advantages of high speed and accuracy. Typical algorithms include the YOLO series (Jiang et al., 2022), including recent developments such as YOLOX (Ge et al., 2021), YOLOV5 (Jocher et al., 2022), YOLOV6 (Li et al., 2022), YOLOV7 (Wang et al., 2023), YOLOV8 (Terven and Cordova-Esparza, 2023), YOLOV9 (Wang C. Y. et al., 2024), and YOLOV10 (Wang A. et al., 2024), as well as SSD (Liu et al., 2016), Cornernet (Law and Deng, 2018), CenterNet (Duan et al., 2019), EfficientDet (Tan et al., 2020), and RetinaNet (Lin et al., 2017). However, these algorithms often exhibit suboptimal performance when dealing with small targets, leading to issues such as missed detections and inaccurate localization.
Deformable DETR (Zhu et al., 2020) integrates the powerful capabilities of Transformers and their ability to model global relationships, replacing the manually designed heuristics in target detection to achieve an end-to-end objective. However, it suffers from slow convergence and the quadratic complexity of Self-Attention in Transformers, resulting in the issue of limited feature map resolution, thereby leading to poor performance in detecting small targets. QueryDet (Yang et al., 2022) (a query mechanism rather than a framework) employs a new query mechanism to accelerate the inference speed of the feature pyramid object detector, reduce computational load, and improve accuracy. It enhances the detection accuracy of small objects, yet still presents certain limitations for very small objects. In order to balance the scarcity of annotated samples and the challenge of maintaining multi-scale hierarchical representations, Yang et al. (2023) proposed a novel pyramid-style image modeling framework that seamlessly adapts to cucumber disease image target detection, thereby enhancing performance. To address the detection of cucumber pathogen spores in complex scenarios, Li et al. (2023) introduced an MG-YOLO detection algorithm, which combines a Weighted Bi-directional Feature Pyramid Network (BiFPN) to integrate multi-scale features from different levels. Cao et al. (2023) proposed a multimodal language model based on image and text labels for cucumber disease identification in scenarios with limited samples. Liu et al. (2023) presented a cucumber disease identification method based on deep learning and mobile technology.
The aforementioned algorithms have all overlooked the feature representation of small targets in the feature extraction stage. The abundant detailed information in the shallow layers of the network has not been fully utilized, especially where the obscured information of small targets in the lower layers is considerably lost (Kim et al., 2023; Sharma et al., 2023). Due to the limited feature information of small targets in cucumber disease images (Ma et al., 2018), coupled with their irregular sizes and shapes, conventional target detection methods often struggle to achieve the expected detection performance, particularly in scenarios involving overlapping or blurred scenes, thereby significantly increasing the likelihood of poor detection results (Bhola et al., 2023). This study acknowledges that the suboptimal performance in small target detection may very likely stem from insufficient feature representation. Exploring the information bottleneck mechanism of the information flow between elements can help elucidate this phenomenon, whereby an imperfect bottleneck network may lead to the loss of task-relevant information, particularly in non-discriminative situations where information loss becomes more critical.
To address the aforementioned issues in cucumber disease image target detection, this study proposes a small target detection algorithm for cucumber disease images, named CucumberDet, which integrates global information perception and feature fusion. To enhance the global information perception capability of the algorithm’s backbone network, our model replaces the original Backbone of the RetinaNet network with Swin Transformer to capture global feature information. The existing neck networks typically rely on coarse accumulation of multiple convolutions, which limits their feature fusion capabilities and is unfavorable for integrating detailed information of small targets at the lower levels. Therefore, we designed the small object feature fusion module (SFFM) to obtain rich lower-level backbone small target features, making the model more suitable for dense small target prediction tasks. Additionally, small targets at the lower levels are easily treated as background negative samples at the higher levels, and the network lacks an upward fusion path. Thus, we propose the multi-layer feature adaptive fusion module (MFAFM) to allow low-level information to be adaptively transmitted to higher levels, achieving more efficient adaptive fusion of shallow detail features and high-level semantic information. This improves the detection accuracy and robustness of small targets in cucumber disease images. The main contributions of this paper are as follows:
1) A swin transformer backbone network based on global information perception is proposed to enhance the detection capability of small targets in cucumber disease images.
2) The design of the small object feature fusion module (SFFM) enhances the feature extraction and fusion capabilities for small targets.
3) The multi-layer feature adaptive fusion module (MFAFM) is proposed to improve the fusion efficiency and detection accuracy of features at different levels.
4) A self-constructed dataset containing various cucumber disease images is built, and the effectiveness of the proposed algorithm is validated on this dataset.
The images in the self-constructed cucumber disease dataset were captured in the greenhouse environment of Shouguang, Shandong Province, China. After cropping and filtering the raw images, a total of 4,740 sample images were obtained (Figure 1). This process resulted in the creation of an annotated cucumber disease image dataset for greenhouse environments (CDGE). The CDGE dataset includes images of five types of cucumber diseases, as well as healthy leaves. All disease types represented are common in cucumbers, and all samples were taken in complex background environments. Each image contains one or more diseased areas.
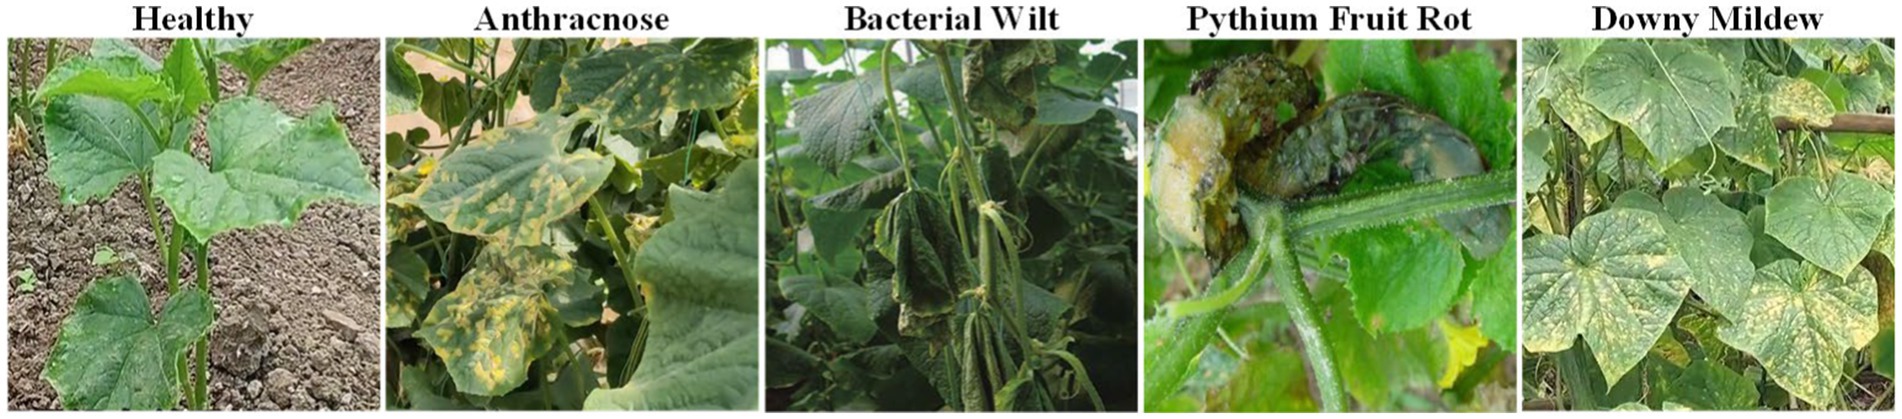
Figure 1. Samples of cucumber disease images in the self-constructed dataset.
The cucumber disease images are captured in natural greenhouse environments, characterized by strong background noise and complex lighting conditions, which can significantly affect the accuracy of disease detection algorithms. To mitigate environmental noise and lighting interference, and to emphasize the distinctive features of cucumber diseases, a sequential approach is employed for image preprocessing, involving median filtering, gamma correction, and adaptive histogram equalization (as illustrated in Figure 2). Firstly, median filtering is applied to the images for noise reduction, followed by gamma correction to mitigate the impact of lighting variations, and ultimately, adaptive histogram equalization is used to enhance image contrast and detail.
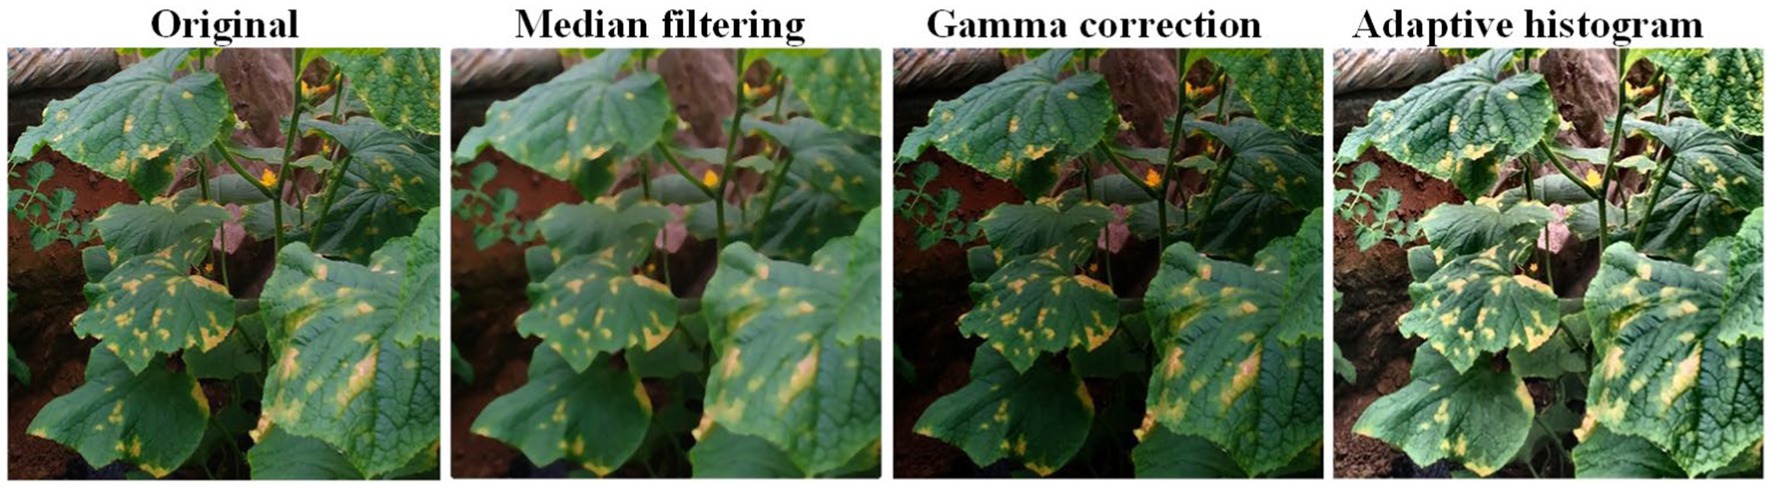
Figure 2. Preprocessing effects of cucumber disease images.
The median filter replaces the grayscale value at pixel (i, j) with the median of the grayscale values within an N × N window centered at that pixel. This process effectively eliminates background noise from the image.
Gamma correction normalizes the pixel values of the input image to the range [0, 1], followed by a non-linear transformation to adjust the overall pixel values. Subsequently, the pixel values are re-normalized to expand the range to [0, 255], resulting in the gamma-corrected image. The non-linear transformation is illustrated by Eq (1).
Where I represents the pixel value of the input image, and γ denotes the specified gamma value.
Gamma correction involves non-linear transformations to adjust pixel values, thereby enhancing the overall brightness of an image and reducing the impact of illumination disturbances.
Adaptive histogram equalization computes local histograms of an image and subsequently redistributes the brightness to improve local contrast and obtain additional image details.
The cucumber disease image data were formatted into the standard VOC dataset format using the object detection open-source annotation tool LabelImg. XML files were generated based on manually annotated anchor boxes, containing the category names and position information of cucumber diseases. The data annotation process is illustrated in Figure 3.

Figure 3. Labellmg annotation and VOC dataset format. (A) Labellmg annotation (B) VOC dataset format.
During the experiment, the image quantities in the training, validation, and testing sets were set at a ratio of 8:1:1, and the distribution of sample quantities for different disease types is presented in Table 1.
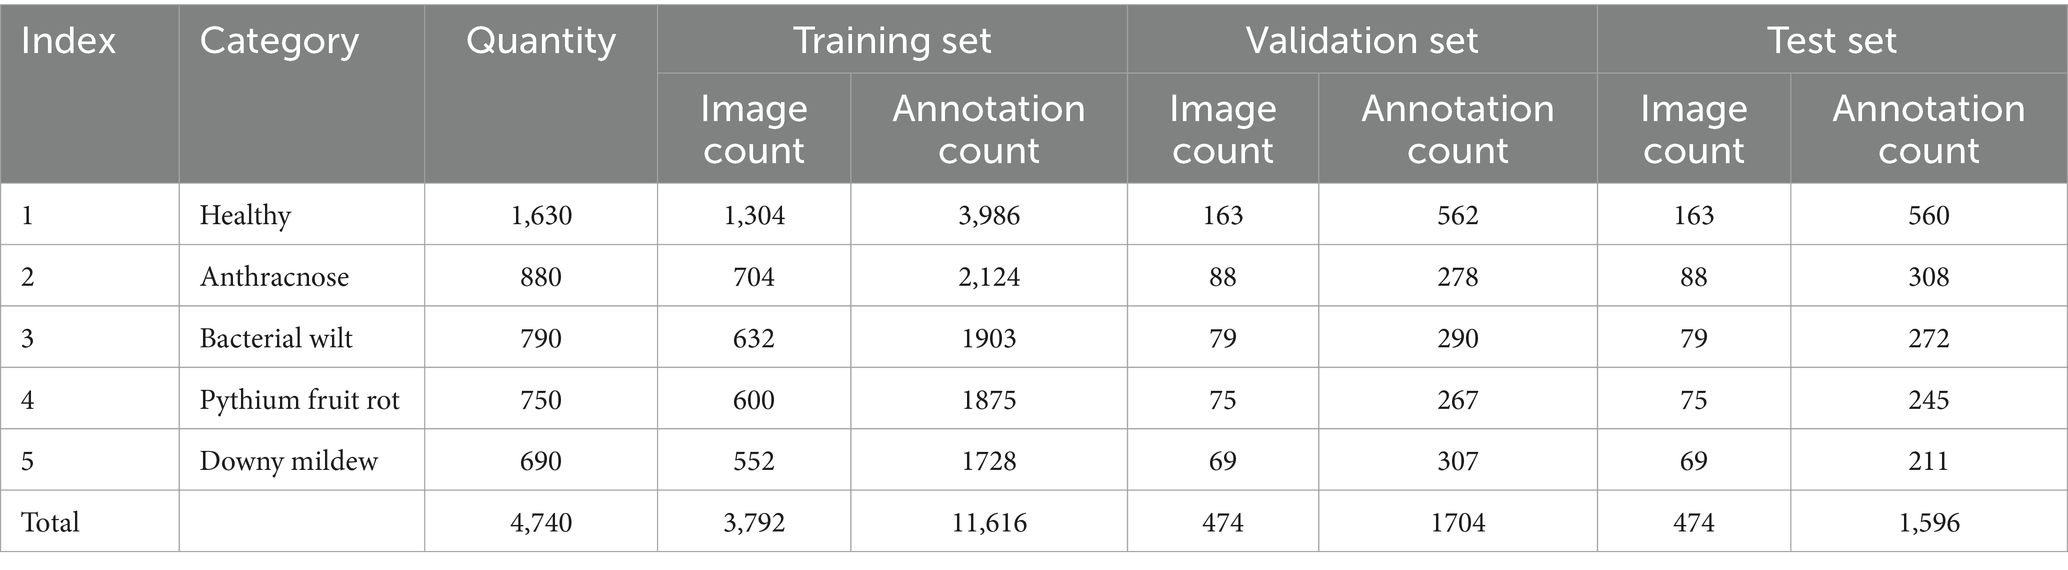
Table 1. Sample quantities of the self-constructed cucumber disease dataset.
To improve the detection performance of cucumber diseases, considering the limited size of the training dataset and potential issues like blurriness and lighting variations in real captures, special attention was given to data augmentation. The goal was to enhance data diversity while preserving disease characteristics and avoiding distortion. This study employed various augmentation techniques, including random rotation, vertical flipping, horizontal mirroring, and random brightness adjustments, effectively expanding the dataset to five times its original size. The purpose of this effort is to enhance the model’s resilience in disease detection amidst complex backgrounds and provide it with a more varied and realistic training dataset. The impact of data augmentation is depicted in Figure 4.

Figure 4. The effects of data augmentation of training dataset.
The schematic diagram delineating the detection process of cucumber diseases in natural settings, as depicted in Figure 5, encompasses three primary components: data preparation, the construction of the cucumber disease detection model CucumberDet, and cucumber disease detection.
(1) Following the acquisition of greenhouse cucumber disease images, an initial screening process was undertaken to eliminate images of relatively low quality, culminating in the formation of an initial set of disease images. Subsequently, data preprocessing and annotation were executed, and the dataset was partitioned. Given the considerable data requirements for training convolutional neural networks and the imperative to augment disease detection accuracy while circumventing overfitting, the disease training set was expanded through data augmentation techniques.
(2) With the dataset established, a baseline model was selected. In response to the exigencies of cucumber disease detection, modules for refining the model were proposed, leading to the development of the CucumberDet model. Thereafter, the model underwent training and validation.
(3) Upon the completion of model training, testing was conducted using a separate dataset. The model was tasked with discerning disease categories and furnishing location information for input disease images.
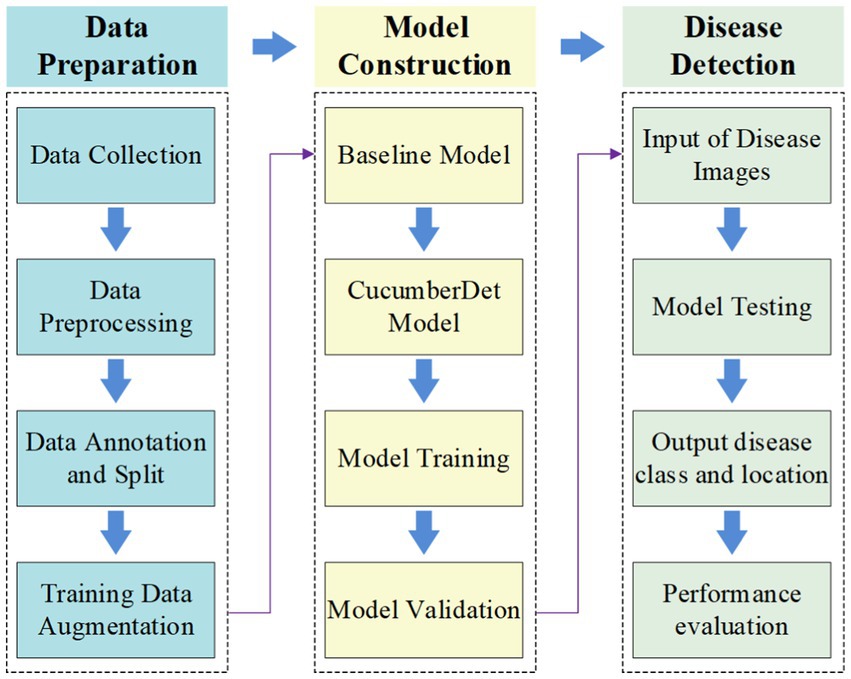
Figure 5. The framework of cucumber disease detection.
The RetinaNet employs the ResNet (He et al., 2016) as its backbone network for feature extraction, utilizes the Feature Pyramid Networks (FPN) (Lin et al., 2017) for multi-scale feature extraction, and subsequently employs two Fully Convolutional Networks (FCN) (Long et al., 2015) sub-networks to handle category classification and position regression, respectively.
RetinaNet integrates the backbone network, the Feature Pyramid Network (FPN), and task-specific subnet into a detection network, with Focal Loss applied to the subnet to enhance the detection capability. The structure of RetinaNet can be divided into three parts, as shown in Figure 6. In its first part, the input image is processed by a CNN to obtain corresponding feature maps; in the second part, the feature maps are input into the FPN to extract and reorganize features of different scales; finally, the feature maps of three different scales output by the FPN are fed into the class subnet and box subnet to obtain the categories and positions of the targets.
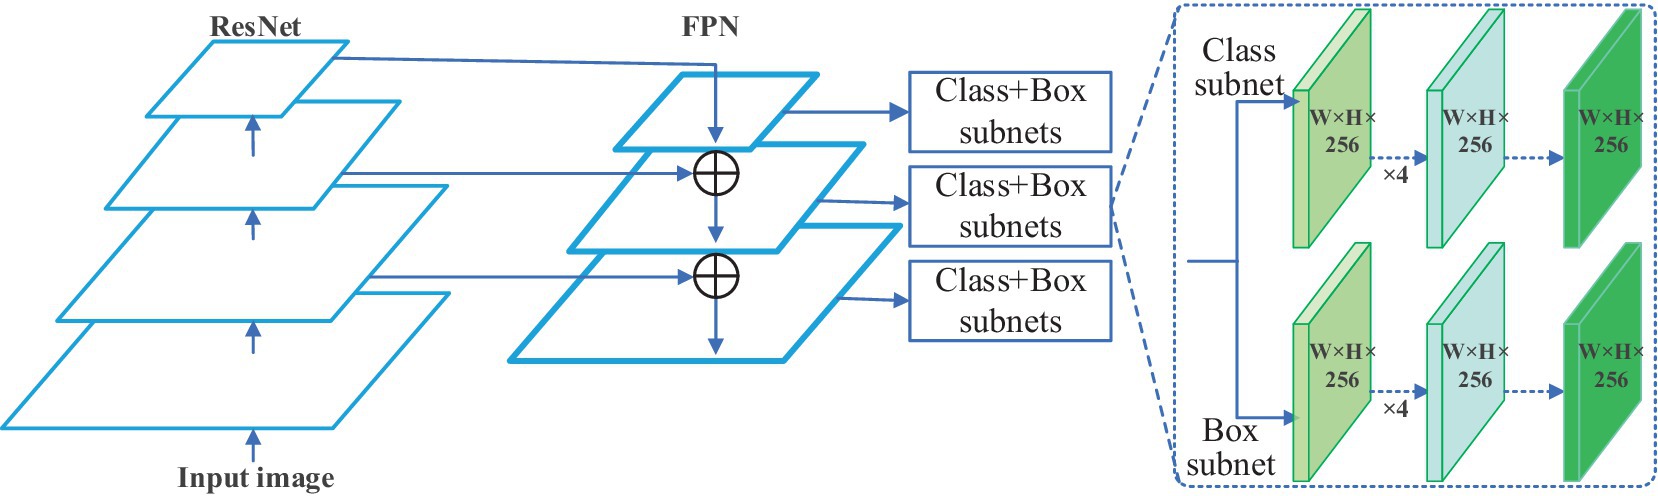
Figure 6. The architecture of RetinaNet.
The proposed cucumber disease detection architecture, named CucumberDet in this study, as depicted in Figure 7, draws inspiration from RetinaNet. To enhance the global information extraction capability of the algorithm’s primary network, the Swin Transformer replaces the original Backbone. Additionally, the Small Target Feature Fusion Module (SFFM) is devised to fully exploit the abundant small object features within the shallow feature extraction module and mitigate the loss of detailed information in the feature maps. Concurrently, the P7 prediction feature layer is eliminated to reduce the model’s parameter count. Finally, the Multi-level Feature Aggregation and Fusion Module (MFAFM) is introduced, fortifying the interaction of features across different levels based on the feature pyramid. This enhancement augments the network’s ability to detect objects at various scales by effectively integrating feature information from diverse levels, thereby enhancing object detection precision and recall.
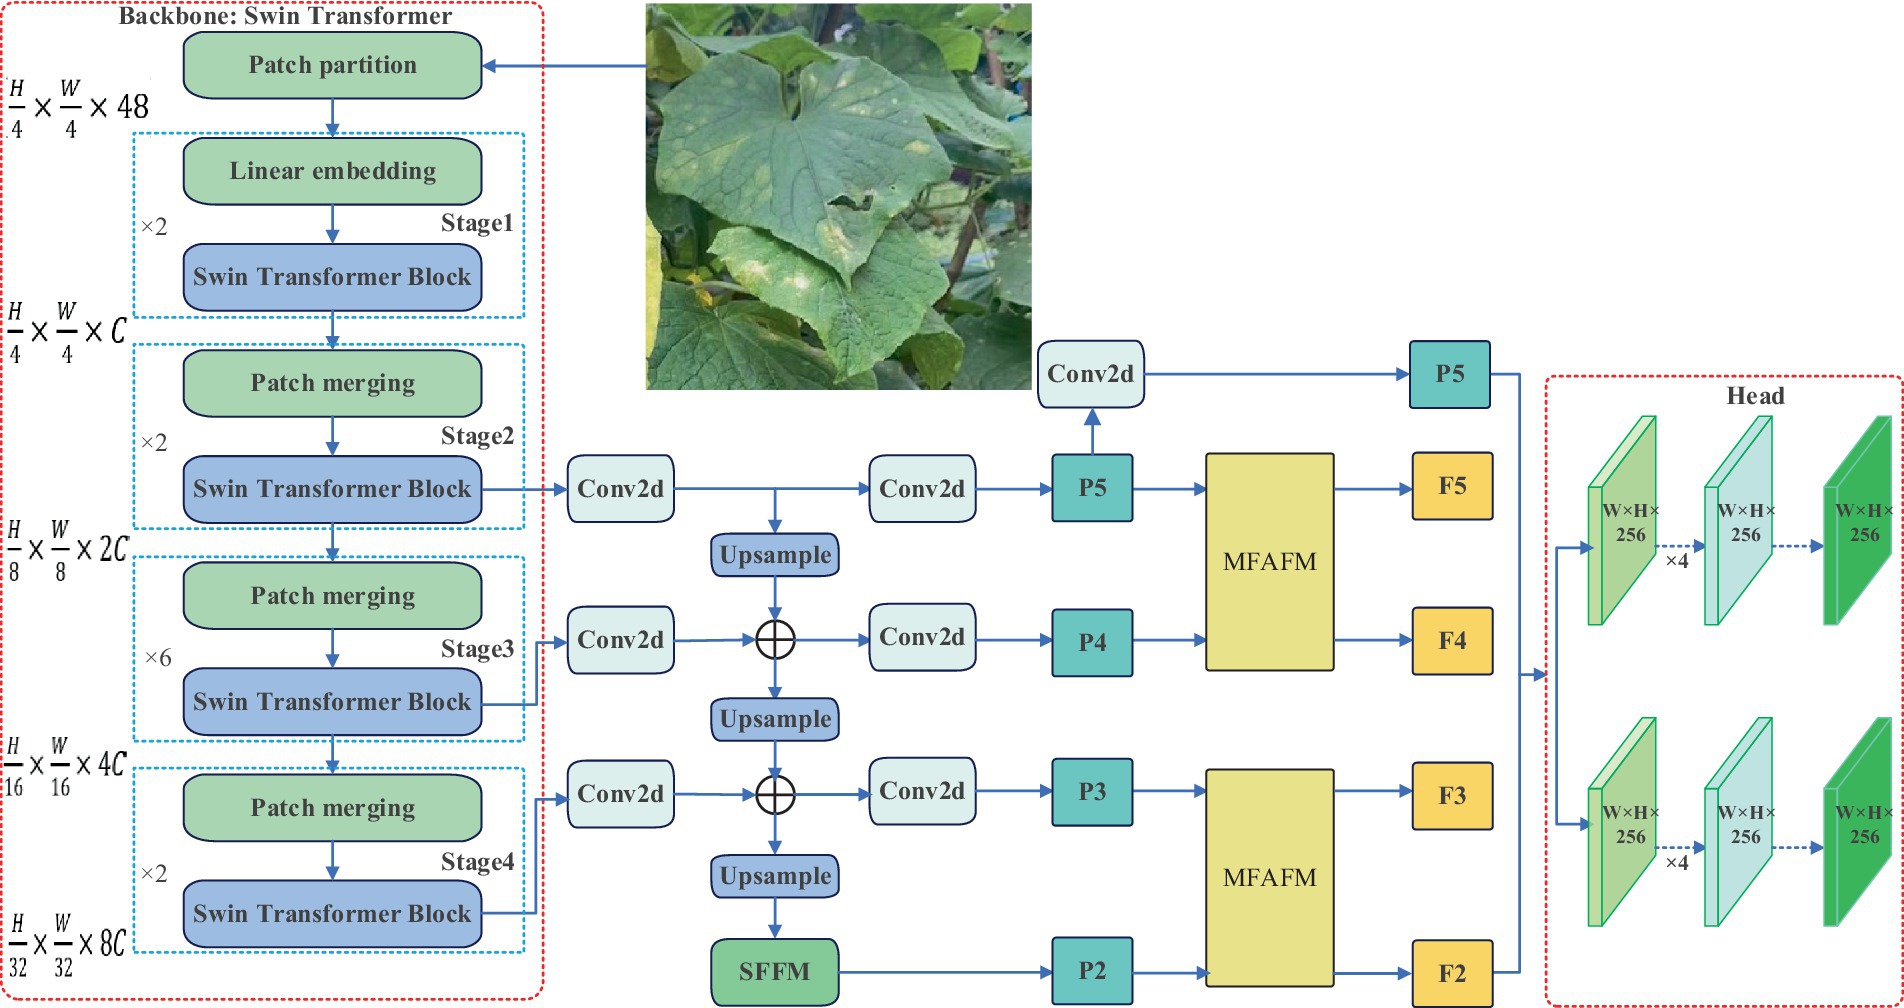
Figure 7. The architecture of CucumberDet.
Due to the success of the Transformer model in sequence modeling and transduction tasks, researchers have begun applying it to the field of computer vision. However, the Transformer model’s performance in adapting to the significant scale differences present in various images and targets for object detection is not ideal. Addressing this issue, Liu et al. (2021) proposed the Swin Transformer. In comparison to common models such as convolutional neural networks, the Swin Transformer network possesses the capability to model global information and its unique sliding window mechanism facilitates inter-window feature interaction, effectively expanding the receptive field and enhancing the efficiency of target extraction. The fundamental framework of Swin Transformer and the two successive Swin Transformer Blocks are illustrated in Figure 8.
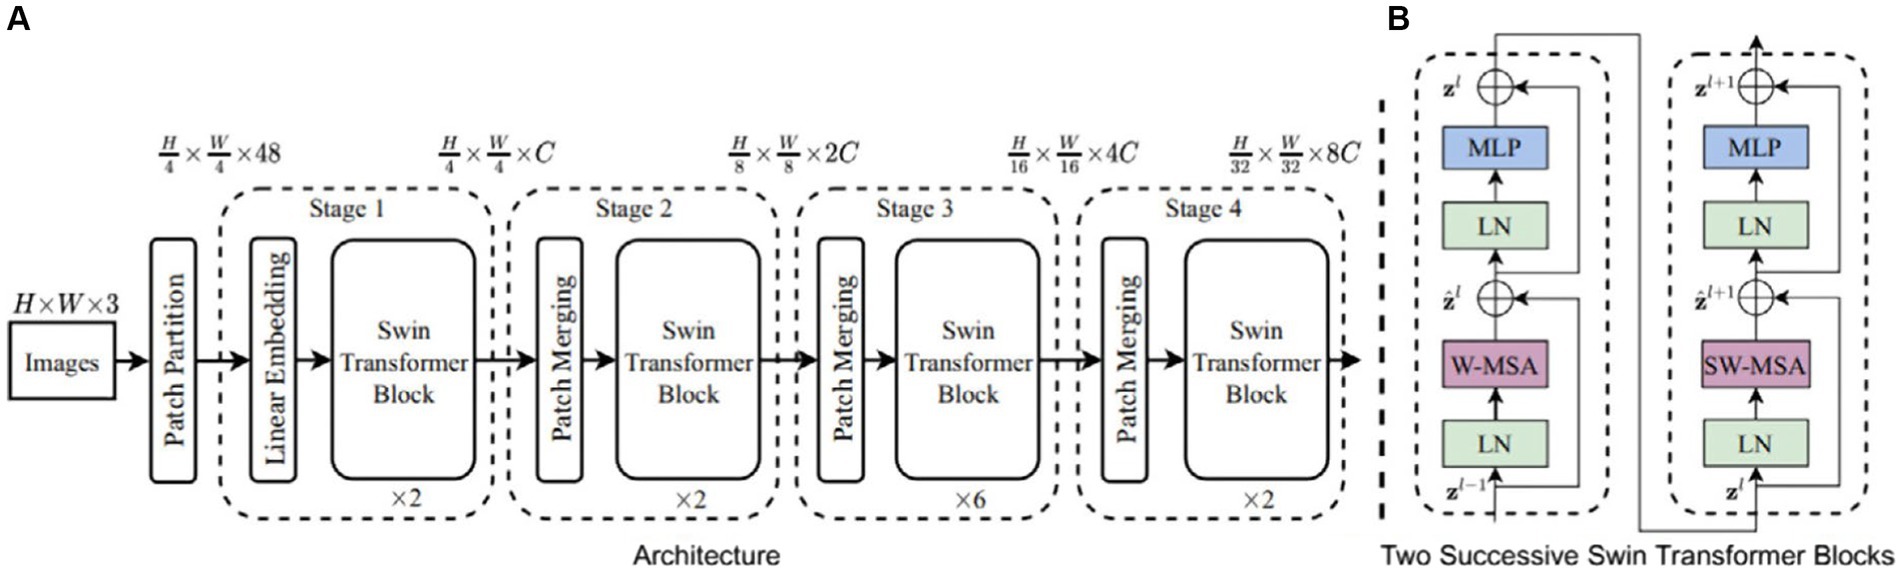
Figure 8. The architecture of swin transformer and swin transformer blocks (Liu et al., 2021).
According to Figure 8, the Swin Transformer Block mainly consists of Layer Normalization (LN), Window-based Multi-head Self-Attention (WMSA), Shifted Window-based Multi-head Self-Attention (SWMSA), and Multi-Layer Perceptron (MLP), which are combined through residual operations. The LN module normalizes different channels of the same sample to ensure the stability of data feature distribution. The traditional Transformer’s multi-head attention mechanism involves large global computations. Therefore, the WMSA module proposed by Swin Transformer independently computes self-attention within each window, effectively reducing computational complexity. The SWMSA module utilizes self-attention interaction information between sliding windows to expand the feature receptive field and improve detection performance. The specific outputs of each part of the Swin Transformer Block are illustrated by Eqs. (2–5).
In the formulas, and represent the output of the WMSA and MLP modules, respectively, while and denote the output of the () SWMSA and MLP modules, respectively.
Due to the complex variations in perspective, scale, lighting conditions, and disease characteristics, cucumber disease detection presents greater challenges compared to general object detection. While the Feature Pyramid Network (FPN) is highly effective, using convolutional neural networks (CNNs) like ResNet for constructing feature extraction networks still poses certain challenges. The localized nature of convolutions, for example, makes it challenging to capture global semantic information from images, which is particularly crucial for small-sized and information-scarce targets. To address these challenges, it is essential to incorporate global semantic information within the network, emphasizing contextual information relevant to the targets. Therefore, this study employs the Swin Transformer as the feature extraction network, effectively leveraging the strengths of both CNNs and Transformers. This approach enhances the model’s global contextual awareness, enabling better adaptation to targets and images of various sizes, and introducing necessary global semantic information relevant to the images for CNNs.
Detecting cucumber diseases in image targets presents certain challenges due to the small size of the objects within the images, contrasted against a relatively larger background. Moreover, the original RetinaNet model’s high downsampling factor makes it difficult to capture feature information of small objects in cucumber disease images on deeper feature maps. To tackle this issue, the Small Target Feature Fusion Module (SFFM) has been developed to extract rich feature information of small objects within the lower-level backbone network, thus making the model more suitable for small object detection tasks. The specific architectural details of the SFFM are depicted in Figure 9.
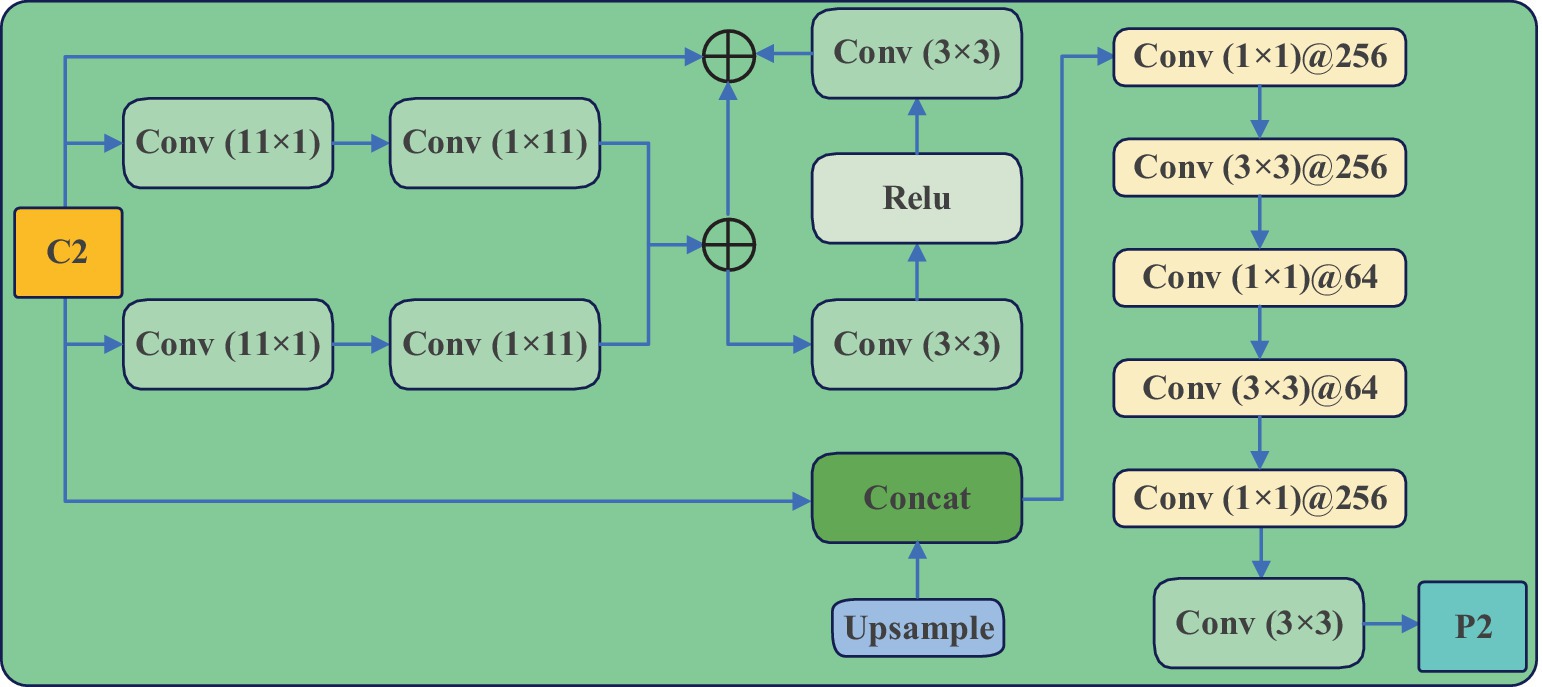
Figure 9. The structure of SFFM.
The SFFM effectively mitigates feature loss in small targets and enhances the model’s localization capability. Initially, it significantly enlarges the effective receptive field by employing the largest possible convolutional kernel. However, unlike most classification networks, this study avoids directly using large kernels for convolution to prevent imposing a substantial computational burden. Additionally, adjusting channels through 1 × 1 convolutions in the same manner as the upper-level feature maps in the network’s neck would incur significant computational costs, given the relatively larger size of the lower-level feature maps. Therefore, this study adopts symmetric large kernel convolutions, which require minimal computational overhead to adequately capture detailed information of small targets at the lower levels. The formulas for SFFM are illustrated by Eqs. (6, 7).
In the formula, and represent standard 1 × 1 and 3 × 3 convolutions, while and denote 1 × 11 and 11 × 1 large kernel convolutions, respectively. The symbol R (·) denotes the ReLU activation function, represents the feature map in the second layer of the feature extraction network, Cat (·) signifies channel concatenation operation, and denotes the feature map obtained by upsampling the FPN module to a scale of 80 × 80, followed by another upsampling operation.
Specifically, the FPN structure within the RetinaNet model does not fully exploit the shallow feature maps from the feature extraction module (Backbone module), which contain more detailed information about smaller targets. Consequently, after the FPN module performs upsampling to obtain 80 × 80 scale feature maps, another upsampling operation is conducted. This generates 160 × 160 feature maps, which are then concatenated with the shallow 160 × 160 scale feature maps from the Backbone module that have undergone processing through the Small Target Feature Fusion Module (SFFM). This concatenation is achieved through a channel-wise operation, and the resulting feature maps are input into the prediction module to obtain a prediction layer specifically tailored for smaller targets. In order to reduce model complexity and parameter count, this study omits the deeper 5 × 5 scale prediction feature layer, maintaining consistency with the original RetinaNet model in terms of the number of prediction feature layers.
In the feature pyramid, the high-level semantic information representing large targets is transmitted to the lower levels through a top-down pathway, thereby preventing the misclassification of large targets as background negatives in the lower levels. However, due to the lack of an upward fusion pathway in the network, medium and small targets in the lower levels are still prone to being perceived as background negatives in the higher levels. This could be detrimental to the detection of multi-scale targets in images of cucumber diseases. Consequently, this study introduces the Multi-scale Feature Adaptation and Fusion Module (MFAFM), which, through adaptive fusion between adjacent layers, facilitates the transmission of information about small targets from the lower levels to the higher levels, thereby preventing the misclassification of small targets as background in the higher-level features, thus avoiding missed detections. It is noteworthy that this module not only enhances detection performance but also maintains the network’s efficiency and trainability.
The FPN outputs prediction feature layers P2, P3, P4, P5, and P6. It has been observed that when performing adaptive fusion between the given set of {P2, P3, P4, P5, P6} feature layers, significant feature redundancy occurs. Therefore, in the process of adaptive fusion, the P6 feature layer is discarded, and only the remaining four feature layers are used for the adaptive fusion. Consequently, the Multi-scale Feature Adaptation and Fusion Module (MFAFM) consists of two parts: high-level adaptive fusion and low-level adaptive fusion. In other words, given the feature maps {P2, P3, P4, P5}, the resulting feature maps after adaptive fusion are {F2, F3, F4, F5}.
The research findings indicate that direct addition is not a viable cross-scale fusion method in the adaptive fusion process, as there are semantic information gaps among feature maps of different scales. In comparison to simple addition, channel concatenation preserves a greater amount of feature information, albeit at the cost of increased model parameters and computational load. To address this, periodic employment of 1 × 1 convolutions for dimensionality reduction is introduced to alleviate convolutional bottlenecks. Furthermore, the incorporation of stacked convolutional layers has been implemented to eliminate aliasing effects caused by interpolation, thereby reducing information loss within channels and enhancing feature representation capabilities. The specific adaptive fusion process is illustrated in Figure 10.
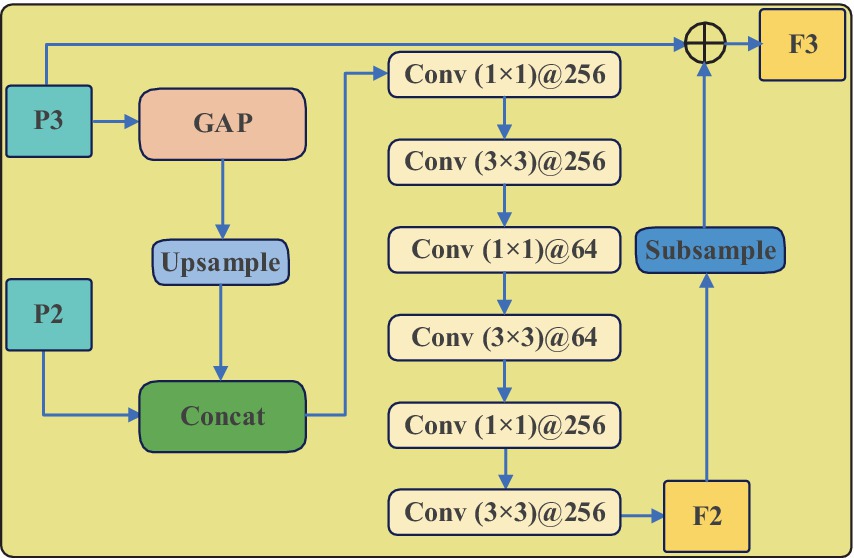
Figure 10. The structure of MFAFM.
As an example of bottom-up adaptive integration, the formula are illustrated by Eqs. (8–10).
In the given expression: Z denotes the stacked convolutional layers, and represent standard 1 × 1 and 3 × 3 convolutions, and X denotes the feature map after channel concatenation. Gap (·) signifies the global average pooling operation applied to the feature map, Upsample (·) denotes the nearest-neighbor interpolation upsampling operation, Concat (·) represents the channel concatenation operation, P2 and P3, respectively, denote the two bottom-level feature maps output by the Feature Pyramid Network (FPN), and Subsample (·) indicates a 2x downsampling operation applied to the feature map.
The global average pooling operation yields feature maps with rich semantic information, while the adaptive fusion of low-level and high-level features enhances the detailed information in the high-level features, preventing the misclassification of small to medium-sized objects in the high-level features as background, thus avoiding missed detections. Ultimately, these 5 layers of features contain abundant global semantic information and fine-grained details of small objects, contributing to the improved detection of objects at different scales in cucumber disease images.
The imbalance of samples within classes (Oksuz et al., 2020) is a common issue in object detection. The unequal distribution of images across different classes in the dataset leads to a long-tailed distribution of samples, causing the network model to overfit to the head classes during training. To address this imbalance in sample distribution, commonly used methods include resampling and reweighting (Cui et al., 2019). Therefore, this study adopts a reweighting approach to improve the Focal Loss, where the Focal Loss is specifically expressed as:
In the equation, t represents the target category; stands for the model’s estimated probability for the target, and and γ are modulation factors.
Inspired by the modulation factor , this study incorporates a class-balancing weight factor based on the Focal Loss. This factor re-balances the number of samples for each category, generating a class-balanced loss to alleviate the impact of sample class imbalance on detection performance. The formulas are illustrated by Eqs. (12, 13).
In the equation, z represents the number of iterations during network training; denotes the class labels, where E signifies the total number of classes in the dataset, with a value of 2 in this study; stands for the number of training samples for a specific class label; N represents the total number of samples in the dataset; signifies the estimated probability for the class label; and γ denotes the modulation factor, with a value of 2. As approaches N, u approaches 1, indicating a larger number of samples for this class, signifying easily classifiable samples, and the network model is likely to assign a smaller weight to the loss. Conversely, as approaches 0, indicating a smaller number of samples for this class and an estimated probability close to 0, tends towards infinity. For such small-sample classes, the network model assigns a larger weight, thereby mitigating the impact of class imbalance on the performance of the detection network.
The deep learning algorithm of our experiment was trained on the Ubuntu 16.04 operating system. The GPU utilized was the NVIDIA GeForce RTX 3090, while the software environment employed CUDA 11.1 and cuDNN 8.0. The processor employed was the Intel Core i9-10900X. The model was implemented based on the PyTorch deep learning framework, as shown in Table 2.
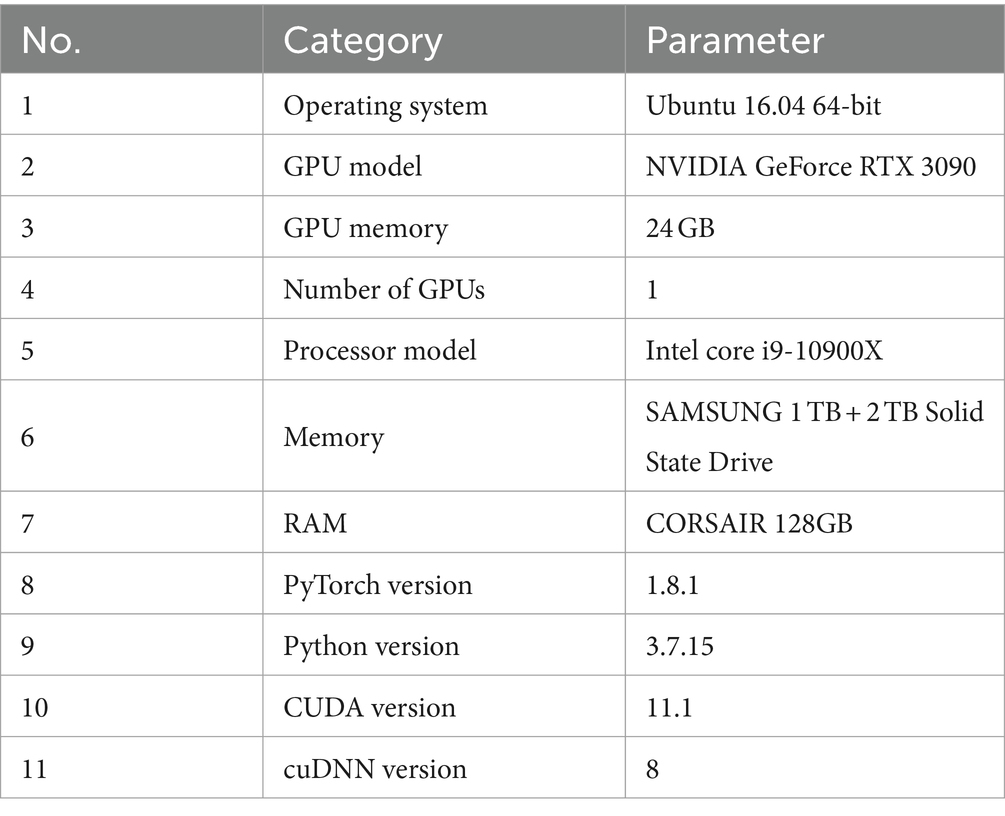
Table 2. Software and hardware environment for deep learning experiment.
In order to enhance the robustness of the target detection model for cucumber disease images, a transfer learning approach was employed for CucumberDet. Initially, the RetinaNet with pre-trained COCO weights was loaded and subjected to preliminary training on the Plantvillage dataset. Subsequently, the weights trained on the Plantvillage dataset were utilized for adaptive training on the custom cucumber disease dataset. By employing transfer learning, the volume of training data was increased, which is conducive to improving the detector’s performance.
Considering the characteristics of the custom cucumber disease image dataset, the model parameters were adjusted to achieve the optimal detection performance. During the training process, in order to reduce the parameters in the CucumberDet model, the input image size was adjusted to 224 × 224. Batch normalization (BN) was applied to initialize the data in batches, thereby enhancing the convergence speed of the model. Stochastic gradient descent (SGD) was employed to optimize the network parameters during training. To prevent model overfitting, multiple experiments were conducted to determine the values of key hyperparameters, including the initial learning rate, momentum, and weight decay coefficient. The following hyperparameter settings were adopted: the learning rate was set to 0.005, the momentum was set to 0.9, and the weight decay coefficient was set to 0.0005.
This study evaluates the performance of the object detection algorithm using the Average Precision (AP), mean Average Precision (mAP), F1-score and Frame Per Second (FPS) metrics.
(1) The AP metric is used to evaluate the detection accuracy of individual classes, and its calculation formula is shown in Eqs. (14–16):
Where R (Recall) represents the recall rate, indicating the proportion of successfully detected samples among the positive samples; P (Precision) represents the detection accuracy, indicating the proportion of predicted positive samples among the actual positive samples; TP represents the number of true positive samples detected as positive, and FN represents the number of false negative samples detected as negative. IOU denotes the degree of overlap between the ground truth bounding box and the predicted bounding box. In our experiments, we employ AP@0.5 to denote the average precision (AP) value at an IOU of 0.5, which characterizes the model’s detection accuracy.
(2) The mAP metric is used to comprehensively evaluate the detection accuracy of the algorithm, and its calculation formula is shown in Eq. (17):
The mAP metric is the sum of the AP metrics for each class, averaged. In the formula, C represents the total number of classes in the dataset, and c represents a specific class.
(3) F1-score is the harmonic mean of precision and recall, with values ranging from 0 to 1. A higher value indicates a better model performance. The formula is illustrated by Eq. (18).
(4) The FPS metric represents the number of frames transmitted per second and is used to evaluate the detection speed of the algorithm.
To ascertain the superiority of the proposed CucumberDet network model, a comparison was made between this study’s CucumberDet model and the RetinaNet baseline model. The comparative results of the loss and mAP curves are illustrated in Figures 11, 12, respectively.

Figure 11. Comparison of loss curve.
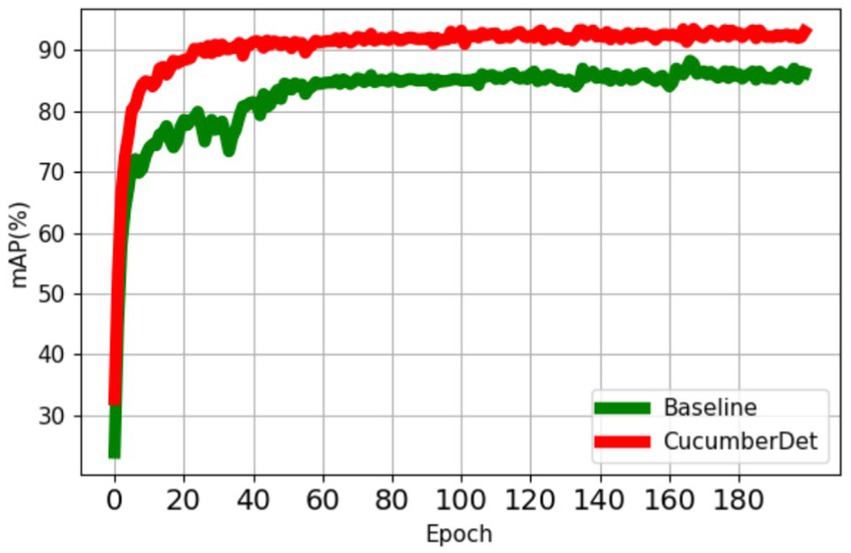
Figure 12. Comparison of mAP.
From Figure 10, it can be observed that the baseline model’s initial loss is around 0.063225, which then significantly decreases, gradually smoothing out and eventually stabilizing at around 0.005432. On the other hand, the proposed CucumberDet network model exhibits an initial loss of 0.051468, stabilizing at around 0.0019597. The initial loss value decreases, and the convergence speed noticeably accelerates, with no significant fluctuations in the curve.
From Figure 12, it is evident that the proposed CucumberDet achieves a higher mAP compared to the baseline model, ultimately converging at approximately 92.5%, marking an improvement of around 6.8% over the baseline model’s mAP. To better align with real-world scenarios and to more effectively demonstrate the detection performance of the proposed CucumberDet model, a comparative evaluation of the CucumberDet model and the baseline model’s performance was conducted on the self-built dataset, as depicted in Figure 13.
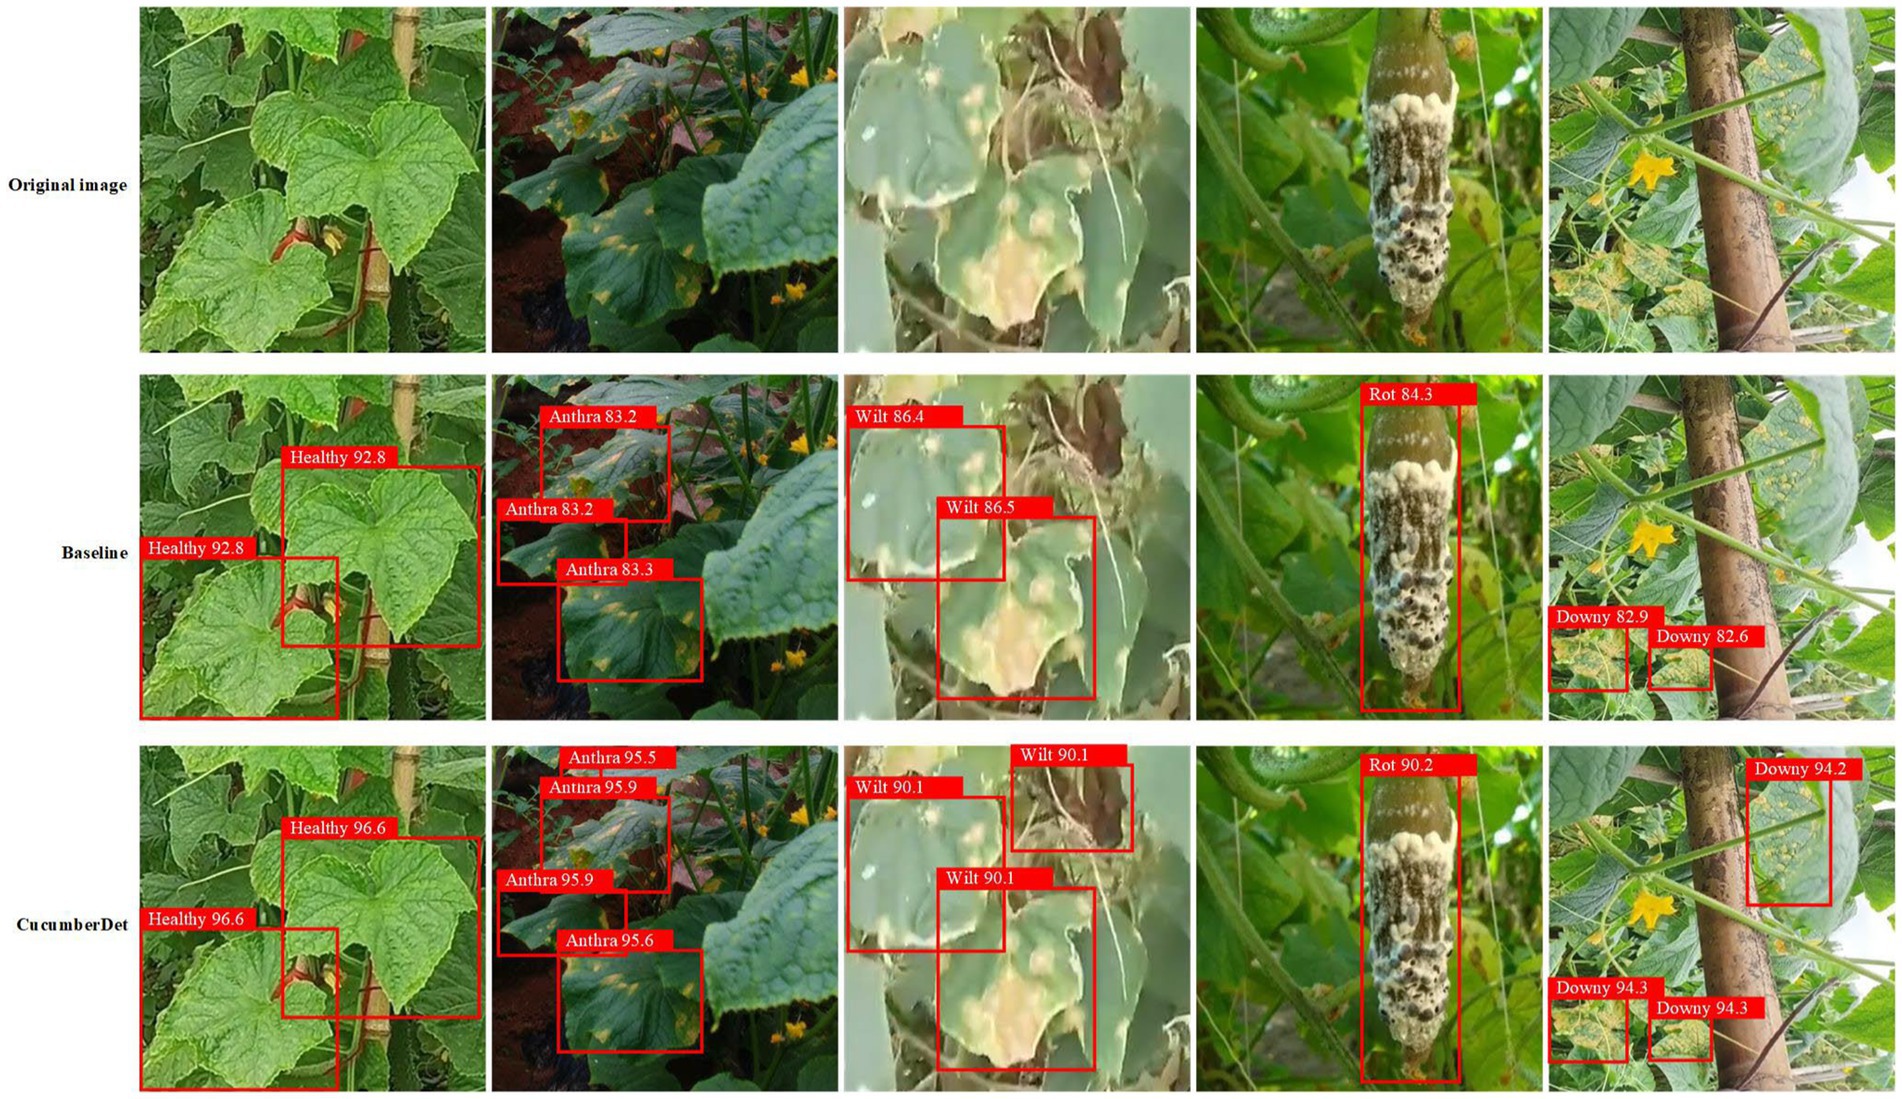
Figure 13. The detection results of the proposed CucumberDet model compared to those of the baseline model.
The comparative analysis depicted in Figure 13 reveals that the baseline model exhibits instances of missed detections, struggling to capture intricate details such as edges and textures within complex backgrounds. In contrast, the proposed CucumberDet model accurately identifies each cucumber disease target, demonstrating superior detection performance across various disease categories when compared to the baseline model. This underscores the enhanced detection capabilities of the CucumberDet model in capturing global features and obscured targets, thereby focusing on challenging aspects such as edge and occluded targets, resulting in higher detection accuracy relative to the baseline model. Particularly noteworthy is the significant advantage exhibited by the CucumberDet model, especially in the categories of Anthracnose and Downy Mildew, validating the effectiveness of the multiple improvement strategies implemented for small target detection within cucumber diseases. This holds substantial significance in practical applications for early disease diagnosis and treatment. Consequently, the CucumberDet model demonstrates robustness in complex real-world environments.
To provide a more intuitive understanding of the CucumberDet model’s capability in detecting small targets within cucumber disease images, Figure 14 showcases the detection results across three different scenarios.
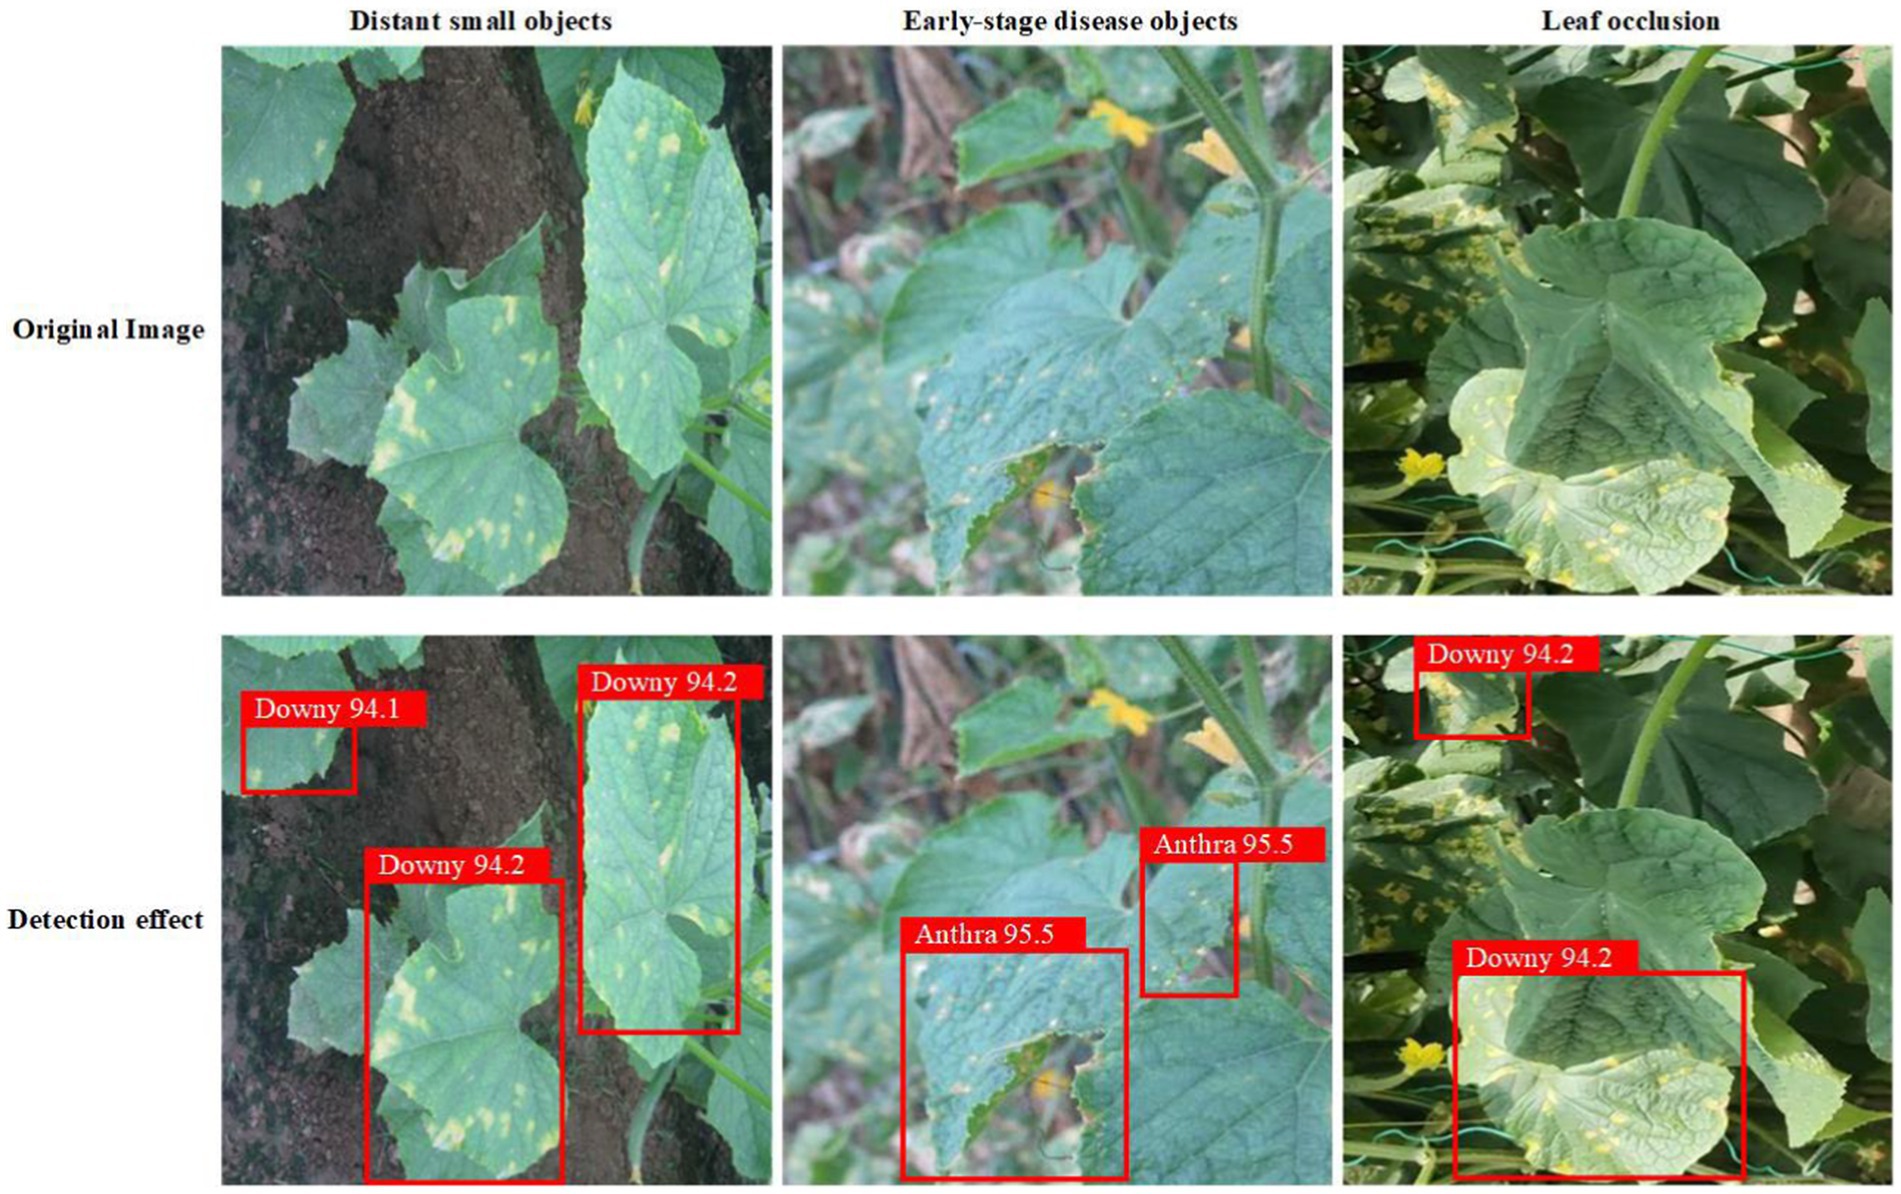
Figure 14. Detection results of cucumber disease images in three different scenarios.
Based on the first row of Figure 14, it is evident that the three scenarios exhibit characteristics such as small areas of disease, blurry spots, and unclear textures. As depicted in the second row of Figure 12, typical challenging detection tasks involving distant small objects in Group 1, early-stage disease objects in Group 2, and targets with leaf occlusion in Group 3 are all discernible. The proposed CucumberDet model demonstrates the absence of missed detections and false alarms when addressing small-scale targets, early symptoms of disease, and complex backgrounds within cucumber disease images. This validates the model’s capacity to learn diverse disease features, including extensive global features such as distance and angle, thereby exhibiting robustness in handling small targets, occlusions, and complex backgrounds. Therefore, both subjective visual inspection and objective experimental data affirm the strong detection capabilities of the proposed CucumberDet model for small targets within cucumber disease images, rendering it suitable for cucumber disease target detection tasks.
The performance of the proposed CucumberDet model compared to the baseline model is illustrated by the P-R curve in Figure 15. In the P-R curve, the horizontal axis represents recall, while the vertical axis represents precision. The closer the curve is to the upper right corner, the better the detection results. The larger area under the P-R curve for the proposed CucumberDet model indicates superior performance compared to the baseline model.
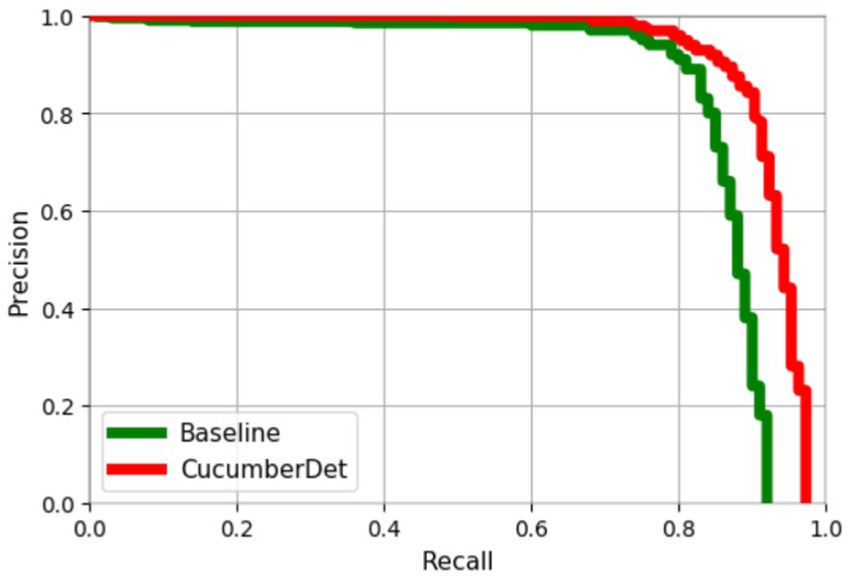
Figure 15. Comparison of precision-recall (P-R) curves.
The proposed model utilizes Swin-Transformer with Tiny, Small, Base, and Large structures, and the selection of models needs to consider the balance between network complexity and accuracy. Employing RetinaNet as the model framework, a series of backbone network ablation experiments were conducted with multiple versions of Swin-Transformer. The experimental results are presented in Table 3. Notably, the Swin_Large model with an input size of 384 × 384 encountered memory overflow during training and testing, based on the experimental hardware and software setup.
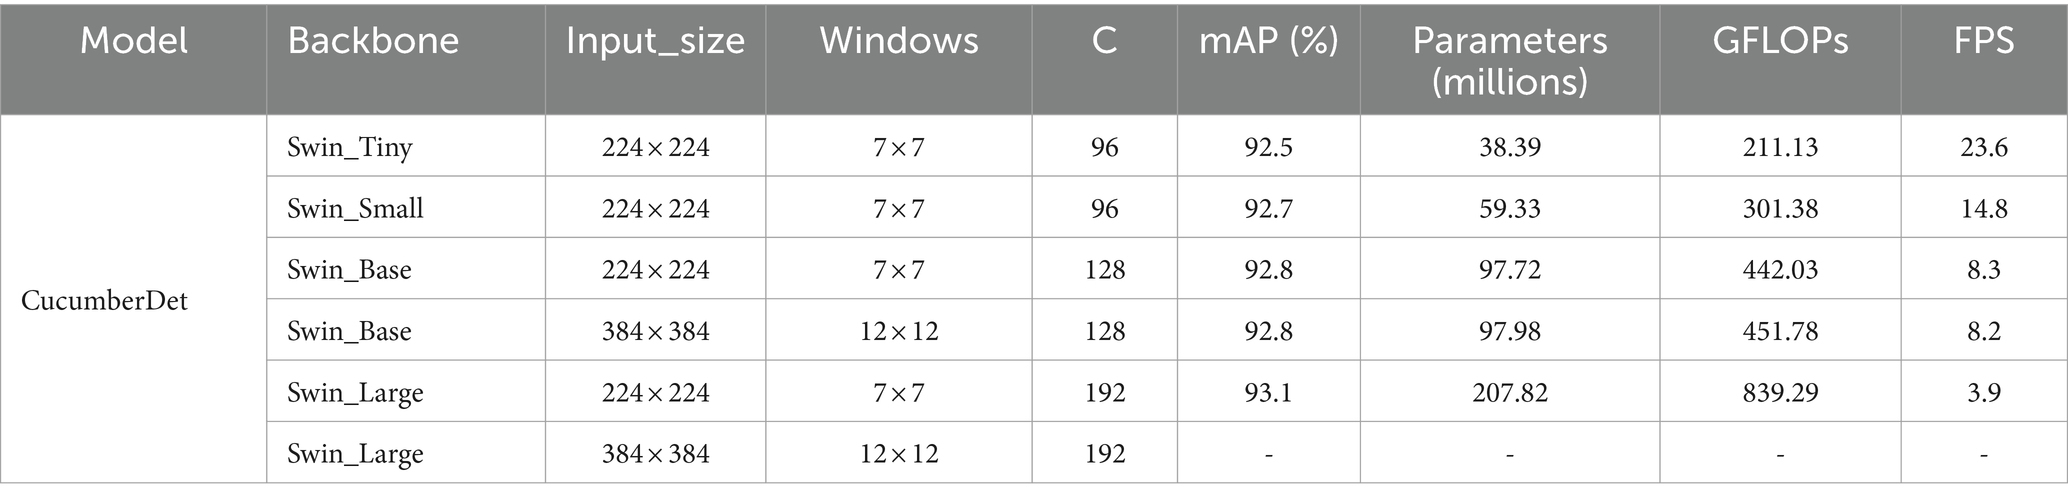
Table 3. Results of backbone network ablation experiment.
From Table 3, it can be observed that with the increase in backbone network parameters, the mAP, parameters, and GFLOPs of the overall model gradually increase, while FPS decreases gradually. However, the improvement in AP is far less than the impact of FPS reduction. Considering the discrepancy between detection accuracy and speed after model deployment, Swin-Tiny was chosen as the backbone network for the proposed model.
In order to validate the effectiveness of the proposed CucumberDet, ablation experiments were conducted on each proposed improvement module, as shown in Table 4. All experiments were tested on a self-constructed dataset. In the backbone network of RetinaNet, Swin Transformer was adopted to replace ResNet50, resulting in Model A; SFFM was added on the basis of Model A to obtain Model B, and the deepest prediction feature layer was removed to reduce model parameters; finally, MFAFM was incorporated on the basis of Model B to obtain the ultimate Model C.
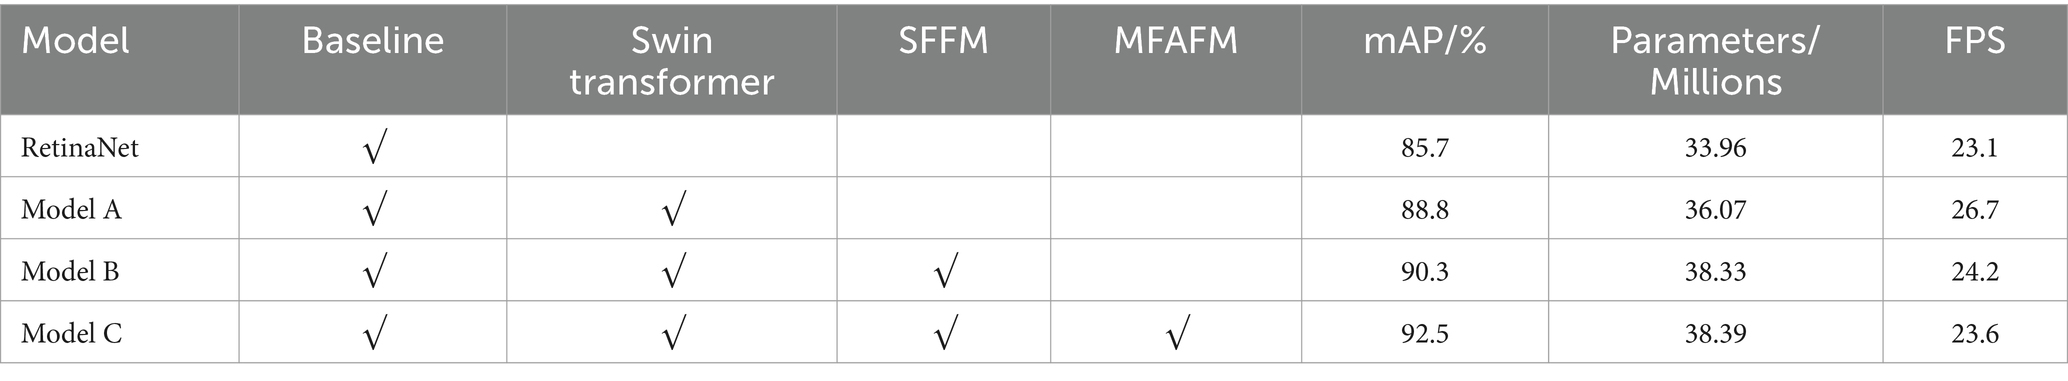
Table 4. Ablation experiment results.
From Table 4, it is evident that upon replacing ResNet50 with Swin Transformer as the backbone network, Model A enhanced the feature extraction capability of the model’s backbone network. Through the Swin Transformer module, it acquired global semantic information, thereby addressing the issue of the baseline model’s lack of global semantic information acquisition and inadequate interaction capabilities, resulting in a 3.1% increase in mAP compared to the baseline model. With the addition of SFFM, Model B achieved a 4.6% increase in mAP compared to the baseline model, demonstrating the strong detection capability of SFFM for small targets in cucumber disease images. Furthermore, the introduction of MFAFM led to a 2.2% increase in mAP for Model C compared to Model B, validating the reliability of MFAFM. In conclusion, in the final model of this study, the parameter increase is minimal, the detection speed meets real-time requirements, and the mAP is 6.8% higher than that of the baseline model RetinaNet, achieving the best detection performance, further confirming the effectiveness of the proposed model in this study.
The proposed CucumberDet is a single-stage detection network. In order to validate its superiority, it was compared with advanced object detection networks, including two-stage detection networks such as Faster R-CNN, Mask R-CNN, Cascade R-CNN, as well as single-stage detection networks such as YOLOX, YOLOV6, YOLOV7, YOLOV8, SSD, Cornernet, CenterNet, EfficientDet, and RetinaNet. The comparison results are shown in Table 5.
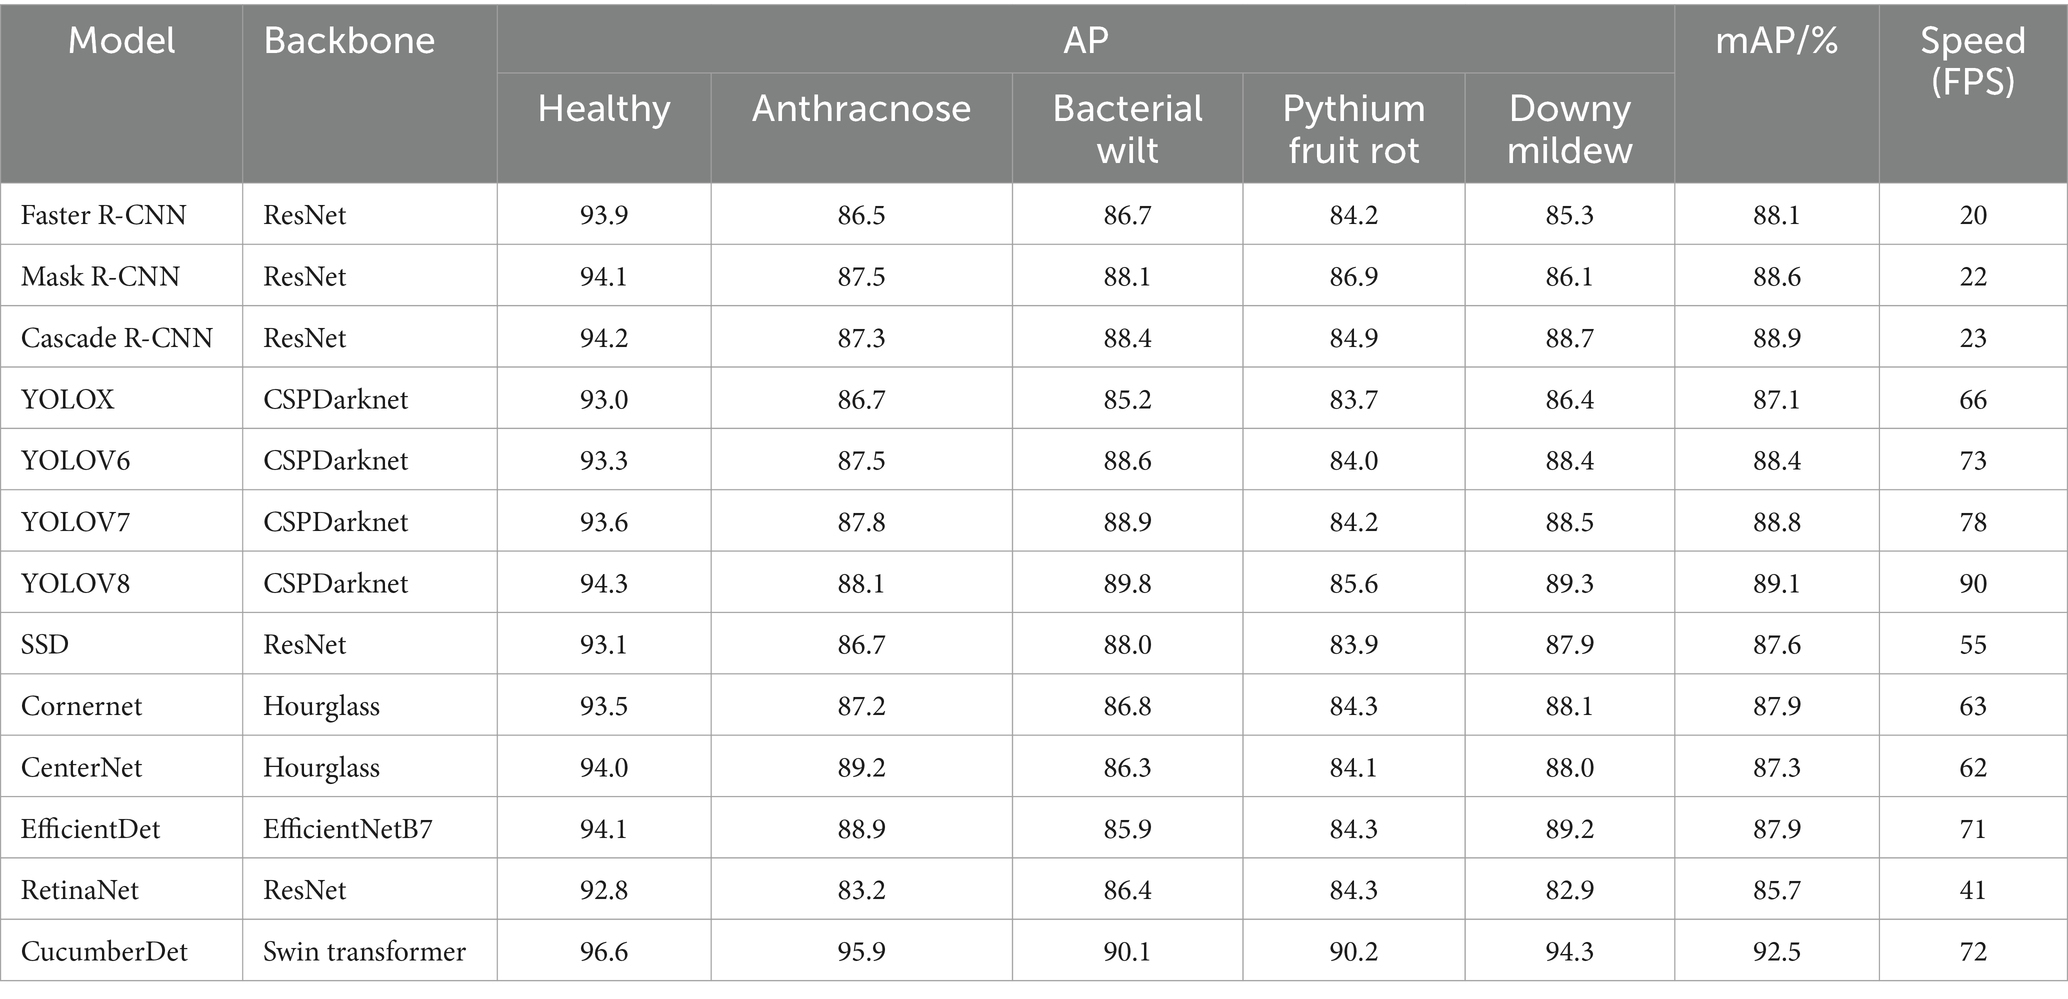
Table 5. Comparative experiments with other state-of-the-art models on the self-constructed dataset.
Table 5 reveals a clear pattern: the proposed CucumberDet outshines other models in average precision (AP) and mean average precision (mAP) across various target categories. Notably, it excels in detecting five categories—Healthy, Anthracnose, Bacterial Wilt, Pythium Fruit Rot, and Downy Mildew—with significant margins. Particularly striking is its supremacy in Anthracnose and Downy Mildew detection, where it establishes a substantial lead over competitors. Moreover, it surpasses most compared algorithms in detecting other target categories. Given the study’s focus on enhancing the detection of small target diseases, the strides made in detecting larger target diseases may not be as pronounced.
Through a comprehensive comparison and analysis of mean Average Precision (mAP) values across all models, the proposed CucumberDet demonstrates a notable 3.4% enhancement over YOLOV8 and a 3.6% advancement over the following best-performing Cascade R-CNN algorithm. This reaffirms the efficacy of employing the Swin Transformer, renowned for its adeptness in capturing both global and local information relationships within images, as the feature extractor for the network in CucumberDet. This augmentation significantly amplifies the network’s prowess in extracting features pertaining to cucumber diseases. The incorporation of SFFM and MFAFM modules further fortifies the detection performance, particularly for small targets associated with cucumber diseases.
Furthermore, in contrast to other mainstream models, CucumberDet exhibits commendable detection speed, rendering it the prime choice in terms of overall performance. These improvements in performance metrics predominantly stem from the seamless fusion of diverse enhancement points, empowering the network to effectively handle small-scale targets and combat background noise in intricate scenes.
In order to further scrutinize the applicability and efficacy of the proposed model for cucumber disease detection, this investigation extended its analysis to encompass additional cucumber disease datasets for comparative validation. Among these datasets are the publicly available CucumberNegm dataset (Negm, 2020) and the CucumberSultana dataset (Sultana et al., 2022, 2023). These datasets exhibit consistent luminosity and aesthetic characteristics, characterized by the absence of overlapping occlusions, minimal background interference, distinct delineations of diseased areas, and well-defined contours of disease targets. Such attributes facilitate the relatively facile extraction of disease-related features and the precise localization of diseased regions, thereby mitigating instances of missed detections and false alarms during disease detection tasks. Through subjecting the proposed CucumberDet model to evaluation on these open-source datasets, the model’s capacity for generalization was verified. Detailed experimental findings are presented in Figure 16 and Table 6.
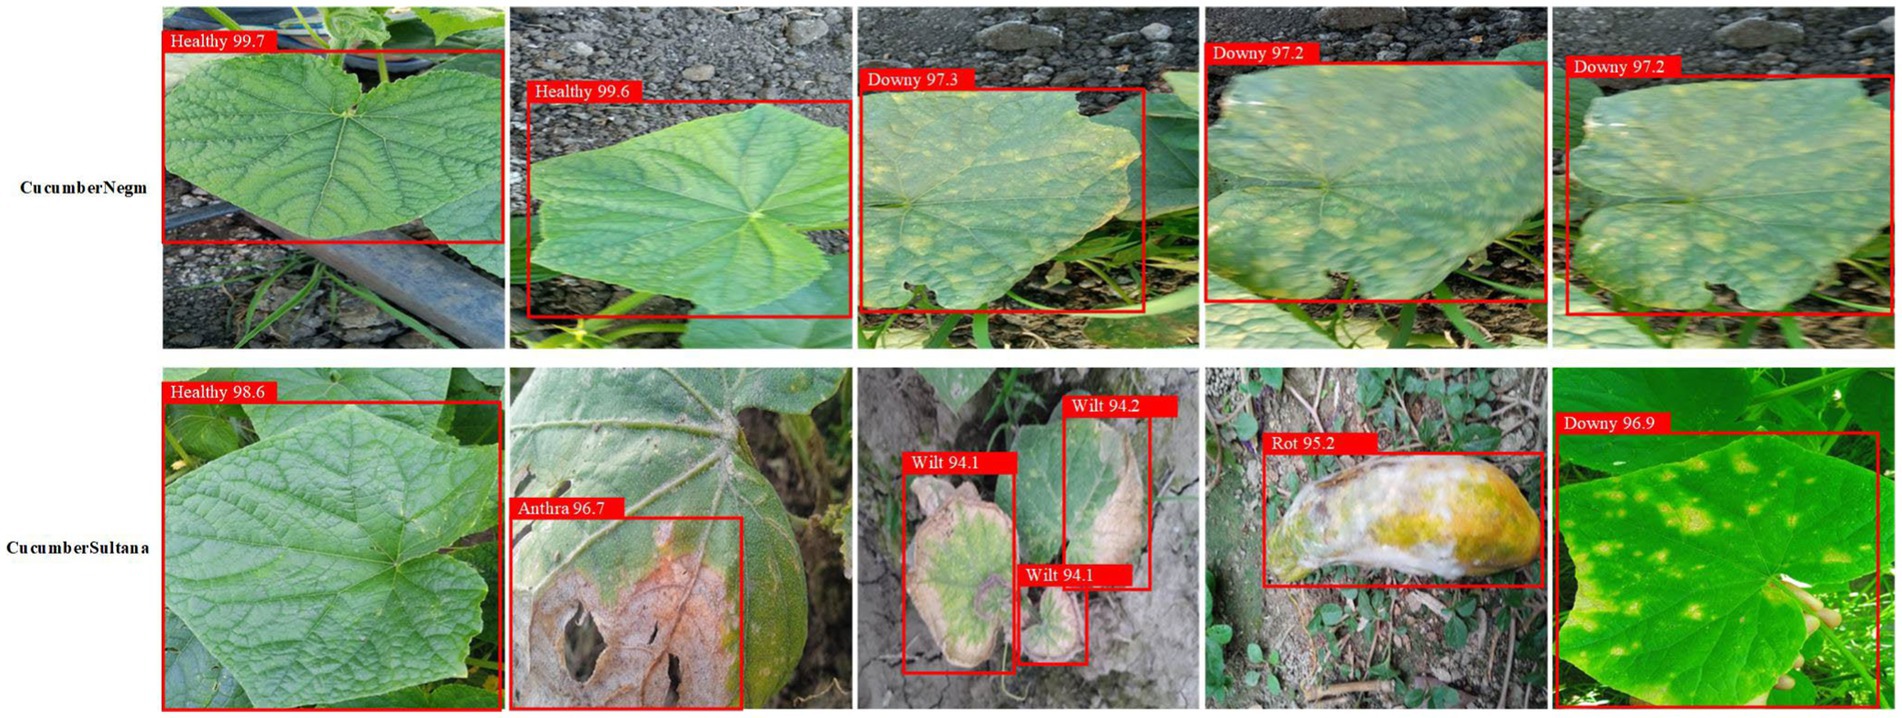
Figure 16. Visualization of detection results on different datasets.
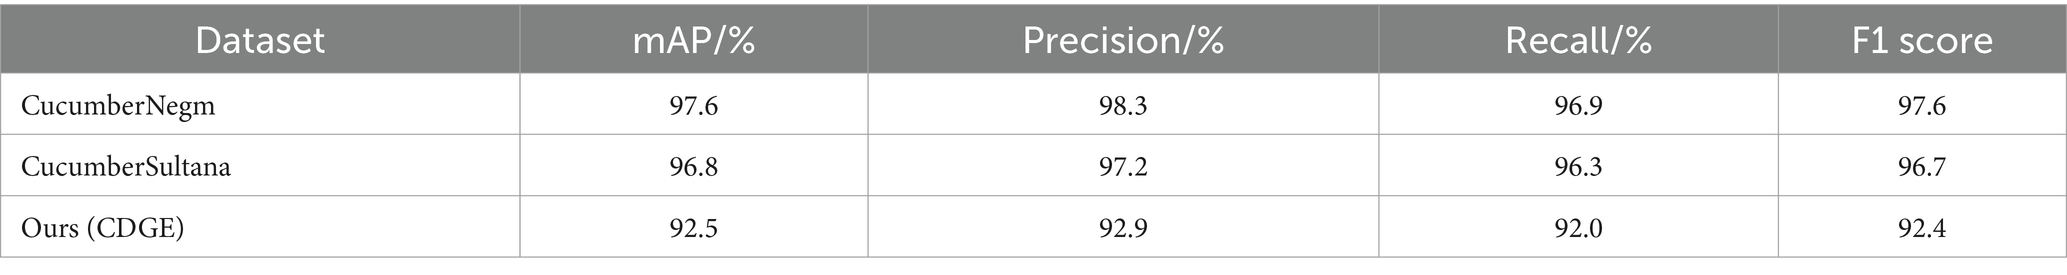
Table 6. Experimental results on different datasets.
Figure 16 reveals the remarkable performance of the proposed CucumberDet across various datasets, precisely discerning cucumber disease targets. This underscores the proficiency of CucumberDet in acquiring efficacious feature representations during training, thereby yielding dependable detection outcomes on unfamiliar data.
Table 6 underscores the robust performance of the proposed CucumberDet across the three datasets. Notably, the mean average precision (mAP) achieved a remarkable level, surpassing 96% for both open-source datasets. Particularly noteworthy is the superior detection accuracy attained for the CucumberNegm dataset, attributed to its distinct disease targets, limited background interference, and narrower field of view. Conversely, while the images in the CucumberSultana dataset exhibit clear disease features and higher resolution, the need to compress the image size to 224 × 224 before training resulted in some loss of disease details, consequently leading to a slightly lower detection accuracy compared to the CucumberNegm dataset.
The collective findings from Figure 16 and Table 6 affirm the robustness and generalization capability of the proposed CucumberDet. This adaptability enables the model to proficiently tackle detection tasks with newfound cucumber disease data, effectively accommodating diverse environmental conditions and disease variations. Thus, the proposed CucumberDet emerges as a reliable solution for cucumber disease detection.
Reasonable data augmentation methods can significantly enhance model performance. To validate the effectiveness of the data augmentation method adopted in this study, the proposed CucumberDet was trained using both the unenhanced original dataset and the augmented dataset. Consistency in environment and hyperparameters was ensured during the training process. The detection results are presented in Table 7.
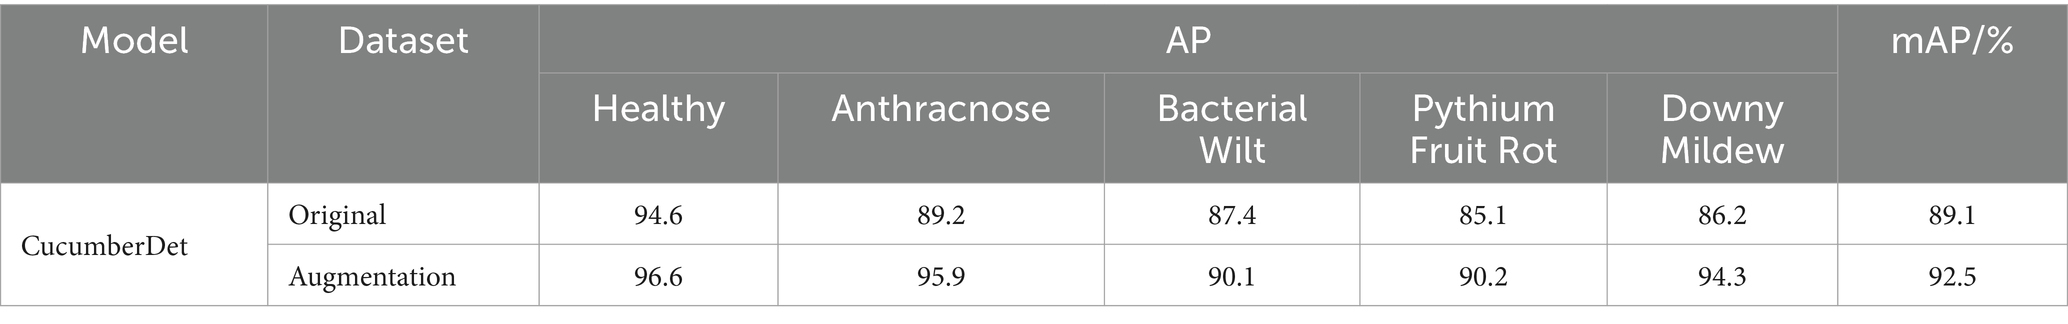
Table 7. Data augmentation impact on model performance.
According to the results in Table 7, the detection accuracy of each cucumber disease class significantly improved after multiple image augmentations were applied to the cucumber disease dataset. The degree of accuracy improvement varied among different disease types. Compared to the original dataset, the mAP increased by 3.4% after data augmentation. This indicates that adopting various data augmentation methods can effectively enhance the robustness and generalization ability of CucumberDet, thereby improving the detection performance of the model across multiple cucumber diseases.
To explore the model’s impact on feature extraction, we used Gradient-weighted Class Activation Mapping (GradCAM) (Selvaraju et al., 2020) to generate heatmaps, as shown in Figure 17. It is evident that the heatmaps highlight regions where the disease is more pronounced, indicating that the model focuses on these areas, aligning with the diagnostic standards of agricultural experts. Additionally, we observed that in images with severe disease, the heatmaps show more pronounced highlighted regions due to the distinct disease features. Conversely, in images with mild disease, the highlighted areas in the heatmaps are smaller due to less apparent disease features. This further validates the accuracy of the proposed model in detecting disease targets.
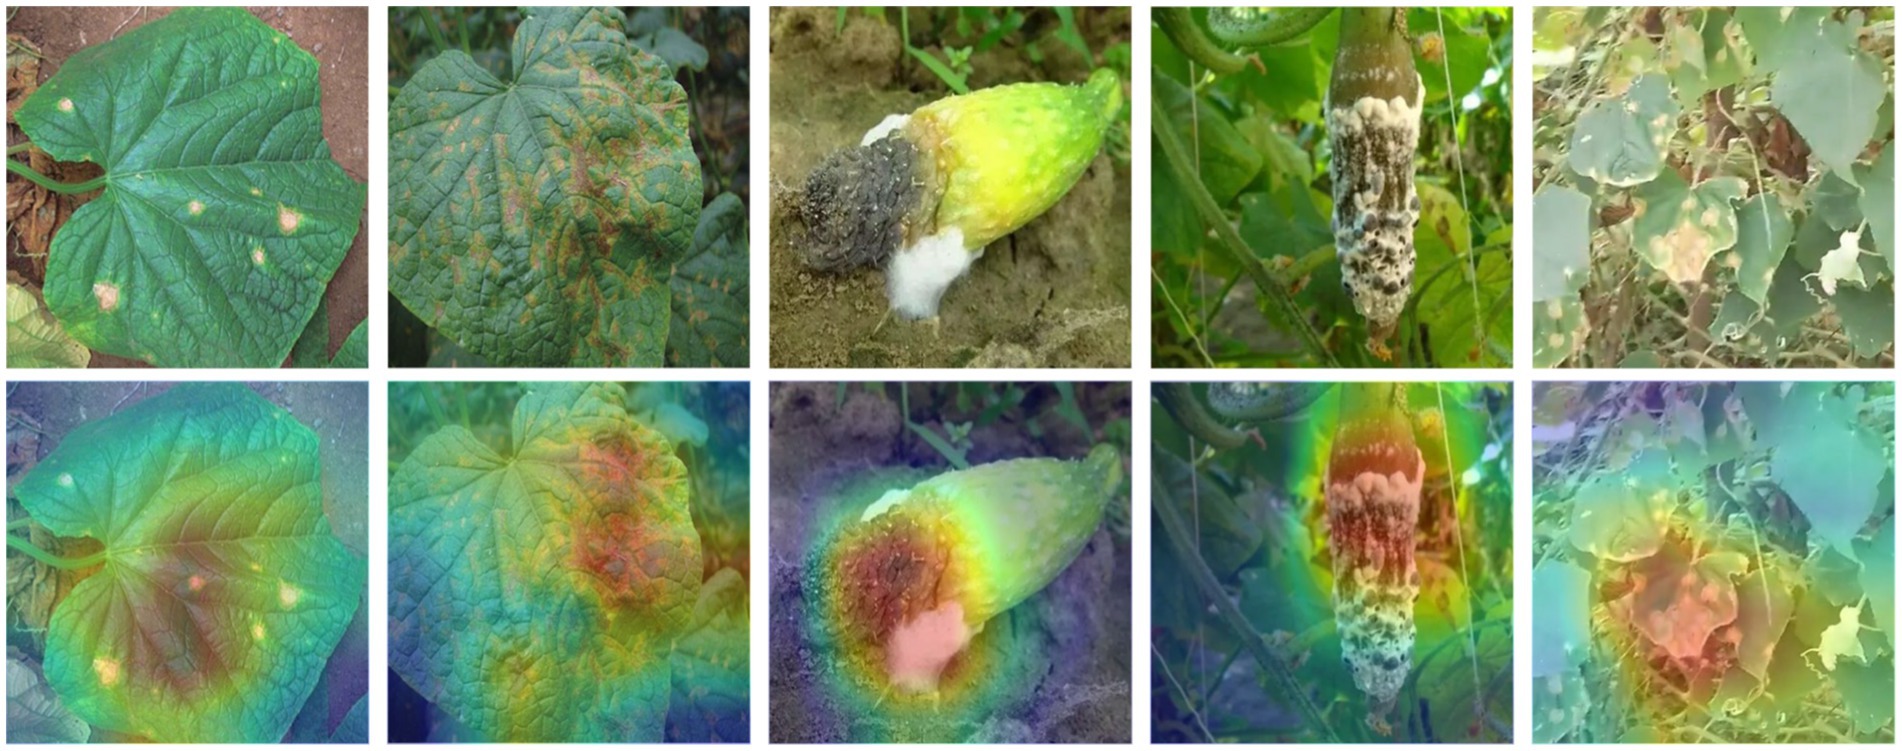
Figure 17. Generated heatmaps of disease images using GradCAM.
The study introduces a cucumber disease image small target detection algorithm that integrates global information perception and feature fusion. The Swin Transformer was selected as the backbone network to extract global contextual information and explore deep semantic features within the images. Opting for the smallest Tiny structure effectively alleviates the computational burden to the maximum extent, mitigating the heaviness associated with the Transformer architecture. Given the scarcity of features in small targets within cucumber disease images, particularly in overlapping or blurry scenarios where conventional object detectors exhibit low accuracy in small target detection, a Small Target Feature Fusion Module (SFFM) was designed to alleviate information loss in the network’s bottleneck and significantly enrich the feature representation of small targets within the network, thereby enhancing the network’s ability to detect small targets. Additionally, a novel Multi-layer Feature Adaptive Fusion Module (MFAFM) was proposed to effectively enable interaction between adjacent two-layer features, thereby preventing small targets in higher-level features from being mistaken as background and causing omissions, thus substantially improving the model’s ability to detect small targets. Through ablation experiments and comparative analyses, the detection performance of the proposed CucumberDet was evaluated, and the model’s robustness was assessed by testing its detection effectiveness on both self-constructed and open-source datasets.
The experimental results confirm that the proposed model effectively enhances global perception capability, preserves effective features of diseased areas, and demonstrates stronger detection capabilities for small-sized targets within cucumber disease images, with an average precision reaching an optimal level, while effectively reducing omission and false alarm rates. The model achieved good detection performance across three different datasets, particularly demonstrating its accuracy in detecting disease targets within the self-constructed dataset, even when the observed field of view is larger, the number of disease targets is higher, and the lesion size is smaller. This indicates the model’s strong generalization ability and its suitability for the task of detecting cucumber disease images.
In future work, the study aims to continue researching small target detection algorithms for cucumber disease images, with a focus on further improving accuracy while ensuring real-time detection of small targets.
The datasets presented in this study can be found in online repositories. The names of the repository/repositories and accession number(s) can be found in the article/supplementary material.
XW: Funding acquisition, Project administration, Resources, Visualization, Writing – original draft, Writing – review & editing. JL: Data curation, Investigation, Methodology, Resources, Software, Validation, Writing – original draft, Writing – review & editing.
The author(s) declare financial support was received for the research, authorship, and/or publication of this article. The present study receives support from the Shandong Province Natural Science Foundation (grant no. ZR2021QC173 and ZR2023MF048), Shandong Province Social Science Project (grant no. 2023-XWKZ-016), School level talent project (grant no. 2018RC002), Weifang Soft Science Project (grant no. 2023RKX184) and Weifang City Science and Technology Development Plan Project (grant no. 2023GX051).
The authors would like to acknowledge the contributions of the participants in this study and the support provided by the Shandong Province Natural Science Foundation.
The authors declare that the research was conducted in the absence of any commercial or financial relationships that could be construed as a potential conflict of interest.
All claims expressed in this article are solely those of the authors and do not necessarily represent those of their affiliated organizations, or those of the publisher, the editors and the reviewers. Any product that may be evaluated in this article, or claim that may be made by its manufacturer, is not guaranteed or endorsed by the publisher.
Abade, A., Ferreira, P. A., and de Barros Vidal, F. (2021). Plant diseases recognition on images using convolutional neural networks: a systematic review. Comput. Electron. Agric. 185:106125. doi: 10.1016/j.compag.2021.106125
Ashtiani, S. H. M., Javanmardi, S., Jahanbanifard, M., Martynenko, A., and Verbeek, F. J. (2021). Detection of mulberry ripeness stages using deep learning models. IEEE Access 9, 100380–100394. doi: 10.1109/ACCESS.2021.3096550
Attri, I., Awasthi, L. K., Sharma, T. P., and Rathee, P. (2023). A review of deep learning techniques used in agriculture. Eco. Inform. :102217.
Bhola, A., Verma, S., and Kumar, P. (2023). A comparative analysis of deep learning models for cucumber disease classification using transfer learning. J. Curr. Sci. Technol. 13, 23–35.
Cai, Z., and Vasconcelos, N. (2018). Cascade r-cnn: Delving into high quality object detection. In proceedings of the IEEE conference on computer vision and pattern recognition (pp. 6154–6162).
Cao, Y., Chen, L., Yuan, Y., and Sun, G. (2023). Cucumber disease recognition with small samples using image-text-label-based multi-modal language model. Comput. Electron. Agric. 211:107993. doi: 10.1016/j.compag.2023.107993
Cui, Y., Jia, M., Lin, T. Y., Song, Y., and Belongie, S. (2019). Class-balanced loss based on effective number of samples. In proceedings of the IEEE/CVF conference on computer vision and pattern recognition (pp. 9268–9277).
Duan, K., Bai, S., E, L., Qi, H., Huang, Q., and Tian, Q. (2019). Centernet: Keypoint triplets for object detection. In Proceedings of the IEEE/CVF international conference on computer vision (pp. 6569–6578).
Ge, Z., Liu, S., Wang, F., Li, Z., and Sun, J. (2021). Yolox: Exceeding yolo series in 2021. Ar xiv preprint arXiv: 2107.08430.
Hasan, R. I., Yusuf, S. M., and Alzubaidi, L. (2020). Review of the state of the art of deep learning for plant diseases: a broad analysis and discussion. Plan. Theory 9:1302. doi: 10.3390/plants9101302
He, K., Gkioxari, G., Dollár, P., and Girshick, R. (2017). Mask r-cnn. In proceedings of the IEEE international conference on computer vision (pp. 2961–2969).
He, K., Zhang, X., Ren, S., and Sun, J. (2016). Deep residual learning for image recognition. In Proceedings of the IEEE conference on computer vision and pattern recognition (pp. 770–778).
Jiang, P., Ergu, D., Liu, F., Cai, Y., and Ma, B. (2022). A review of yolo algorithm developments. Procedia Comput. Sci. 199, 1066–1073. doi: 10.1016/j.procs.2022.01.135
Jocher, G., Chaurasia, A., Stoken, A., Borovec, J., Kwon, Y., Michael, K., et al. (2022). Ultralytics/yolov5: v6. 2-yolov5 classification models, apple m1, reproducibility, clearml and deci. Ai integrations. Zenodo.
Kim, S., Hong, S. J., Ryu, J., Kim, E., Lee, C. H., and Kim, G. (2023). Application of amodal segmentation on cucumber segmentation and occlusion recovery. Comput. Electron. Agric. 210:107847. doi: 10.1016/j.compag.2023.107847
Law, H., and Deng, J. (2018). Cornernet: detecting objects as paired keypoints. In Proceedings of the European conference on computer vision (ECCV) (pp. 734–750).
Li, C., Li, L., Jiang, H., Weng, K., Geng, Y., Li, L., et al. (2022). YOLOv6: a single-stage object detection framework for industrial applications. arXiv preprint arXiv: 2209.02976.
Li, L., Zhang, S., and Wang, B. (2021). Plant disease detection and classification by deep learning—a review. IEEE Access 9, 56683–56698. doi: 10.1109/ACCESS.2021.3069646
Li, K., Zhu, X., Qiao, C., Zhang, L., Gao, W., and Wang, Y. (2023). The gray Mold spore detection of cucumber based on microscopic image and deep learning. Plant Phenomics 5:0011. doi: 10.34133/plantphenomics.0011
Lin, T. Y., Dollár, P., Girshick, R., He, K., Hariharan, B., and Belongie, S. (2017). Feature pyramid networks for object detection. In Proceedings of the IEEE conference on computer vision and pattern recognition (pp. 2117–2125).
Lin, T. Y., Goyal, P., Girshick, R., He, K., and Dollár, P. (2017). Focal loss for dense object detection. In Proceedings of the IEEE international conference on computer vision (pp. 2980–2988).
Liu, W., Anguelov, D., Erhan, D., Szegedy, C., Reed, S., Fu, C. Y., et al. (2016). SSD: single shot multibox detector. In Computer vision–ECCV 2016: 14th European conference, Amsterdam, the Netherlands, October 11–14, 2016, proceedings, part I 14 (pp. 21–37). Springer International Publishing.
Liu, Z., Lin, Y., Cao, Y., Hu, H., Wei, Y., Zhang, Z., et al. (2021). Swin transformer: hierarchical vision transformer using shifted windows. In proceedings of the IEEE/CVF international conference on computer vision (pp. 10012–10022).
Liu, Y., Wang, Z., Wang, R., Chen, J., and Gao, H. (2023). Flooding-based Mobile net to identify cucumber diseases from leaf images in natural scenes. Comput. Electron. Agric. 213:108166. doi: 10.1016/j.compag.2023.108166
Long, J., Shelhamer, E., and Darrell, T. (2015). Fully convolutional networks for semantic segmentation. In Proceedings of the IEEE conference on computer vision and pattern recognition (pp. 3431–3440).
Ma, J., Du, K., Zheng, F., Zhang, L., Gong, Z., and Sun, Z. (2018). A recognition method for cucumber diseases using leaf symptom images based on deep convolutional neural network. Comput. Electron. Agric. 154, 18–24. doi: 10.1016/j.compag.2018.08.048
Manavalan, R. (2020). Automatic identification of diseases in grains crops through computational approaches: a review. Comput. Electron. Agric. 178:105802. doi: 10.1016/j.compag.2020.105802
Negm, K., “Cucumber plant diseases dataset Kaggle,” (2020). Available at: https://www.kaggle.com/kareem3egm/cucumber-plant-diseases-dataset
Oksuz, K., Cam, B. C., Kalkan, S., and Akbas, E. (2020). Imbalance problems in object detection: a review. IEEE Trans. Pattern Anal. Mach. Intell. 43, 3388–3415. doi: 10.1109/TPAMI.2020.2981890
Ouhami, M., Hafiane, A., Es-Saady, Y., El Hajji, M., and Canals, R. (2021). Computer vision, IoT and data fusion for crop disease detection using machine learning: a survey and ongoing research. Remote Sens. 13:2486. doi: 10.3390/rs13132486
Ren, S., He, K., Girshick, R., and Sun, J. (2015). Faster r-cnn: towards real-time object detection with region proposal networks. Adv. Neural Inf. Proces. Syst. 28.
Selvaraju, R. R., Cogswell, M., Das, A., Vedantam, R., Parikh, D., and Batra, D. (2020). Grad-cam: visual explanations from deep networks via gradient-based localization. Int. J. Comput. Vis. 128, 336–359. doi: 10.1007/s11263-019-01228-7
Sharma, V., Tripathi, A. K., and Mittal, H. (2023). DLMC-net: deeper lightweight multi-class classification model for plant leaf disease detection. Eco. Inform. 75:102025. doi: 10.1016/j.ecoinf.2023.102025
Sultana, N., Shorif, S. B., Akter, M., and Uddin, M. S. (2022). Cucumber disease recognition dataset. Mendeley Data V1. doi: 10.17632/y6d3z6f8z9.1
Sultana, N., Shorif, S. B., Akter, M., and Uddin, M. S. (2023). A dataset for successful recognition of cucumber diseases. Data Brief 49:109320. doi: 10.1016/j.dib.2023.109320
Tan, M., Pang, R., and Le, Q. V. (2020). Efficientdet: Scalable and efficient object detection. In Proceedings of the IEEE/CVF conference on computer vision and pattern recognition (pp. 10781–10790).
Terven, J., and Cordova-Esparza, D. (2023). A comprehensive review of YOLO: from YOLOv1 to YOLOv8 and beyond. arXiv preprint arXiv: 2304.00501.
Wang, C. Y., Bochkovskiy, A., and Liao, H. Y. M. (2023). YOLOv7: Trainable bag-of-freebies sets new state-of-the-art for real-time object detectors. In proceedings of the IEEE/CVF conference on computer vision and pattern recognition (pp. 7464–7475).
Wang, A., Chen, H., Liu, L., Chen, K., Lin, Z., Han, J., et al. (2024). Yolov 10: real-time end-to-end object detection. Arxiv preprint arxiv: 2405.14458.
Wang, C. Y., Yeh, I. H., and Liao, H. Y. M. (2024). YOLOv9: learning what you want to learn using programmable gradient information. Arxiv preprint arxiv: 2402.13616.
Yang, R., Guo, Y., Hu, Z., Gao, R., and Yang, H. (2023). Semantic segmentation of cucumber leaf disease spots based on ECA-Seg former. Agriculture 13:1513. doi: 10.3390/agriculture13081513
Yang, C., Huang, Z., and Wang, N. (2022). Query Det: cascaded sparse query for accelerating high-resolution small object detection. In Proceedings of the IEEE/CVF conference on computer vision and pattern recognition (pp. 13668–13677).
Zhang, S., Zhang, S., Zhang, C., Wang, X., and Shi, Y. (2019). Cucumber leaf disease identification with global pooling dilated convolutional neural network. Comput. Electron. Agric. 162, 422–430. doi: 10.1016/j.compag.2019.03.012
Keywords: object detection, global information perception, feature fusion, cucumber disease image, disease detection healthy
Citation: Wang X and Liu J (2024) Detection of small targets in cucumber disease images through global information perception and feature fusion. Front. Sustain. Food Syst. 8:1366387. doi: 10.3389/fsufs.2024.1366387
Edited by:
Nicolas Desoignies, HEPH Condorcet, BelgiumReviewed by:
Seyed-Hassan Miraei Ashtiani, Dalhousie University, CanadaCopyright © 2024 Wang and Liu. This is an open-access article distributed under the terms of the Creative Commons Attribution License (CC BY). The use, distribution or reproduction in other forums is permitted, provided the original author(s) and the copyright owner(s) are credited and that the original publication in this journal is cited, in accordance with accepted academic practice. No use, distribution or reproduction is permitted which does not comply with these terms.
*Correspondence: Jun Liu, bGl1X2p1bjg2MDExNkB3ZnVzdC5lZHUuY24=
Disclaimer: All claims expressed in this article are solely those of the authors and do not necessarily represent those of their affiliated organizations, or those of the publisher, the editors and the reviewers. Any product that may be evaluated in this article or claim that may be made by its manufacturer is not guaranteed or endorsed by the publisher.
Research integrity at Frontiers
Learn more about the work of our research integrity team to safeguard the quality of each article we publish.