 Kun Zhou
 Jin Wu2†
- 1College of Management, Sichuan Agricultural University, Chengdu, China
- 2Biogas Institute of Ministry of Agriculture and Rural Affairs, Chengdu, China
- 3Faculty of Economics and Business Administration, Yibin University, Yibin, China
- 4State Capital Infrastructure Office, Sichuan Agricultural University, Chengdu, China
Increasing demands for livestock products have stimulated rapid increases in the number of livestock and the scale of farming, thus increasing pressure on resources and the environment. Coordinating the development of livestock production (LP) with residential consumption (RC), resources and the environmental carrying capacity (RECC) is important to ensure sustainable development. In this study, the entropy weight method and the improved-coupling coordination degree (CCD) model were used to identify the spatial–temporal coordination development characteristics of livestock production-residential consumption-resource and environmental carrying capacity (LRRE). Furthermore, the spatial autocorrelation model (SAM) and gray model (GM) were used to analyze the spatial aggregation characteristics and future development trends of the CCDs of the LRRE in China. The findings show that the CCDs of the LRRE values in 31 Chinese provinces increased from 2005 to 2020, but no provinces reached a high coordination level. Specifically, the coordinated development level of LRRE is relatively high in the central, eastern and northeastern regions and relatively low in the western region. The spatial autocorrelation analysis confirmed that the high-high (H-H) aggregation areas were mainly distributed in the northeastern, eastern, and central regions, while low-high (L-H) agglomeration was distributed in the western region. This phenomenon is mainly attributed to the continuous expansion of the scale of livestock production in western China. Regions with relatively developed economies have more funds to invest in environmental protection projects. Using GM method, we find that the CCDs of LRRE in 31 provinces in China will increase from 2021 to 2030, and all provinces will reach the basic coordination level. However, most of the western regions will barely reach the basic coordination level. This result indicates that the low level of LRRE development in western China may be difficult to change in the short term. The level of coordinated LRRE development in the relatively developed eastern region is increasing. The spatial layout of China’s livestock industry should be appropriately adjusted, its expansion rate in the western region should be decreased, and the ecological environment of the areas bordering the western and central regions should be improved. These findings have practical implications for other large livestock production countries. Promoting the coordinated development of LRRE is also an important condition for agricultural transformation in developing countries, especially for improving the environment in key areas of the livestock industry.
1 Introduction
Since its reform and opening up, China’s development has led to a significant increase in the demand for livestock products (He et al., 2018; Zhao et al., 2021). Currently, China has become the largest producer of livestock products worldwide (Bai et al., 2018; Zhang C. et al., 2019). In 2020, China’s meat, egg, and milk production were 899 Mt., 341 Mt., and 368 Mt., respectively (NBS, 2022); worldwide, pork accounted for 37.95% of production, and beef and chicken accounted for more than 10%, respectively (USDA, 2022). However, the expanding scale of livestock farming has placed tremendous pressure on resources and the environment (Zheng et al., 2019). Livestock production releases a large amount of greenhouse gases (GHGs) and uses limited resources, such as land (Post et al., 2020), which affects soil and water safety and poses certain hazards to human health (Rosa et al., 2020). In China alone, compared to their numbers in 2000, the number of pigs in 2022 increased by 36.22 million, theoretically increasing nitrogen and phosphorus discharges by 39.84 and 5.98 104 t, respectively (Zhou et al., 2024), placing enormous pressure on river and soil ecosystems. Waste emissions from ruminants in China have been estimated to cost $32.2 billion in damage to ecosystems (Du et al., 2018). Residents living near farms for a long time have also been frequently exposed to respiratory and cardiopulmonary diseases (Gerbecks et al., 2020). Coordinating the relationships among livestock breeders, resources, the environment and residents has become the key to the development of the current breeding industry.
The development of animal husbandry should be compatible with the resource environment and residents’ consumption; an uncoordinated development relationship may lead to an unstable food supply and ecological disaster. Agriculture is a complex process that results from interactions between humans and nature and is intensely affected by resources, society and market price (Hatfield et al., 2020; Seguin et al., 2021). Livestock production needs to occur in spaces with substantial regional resources and environmental carrying capacity (RECC), as exceeding the RECC may permanently damage the local ecological structure (Zhang Y. et al., 2022). For example, livestock production is dependent on land and crops to absorb manure, and if resources are insufficient, the ammonia, nitrogen and phosphorus produced during livestock production can severely pollute the air, rivers and soil. With the development of the economy, the rising demand for livestock products will further stimulate growth in the livestock industry (Sun et al., 2021), which will also impose greater environmental pressure (Qian et al., 2022). Population size and residential consumption preferences drive expansion in the livestock sector. If these factors are ignored, the development of the livestock sector may fall short of realistic development goals. For example, provinces with large populations do not have sufficient meat production capacity, which may limit the food supply capacity of these areas. However, although the resource environment and residential consumption play key roles in the development of livestock systems, this relationship is not yet clear; however, an understanding of it is crucial for the layout of China’s livestock industry. Therefore, focusing on in-depth analyses of the coupling coordination degree (CCD) of livestock production (LP), residential consumption (RC), and the RECC (LRRE) is important for evaluating the effect of agricultural policy and promoting the coordinated development capacity of the livestock industry.
Currently, much research considers the impacts of natural disasters on socioeconomic factors (Ekwueme, 2022; Mann and Gupta, 2022) and food security (Jabal et al., 2022) or the impacts of extreme disasters on sustainable business development (Habib and Mourad, 2023). While these studies can help readers understand climate change in depth, they neglect to consider livestock factors. Some scholars are currently focusing on the environmental pressures brought about by agricultural production, especially the environmental damage caused by the livestock industry. For example, several scholars have measured theoretical livestock manure emissions in different regions (Wang et al., 2021) and water, soil, and atmospheric pollution caused by livestock production (Han et al., 2023). Nevertheless, few scholars have studied the development of the livestock industry from a resource-environment perspective (Han et al., 2023). Other relevant studies often focus on environmental pressure (carbon emission) or a certain method of agricultural land resource utilization, but pay less attention to coupling coordination (Jia et al., 2023; Liu et al., 2023). Several scholars have begun to establish a coupling coordination degree model (CCDM) that analyzes the development-oriented relationships between different systems such as fishery systems and environmental quality (Peng et al., 2021); RECC (Chen et al., 2022; Zhang et al., 2022a); agricultural green development and food security (Zhang et al., 2022b; Zhang and Li, 2022); urbanization and the ecological environment (Ariken et al., 2021; Gao et al., 2021; Yang et al., 2022); tourism and the ecological environment (Zhang and Li, 2021; Zhang et al., 2023); and water resource use efficiency and economic development (Dai et al., 2022; Zhang and Li, 2022). However, few studies have systematically investigated the coupling coordination relationship of LRRE to analyze the effects of environmental policies and improve ecological development. The United Nation Framework Convention on Climate Change (UNFCCC) proposes improving the capacity for coordinated development between production systems and ecosystems to better respond to climate change (Liu F. et al., 2022). The growing consumer demand for meat has stimulated further expansion of livestock production, greatly increasing pressure on resources and the environment (Liang et al., 2023). Countries impacted by this growth need an approach for achieving the coordinated development of the LRRE system. Therefore, this paper provides an effective reference for other large livestock-producing countries worldwide by analyzing the temporal and spatial changes and future trends in the coordinated development of LRRE in China.
To explore the development relationship of China’s LRRE system, in this study, a coupled relationship evaluation framework for the LRRE system is constructed and an improved-CCDM is used to analyze the CCDs of the LRRE in China from 2005 to 2020. Furthermore, the spatial autocorrelation model (SAM) and the gray model (GM) are used to analyze the spatial aggregation characteristics and future development trends of the CCDs of LRRE in China. The contributions of this paper are as follows: (1) The resource environment and residential consumption play crucial roles in the development of the livestock industry. However, the coupling coordination development relationship between these variables has not yet been demanded; this information is critical for determining the layout of livestock production. Therefore, a framework for assessing the sustainable development of the livestock industry is constructed from the perspectives of LP, RC and RECC, thus providing practical assistance in guaranteeing food security, adjusting the layout of the livestock industry and alleviating environmental pressure. (2) In the construction of indicators, in contrast to existing studies, in this study, we consider GHGs to be an undesired output of livestock production systems; furthermore, we collected and utilized data on the meat consumption of residents in each region of China, thus creating a comprehensive LRRE indicator system. (3) Methodologically, we use an improved-CCDM to calculate the CCD of the RECC, increasing the accuracy of the results, and the SAM and GM to analyze the spatial aggregation characteristics and future trends of the CCD for each Chinese province from 2021 to 2030. This analysis strategy is helpful for researchers and policymakers because it more clearly explains the spatial distribution characteristics and evolutionary trends of the CCD of the LRRE in each province in China and provides a realistic basis for agricultural green development policy formulation.
2 Index selection, methods, and data sources
2.1 Index selection
2.1.1 Livestock production systems
LP systems contain social, economic, and ecological elements (Zhao et al., 2021). The social element refers mainly to the quantity of food (meat, egg, and milk) produced by livestock. The economic element consists of the total output value of the livestock industry and the value of livestock production per unit of farmland area. The ecological elements include livestock manure, nutrient supplies from livestock manure, and GHG emissions from livestock farming processes. Livestock manure, manure nutrient supply, and GHG emissions are calculated as follows:
1. Calculation of livestock manure
The study selected pigs, sows, poultry, beef cattle, dairy cows, sheep, horses, donkeys, and mules as subjects. According to Li et al. (2022), rearing quantity was based on the slaughter of pigs and poultry; stockpiles were used to calculate the quantities of the other animals. In addition, due to the influences of rearing methods, climatic environment and other factors, the manure emission factors of various livestock in different areas are differed We referred to Zhou et al. (2014) to set the livestock manure emission factors of each livestock type (Table A.1 in Supplementary material A). The specific calculation formula (1) is as follows:
is the quantity of manure excreted by livestock; is the number of livestock i slaughtered or stockpiled. is the rearing time of livestock i, and is the manure emission factor of livestock i.
1. Calculation of nutrient supply from livestock manure as follows equation (2):
is the livestock manure nutrient supply; is the nitrogen or phosphorus emissions of livestock i; and θ is the nutrient retention rate. We referred to the recommended values given in the Technical Guide to Livestock Manure Land Carrying Capacity Measurement, which indicated that the nutrient retention rates of nitrogen and phosphorus are 65% (MARD, 2018).
1. Calculation of greenhouse gas emissions from livestock farming as follows equation (3):
GHGs are the GHG emissions from livestock farming, represents the stockpile of ruminants, is the enteric fermentation methane emission factor, is the quantity of livestock manure, is the livestock manure methane emission factor, and is the livestock manure nitrous oxide emission factors. We referred to Guo et al. (2017) to define enteric fermentation methane emission factors, livestock manure methane emission factors, and livestock manure nitrous oxide emission factors (Table A.2 in Supplementary material A).
2.1.2 Resource and environmental carrying capacity
The RECC subsystem consists of resource carrying capacity and environmental carrying capacity systems (Zhang F. et al., 2019). In this paper, referring to Chen et al. (2022) and Zhao et al. (2022), we selected agricultural land area, crop sown area, irrigated area, regional crop nutrient demand, regional crop manure nutrient demand, fertilizer use, total feed production, rural electricity consumption, total water resources, and road mileage for the evaluation of the resource subsystem. To evaluate the environmental subsystem, we selected the forest coverage rate, wetland area, pollution control investment, annual average PM2.5 concentration, and green area.
The calculations of regional crop nutrient demand and nutrient requirements for crops from livestock manure were based on the Technical Guide to the Measurement of Land Carrying Capacity of Livestock and Poultry Manure (MARD, 2018). The calculation process is as follows equation (4):
1. Calculation of regional crop nutrient demand:
is the regional crop nutrient requirement, is the yield of crop i, and is the crop i nutrient demand coefficient (Table A.3 in Supplementary material A).
1. Calculation of the manure nutrient requirements of crops from livestock manure as follows equation (5):
where is the nutrient requirement of crops from livestock manure; represents the share of chemical fertilizer nutrients in the total nutrient requirements of crops; is the proportion of livestock manure nutrients to the total nutrient requirements of crops; and is the utilization rate of livestock manure nutrients. For convenience, we referred to the recommended values given in the Technical Guide to Livestock Manure Land Carrying Capacity Measurement (MARD, 2018), where is 50%, the utilization rate is 30% for nitrogen and 35% for phosphorus (Zheng et al., 2019), and is 45%.
2.1.3 Residential consumption
The residential consumption system consists of the livestock product consumption level and consumption potential. The main evaluation indicators of consumption potential were GDP, GDP per capita, urbanization level, per capita income, population size and Engel’s coefficient (Cao et al., 2019; Roux et al., 2021). The consumption level included per capita meat, egg, and milk consumption demand, as well as the total meat, egg, and milk consumption of residents (Fan and Fang, 2020). Table 1 shows the LRRE indicator system.
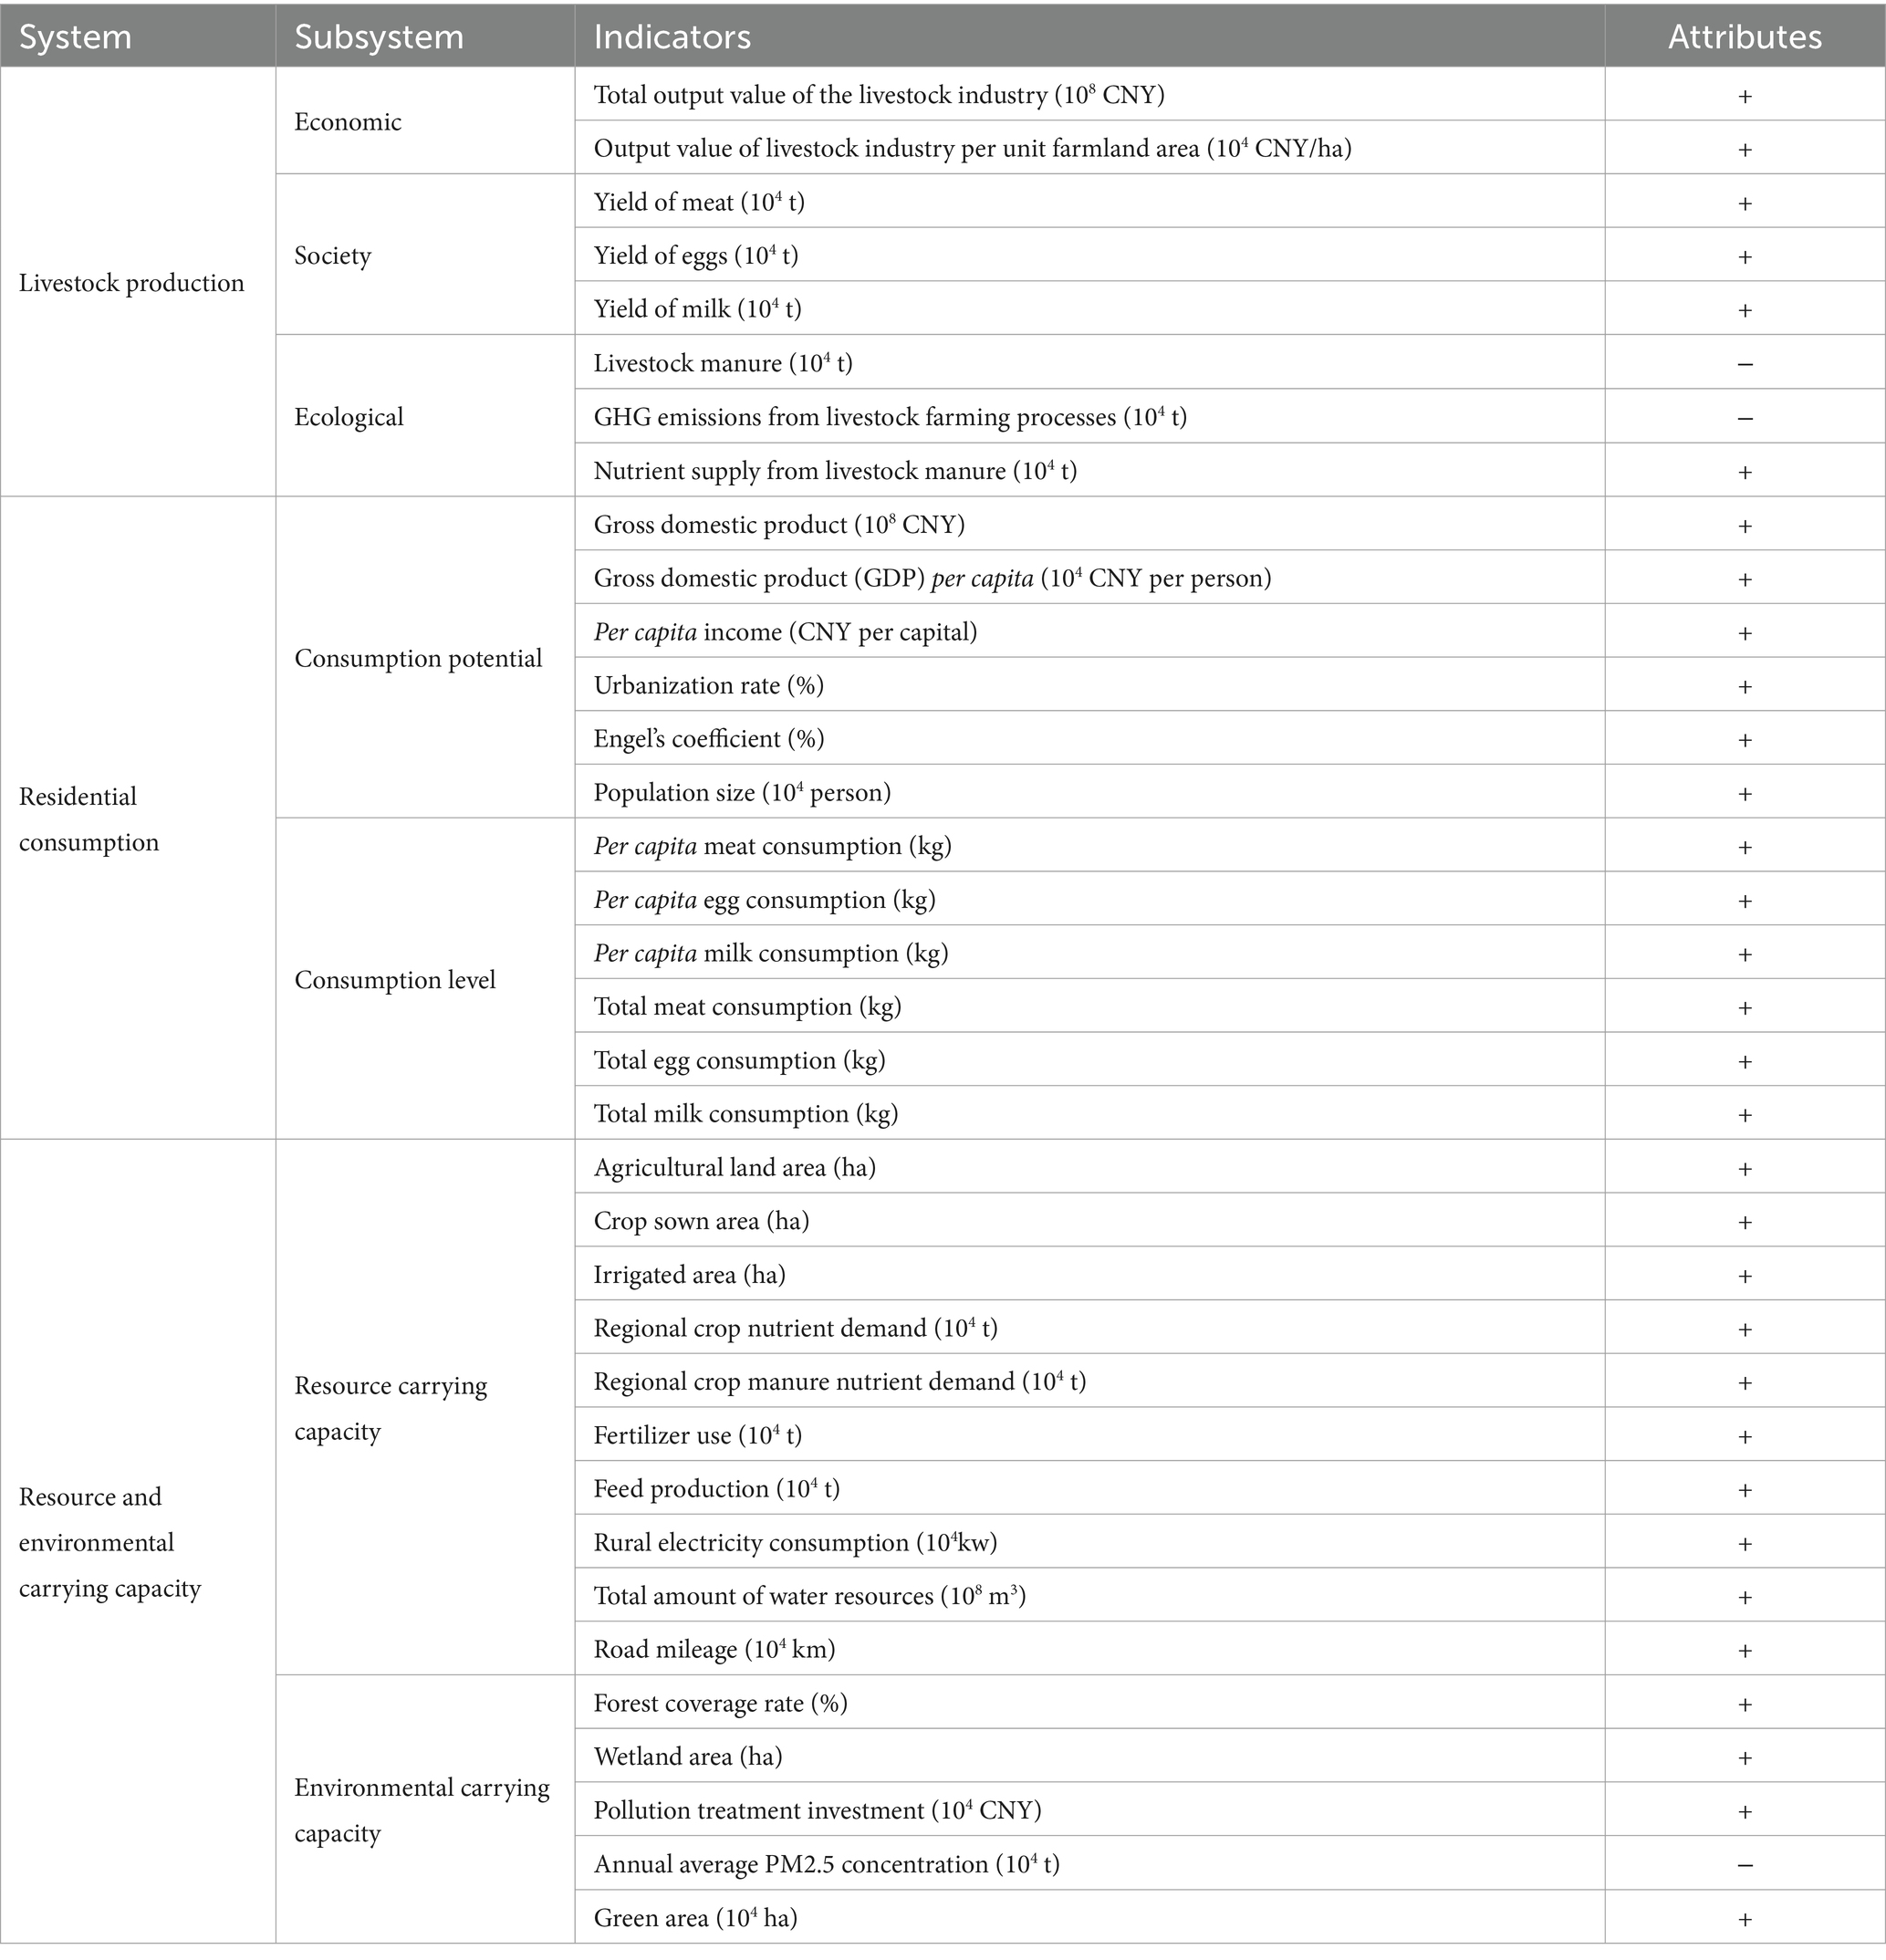
Table 1. Indicator system of LRRE.
2.2 Methods
2.2.1 Improved-CCDM
The entropy weight method can be used to comprehensively evaluate several dimensions; it is often used in comprehensive evaluation research because of its scientific basis and simplicity. In this study, the entropy weight method was adopted to calculate the total score of each subsystem; the specific calculation methods used are described in Sahoo et al. (2017) and Zhang C. et al. (2019). The total score of each subsystem was calculated. Then, the improved-CCDM was used to calculate the CCD of the LRRE. The CCDM is mainly used to evaluate the strength and correlation between the interactions of systems and has been widely used in several fields (Cheung and Ma, 2011; Tan et al., 2022). The calculation is as follows equation (6) (Ariken et al., 2021):
where C represents the coupling degree between LRRE, and , and are the evaluation indices of LP, RC, and RECC, respectively.
Furthermore, we can calculate the CCD of LRRE by formulas (7, 8):
where D is the CCD for the three systems, 0 ≤ D ≤ 1; when D is closer to 1, the CCD is higher. T is the comprehensive evaluation index for the coordinated development of the LRRE subsystems. α, β, and μ represent the weight values of the LRRE subsystems. We referenced Shen et al. (2018) and Jiang et al. (2022) and used the improved-CCDM to calculate , β, and μ. The equations are as follows equation (9):
Li J. et al. (2021) and Peng et al. (2021) were referenced to construct the coupling coordination level (Table 2). In Table 2, we divide coupling coordination degree into five levels. When the degree of dissonance coordination increases to a high level, the coordination level of the LRRE system increases, and livestock production, residential consumption and resource environment match.
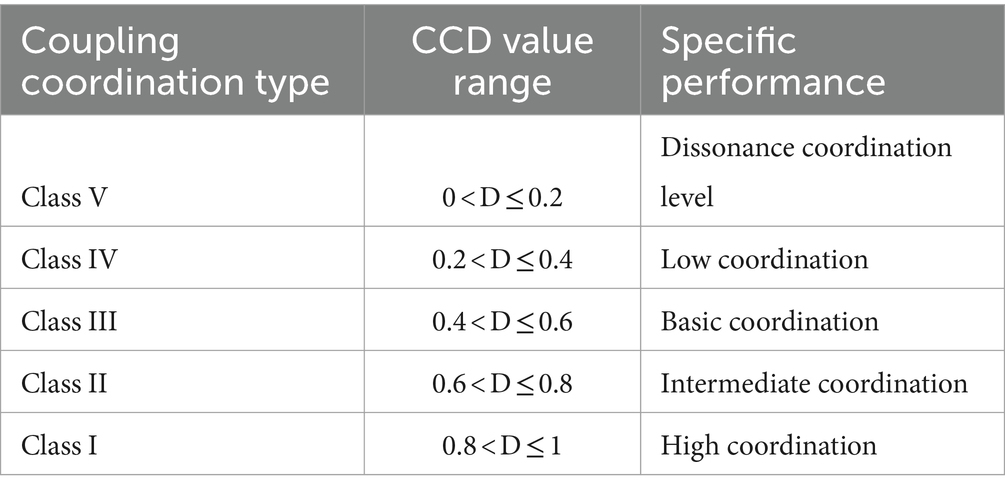
Table 2. Coupling coordination level of LRRE.
2.2.2 Spatial autocorrelation
Moran’s I is commonly used to measure the spatial aggregation characteristics of and period changes in industry (Ping et al., 2004; Zhou et al., 2014). Therefore, we used the global Moran’s I to test the spatial correlation of LRRE with equation (10):
where and are the levels of CCD in province i and province j, respectively; is the average level of CCD; represents the elements in row i and column j of the spatial weight matrix; n is the number of provinces; and is the sample variance.
To adequately express the trend of regional differences, we further used the local spatial autocorrelation method to reveal the correlation of local study units in the neighborhood space (Li Q. et al., 2021). The specific expressions are as follows equation (11):
2.2.3 GM (1.1) prediction model
The GM (1.1) is the traditional prediction model and can develop and utilize explicit and implicit information from modest data to determine the mathematical relationships between factors. Typically, discrete models are used to construct a model for the period-by-period analysis of intercropping. However, discrete models can perform only short-term analysis of the development of an objective system, and cannot adapt to the requirements of long-term analysis, planning and decision-making. Therefore, the GM is more suitable for short-term forecasting analysis (Jiang et al., 2022) and is widely used for prediction studies (Qian and Wang, 2020; Geng et al., 2021; Liu H. et al., 2022). Therefore, to visualize the dynamic evolution trajectory of the CCD of the LRRE in the future, we adopted this method to forecast the CCD of the LRRE from 2021 to 2030 in 31 provinces in China. The GM (1.1) model is constructed as follows:
First, the original sequence determined by is the following equation (12):
Second, the whitening differential equation is calculated as follows equation (13):
where a is the development gray number and u is the endogenous control gray number.
Furthermore, the solution of equation (13) is equation (14):
2.3 Data sources
The data were obtained from the China Statistical Yearbook, China Rural Statistical Yearbook, China Animal Husbandry and Veterinary Statistics Yearbook, China Provincial Statistical Yearbooks and the website: https://data.cnki.net/. All the data are time series data from 2005 to 2020. In this study, we referred to Sun et al. (2019) for the division of China’s four regions.1
3 Results
3.1 Comprehensive evaluation results of the LS, RC, and RECC
In this study, the entropy method was first used to calculate the comprehensive scores for LS, RC and RECC from 2005 to 2020 as a way to understand the development of each system. The scores for each system are shown in Figure 1.
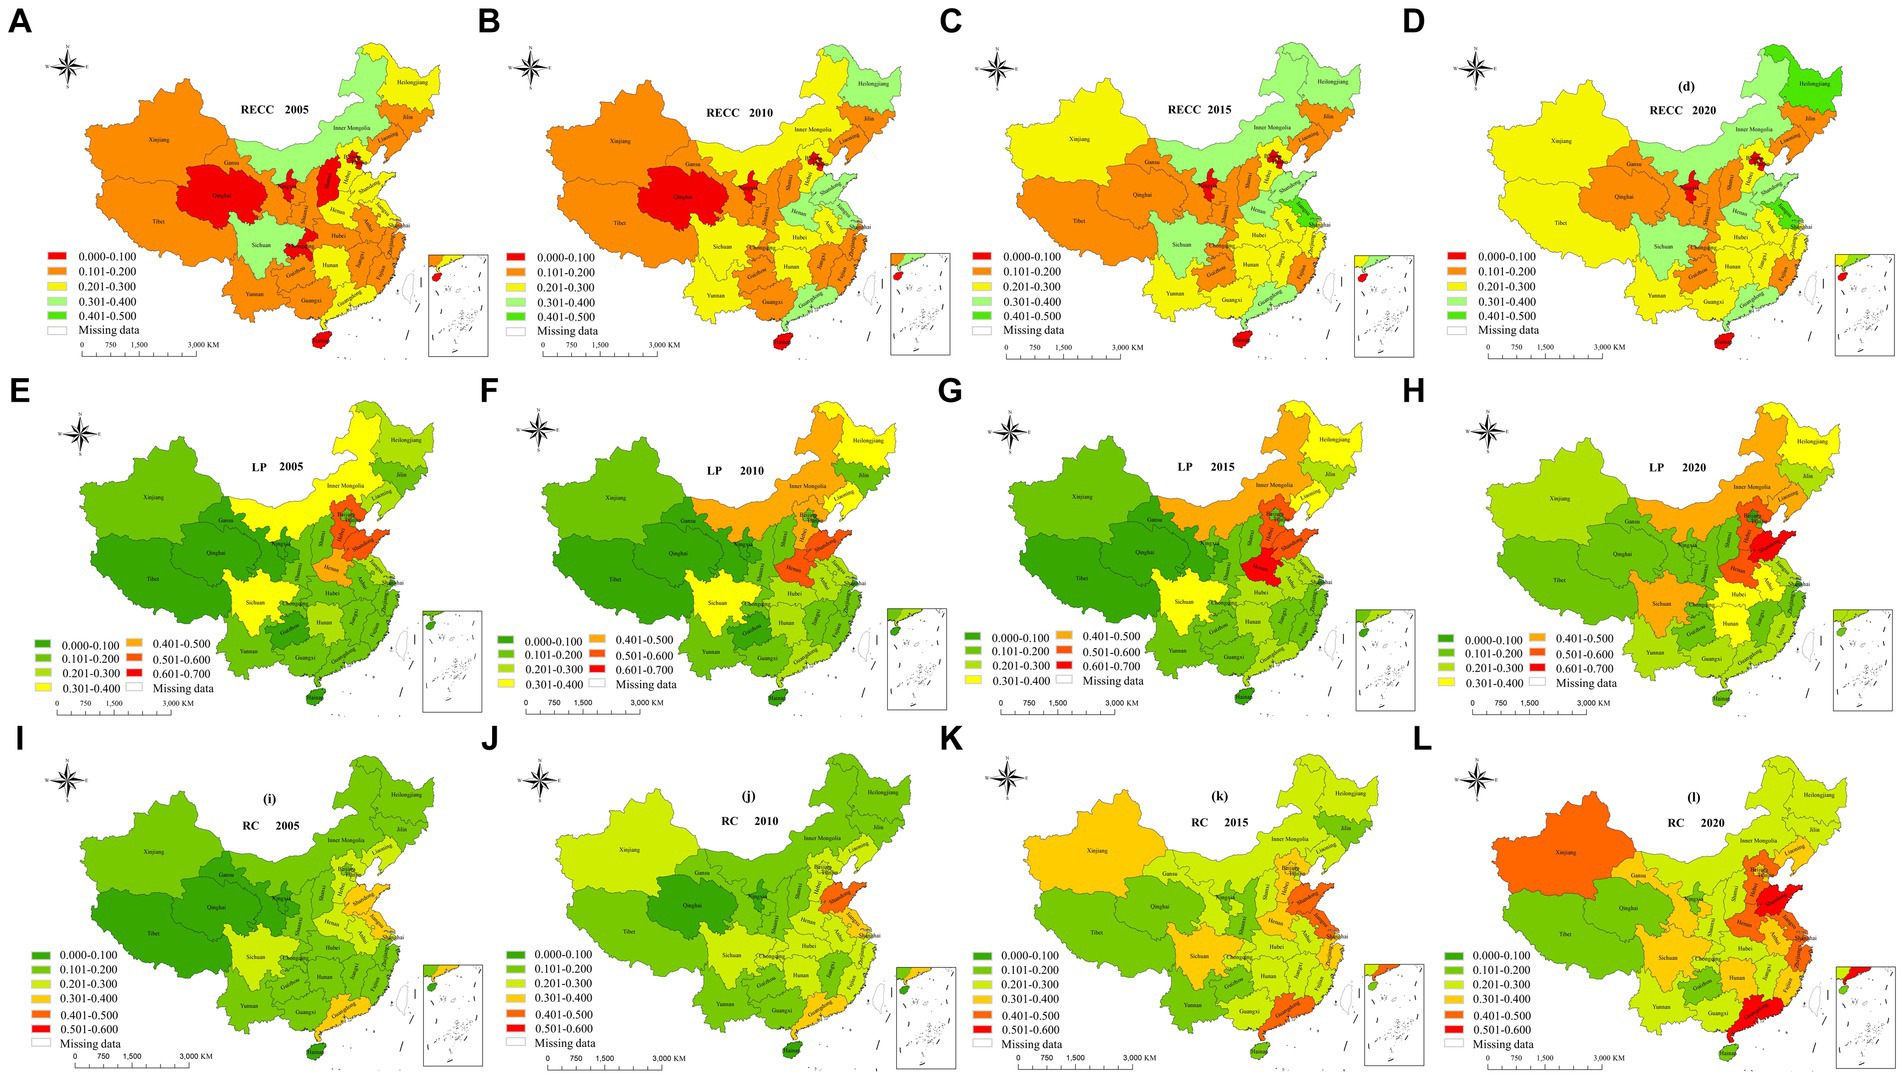
Figure 1. The spatial patterns of RECC, LP, and RC in China from 2005 to 2020. (A–L) stands for the order of the pictures, which is explained in the text.
Resource and environmental carrying capacity (RECC). Figures 1A–D, show that the RECC in China’s provinces increased from 2005 to 2020. This result is similar to the findings of Liao et al. (2020). However, unlike Li et al. (2022), who studied the RECC at the national level, our study focused on 31 provinces in mainland China. This approach can be used to analyze the spatial and temporal trends of China’s RECC more effectively. Specifically, in 2005, except for Sichuan and Inner Mongolia, the RECCs of all the provinces in China were relatively low (<0.3). With the rapid development of China’s economy and policy support, the RECC levels of Chinese provinces improved comprehensively; those of Henan, Shandong, Jiangsu, Guangdong, and Heilongjiang exhibited the most obvious increase. Jiangsu and Heilongjiang reached 0.4–0.5 in 2015 and 2020, respectively, and had the highest provincial RECC levels in China. Guangdong, Jiangsu and Shandong are coastal cities and the best economically developed provinces in China. A good economy ensures that these areas have sufficient funds to improve the environment. However, Beijing, Tianjin, Ningxia, and Hainan had the weakest RECCs, with no significant improvement between 2005 and 2020. Ningxia, located in western China, is characterized by arid and semiarid regions, and its severe environment leads to a relatively weak resource carrying capacity. Moreover, although western China’s RECC has improved, it was still at a low level (0.1–0.2). Beijing and Tianjin are economically developed cities in China. However, the high level of urbanization and large population consumes a large amount of resources, which is a massive challenge for RECC. Overall, improvements of in factors such as the scale of agriculture, water resources, infrastructure and pollution treatment capacity have greatly contributed to the RECC. However, some regions are weak due to differences in economic levels, resource reserves, and pollution treatment among provinces (Liao et al., 2020; Tan et al., 2022).
Livestock production (LP) (Figures 1E–H). From 2005 to 2020, the spatial and temporal characteristics of China’s livestock production changed significantly. In 2005, the regions with higher-intensity livestock production were concentrated in Shandong, Henan, Hebei, Sichuan, and Inner Mongolia, all with livestock production intensities above 0.3. In 2010, livestock production intensity increased significantly in Heilongjiang, Liaoning, and Inner Mongolia, reaching 0.351, 0.353, and 0.457, respectively. In 2020, the intensity of livestock production in the western regions of Yunnan, Sichuan, and Xinjiang, central regions of Anhui, Hubei, and Hunan, and northeastern region of Liaoning further increased, especially in Sichuan and Liaoning, which had livestock production values of 0.430 and 0.442, respectively. These regions have good conditions for livestock development, such as fertile grasslands, agricultural land, and water resources; their excellent resource endowments have led livestock development policy to gradually tilt toward the western and northeastern regions. China’s 14th Five-Year Plan for Agriculture also identifies the western and northeastern regions as the main livestock production areas. By producing high-resolution maps of livestock production in China, Cheng et al. (2023) found that the intensity of livestock production in China is increasing, especially in Northwest China and in rural areas, and while this growth contributes to reducing hunger and poverty, it may increase pressure on cleaner production.
Residential consumption (RC). Figures 1I–L shows the evolution characteristics of the spatial distribution of livestock product consumption by residents in China from 2005 to 2020. In 2005, the highest livestock product consumption levels occurred mainly in Shandong, Jiangsu and Guangdong, within a range of 0.3 to 0.4. In 2010, Shandong had the highest livestock product consumption level (0.402); furthermore, the consumption level in the central and eastern regions, such as Hubei, Hunan, Anhui, Zhejiang, and Fujian, increased to above 0.2. In 2015, the livestock product consumption levels in the eastern and central regions rose to above 0.2, with Beijing, Henan, Hebei, Zhejiang, Shandong, Jiangsu, and Guangdong reaching levels above 0.3. In 2020, the livestock product consumption level in the eastern region further increased, especially in Shandong and Guangdong, which had the highest levels in China. In the western and northeastern regions, only Xinjiang reached a livestock product consumption level of 0.4–0.5. In fact, the eastern region, as China’s pioneer in opening up to the outside world, has enormous economic development advantages (Zhang Y. et al., 2022). Rapid economic development has attracted a larger population and increased residential consumption levels (Zhang Z. et al., 2022). The results of our study also reinforce this social phenomenon.
3.2 Spatial–temporal characteristics of the CCDs of the LRRE in China
As shown in Figure 2, the CCDs of the LRRE in 31 provinces of China increased from 2005 to 2020; however, only a few provinces reached an intermediate coordination level (0.6–0.8) in 2020, and most provinces exhibited basic coordination (0.4–0.6). This situation indicates that there is still potential for further coordinated development of LRRE in China. Among them, Ningxia, Xinjiang, and Gansu had the highest annual average growth rates, reaching 2.14, 2.37, and 2.46%, respectively. Shandong, Tibet, Sichuan, Shanxi, and Jilin Provinces had average annual growth rates of less than 1%. The CCDs of the LRRE reached an intermediate coordination level in major livestock production provinces such as Shandong, Henan, Hebei, Sichuan, and Heilongjiang. These provinces have relatively excellent resource endowments but still have not reached a high coordination level, primarily because although the RECCs of these regions are constantly improving, the production intensity of livestock products and the consumption level of residents are rising faster. Hainan, Tibet, Qinghai, and Ningxia have always had a low coordination level. All these provinces are situated in the western region; furthermore, Tibet, Qinghai, and Ningxia are characterized by high-quality pastoral areas in China, sparse populations, and poor resource endowments, which lead to relatively low CCDs.
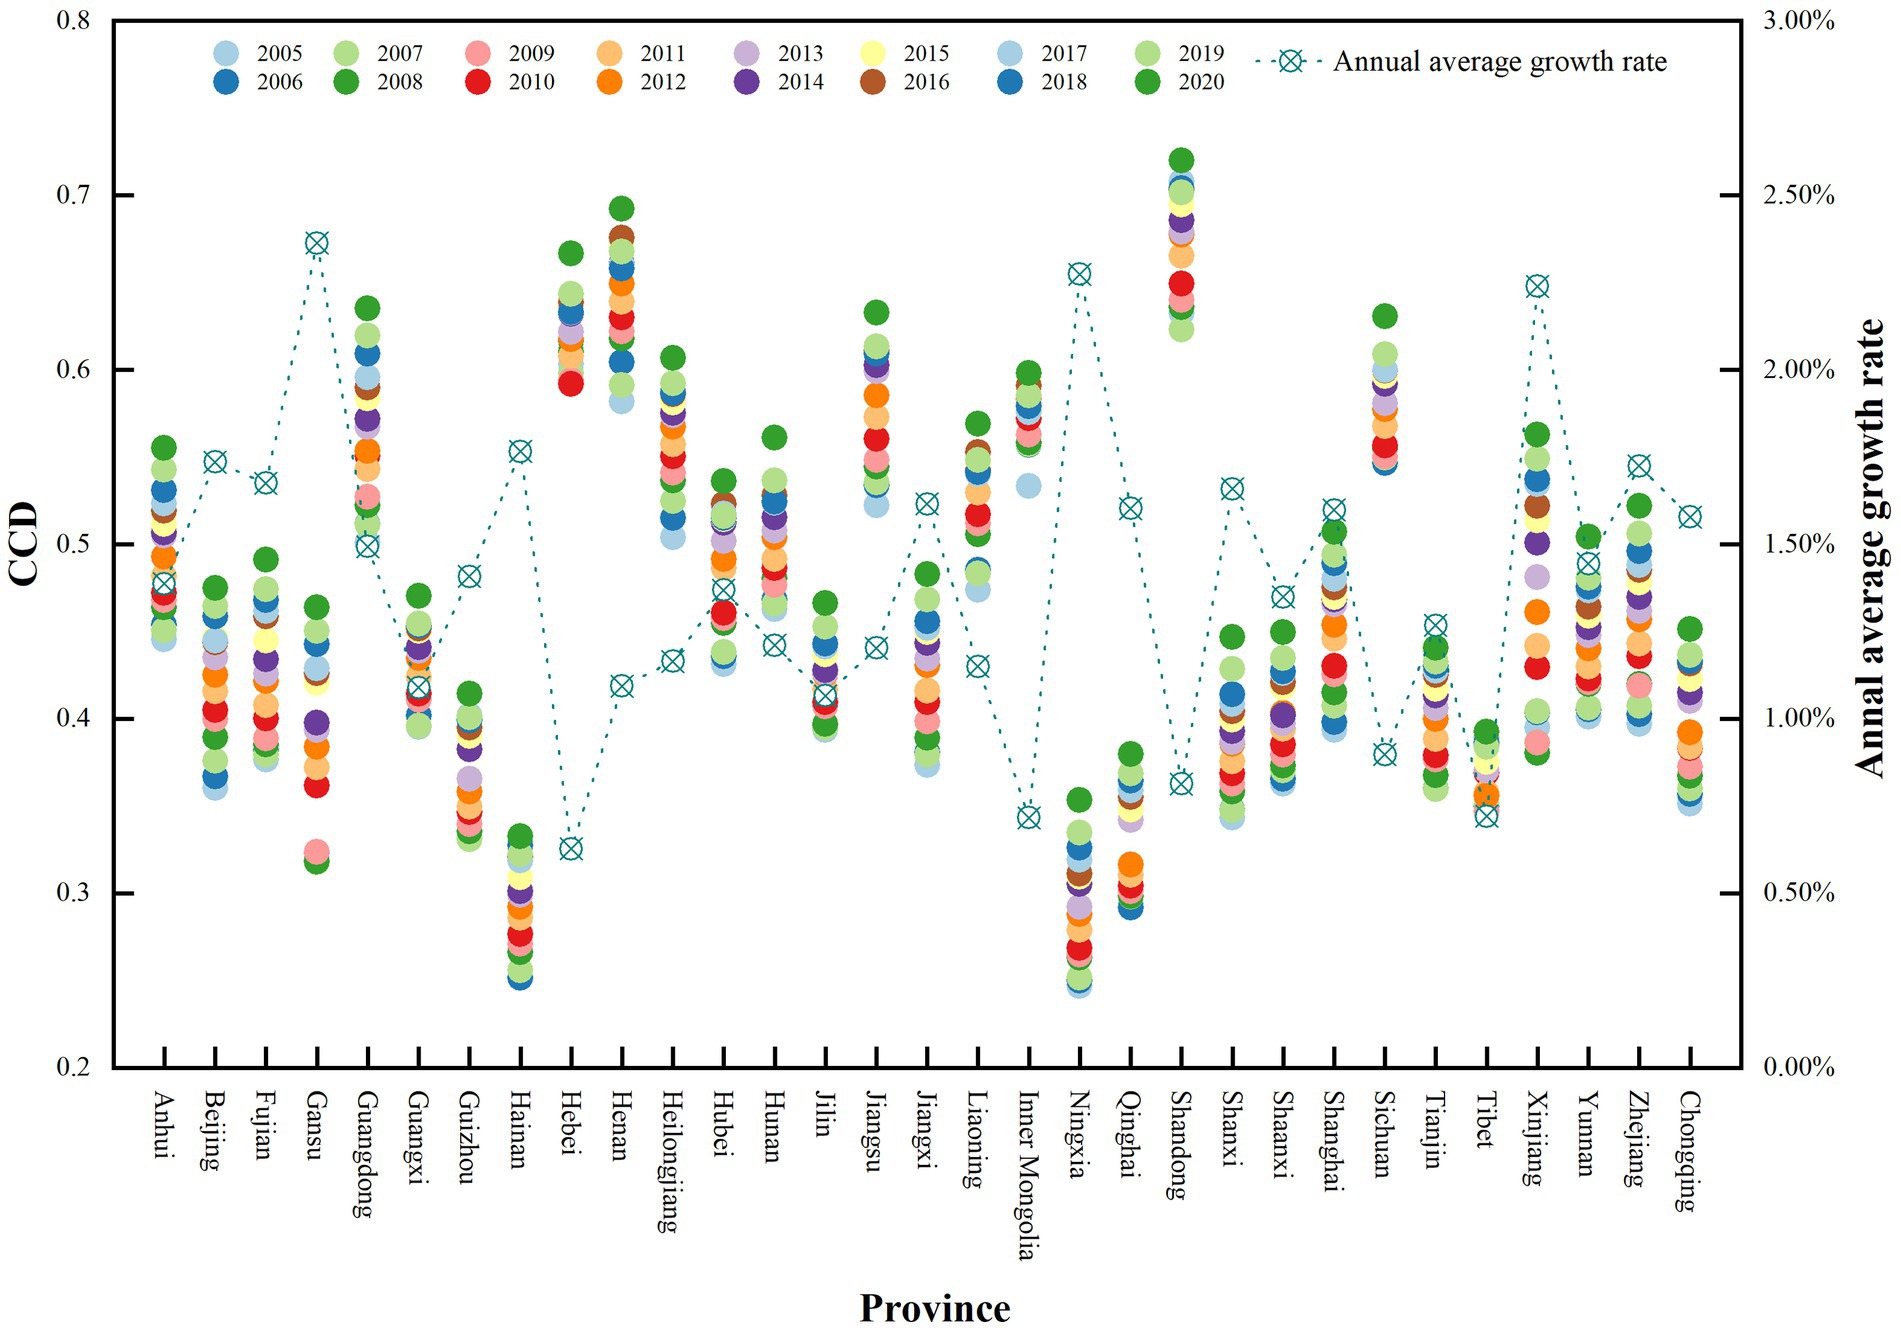
Figure 2. CCDs of the LRRE in China from 2005 to 2020.
As shown in Figure 3, the spatial distribution characteristics reveal relatively high CCDs in the central, eastern and northeastern regions and relatively low CCDs in the western region. Specifically, only Hebei and Shandong reached an intermediate coordination level in 2005, and the surrounding areas were mostly between the basic coordination and low coordination level. No province was at the dissonance coordination levels. In 2010, Henan Province increased from a basic coordination level to an intermediate coordination level, and coastal regions essentially reached a basic coordinate level. Jiangsu reached the intermediate coordination level in 2015, as did Heilongjiang, Sichuan, and Guangdong in 2020. From 2005 to 2020, except for Tibet, Qinghai, Ningxia, and Hainan in the western region, all the provinces achieved a basic coordination level. This shows that the development of China’s livestock industry has not been at the expense of the environment in relation to increases in the consumption levels of residents; rather, the relationships among production, consumption, and resources and the environment has continued to shift toward coordinated development (Fan et al., 2020). However, at the same time, the coordinated development level of LRRE in some provinces in China, such as Beijing, Tianjin, Ningxia, Qinghai, and Tibet, remains at a low coordinated level. These areas should pay attention to matching multidimensional systems such as livestock production, resources and the environment, and residential consumption. Any system that develops more slowly than others may negatively impact residents’ welfare and social economy.
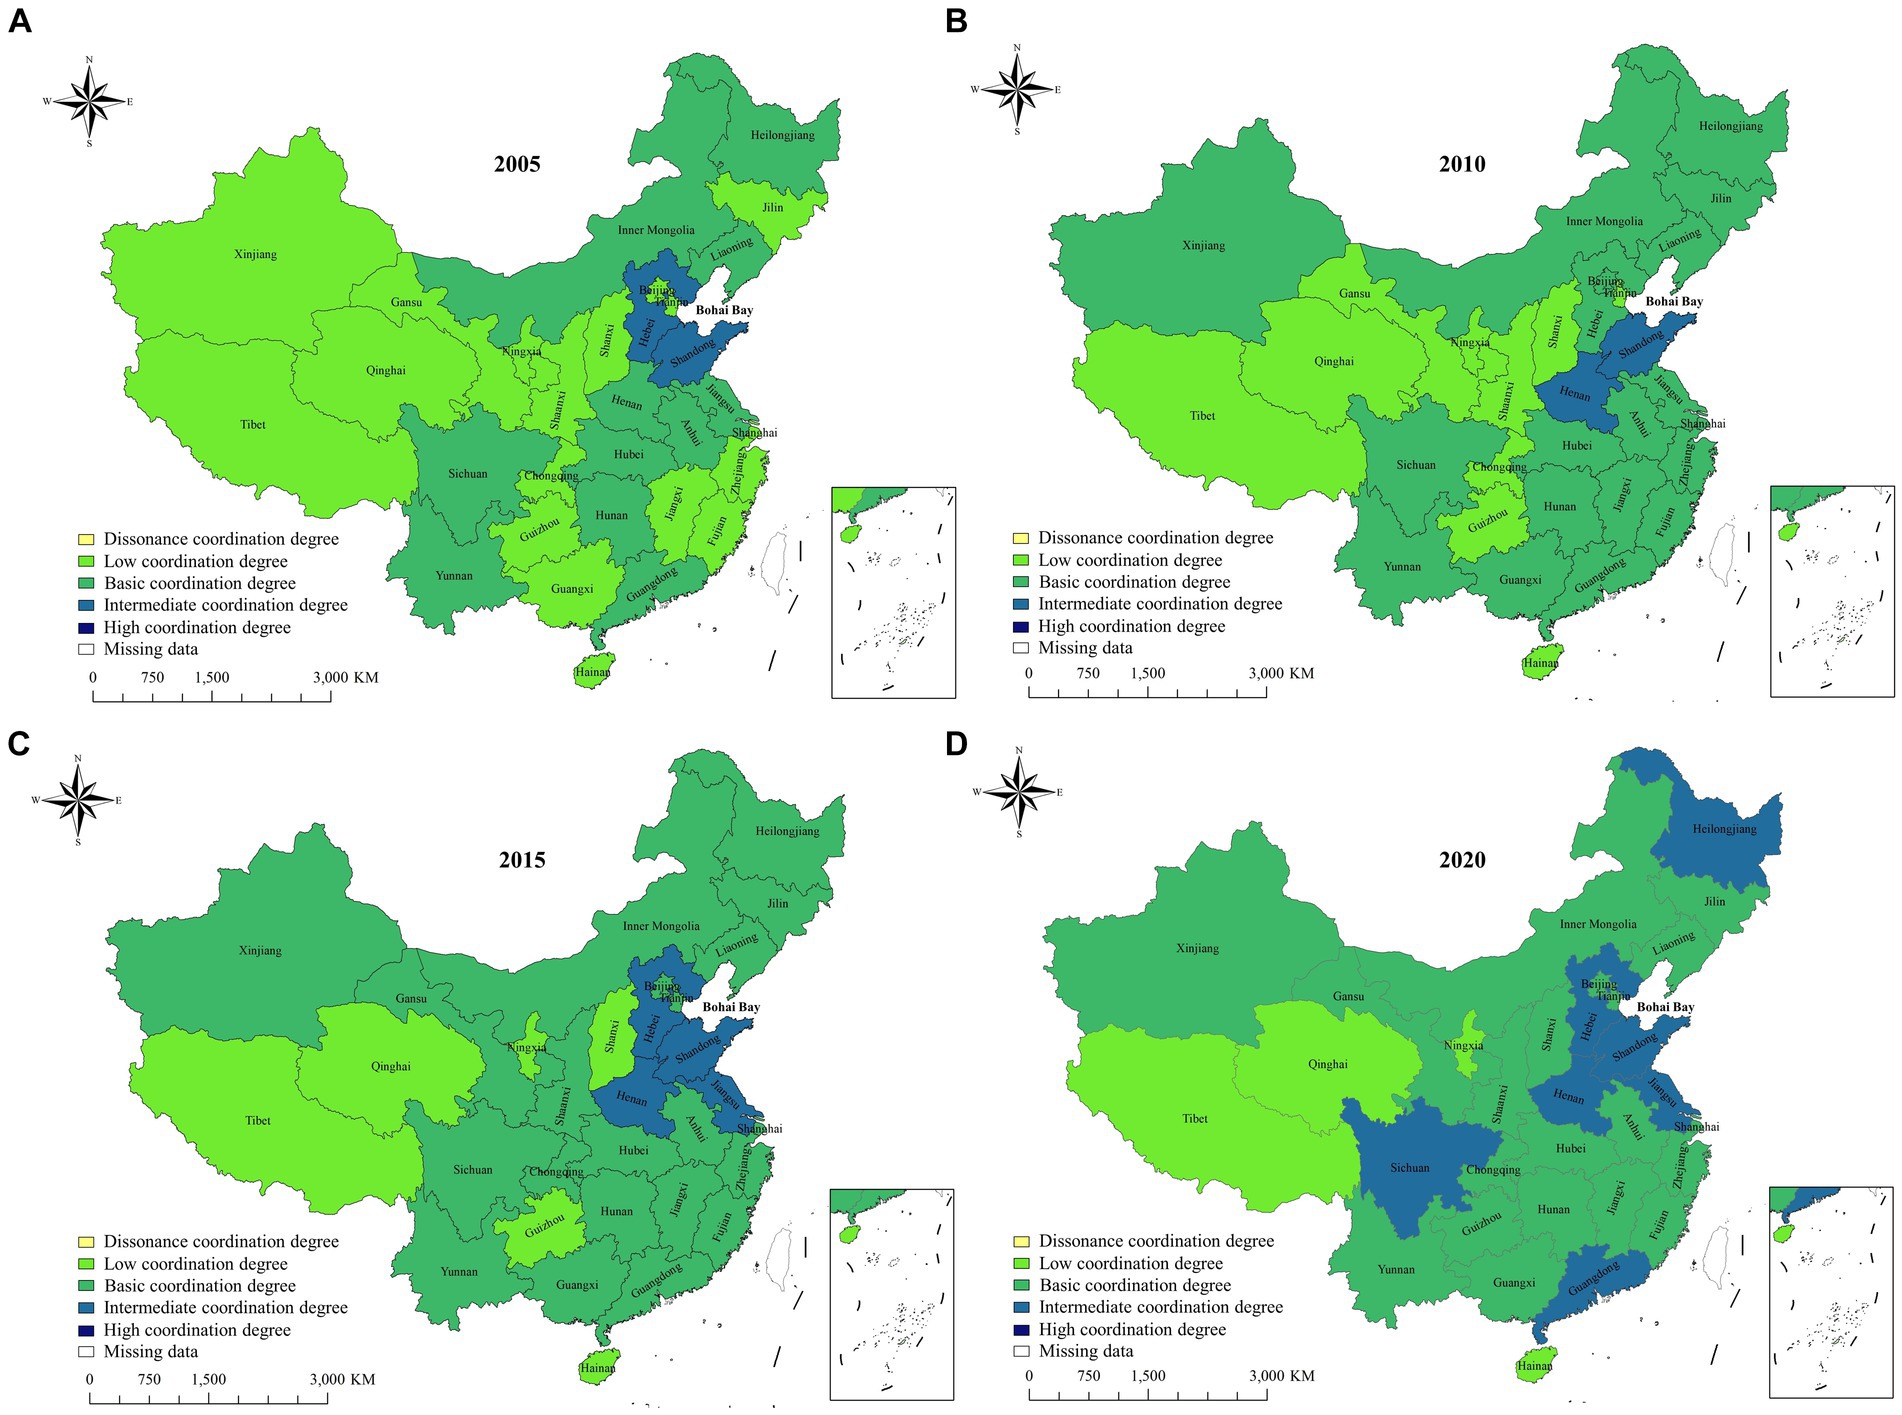
Figure 3. Spatial distribution of the CCDs of the LRRE in China.
3.3 Spatial autocorrelation analysis of the CCDs
Table 3 presents the global spatial autocorrelation results for the CCD of the LRRE. The results showed that the global Moran’s I was positive and significant (p < 0.1), indicating that the spatial distribution of the CCDs of the LRRE in China was positively correlated and significantly clustered. Furthermore, Figure 4 shows the local spatial clustering characteristics of the LRRE in 2005, 2010, 2015, and 2020 in 31 Chinese provinces, with a significance level less than 10%. The main aggregation regions were located in the eastern, central, northeastern, and some western regions of China. Specifically, the high-high (H-H) aggregation areas were mainly distributed in the northeastern, eastern, and central regions. In particular, Hunan, Jiangxi, and Fujian changed from low-high (L-H) aggregation to H-H aggregation, indicating that the influence of these three provinces on the surrounding areas became positive. The L-H aggregation regions were mainly concentrated in the junction regions of the central and western provinces, such as Shanxi, Shaanxi, Ningxia, Gansu, Chongqing and Guizhou Provinces, indicating that the CCDs in these provinces were lower than that in the surrounding areas. These regions are on the Loess Plateau and have a relatively harsh ecological environment (Li J. et al., 2021; Li Q. et al., 2021), which should be noted by the Chinese government. Moreover, we found that the H-H aggregation in Jilin shifted to L-H aggregation from 2005 to 2010, indicating that the CCD in Jilin decreased compared to that in the surrounding areas. The possible reasons for this phenomenon were that the intensity of livestock production and consumption level in Jilin Province increased; however, the RECC did not simultaneously increase.
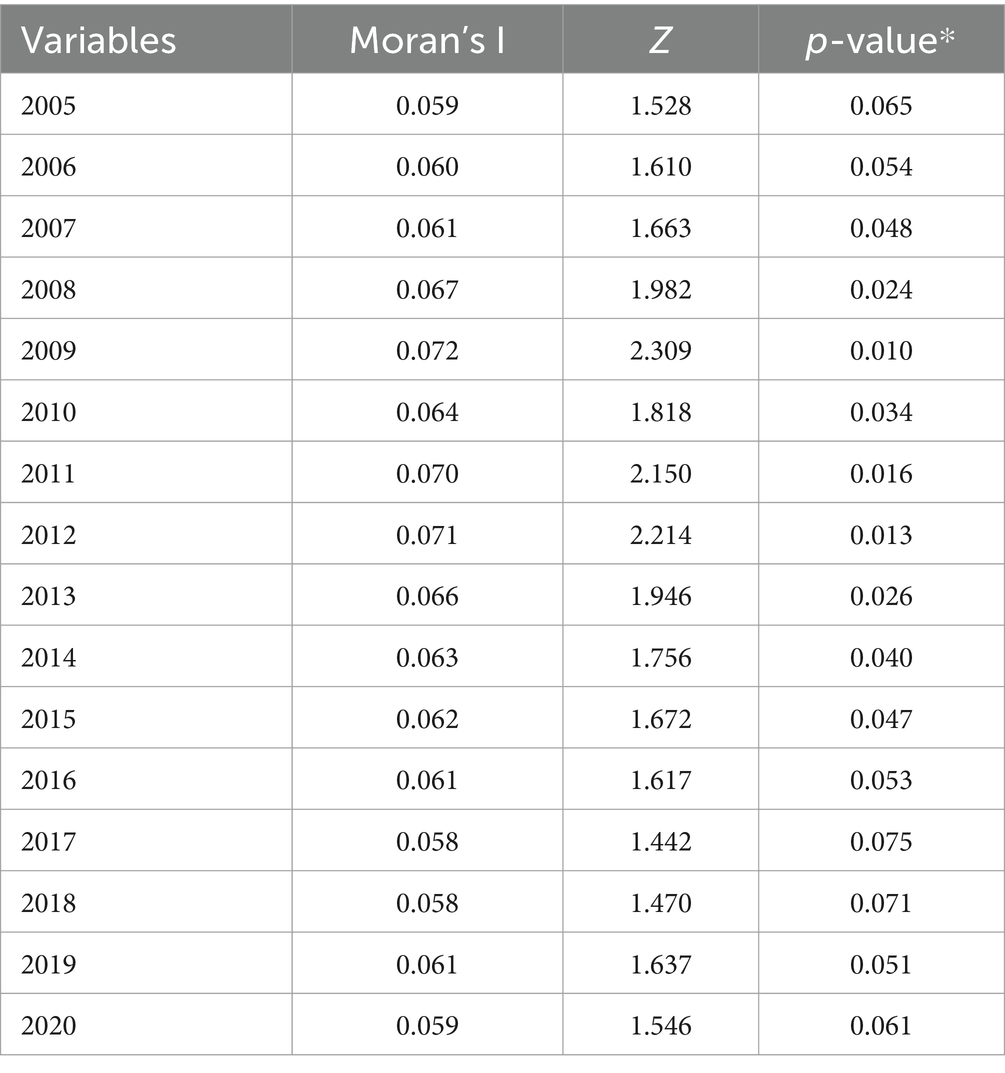
Table 3. Global Moran’s index of CCD in China from 2005 to 2020.
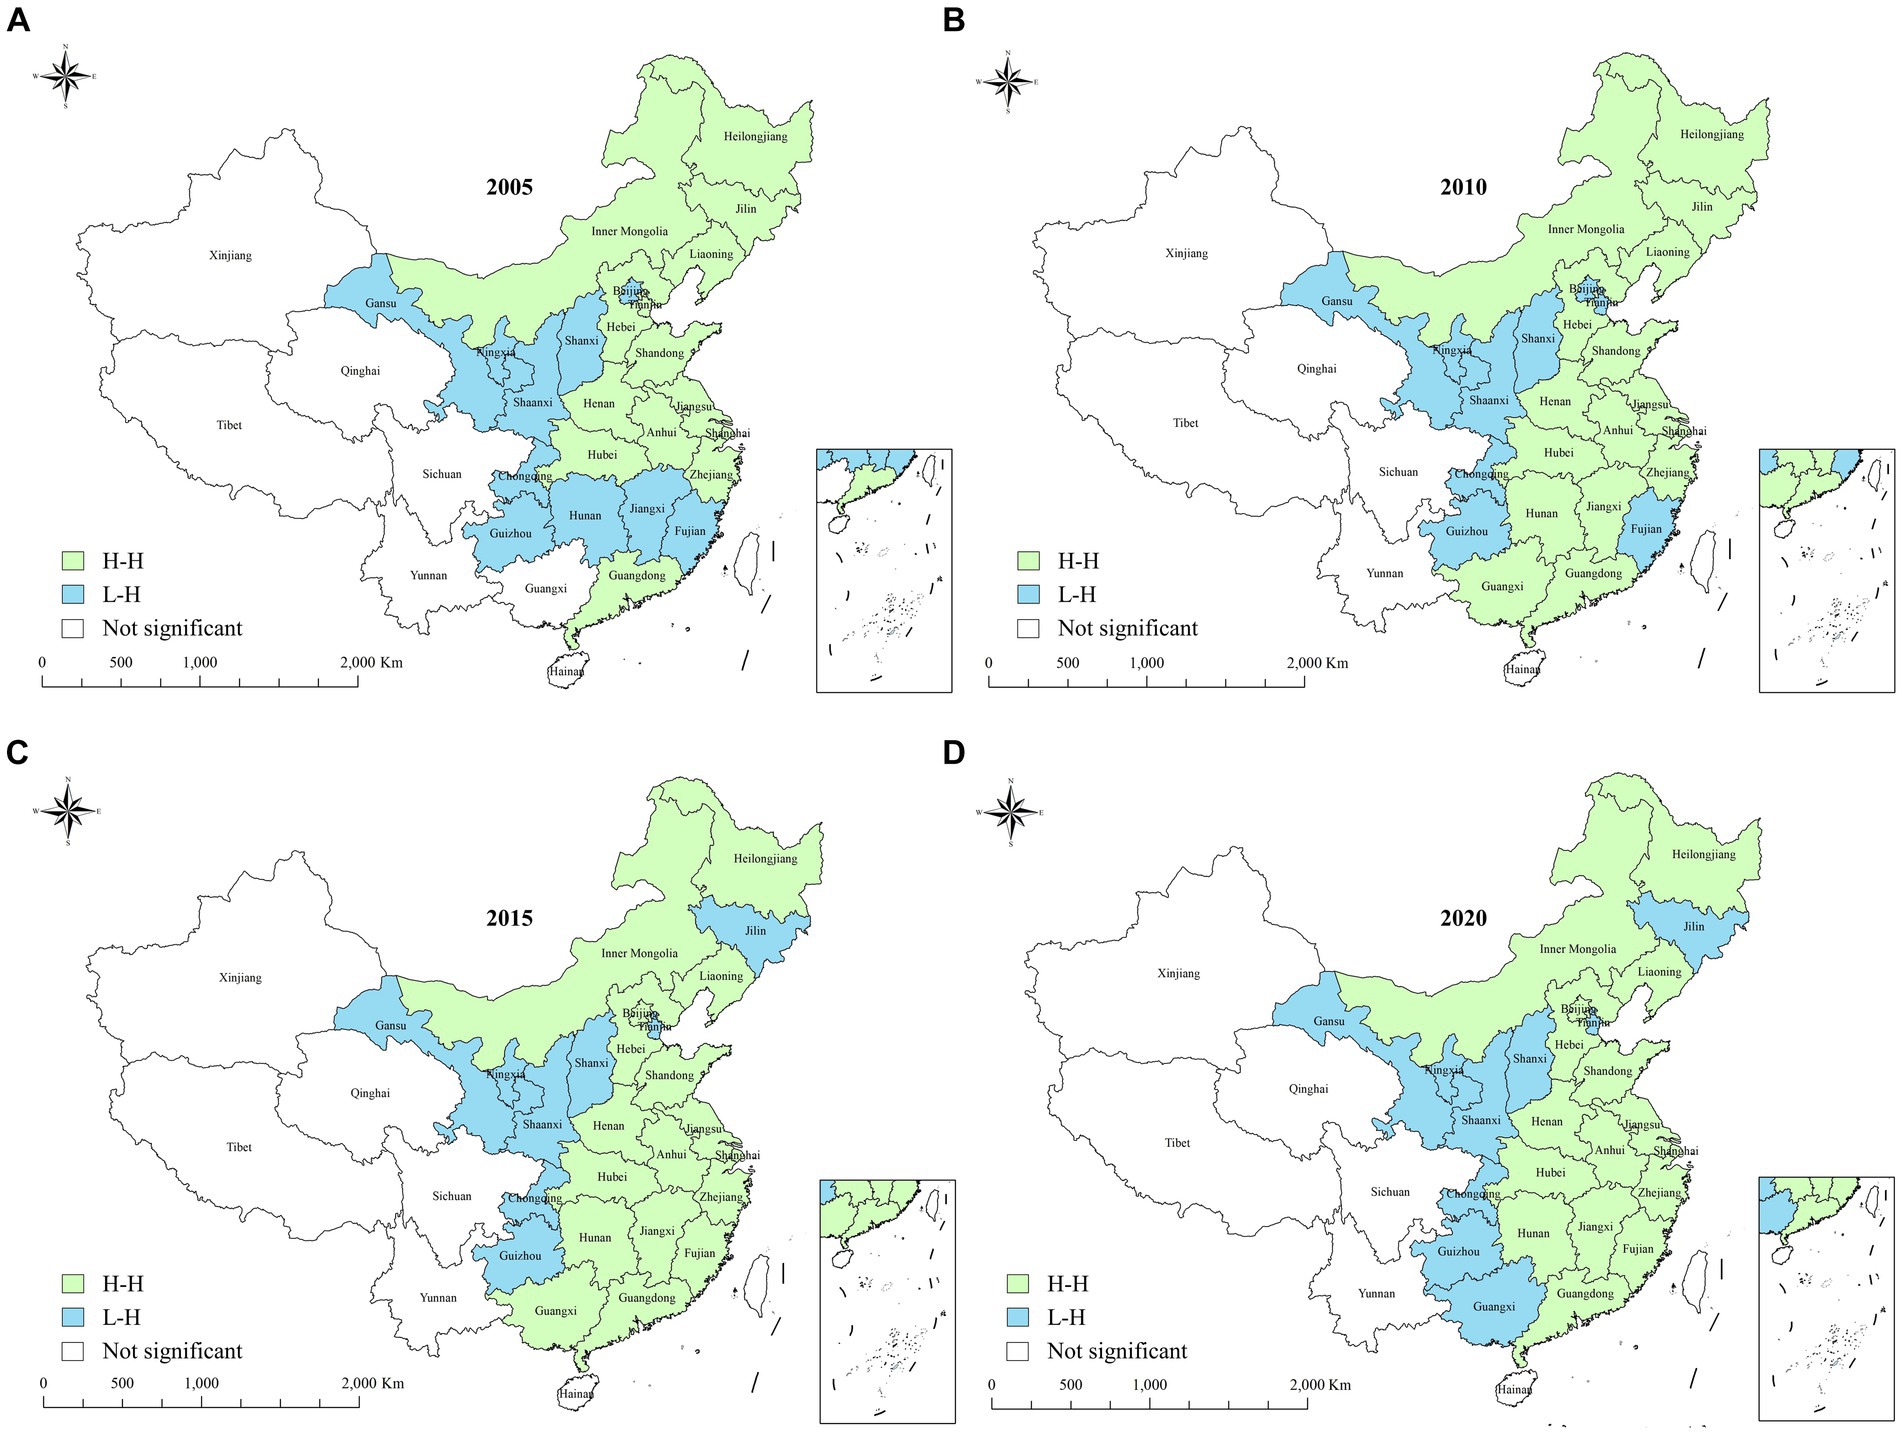
Figure 4. Local spatial autocorrelation results of the CCDs of the LRRE in China from 2005 to 2020.
3.4 CCD prediction results
Predicting the coordinated development trend of LRRE in different regions of China can provide a valuable reference for policy makers. Figure 5 shows that the CCDs of all 31 Chinese provinces will increase from 2021 to 2030, and all provinces will be at a level of basic coordination. From 2021 to 2030, Gansu, Anhui, Hubei, Hunan, Liaoning, Xinjiang, and Zhejiang will transition from a basic coordination level to an intermediate coordination level. In 2030, Fujian (0.592) and Shanghai (0.597) will reach an intermediate coordination level, and Henan (0.752), Xinjiang (0.766), and Shandong (0.799) will reach a high coordination level. Although Ningxia, Qinghai, Tibet, and Guizhou Provinces will reach a basic coordination level in 2030, the CCD levels in these regions will still be lower (less than 0.5), suggesting more potential for improvement. These prediction results indicate that the low level of coordinated development of LRRE in western China may struggle to change in the short term. The level of coordinated LRRE development in the developed eastern region is increasing. Therefore, in the future, China’s livestock industry should appropriately adjust its spatial layout, reduce the expansion rate of the livestock industry in the western region, and improve the ecological environment in the areas bordering the western and central regions (arid and semiarid regions).
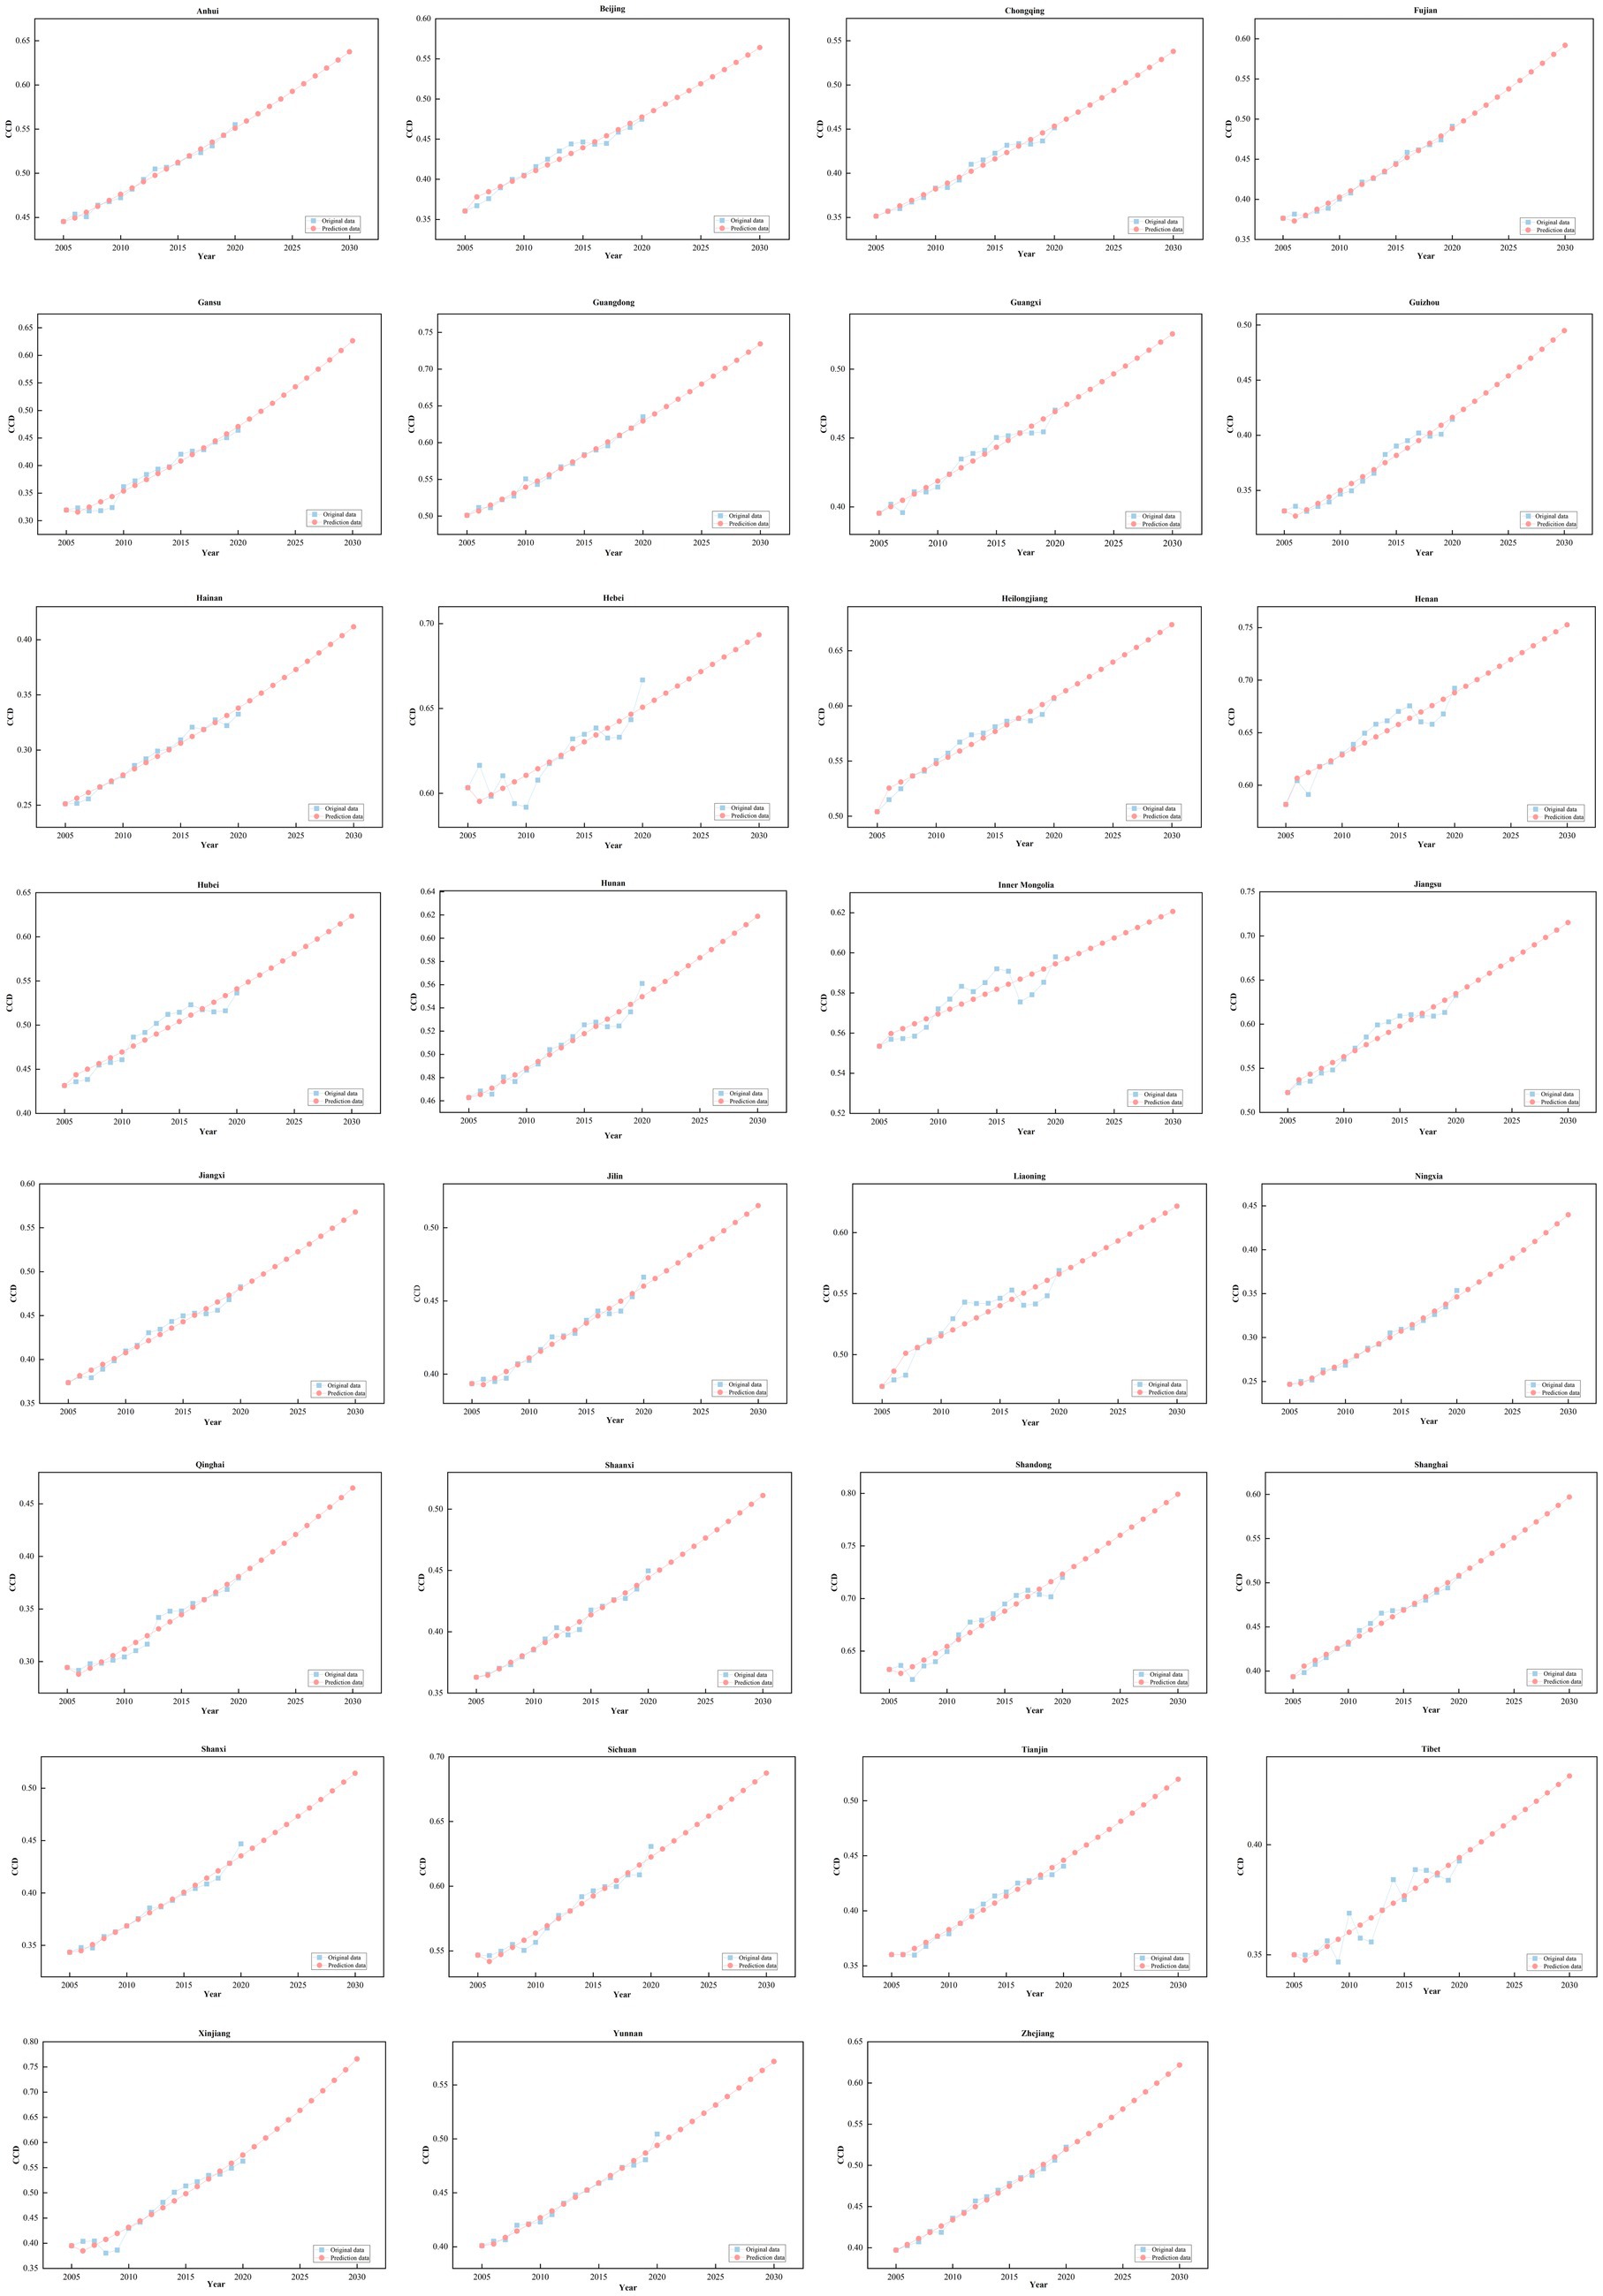
Figure 5. CCDs prediction results in China from 2021 to 2030.
4 Discussion
A scientific evaluation of the status of sustainable development in the livestock sector has importance for most developing countries, as it relates to stable food supplies and ecological environment improvements. Several researchers have endeavored to explore the environmental catastrophes caused by livestock farming, but additional research is needed to determine how livestock farming can be sustainable. The development of the livestock industry is strongly related to resources, the environment and resident consumption levels, and we have made efforts to analyze the development of these factors via scientific methods and comprehensive data. A modeling assessment of the sustainable development of China’s livestock sector is necessary because China is the largest producer and consumer of meat worldwide, and subject to pollution caused by the livestock industry. Therefore, we selected China as an example to explore the relationships among LP, RC, and the RECC; these relationships can provide useful information for the sustainable development of the livestock industry in China and other major agricultural countries.
The spatial and temporal characteristics of each subsystem of the LRRE in China are obviously different. In particular, there are significant spatial differences between the production and consumption of livestock products. Livestock production is concentrated mainly in the central region and Shandong; however, the intensity of livestock production is increasing in the western and northeastern regions. The consumption of livestock products occurs mainly in economically developed and densely populated areas (eastern and part of central China). This finding is similar to the findings of Yang et al. (2022), who reported that large quantities of meat are consumed in the central and eastern regions of China, where the population is concentrated, though livestock farming in the western pastoral areas is also expanding due to the rising demand for meat. As the economy grows, the demand for meat will continue to rise, placing more environmental pressure on the areas with concentrated livestock production (Sun et al., 2021). Fortunately, the overall RECC level in China is increasing providing a high level of ecological security for livestock production. However, the Chinese government should also focus on some western regions (Qinghai, Ningxia, and Gansu) where the RECC level is still low and not conducive to the green development of the livestock industry.
Overall, the CCDs of the LRRE in China’s provinces increased from 2005 to 2020, indicating that China’s livestock industry is transforming to green development. However, notably, whether the western region can continue to sustain the continuous growth of consumption demand for livestock products is a key issue. The CCDs of Qinghai, Tibet, and Ningxia have not significantly improved over the past decade. The results of the spatial autocorrelation test and prediction also reveal that the western provinces exhibit obvious L-H aggregation characteristics; Tibet, Gansu, Ningxia and Guizhou will have the lowest CCDs in China in 2030. These findings indicate that the ability of western China to sustain expansions in the scale of the livestock industry is both a present and future concern. In fact, the Chinese government proposed ecological civilization construction as early as 2012; this concept requires improving the ecological environment by adjusting the industrial layout and investment in environmental management (He et al., 2023). Furthermore, the pattern of China’s livestock production has changed. The scale of livestock production in the eastern and southern water network areas has been continuously reduced, and the ecological environment has improved (Zheng et al., 2021). However, despite the decrease in the scale of livestock in the eastern and southern regions, the increase in consumer demand has led to the need to expand livestock production in other regions of China. In addition, western China has a large amount of pasture and land, which is conducive to expanding livestock production (Klotzbucher, 2009). However, this scenario has exacerbated ecological degradation in western China (Briske et al., 2015). Several studies have shown that the soil and pastures in western China have been severely damaged by the continued expansion of grazing (Dong et al., 2020; He et al., 2023). In fact, the Chinese government has advocated using the production method of “grazing prohibition, resting grazing and rotational grazing” to reduce the ecological impact of grazing, but this method is not conducive to the livelihoods of herders and does not support the growing consumer demand for meat (Harris, 2010). Currently, the Chinese government urgently needs to re-examine the pattern of livestock production and implement measures to improve the RECC in western China (Shang et al., 2014).
As population size and affability continue to increase, the global demand for meat consumption continues to rise, resulting in more serious environmental problems. Livestock production requires large amounts of water, grassland, and forage crops; meat production is also a major source of GHG emissions. In some developed countries, the demand for meat consumption is high. However, the layout of the livestock industry is coordinated with residents’ dietary habits and resource endowments, so the livestock industry has not caused severe damage to the environment, as in the United States (Tonsor and Lusk, 2022). The sustainable development of the livestock sector is also strongly related to national economic transformation policy. Australia has one of the highest rates of meat consumption worldwide’ (Ford et al., 2023). To avoid the adverse impact of the large-scale livestock industry on the environment, the Australian government requested residents to reduce excessive meat consumption and improve the agricultural production environment, which ultimately reduced the environmental pressure caused by the livestock industry (Sievert et al., 2022). Developing countries are experiencing rapid population and economic growth; thus, the consumption of meat and the scale of animal rearing are expanding, which creates challenges for environmental sustainability (Alobo Loison and Hillbom, 2020; Ronaghi and Ronaghi, 2021). Therefore, promoting the coordinated development of LRRE is an essential condition for agricultural transformation in developing countries (Benson and Mugarura, 2013).
5 Conclusion and policy implications
5.1 Research conclusion
With the growth of the economy, residential demand for meat is increasing, which in turn stimulates the expansion of the livestock industry; however, overfarming can harm the environment. Therefore, promoting the coordinated development of LRRE systems has become the key to sustainable development. This study established an analytical framework for the coupling coordination development of the LRRE. The SAM and GM (1.1) were used to analyze the spatial correlation and future trends of the CCD of the LRRE systems. This analysis strategy can help policy makers understand the development pattern of China’s LRRE system while providing effective evidence for optimizing the layout of China’s livestock sector. The main conclusions of this study are as follows.
(1) From 2005 to 2020, the levels of China’s LP, RC, and RECC increased. However, there were great differences in the spatial distributions of LP, RC, and RECC in China. The highest intensities of livestock production were concentrated in Shandong, Henan, Hebei, Inner Mongolia, and Sichuan and then shifted to the central, western and northeastern regions. The consumption of livestock products occurred mainly in the eastern coastal areas of China. In comparison to the other provinces, Jiangsu, Heilongjiang, Shandong, Guangdong, Sichuan, and Inner Mongolia had higher RECCs. (2) The CCDs of the LRRE continued to increase in 31 Chinese provinces from 2005 to 2020, with relatively high levels in the central, eastern and northeastern regions and relatively low levels in the western region. (3) The spatial autocorrelation analysis confirmed that the high-high (H-H) aggregation areas were mainly distributed in the northeastern, eastern, and central regions, while low-high (L-H) agglomeration was distributed in the western region. (4) According to the prediction results, the CCDs of the LRRE in 31 Chinese provinces will increase to different degrees from 2021 to 2030, and all provinces will reach the basic coordination level. However, most of the western regions will barely reach the basic coordination level. This result indicates that the low level of LRRE development in western China may be difficult to change in the short term.
5.2 Policy implications
Based on these conclusions, we propose the following policy recommendations.
(1) The Chinese government needs to consider and address the trend of expanding livestock farming in the western and northeastern regions, as well as the still high-intensity livestock production levels in some southern water network areas, such as Anhui, Hunan, and Hubei. The government should adjust its environmental protection policy to reduce ecological and environmental pressure in southern water network areas. Moreover, because Beijing, Tianjin, Ningxia, and Hainan had the weakest RECCs, these areas should reduce the intensity of their livestock production and increase their areas of forests and vegetation. (2) The consumption of livestock products occurs in China’s coastal areas, so large and standardized farms should be appropriately built in these areas to supply residents with primary meat foods to alleviate ecological pressure in other areas. Sustainably guiding people’s food consumption and encouraging them to eat poultry and eggs instead of beef or mutton will help reduce the consumption of water and food and reduce the risk of soil degradation. The proportion of meat food imports can be appropriately increased to meet the residential demand for meat food consumption. (3) The CCDs of the LRRE are low in the central and western junction regions, such as Shanxi, Shaanxi, Ningxia, Chongqing, and Guizhou. The Chinese government needs to focus on these areas and provide support. In addition, these areas need to develop cleaner production techniques, protect pastures and vegetation, and improve their RECCs. (4) The eastern and central regions have higher overall CCDs and are in the H-H aggregation area. These regions should take full advantage and of their situation while providing technology and capital to the western region to improve the green development capacity of their livestock industry. The western region is the main production area for beef, mutton, and milk in China. According to the 14th Five-Year Plan for China’s livestock development (MARD, 2021), the western region is likely to further expand its farming scale in the future. However, to protect the environment, the green development capacity of its livestock industry needs to be improved in the western region, large-scale biogas engineering and power generation technology needs to be developed in the highland cold region, and a complete resource recycling system needs to be established to cope with the expanding trend of the livestock industry in the future.
6 Study limitations
The analytical results of this study can guide developing countries in the coupling coordination development of LP, RC and RECC, and help with developing effective measures for adjusting the spatial distribution of the livestock industry. However, this study has several limitations. First, due to the limitation of data availability, the evaluation index system of this study lacks relevant livestock production technology, such as information on the mechanization rate of the livestock industry, the level of digitalization, and the education level of workers; thus, the level of livestock development in some regions may be underestimated. In future research, technical evaluation systems for livestock production can be added, along with relevant technical standards. Second, although this study was based on 31 provinces in mainland China, many of China’s provinces have vast land areas, and the distribution of industrial development, population, climate, and resource conditions within each province varies greatly; therefore, examining the development of the LRRE in terms of provincial-level data may lead to rough generalizations. Therefore, in the future, if higher resolution maps or data can be accessed to analyze the development of LRRE, the layout of China’s livestock industry can be optimized. Finally, although this paper used an improved-CCDM, SAD, and GM, the rapid development of technology may permit future research to use a combination of multidisciplinary techniques such as management science and ecology to assess the environmental impacts and optimize the layout of the livestock industry more accurately.
Data availability statement
Publicly available datasets were analyzed in this study. This data can be found at: https://data.cnki.net/.
Author contributions
KZ: Conceptualization, Data curation, Formal analysis, Investigation, Methodology, Project administration, Resources, Software, Writing – original draft, Writing – review & editing. JW: Conceptualization, Formal analysis, Funding acquisition, Software, Writing – original draft. HL: Conceptualization, Data curation, Investigation, Methodology, Software, Writing – original draft. ZZ: Methodology, Formal analysis, Writing – original draft. HW: Supervision, Formal analysis, Project administration, Funding acquisition, Writing – review & editing. JL: Funding acquisition, Resources, Supervision, Writing – review & editing.
Funding
The author(s) declare financial support was received for the research, authorship, and/or publication of this article. This research was funded by the Sichuan Soft Science Research Program [grant no. 2022JDR0174] and [grant no. 22RKX0099].
Acknowledgments
The authors also thank the editors and reviewers for their suggestions.
Conflict of interest
The authors declare that the research was conducted in the absence of any commercial or financial relationships that could be construed as potential conflicts of interest.
Publisher’s note
All claims expressed in this article are solely those of the authors and do not necessarily represent those of their affiliated organizations, or those of the publisher, the editors and the reviewers. Any product that may be evaluated in this article, or claim that may be made by its manufacturer, is not guaranteed or endorsed by the publisher.
Supplementary material
The Supplementary material for this article can be found online at: https://www.frontiersin.org/articles/10.3389/fsufs.2024.1365076/full#supplementary-material
Abbreviations
CCD, Coupling coordination degree; LRRE, livestock production-residential consumption-resource and environment carrying capacity; H-H, high-high; L-H, low-high; LP, livestock production; RC, residential consumption; RECC, resource and environment carrying capacity.
Footnotes
1. ^Eastern region: Beijing, Tianjin, Hebei, Shandong, Shanghai, Jiangsu, Zhejiang, Fujian, Guangdong and Hainan; central region: Shanxi, Henan, Anhui, Jiangxi, Hubei and Hunan; western region: Guangxi, Chongqing, Sichuan, Guizhou, Yunnan, Shaanxi, Gansu, Qinghai, Ningxia, Inner Mongolia, Tibet and Xinjiang; and northeastern region: Liaoning, Jilin, and Heilongjiang.
References
Alobo Loison, S., and Hillbom, E. (2020). Regional evidence of smallholder-based growth in Zambia’s livestock sector. World Dev. Perspect. 19:100229. doi: 10.1016/j.wdp.2020.100229
Ariken, M., Zhang, F., Chan, N., and Kung, H. T. (2021). Coupling coordination analysis and spatio-temporal heterogeneity between urbanization and eco-environment along the silk road Economic Belt in China. Ecol. Indic. 121:107014. doi: 10.1016/j.ecolind.2020.107014
Bai, Z., Ma, W., Ma, L., Velthof, G. L., Wei, Z., Havlík, P., et al. (2018). China’s livestock transition: driving forces, impacts, and consequences. Sci. Adv. 4:eaar8534. doi: 10.1126/sciadv.aar8534
Benson, T., and Mugarura, S. (2013). Livestock development planning in Uganda: identification of areas of opportunity and challenge. Land Use Policy 35, 131–139. doi: 10.1016/j.landusepol.2013.05.013
Briske, D. D., Zhao, M., and Han, G. (2015). Strategies to alleviate poverty and grassland degradation in Inner Mongolia: intensification vs production efficiency of livestock systems. J. Environ. Manag. 152, 177–182. doi: 10.1016/j.jenvman.2014.07.036
Cao, Q., Kang, W., Xu, S., Sajid, M. J., and Cao, M. (2019). Estimation and decomposition analysis of carbon emissions from the entire production cycle for Chinese household consumption. J. Environ. Manag. 247, 525–537. doi: 10.1016/j.jenvman.2019.06.044
Chen, Y., Chen, A., and Zhang, D. (2022). Evaluation of resources and environmental carrying capacity and its spatial-temporal dynamic evolution: a case study in Shandong Province China. Sustain. Cities Soc. 82:103916. doi: 10.1016/j.scs.2022.103916
Cheng, M., Quan, J., Yin, J., Liu, X., Yuan, Z., and Ma, L. (2023). High-resolution maps of intensive and extensive livestock production in China. Res. Environ. and Sustain. 12:100104. doi: 10.1016/j.resenv.2022.100104
Cheung, C., and Ma, S. (2011). Coupling social solidarity and social harmony in Hong Kong. Soc. Indic. Res. 103, 145–167. doi: 10.1007/s11205-010-9702-8
Dai, D., Sun, M., Lv, X., Hu, J., Zhang, H., Xu, X., et al. (2022). Comprehensive assessment of the water environment carrying capacity based on the spatial system dynamics model, a case study of Yongding River basin in North China. J. Clean. Prod. 344:131137. doi: 10.1016/j.jclepro.2022.131137
Dong, S., Shang, Z., Gao, J., and Boone, R. B. (2020). Enhancing sustainability of grassland ecosystems through ecological restoration and grazing management in an era of climate change on Qinghai-Tibetan plateau. Agric. Ecosyst. Environ. 287:106684. doi: 10.1016/j.agee.2019.106684
Du, Y., Ge, Y., Ren, Y., Fan, X., Pan, K., Lin, L., et al. (2018). A global strategy to mitigate the environmental impact of China’s ruminant consumption boom. Nature Communications, 11. doi: 10.1038/s41467-018-06381-0
Ekwueme, B. N. (2022). Machine learning based prediction of urban flood susceptibility from selected Rivers in a tropical catchment area. Civil Eng. J. 8, 1857–1878. doi: 10.28991/CEJ-2022-08-09-08
Fan, Y., and Fang, C. (2020). Insight into carbon emissions related to residential consumption in Tibetan plateau–case study of Qinghai sustain. Cities Soc. 61:102310. doi: 10.1016/j.scs.2020.102310
Fan, W., Wang, H., Liu, Y., and Liu, H. (2020). Spatio-temporal variation of the coupling relationship between urbanization and air quality: a case study of Shandong Province. J. Clean. Prod. 272:122812. doi: 10.1016/j.jclepro.2020.122812
Ford, H., Zhang, Y., Gould, J., Danner, L., Bastian, S. E. P., Ford, R., et al. (2023). Applying regression tree analysis to explore willingness to reduce meat and adopt protein alternatives among Australia, China and the UK. Food Qual. Prefer. 112:105034. doi: 10.1016/j.foodqual.2023.105034
Gao, Q., Fang, C., Liu, H., and Zhang, L. (2021). Conjugate evaluation of sustainable carrying capacity of urban agglomeration and multi-scenario policy regulation. Sci. Total Environ. 785:147373. doi: 10.1016/j.scitotenv.2021.147373
Geng, Y., Wang, R., and Wei, Z. (2021). Temporal-spatial measurement and prediction between air environment and inbound tourism: case of China. J. Clean. Prod. 287:125486. doi: 10.1016/j.jclepro.2020.125486
Gerbecks, J., Baliatsas, C., Yzermans, C. J., Smit, L. A. M., Huss, A., Heederik, D. J. J., et al. (2020). Prevalence of non-specific health symptoms in livestock dense areas: looking beyond respiratory conditions. Int. J. Hyg. Environ. Health 230:113603. doi: 10.1016/j.ijheh.2020.113603
Guo, J., Qi, D. S., Zhang, N. Y., Sun, L. H., and Hu, R. J. (2017). Chinese greenhouse gas emissions from livestock: trend and predicted peak value. J. Agric. Environ. Sci. 36, 2106–2113.
Habib, A. M., and Mourad, N. (2023). The influence of environmental, social, and governance (ESG) practices on US firms’ performance: evidence from the coronavirus crisis. J. Knowl. Econ. doi: 10.1007/s13132-023-01278-w
Han, Z., Han, C., Shi, Z., Li, J., and Luo, E. (2023). Rebuilding the crop-livestock integration system in China ——based on the perspective of circular economy. J. Clean. Prod. 393:136347. doi: 10.1016/j.jclepro.2023.136347
Harris, R. B. (2010). Rangeland degradation on the Qinghai-Tibetan plateau: a review of the evidence of its magnitude and causes. J. Arid Environ. 74, 1–12. doi: 10.1016/j.jaridenv.2009.06.014
Hatfield, J. L., Antle, J., Garrett, K. A., Mader, T., Marshall, E., Nearing, M., et al. (2020). Indicators of climate change in agricultural systems. Clim. Chang. 163, 1719–1732. doi: 10.1007/s10584-018-2222-2
He, P., Baiocchi, G., Hubacek, K., Feng, K., and Yu, Y. (2018). The environmental impacts of rapidly changing diets and their nutritional quality in China. Nat. Sustain. 1, 122–127. doi: 10.1038/s41893-018-0035-y
He, F., Yang, J., Dong, S., Zhi, Y., Hao, X., Shen, H., et al. (2023). Short-term grazing changed temporal productivity stability of alpine grassland on Qinghai-Tibetan plateau via response species richness and functional groups asynchrony. Ecol. Indic. 146:109800. doi: 10.1016/j.ecolind.2022.109800
Jabal, Z. K., Khayyun, T. S., and Alwan, I. A. (2022). Impact of climate change on crops productivity using MODIS-NDVI time series. Civil Eng. J. 8, 1136–1156. doi: 10.28991/CEJ-2022-08-06-04
Jia, J., Xin, L., Lu, C., Wu, B., and Zhong, Y. (2023). China’s CO2 emissions: a systematical decomposition concurrently from multi-sectors and multi-stages since 1980 by an extended logarithmic mean divisia index. Energ. Strat. Rev. 49:101141. doi: 10.1016/j.esr.2023.101141
Jiang, J., Zhu, S., Wang, W., Li, Y., and Li, N. (2022). Coupling coordination between new urbanisation and carbon emissions in China. Sci. Total Environ. 850:158076. doi: 10.1016/j.scitotenv.2022.158076
Klotzbucher, S. (2009). Sustainable development in Western China: managing people, livestock and grasslands in pastoral areas. J. Dev. Stud. 45, 828–830. doi: 10.1080/00220380902910272
Li, J., Sun, W., Li, M., and Linlin, M. (2021). Coupling coordination degree of production, living and ecological spaces and its influencing factors in the Yellow River Basin. J. Clean. Prod. 298:126803. doi: 10.1016/j.jclepro.2021.126803
Li, J., Yang, W., Liu, L., Liu, X., Qiu, F., and Ma, X. (2022). Development and environmental impacts of China’s livestock and poultry breeding. J. Clean. Prod. 371:133586. doi: 10.1016/j.jclepro.2022.133586
Li, Q., Zhao, Y., Li, S., and Zhang, L. (2021). Spatial-temporal characteristics of the coupling coordination of social security and economic development in China during 2002–2018. Reg. Sustain. 2, 116–129. doi: 10.1016/j.regsus.2021.04.001
Liang, Y., Xu, Y., Lai, D., Hua, G., Huang, D., Wang, H., et al. (2023). Emerging market for pork with animal welfare attribute in China: An ethical perspective. Meat Sci. 195:108994. doi: 10.1016/j.meatsci.2022.108994
Liao, S., Wu, Y., Wong, S., and Shen, L. (2020). Provincial perspective analysis on the coordination between urbanization growth and resource environment carrying capacity (RECC) in China. Sci. Total Environ. 730:138964. doi: 10.1016/j.scitotenv.2020.138964
Liu, S., Jia, J., Huang, H., Chen, D., Zhong, Y., and Zhou, Y. (2023). China’s CO2 emissions: a thorough analysis of spatiotemporal characteristics and sustainable policy from the agricultural land-use perspective during 1995–2020. Land. 12:1220. doi: 10.3390/land12061220
Liu, F., Wang, C., Luo, M., Zhou, S., and Liu, C. (2022). An investigation of the coupling coordination of a regional agricultural economics-ecology-society composite based on a data-driven approach. Ecol. Indic. 143:109363. doi: 10.1016/j.ecolind.2022.109363
Liu, H., Xia, J., Zou, L., and Huo, R. (2022). Comprehensive quantitative evaluation of the water resource carrying capacity in Wuhan City based on the “human–water–city” framework: past, present and future. J. Clean. Prod. 366:126803:132847. doi: 10.1016/j.jclepro.2022.132847
Mann, R., and Gupta, A. (2022). Temporal trends of rainfall and temperature over two sub-divisions of Western Ghats. HighTech. Innov. J. 3, 28–42. doi: 10.28991/HIJ-SP2022-03-03
MARD (2018). Technical guide to the measurement of land carrying capacity of livestock and poultry manure. Available at: http://www.xmsyj.moa.gov.cn/zcjd/201904/t20190429_6287183.htm. (Accessed 1 September 2022)
MARD (2021). The 14th five-year plan for the development of the national animal husbandry and veterinary industry. http://www.gov.cn/zhengce/zhengceku/2021-12/22/5663947/files/fd62c2ed4d3d450e8b0f87c2dc8ff326.pdf. (Accessed 1 October 2022)
NBS. (2022). National data. Available at: https://data.stats.gov.cn/easyquery.htm?cn=C01. (Accessed 23 May 2022).
Peng, D., Mu, Y., and Zhu, Y. (2021). Evaluating the level of coordinated development of fisheries economic growth and environmental quality in selected Chinese regions. Environ. Impact Assess. Rev. 89:106605. doi: 10.1016/j.eiar.2021.106605
Ping, J. L., Green, C. J., Zartman, R. E., and Bronson, K. F. (2004). Exploring spatial dependence of cotton yield using global and local autocorrelation statistics. Field Crop Res. 89, 219–236. doi: 10.1016/j.fcr.2004.02.009
Post, P. M., Hogerwerf, L., Bokkers, E., Baumann, B., Fischer, P., Rutledge-Jonker, S., et al. (2020). Effects of Dutch livestock production on human health and the environment. Sci. Total Environ. 737:139702. doi: 10.1016/j.scitotenv.2020.139702
Qian, W., and Wang, J. (2020). An improved seasonal GM(1,1) model based on the HP filter for forecasting wind power generation in China. Energy 209:118499. doi: 10.1016/j.energy.2020.118499
Qian, Q., Wang, J., Zhang, X., Wang, S., Li, Y., Wang, Q., et al. (2022). Improving herders’ income through alpine grassland husbandry on Qinghai-Tibetan plateau. Land Use Policy 113:105896. doi: 10.1016/j.landusepol.2021.105896
Ronaghi, M., and Ronaghi, M. H. (2021). Investigating the impact of economic, political, and social factors on augmented reality technology acceptance in agriculture (livestock farming) sector in a developing country. Technol. Soc. 67:101739. doi: 10.1016/j.techsoc.2021.101739
Rosa, L., Chiarelli, D. D., Rulli, M. C., Dell'Angelo, J., and D'Odorico, P. (2020). Global agricultural economic water scarcity. Si. Adv. 6. doi: 10.1126/sciadv.aaz6031
Roux, N., Kastner, T., Erb, K. H., and Haberl, H. (2021). Does agricultural trade reduce pressure on land ecosystems? Decomposing drivers of the embodied human appropriation of net primary production. Ecol. Econ. 181:106915. doi: 10.1016/j.ecolecon.2020.106915
Sahoo, M. M., Patra, K. C., Swain, J. B., and Khatua, K. K. (2017). Evaluation of water quality with application of Bayes’ rule and entropy weight method. Eur. J. Environ. Civ. Eng. 21, 730–752. doi: 10.1080/19648189.2016.1150895
Seguin, R., Lefsrud, M. G., Delormier, T., and Adamowski, J. (2021). Assessing constraints to agricultural development in circumpolar Canada through an innovation systems lens. Agric. Syst. 194:103268. doi: 10.1016/j.agsy.2021.103268
Shang, Z. H., Gibb, M. J., Leiber, F., Ismail, M., Ding, L. M., Guo, X. S., et al. (2014). Long, R.J., n.d. the sustainable development of grassland-livestock systems on the Tibetan plateau: problems, strategies and prospects. Rangeland J. 36, 267–296. doi: 10.1071/RJ14008
Shen, L., Huang, Y., Huang, Z., Lou, Y., Ye, G., and Wong, S. W. (2018). Improved coupling analysis on the coordination between socio-economy and carbon emission. Ecol. Indic. 94, 357–366. doi: 10.1016/j.ecolind.2018.06.068
Sievert, K., Chen, V., Voisin, R., Johnson, H., Parker, C., Lawrence, M., et al. (2022). Meat production and consumption for a healthy and sustainable Australian food system: policy options and political dimensions. Sustain. Prod. Consum. 33, 674–685. doi: 10.1016/j.spc.2022.08.007
Sun, Z., Liu, Y., and Yu, Y. (2019). China’s carbon emission peak pre-2030: exploring multi-scenario optimal low-carbon behaviors for China’s regions. J. Clean. Prod. 231, 963–979. doi: 10.1016/j.jclepro.2019.05.159
Sun, M., Xu, X., Hu, Y., Ren, Y., Zhang, L., and Wang, Y. (2021). What differentiates food-related environmental footprints of rural Chinese households? Resour. Conserv. Recycl. 166:105347. doi: 10.1016/j.resconrec.2020.105347
Tan, S., Liu, Q., and Han, S. (2022). Spatial-temporal evolution of coupling relationship between land development intensity and resources environment carrying capacity in China. J. Environ. Manag. 301:113778. doi: 10.1016/j.jenvman.2021.113778
Tonsor, G. T., and Lusk, J. L. (2022). U.S. perspective: meat demand outdoes meat avoidance. Meat Sci. 190:108843. doi: 10.1016/j.meatsci.2022.108843
USDA. (2022). Livestock and poultry: World markets and trade. Available at: https://apps.fas.usda.gov/psdonline/circulars/livestock_poultry.pdf. (Accessed 1 November 2022)
Wang, Y., Zhang, Y., Li, J., Lin, J. G., Zhang, N., and Cao, W. (2021). Biogas energy generated from livestock manure in China: current situation and future trends. J. Environ. Manage. 297:113324. doi: 10.1016/j.jenvman.2021.113324
Yang, X., Zhang, F., Xiao, Y., An, Y., Jiang, C., Tan, H., et al. (2022). Coupling and interaction between tourism eco-efficiency and new urbanization in the Yangtze River Economic Belt: based on the perspective of uncoupling coordination. Environ. Dev. Sustain. 25, 13171–13197. doi: 10.1007/s10668-022-02610-1
Zhang, Y., Khan, S. U., Swallow, B., Liu, W., and Zhao, M. (2022). Coupling coordination analysis of China’s water resources utilization efficiency and economic development level. J. Clean. Prod. 373:133874. doi: 10.1016/j.jclepro.2022.133874
Zhang, T., and Li, L. (2021). Research on temporal and spatial variations in the degree of coupling coordination of tourism–urbanization–ecological environment: a case study of Heilongjiang, China. Environ. Dev. Sustain. 23, 8474–8491. doi: 10.1007/s10668-020-00976-8
Zhang, Y., and Li, B. (2022). Coupling coordination analysis of grain production and economic development in Huang-Huai-Hai region. Environ. Dev. Sustain. 25, 13099–13124. doi: 10.1007/s10668-022-02605-y
Zhang, C., Liu, S., Wu, S., Jin, S., Reis, S., Liu, H., et al. (2019). Rebuilding the linkage between livestock and cropland to mitigate agricultural pollution in China. Resour. Conserv. Recycl. 144, 65–73. doi: 10.1016/j.resconrec.2019.01.011
Zhang, Z., Shi, K., Tang, L., Su, K., Zhu, Z., and Yang, Q. (2022). Exploring the spatiotemporal evolution and coordination of agricultural green efficiency and food security in China using ESTDA and CCD models. J. Clean. Prod. 374:133967. doi: 10.1016/j.jclepro.2022.133967
Zhang, Y., Tian, Q., and Wu, J. (2023). Coupling coordination degree and obstacle factors between the tourism industry and ecological environment in the Beijing-Hangzhou Grand Canal basin, China. Environ Dev Sustain 26, 2589–2613. doi: 10.1007/s10668-022-02855-w
Zhang, H., Wang, Z., Liu, J., Chai, J., and Wei, C. (2022a). Selection of targeted poverty alleviation policies from the perspective of land resources-environmental carrying capacity. J. Rural. Stud. 93, 318–325. doi: 10.1016/j.jrurstud.2019.02.011
Zhang, F., Wang, Y., Ma, X., Wang, Y., Yang, G., and Zhu, L. (2019). Evaluation of resources and environmental carrying capacity of 36 large cities in China based on a support-pressure coupling mechanism. Sci. Total Environ. 688, 838–854. doi: 10.1016/j.scitotenv.2019.06.247
Zhang, H., Zhou, G., Zhang, S., Yang, Y., Dev, S., Su, Q., et al. (2022b). Risk assessment of heavy metals contamination in pork. Food Control 135:108793. doi: 10.1016/j.foodcont.2021.108793
Zhao, H., Chang, J., Havlík, P., van Dijk, M., Valin, H., Janssens, C., et al. (2021). China’s future food demand and its implications for trade and environment. Nat. Sustain. 4, 1042–1051. doi: 10.1038/s41893-021-00784-6
Zhao, Y., Dai, R., Yang, Y., Li, F., Zhang, Y., and Wang, X. (2022). Integrated evaluation of resource and environmental carrying capacity during the transformation of resource-exhausted cities based on Euclidean distance and a gray-TOPSIS model: a case study of Jiaozuo City. China. Ecol. Indic. 142:109282. doi: 10.1016/j.ecolind.2022.109282
Zheng, G., Li, M., Shen, Y., Yu, B., Chen, T., and Liu, X. (2021). Environmental impact and adaptation study of pig farming relocation in China. Environ. Impact Assess. Rev. 89:106593. doi: 10.1016/j.eiar.2021.106593
Zheng, L., Zhang, Q., Zhang, A., Hussain, H. A., Liu, X., and Yang, Z. (2019). Spatiotemporal characteristics of the bearing capacity of cropland based on manure nitrogen and phosphorus load in mainland China. J. Clean. Prod. 233, 601–610. doi: 10.1016/j.jclepro.2019.06.049
Zhou, T., Fu, Q., Zhu, Y., Hu, Z., Yang, F., et al. (2014). Optimizing pollutant generation coefficients of livestock constitution in China. Geogr. Res. 33, 762–776.
Keywords: livestock industry, resource and environmental carrying capacity, development relationship, spatial distribution, future trend
Citation: Zhou K, Wu J, Li H, Zhang Z, Wu H and Li J (2024) Analysis of the coupling coordination of livestock production, residential consumption, and resource and environmental carrying capacity in China. Front. Sustain. Food Syst. 8:1365076. doi: 10.3389/fsufs.2024.1365076
Edited by:
Christian Bux, University of Bari Aldo Moro, ItalyReviewed by:
Suresh Neethirajan, Dalhousie University, CanadaYongyang Wang, Guangdong University of Technology, China
Junsong Jia, Jiangxi Normal University, China
Copyright © 2024 Zhou, Wu, Li, Zhang, Wu and Li. This is an open-access article distributed under the terms of the Creative Commons Attribution License (CC BY). The use, distribution or reproduction in other forums is permitted, provided the original author(s) and the copyright owner(s) are credited and that the original publication in this journal is cited, in accordance with accepted academic practice. No use, distribution or reproduction is permitted which does not comply with these terms.
*Correspondence: Jianqiang Li, bGpxOTgwMUAxMjYuY29t
†These authors have contribution equally with the first author and can be considered as co-first authors