 Deissy Martinez-Baron1,2*
 Marina Alarcón de Antón3,4
 Jesús David Martinez Salgado1
 Andrea Estefanía Castellanos1
- 1International Center for Tropical Agriculture (CIAT), Cali, Colombia
- 2Department of Geography, University of Copenhagen, Copenhagen, Denmark
- 3FarmTree B.V., Wageningen, Netherlands
- 4Farming Systems Ecology Group, Wageningen University and Research, Wageningen, Netherlands
Introduction: Climate change poses a significant threat to rural livelihoods in low- and middle-income countries. Enhancing the sustainability of these livelihoods is crucial for ensuring food security and nutrition at both global and regional levels. This study investigates the role of Climate Smart Agriculture (CSA) practices in improving rural livelihoods in Latin America, specifically through the Climate Smart Village (CSV) approach.
Methods: Our analysis involved a dataset of 267 households, comprising both adopters and non-adopters of CSA practices in CSVs across Guatemala, Honduras, and Colombia. We employed multiple correspondence analysis (MCA), Gower’s metric, agglomerative clustering, partitioning around medoids (PAM), and cluster validation. Our aim was to understand how CSA practices, which include the use of agroclimatic information, soil and water management practices, and risk diversification strategies, contribute to enhancing livelihoods. We examined this in the context of the five capitals (social, natural, physical, financial, and human) of the Sustainable Livelihoods Framework (SLF).
Results: Our findings indicate that CSA farmers exhibit lower capital-based vulnerability compared to non-CSA farmers. This is particularly evident in the areas of social capital, as well as human and natural capital for certain CSA adopters. However, the similar performance in financial and physical capital between CSA and non-CSA farmers suggests the need for additional strategies to reduce vulnerability in these areas. We examined this through the Sustainable Livelihoods Framework (SLF), which includes five capitals: social, natural, physical, financial and human.
Conclusion: These findings offer a valuable framework for policy and decision-making processes, helping to identify which capitals and dimensions of livelihood vulnerability should be prioritized in different contexts to achieve climate resilience and sustainable development. The study advocates for continued research efforts, incorporating expanded indicators, such as gender indicators within social and human capital definitions, for a more comprehensive assessment of CSA’s impact. The application of SLF for analyzing CSA’s contribution to rural livelihoods represents a novel approach in Latin American studies.
1 Introduction
Rural livelihoods dependent on agriculture face unprecedented challenges due to the growing impact of climate change on agricultural systems, particularly in low- and middle-income countries. Agriculture engages 14% of the total labor force and 55% of the rural labor force in the Latin America and Caribbean (LAC) region. Women make up 7.5% of the agricultural labor force of the region, including 41% of rural workers. The implications of climate change for the region are profound (IICA, 2019). Simultaneously, the sector itself contributes substantially to global emissions, underscoring the urgent need for sustainable practices.
While smallholder farmers, particularly women, are pivotal in global food production, their vulnerability to environmental shifts cannot be understated (Doss, 2018; Ricciardi et al., 2018; Donatti et al., 2019). Therefore, the pursuit of sustainable livelihoods for these communities is critical not only for regional food security but also for global sustainability. Building on the concept of sustainability, which involves the ability to withstand shocks and maintain resources for future generations, the Climate-Smart Agriculture (CSA) approach presents a holistic development strategy. CSA strives to enhance the resilience and productivity of agricultural systems, ensure food security, and mitigate environmental pressures and greenhouse gas emissions.
Despite the growing body of literature on CSA and its role in enhancing agricultural resilience and productivity, a comprehensive exploration that integrates the Sustainable Livelihoods Framework (SLF) within the context of CSA remains an untapped area of research. By emphasizing the interplay between natural, physical, social, human, and financial capitals, the SLF provides a comprehensive lens to assess the impact of CSA on rural livelihoods.
This study aims to fill this gap by examining how CSA contributes to the sustainability of rural livelihoods in Latin America and the Caribbean, leveraging secondary field data from three distinct geographies. The paper not only adds to the existing evidence on the effectiveness of CSA at scale in reducing the vulnerability of agriculture-dependent households but also highlights the importance of adopting a dual framework approach bringing the SLF and the CSA approaches together for robust policy recommendations and investments. Furthermore, the study provides a unique comparative analysis of the implementation of the Climate-Smart Village (CSV) approach across different geographic locations, providing insights into the varying impacts of CSA practices on rural livelihoods. By exploring the changes in the diverse livelihood capitals resulting from the adoption of CSA practices, this study provides a nuanced understanding of the interconnected dynamics between climate-resilient agriculture and sustainable livelihoods in the face of a changing climate landscape.
2 Climate-smart agriculture (CSA) and the sustainable livelihoods framework (SLF)
The impacts of climate change have placed significant strains on rural communities, leading to resource degradation, food shortages, and social inequalities (Gentle and Maraseni, 2012; Gitz et al., 2016; Ray et al., 2019). These challenges have disrupted the delicate equilibrium of agriculture-based livelihoods, highlighting the vulnerability of rural communities to climate change (Lal et al., 2011; Singh et al., 2021). Extensive research on climate variability and change in agriculture has unequivocally underscored the importance of climate-smart agriculture (CSA) as a crucial strategy to mitigate the adverse impacts of climate change on both food security and livelihoods, as emphasized by Manda et al. (2016). CSA refers to agricultural practices that aim to enhance productivity, resilience, and sustainability in the face of climate change challenges by integrating climate adaptation and mitigation strategies (Lipper et al., 2014). CSA aims to secure food production while minimizing environmental impacts and strengthening the resilience of farming communities.
Lipper and Zilberman (2018) explore the evolution and key features of the CSA concept. Initially, the CSA concept aimed at meeting three main objectives: sustainably increasing food security, building resilience to climate change, and reducing greenhouse gas emissions. However, challenges arose due to the lack of a clear methodology, resulting in varied interpretations and controversy. Over time, a methodology emerged, emphasizing the need for evidence-based assessments, an enabling policy environment, and coordinated investments. The Climate Smart Agriculture sourcebook, released in 2013, defined CSA practices, highlighting resource use efficiency and resilience enhancement (FAO, 2013). Further refinement of the CSA methodology occurred through a consultative process, addressing controversies and emphasizing the broader spatial and temporal scales of CSA objectives. Recent developments include “country CSA profiles,” providing critical evaluations of ongoing practices, institutional support, and a methodology for assessing climate-smart agriculture at the country level. A key CSA goal is to improve rural livelihoods so that they are resilient to external shocks such as climate change. Such resilience can be assessed through different dimensions embedded in livelihoods. The sustainable livelihoods framework has well-described the different assets or capitals embraced by livelihoods.
The sustainable livelihood capital approach is a conceptual framework used in the field of sustainable development and poverty reduction. Numerous authors in the development community have developed and evolved the approach through research and practice (Habib et al., 2023). It is used to understand and analyze the resources and assets that people and communities have at their disposal to improve their living conditions. The five main capitals considered in this approach are human, social, financial, physical, and natural; however, some authors have proposed adding more capitals to the approach. The analysis of how people and communities take advantage, strengthen, and generate synergies between these capitals helps to understand and generate the enabling conditions to improve the adaptation of each person or community to the specific conditions that surround them (Yin et al., 2020).
The CSA and sustainable livelihoods frameworks are complementary approaches for understanding and promoting adoption of practices to increase resilience to climate change. However, scientific literature that integrates both approaches is still limited. We found eight articles that analyzed CSA in relation to the concept of sustainable livelihoods or the SLF (Table 1). None of those had a focus in Latin America. This is the first study analyzing CSA contribution in the light of the SLF in Latin America.
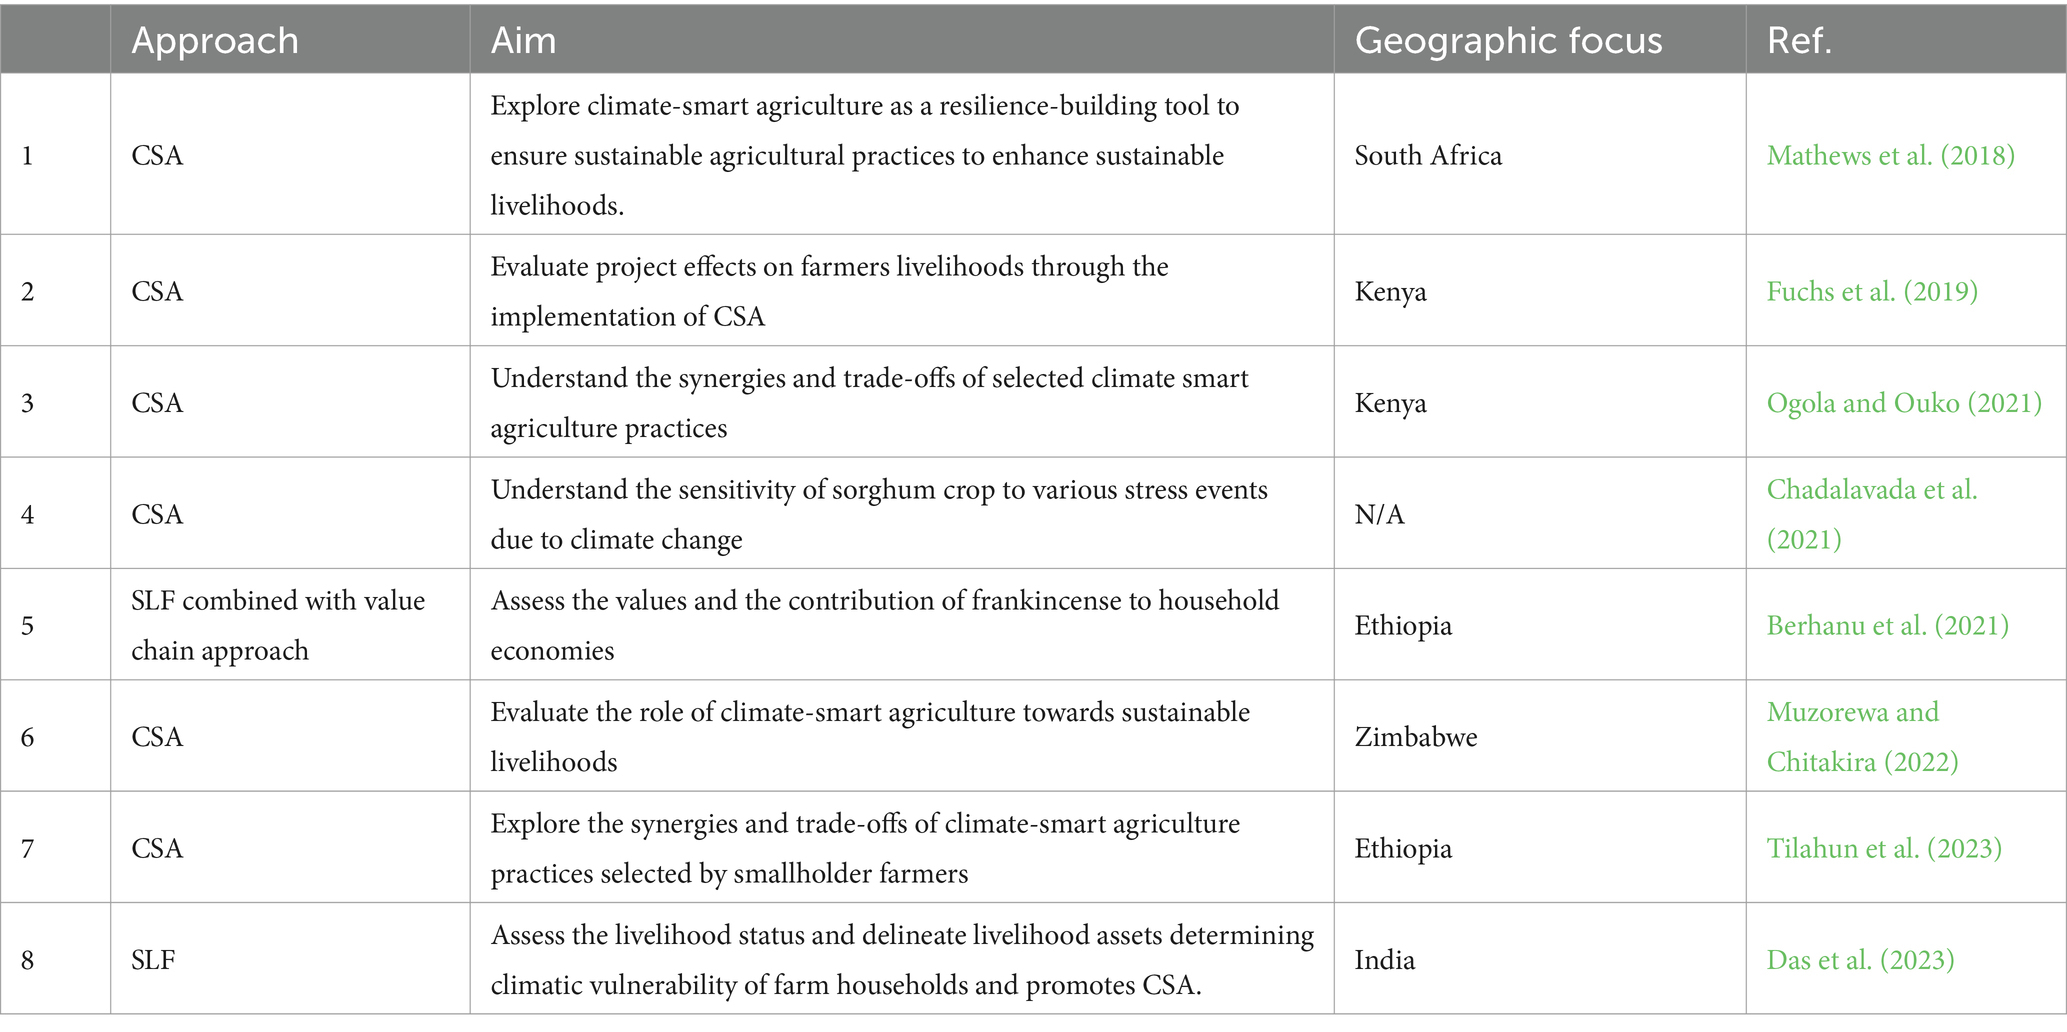
Table 1. Collection of articles that analyzed CSA and sustainable livelihoods concept or framework.
3 Materials and methods
The methodology employed in this study comprises three primary stages. Initially, we focused on data processing and variable selection, involving the identification of crucial variables for each livelihood capital, consolidation of mixed variables, and thorough cleansing of databases, including addressing missing data, outliers, and ensuring a single observation per household. Subsequently, we undertook farm-type characterization using a combination of multiple correspondence analysis and cluster analysis. This step included the careful selection of the most appropriate clustering method to analyze both continuous and discrete variables, employing the multiple correspondence method, and ultimately generating distinct clusters. Finally, we formulated the Livelihood Vulnerability Index (LVI) by assessing the comprehensive vulnerability of the studied livelihoods.
3.1 Study area
The study was conducted in three Climate Smart Villages (CSV) in Latin-American: Cauca, Colombia; Olopa, Guatemala; and Santa Rita, Honduras. Despite their distinct agro-climatic and geographical features, these villages exhibit similar farm socioeconomics, climate vulnerability, and adaptation strategies. The study used 2020 household survey data (Bonilla-Findji et al., 2020a,b,c). In brief, the CSV farming households are characterized by smallholder rainfed crop farming systems of staple crops, fruit trees and small livestock, with mostly a small-to-marginal farm size (Table 2). Furthermore, farming households from the three CSVs show similar adaptation strategies to climate change implemented through the climate smart village (CSV) approach framework of the Climate Change, Agriculture and Food Security (CCAFS) program (López et al., 2020). The analogous nature of the catalogues of CSA practices adopted by these three CSVs allows us to compare the impact of CSA adoption on capital-based livelihood vulnerability, which is the main focus of the paper, by combining regional data from three different locations.
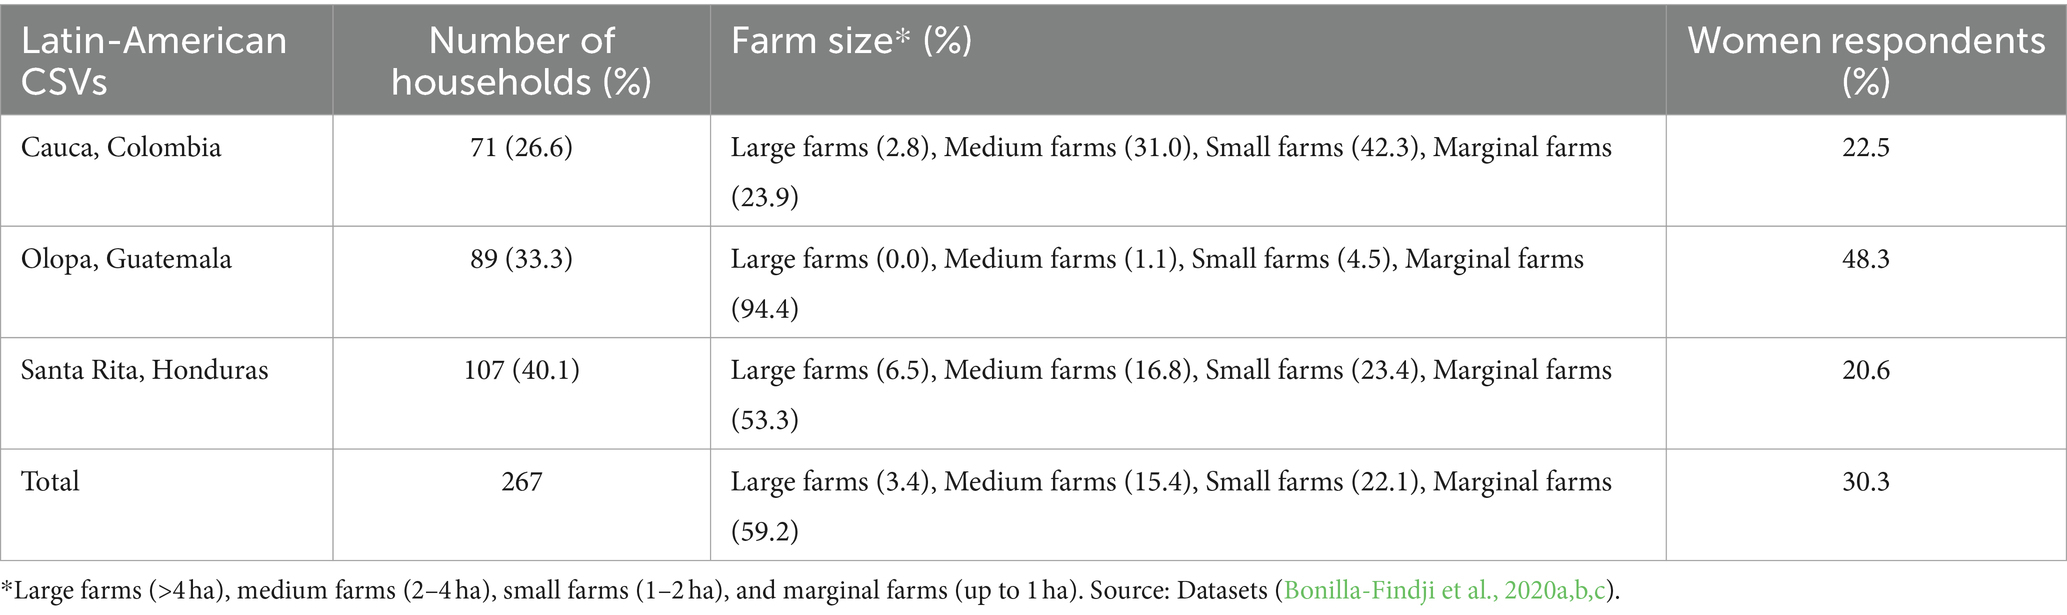
Table 2. Distribution of farm sizes for households studied across the three Latin-American Climate-Smart Villages.
3.2 Data used
The data used in the study corresponds to three published datasets containing household survey information from the “Integrated Monitoring Framework for Climate-Smart Agriculture” from the CCAFS research project (Bonilla-Findji et al., 2020a,b,c). The “Integrated Monitoring Framework for Climate-Smart Agriculture” was developed and used by CCAFS annually across the global network of Climate-Smart Villages to gather field-based evidence by tracking the progress on (i) adoption of CSA practices and technologies, as well as access to climate information services and (ii) their related impacts at household level (Bonilla-Findji et al., 2021).
The main objectives of the CSA monitoring framework are to (1) understand enabler and barriers for adoption of CSA technologies and practices; (2) understand gender-disaggregated perceived effects of CSA adoption, dis-adoption, control over resources and labour; and (3) understand CSA performance, synergies and trade-offs at the farm level. This framework introduces standardized descriptive indicators aimed at monitoring changes across various dimensions. These include five enabling dimensions that could influence adoption patterns, a core set of six indicators at the household level designed to evaluate the perceived impacts of CSA practices on aspects such as food Security, productivity, income, and climate vulnerability. Additionally, it incorporates four core indicators focusing on gender aspects, encompassing participation in decision-making, participation in implementation, access/control over resources, and work time. At the farm level, the framework includes seven core indicators to assess CSA performance, while also examining synergies and trade-offs among its three key pillars (Bonilla-Findji et al., 2021).
The final selection of monitoring household survey datasets from three Latin American countries were composed of 6 modules: (1) household demographics, (2) household agricultural activities, (3) exposure to climatic events, (4) access to weather and climatic information, (5) household food security and (6) adoption of CSA practices. From these modules within the CSV datasets, we selected the relevant information to construct the dataset for this study.1 The CSA practices analyzed are listed in Table 3, it is important to note that according to the concept of CSA, practices and technologies should be implemented as portfolios considering context-specificities and acknowledging that sets of practices could actually contribute to climate smartness.
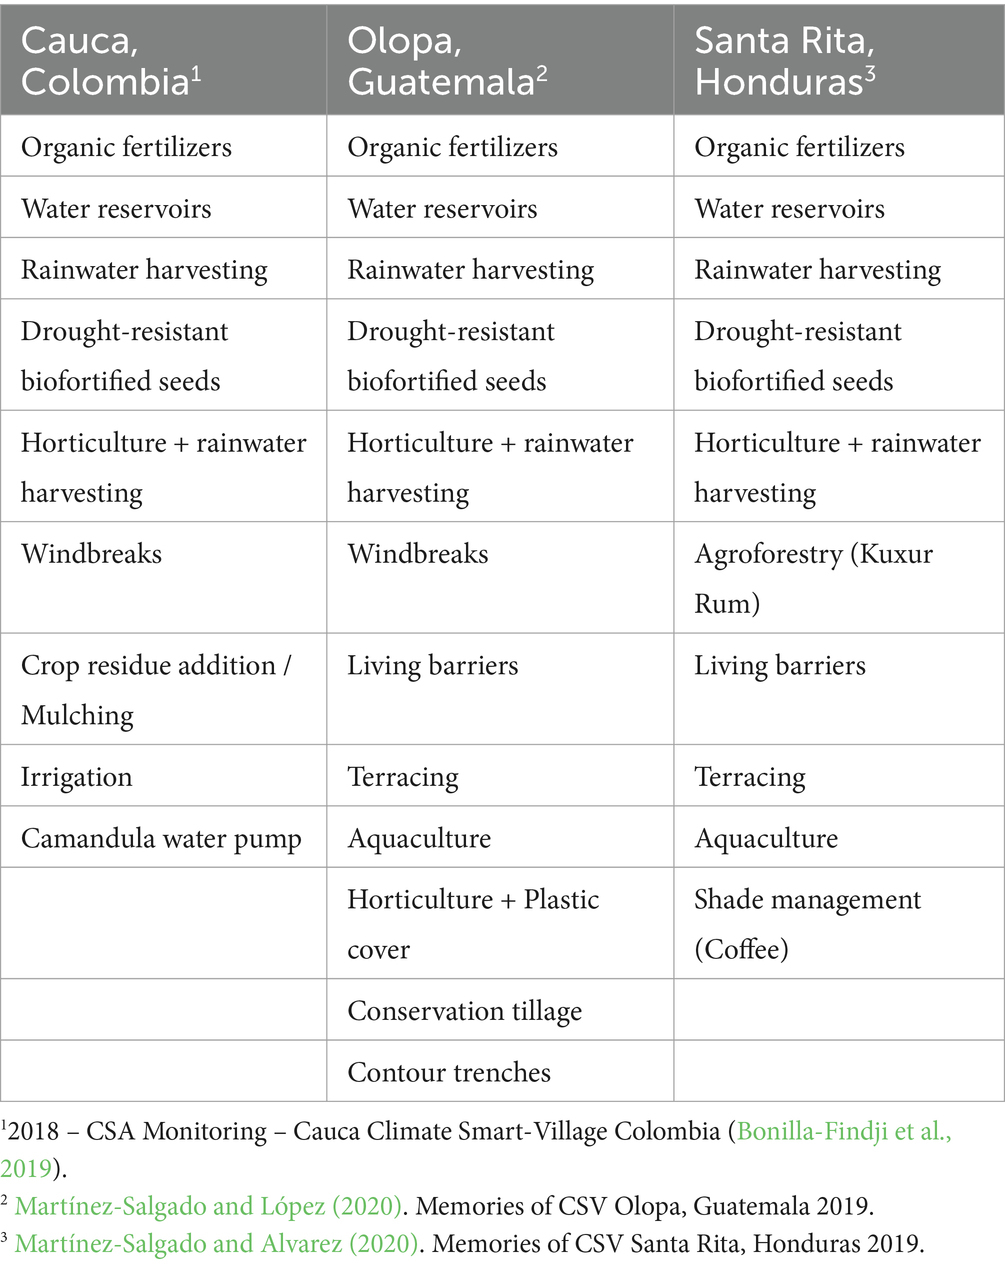
Table 3. List of implemented CSA practices at each Latin American CSV.
3.3 Data processing and variable selection
After selecting the final datasets, we proceeded with data processing by identifying the questions of the survey which addressed an aspect of a livelihood capital, from which a set of 23 unique mixed variables were constructed (Table 3). Each variable, whether numeric or categorical, represented one relevant aspect of a livelihood capital. All 23 variables were constructed based on previously used capital-based livelihood vulnerability indicators (Hahn et al., 2009; Pandey and Jha, 2012; Xu et al., 2020; Zhang et al., 2020; Zhang and Fang, 2020). We also consulted experts about factors that are known to influence capital-based livelihood vulnerability in Latin-American CSV farming households. The variable selection process resulted in a total of 23 mixed variables available for cluster analysis and farm type characterization. It is important to note that the survey dataset used covered relevant aspects of physical, financial, social and human capital extensively, whereas aspects of natural capital (such as soil or water quality) were less covered. For that reason, the natural capital variables selected represent qualitative proxies to estimate the state of natural resources in the farming household system.
Secondly, household records which contained no information on one or more of the selected survey questions were removed. Only households which had answered all the selected questions used to construct the 23 variables were included in the study. When there was more than one record per household, the answer from the head of household (man or woman) was prioritized and selected over the answers of other members of the household to ensure higher data reliability Despite the importance of assessing gender aspects in this study, the lack of systematic recording of two survey responses from both male and female head of household (especially in Cauca and Santa Rita CSVs) did not allow to include two responses per household and disaggregate the data by gender prior clustering. Finally, as a prerequisite for clustering, data quality checks were performed, which included removal of missing and out-of-range data, which unfortunately reduced the number of household records to use in the analysis, thus data did not allow enough reliability for performing gender analysis. Quantitative data were checked for outliers, which were removed to minimize bias and improve clustering. The average area destined for productive agricultural activities per household was restricted to a minimum of 200 m2 and a maximum of 84,000 m2 per household. Farming households which had a value outside that range were removed. No household had more than 10 combined number of tree species, crop species and livestock species.
Variable selection, data selection and data quality checks were carried out using Microsoft Excel (2020) software. The data cleaning process trimmed the initial datasets to a total of 267 households to be used in this study—71, 89 and 107 household records from Cauca, Olopa and Santa Rita, respectively. Unfortunately, due to the total number of female responses being rather low (30.3%), a separation of the total household sample by gender was not considered, as the sub-sample of women responses (81) was too low for the statistical analysis.
3.4 Farm-type characterization with multiple correspondence and cluster analysis
The statistical analysis of the data was divided into four steps: (1) multiple correspondence analysis (MCA); (2) computing the dissimilarity between observations using Gower’s metric; (3) agglomerative clustering using Ward’s minimum variance method and partitioning around medoids (PAM), and; (4) cluster validation using the silhouette width method. All the analyses were conducted in R version 3.6.3 (R Core Team, 2020), using the R packages “cluster,” “rtsne,” “ggplot,” “factoextra” and “factominer” for computing the clustering algorithms and respective visualizations. Table 4 shows the variables used in the cluster analysis.
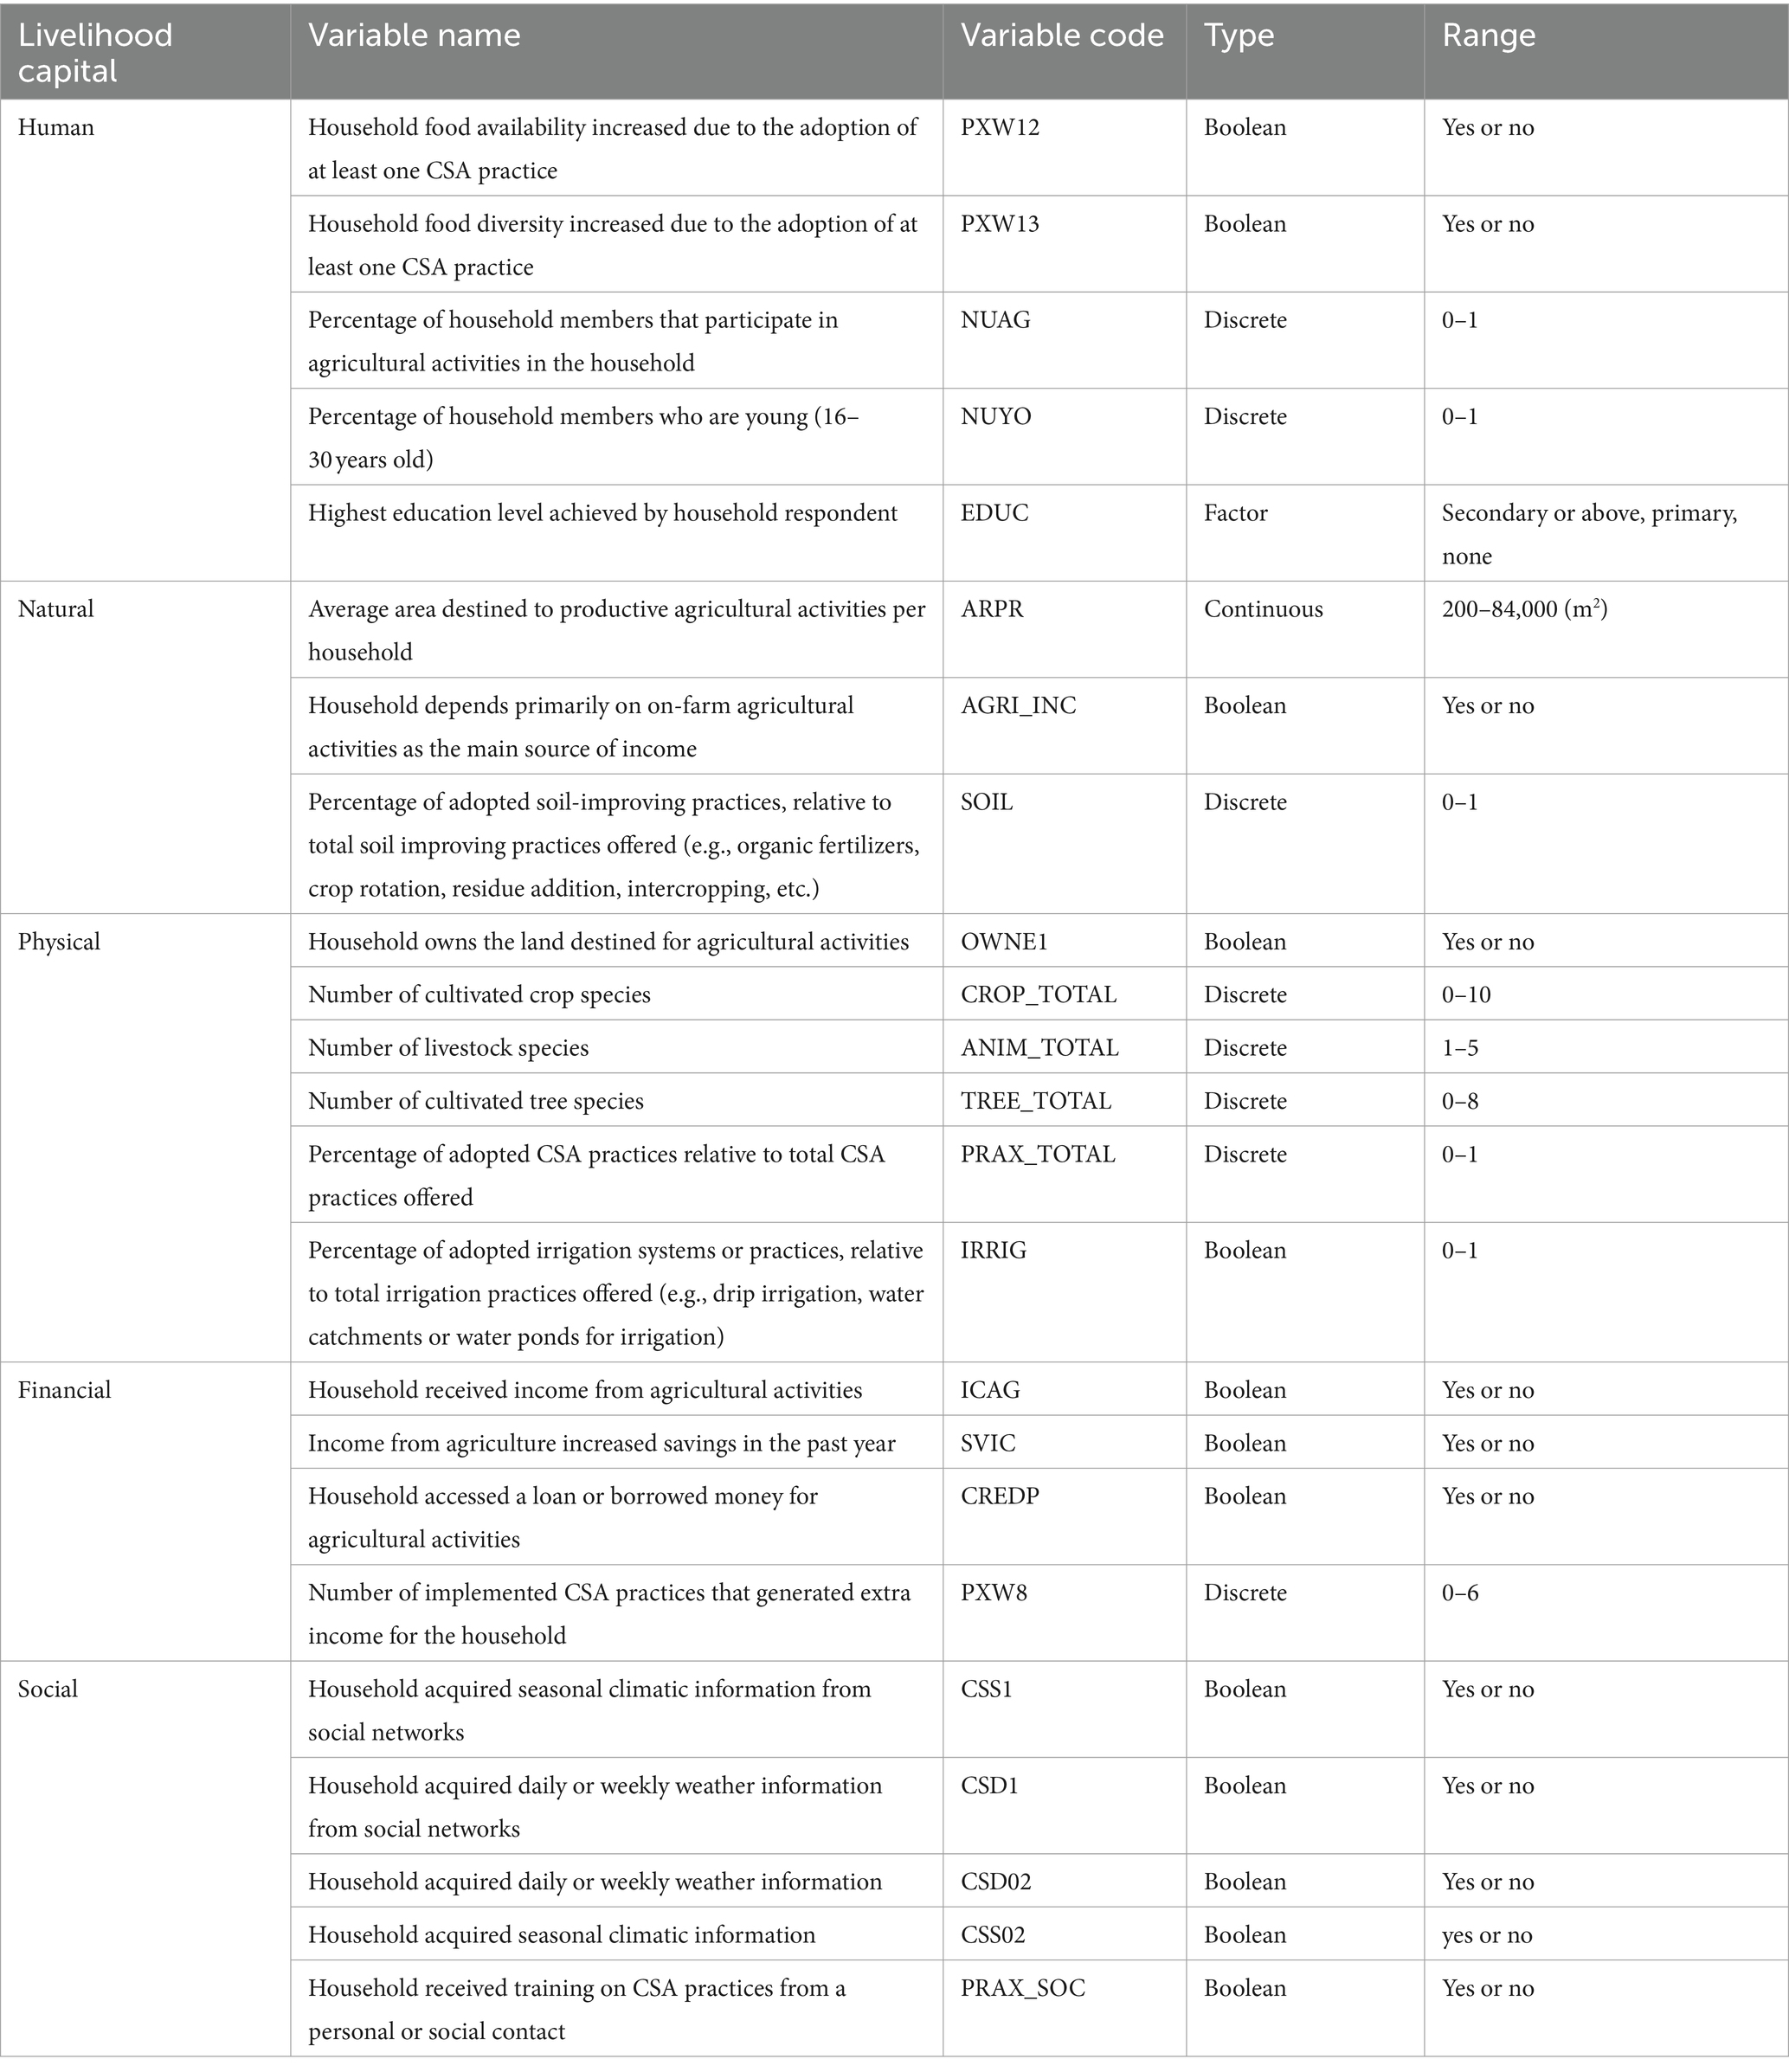
Table 4. Variables used in the cluster analysis.
First, to study the associations between the variables to be used in the cluster analysis, multiple correspondence analysis (MCA) was performed. MCA applies a dimensionality reduction algorithm to illustrate the principal components of the analysis in two dimensions. These two dimensions represent the combination of most influential variables in the analysis (Supplementary material). MCA allowed us to visualize the contributions of different variables to the combined first and second dimensions of the analysis, and therefore to identify the variables that most strongly influenced the variance of our data.
As a first step in the clustering Gower’s metric was used to compute the distance or dissimilarity between each pair of observations, since this distance metric is suitable for mixed data types and the datasets contained both categorical and numeric variables (Martin, 2016; Kassambara, 2017). As a prerequisite for clustering, Gower’s metric automatically normalized the data by rescaling it to a range between 0 and 1. Ward’s minimum variance method was used as the agglomeration or linkage method to compute the minimum distance between clusters. Ward’s method minimizes the total within-cluster variance, so that at each step of the clustering, the pair of clusters with minimum between-cluster distance are merged. Other authors also recommend using Gower’s metric and Ward’s linkage method for clustering mixed data (Chávez Esponda et al., 2010; Hendrickson, 2014; Martin, 2016). Once the distance information was obtained, agglomerative clustering was performed to obtain a tree-based representation of the objects (dendrogram). In agglomerative clustering, the cluster algorithm treats each single observation as a single cluster and pairs it with the next most similar cluster. This step is repeated until all clusters have been merged into one big cluster containing all objects, obtaining a dendrogram as a result (Kassambara, 2017).
After applying the clustering algorithm and computing the cluster distance information, the optimum number of clusters (k) that best represented the data was identified using the average silhouette method. This method allowed identifying the optimal number of clusters (k) which maximizes the average silhouette over a range of possible values for k (Kassambara, 2017). Once the number of optimum clusters (k) was selected, PAM partitioning (partitioning around the medoids) was performed, which partitions the data based on the most central point of each cluster (medoid). In k-medoids clustering, each cluster is represented by one of the data points in the cluster, the medoids, which correspond to the most centrally located point in each cluster. The medoids are therefore a representative example of the members of that cluster. As opposed to other types of clustering, the k-medoids statistical method is less sensitive to noise and outliers and it is compatible with the Gower distance metric (Martin, 2016). After PAM partitioning was performed, descriptive statistics of each cluster were obtained for interpretation and comparison of clusters. The above-mentioned steps for cluster analysis were performed first for all 267 CSV households. The same cluster analysis was then performed only for the 223 CSA farms which had adopted at least one CSA practice, in order to identify if implementation of at least one CSA practice has some effect on capital-based livelihood.
As a last step in the analysis, cluster validation was performed in order to evaluate the goodness of fit of the clustering algorithm results The silhouette width method was used as an internal cluster validation method, which measures how well an observation is clustered by estimating the average distance between clusters (Martin, 2016; Kassambara, 2017). The silhouette plot displays a measure of how close each point in one cluster is to points in the neighboring clusters. Observations with a large silhouette width (almost 1) can be considered well clustered, a small silhouette width means the observation lies within two clusters, and a negative silhouette width means the observation is probably placed in the wrong cluster (Kassambara, 2017).
3.5 Design of livelihood vulnerability index (LVI)
The vulnerability analysis in this study was based on the sustainable livelihoods approach (SLA). SLA can be used to assess vulnerability at the local level by analyzing the status of the five livelihood capitals — financial, social, natural, human, and physical. These five capitals are the basis for assessing an individual’s or household’s ability to cope with risks. They also serve as a starting point identifying necessary interventions (Chambers and Conway, 1991). Zhang and Fang (2020) inspired our method to construct a Livelihood Vulnerability Index (LVI). They constructed an LVI integrating the 3 dimensions of IPCC’s definition of vulnerability—exposure, sensitivity, and adaptive capacity (IPCC, 2014), using the five livelihood capitals from the Department of International Development framework (DFID, 1999). To construct the LVI, each livelihood capital is represented by a number of indicators which belong to one of the three major vulnerability dimensions of livelihood capital: exposure, sensitivity and adaptive capacity. In this study, we first constructed an index of vulnerability for each livelihood capital, which represents the contribution of that specific capital to vulnerability, and then aggregated the scores of the five capital vulnerabilities into one LVI per group of households. This approach indicates how each capital contributes to livelihood vulnerability for each group of farming households.
The five capital vulnerability indices and final LVI per group were constructed using 25 sub-component indicators. We selected these indicators based on published studies that measure livelihood vulnerability (Eakin and Bojórquez-Tapia, 2008; Hahn et al., 2009; Pandey and Jha, 2012; Xu et al., 2020; Zhang et al., 2020; Zhang and Fang, 2020). They were also adapted from the variables used in the cluster analyses. To construct the LVI, a balanced weighted average approach was employed, which is based on the assumption that each sub-component equally contributes to the overall index (Hahn et al., 2009).
The whole process to construct the LVI includes four major steps. First, the sub-component indicators were normalized to a value between 0 and 1 by min–max normalization using Eq. 1:
where Sg is the original investigative indicator sub-component for households in the selected group g, and Smin and Smax are the minimum and maximum value for each sub-component, respectively.Second, after each sub-component was standardized, Eq. 2 was employed to calculate an index of each dimension of vulnerability (exposure, sensitivity and adaptive capacity) for each type of livelihood capital:
Where Ce, Cs and Ca correspond to the value of each vulnerability dimension (exposure, sensitivity or adaptive capacity) for each Livelihood Capital of each group g. Index sg represents the subcomponents, and n is the number of sub-components in each of the vulnerability dimensions of Livelihood Capital.
Third, after each dimension of vulnerability was calculated for each type of livelihood capital, Eq. 3 was employed to calculate the index of each Livelihood Capital’s contribution to vulnerability (CVI-IPCC):
Which can be expressed as:
where CVI−IPCCg is the value of the Livelihood Capital’s overall contribution to vulnerability for group g after incorporating each vulnerability dimension (Ce, Ca, Cs) of the IPCC’s vulnerability framework.
Fourth, the LVI at the group-level, which represents the value of the five livelihood capitals for a given group, was calculated using Eq. 4:
where w1, w2, w3, w4, and w5 are the weights of the five livelihood capitals’ contribution to vulnerability—human capital vulnerability (HCV), natural capital vulnerability (NCV), physical capital vulnerability (PCV), financial capital vulnerability (FCV) and social capital vulnerability (SCV). In this study, the LVI ranged from −0.2 (low vulnerability) to 0.4 (high vulnerability). A detailed assessment process of the calculation of the LVI is illustrated in Supplementary material.
The LVI provides a comparable method for assessing vulnerability within groups of CSV farmers. To observe differences in vulnerability associated to CSA adoption, the LVI was constructed for the CSA farmers and the non-CSA farmers. This vulnerability analysis allowed us to observe the different contributions to vulnerability of each livelihood capital and overall LVI of each group of farming households.
4 Results
4.1 Capital-based livelihood vulnerability in CSA vs. non-CSA farmers
The clustering exercise results shed light on three distinct clusters: one comprised of non-CSA farmers and the other two consisting of CSA farmers (refer to Supplementary material for detailed information on the clustering exercise). Within the non-CSA farmer cluster, individuals exhibited the lowest adoption rate of CSA practices, standing at 9.6% for all variables associated with each capital.
In the case of CSA farmers, we performed a two-cluster solution. This clustering approach revealed that the adoption of CSA practices played a pivotal role in delineating different groups within farming households. Subsequent rounds of clustering analysis underscored the primary divergence between the two groups of CSA farmers, which focused primarily on social capital. Cluster 1 showed superior performance in financial and human capital indicators compared to Cluster 2 (see Table 4). Conversely, the non-CSA farmer group displayed markedly lower values across almost all indicators when compared to the two groups of CSA farmers (see Table 5).

Table 5. Summary of cluster information (most influential variables in the clustering based on MCA analysis are highlighted in bold).
The multiple correspondence analysis (MCA) allowed to understand the variables with the largest influence in clustering the data, by underscoring the variables with the largest contributions to the combined first and second dimensions of the analysis (see Supplementary material). These included two variables from human capital (whether household increased food availability, PXW12, and food diversity, PXW13), Four variables from social capital related to acquisition of weather and climatic information and connection with social networks (CSS02, CSD02, CSS1 and CSD1), one variable from physical capital (PRAX_TOTAL: percentage of CSA practices adopted), and one variable from natural capital (SOIL, percentage of soil improving practices adopted). Based on this clustering result the following cluster descriptions were made:
Cluster 1: Medium-high adopters of CSA (including soil fertility and food diversity practices), with high access to social networks and climate/weather data (82 households).
Cluster 2: Medium-low adopters of CSA (including soil fertility and food diversity practices) with low access to social networks and climate/weather data (141 households).
Non-CSA: No-or-low adopters of CSA (no soil fertility adopters, with low adoption of food diversity practices), low access to social networks and medium access to climate/weather data (44 households).
The percentage of women responses was similar in the three clusters (35.4% in cluster 1, 28.4% in cluster 2, and 27.3% in the non-CSA cluster) and comparable to the percentage of women responses from the total household sample (30.3%). This result also indicated that, with the household data used in the analysis, gender as a variable for clustering did not show a significant influence in the partitioning of the data. It is possible that gender could have higher influence in the clustering than the one observed in this analysis, had the percentage of female respondents from the clustering sample been higher. Despite the relevance for this type of studies, the lack of systematic recording of one male and one female survey per household limited the possibility to analyse gender implications. The latter in addition to the significant amount of missing and incorrect data, which forced to discard many household records from the initial datasets.
Figures 1, 2 present the constructed capital vulnerability scores for each group of households, and the disaggregated indicator values per capital and per dimension of vulnerability. The final aggregated Livelihood Vulnerability Index (LVI) score for each group of households reveals that CSA Cluster 1 exhibits the lowest livelihood vulnerability (−0.048), followed by CSA Cluster 2 (0.063), with the non-CSA farmers group displaying the highest vulnerability (0.168).
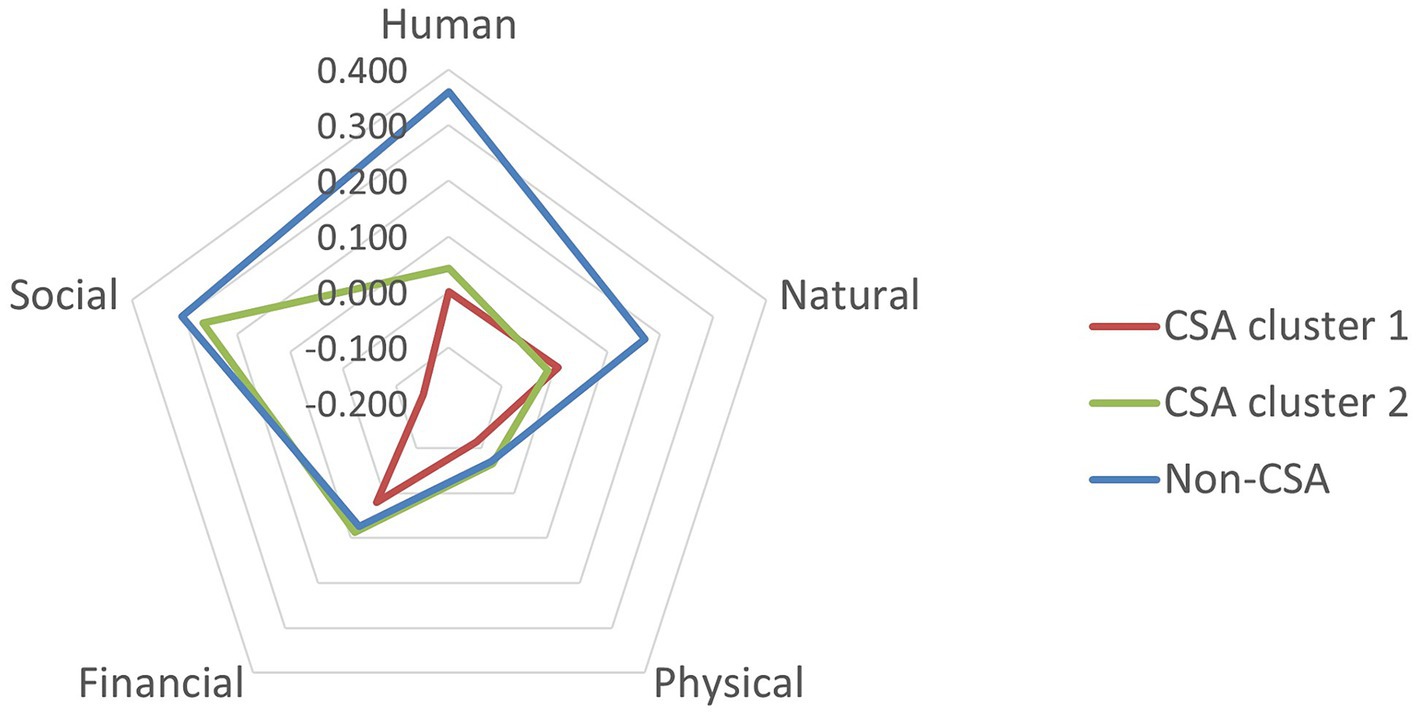
Figure 1. Livelihood vulnerability results per livelihood capital for the three groups of climate-smart village farming households: CSA farmers-cluster 1 (red), CSA farmers-cluster 2 (green), and CSA non-farmers (blue; −0.2 = least vulnerable, 0.4 = most vulnerable).
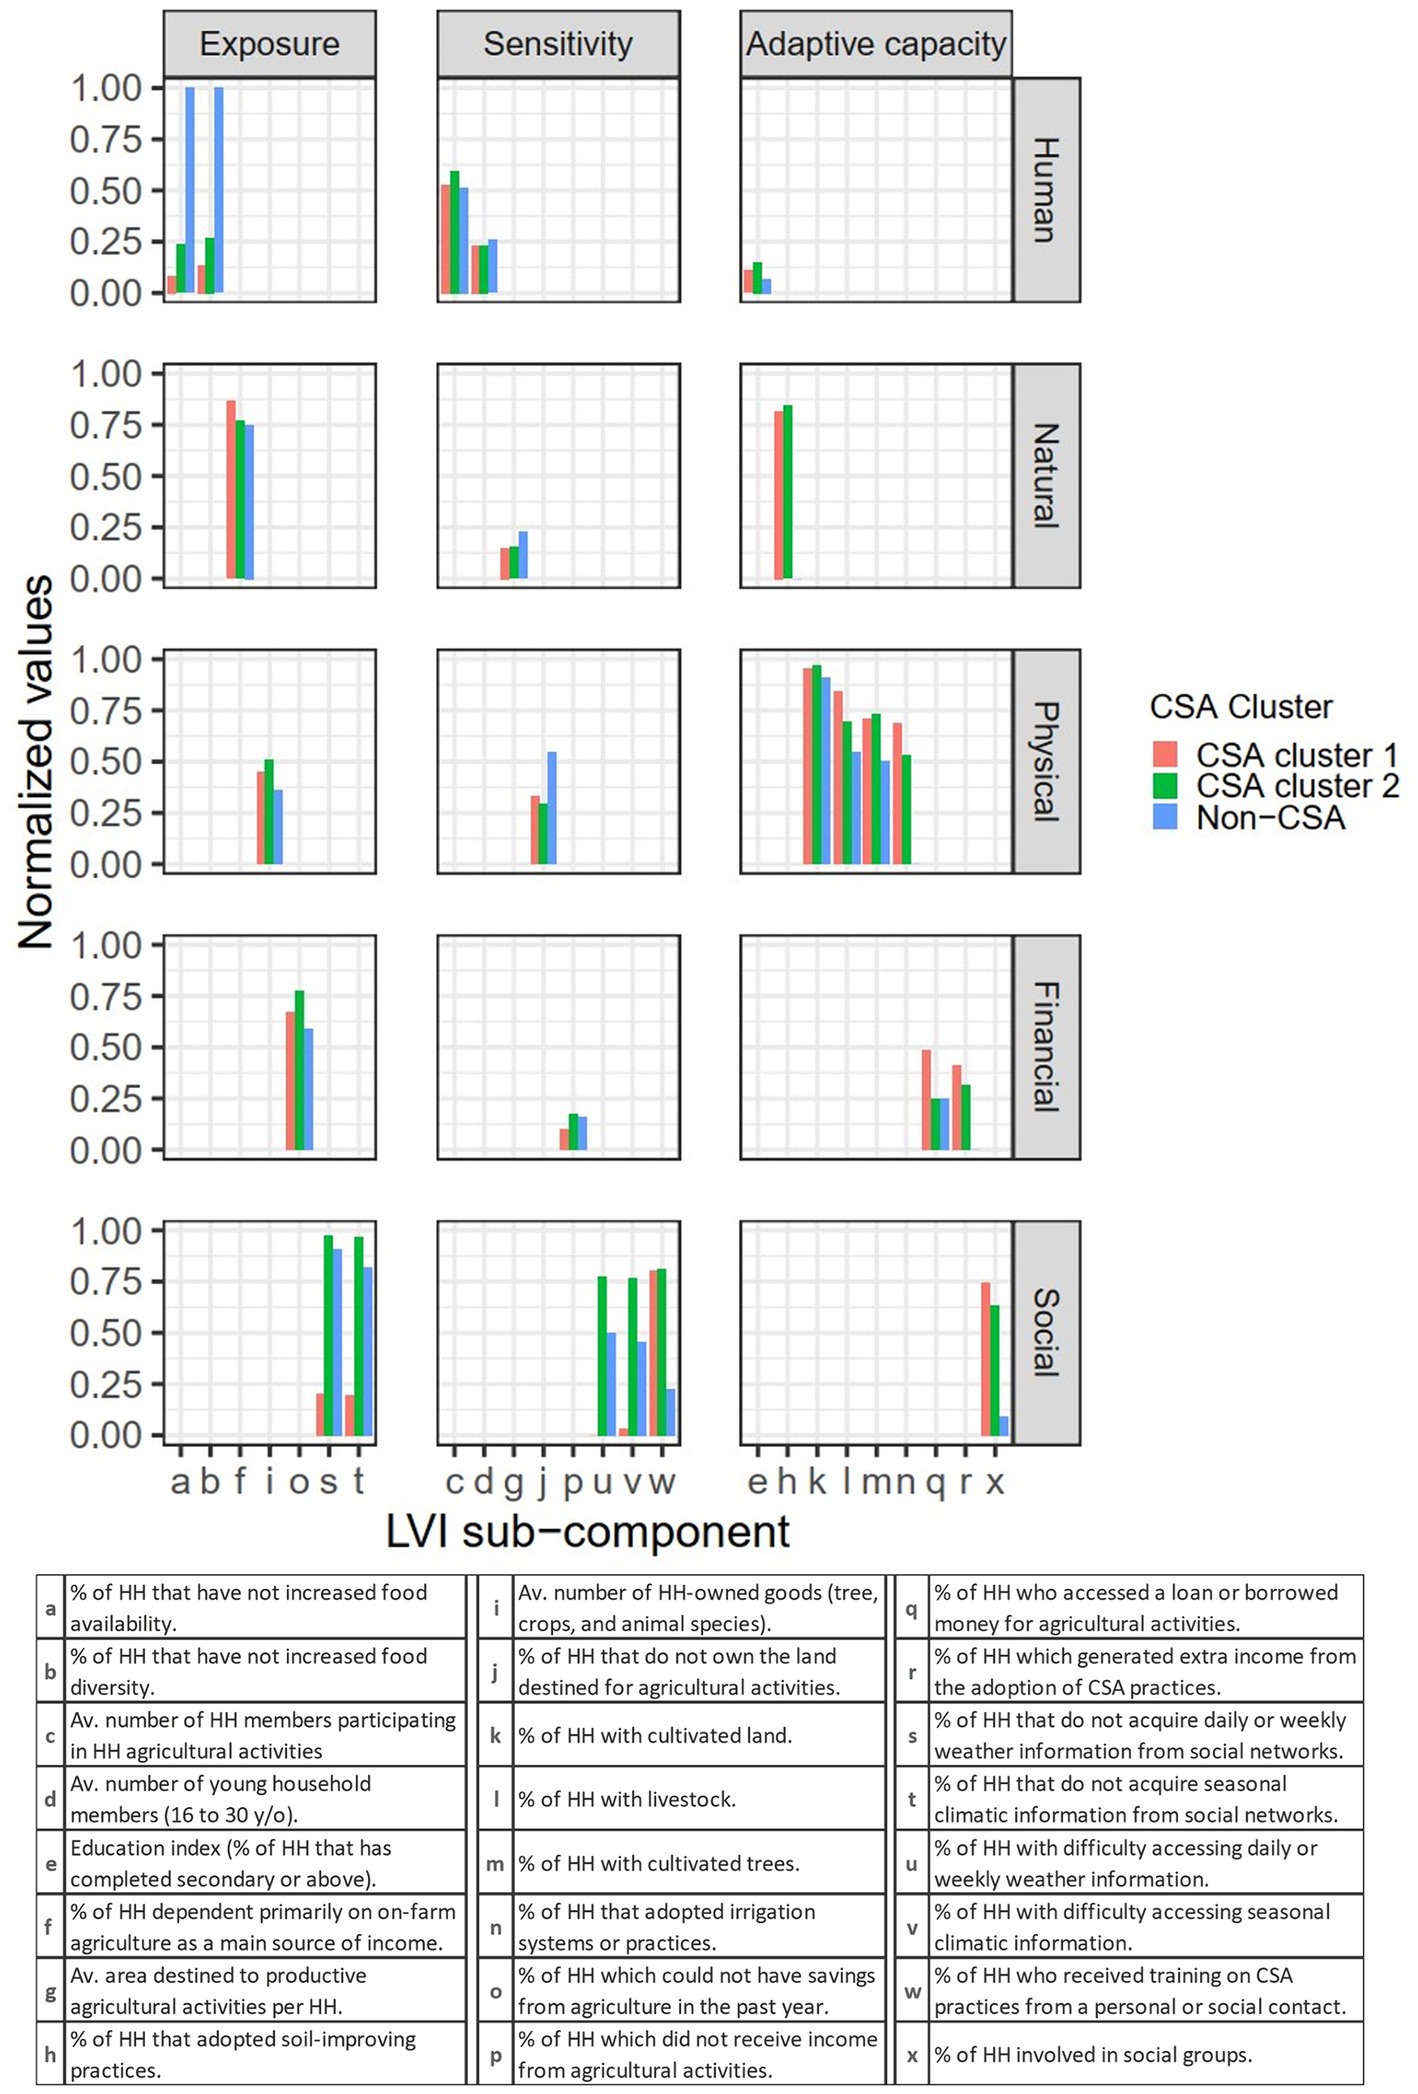
Figure 2. Normalized indicator values for livelihood capitals and dimension of vulnerability, for three types of CSV farming households: two groups of CSA farmers and non-CSA farmers. Further details on indicator values see Supplementary material.
In a comprehensive overview, CSA Cluster 1 demonstrates the lowest vulnerability across all types of capital, except for natural capital, where CSA Cluster 2 shows a slightly lower vulnerability (0,007 compared to −0.012, respectively). On the contrary, the non-CSA farmers group registers the highest vulnerability across all types of capital, despite scoring similarly to CSA Cluster 2 in social, financial, and physical capital (Figure 1). Regarding the impact of each livelihood capital on vulnerability, the three groups of farming households demonstrated comparable performance in terms of financial and physical capital. However, even within these two capital categories, CSA Cluster 1 outperformed the other two clusters, as illustrated in Figure 1.
The largest differences between the three groups of farming households were observed for social, human, and natural capital. For human and natural, the two CSA clusters showed similar and much lower vulnerability scores (human: 0.000 and 0.043; natural: 0.007 and 0.012, respectively) than the group of non-CSA farmers (human: 0.359; natural: 0.171). In terms of social capital, CSA cluster 1 showed by far the lowest vulnerability among groups (−0.152) whereas CSA cluster 2 and non-CSA farmers showed a similar and much higher vulnerability score in social capital (0.264 and 0.304, respectively) (Figures 1, 2).
4.2 Human capital
The differences in human capital scores between CSA farmers and non-CSA farmers were mainly due to the different performance in the food availability and food diversity indicators, for which non-CSA farmers showed high vulnerability (Figures 1, 2). This result suggests that CSA interventions might be particularly effective in improving food diversification in the farming household for either on-farm consumption or market sales. Furthermore, a slightly higher percentage of CSA farmers achieved a higher education index. However, educational differences between farming households might have already been present prior to CSA interventions. A wider range of indicators for human capital could be included to characterize this type of capital. Then, we might observe larger differences between groups of farming households and where the differences come from. Other possible indicators to be included in the quantification of human capital could be the dependency ratio, the percentage of illiteracy in the household, the level of education, agricultural training of the members of the household, and the overall health of household members (Xu et al., 2020; Zhang et al., 2020; Zhang and Fang, 2020).
4.3 Natural capital
Non-CSA farmers did not adopt any soil-improving practices, which resulted in the main difference in natural capital scores among groups (Figure 2). However, is it possible that the group of non-CSA farmers has adopted or already implemented other soil conservation practices than the soil practices included in the CSA package, and therefore have a higher adaptive capacity in natural capital than what our indicator reflects. Another observed difference in natural capital between groups was the average area destined to productive agricultural activities per household, which was higher in CSA farmers compared to non-CSA farmers (Figure 2). This result suggests that agricultural land differences between CSA adopters and non-adopters might have already been present. However, since the indicator used corresponded to the area destined to productive agricultural activities and not the total farm size, it is also possible that CSA might have had a positive effect in supporting farmers in more efficiently utilizing their existing land for agricultural production. Nevertheless, this livelihood capital only included three indicators, one for each dimension of vulnerability, which greatly limits the ability to fully measure natural capital-related differences between groups. More indicators should be included to cover all aspects of this capital, including indicators about access to fresh water sources, quality of the owned land, exposure to climatic events, biodiversity degree, air quality, erosion protection, etc. (Xu et al., 2020; Zhang and Fang, 2020; Zhang et al., 2020).
4.4 Physical capital
The largest difference in physical capital between groups was the percentage of adopted irrigation practices, which was 0% for non-CSA farmers and 60 and 50% for the two groups of CSA farmers, respectively (Figure 2). This result suggests that CSA might have positively encouraged farmers to adopt improved water management practices. However, as for the adoption of soil-improving practices, it is possible that non-CSA farmers already have some irrigation practices or infrastructure in place that this indicator would not measure. The second largest difference in physical capital was the percentage of households which do not own the land dedicated to agricultural activities, which was higher in non-CSA farmers (50%) and relatively similar between the two groups of CSA farmers (33 and 29%). This result suggests that differences in land property rights might have already been present prior to CSA implementation. It is possible that households who are owners might have been at an advantage in their ability to take up CSA practices. The average number of household-owned goods was similar between the two groups of CSA farmers and higher than the non-CSA group (Figure 2). All three groups showed a similar percentage of households with cultivated land (above 90% in all cases), but a higher percentage of households in CSA cluster 1 had livestock compared to CSA cluster 2 and non-CSA farmers, suggesting the CSA focus on farm diversification improved resilience. The two CSA groups also showed a higher percentage of households with cultivated tree species. Although six indicators were used to measure physical capital, our set of indicators did not cover other relevant aspects for this type of capital, such as possession of agricultural machinery and other durable goods, the level of infrastructure, transport, access to markets, etc. To better quantify physical capital, further indicators which measure these aspects should also be included (DFID, 1999; Xu et al., 2020; Zhang and Fang, 2020; Zhang et al., 2020).
4.5 Financial capital
Adaptive capacity indicators described the largest differences in financial capital between groups. The two groups of CSA farmers were in general more able to borrow money or were able to generate extra sources of income compared to the group of non-CSA farmers. This result again highlights the potential positive effect of CSA implementation on food and income diversification. The percentage of households which were unable to save money in the past year was more similar among all groups but still higher for the CSA farmers than non-CSA farmers. A lower number of households did not receive income from agriculture in CSA cluster 1 (9.8%) compared to the other two groups (17.7 and 15.9%). Other possible indicators related to non-farm income sources are if the household experienced monetary loss or if the household is below the poverty line. The analysis could benefit from indicators on insurance, subsidies, total annual income or other types of financial support (DFID, 1999; Xu et al., 2020; Zhang and Fang, 2020; Zhang et al., 2020).
4.6 Social capital
Social capital was the livelihood capital where the largest differences between groups of farming households were observed. Almost no household from CSA cluster 1 had difficulty accessing weather information whether daily or seasonal, whereas 70 and 50% of households in CSA cluster 2 and non-CSA, respectively, could not access this information (Figure 2). Furthermore, a high percentage of households in CSA cluster 1 acquired weather and climate information from social networks, which was not the case for the other two groups. This result suggests that CSA interventions might have been most successful in farming communities with already-established social networks. When these networks were not as strong, the positive CSA contribution in social capital might have been minimal. The involvement of households in social groups was much higher for CSA farmers (74 and 64%, respectively) than in non-CSA farmers (10%). Other possible indicators that could be included to better characterize social capital would be percentage of households with members working for the government, households receiving help from the government, number of community organizations joined, or diversity of agricultural product sales channels (DFID, 1999; Xu et al., 2020; Zhang and Fang, 2020; Zhang et al., 2020).
5 Discussion and conclusion
This study seeks to explain the contribution of CSA to the sustainability of rural livelihoods in Latin America. Leveraging field data from three distinct geographies in Latin America, we conduct a comparative analysis of the Climate-Smart Village (CSV) approach, evaluating the resilience of rural livelihoods. An innovative aspect of our study involves the integration of CSA and the Sustainable Livelihoods Framework (SLF), providing a nuanced perspective on the impact of CSA. The insights garnered from this research have significant implications for informing policy and investment decision-making processes.
Our findings underscore the positive impact of CSA practices on diverse livelihood capitals. Noteworthy outcomes include improved indicators of food availability and diversity (human capital) among CSA farmers. Additionally, CSA farmers show a propensity to adopt soil-improving practices acquired from social networks, thereby enhancing their natural capital. Geographical disparities in the adoption of irrigation practices reveal significant differences in physical capital among CSA farmers. Financially, CSA farmers show higher adaptive capacity, particularly in accessing credit and generating income. Socially, there is a pronounced increase in the participation of CSA farmers in social groups, reflecting enhanced social capital, which is confirmed by Das et al. (2023) who found that households with stronger social assets are more resilient to climatic challenges. Previous studies also highlight the value of a combined CSA approach and SLA focus to enhance resilience to climate change and livelihoods by identifying the most effective CSA practices per region (Mathews et al., 2018; Ogola and Ouko, 2021; Muzorewa and Chitakira, 2022). Other studies have gone further in these analyzes by measuring the contribution of specific CSA practices to the three CSA pillars, as a proxy to measure contribution to sustainable livelihoods (Ogola and Ouko, 2021; Tilahun et al., 2023).
The combination of CSA and SLA approaches to assess resilience has therefore been mostly studied from a CSA entry point. In contrast, other studies have focused on using the SLA approach to assess contribution to climate change resilience in different agricultural communities (Das et al., 2023). This study broadens the methodologies and evidence by providing a dual framework to delineate which aspects of livelihoods need to be enhanced most in CSA rural agricultural communities. Collectively, these results affirm that building the capacity to adapt to climate change is closely linked to the multiple capitals of rural livelihoods.
Our study highlights that, within the Latin American farming households included in the analysis, the CSV approach has had an overall positive impact on reducing livelihood vulnerability. Fuchs et al. (2019) and Mathews et al. (2018) highlight the notable positive impact on the sustainability of livelihoods and landscapes when appropriate and targeted CSA measures are implemented. However, the analysis also highlights that the CSV approach was particularly successful in increasing natural and human capital, somewhat successful in improving social capital, and had almost no effect in improving physical and financial capital.
This uneven contribution to capital-based vulnerability could be due to CSV’s focus on implementing CSA practices that improve agrobiodiversity, agricultural management practices, and access to information and social networks which can have a large impact on natural, human, and social capital, respectively. The increase in these three key capitals suggests that CSA can positively contribute to increasing resilience to climate change, as resilience can be increased with more diversified farming systems (Vernooy, 2022) and a wider support network (Ingold, 2017).
The limited impact of CSA interventions on financial and physical capital highlights the need to include additional interventions within or alongside this approach. Interventions should help farmers address these two key aspects of livelihood vulnerability. Other studies have also highlighted the important contribution of income diversification CSA strategies to strengthen financial capital and resilience, particularly in lower income households (Berhanu et al., 2021). The analysis suggests that the CSV approach either did not sufficiently target improvements in farmers’ financial and physical capital, or it failed to address differences that might have already been present (such as differences in farm size and land rights). Additional interventions to specifically target farmers’ financial and physical capital could include the introduction of financial instruments such as subsidies (for inputs, infrastructure, or machinery), loans, grants or insurance. Our study sheds light on the interplay between climate-resilient agriculture and sustainable livelihoods by integrating the SLF and CSA. It underscores the need for a comprehensive lens to fully assess the impact of CSA on rural livelihoods. However, it is important to further characterize differences in impact of CSA on the livelihoods of rural women and men, which was a limitation of this study due to a lack of sufficient gender disaggregated data for the statistical analysis.
Our results on social capital support previous findings on the role of social networks in enabling interactions across scales that can support CSA adoption (Martinez-Barón et al., 2018). However, the role of gender in establishing and maintaining these social networks needs to be better understood. Not only is it important to better understand the role of gender within social capital, but its role in all five livelihood capitals, as well as the relationship between gender and the three aspects of livelihood vulnerability. Further research should advance these findings by considering and comparing the perspectives of both men and women within CSA and non-CSA rural communities, and how they contribute to improve livelihoods and enhance resilience Moreover, not only gender differences in CSA adoption should be further looked at, but also how other intersecting factors such as socio-economic level, age, or education level, interact with gender to drive or halt CSA adoption (Howland et al., 2019; Acosta et al., 2021).
In this study, it was not possible to conduct such disaggregated analysis due to having an insufficient women sample size, which we acknowledge as a limitation. Equally important is the need to understand not only the relationship between gender and livelihood vulnerability, but also identify key areas of intervention where the rights of smallholder women can be advanced. Such advancement of women’s rights could begin by better understanding gender norms in smallholder agriculture and using novel frameworks for system change towards resilience (Rietveld et al., 2023). We acknowledge the pivotal role of women in increasing resilience in small-scale agriculture, and suggest putting gender at the centre of AR4D studies from the very initial stages of project design (IFAD, 2022). We especially emphasize the importance of centering gender during hypothesis formulation, and data collection methodology definition, in order to ensure a higher recording of female household responses to better capture the perspectives of rural women in both qualitative and quantitative ways. We emphasize again the importance of adopting a dual framework for policy and investment decisions, recognizing the complementary insights provided by both CSA and SLF.
Special consideration also needs to be taken to understand why the CSV approach succeeded in increasing social capital for some CSA farmers, but not for all, and the potential role of gender in this regard. Other combined CSA and SLA approaches in other regions also report that higher project involvement predicts lower livelihood vulnerability (Fuchs et al., 2019). This analysis suggests that the CSV approach can increase social capital very significantly by linking farmers to social groups and to information services. However, practitioners should carefully examine what factors play a role in livelihood capital formation for some CSA farmers and not others.
In conclusion, our research highlights the potential for CSA to positively influence rural livelihoods in the LAC region. The study advocates for continued research efforts, incorporating expanded indicators, such as gender indicators within social and human capital definitions, for a more comprehensive assessment of CSA’s impact. Additionally, we stress the urgency of considering the implications for promoting sustainable livelihoods in the face of climate change. This comprehensive approach is vital for guiding effective policies and investments geared towards building resilient and sustainable rural communities in LAC.
Data availability statement
The data used in the study corresponds to three published datasets containing household survey information from the “Integrated Monitoring Framework for Climate-Smart Agri- culture” from the CCAFS research project (Bonilla-Findji et al., 2020a,b,c).
Ethics statement
The studies involving humans were approved by the Institutional Review Board (IRB) of the Alliance of Bioversity and CIAT. The IRB chairs are Juliana Muriel and Powell Mponela. The studies were conducted in accordance with the local legislation and institutional requirements. The participants provided their written informed consent to participate in this study.
Author contributions
DMB: Conceptualization, Funding acquisition, Investigation, Methodology, Resources, Supervision, Validation, Writing – original draft, Writing – review & editing. MA: Data curation, Formal analysis, Methodology, Writing – original draft, Software, Visualization, Writing – review & editing. JM: Conceptualization, Investigation, Formal analysis, Methodology, Supervision, Validation, Writing – original draft. AC: Investigation, Writing – review & editing.
Funding
The author(s) declare financial support was received for the research, authorship, and/or publication of this article. Results of this paper were analyzed in the framework of the CGIAR regional integrated initiative for Latin America and the Caribbean: AgriLAC Resiliente (https://www.cgiar.org/initiative/agrilac-resiliente/) and the project Putting Ecosystems at the Center of Adaptation through the Climate Smart Village (CSV) approach (funded by Global EbA Fund – https://globalebafund.org/304_1_234/). The data was gathered through the CGIAR Research Program on Climate Change, Agriculture and Food Security (CCAFS).
Acknowledgments
We would like to thank all funders who supported this research through their contributions to the CGIAR Trust Fund (https://www.cgiar.org/funders). Also, we would like to thank the International Climate Initiative (IKI) of the German Federal Ministry for the Environment, Nature Conservation, Nuclear Safety and Consumer Protection (BMUV) who financed the Global EbA Fund through UICN and UNEP.
Conflict of interest
MA was employed by FarmTree B.V.
The remaining authors declare that the research was conducted in the absence of any commercial or financial relationships that could be construed as a potential conflict of interest.
Publisher’s note
All claims expressed in this article are solely those of the authors and do not necessarily represent those of their affiliated organizations, or those of the publisher, the editors and the reviewers. Any product that may be evaluated in this article, or claim that may be made by its manufacturer, is not guaranteed or endorsed by the publisher.
Supplementary material
The Supplementary material for this article can be found online at: https://www.frontiersin.org/articles/10.3389/fsufs.2024.1363101/full#supplementary-material
Footnotes
1. ^Further information on the surveys implemented as part of the monitoring framework can be found in Martínez-Salgado and López (2020); as well as Martínez-Salgado and Alvarez (2020); information available only for Guatemala and Honduras CSVs.
References
Acosta, M., Riley, S., Bonilla-Findji, O., Martínez-Barón, D., Howland, F., Huyer, S., et al. (2021). Exploring women’s differentiated access to climate-smart agricultural interventions in selected climate-smart villages of Latin America. Sustain. For. 13:10951. doi: 10.3390/su131910951
Berhanu, Y., Vedeld, P., Angassa, A., and Aune, J. B. (2021). The contribution of frankincense to the agro-pastoral household economy and its potential for commercialization – a case from Borana, southern Ethiopia. J. Arid Environ. 186:104423. doi: 10.1016/j.jaridenv.2020.104423
Bonilla-Findji, O., Eitzinger, A., Andrieu, N., Jarvin, A., Martínez- Barón, D., Ortega, L. A., et al. (2019). “2018- CSA Monitoring – Cauca Climate Smart-Village Colombia”, Harvard Dataverse, V2, UNF:6:DmhB4LLks9al/lk0KgS72Q== [fileUNF]. CCAFS Dataset. CGIAR Research Program on Climate Change, Agriculture and Food Security (CCAFS). doi: 10.7910/DVN/FNWDAX
Bonilla-Findji, O., Eitzinger, A., and Andrieu, N. (2021). Implementation manual: CCAFS climate-smart monitoring framework – tackling uptake of CSA options and perceived outcomes at household and farm level. CGIAR research program on climate change, agriculture and food security (CCAFS). Implementation in the AR4D climate-Smart Village sites: pp. 9–11.
Bonilla-Findji, O., Eitzinger, A., Andrieu, N., Jarvis, A., Martínez-Barón, D., Martínez-Salgado, J. D., et al. (2020a) 2020 – CSA monitoring: Santa Rita climate-Smart Village (Honduras). Harvard Dataverse, V1, UNF:6:r8DXvNJlyJAczxH+fFbNcQ== [fileUNF]. doi: 10.7910/DVN/OSNTKT
Bonilla-Findji, O., Eitzinger, A., Jarvis, A., Andrieu, N., Martínez-Barón, D., Martínez-Salgado, J. D., et al. (2020b). 2020 – CSA monitoring: Olopa climate-Smart Village (Guatemala). Harvard Dataverse, V1, UNF:6:pN+7CErDRSwYGPDXjBoQYw== [fileUNF]. doi: 10.7910/DVN/VTPO4U
Bonilla-Findji, O., Eitzinger, A., Jarvis, A., Martínez-Barón, D., Martínez-Salgado, J. D., Ortega, L. A., et al. (2020c). 2019 – CSA monitoring – Cauca climate Smart-Village (Colombia). Harvard Dataverse, V2, UNF:6:L8DWb+pzT5t++8r30hoa3A== [fileUNF]. doi: 10.7910/DVN/ZHEDWC
Chadalavada, K., Kumari, B. D. R., and Kumar, T. S. (2021). Sorghum mitigates climate variability and change on crop yield and quality. Planta 253:113. doi: 10.1007/s00425-021-03631-2
Chambers, R., and Conway, G. R. (1991). Sustainable rural livelihoods: Practical concepts for the 21st century. IDS discussion paper, 296 (Brighton: Institute of Development Studies, University of Sussex), 29.
Chávez Esponda, D., Miranda Cabrera, I., Varela Nualles, M., and Fernández, L. (2010). Utilización del análisis de cluster con variables mixtas en la selección de genotipos de maíz (Zea mays). Rev. Investig. Oper. 30, 209–216.
Das, U., Ansari, M. A., and Ghosh, S. (2023). Measures of livelihoods and their effect on vulnerability of farmers to climate change: evidence from coastal and non-coastal regions in India. Environ. Dev. Sustain. 26, 4801–4836. doi: 10.1007/s10668-023-02911-z
DFID. (1999). DFID (2000): Sustainable livelihoods guidance sheets. Department for International Development. Available at: http://www.livelihoods.org/info/info_guidancesheets.html
Donatti, C. I., Harvey, C. A., Martinez-Rodriguez, M. R., Vignola, R., and Rodriguez, C. M. (2019). Vulnerability of smallholder farmers to climate change in Central America and Mexico: current knowledge and research gaps. Clim. Dev. 11, 264–286. doi: 10.1080/17565529.2018.1442796
Doss, C. R. (2018). Women and agricultural productivity: reframing the issues. Dev. Policy Rev. 36, 35–50. doi: 10.1111/dpr.12243
Eakin, H., and Bojórquez-Tapia, L. A. (2008). Insights into the composition of household vulnerability from multicriteria decision analysis. Glob. Environ. Chang. 18, 112–127. doi: 10.1016/j.gloenvcha.2007.09.001
FAO. (2013). Climate-smart agriculture sourcebook. Rome. Available at: https://www.fao.org/publications/card/en/c/6f103daf-4cd2-5a95-a03c-3d5d6b489fff/
Fuchs, L., Orero, L., Namoi, N., and Neufeldt, H. (2019). How to effectively enhance sustainable livelihoods in smallholder systems: a comparative study from western Kenya. Sustain. For. 11:1564. doi: 10.3390/su11061564
Gentle, P., and Maraseni, T. (2012). Climate change, poverty and livelihoods: adaptation practices by rural mountain communities in Nepal. Environ. Sci. Pol. 21, 24–34. doi: 10.1016/j.envsci.2012.03.007
Gitz, V., Meybeck, A., Lipper, L., De Young, C., and Braatz, S. (2016). Climate change and food security: risks and responses. Food and Agriculture Organization of the United Nations 110, pp. 2–4. Available at: https://www.fao.org/3/i5188e/I5188E.pdf
Habib, N., Ariyawardana, A., and Aziz, A. A. (2023). The influence and impact of livelihood capitals on livelihood diversification strategies in low- and middle-income countries: a systematic literature review. Environ. Sci. Pollut. Res. 30, 69882–69898. doi: 10.1007/s11356-023-27638-2
Hahn, M. B., Riederer, A. M., and Foster, S. O. (2009). The livelihood vulnerability index: a pragmatic approach to assessing risks from climate variability and change-a case study in Mozambique. Glob. Environ. Chang. 19, 74–88. doi: 10.1016/j.gloenvcha.2008.11.002
Hendrickson, J. L. (2014). Methods for clustering mixed data. 109. Available at: http://scholarcommons.sc.edu/cgi/viewcontent.cgi?article=3651&context=etd
Howland, F., Arora, D., Bonilla-Findji, O., and Andrieu, N. (2019). Understanding socio-economic aspects of adoption and effects of climate smart agricultural (CSA) practices in Guatemala. Cali, Colombia: CGIAR Research Program on Climate Change, Agriculture and Food Security (CCAFS).
IFAD. (2022). How to do note: How to integrate the gender action learning system (GALS) in IFAD operations.
IICA (2019). Atlas for Agriculture in the Americas. Available at: http://repositorio.iica.int/handle/11324/8218
Ingold, K. (2017). How to create and preserve social capital in climate adaptation policies: a network approach. Ecol. Econ. 131, 414–424. doi: 10.1016/j.ecolecon.2016.08.033
IPCC (2014). Climate change 2014: synthesis report. Contribution of working groups I, II and III to the fifth assessment report of the intergovernmental panel on climate change [Core writing team, R.K. Pachauri and L.A. Meyer (eds.)].
Kassambara, A. (2017). Multivariate analysis 1: practical guide to cluster analysis in R : Taylor & Francis Group, 1–187.
Lal, R., Delgado, J. A., Groffman, P. M., Millar, N., Dell, C. J., and Rotz, A. C. (2011). Management to mitigate and adapt to climate change. J. Soil Water Conserv. 66, 276–285. doi: 10.2489/jswc.66.4.276
Lipper, L., Thornton, P., Campbell, B. M., Baedeker, T., Braimoh, A., Bwalya, M., et al. (2014). Climate-smart agriculture for food security. Nat. Clim. Chang. 4, 1068–1072. doi: 10.1038/nclimate2437
Lipper, L., and Zilberman, D. (2018). A short history of the evolution of the climate smart agriculture approach and its links to climate change and sustainable agriculture debates. In: L. Lipper, N. McCarthy, D. Zilberman, S. Asfaw, and G. Branca (eds) Climate smart agriculture: Building resilience to climate change, 13–30. Available at: https://link.springer.com/chapter/10.1007/978-3-319-61194-5_2#Sec4
López, C., Álvarez, O., Martínez-Salgado, J. D., and Martínez Barón, D. (2020). Manual de implementación de prácticas de Agricultura Sostenible Adaptada al Clima (ASAC). Experiencias de los TeSAC de Guatemala y Honduras. Programa de Investigación de CGIAR en Cambio Climático, Agricultura y Seguridad Alimentaria (CCAFS). Available at: https://hdl.handle.net/10568/111802
Manda, J., Alene, A. D., Gardebroek, C., Kassie, M., and Tembo, G. (2016). Adoption and impacts of sustainable agricultural practices on maize yields and incomes: evidence from rural Zambia. J. Agric. Econ. 67, 130–153. doi: 10.1111/1477-9552.12127
Martin, D. P. (2016). Clustering mixed data types in R. Accessed from Wicked Good Data (dpmartin42.github.io)
Martinez-Barón, D., Orjuela, G., Renzoni, G., Rodríguez, A. M. L., and Prager, S. D. (2018). Small-scale farmers in a 1.5 C future: the importance of local social dynamics as an enabling factor for implementation and scaling of climate-smart agriculture. Curr. Opin. Environ. Sustain. 31, 112–119. doi: 10.1016/j.cosust.2018.02.013
Martínez-Salgado, J. D., and Alvarez, O. (2020). Implementación del Monitoreo de opciones de Agricultura Sostenible Adaptada al Clima (ASAC): Seguimiento a su adopción e impactos en el TeSAC de Santa Rita, Honduras. – Reporte de Actividad. Wageningen, the Netherlands: Programa de Investigación del CGIAR en Cambio Climático, Agricultura y Seguridad Alimentaria (CCAFS). Available at: https://hdl.handle.net/10568/109696
Martínez-Salgado, J. D., and López, C. (2020) Implementación del Monitoreo de opciones de Agricultura Sostenible Adaptada al Clima (ASAC): Seguimiento a su adopción e impactos en el TeSAC de Olopa, Guatemala – febrero 2020 Reporte de Actividad. Wageningen, the Netherlands: Programa de Investigación del CGIAR en Cambio Climático, Agricultura y Seguridad Alimentaria (CCAFS). Available at: https://hdl.handle.net/10568/109696
Mathews, J. A., Kruger, L., and Wentink, G. J. (2018). Climate-smart agriculture for sustainable agricultural sectors: the case of Mooifontein. Jamba (Potchefstroom, South Africa) 10. doi: 10.4102/jamba.v10i1.492
Muzorewa, W., and Chitakira, M. (2022). “Evaluating the role of climate smart agriculture towards sustainable livelihoods in Mutare district, Zimbabwe”. Universität Kassel. doi: 10.17170/KOBRA-202110144900
Ogola, R. J. O., and Ouko, K. O. (2021). Synergies and trade-offs of selected climate smart agriculture practices in Irish potato farming, Kenya. Cogent Food Agric. 7. doi: 10.1080/23311932.2021.1948257
Pandey, R., and Jha, S. K. (2012). Climate vulnerability index – measure of climate change vulnerability to communities: a case of rural lower Himalaya, India. Mitig. Adapt. Strateg. Glob. Chang. 17, 487–506. doi: 10.1007/s11027-011-9338-2
R Core Team. (2020). R: A language and environment for statistical computing. R Foundation for Statistical Computing, Vienna, Austria. Available at: https://www.R-project.org/
Ray, D. K., West, P., Clark, M., Gerber, J., Prishchepov, A. V., and Chatterjee, S. (2019). Climate change has likely already affected global food production. PLoS One 14:e0217148. doi: 10.1371/journal.pone.0217148
Ricciardi, V., Ramankutty, N., Mehrabi, Z., Jarvis, L., and Chookolingo, B. (2018). How much of the world's food do smallholders produce? Glob. Food Sec. 17, 64–72. doi: 10.1016/j.gfs.2018.05.002
Rietveld, A. M., Farnworth, C. R., Shijagurumayum, M., Meentzen, A., Voss, R., Morahan, R., et al. (2023). An evidence synthesis of gender norms in agrifood systems: pathways towards improved women’s economic resilience to climate change. Bioversity International. Rome, Italy. 90 p. ISBN: 978–92–9255-310-4
Singh, N. P., Anand, B., Singh, S., Srivastava, S. K., Rao, C. S., Rao, K. V., et al. (2021). Synergies and trade-offs for climate-resilient agriculture in India: an agro-climatic zone assessment. Clim. Chang. 164, 1–2. doi: 10.1007/s10584-021-02969-6
Tilahun, G., Bantider, A., and Yayeh, D. (2023). Synergies and trade-offs of climate-smart agriculture (CSA) practices selected by smallholder farmers in Geshy watershed, Southwest Ethiopia. Reg. Sustain. 4, 129–138. doi: 10.1016/j.regsus.2023.04.001
Vernooy, R. (2022). Does crop diversification lead to climate-related resilience? Improving the theory through insights on practice. Agroecol. Sustain. Food Syst. 46, 877–901. doi: 10.1080/21683565.2022.2076184
Xu, X., Wang, L., Sun, M., Fu, C., Bai, Y., Li, C., et al. (2020). Climate change vulnerability assessment for smallholder farmers in China: an extended framework. J. Environ. Manag. 276:111315. doi: 10.1016/j.jenvman.2020.111315
Yin, S., Yang, X., and Chen, J. (2020). Adaptive behavior of farmers’ livelihoods in the context of human-environment system changes. Habitat Int. 100:102185. doi: 10.1016/j.habitatint.2020.102185
Zhang, C., and Fang, Y. (2020). Application of capital-based approach in the measurement of livelihood sustainability: a case study from the Koshi River basin community in Nepal. Ecol. Indic. 116:106474. doi: 10.1016/j.ecolind.2020.106474
Keywords: sustainable livelihoods framework, climate smart agriculture, climate-smart villages, social capital, natural capital, physical capital, financial capital, human capital
Citation: Martinez-Baron D, Alarcón de Antón M, Martinez Salgado JD and Castellanos AE (2024) Climate-smart agriculture reduces capital-based livelihoods vulnerability: evidence from Latin America. Front. Sustain. Food Syst. 8:1363101. doi: 10.3389/fsufs.2024.1363101
Edited by:
Jacques Avelino, Institut National de la Recherche Agronomique (INRA), FranceReviewed by:
Robyn Gwen Alders, Chatham House, United KingdomMohammad Aslam Ansari, G. B. Pant University of Agriculture and Technology, India
Copyright © 2024 Martinez-Baron, Alarcón de Antón, Martinez Salgado and Castellanos. This is an open-access article distributed under the terms of the Creative Commons Attribution License (CC BY). The use, distribution or reproduction in other forums is permitted, provided the original author(s) and the copyright owner(s) are credited and that the original publication in this journal is cited, in accordance with accepted academic practice. No use, distribution or reproduction is permitted which does not comply with these terms.
*Correspondence: Deissy Martinez-Baron, ZC5tLmJhcm9uQGNnaWFyLm9yZw==