 Jingdong Li
 Zhi Li
 Zilong Shi2
- 1Institute of Geographic Sciences and Natural Resources Research, Chinese Academy of Sciences, Beijing, China
- 2Center of High-Quality Development Research, Beijing Academy of Science and Technology, Beijing, China
- 3School of Economics and Trade, Henan University of Technology, Zhengzhou, China
- 4Technology Innovation Strategy Research and Technology Transfer Promotion Center of Shenzhen, Shenzhen, China
Introduction: The fragility of agriculture makes the food supply chain vulnerable to external risks such as epidemic, conflict, disaster, climate change, economic and energy crisis. The COVID-19 pandemic has spread and continued globally in recent years, resulting in food supply chain disruption and insecurity, which triggers profound reflection on the impacts of public health events (PHEs). Studying the impacts of PHEs on the resilience of food supply chain has great significance to effectively reduce the risks of disruption and insecurity in the future.
Methods: Based on the composition of PHEs and the division of food supply chain, this paper adopted the nonlinear Granger causality test to verify the nonlinear causal relationship between PHEs and proxy variables in the food supply chain; then the TVP-VAR-SV model was constructed and its three-dimensional pulse response results were matched with the sensitivity, recovery, and adaptation of the food supply chain resilience to deeply explore the dynamic impacts of PHEs.
Results: PHEs has significant nonlinear conduction effects on the resilience of food supply chain, the impacts of PHEs on the partial sector resilience have significant dynamic characteristics in the whole sample period, and the impacts of PHEs on the recovery and adaptation aspects of food supply chain resilience have structural break characteristics.
Discussion: The differences, dynamic characteristics and structural breaks of the impacts of PHEs on the resilience of food supply chain are caused by the infectivity and mortality of PHEs, attributes of food products, regulation of supply and demand in the market, behavioral decisions of all participants, changes in the policy environment, and coordination and upgrading of all sectors in the supply chain.
1 Introduction
Food security concerns survival, development, stability and harmony. In both Millennium Development Goals (MDGs) and Sustainable Development Goals (SDGs), proposed in 2000 and 2015, respectively, eradicating hunger, ensuring food security and improving nutrition have always been the focus of the United Nations and the world (UN, 2001, 2015). However, the fragility of food industry makes it vulnerable to external risks. The impacts of pandemics, conflicts, disasters, climate change, economic and energy crisis in recent years have exacerbated the risk of global food supply chain rupture (FSIN, 2022; Li and Lin, 2023). The continuous spread of COVID-19 in the world, in particular, has brought more challenges to the food supply chain and further worsened the global food security (Swinnen and Vos, 2021). The supply chain disruption, economic recession and regional conflicts caused by COVID-19 have led to a significant increase in the number of hunger worldwide (FSIN, 2022). The number of people affected by hunger in the world in 2021 is about 702 to 828 million, an increase of 150 million compared with that before the outbreak of the COVID-19 at the end of 2019, which further frustrates the achievement of SDGs 1 and SDGs 2 in 2030 (FAO et al., 2022). Although the pandemic is coming to an end, its impacts on the food supply chain still exists. In order to effectively reduce the negative impacts of major health events on the food supply chain in the future, relevant research is of great theoretical and practical significance.
Public health events (PHEs) refers to major infectious diseases and congregative diseases of unknown causes, which occur suddenly and may cause serious damage to residents’ health (Yang et al., 2020). They are characterized by sudden outbreak, huge destruction, rapid spread and unpredictability (Duan et al., 2021). Such serious infectious diseases as COVID-19 have extensive and far-reaching economic and social impacts (Bloomberg, 2020; Ivanov and Das, 2020; Goel and Haruna, 2021). Smooth operation of the supply chain is crucial to economic development and social stability (Salvatore, 2020). PHEs can conduct risks to areas unaffected by the pandemic through the supply chain. Food supply chain refers to the complex network chain that starts from the initial raw materials suppliers, and goes onto food producers and sellers before finally reaching the consumers. It involves capital flow, information flow and logistics (Zhang, 2022). The risk of the food supply chain is an extension of the general supply chain risk, which comes from the uncertainty of its internal composition and external environment (Diabat et al., 2012). The external uncertainty of PHEs, in particular, has serious and unpredictable impacts on food supply chain (Li and Song, 2022). Recently, PHEs caused frequent disruptions of the food supply chain. In particular, the COVID-19 has exposed the weaknesses in food supply chain (Chenarides et al., 2021), and lead to an upsurge of studies on the impacts of PHEs on food supply chain.
The impact of PHEs on the food supply chain is multifaceted. Firstly, PHEs disrupts the food supply chain of all countries in the world by affecting food production. For example, during COVID-19, at least 93 farms, 462 meat packaging plants and 257 food processing plants in the United States were seriously affected (Aday and Aday, 2020). Xinfadi wholesale market (one of the largest wholesale markets of agricultural products in China) was also closed for 63 days due to COVID-19 (FDPGBM, 2021), which had significant negative impacts on upstream and downstream enterprises of the local food supply chain. Secondly, due to the ambiguity and lack of mandatory restrictions on grain exports in international standards (Zhong and Chen, 2020), some major grain exporting countries (such as Ukraine, Russia, etc.) announced the suspension, prohibition of grain exports or the imposition of quotas and other restrictive measures on some agricultural products during COVID-19, which increased the risk of disruption of agricultural trade and input supply (World Bank, 2020), and had serious impacts on the global food supply chain (Chen et al., 2020). Finally, the restriction of personnel flow, production stagnation, economic downturn and income reduction caused by PHEs (Hobbs, 2020; Swinnen and Mcdermott, 2020; Mahajan and Tomar, 2021) affected the people’s ability to obtain food, which is even worse for the low-income groups (FSIN, 2022). COVID-19 led to an 82% decline in the income of informal workers worldwide (ILO, 2020), and their ability to obtain food decreased significantly. Food security of the lowest income groups is an even bigger concern.
The supply chain resilience refers to the capacity of tolerance or restoration of partial sector or entire chain response to risks and uncertainties (Ali et al., 2021). The food supply chain has the same structure and function as the general product supply chain, but due to the fragility of agricultural production and the seriousness of food safety, the resilience of food supply chain is also relatively low. Preparation, response, recovery, and adaptation are considered the most basic analyses in supply chain resilience analysis (Adobor and McMullen, 2018; Stone and Rahimifard, 2018). After considering the impact of risk interruption on supply chain resilience, resilience will be defined as the capacity to predict, avoid, and adapt to interruptions and changes (Ortiz-de-Mandojana and Bansal, 2016). Resilience elements are management practices and fundamental components that support the implementation of various functions in the food supply chain (Tukamuhabwa et al., 2015; Ali et al., 2021). When the food supply chain facing severe risks, especially large-scale disasters such as the COVID-19 pandemic, the Russia-Ukraine conflict, and extreme weather, how to manage interruptions and quickly resume the operation of the supply chain is an important criterion for ensuring regional food security.
In existing studies on the impacts of PHEs on the resilience of food supply chain, assessing the impact of epidemics or disasters on food supply chain disruptions is the most common. For example, evaluating the impact of major public health events such as Avaian influenza A (H7N9), African swine fever, influenza A/H1N1, and COVID-19 on disruptions in poultry meat and grain supply (Dhand et al., 2011; Khokhar et al., 2015; Jiang et al., 2021; Laborde et al., 2021; Yao et al., 2022; Zhang and Sun, 2022), its main research methods include phenomenology, assessment, statistics, simulation, etc. Secondly, it is necessary to evaluate the preparedness for future PHEs based on the existing food supply chain system and propose new designs for the food supply chain to enhance resilience. For example, performance indicators are constructed for evaluation and analysis from aspects such as cost effectiveness, demand fulfillment, and resilience measures (Yu and Nagurney, 2013; Martínez-Guido et al., 2021; Singh et al., 2021), its main research methods include assessment, phenomenology, grounded theory, simulation, and critical theory. In addition, research on improving the resilience of food supply chains is gradually emerging with the application of new technologies. For example, new approaches such as integrated modeling, genotyping technology, and biosensor technology are applied to identify contamination sources and track contaminated food, in order to enhance the resilience of the food supply chain (Keeratipibul et al., 2015; Matta et al., 2018; Schlaich et al., 2020).
The sudden, destructive and unpredictable nature of PHEs puts China’s food supply chain at great risk. The disruption of China’s food supply chain will seriously threaten the normal operation of the global food supply system and affect food security of other countries in the system. The importance of China’s food safety to global food supply system in the context of PHEs is self-evident, and the research on the impacts of PHEs on the safety of China’s food supply chain is of great practical significance. In analyzing the impacts of PHEs on the resilience of the food supply chain, existing research mainly uses phenomenology, assessment, statistics and simulation methods, especially event analysis, which includes phenomenology and assessment, has been widely applied (Li and Song, 2022; Perdana et al., 2022). However, due to the heterogeneity, nonlinearity, and time-varying nature of PHEs’ impacts, the common test method and time series model cannot meet the requirements of the analysis (Swinnen and Mcdermott, 2020; Li and Song, 2022; Azevedo et al., 2023), which may lead to a weakening of evaluation effectiveness. Therefore, selecting appropriate research methods and approaches is crucial for a deeper learning of the impacts of PHEs on the resilience of food supply chain.
This paper first selected the types of infectious diseases included in PHEs by synthesizing national notifiable diseases (Class A and B) and zoonotic infectious diseases. Food supply chain was divided into raw material production and supply sector, food processing and manufacturing sector, and food distribution and consumption sector. Proxy variables were selected for each sector to study the impacts of PHEs on food supply chain. Meanwhile, considering that the nonlinear Granger causality test can more accurately identify the nonlinear conduction relationship between variables (Diks and Panchenko, 2006), and the TVP-VAR-SV model can more accurately capture the time-varying effects between variables in the whole sample period (Nakajima, 2011). This paper has some innovation points: firstly, using the nonlinear Granger causality test to verify the nonlinear conduction of PHEs to each proxy variable, as the basis for adapting time-varying model applications; secondly, a TVP-VAR-SV model was constructed, and its three-dimensional impulse response was used to deeply explore the dynamic impacts of PHEs on the resilience of food supply chain from the aspects of response, recovery, and adaptation. It is expected to provide theoretical basis and practical experience for effectively reducing the damage of major health emergencies to food supply chain in the future.
2 Materials and methods
2.1 Selection of public health events
The focus of this paper is to explore the impacts of PHEs on each sector of the food supply chain. Referring to Li and Song (2022) for the selection of PHEs, it took the number of deaths caused by national notifiable diseases (Class A and B) and zoonotic infectious diseases as the proxy variable for PHEs. National notifiable diseases (Class A and B) include 30 infectious diseases such as COVID-19, SARS and H1N1, and zoonotic infectious diseases include 29, such as BSE, rabies and anthrax. Their classification is shown in Figure 1A. Because they have some common diseases (H1N1, H5N1, H7N1, H7N9, rabies, asthma, brucellosis, leptospirosis, and schizophrenia), the number of deaths of these common diseases was counted once to prevent statistical errors due to repeated counting. From January 2005 to December 2021, the number of deaths caused by National notifiable diseases (Class A and B) and Zoonotic infectious diseases is shown in Figure 2B. Based on the principles of trough-peak division and specific types of diseases, 13 periods with a large number of deaths were identified. In terms of the time of the outbreak of specific diseases, COVID-19 in Period 13 is the main reason for the sharp increase in the number of deaths in recent years, and more than 3,300 people died in Period 13 alone. Highly pathogenic avian influenza (H5N1, H7N1, H7N9, etc.) and influenza A (H1N1) occurred continually from Period 1 to Period 10, resulting in more than 1,500 deaths in the sample time. Hemorrhagic fever, malaria, leptospirosis, schistosomiasis, rabies, brucellosis and anthrax are the reasons for the increase in the number of deaths within the sample time. Class A infectious diseases (cholera and plague) with high mortality rate broke out during Period 2, Period 3, Period 6 and Period 11, but did not lead to a pandemic or mass mortality, thanks to China’s pandemic prevention policies and measures. Additionally, Japanese encephalitis occurred continually from Period 1 to Period 12, causing great impacts on food and health safety.
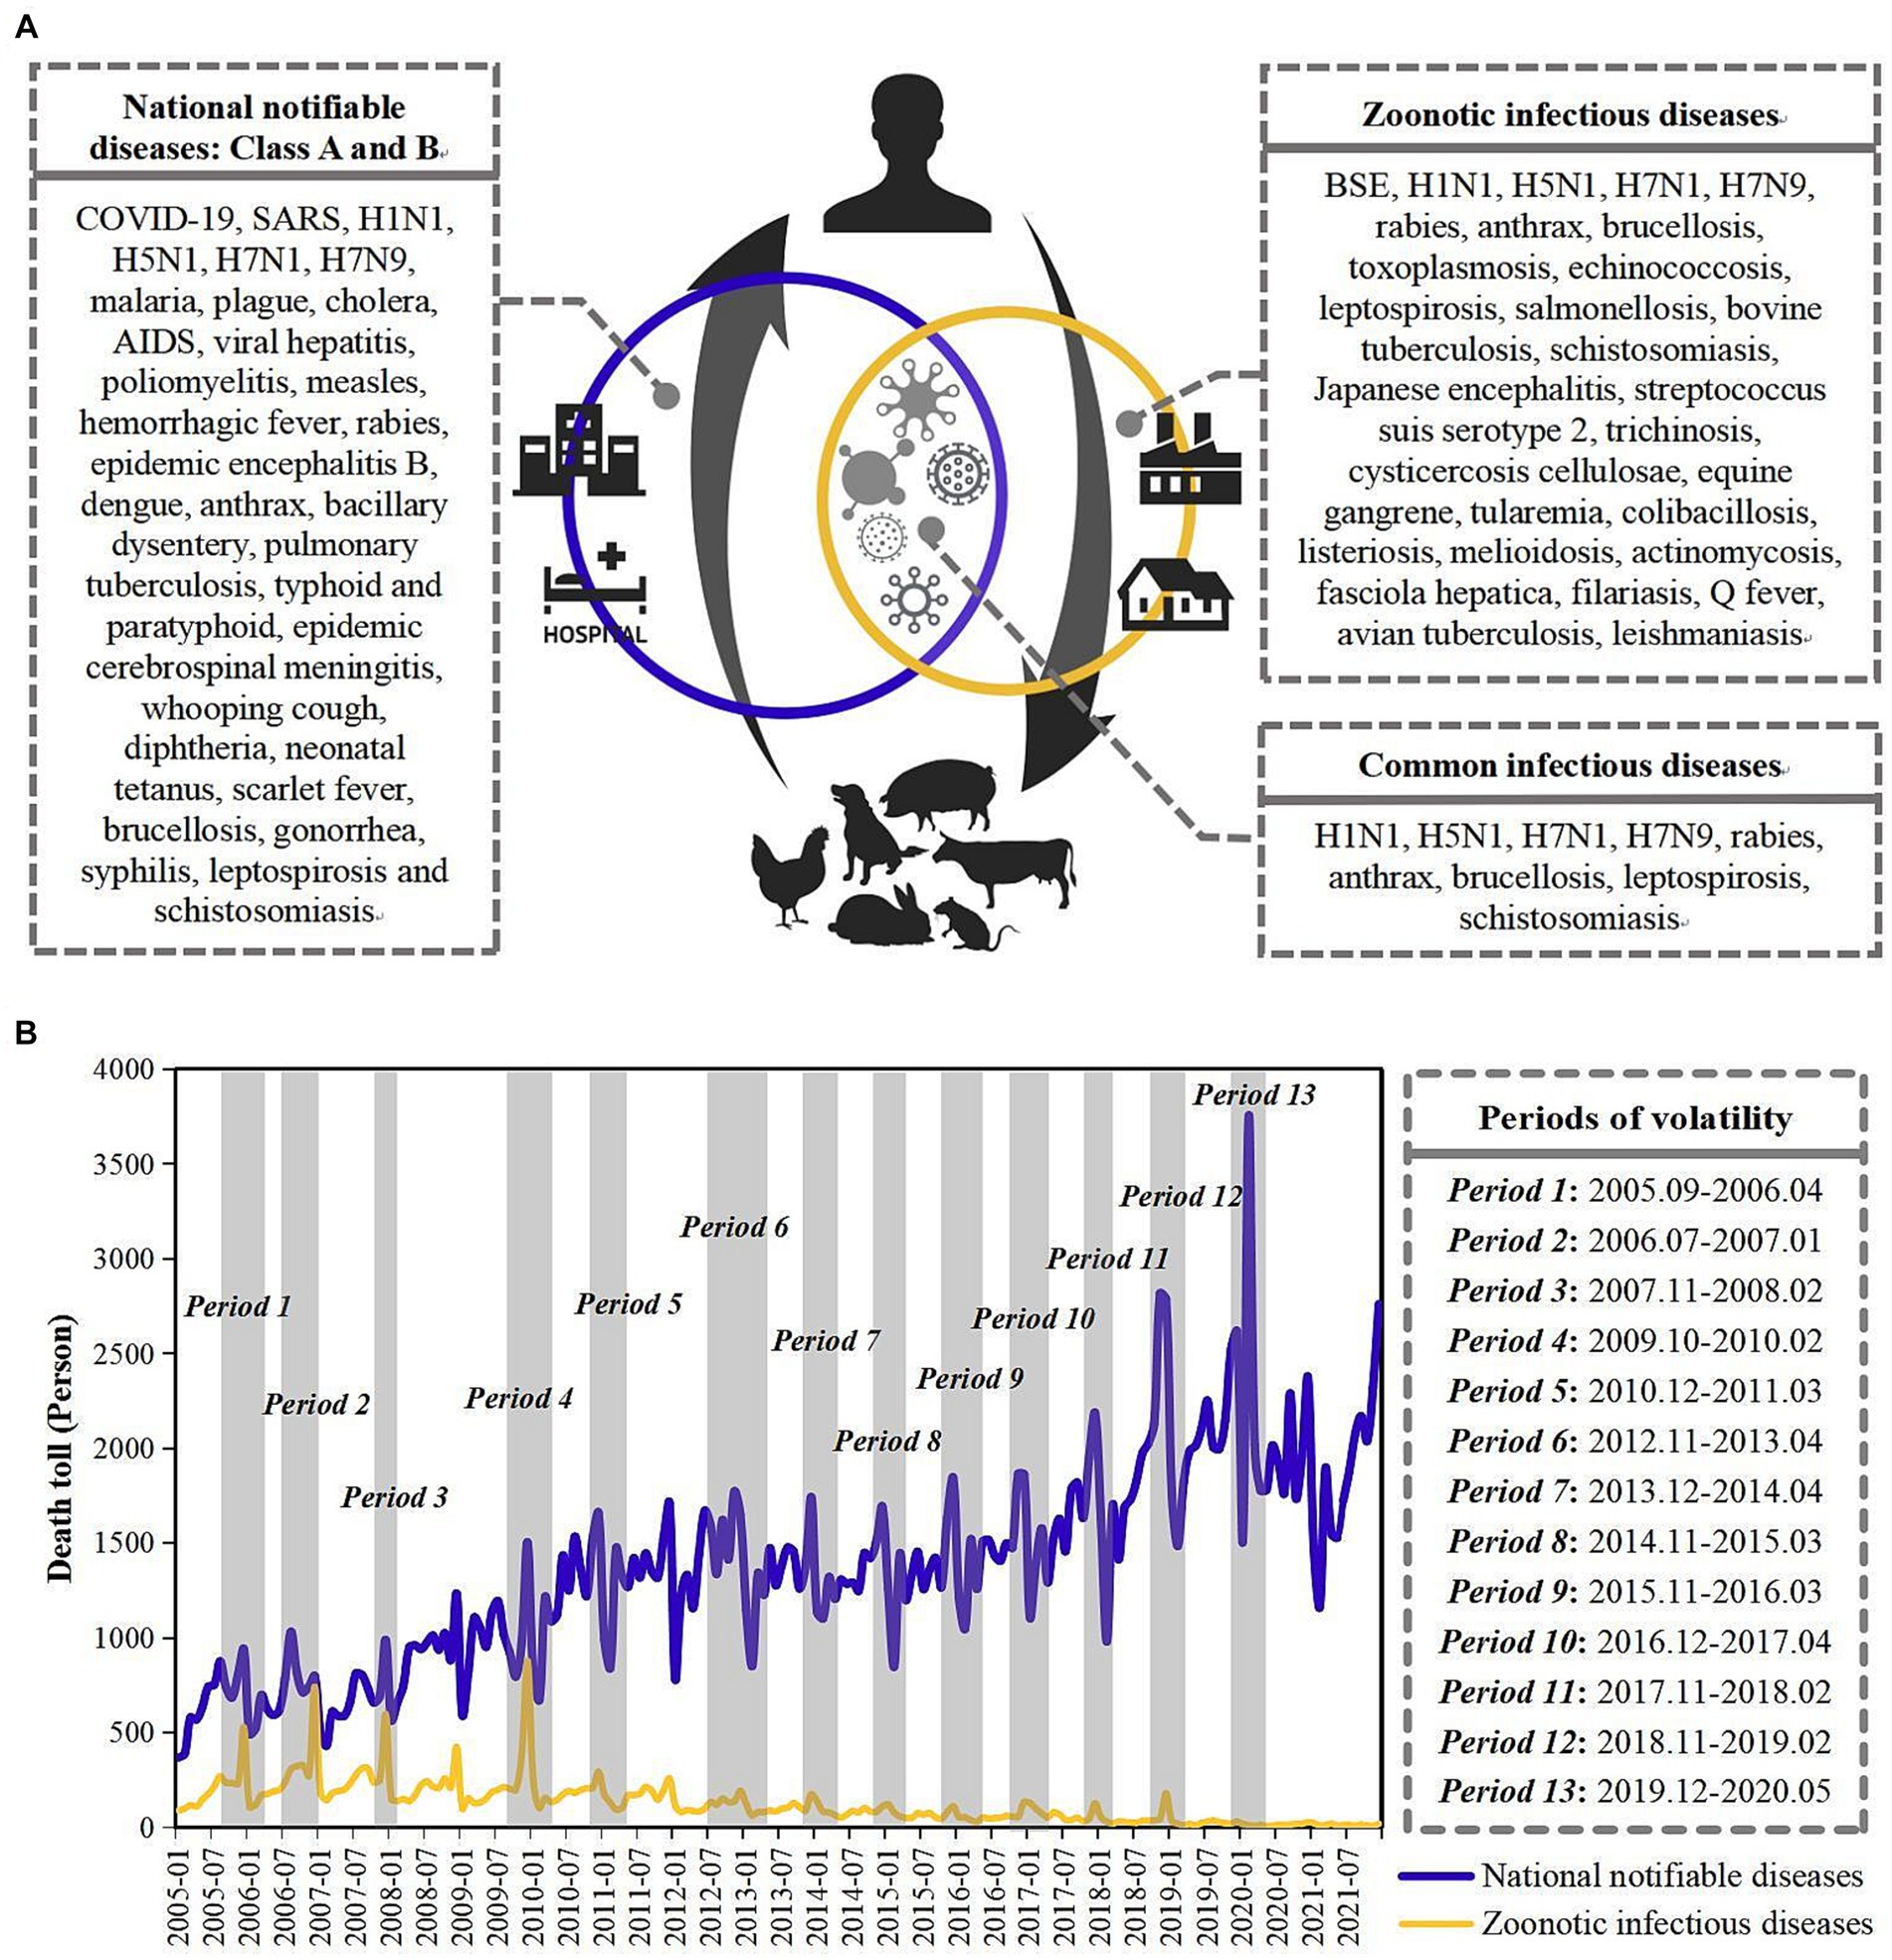
Figure 1. Classification, composition, and mortality of public health events. (A) is the classification and composition of public health events. (B) is the trends of mortality of public health events.
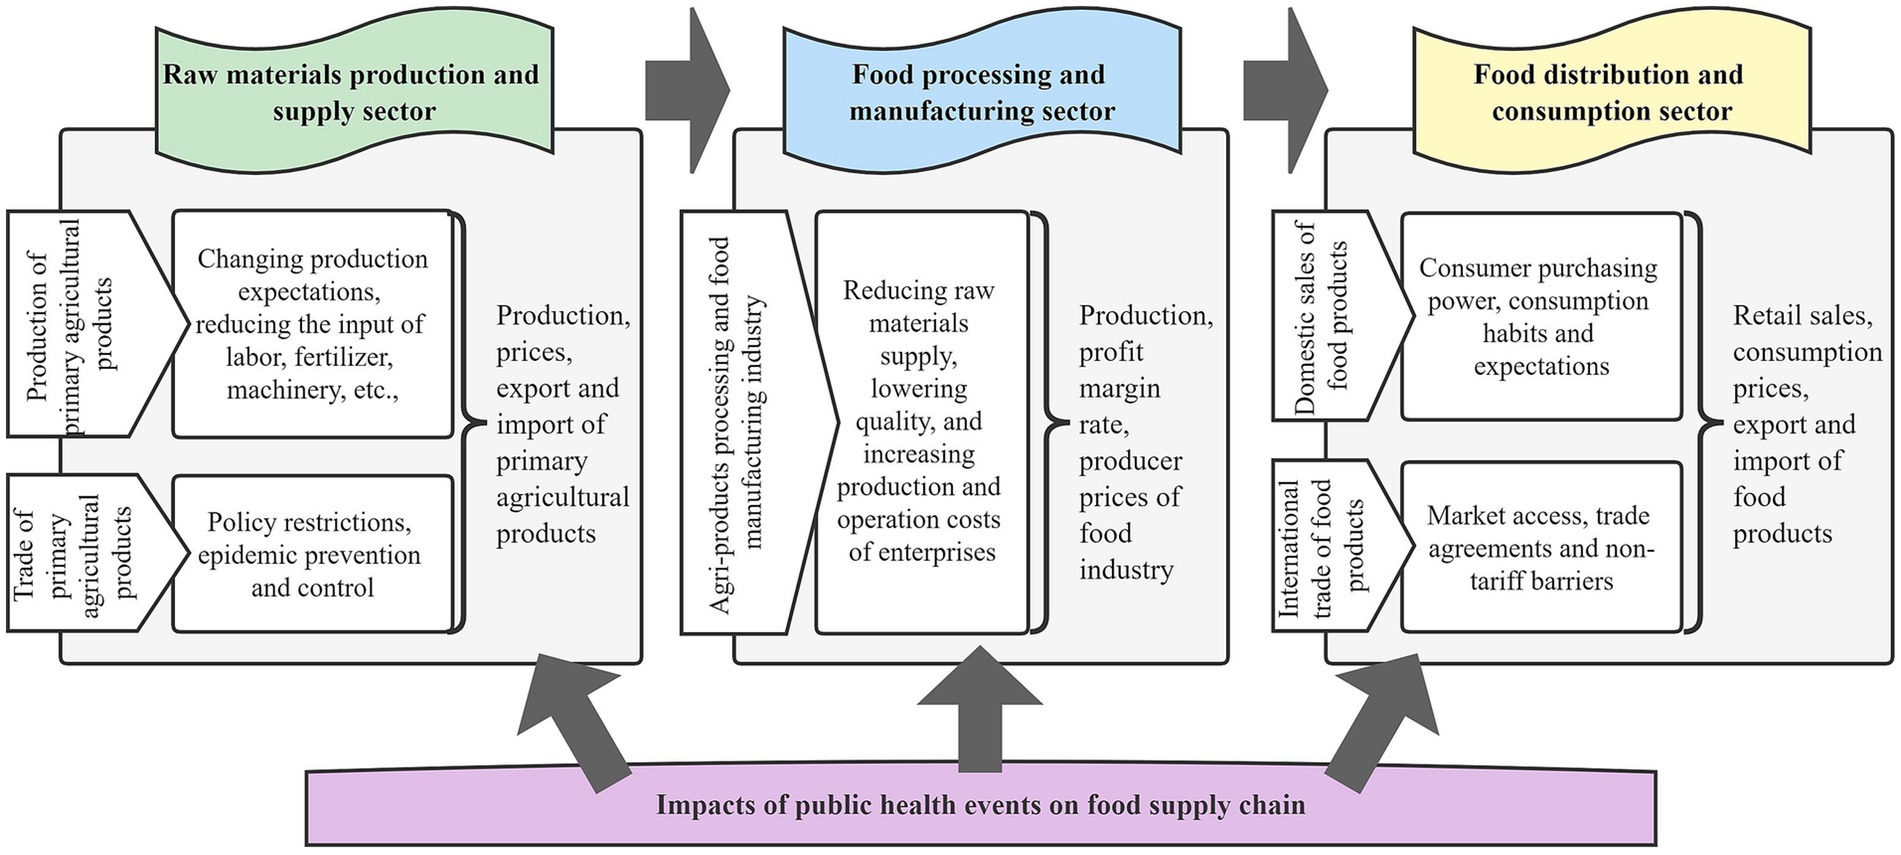
Figure 2. Composition of food industry chain and the influence mechanism.
2.2 Composition and division of food supply chain
Food supply chain generally refers to the network chain that starts from the initial food raw materials supply, and goes onto food production, transportation and sales, before finally reaching the consumers (Song and Zhuang, 2017; Zhang, 2022). Therefore, the food supply chain can be simply divided into raw material production and supply sector, food processing and manufacturing sector, and food distribution and consumption sector (Schipanski et al., 2016). First of all, raw materials production and supply sector refers to the production and trade of primary agricultural products as raw materials. PHEs can affect the output and price of primary agricultural products by changing production expectations, reducing the input of labor, fertilizer, machinery, etc., and affect the trade of related primary agricultural products through policy restrictions, epidemic prevention and control, etc. (Gu and Wang, 2020; Laborde et al., 2021; Stephesns et al., 2022). Secondly, food processing and manufacturing sector refers to the process of processing and manufacturing primary agricultural products to obtain food products. PHEs can affect food output, price and profit by reducing raw materials supply, lowering quality, and increasing production and operation costs of enterprises (Khokhar et al., 2015; Perdana et al., 2022). Finally, food distribution and consumption sector refers to the process in which dealers transport food to domestic or international markets for sale. PHEs can influence food sales, prices and trade through market access, trade agreements, non-tariff barriers, consumer purchasing power, consumption habits and expectations (Davis et al., 2021; Suyo et al., 2021; Azevedo et al., 2023). The influence mechanism of PHEs on all sectors of the food supply chain is shown in Figure 2.
Based on the sector division of the food supply chain and risk identification of the impacts of PHEs, this paper examined the impacts of PHEs on the resilience of food industry chain by selecting proxy variables. In raw materials production and supply sector, output value of primary agricultural products (OVPAP), price of primary agricultural products (PPAP), export amount of primary agricultural products (EAPAP), and import amount of primary agricultural products (IAPAP) were selected as proxy variables, in consideration of the significant impacts of PHEs on output, price and trade volume of raw materials, and the availability of data. In food processing and manufacturing sector, PHEs has great impacts on food output, producer price, industry profit margin, etc. Therefore, output value of food industry (OVFI), product margin rate of food industry (PMRFI), and producer price of food industry (PPFI) were selected as proxy variables. In food distribution and consumption sector, PHEs has great impacts on sales, price and trade, so retail sales amount of food products (RSAFP), export amount of food products (EAFP), import amount of food products (IAFP), and consumption price of food products (CPFP) were selected as proxy variables.
The change trends of proxy variables in each sector of the food supply chain are shown in Figure 3. In raw materials production and supply sector, the fluctuation range of OVPAP, PPAP, EAPAP, and IAPAP was large before 2009 (especially during October 2006–November 2008), and was significantly reduced after 2009 (Figure 3A). In food processing and manufacturing sector, the fluctuation range of OVFI, PMRFI and PPFI increased significantly from March 2005 to June 2012, then slowed down from July 2012 to July 2017, and increased significantly again after August 2017 (Figure 3B). In food distribution and consumption sector, RSAFP, EAFP, IAFP, and CPFP fluctuated significantly during the whole sample period (Figure 3C). It can be concluded that the fluctuation of each proxy variable does not have simple correspondence with the fluctuation of PHEs. Based on the lagged impacts and the nonlinear principle of conduction (Foroutan and Lahmiri, 2022), this paper built a nonlinear test and dynamic analysis model for empirical study.
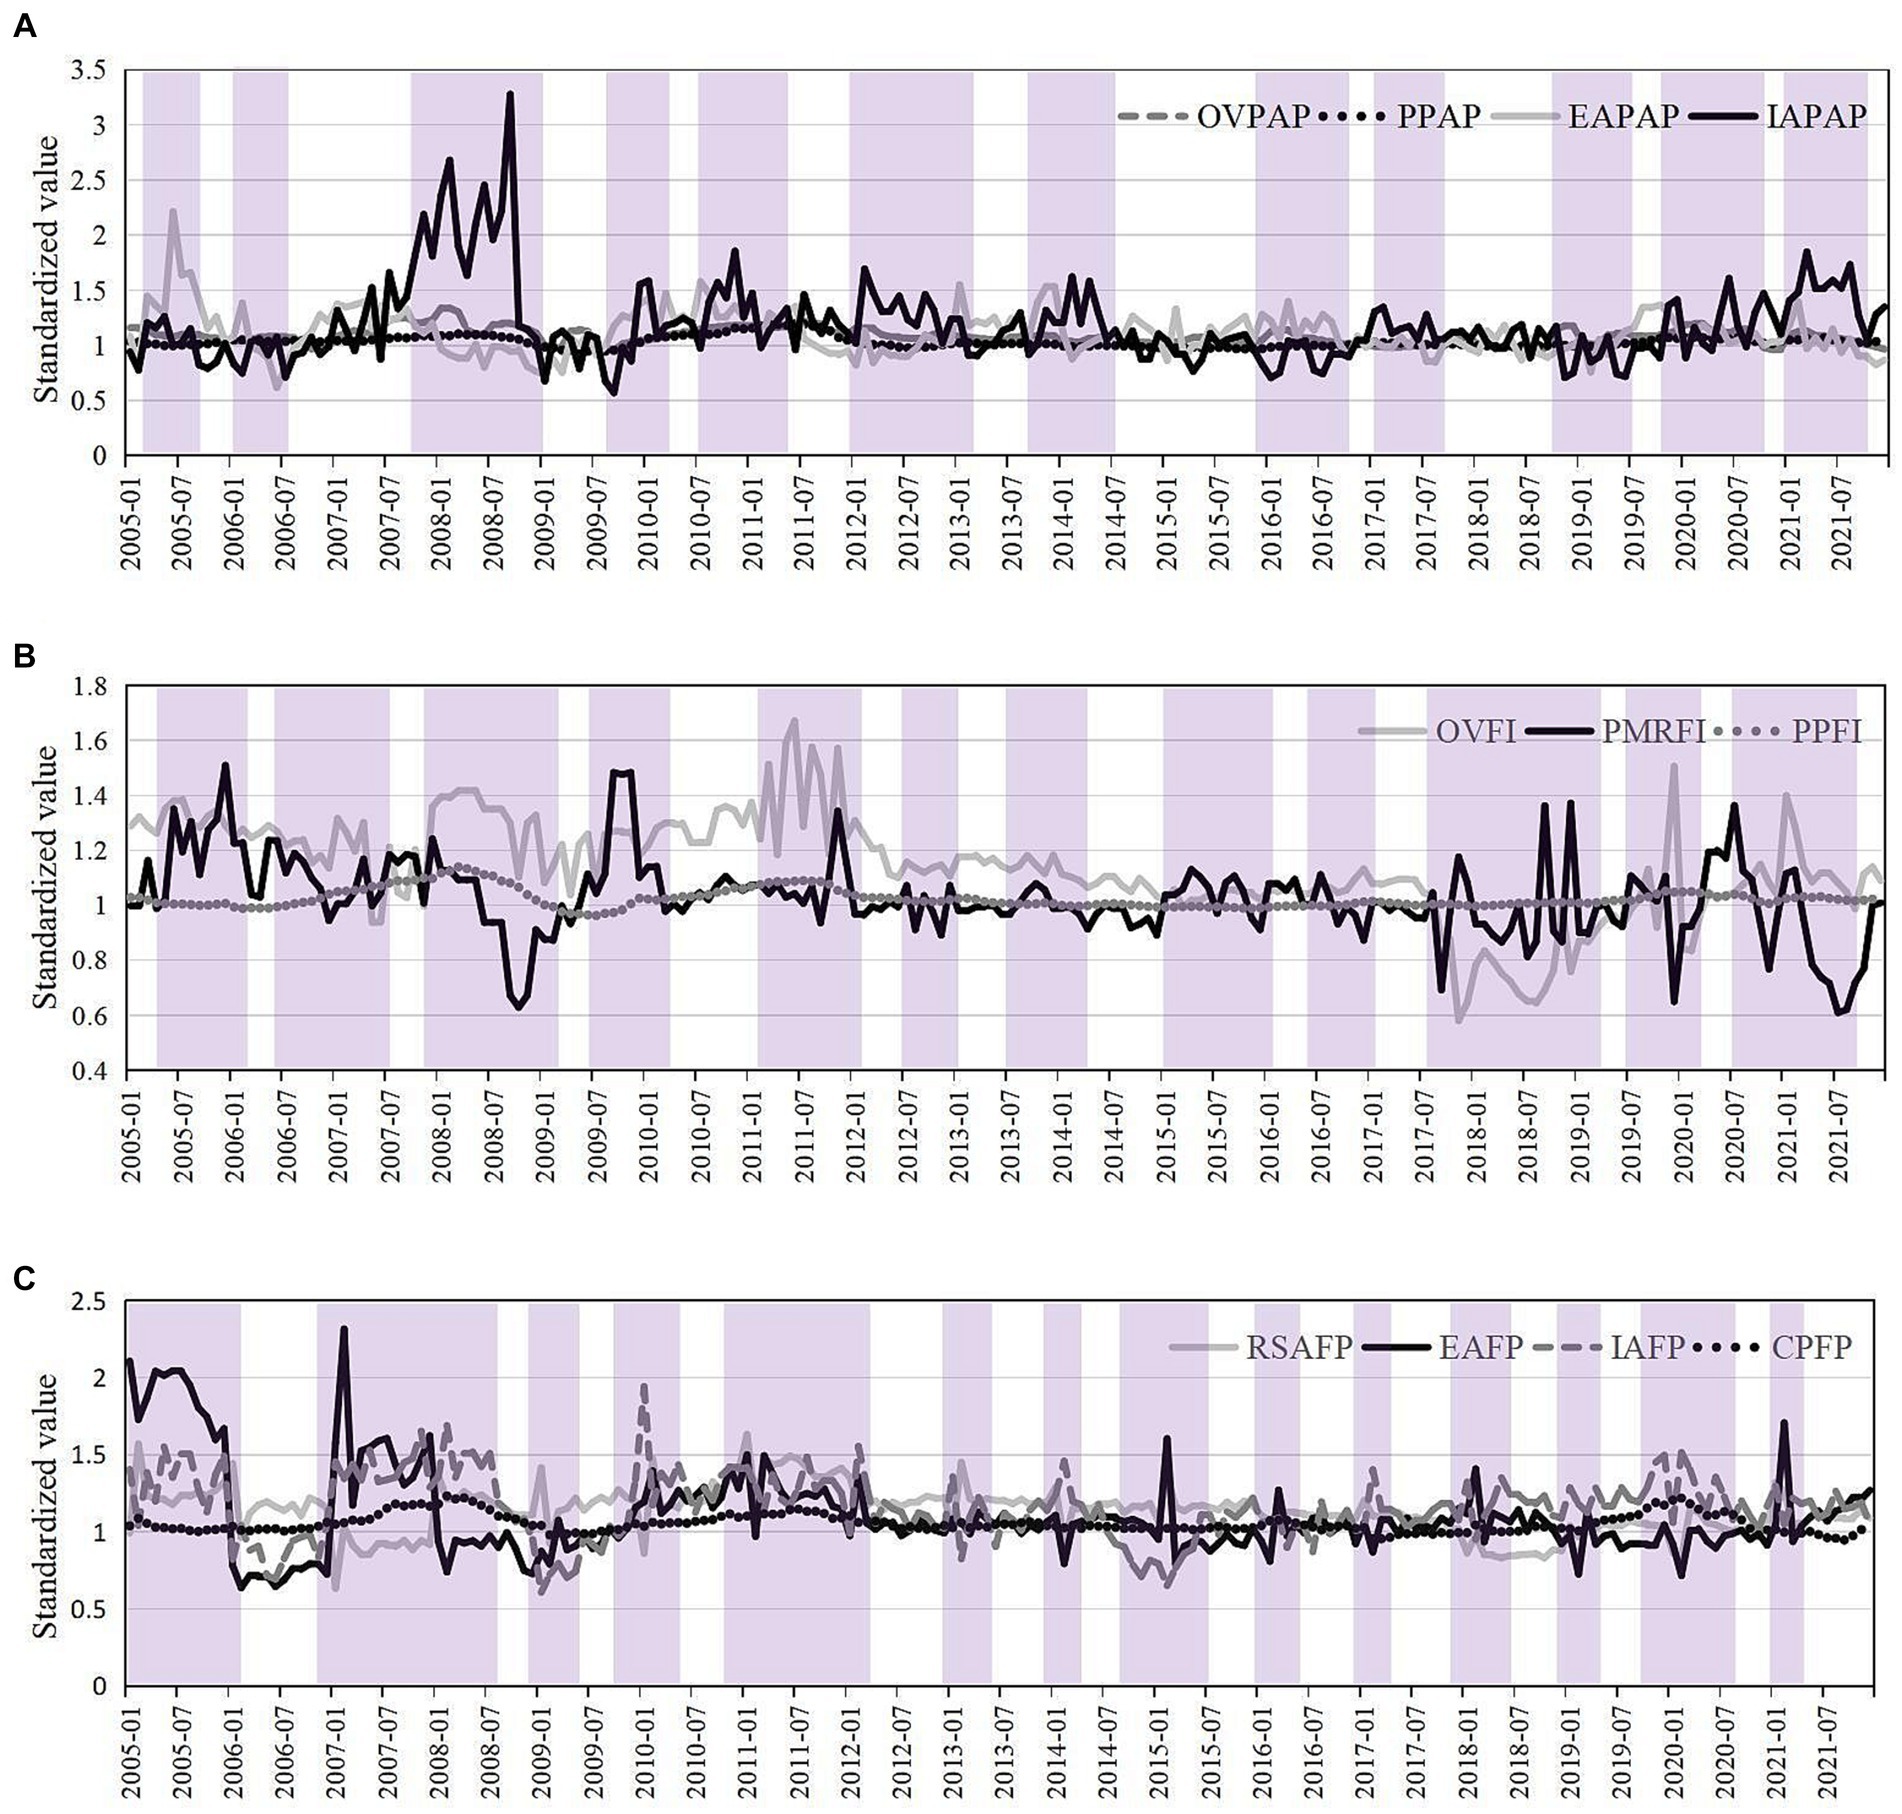
Figure 3. Change trends of proxy variables in each sector of the food supply chain. (A) is the change trends of proxy variables in raw materials production and supply sector. (B) is the change trends of proxy variables in food processing and manufacturing sector. (C) is the change trends of proxy variables in food distribution and consumption sector.
2.3 Construction of empirical models
2.3.1 Nonlinear granger causality test
Considering the heterogenity, nonlinear and time-varying nature of PHEs’ impacts (Li and Song, 2022; Azevedo et al., 2023), the Nonlinear Granger causality test can more accurately identify the nonlinear conduction relationship between variables (Diks and Panchenko, 2006), the paper uses the non-linear Granger causality test proposed by Diks and Panchenko (2006) to identify the nonlinear conduction effects of PHEs on the proxy variables in each sector of the food supply chain. Diks and Panchenko (2006) based on the linear Granger causality model, filtered out the linear predictive ability between sequences, and extracted the corresponding information from the residual to analyze the nonlinear Granger causality. and are two time series, is the m-dimension leading vector of , is the period lag vector of , is the period lag vector of (Eqs. 1–3):
Given , and , and any small constant ; if satisfies the conditional probability of Eqs. (4), (5), then is not the strictly nonlinear Granger cause of .
where, represents the probability, represents the maximum norm. If the conditional probability of the right sequence (that is, the influence probability of the lagging sequence on the leading sequence) in Eq. (4) is given, whether there is sequence as the condition, it will not affect the result, then is not the Granger cause of . The conditional probability in Eq. (4) can also be expressed by Eqs. (6–10):
where,
Assuming that and are strictly stationary and satisfy the mixing condition, Diks and Panchenko (2006) constructed the following statistics of asymptotic normal distribution based on the original assumption that “ is not the strict Granger cause of ”:
where, ; is the asymptotic variance of the modified test statistic. According to the statistics of Eq. (11), we can test the estimated residual series of the two VAR models of Eqs. (12), (13) in turn. If the original hypothesis of Granger’s non-causality is rejected, there is a nonlinear causality between the two sequences.
where, , , and are estimated parameters; and are residual sequences; , , and are lag orders.
2.3.2 TVP-VAR-SV model
TVP-VAR-SV model can more accurately capture the time-varying effects between variables in the whole sample period (Nakajima, 2011). Therefore, this article constructs a TVP-VAR-SV model and matches its three-dimensional pulse response results with the sensitivity, recovery, and adaptation of the food supply chain resilience to deeply explore the dynamic impact of PHEs on various proxy variables. The construction of TVP-VAR-SV model starts from the structural VAR model, and the general structural VAR model (Eq. 14) can be expressed as:
where is a vector of observed variables; is a matrix of time-varying coefficients; is a vector of structural impact; assuming that , is a diagonal matrix, and is a lower-triangular matrix (Eq. 15).
Assuming that , and the structural VAR model can be written as Eq. (16):
where is the stacked row vector; define , stands for the Kronecker product, and the reduced-form structural VAR can be expressed as Eq. (17):
Then, assuming that all parameters are time-varying, the model is extended to Eq. (18):
where , , are time-varying, thus the above expression is Time-Varying Parameter VAR model.
The elements of are compiled in a vector , define , 且 (Nakajima, 2011). Thus, assuming that the parameters in TVP-VAR-SV model are following the random walk process as (Eqs. 19–21):
The Markov Chain Monte Carlo (MCMC) method is used to estimate the parameters. The steps are: (1) ① Set , , is the prior probability density of , set the initial value of , , and ; (2) ② Set the values of , , and , sample ; (3) ③ Set the values of , sample ; (4) ④ Set the values of , , and , sample ; (5) ⑤ Set the values of , sample ; (6) ⑥ Set the values of , , and , sample ; (7) ⑦ Set the values of , sample ; (8) ⑧ Return to the step (2) ②.
2.4 Data sources
Considering the multiple and frequent of PHEs, the monthly data can better describe the dynamic and nonlinear impacts of PHEs on food supply chain. Therefore, the paper selects the monthly data of PHEs and food supply chain from January 2005 to December 2021 as the research sample. In the composition of PHEs, the data of national notifiable diseases (Class A and B) comes from the National Health Commission of the People’s Republic of China, and the data of zoonotic infectious diseases comes from the Ministry of Agriculture and Rural Affairs of China, and supplemented with the EM-DAT database. In the composition of food supply chain, the raw materials production industry is subdivided into animal husbandry and plant planting; the agri-products processing industry is subdivided into grain grinding, feed processing, vegetable oil processing, sugar manufacturing, slaughtering and meat processing, aquatic products processing, vegetable, fungus, fruit and nut processing, and other agri-products processing; the Food manufacturing industry is subdivided into Baked food manufacturing, Candy, chocolate and preserves manufacturing, Convenience food manufacturing, Dairy manufacturing, Manufacture of condiments and fermented products manufacturing, and other food manufacturing, the specific classification and HS code for international trade are shown in Supplementary Table S1. The data of OVPAP, PPAP, OVFI, PMRFI, PPFI, RSAFP, and CPFP comes from the National Bureau of Statistics of China; the data of EAPAP, IAPAP, EAFP, and IAFP comes from the China Customs Database. Standardizing all series to better apply the nonlinear Granger causality test and TVP-VAR-SV model (mean value is 0, standard deviation is 1).
3 Results and analysis
3.1 Results of nonlinear granger causality test
Under the analysis framework of TVP-VAR-SV model, it is important to examine the causal relationship between variables. This paper uses the non-linear Granger causality test proposed by Diks and Panchenko (2006) to identify the nonlinear conduction effects of PHEs on the proxy variables in each sector of the food supply chain, the results are shown in Table 1. To clearly reflect the non-linear impacts of PHEs on all sectors of the food supply chain, this paper introduces the general Granger causality test (linear Granger causality test) for comparative analysis. According to the results of Granger causality test, PHEs has only significant linear conduction effects on RSAFP (Lag = 2–3) and CPFP (Lag = 1–8), while the linear Granger test results of other proxy variables are not significant in the lag phases.
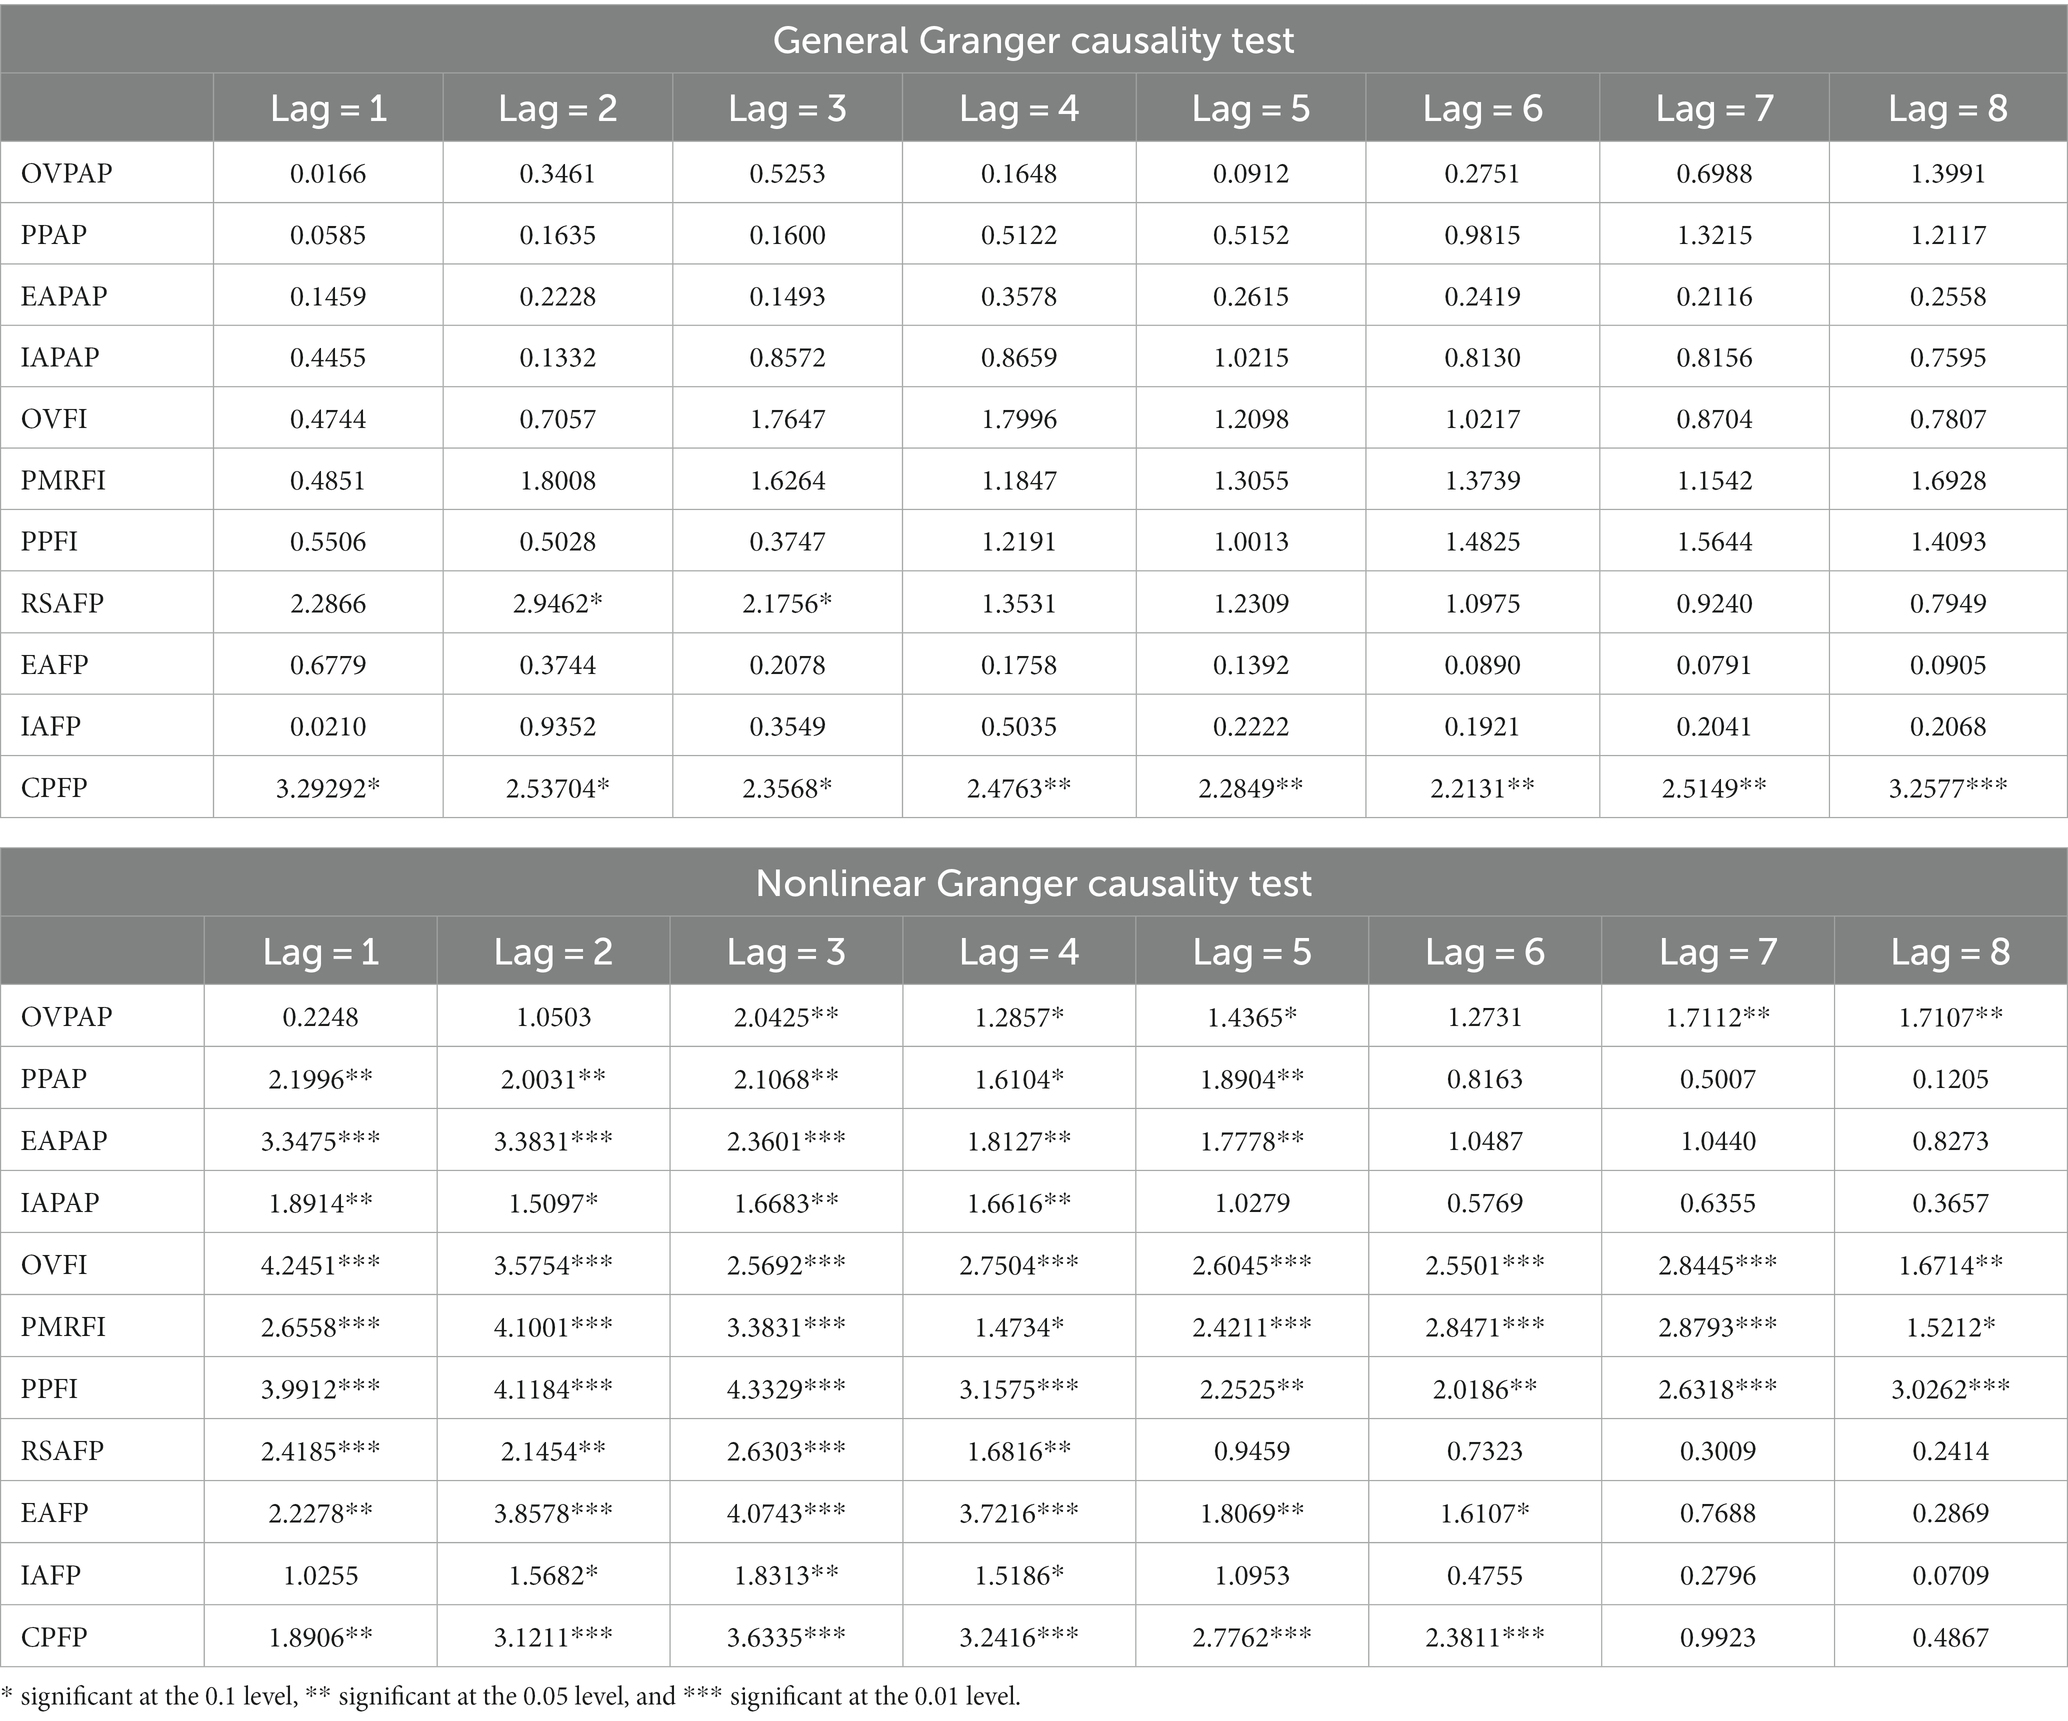
Table 1. Results of general Granger causality test and nonlinear Granger causality test.
Meanwhile, according to the results of nonlinear Granger causality test, PHEs has significant nonlinear conduction effects on the proxy variables in each sector of the food supply chain. Thus, compared with general Granger causality test, the nonlinear Granger causality test can better explain the nonlinear transmission of PHEs to proxy variables. Specifically, PHEs has significant nonlinear conduction effects on OVPAP after the 3rd lag phase; PHEs has significant nonlinear conduction effects on PPAP and EAPAP from the 1st lag phase to 5th lag phase; PHEs has significant nonlinear conduction effects on IAPAP and RSAFP from the 1st lag phase to 4th lag phase; PHEs has significant nonlinear conduction effects on OVFI, PMRFI and PPFI during the whole lag phase; PHEs has significant nonlinear conduction effects on EAFP and CPFP from the 1st lag phase to 6th lag phase; PHEs has significant nonlinear conduction effects on IAFP from the 2nd lag phase to 4th lag phase.
Comparison of different nonlinear conduction of PHEs to each proxy variable shows that in raw materials production and supply sector, PHEs has lagged impacts on OVPAP, which is mainly related to the growth cycle of primary agricultural products (Gu and Wang, 2020; Stephesns et al., 2022). PHEs has rapid impacts on PPAP, EAPAP, and IAPAP, and significant conduction effects appear in the first lag phase, which shows that sellers and traders in the raw material market can make quick response to PHEs. In food processing and manufacturing sector, the conduction effects of PHEs on the proxy variables OVFI, PMRFI and PPFI last long, indicating a long-term impact of PHEs on China’s food production. In food distribution and consumption sector, PHEs has conductive effects on RSAFP and IAFP in the short term, and on EAFP and CPFP in the long term, which may be related to China’s trade policy, emergency measures and macro-regulation (Pu and Zhong, 2020; Li and Song, 2022). In summary, based on the results of nonlinear Granger causality test, all variables can be further analyzed with the impulse response method of time series.
3.2 Three-dimensional impulse response result analysis
Based on the stationary test of data and the nonlinear Granger causality test of variables, this paper used the TVP-VAR-SV model to explore the three-dimensional impulse response of each sector in the food supply chain to PHEs’ impulses, then matched the impulse results with the response, recovery, and adaptation of the supply chain resilience, to delve into the dynamic characteristics and structural breaks of PHEs on the resilience of each sector in the food supply chain.
This paper established TVP-VAR-SV model for empirical analysis in raw materials production and supply, food processing and manufacturing, distribution and consumption sector, respectively. Before empirical analysis with TVP-VAR-SV model, MCMC method was used to simulate 10,000 samplings and the parameter estimation results of raw materials production and supply, food processing and manufacturing, distribution and consumption sector were obtained, as shown in Table 2. Table 2 details the posterior mean, posterior standard deviation, 95% confidence interval limit, convergence diagnostic value and invalid factor of the three groups of models. The posterior mean of each parameter in the model is within 95% confidence interval, and the convergence diagnostic value is less than the critical value 1.96 at 5%, so the null hypothesis of convergence to the posterior distribution cannot be rejected. In the model of raw materials production and supply sector, the maximum invalid influence factor of the parameter is 5.88, indicating that at least 1,700 valid samples are obtained from the 10,000 samplings, and the MCMC sampling results can meet the posterior inference of TVP-VAR-SV model. Likewise, it can be proved that the MCMC sampling results of food processing and manufacturing, distribution and consumption sector also meet the posterior inference of the model.
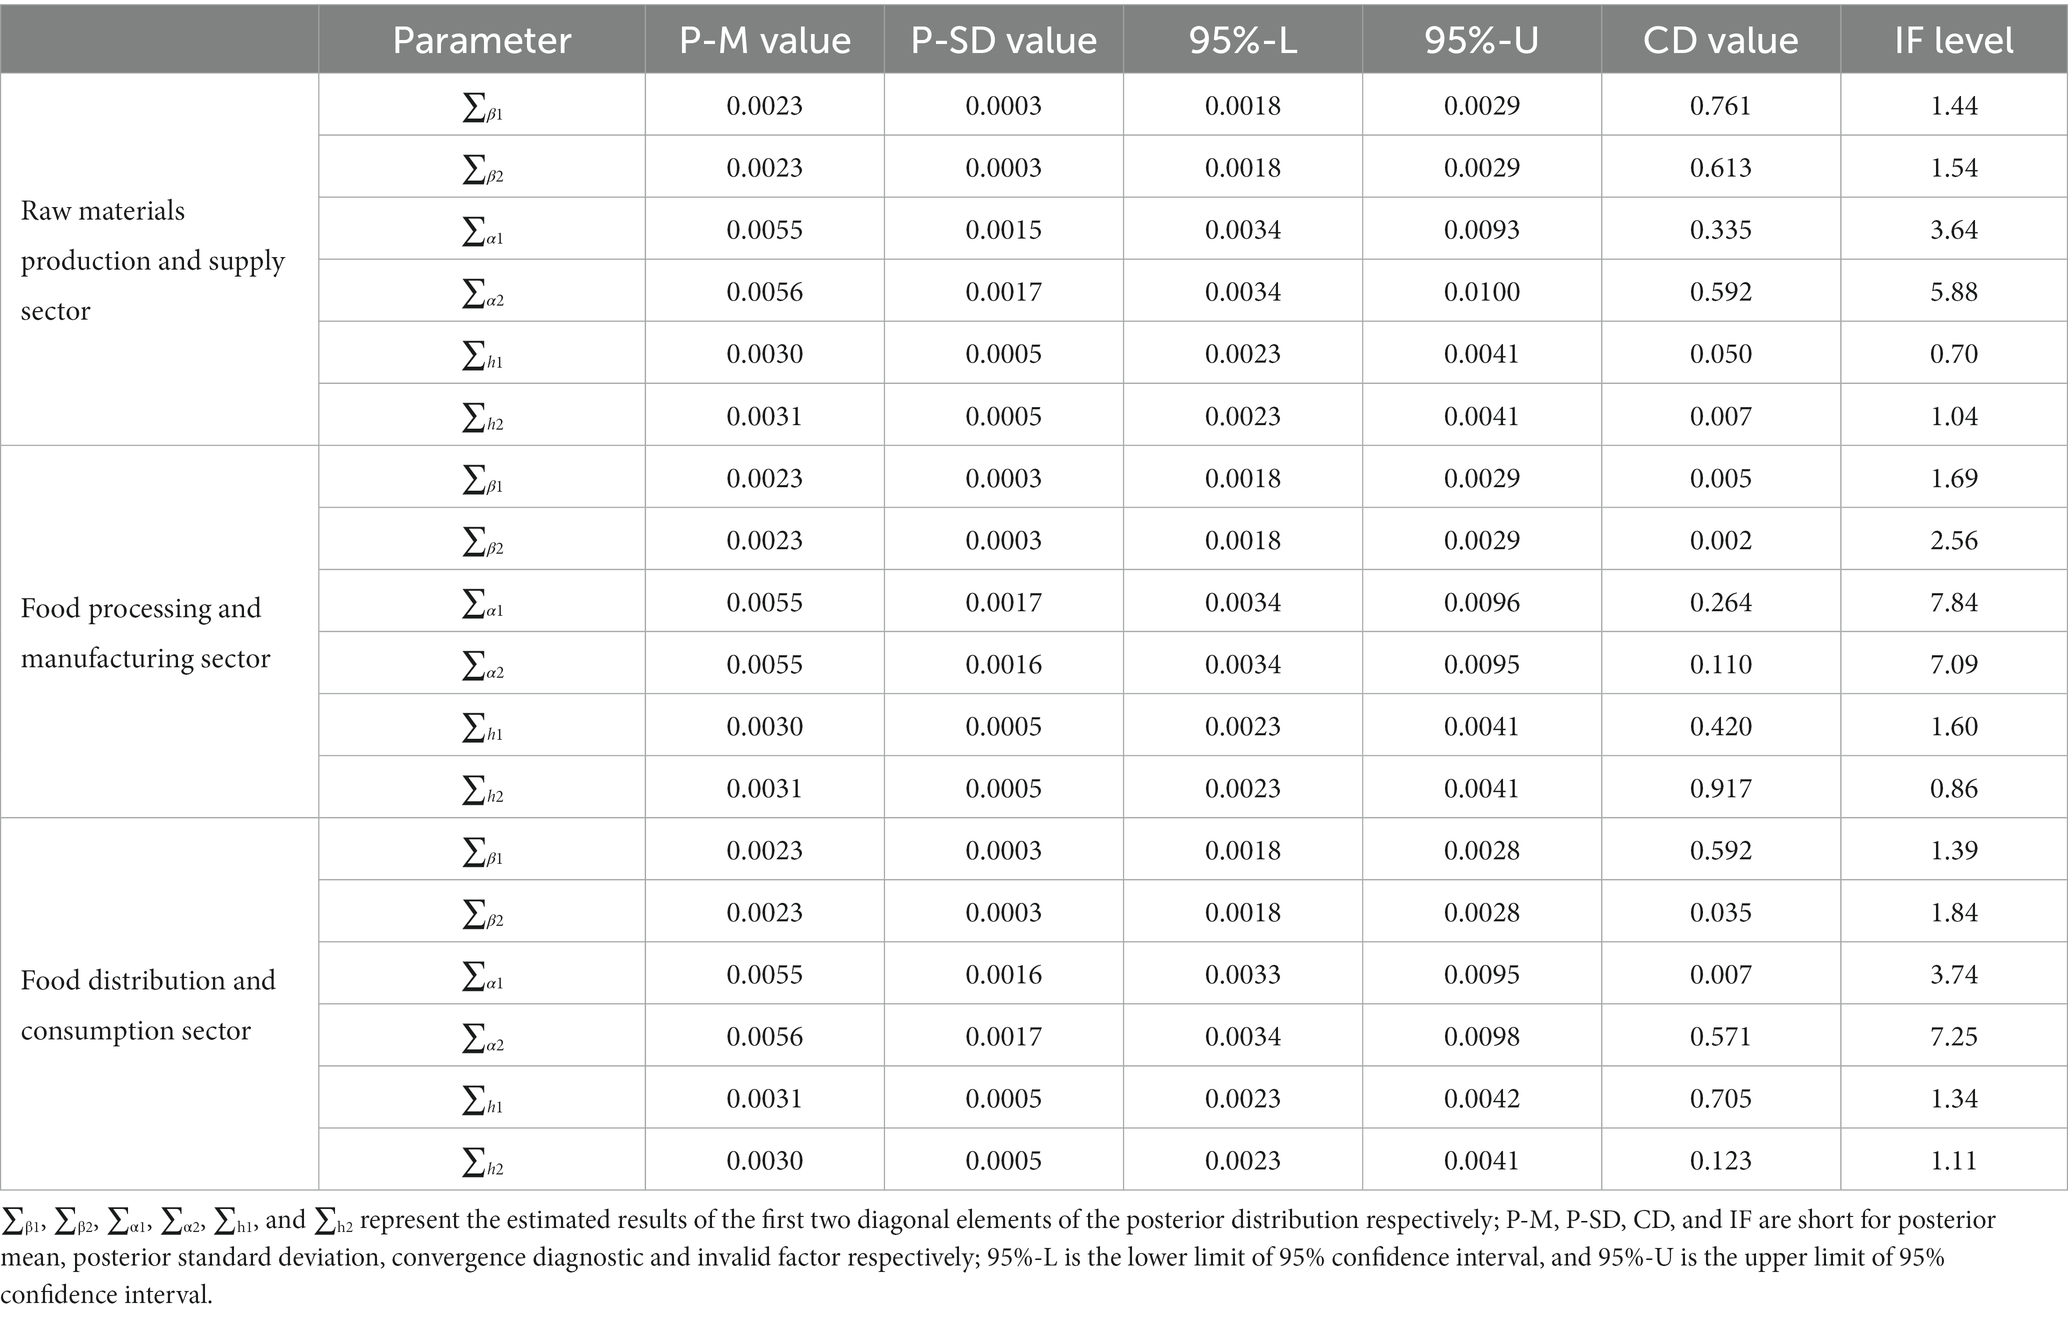
Table 2. The estimation results of MCMC simulation.
3.2.1 Raw materials production and supply sector
The impacts of PHEs’ unit positive impulses on proxy variables in raw materials production and supply sector from January 2005 to December 2021 are shown in Figures 4A–L. Figures 4A,D,G,J are overviews of the three-dimensional response results. After matching their projections on the x–z and y–z cross-sections with the response, recovery, and adaptation of the supply chain resilience, it can be used to analyze the impacts of PHEs on the food supply chain. Projections of the three-dimensional response results on the x–z section can clearly display the time point of the maximum response value and the variation of the response value within the lag period, which correspond to the response and recovery aspects of the supply chain resilience, are shown in Figures 4B,E,H,K. Projections of the three-dimensional response results on the y–z section focus on depicting the dynamic differences in the impacts of PHEs on proxy variables at different periods, corresponding to the adaptation aspect of the supply chain resilience, are shown in Figures 4C,F,I,L. Among them, Figure 4A is the three-dimensional responses of OVPAP to PHEs’ impulses, Figure 4B is the projection of impulse response results on the x–z section, Figure 4C is the projection of impulse response results on the y–z section.
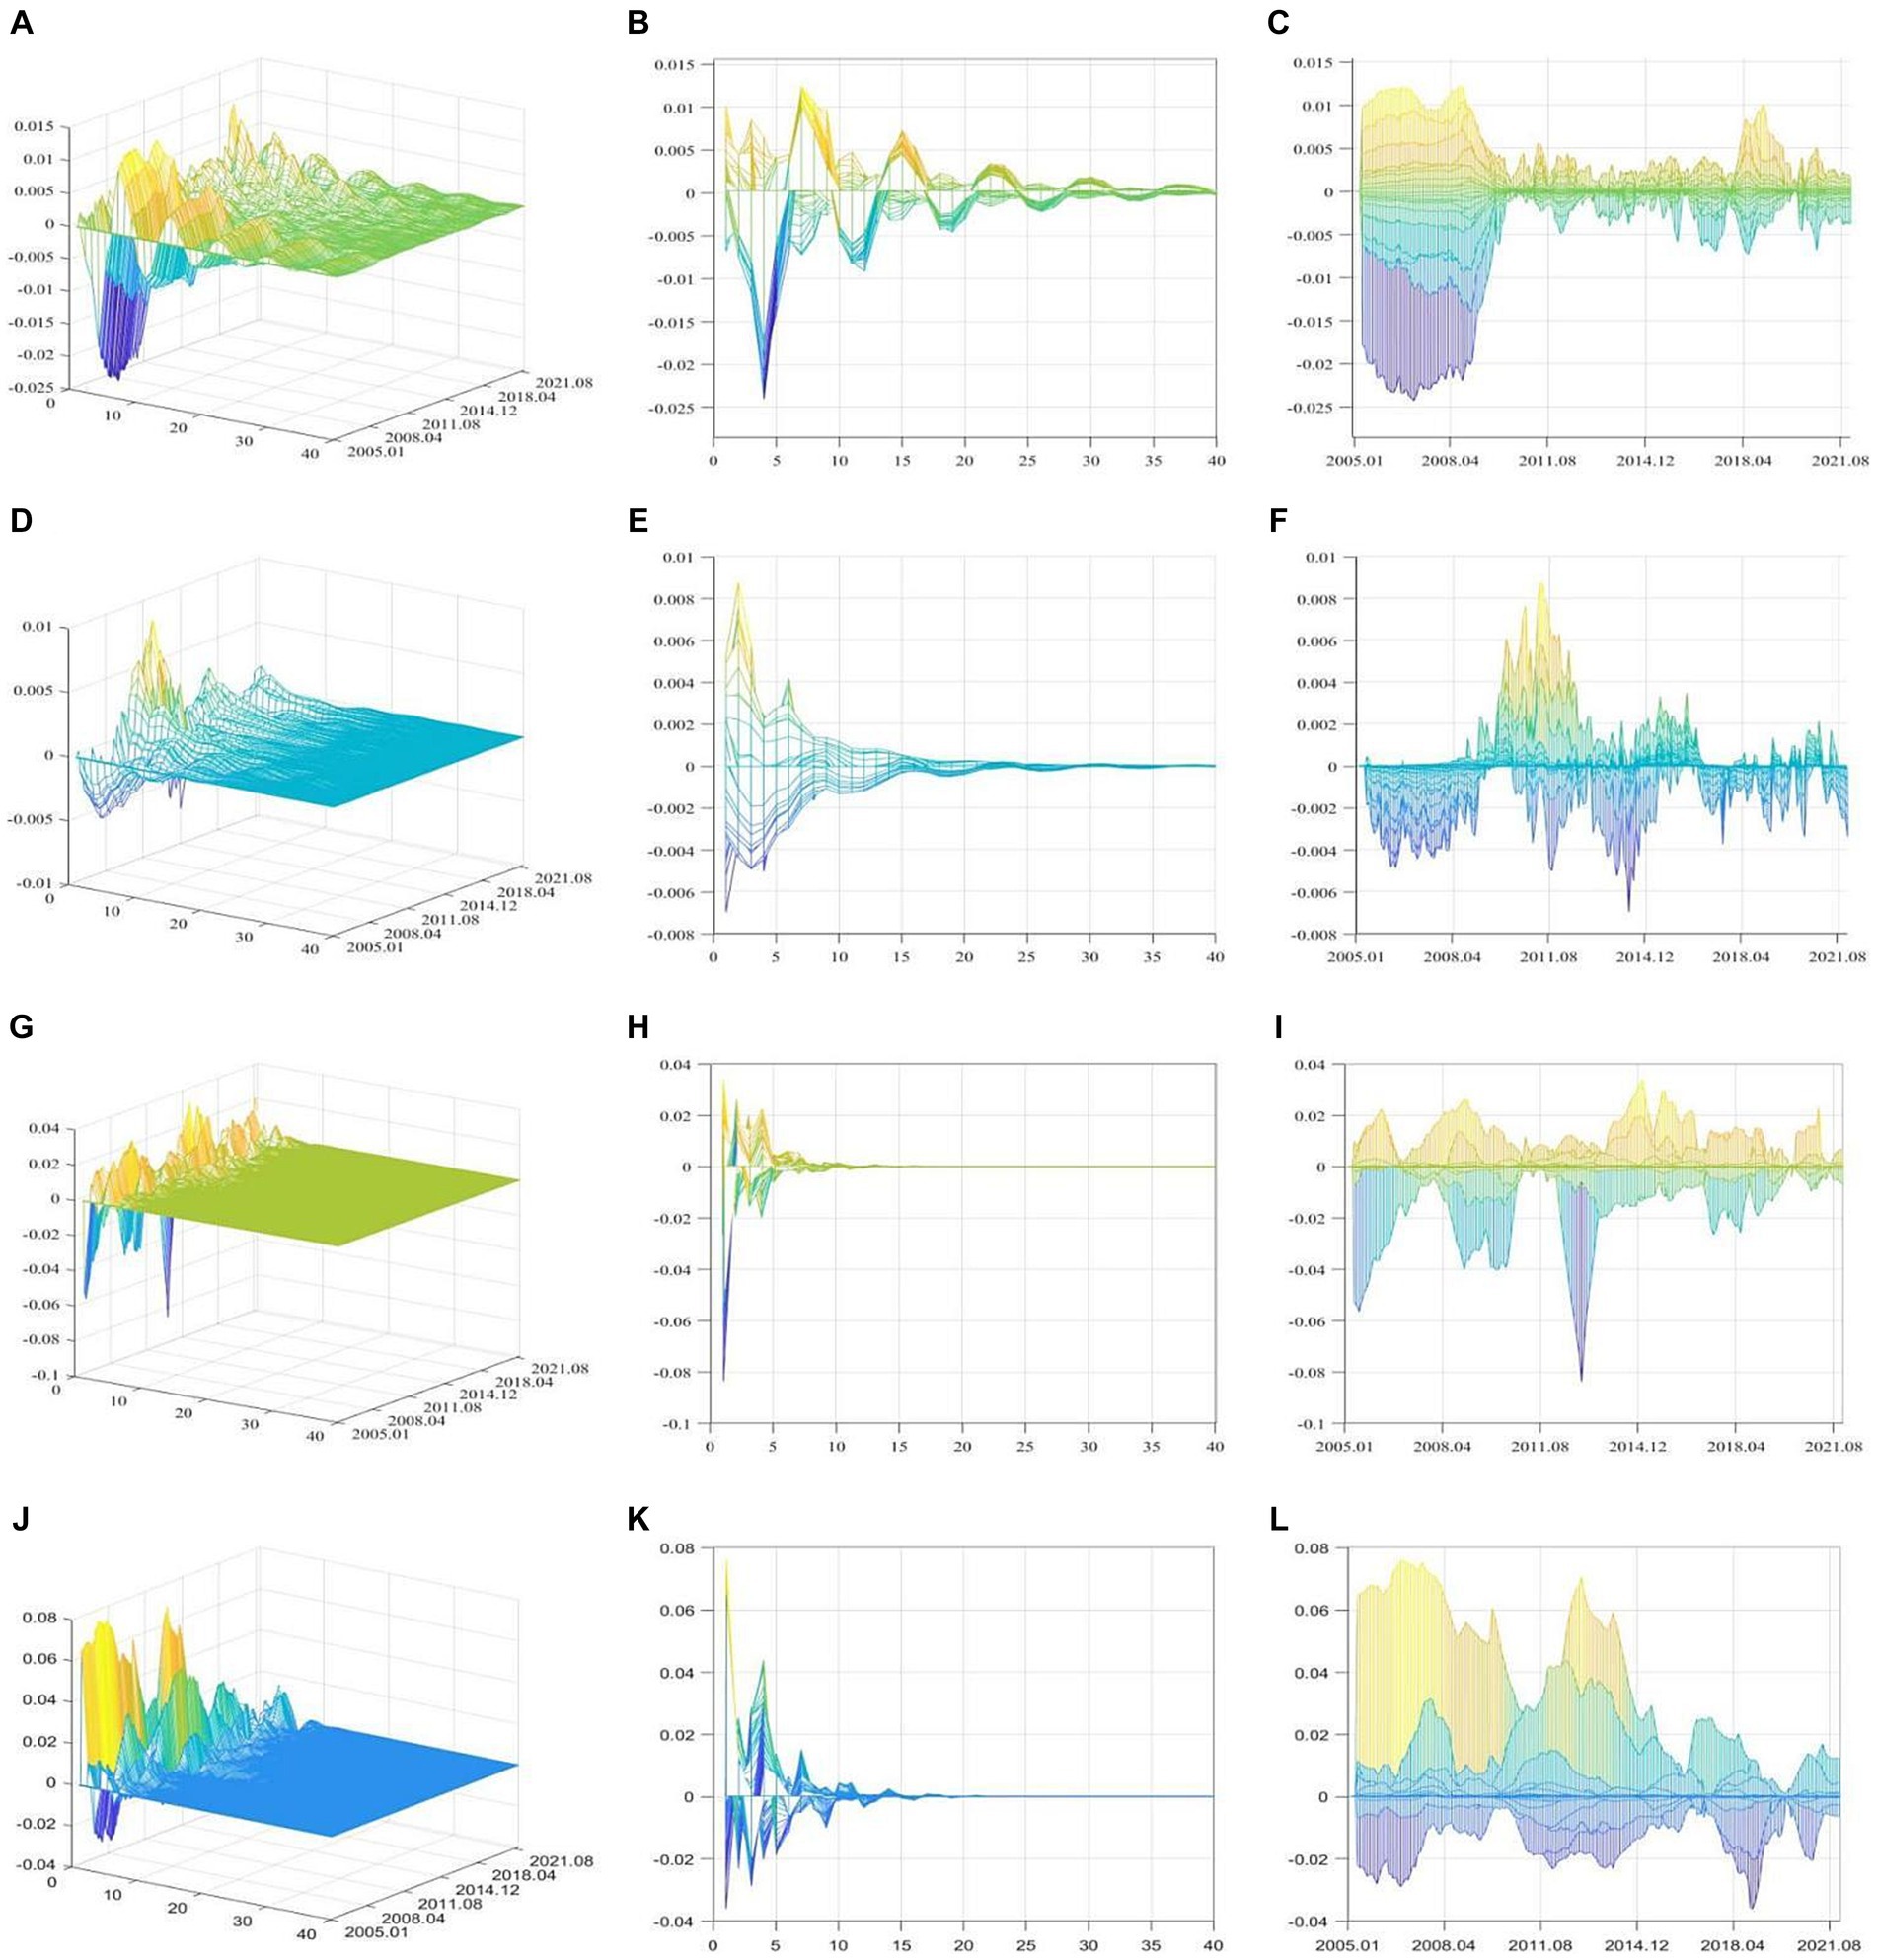
Figure 4. The three dimensional impulse responses of proxy variables in raw materials production and supply sector. (A,D,G,J) are the three-dimensional responses of OVPAP, PPAP, EAPAP, and IAPAP to PHEs’ impulses respectively; the x-axis is the lag phase of impulse responses, the y-axis is the occurrence time of the positive impulses, and the z-axis represents the response levels. (B,E,H,K) are the projection of response results of OVPAP, PPAP, EAPAP, and IAPAP on the x–z section, respectively. (C,F,I,L) are the projection of response results of OVPAP, PPAP, EAPAP, and IAPAP on the y–z section, respectively.
In the response aspect of food supply chain resilience, PHEs’ positive impulses have positive impacts on OVPAP first and then negative impacts, and the responses last for a long time, with the value approaching 0 after Phase 35 (Figure 4A). In the recovery aspect of food supply chain resilience, OVPAP shows alternate positive and negative responses (Figure 4B). The volatility of responses is mainly caused by the lag between production decision and output of agricultural products due to the growth cycle of agricultural products (Fan et al., 2021). In the adaptation aspect of food supply chain resilience, the responses of OVPAP changed greatly from 2005 to 2009, and the negative response value exceeded positive value, getting to a maximum of −0.024 (January 2007). According to Figure 1B, the outbreak of highly pathogenic avian influenza and Japanese encephalitis (Period 1 and Period 2) is the main reason for the great fluctuation of OVPAP during this period. After 2009, the positive and negative responses of OVPAP decreased significantly, with the maximum negative value of only −0.007 (June 2018). Especially during COVID-19 (Period 13), which caused much more death and greater economic losses, it did not cause a significant decline in OVPAP, with a maximum negative response value of only −0.003 (April 2020). This is mainly due to the efforts made by the Chinese government in agricultural policies and pandemic prevention in recent years (Pu and Zhong, 2020; Li and Song, 2022).
PHEs’ impulses have both positive and negative impacts on PPAP, and the response value gradually approaches 0 after Phase 20 (Figure 4D). In the response aspect, PHEs’ impulses can have quick impacts on PPAP, with high response values in the first five lag phases and rapidly declining values from Phase 5 to 10 (Figure 4E). In the recovery aspect, PHEs’ impulses can significantly affect the price of raw materials within half a year, and the impacts disappear afterwards. In the adaptation aspect, PPAP mainly had negative responses from 2005 to 2009, and it had both positive and negative responses after 2009, with the largest positive value from March 2009 to January 2013. The structural breaks of PPAP responses are the result of the joint regulation of market supply and demand and government policies (Li and Song, 2022). The negative responses are mainly related to the instability of agricultural product supply, trade fluctuation and quality decline caused by PHEs (Saboori et al., 2022; Liang and Zhong, 2023). However, the time with great positive responses (especially March 2009 to January 2013) corresponds with the outbreak of highly pathogenic avian influenza, influenza A (H1N1) and Japanese encephalitis (Figure 4F). After these devastating zoonotic infectious diseases broke out, the infected animals were required to be treated as soon as possible to cut off the source of infection, which led to reduction in the production and consumption of related agricultural products. Overall price of raw materials were raised due to the influence of market supply and demand and substitution effect (Devereux et al., 2020; Yao et al., 2022).
PHEs’ impulses have both positive and negative impacts on EAPAP. Both decrease significantly after Phase 5 and the value gradually approaches 0 after Phase 10 (Figure 4G). In the response aspect, PHEs’ impulses rapidly causes negative responses of EAPAP in the first two lag phases, indicating that outbreak of PHEs can cause significant decline of EAPAP in the short term (Figure 4H). In the recovery aspect, when PHEs breaks out, especially zoonotic infectious diseases, safety clauses and prevention and control measures restrict the export of primary agricultural products in the short term (Laborde et al., 2021; Saboori et al., 2022; Stephesns et al., 2022), while in the long term, with proper control or end of the pandemic, compensatory growth appears (Zhan and Chen, 2021; Li and Song, 2022). In the adaptation aspect, the negative responses of EAPAP increased significantly from January 2005 to December 2006, June 2008 to January 2011, and February 2012 to November 2013 (Figure 4I), when serious zoonotic infectious diseases (influenza A (H1N1), highly pathogenic avian influenza and Japanese encephalitis) occurred and led to significant decline in exports of livestock products, which promoted the rapid increase of the negative responses of EAPAP.
In the response aspect, responses of IAPAP are sensitive to the impulses of PHEs, and reach the maximum positive value (or the maximum negative value) in the first two lag phases (Figure 4J). Both positive and negative responses are significantly reduced from Phase 4 to 10, and gradually approached 0 after Phase 15 (Figure 4K). It shows that PHEs significantly improves IAPAP in the short term, and the impact declines remarkably after 4 months. In the recovery aspect, outbreak of PHEs leads to decline of the supply and quality of domestic agricultural products (Laborde et al., 2021; Suyo et al., 2021), and imports of affected products increase to make up the demand gap. In the long run, supply recovers and imports gradually decline with the control or end of the pandemic. Therefore, IAPAP has great positive responses in the short term, while the responses decrease in the long term (or becomes negative under policy control). In the adaptation aspect, the positive responses of IAPAP increased significantly from January 2005 to December 2010 and from May 2012 to February 2015 (Figure 4L), due to the outbreak of influenza A (H1N1), highly pathogenic avian influenza and Japanese encephalitis, which resulted in a substantial increase in the imports of related livestock products.
Differences of PHEs’ impacts can be easily summarized from the three-dimensional impulse responses. In the response aspect of food supply chain resilience, PHEs has quick impacts on PPAP, EAPAP, and IAPAP, while it has lagged impacts on OVPAP; it has the longest impact on OVPAP, followed by PPAP, and the shortest impact on EAPAP and IAPAP; it has the greatest impact on EAPAP, followed by IAPAP and OVPAP, and the least impact on PPAP. In the recovery aspect of food supply chain resilience, under the influence of market regulation and government macro-control, the price and trade of raw materials are more sensitive to PHEs’ impulses but with shorter duration. However, the periodicity of agricultural production and the lagged effects of decision-making lead to lagged response of raw material production to PHEs’ impulses, and longer duration (Fan et al., 2021). When PHEs occurs, the safety clauses and prevention and control measures restrict exports of relevant primary agricultural products in the short term (Zhan and Chen, 2021; Saboori et al., 2022; Stephesns et al., 2022), and increase imports to make up for the demand gap in the domestic market. Therefore, PHEs has great impacts on raw material trade. In the adaptation aspect of food supply chain resilience, stabilizing the output and price of primary agricultural products is an important way to achieve food security (Devereux et al., 2020; Saboori et al., 2022). In this connection, the Chinese government has issued a series of policies to stabilize production and price of agricultural products to mitigate the impact of PHEs on OVPAP and PPAP.
3.2.2 Food processing and manufacturing sector
PHEs’ impulses first have negative impacts on OVFI and then positive. Both response values gradually approach 0 after Phase 10 (Figure 5A). In the response aspect, PHEs’ impulses can quickly cause the negative responses of OVFI in the short term, which then turns positive. In the long term, positive and negative responses alternate (Figure 5B). In the recovery aspect, food production declines by reducing raw material supply, lowering their quality, increasing production costs, and adjusting production strategies in the early stage of PHEs, (Kuiper and Lansink, 2013; Suyo et al., 2021). However, food production enterprises have the responsibility of ensuring food supply during disaster emergencies (Schneider, 2016). After the outbreak of PHEs, government helps these enterprises to resume production through technical support, financial subsidies, tax relief, etc., to ensure the stability of food supply (Zhan and Chen, 2021), so the negative responses of OVFI become positive. In the adaptation aspect, the negative responses of OVFI increased significantly from November 2007 to January 2010, from July 2010 to December 2012, and from May 2017 to August 2018 (Figure 5C), and the corresponding PHEs include H1N1 influenza A, highly pathogenic avian influenza, H7N9, Japanese encephalitis, hemorrhagic fever, plague, and malaria (Period 3–6 and Period 10–11 in Figure 1B). The occurrence of these infectious diseases led to huge fluctuations in the output of the food industry, which seriously damaged the stability of food supply chain.
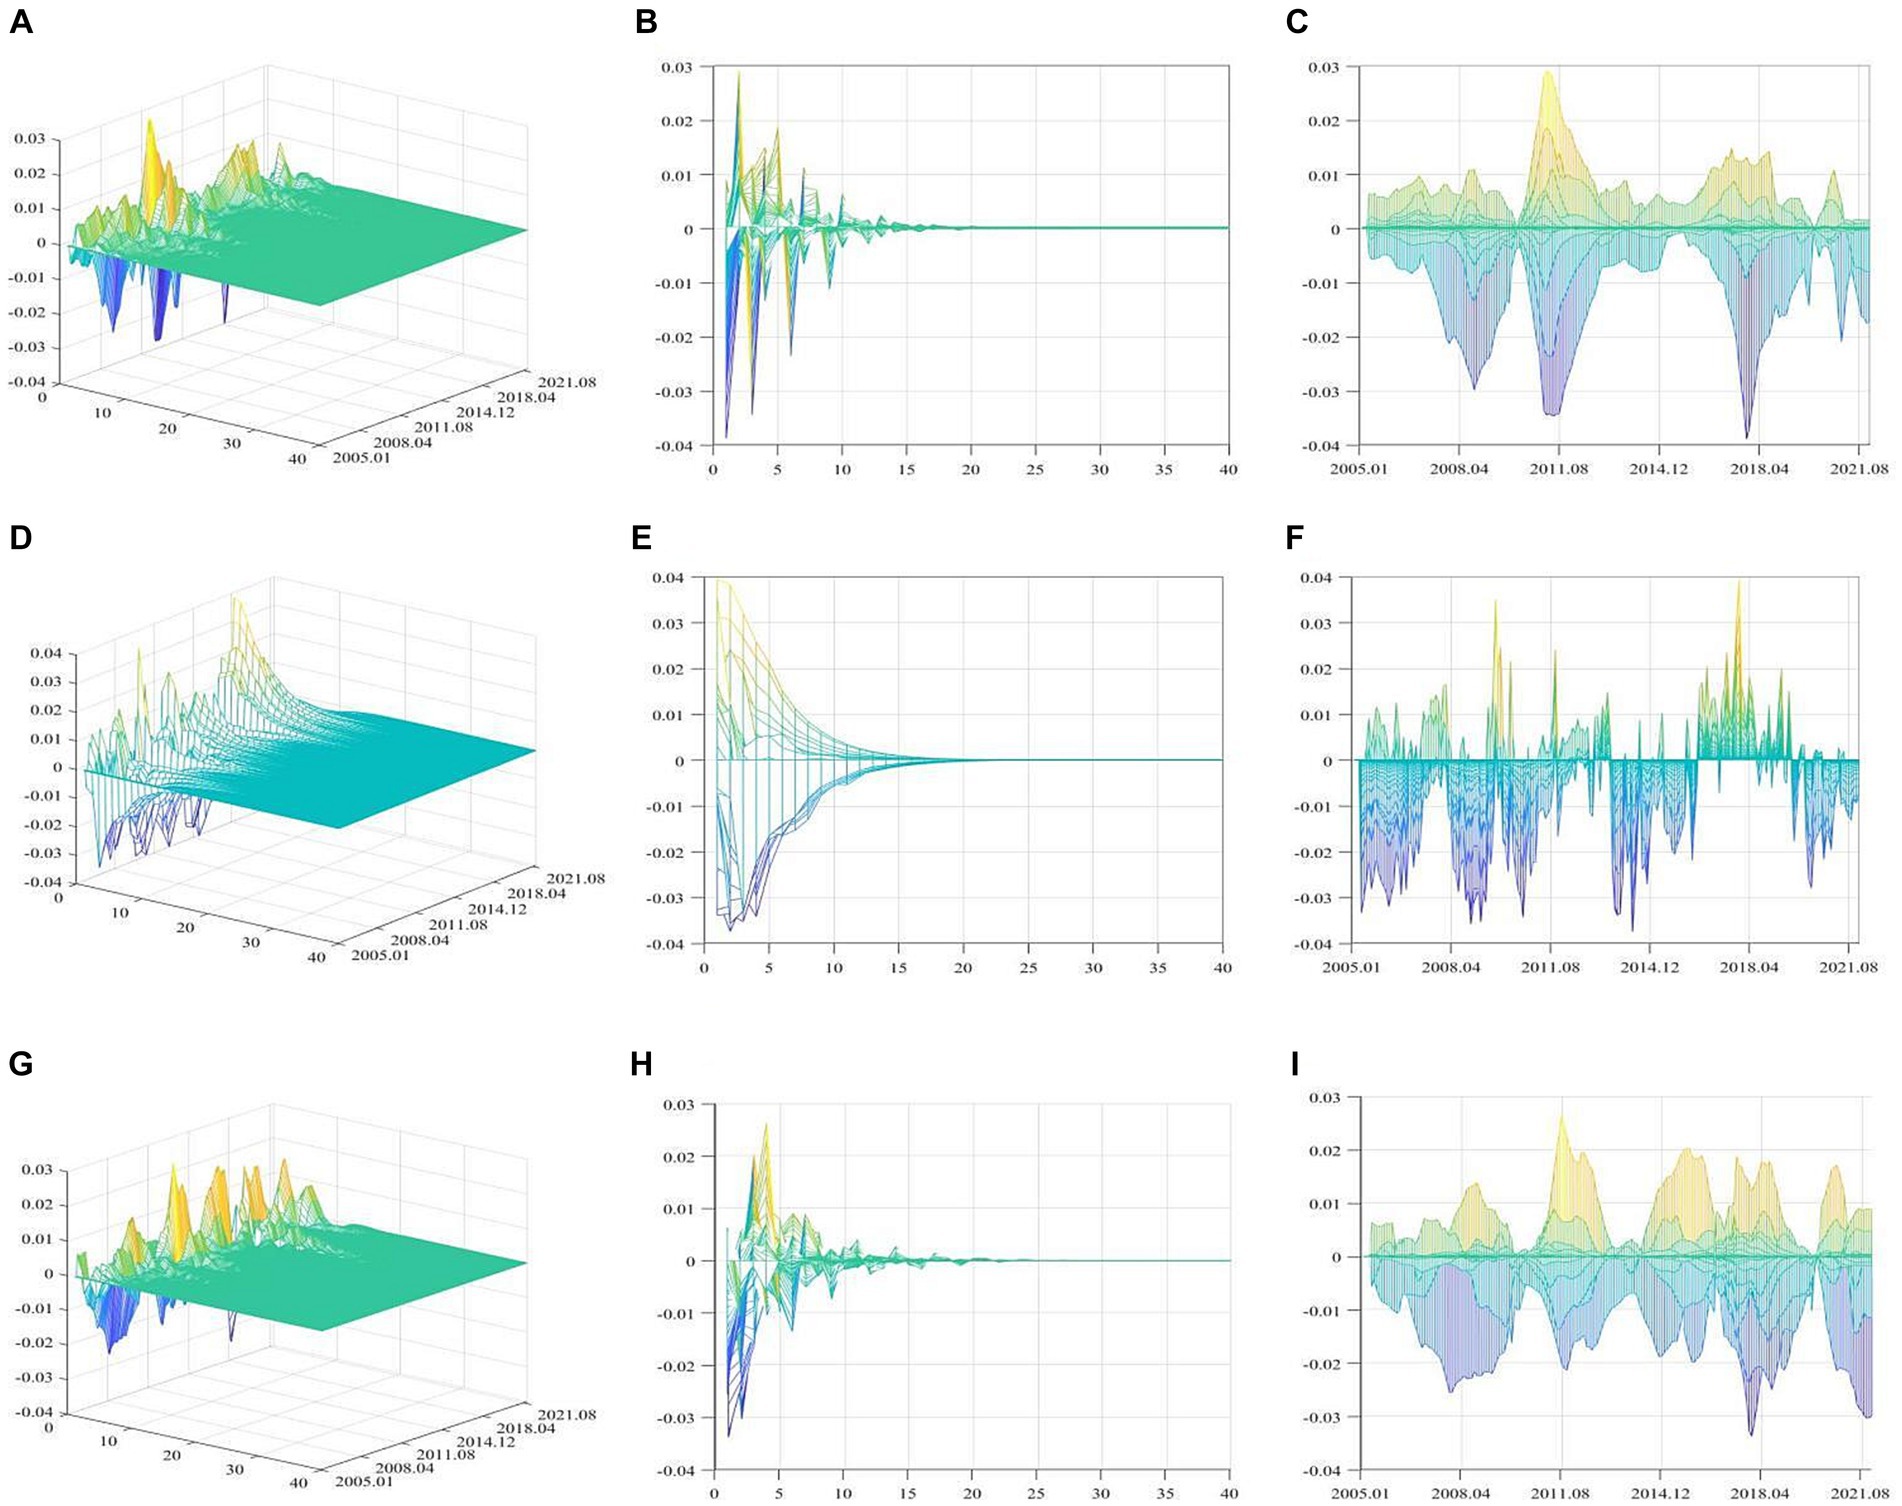
Figure 5. The three dimensional impulse responses of proxy variables in food processing and manufacturing sector. (A,D,G) are the three-dimensional responses of OVFI, PMRFI and PPFI to PHEs’ impulses respectively; the x-axis is the lag phase of impulse responses, the y-axis is the occurrence time of the positive impulses, and the z-axis represents the response levels. (B,E,H) are the projection of response results of OVFI, PMRFI, and PPFI on the x–z section, respectively. (C,F,I) are the projection of response results of OVFI, PMRFI, and PPFI on the y–z section, respectively.
PHEs has both positive and negative impacts on PPFI. Both impacts reach the maximum in the first three phases, decrease significantly from Phase 4 to 10, and disappear after Phase 15 (Figures 5D,E). It shows that PHEs can quickly cause changes in PPFI, and the impacts last for a long time. The impacts on PPFI are characterized by structural breaks, which are related to the attributes of specific health events. The positive responses increased significantly from May 2007 to March 2008, June 2009 to June 2010, August 2011 to September 2013 and from July 2016 to February 2020, while in other time, the impacts were negative (Figure 5F). PHEs during the period of positive responses mainly includes highly pathogenic avian influenza, influenza A (H1N1), hemorrhagic fever, malaria, H7N9, leptospirosis, anthrax, plague, schistosomiasis, rabies, brucellosis, and COVID-19. PHEs during the period of negative responses includes highly pathogenic avian influenza, influenza A (H1N1), H7N9, and Japanese encephalitis. Highly pathogenic avian influenza, influenza A (H1N1) and H7N9 occurred during the both periods of positive and negative responses, but the number of deaths caused by these PHEs in the former period is far greater than that in the latter. Therefore, it can be inferred that when the number of deaths caused by PHEs increases significantly, the cost rise and output fluctuation due to the shortage of raw materials and labor force drive the rise of food production prices (Khokhar et al., 2015). However, when the impacts and scope of PHEs are small, especially during some zoonotic infectious diseases that are timely controlled, production price is reduced mainly by decreasing demand (Dhand et al., 2011).
PHEs has both positive and negative impacts on PMRFI. Both impacts gradually disappear after Phase 10 (Figure 5G). PHEs’ impulses cause a rapid increase in the PMRFI responses in the first five phases, and the responses decrease significantly from Phase 5 to 10 and approach 0 after Phase 10 (Figure 5H). It indicates that the first five months of PHEs outbreak has great impacts on the profits of food enterprises, which gradually disappear within one year. The impact has significant dynamic characteristics (Figure 5I). Generally, PHEs has negative impacts on PMRFI first, and then positive impacts. This is because in the early stage of PHEs outbreak, the overall profit margin of the food industry declines due to cost increase of raw materials and labor, reduction of commodity inventory, decline of quality, and financial risks of enterprises (Kuiper and Lansink, 2013; Suyo et al., 2021). In the long run, as the epidemic is under control and the food enterprises resume normal production, and the profit margin recovers (Nordhagen et al., 2021). Meanwhile, the more harmful PHEs is, the greater its negative impacts on PMRFI, and the smaller the space for profit recovery. Especially during COVID-19 (January 2020 to December 2021), the negative responses of PMRFI increased significantly, while the positive responses remained low.
In the response aspect of food supply chain resilience, PHEs has quick impacts on OVFI, PPFI and PMRFI (the maximum positive or negative response values are reached in the first three phases), indicating that food production sector is sensitive to the impacts of PHEs. In the recovery aspect of food supply chain resilience, the degree and duration of the impacts on OVFI, PPFI and PMRFI, are similar, reflecting the close relationship between various factors in food processing and manufacturing sector. In the adaptation aspect of food supply chain resilience, the time-varying frequency of PPFI is significantly higher than that of OVFI and PMRFI. As the core of the supply chain, food processing and manufacturing enterprises carry out production and operation with the goal of maximizing profits (Kshetri, 2021). When PHEs breaks out, the decision-makers change the operation strategy based on production costs, product inventory, market conditions, financial risks, profitability (Khokhar et al., 2015; Zhan and Chen, 2021; Perdana et al., 2022). Among these, changing the selling price is the most flexible means for manufacturers to adjust their operation strategies, so the time-varying frequency of PPFI is significantly higher than that of OVFI and PMRFI. Meanwhile, the time-varying frequency of food production is significantly lower in the whole sample period, due to the constraints of sunk costs, order contracts and social responsibilities. The sales profit is the combination of food production, sales volume, price, cost and inventory, so the time-varying frequency of PMRFI is between that of PPFI and OVFI.
3.2.3 Food distribution and consumption sector
PHEs has both positive and negative impacts on RSAFP. Both impacts gradually disappear after the Phase 10 (Figure 6A). In the response aspect, PHEs’ impulses have negative impacts on RSAFP first, and then positive impacts. Specifically, the negative responses increase rapidly in the first two phases, the positive and negative responses decrease with fluctuation from Phase 3 to 5, and approach 0 after Phase 8 (Figure 6B). In the recovery aspect, the outbreak of infectious diseases (especially zoonotic infectious diseases) causes market closure, consumer demand decline, etc., so food sales fall rapidly in the short term (Zhan and Chen, 2021). With the control and end of the pandemic, food sales show compensatory growth. In the adaptation aspect, the impacts of PHEs on RSAFP have significant dynamic characteristics (Figure 6C). The positive and negative responses of RSAFP declined remarkably especially after 2015, which is mainly related to the government’s support policies and the development of e-commerce (Davis et al., 2021; Swinnen and Vos, 2021). Therefore, compared with the PHEs before 2015, the impact of the outbreak of COVID-19 in 2020 on the RSAFP decreased significantly.
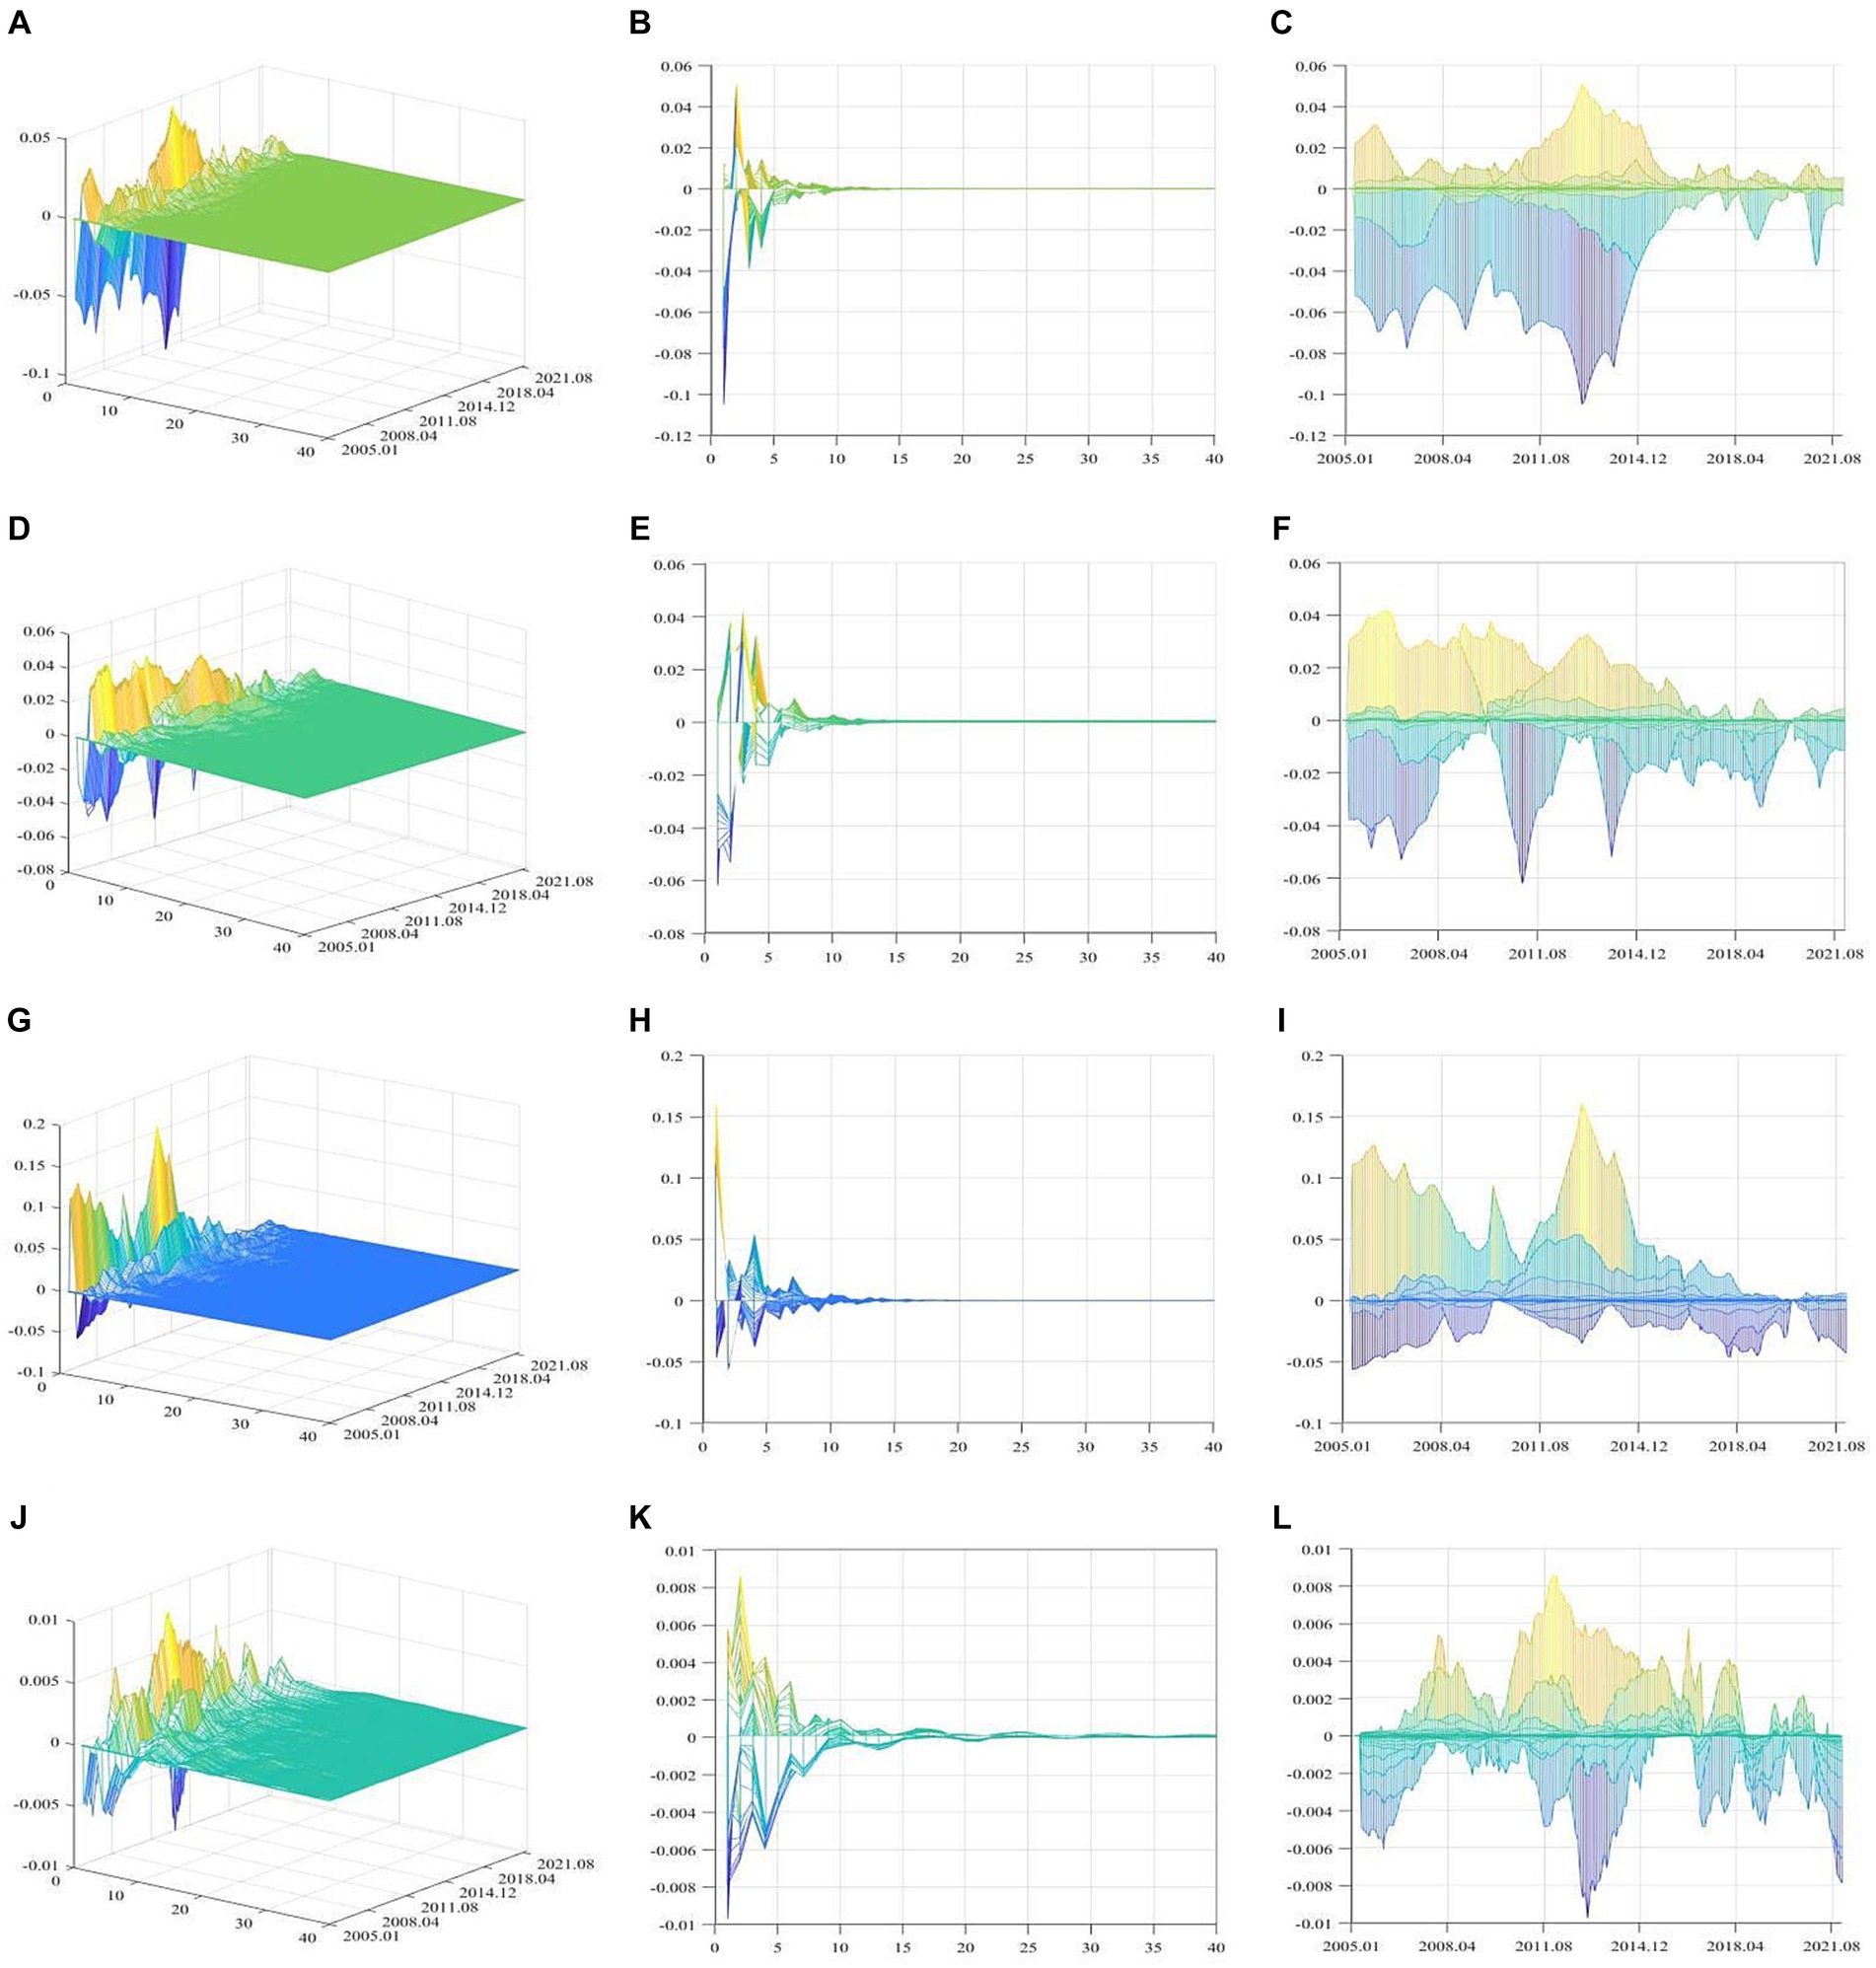
Figure 6. The three dimensional impulse responses of proxy variables in food distribution and consumption sector. (A, D, G, J) are the three-dimensional responses of RSAFP, EAFP, IAFP, and CPFP to PHEs’ impulses respectively; the x-axis is the lag phase of impulse responses, the y-axis is the occurrence time of the positive impulses, and the z-axis represents the response levels. (B, E, H, K) are the projection of response results of RSAFP, EAFP, IAFP, and CPFP on the x–z section, respectively. (C, F, I, L) are the projection of response results of RSAFP, EAFP, IAFP, and CPFP on the y–z section, respectively.
PHEs’ impulses first have negative impacts on EAFP, and then positive impacts. Both impacts decrease significantly after Phase 5, and gradually disappear after Phase 10 (Figures 6D,E). PHEs’ impulses quickly cause the negative responses of EAFP in the first two lag phases, and the positive and negative responses alternate from Phase 3 to 5, the positive responses being dominant. It shows that the outbreak of PHEs rapidly leads to the decline of EAFP in the short term, and compensatory growth of EAFP occur over time. EAFP has a large negative response value from January 2005 to April 2008, January 2010 to August 2012, and from June 2013 to October 2014, which may be related to the outbreak of influenza A (H1N1), highly pathogenic avian influenza, H7N9, Japanese encephalitis and other zoonotic infectious diseases in these periods (Figure 6F). When these serious zoonotic infectious diseases occur, the international market restrict the trade of related processed products and finished products through technical barriers to trade in health, quarantine, product quality and certification in the short term (Wang et al., 2022; Azevedo et al., 2023). After the pandemic, food exports rebound (Saboori et al., 2022).
The responses of IAFP to PHEs’ impulses can reach the maximum positive value in the first two lag phases, and then the positive responses decrease and turn negative. Both the positive and negative responses significantly decrease from Phase 3 to 5, and gradually approach 0 after Phase 10 (Figures 6G,H). It indicates that IAFP are sensitive to PHEs’ impulses. When the outbreak of infectious diseases causes the decline of relevant food production, imports increase remarkably in the short term to make up for the demand gap (Devereux et al., 2020; Saboori et al., 2022). However, with the control of the domestic pandemic and the resumption of normal operation of food enterprises, food imports gradually decline. Therefore, the reason for the significant increase of the positive responses from January 2005 to June 2008, November 2009 to October 2010, and January 2012 to December 2014 is similar to that of IAPAP (Figure 6I). It is the outbreak of zoonotic infectious diseases which leads to the significant increase in imports of related livestock products. However, the outbreak of COVID-19 in 2020 only has negative impacts on IAFP. A valid explanation for this PHEsnomenon is that the global outbound of COVID-19 has made China more concerned about the safety of imported products, and led to a significant decline in food imports under the increasing quarantine measures and restrictions (Kazancoglu et al., 2023).
PHEs’ impulses have both positive and negative impacts on CPFP (Figure 6J). In general, PHEs first has negative impacts on CPFP, and then positive. Both response values reach the maximum in the first three phases, rapidly decline from Phase 4 to 10, and approach 0 after Phase 10 (Figure 6K). It suggests that when infectious diseases break out, consumers’ demand for certain food product decreases in the short term, which leads to oversupply and drives the decline of the overall food price. In the long run, with the end of the pandemic, the demand and supply of food revovers, and price also rebounds. However, the positive responses of CPFP increased significantly from April 2007 to February 2009, May 2010 to December 2014, and from February 2017 to July 2018 (Figure 6L). The possible reason is that the outbreak of infectious diseases during these periods led to the increase of food production costs, production fluctuations and larger demand gap (Saboori et al., 2022; Yao et al., 2022), which further promoted the rise of food consumption prices. However, after the outbreak of COVID-19 in 2020, the positive responses of CPFP rose briefly before it declined and turned negative. This is because the continuation of the COVID-19 led to the closure of the catering industry, economic downturn and degradation of consumption (Byker et al., 2022; Manyong et al., 2022), which continued to depress the level of food prices.
In the response aspect of food supply chain resilience, after the impacts of PHEs, the response values of RSAFP, EAFP, IAFP, and CPFP all reach the maximum in the first three phases, indicating that all factors in the food distribution and consumption sector have sensitive responses to PHEs’ impulses. As the final link of the food supply chain, food distribution and consumption sector mainly includes wholesalers, retailers, importers and exporters, and consumers. Among them, wholesalers, retailers, importer and exporters carry out business activities under the market system and government supervision, with the goal of pursuing profits (Davis et al., 2021; Suyo et al., 2021), and closely link production enterprises with consumers. After the outbreak of serious infectious diseases, they are faced with the risks of insufficient domestic food production, quality decline, cost increase, demand fluctuation, market closure and so on. To avoid risks and reduce losses, these commercial entities quickly adjust their business strategies (Davis et al., 2021; Suyo et al., 2021; Zhan and Chen, 2021), resulting in large fluctuation in the responses of RSAFP in the short term. In the recovery aspect of food supply chain resilience, trade of food related to infectious diseases is severely impacted due to the adjustment of international market access and trade guidelines, so the impacts of PHEs on IAFP and EAFP are greater than those on RSAFP. In the adaptation aspect of food supply chain resilience, food is our daily necessity, so its price fluctuation is regulated by the government. Especially during major epidemics, dealers are subject to administrative punishment for driving up prices and not clearly marking prices. Therefore, the impacts of PHEs’ impulses on CPFP are significantly less than those on IAFP, EAFP, and RSAFP.
4 Discussions
The impacts of PHEs on the resilience of food supply chain have significant differences, dynamic characteristics and structural breaks. This is caused by the infectivity and mortality of PHEs, attributes of food products, regulation of supply and demand in the market, behavioral decisions of all participants, changes in the policy environment, and coordination and upgrading of all sectors in the supply chain.
Firstly, differences can be summarized as those in the impacts of PHEs on the resilience of partial sector or entire chain. From the impacts on the entire chain resilience, the impacts on the resilience of food distribution and consumption is significantly higher than those on raw materials production and supply sector, and food processing and manufacturing sector. Due to the large number of economic entities involved and the complex structure, food distribution and consumption sector gathers the risks conducted from food production, trade, distribution and consumption, so it is more affected by PHEs’ impulses, this is consistent with Zhan and Chen (2021). From the impacts on the partial sector resilience, PHEs has greater impacts on the resilience of raw material trade and food retail, followed by food output, producer price and profit, while have smaller impacts on raw material production, raw material price and consumption price. Food and raw materials trade is jointly regulated by the fluctuation of supply and demand from domestic and international markets, and also is restricted by market access, trade policies and guidelines. Therefore, it is greatly affected by PHEs’ impulses. The result supports the findings of Saboori et al. (2022) and Kazancoglu et al. (2023). Food retail is regulated by market supply and demand, especially demand. Therefore, when PHEs’ impulses simultaneously cause food supply fluctuations and demand decrease, food retail declines significantly. Faced with the impulses of PHEs, food enterprises reduce losses by adjusting output and price, and make profits after deducting costs. Therefore, the proxy variables in food processing and manufacturing sector are more closely linked, and the impacts of PHEs on their resilience are similar. Chinese government has issued a series of supporting policies to ensure the stability of the production and price of primary agricultural products, which mitigates the impacts of PHEs on production and price of raw materials; this is consistent with Li and Song (2022) and Jiang et al. (2021). Meanwhile, as an important indicator for food safety, food price has become an important regulatory object of the government. The existing support policies and regulatory system also alleviate the impacts of PHEs on food consumption price.
Secondly, the impact results on proxy variables have significant dynamic characteristics in the whole sample period. In raw materials production and supply sector, the impacts of PHEs on the production resilience of raw materials decreased significantly after 2009, which is attributed to the support policies by the Chinese government during this period. For example, the Chinese government abolished agricultural taxes in 2006, introduced a temporary grain collection and storage system in 2008, and substantially increased agricultural subsidies. The dynamic characteristics of the impacts on raw material price and trade resilience are mainly related to the attributes of PHEs in different periods (infectivity and mortality). In food processing and manufacturing sector, the dynamic characteristics of impact results depend mainly on the attributes of PHEs and the operation strategy of the manufacturers. In response to health events with different attributes, manufacturers reduce operational risks by adjusting food prices and output, which affects their profits. Therefore, the dynamic characteristics of food output, producer prices and profits resilience are correlated. In food distribution and consumption sector, the dynamic characteristics of impact results are mainly determined by the attributes of PHEs and the decisions of commercial entities, and regulated by the upgrading of supply chain, policies and regulatory systems. In particular, Chinese government revised the Food Safety Law, the hygiene regulations of food enterprises and the import and export inspection regulations around 2015, and vigorously promoted the construction of the agricultural product warehousing and logistics system, so as to upgrade the supply chain, and further improve policy and regulatory system. Therefore, the impacts of PHEs on food sales and trade resilience have been significantly reduced since then. However, compared with other major health events, the impacts of COVID-19 on the proxy variables (excluding industry profit margin and consumption price of food) are significantly reduced, although COVID-19 is far more harmful. This is mainly due to the agricultural policy, pandemic prevention measures and supply chain upgrading strategy promoted by the Chinese government in recent years, which have increased the resilience of food supply chain (specifically in the adaptation aspect). The results support the findings of Jiang et al. (2021) and Consoli et al. (2023). Meanwhile, government decision-makers should also be alert to major health events such as COVID-19 which breaks the food supply chain by depressing consumption prices and enterprise profits for a long time.
Finally, structural breaks are reflected in the change of the impact direction of PHEs on proxy variables in the lag phases and in different sample periods. On the one hand, in terms of structural breaks in the lag phases, almost all proxy variables have alternate positive and negative response values. Specifically, the structural breaks of the impacts on raw material production resilience have the largest alternate spacing and the longest duration (alternate spacing is between 3 to 5 lag phases, and the duration exceeds 24 lag phases), which is determined by the lag of farmers’ adjustment of production decisions and the growth cycle of agricultural products. The structural breaks of the impacts on food output and industry profit margin have large alternate spacing and long duration (alternate spacing is between 2–3 lag phases, and the duration is within 20 lag phases), which is related to quick decision-making and short production cycle of food enterprises. The structural breaks of the impacts on raw material trade, food sales and trade resilience have small alternate spacing and short duration (alternate spacing is between 1–2 lag phases, and the duration is within 12 lag phases), which is related to the sensitive perception of risks and rapid change of decision by commercial entities in the distribution sector. The impacts on raw material prices, producer prices and consumption prices are weak with low frequency of alternation. Agricultural products and food are life necessities, and have low price elasticity of demand. Additionally, the regulation and management policies implemented by the Chinese government in recent years also mitigate the structural breaks of PHEs’ impacts. On the other hand, structural breaks in different sample periods are mainly reflected in the impacts of PHEs on raw material price, food production prices and consumption prices resilience. Generally, impulses of PHEs have negative impacts on the prices of raw materials and food. However, when a serious outbreak of zoonotic infectious diseases causes reduction of raw material supply, labor shortage, production cost increase, and fluctuations in food production, the prices of raw materials and food rise rapidly. The results verify the findings of Saboori et al. (2022) and Consoli et al. (2023). Therefore, when serious infectious diseases break out, government decision-makers should be vigilant and prevent the sharp rise of agricultural products and food prices in the short term.
5 Conclusions and limitations
5.1 Conclusion
Based on the introduction of the composition of PHEs and the division of food supply chain, this paper briefly described their changing tendency. It adopted nonlinear Granger causality test to verify the nonlinear causal relationship between PHEs and proxy variables in the food supply chain. TVP-VAR-SV model was constructed and with its three-dimensional impulse response, this paper analyzed the dynamic impacts of PHEs on the resilience of food supply chain. The main conclusions are as follows:
1. PHEs has significant nonlinear conduction effects and dynamic impacts on the resilience of food supply chain. The dynamic impacts have significant differences in different sectors. From the impacts on the entire chain resilience, the overall impacts on food distribution and consumption sector are significantly higher than those on raw material production and supply and food processing and manufacturing sector. From the impacts on the partial sector resilience, PHEs has the greatest impacts on food and raw material trade and food retail, followed by food output, producer price and profit, and the smallest impacts on raw material production, raw material price and food consumption price.
2. The impacts of PHEs on the partial sector resilience have significant dynamic characteristics in the whole sample period. In raw materials production and supply sector, the dynamic characteristics of the impacts on raw materials output resilience are attributed to the agricultural support policies implemented by the Chinese government, while the dynamic characteristics of the impacts on raw materials price and trade resilience are related to the attributes of infectious diseases in different periods. In food processing and manufacturing sector, dynamic characteristics of impact results mainly depend on the attributes of infectious diseases and the operation strategy of manufacturers, which leads to correlation between the impulse responses of food production, producer price and profit. In food distribution and consumption sector, dynamic characteristics of impact results are mainly determined by the attributes of diseases and business decisions of commercial entities, and regulated by the upgrading of supply chain, policies and regulatory systems.
3. In the recovery and adaptation aspects of food supply chain resilience, the impacts of PHEs have structural break characteristics. In the recovery aspect, positive and negative responses alternate in the lag phases. The structural breaks of the responses of raw material production are the most obvious as a result of the lagged effect of farmers’ decision adjustment and the growth cycle of agricultural products. The structural breaks of the responses of food production, trade, sales and industry profit margin have small alternating spacing and short duration, which is related to the sensitive perception of risks by commercial entities, rapid change of decisions and short production cycle. The structural breaks of the responses of raw material price, producer price and consumption price are weak, because agricultural products and food are life necessities and thus are regulated and supervised by the government. In the adaptation aspect, structural breaks in different sample periods are reflected in the impacts of PHEs on raw material price, food production price and consumption price. In particular, when the serious zoonotic infectious diseases lead to the reduction of raw material supply, shortage of labor force, increase of production costs, and fluctuation of food production, prices of raw materials and food are rapidly raised.
5.2 Limitations
This paper acknowledges that there are still some limitations in analyzing the impact of PHEs on the resilience of food supply chain. Firstly, this article matches the three-dimensional response results of PHEs shocks with the sensitivity, recovery, and adaptation of the food supply chain resilience by selecting proxy variables, to explore the direct impact of these results. However, the impacts of PHEs on agency variables in various departments of the food supply chain not only have direct impacts, but also transmission effects from other agency variables (indirect impacts). The transmission effects of PHEs’ impacts are latent and often difficult to identify and measure. In future research, the direct impacts of PHEs can be removed from the volatility of the proxy variables themselves, and then methods such as latent variable estimation or latent variable extraction can be applied to measure transmission effects. Secondly, the paper lacks a prediction of the impacts of PHEs on the resilience of the food supply chain. By studying the dynamic and nonlinear impacts of PHEs on the resilience of food supply chain, the long-term goal of this paper should be to predict the impacts of PHEs on the resilience of food supply chain, providing basis and support for effectively reducing the damage of major health emergencies to food supply chain in the future. Meanwhile, considering the higher accuracy of machine learning and deep learning in time series prediction analysis, in future research, this study should be used as the basic framework to construct a prediction system of food supply chain resilience that combines machine learning and deep learning, and then make various scenario prediction to cope with the impacts of PHEs.
Data availability statement
The raw data supporting the conclusions of this article will be made available by the authors, without undue reservation.
Author contributions
JL: Conceptualization, Data curation, Formal analysis, Funding acquisition, Investigation, Methodology, Resources, Software, Writing – original draft, Writing – review & editing. ZL: Data curation, Funding acquisition, Project administration, Supervision, Validation, Visualization, Writing – review & editing. ZS: Investigation, Resources, Supervision, Writing – review & editing. HG: Conceptualization, Formal analysis, Investigation, Methodology, Writing – review & editing.
Funding
The author(s) declare financial support was received for the research, authorship, and/or publication of this article. The work was supported by the Priority Research Program of Chinese Academy of Sciences (XDA20010102).
Conflict of interest
The authors declare that the research was conducted in the absence of any commercial or financial relationships that could be construed as a potential conflict of interest.
Publisher’s note
All claims expressed in this article are solely those of the authors and do not necessarily represent those of their affiliated organizations, or those of the publisher, the editors and the reviewers. Any product that may be evaluated in this article, or claim that may be made by its manufacturer, is not guaranteed or endorsed by the publisher.
Supplementary material
The Supplementary material for this article can be found online at: https://www.frontiersin.org/articles/10.3389/fsufs.2024.1347594/full#supplementary-material
References
Aday, S., and Aday, M. S. (2020). Impact of COVID-19 on the food supply chain. Food Qual. Saf. 4, 167–180. doi: 10.1093/fqsafe/fyaa024
Adobor, H., and McMullen, R. S. (2018). Supply chain resilience: a dynamic and multidimensional approach. Int. J. Logist. Manag. 29, 1451–1471. doi: 10.1108/IJLM-04-2017-0093
Ali, M. H., Suleiman, N., Khalid, N., Tan, K. H., Tseng, M. L., and Kumar, M. (2021). Supply chain resilience reactive strategies for food SMEs in coping to COVID-19 crisis. Trends Food Sci. Technol. 109, 94–102. doi: 10.1016/j.tifs.2021.01.021
Azevedo, F. M., Morais, N., Silva, D., Candido, A. C., Morais, D., and Priore, S. E. (2023). Food insecurity and its socioeconomic and health determinants in pregnant women and mothers of children under 2 years of age, during the COVID-19 pandemic: a systematic review and meta-analysis. Front. Public Health 11:1087955. doi: 10.3389/fpubh.2023.1087955
Bloomberg , (2020). Apple supply chain braces for disruption from coronavirus. January 28. Industry Week. Available at: https://www.industryweek.com/supply-chain/logistics/article/21121567/apple-supply-chain-braces-for-disruption-from-coronavirus.
Byker, C., Houghtaling, B., Shanks, J., Grocke-Dewey, M., Webber, E., and Andress, L. (2022). Disparities in dietary practices during the COVID-19 pandemic by food security status. Prev. Med. Rep. 28:101830. doi: 10.1016/j.pmedr.2022.101830
Chen, K., Zhan, Y., Zhang, Y., and Fan, S. (2020). The impacts of COVID-19 on global food security and the coping strategy. Chin. Rural Econ. 5, 2–12.
Chenarides, L., Manfredo, M., and Richards, T. J. (2021). Covid-19 and food supply Chainsjel codes. Appl. Econ. Perspect. Policy 43, 270–279. doi: 10.1002/aepp.13085
Consoli, S., Egas Yerovi, J. J., Machiorlatti, M., and Morales Opazo, C. (2023). Real-time monitoring of food price policy interventions during the first two years of COVID-19. Food Policy 115:102405. doi: 10.1016/j.foodpol.2023.102405
Davis, K. F., Downs, S., and Gephart, J. A. (2021). Towards food supply chain resilience to environmental shocks. Nat. Food 2, 54–65. doi: 10.1038/s43016-020-00196-3
Devereux, S., Béné, C., and Hoddinott, J. (2020). Conceptualising COVID-19’s impacts on household food security. Food Sec. 12, 769–772. doi: 10.1007/s12571-020-01085-0
Dhand, N. K., Hernandez-Jover, M., Taylor, M., and Holyoake, P. (2011). Public perceptions of the transmission of pandemic influenza a/H1N1 2009 from pigs and pork products in Australia. Prev. Vet. Med. 98, 165–175. doi: 10.1016/j.prevetmed.2010.11.006
Diabat, A., Kannan, G., and Vinay, V. P. (2012). Supply chain risk management and its mitigation in a food industry. Int. J. Prod. Res. 50, 3039–3050. doi: 10.1080/00207543.2011.588619
Diks, C., and Panchenko, V. (2006). A new statistic and practical guidelines for nonparametric granger causality testing. J. Econ. Dyn. Control. 30, 1647–1669. doi: 10.1016/j.jedc.2005.08.008
Duan, X., Zhang, Z., and Zhang, W. (2021). How is the risk of major sudden infectious epidemic transmitted? A grounded theory analysis based on COVID-19 in China. Front. Public Health 9:795481. doi: 10.3389/fpubh.2021.795481
Fan, S., Teng, P., Chew, P., Smith, G., and Copeland, L. (2021). Food system resilience and COVID-19: lessons from the Asian experience. Glob. Food Sec. 28:100501. doi: 10.1016/j.gfs.2021.100501
FAO, IFAD, UNICEF, WFP and WHO . (2022). The state of food security and nutrition in the world 2022, Repurposing food and agricultural policies to make healthy diets more affordable (Rome: FAO)
Fengtai District People’s Government of Beijing Municipality (2021). The Xinfadi market is temporarily closed for management. Available at: http://www.bjft.gov.cn/ftq/zwyw/202006/3630aeb2d1ed44128b0d44b84e36b620.shtml (accessed 24 August 2021).
Foroutan, P., and Lahmiri, S. (2022). The effect of COVID-19 pandemic on return-volume and return-volatility relationships in cryptocurrency markets. Chaos, Solitons Fractals 162:112443. doi: 10.1016/j.chaos.2022.112443
FSIN . (2022). Global report on food crises. Available at: https://www.fsinplatform.org/sites/default/files/resources/files/GRFC%202022%20KM%20ENG%20ARTWORK.pdf (Accessed September 12, 2022)
Goel, R. K., and Haruna, S. (2021). Haruna unmasking the demand for masks: analytics of mandating coronavirus masks. Metroeconomica 72, 580–591. doi: 10.1111/meca.12334
Gu, H., and Wang, C. (2020). Impacts of the COVID-19 pandemic on vegetable production and countermeasures from an agricultural insurance perspective. J. Integr. Agric. 19, 2866–2876. doi: 10.1016/S2095-3119(20)63429-3
Hobbs, J. E. (2020). Food supply chains during the COVID-19 pandemic. Can. J. Agric. Econ. 68, 171–176. doi: 10.1111/cjag.12237
ILO Monitor (2020). COVID-19 and the world of work (sixth edition) [2021-02-26]. Available at: https://www.ilo.org/wcmsp5/groups/public/---dgreports/---docmm/documents/briefingnote/wcms_755910.pdf
Ivanov, D., and Das, A. (2020). Coronavirus (COVID-19/SARS-CoV-2) and supply chain resilience: a research note. Int. J. Integr. Supply Manag. 13, 90–102. doi: 10.1504/IJISM.2020.107780
Jiang, X., Chen, Y., and Wang, J. (2021). Global food security under COVID-19: comparison and enlightenment of policy responses in different countries. Food Secur. 10:2850. doi: 10.3390/foods10112850
Kazancoglu, Y., Ekinci, E., Mangla, S. K., Sezer, M. D., and Ozbiltekin-Pala, M. (2023). Impact of epidemic outbreaks (COVID-19) on global supply chains: a case of trade between Turkey and China. Socio Econ. Plan. Sci. 85:101494. doi: 10.1016/j.seps.2022.101494
Keeratipibul, S., Silamat, P., Phraephaisarn, C., Srisitthinam, D., Takahashi, H., and Chaturongkasumrit, Y. (2015). Genotyping of Salmonella enterica serovar typhimurium isolates by multilocus variable number of tandem repeat high-resolution melting analysis (MLV-HRMA). Foodborne Pathog. Dis. 12, 8–20. doi: 10.1089/fpd.2014.1761
Khokhar, S. G., Min, Q., and Su, C. (2015). Bird flu (H7N9) outbreak and its implications on the supply chain of poultry meat in China. J. Appl. Poult. Res. 24, 215–221. doi: 10.3382/japr/pfv007
Kshetri, N. (2021). Food and beverage industry supply chains. Blockchain and Supply Chain Management, Elsevier, 89–114
Kuiper, W. E., and Lansink, A. (2013). Asymmetric Price transmission in food supply chains: impulse response analysis by local projections applied to U.S. broiler and pork prices. Agribusiness 29, 325–343. doi: 10.1002/agr.21338
Laborde, D., Martin, W., and Vos, R. (2021). Impacts of COVID-19 on global poverty, food security, and diets: insights from global model scenario analysis. Agric. Econ. 52, 375–390. doi: 10.1111/agec.12624
Li, J., and Lin, Q. (2023). Threshold effects of green technology application on sustainable grain production: evidence from China. Front. Plant Sci. 14:1107970. doi: 10.3389/fpls.2023.1107970
Li, J., and Song, Z. (2022). Dynamic impacts of external uncertainties on the stability of the food supply chain: evidence from China. Food Secur. 11:2552. doi: 10.3390/foods11172552
Liang, Y., and Zhong, T. (2023). Impacts of community-level grassroots organizations on household food security during the COVID-19 epidemic period in China. Int. J. Disaster Risk Reduct. 85:103490. doi: 10.1016/j.ijdrr.2022.103490
Mahajan, K., and Tomar, S. (2021). COVID-19 and supply chain disruption: evidence from food markets in India. Am. J. Agric. Econ. 103, 35–52. doi: 10.1111/ajae.12158
Manyong, V., Bokanga, M., Akonkwa Nyamuhirwa, D.-M., Bamba, Z., Adeoti, R., and Mwepu, G. (2022). COVID-19 outbreak and rural household food security in the Western Democratic Republic of the Congo. World Dev. Persp. 28:100469. doi: 10.1016/j.wdp.2022.100469/
Martínez-Guido, S. I., Núñez-López, J. M., and Ponce-Ortega, J. M. (2021). Involving resilience in synthesizing food networks in low-income communities. Process Integr. Optimiz. Sustain. 5, 139–157. doi: 10.1007/s41660-020-00126-7
Matta, L. L., Karuppuswami, S., Chahal, P., and Alocilja, E. C. (2018). AuNP-RF sensor: an innovative application of RF technology for sensing pathogens electrically in liquids (SPEL) within the food supply chain. Biosens. Bioelectron. 111, 152–158. doi: 10.1016/j.bios.2018.04.010
Nakajima, J. (2011). Time-varying parameter VAR model with stochastic volatility: an overview of methodology and empirical applications. IMES Discussion Paper Series 29, 107–142.
Nordhagen, S., Igbeka, U., Rowlands, H., Shine, R. S., Heneghan, E., and Tench, J. (2021). COVID-19 and small enterprises in the food supply chain: early impacts and implications for longer-term food system resilience in low- and middle-income countries. World Dev. 141:105405. doi: 10.1016/j.worlddev.2021.105405
Ortiz-de-Mandojana, N., and Bansal, P. (2016). The long-term benefits of organizational resilience through sustainable business practices. Strateg. Manag. J. 37, 1615–1631. doi: 10.1002/smj.2410
Perdana, T., Onggo, B. S., Sadeli, A. H., Chaerani, D., Achmad, A. L. H., and Hermiatin, F. R. (2022). Food supply chain management in disaster events: a systematic literature review. Int. J. Disaster Risk Reduct. 79:103183. doi: 10.1016/j.ijdrr.2022.103183
Pu, M., and Zhong, Y. (2020). Rising concerns over agricultural production as COVID-19 spreads: lessons from China. Glob. Food Sec. 26:100409. doi: 10.1016/j.gfs.2020.100409
Saboori, B., Radmehr, R., Zhang, Y. Y., and Zekri, S. (2022). A new face of food security: a global perspective of the COVID-19 pandemic. Prog. Disaster Sci. 16:100252. doi: 10.1016/j.pdisas.2022.100252
Salvatore, D. (2020). Growth and trade in the United States and the world economy: overview. J. Policy Model 42, 750–759. doi: 10.1016/j.jpolmod.2020.03.001
Schipanski, M. E., MacDonald, G. K., Rosenzweig, S., Chappell, M. J., Bennett, E. M., and Kerr, R. B. (2016). Realizing resilient food systems. Bioscience 66, 600–610. doi: 10.1093/biosci/biw052
Schlaich, T., Horn, A. L., Fuhrmann, M., and Friedrich, H. (2020). A gravity-based food flow model to identify the source of foodborne disease outbreaks. Int. J. Environ. Res. Public Health 17:444. doi: 10.3390/ijerph17020444
Schneider, M. (2016). Dragon head enterprises and the state of agribusiness in China. J. Agrar. Chang. 17, 3–21. doi: 10.1111/joac.12151
Singh, S., Kumar, R., Panchal, R., and Tiwari, M. K. (2021). Impact of COVID-19 on logistics systems and disruptions in food supply chain. Int. J. Prod. Res. 59, 1993–2008. doi: 10.1080/00207543.2020.1792000
Song, C., and Zhuang, J. (2017). Modeling a government-manufacturer-farmer game for food supply chain risk management. Food Control 78, 443–455. doi: 10.1016/j.foodcont.2017.02.047
Stephesns, E., Timsina, J., Martin, G., van Wijk, M., Klerkx, L., and Reidsma, P. (2022). The immediate impact of the first waves of the global COVID-19 pandemic on agricultural systems worldwide: reflections on the COVID-19 special issue for agricultural systems. Agric. Syst. 201:103436. doi: 10.1016/j.agsy.2022.103436
Stone, J., and Rahimifard, S. (2018). Resilience in Agri-food supply chains: a critical analysis of the literature and synthesis of a novel framework. Supply Chain Manag. Int. J. 23, 207–238. doi: 10.1108/SCM-06-2017-0201
Suyo, J., le Masson, V., Shaxson, L., Luhan, M. R. J., and Hurtado, A. Q. (2021). Navigating risks and uncertainties: risk perceptions and risk management strategies in the Philippine seaweed industry. Mar. Policy 126:104408. doi: 10.1016/j.marpol.2021.104408
Swinnen, J. E., and Mcdermott, J. E. (2020). COVID-19 and global food security. IFPRI Books 19, 26–33. doi: 10.2499/p15738coll2.133762
Swinnen, J., and Vos, R. (2021). COVID and impacts on global food systems and household welfare: introduction to a special issue. Agric. Econ. 52, 365–374. doi: 10.1111/agec.12623
Tukamuhabwa, B. R., Stevenson, M., Busby, J., and Zorzini, M. (2015). Supply chain resilience: definition, review and theoretical foundations for further study. Int. J. Prod. Res. 53, 5592–5623. doi: 10.1080/00207543.2015.1037934
UN (2001). Road map towards the implementation of the United Nations millennium declaration. Available at: https://mdgs.un.org/unsd/mdg/Resources/Static/Products/SGReports/56_326/a_56_326e.pdf
UN (2015). Transforming our world: The 2030 agenda for sustainable development. Available at: https://documents-dds-ny.un.org/doc/UNDOC/GEN/N15/291/89/PDF/N1529189.pdf?OpenElement
Wang, Y., Tilley, H. B., Phalke, S., Andersson, A. A., Dingle, C., and Hatten, C. E. R. (2022). Discussion of wildlife trade before and during the COVID-19 pandemic in professional opinion pieces and scientific articles. Global Ecol. Conserv. 38:e02270. doi: 10.1016/j.gecco.2022.e02270
World Bank (2020). Commodity market outlook, implication of COVID-19 for commodities. Technical Report
Yang, Z., Chen, Y., and Zhang, P. (2020). Macroeconomic shock, financial risk transmission and governance response to major public emergencies. J. Manag. World 11:67. doi: 10.19744/j.cnki.11-1235/f.2020.0067
Yao, H., Zang, C., Zuo, X., Xian, Y., Lu, Y., and Huang, Y. (2022). Tradeoff analysis of the pork supply and food security under the influence of African swine fever and the COVID-19 outbreak in China. Geogr. Sustain. 3, 32–43. doi: 10.1016/j.geosus.2022.01.005
Yu, M., and Nagurney, A. (2013). Competitive food supply chain networks with application to fresh produce. Eur. J. Oper. Res. 224, 273–282. doi: 10.1016/j.ejor.2012.07.033
Zhan, Y., and Chen, K. Z. (2021). Building resilient food system amidst COVID-19: responses and lessons from China. Agric. Syst. 190:103102. doi: 10.1016/j.agsy.2021.103102
Zhang, X. (2022). Research on security risks and prevention mechanisms of Agri-food supply chain. Issues Agric. Econ. 02, 97–107. doi: 10.13246/j.cnki.iae.20211122.002
Zhang, D., and Sun, Z. (2022). Comparative advantage of agricultural trade in countries along the belt and road and China and its dynamic evolution characteristics. Food Secur. 11:3401. doi: 10.3390/foods11213401
Keywords: public health events, food supply chain, nonlinear conduction, dynamic impacts, COVID-19 pandemic
Citation: Li J, Li Z, Shi Z and Geng H (2024) Examining the dynamic and nonlinear impacts of public health events on the resilience of food supply chain: evidence from China. Front. Sustain. Food Syst. 8:1347594. doi: 10.3389/fsufs.2024.1347594
Edited by:
Ruishi Si, Xi’an University of Architecture and Technology, ChinaReviewed by:
Zhilu Sun, Chinese Academy of Agricultural Sciences, ChinaXiaoyu Jiang, Chinese Academy of Agricultural Sciences, China
Copyright © 2024 Li, Li, Shi and Geng. This is an open-access article distributed under the terms of the Creative Commons Attribution License (CC BY). The use, distribution or reproduction in other forums is permitted, provided the original author(s) and the copyright owner(s) are credited and that the original publication in this journal is cited, in accordance with accepted academic practice. No use, distribution or reproduction is permitted which does not comply with these terms.
*Correspondence: Zhi Li, bGl6aGkyMDE5QGhhdXQuZWR1LmNu; Hongjun Geng, ODY5MTY3MTA2QHFxLmNvbQ==