 Gerardo Ramos1
 Polly Goldman1Jason Sharrett2Gabriel O. Sacher1,3Kayla K. Pennerman1Christine Jade Dilla-Ermita4†Jose H. Jaime1Mary E. Steele5,6Shashika S. Hewavitharana5,6†
 Gerald J. Holmes5†
 Hannah Waterhouse7José Pablo Dundore-Arias8†
 Peter Henry1*†
- 1United States Department of Agriculture, Agricultural Research Service, Salinas, CA, United States
- 2California Strawberry Commission, Watsonville, CA, United States
- 3Department of Plant Pathology and Environmental Microbiology, Pennsylvania State University, University Park, PA, United States
- 4Department of Plant Sciences, University of California, Davis, Davis, CA, United States
- 5Strawberry Center, California Polytechnic State University, San Luis Obispo, CA, United States
- 6Plant Sciences Department, California Polytechnic State University, San Luis Obispo, CA, United States
- 7Department of Environmental Studies, University of California, Santa Cruz, Santa Cruz, CA, United States
- 8Department of Biology and Chemistry, California State University Monterey Bay, Seaside, CA, United States
Strawberries in California are grown in specific coastal areas where land is scarce and climate change threatens future production. Strawberry growers are under pressure to adopt sustainable production strategies such as crop rotation, but this practice requires more land than back-to-back planting. The objectives of this research were to quantify the rate of crop rotation across the three main strawberry producing regions in California (Ventura, Santa Maria, and Monterey Bay), and evaluate geographic and edaphic influences on crop rotation. All strawberry fields in the main strawberry producing regions of California were identified by satellite imagery and manual inspection for the years 2017 through 2022. ArcGIS Pro was used to outline each strawberry field and compare among years to determine the period between successive strawberry plantings. Edaphic characteristics and shapefiles for surrounding fields were retrieved from public datasets. The three regions significantly differed in their rates of crop rotation. On average, 95, 52, and 25% of strawberry hectares were rotated each year in the Monterey Bay, Santa Maria, and Ventura regions, respectively. Shorter rotation lengths were associated with reduced distance from the ocean and soil with a higher percentage of sand. Based on 2 years of disease surveys, fields infested with Macrophomina phaseolina tended to be further inland than fields infested with Fusarium oxysporum f. sp. fragariae in the Monterey Bay region. This study determined that distance from the ocean and soil texture are associated with crop rotation lengths in California strawberry production. Enough land may be available in the Santa Maria and Monterey Bay regions for growers to lengthen crop rotations, but water quality, social networks, and financial considerations that were outside the scope of this study are likely to limit the ability for strawberry growers to maximize the duration of crop rotations.
Introduction
Strawberries are the sixth most consumed fruit in the United States and are an important source of fresh fruit (United States Department of Agriculture Economic Research Service [USDA-ERS], 2019). More than 90% of domestically consumed strawberries are produced on only ~16,000 hectares in California (United States Department of Agriculture Economic Research Service [USDA-ERS], 2021; California Strawberry Commission, 2022), a miniscule area equal to roughly 2.7% of land in the Los Angeles Metropolitan Area (585,902 hectares) (Atlas of Urban Expansion, 2016; California Strawberry Commission, 2022). California’s outsized impact on domestic fruit availability is achieved with production systems that have steadily increased in efficiency over the past several decades, boosted by cultivar improvements and enhanced cultural practices (Wilhelm and Paulus, 1980; Voth and Bringhurst, 1990; Feldmann et al., 2024). Now, coastal California boasts the highest per-hectare strawberry yields in the world and provides a nearly year-round supply of fresh fruit (United States Department of Agriculture National Agriculture Statistics Service [USDA-NASS], 2021; Feldmann et al., 2024).
Recent gains in efficiency are reliant on a highly specific combination of climatic and edaphic characteristics: fertile, sandy soils and mild temperatures in proximity to the Pacific Ocean (Pathak et al., 2016, 2018; Menzel, 2021). Sandy soils benefit strawberry production through improved drainage, which reduces the likelihood of root rot caused by Phytophthora spp. or minor parasites and reduces the accumulation of salts in the rooting zone (University of California Cooperative Extension and Cachuma Resource Conservation District, 2015; Baggio et al., 2021a). Average temperatures rise rapidly over short distances from the ocean (California Department of Water Resources, 2023), and higher temperatures can have major impacts on strawberry production. For example, fruit quality and yield decreased as daily high temperatures increased from 18°C to 25°C (Wang and Camp, 2000; Menzel, 2021). Lower night-time temperatures are also associated with increased sugar concentrations and titratable acids (Wang and Camp, 2000). At 30°C daily high temperatures, the impacts are more severe, with significant reductions in yield and fruit quality that are in part driven by reduced pollen viability (Wang and Camp, 2000; Ledesma and Sugiyama, 2005; Balasooriya et al., 2020).
These factors related to temperature and soil have led to a consolidation of fruit production in relatively small regions close to the ocean. Fields with these characteristics are concentrated in three regions in coastal valleys created by the Santa Clara River (Ventura region), Santa Maria River (Santa Maria region) and the Pajaro and Salinas Rivers (Monterey Bay region). A consistent supply of strawberries is achieved by strategic deployment of early-producing (short day) cultivars at lower latitudes in Ventura, cultivars that produce throughout the summer and fall (day neutral) at the higher latitudes in the Monterey Bay, and a mixture of both types in Santa Maria (California Strawberry Commission, 2022). While most strawberries are fall-planted for spring and summer harvest, an increasing area is summer-planted for fall and winter harvest (Holmes, 2024). The additional summer-planted season enables year-round production of strawberries in California.
The availability of productive land is further limited by soilborne pathogens that can cause plant mortality and greatly reduce yield. Historically, growers fumigated soil with mixtures of methyl bromide and chloropicrin to manage Verticillium dahliae (a fungus) and Phytophthora spp. (an oomycete; Wilhelm and Sagen, 1974; Wilhelm and Paulus, 1980). During the phaseout of methyl bromide, two new fungal pathogens, Fusarium oxysporum f. sp. fragariae and Macrophomina phaseolina, emerged and became common in all production regions (Koike, 2008; Koike et al., 2009; Henry et al., 2017; Burkhardt et al., 2018). Each of these pathogens has the potential to cause persistent, long-term reductions in yield in infested fields.
Conventional strawberry growers maximize the utility of scarce land by fumigating soil before planting. This practice enables growers to shorten or eliminate crop rotations that would otherwise be required for disease prevention (Wilhelm and Paulus, 1980). The result is that pathogen abundance in climatically-desirable, infested fields is reduced and these fields may remain in production. However, the industry is under increasing pressure to reduce or eliminate fumigant use. The California Sustainable Pest Management Roadmap proposes to eliminate the use of “Priority Pesticides” by 2050 and current soil fumigants are suspected to fall into this category (California Department of Pesticide Regulation, 2023). Achieving comparable productivity without soil fumigants is not always possible, especially where pathogens are present (Duniway, 2002; Ajwa and Trout, 2004). Without fumigation, successful disease management can require a combination of 4-or-more year crop rotations, disease resistant cultivars, and biologically-based soil disinfestation techniques (Zavatta et al., 2021).
Crop rotation, or successively planting different crops on the same piece of land, is facilitated by diverse vegetable producers that are common in all three strawberry growing regions. Common rotation crops in these regions include lettuce, spinach, broccoli, celery, cilantro, and many others. However, crop rotations require more land than back-to-back strawberry planting to sustain production levels. For a region to support 1,000 hectares of strawberry production each year in a “2-year rotation,” where strawberries are planted every other year, 2,000 hectares of land would be required. If the time out of strawberry production increases to 2 years for each piece of land, 3,000 hectares are required to support a system with 1,000 hectares of strawberry production. Thus, sustained production levels in longer crop rotations require more land, and land availability may limit the potential for practicing crop rotation.
Increasing crop rotation duration and diversity can interrupt pest and disease cycles, increase yields and yield stability, mitigate freshwater pollution, and reduce risk of crop failure from adverse weather (Davis et al., 2012; Sindelar et al., 2016; Hunt et al., 2017; Bowles et al., 2020). Systems where crop rotations are simplified or eliminated rely heavily on external agrochemical inputs with well-documented tradeoffs for soil degradation and erosion, as well as water pollution and negative impacts on human health (Weisenburger, 1993; Amundson et al., 2015; Harter et al., 2017; Ward et al., 2018). Reducing surface- and ground-water pollution is increasingly important in the coastal regions where strawberries are grown; water availability in the central coast region is limited, and the water supply for 33% of households in this region is above the maximum contaminant limit for nitrate, for which the main source is nitrogen fertilizers (United States Geological Survey, 2013).
Lengthening crop rotations is viewed as an important strategy for achieving soilborne disease management without fumigation and improving environmental quality, but the frequency and duration of crop rotation in strawberry production have not been quantified. Quantifying crop rotation practices among strawberry growers is prerequisite to addressing the barriers to adoption of lengthened rotations. The goals of this study were to: (1) use geospatial analysis to determine the frequency and duration of crop rotations in California strawberry fields, (2) explore geographic and edaphic factors driving the spatial concentration of strawberry production, (3) evaluate the feasibility of increasing the duration of non-strawberry period of crop rotations, and (4) compare pathogen incidence with geographic data. The results provide insight into the vulnerability of strawberry production to changes in fumigant availability and the risks posed by a changing climate to this critical source of fresh fruit.
Materials and methods
Strawberry field identification
All strawberry fields in the Ventura, Santa Maria, and Monterey Bay regions in the years 2017 through 2022 were identified by: (1) manual inspection of Sentinel-2 satellite imagery accessed through Sentinel Explorer (Esri, Inc. Redlands, CA) and Landsat satellite imagery accessed through Google Earth and (2) physically visiting strawberry fields to confirm their presence. Sentinel 2 images are collected approximately every 5 days, enabling year-round monitoring of strawberry production areas. Strawberry fields are defined as an area greater than or equal to 0.4 hectares where strawberries were grown. These fields were easily identifiable from satellite imagery by the presence of plastic mulch, field organization with approximately 100- to 300-feet row lengths, abundant temporary access roads, and planting that occurs at specific times of year (Figure 1). No other crops grown in these regions look similar in satellite imagery. Polygon field boundaries were created for each field in ArcGIS Pro (version 3.0.36056) based on locations shown on satellite imagery. In-person verifications confirmed the location of these fields and the veracity of the remote-sensing based method for field identification.
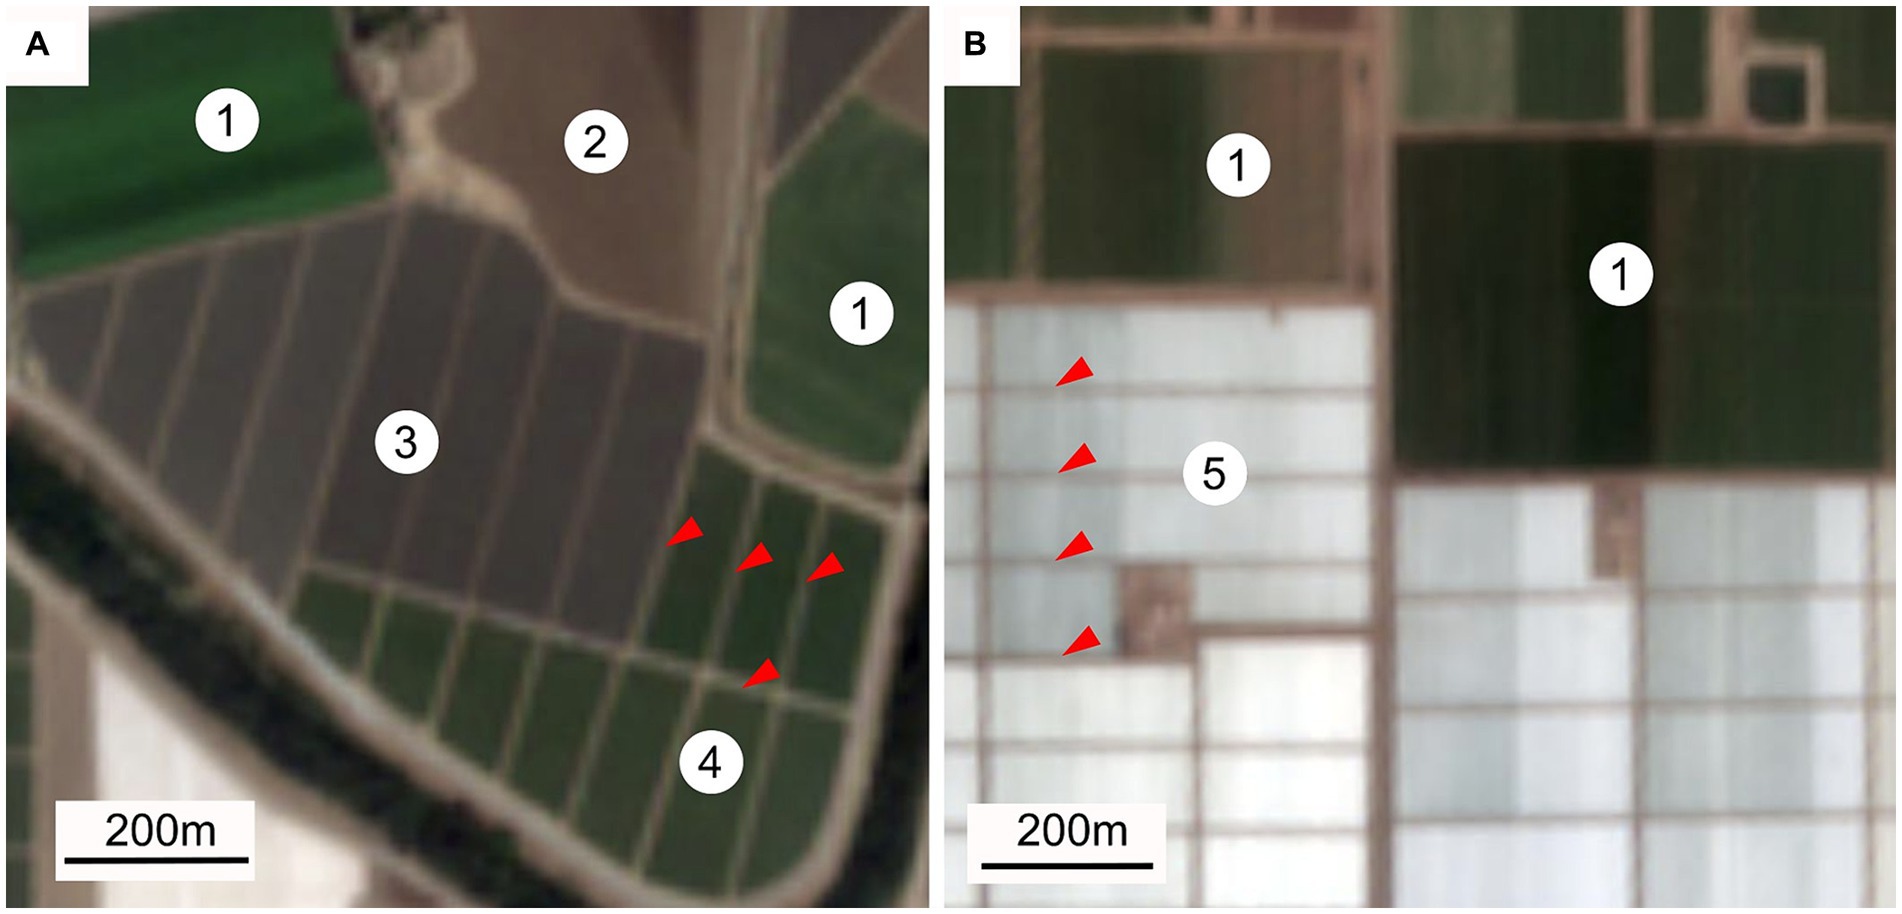
Figure 1. Example Sentinel-2 images of strawberry and adjacent fields near Watsonville, CA on September 21, 2023 (A) and near Oxnard, CA on August 29, 2023 (B). Image resolution is dictated by Sentinel-2 data collection systems. Crops are annotated as (1) vegetable crops; note the absence of access roads, (2) fallow field, (3) beds covered with plastic mulch and prepared for fall strawberry planting in October or November, (4) fall-planted strawberry field in production, (5) summer-planted strawberry field approximately 6 weeks after planting. Only white plastic mulch is used in summer-planted production. Red triangles indicate the position of some, but not all, access roads in strawberry fields.
Analysis of crop rotation history
Field history for one or more preceding years is necessary to determine if a strawberry field is being rotated with other crops. With 6 years of data, we analyzed the preceding 2 years of field history for four query years: 2019, 2020, 2021, and 2022. We used the ‘overlay’ tool in ArcGIS Pro to determine if each field was in a 1-year rotation (not rotated; in strawberry production in the preceding year), in a 2-year rotation (strawberries produced at that location 2 years ago but not in the preceding year), or in a 3-or-more year rotation (3+ years; no strawberries grown in that location during the past 2 or more years). These analyses were conducted separately for summer-planted and fall-planted fields. We verified the accuracy of our results by confirming that the total hectares of the fields in each rotation type equaled the number of hectares in the input file that included all fields before rotation analysis.
For each production region and each year under consideration, we determined the proportion of total hectares under each rotation type. Analysis of these proportional data was done by ANOVA using the lm function of R (version 4.2.1, R Core Team, Vienna, Austria), with a fully factorial model and the years (n = 4) treated as replicates. Contrasts were made between the fixed effects of rotation type, region, and production system. Normality was assessed by a Shapiro–Wilk test (function = shapiro.test; package = stats) and heteroskedasticity assessed with a Levene’s test (function = leveneTest; package = car). Post hoc comparisons were done using Tukey’s pairwise comparisons of means (package = ‘emmeans’).
Identifying factors structuring current field distributions
We focused this investigation on two factors that we considered most likely to be structuring the current geographic concentration of strawberry production: distance from the ocean and soil texture. We retrieved coastal boundary shapefiles from the National Hydrography Dataset from the US Geological Survey’s National Map. Using the ‘near’ tool in ArcGIS Pro, we calculated each field’s distance from the ocean. We evaluated the percentage of sand in a soil’s texture as a measure of coarseness and drainage. The percent sand values for our areas of interest were from the gSSURGO database (United States Department of Agriculture Natural Resources Conservation Service, 2022), which contains soil information from samples collected by the National Cooperative Soil Survey. This table was joined with the gSSURGO ‘MapunitRaster_10m’ using MUKEY as the join field. The average percent sand was calculated for each field using the ‘zonal statistics as table’ tool in ArcGIS Pro.
To determine the statistical significance of variables affecting strawberry rotation length a generalized linear model was implemented in R using a Poisson distribution for the response variable [function = glm(); R Core Team, 2013]. Explanatory variables included field distance from the ocean, mean percent soil sand content, and field size and were scaled and centered prior to statistical analysis. The model was run using district as a grouping variable interacted with each explanatory variable. No overdispersion was detected (dispersion ratio < 1). The deviance residuals were approximately normally distributed for each district model suggesting our models were specified correctly. A residual deviance goodness-of-fit chi-squared test was performed (p = 0.999) on the residual deviances for each model and was not statistically significant indicating our models fit the data. The variance inflation factor was used to detect multicollinearity amongst the explanatory variables using the vif() function from the car package in R (Fox and Weisberg, 2019). No multicollinearity was detected as all variance inflation factors were less than 2 (Kim, 2019).
Identifying factors associated with pathogen occurrence
During August through September 2021, Steele et al. (2022) collected symptomatic plant samples from strawberry fields in the Monterey Bay region to test for the four main soilborne strawberry pathogens in California: F. oxysporum f. sp. fragariae race 1, M. phaseolina, V. dahliae, and Phytophthora spp. Eight symptomatic plants were collected per field and tested using recombinase polymerase assays designed to specifically identify each pathogen (Burkhardt et al., 2018, 2019; Steele et al., 2022). This pathogen survey was repeated in May through October 2022 using the same methods; some of the data collected in 2022 were reported in Henry et al. (2023). In both years, fields with suspected soilborne disease were identified by (1) systematically contacting growers, pest control advisors, and extension personnel, and (2) visually inspecting strawberry fields identified by satellite imagery.
The full survey data from both 2021 and 2022 were reanalyzed for this study to evaluate the association between pathogen incidence, distance from the ocean, mean percent sand, and field size. The effects of these variables on each pathogen’s binary presence/absence in sampled fields were analyzed using a generalized logistic regression model (GLRM; function = glm; package = stats; “family = binomial”). Each pathogen’s relative incidence was compared with a pairwise Fisher’s test (PFT; function = pairwiseNominalIndependence; package = rcompanion) on a contingency table consisting of the detection or non-detection counts for each pathogen.
Evaluating the land use requirement of strawberry production in coastal California
The total amount of land suitable for strawberry production in coastal California has not been previously determined. The outcome such an analysis would depend on the criteria used for determining a field’s suitability for strawberry production. To investigate the range of potential outcomes, we evaluated three scenarios of land availability based on increasingly conservative sets of criteria (methods detailed below).
Here, the land use requirement is defined as the maximum number of hectares available for strawberry production under specific crop rotation durations. As described in the introduction, the land use requirement varies with rotation duration and can be represented by the formula
where c = the land use requirement of strawberry production area, h = the total hectares available, and n = the rotation duration.
For the first scenario, all agricultural field boundaries were sourced from the CalAgPermits shapefile databases provided by each of these county’s department of agriculture. The counties included were Santa Cruz, Monterey, San Luis Obispo, Santa Barbara, and Ventura, as these encompass the three strawberry growing regions (Monterey Bay, Santa Maria, and Ventura). These fields were filtered to include those that were likely to be suitable for strawberry production based on the following three specifications: (1) located within 6.43 km from any field where strawberries were grown between 2017 and 2022; (2) located within the 95th percentile for distance, as fields further inland are unlikely to be suitable for strawberry production; (3) having an average slope less than or equal to the maximum of the average slopes for current strawberry fields (methods described below).
For the second scenario, we removed any fields from the first scenario that were planted with a perennial crop (e.g., lemons or avocados), as these cannot routinely be rotated with strawberries. Fields where perennials were planted were identified by analyzing the associated pesticide application permit data provided by the county. Our third, most conservative criterion included only fields where strawberries were planted between 2017 and 2022.
To determine the maximum slope that was suitable for a field in strawberry production, we analyzed all strawberry fields in our dataset. Because our dataset of strawberry fields was comprehensive, we assumed it was unlikely that strawberries would be grown in fields with slopes greater than previously observed. We determined the maximum slope of strawberry fields from 2017 to 2022. First, we retrieved Geo TIFF Digital Elevation Models (DEM) from the USGS’s National Map. Using the ‘slope’ tool an elevation raster was created with the Geo TIFF elevation model as the input raster (with 32-bit float pixel type) and the output measurement of ‘degree’. The output raster was used to calculate the average slope for each field, and from these values the maximum (11 degrees) of the average slopes was determined.
Results
Identification of strawberry fields
A total of 5,182 strawberry fields were identified between 2017 and 2022 (Table 1). Most of the area in strawberry production was in the Monterey Bay and Santa Maria each year, with the Ventura region consistently having the smallest area in strawberry production (Table 1). The total area in strawberry production increased from 2017 to 2022 (Table 1).
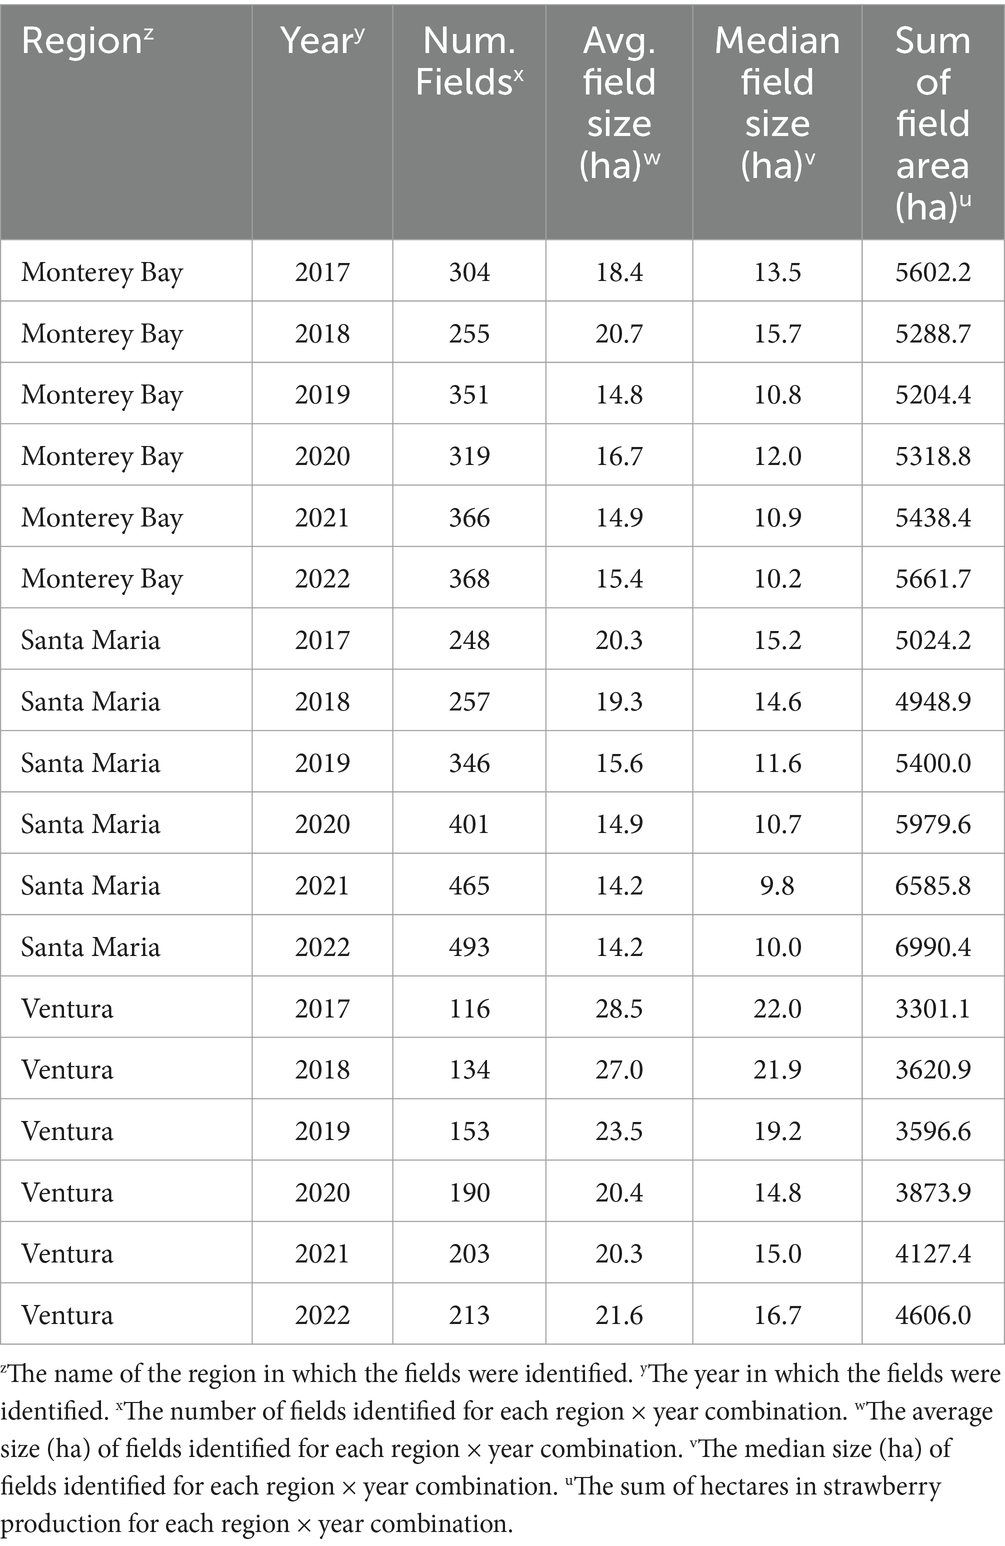
Table 1. Summary statistics of strawberry fields identified for this study.
Crop rotation durations differed between production regions
Shapiro–Wilk and Levene’s tests indicated the crop rotation proportional data met the assumptions of normality (p ≥ 0.20) and non-heteroskedasticity (p ≥ 0.39), respectively. Significant differences were observed in the proportions of hectares under each rotation duration by region combination (ANOVA, p < 0.001; Figure 2A). The proportion of fields in each rotation type did not significantly differ between fall- and summer-planted fields in Ventura (p = 0.976), whereas in Santa Maria 2-year and 3+ year rotations significantly differed in their frequency between fall- and summer-planted systems (p = 0.029, p = 0.032, respectively; Figure 2B). The summer-vs-fall comparison was not made for the Monterey Bay region, which only has fall-planted production.
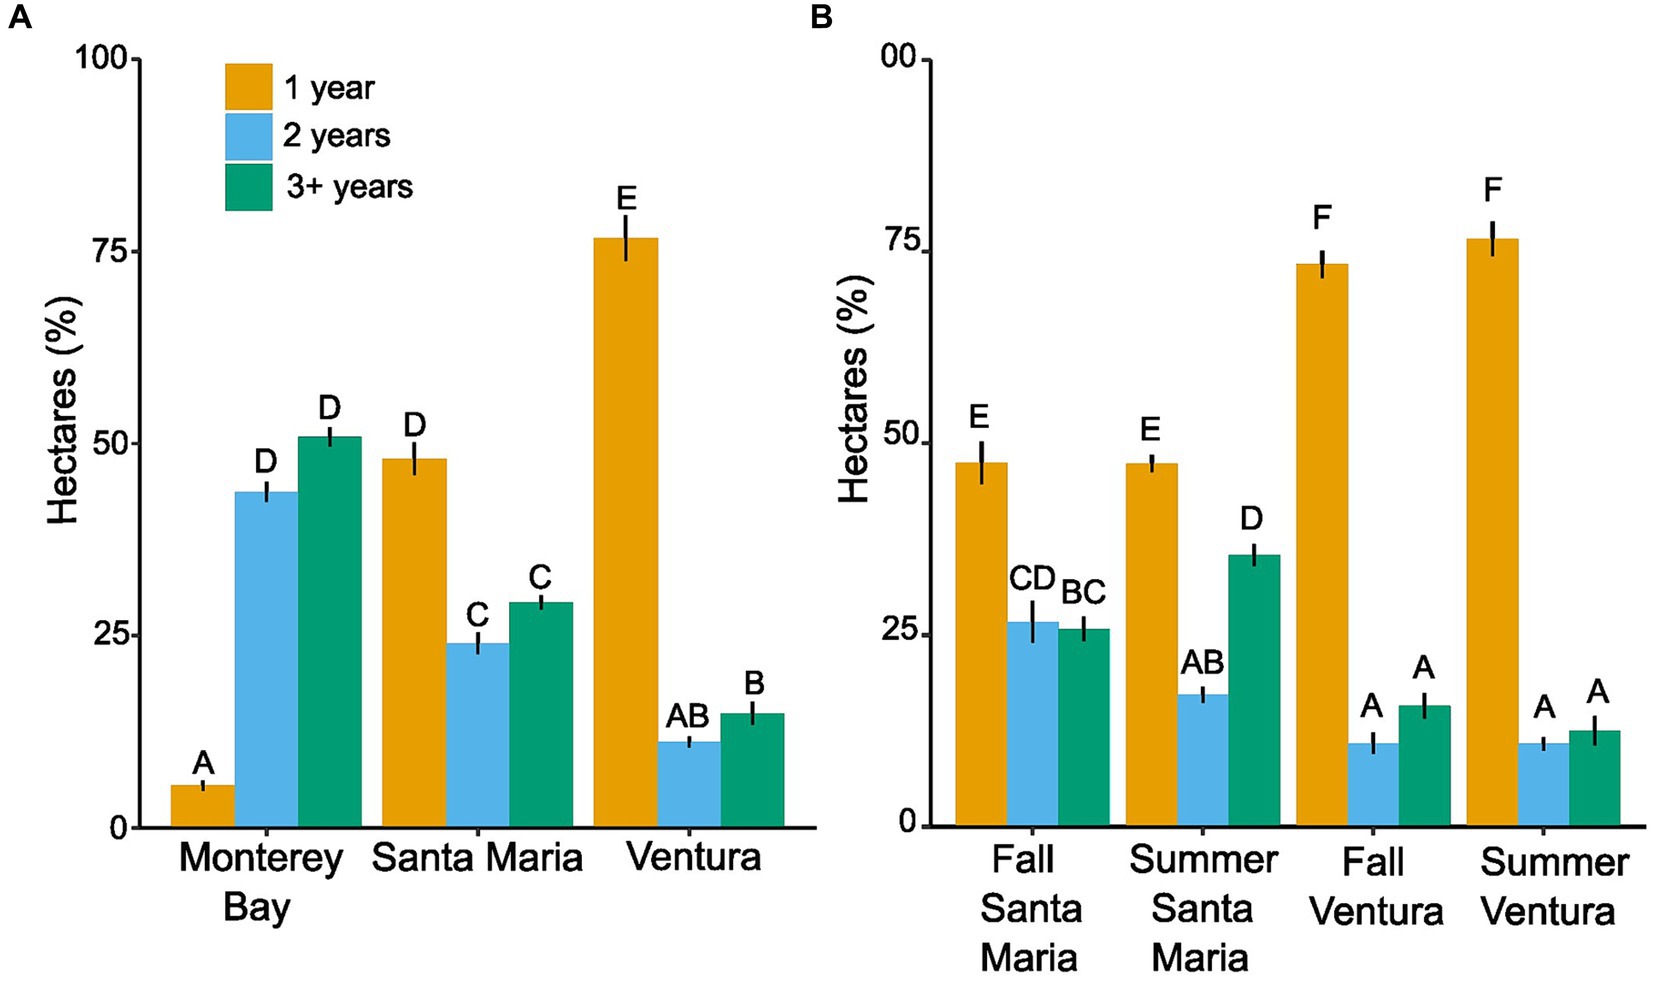
Figure 2. Patterns of crop rotation for land in strawberry production in the three main strawberry growing regions of California. (A) Mean percentage of strawberry land under three different crop rotation durations for each region, where 1 year means not rotated (back-to-back strawberry), 2 years means the previous year the field was not in strawberry production but 2 years ago it was, and 3+ years means strawberries were not planted in that area for at least the last 2 years. (B) Crop rotation patterns contrasted between fall-planted and summer-planted fields in Santa Maria and Ventura. Error bars show 1× standard error. Bars with the same letters indicate no significant differences (a = 0.05) by a Tukey’s HSD test.
Distance from the ocean was associated with length of crop rotation and production season
The 95th percentile distance was 12.66 km (7.87 mi), 25.10 km (15.60 mi), and 22.88 km (14.22 mi) from the ocean for Ventura, Santa Maria, and Monterey Bay regions, respectively. The average distance from the ocean of planted strawberry fields differed significantly across the three production regions and between rotation types (n = 3,868 fields from 2019 to 2022; Kruskal–Wallis p < 0.001), with the largest average distance in Santa Maria (15.39 km) and smallest in Ventura (6.23 km; Monterey Bay average distance = 10.40 km; Figure 3A). When comparing production systems in Santa Maria and Ventura, summer-planted fields were significantly closer to the ocean than the fall-planted fields in Ventura (Dunn’s Test p < 0.001), but this was not the case in Santa Maria (Dunn’s Test p = 0.719; Figure 3A). As distance from the ocean increased, rotation length tended to increase in both the Monterey Bay and Ventura, but not in Santa Maria (Figures 3B,C).
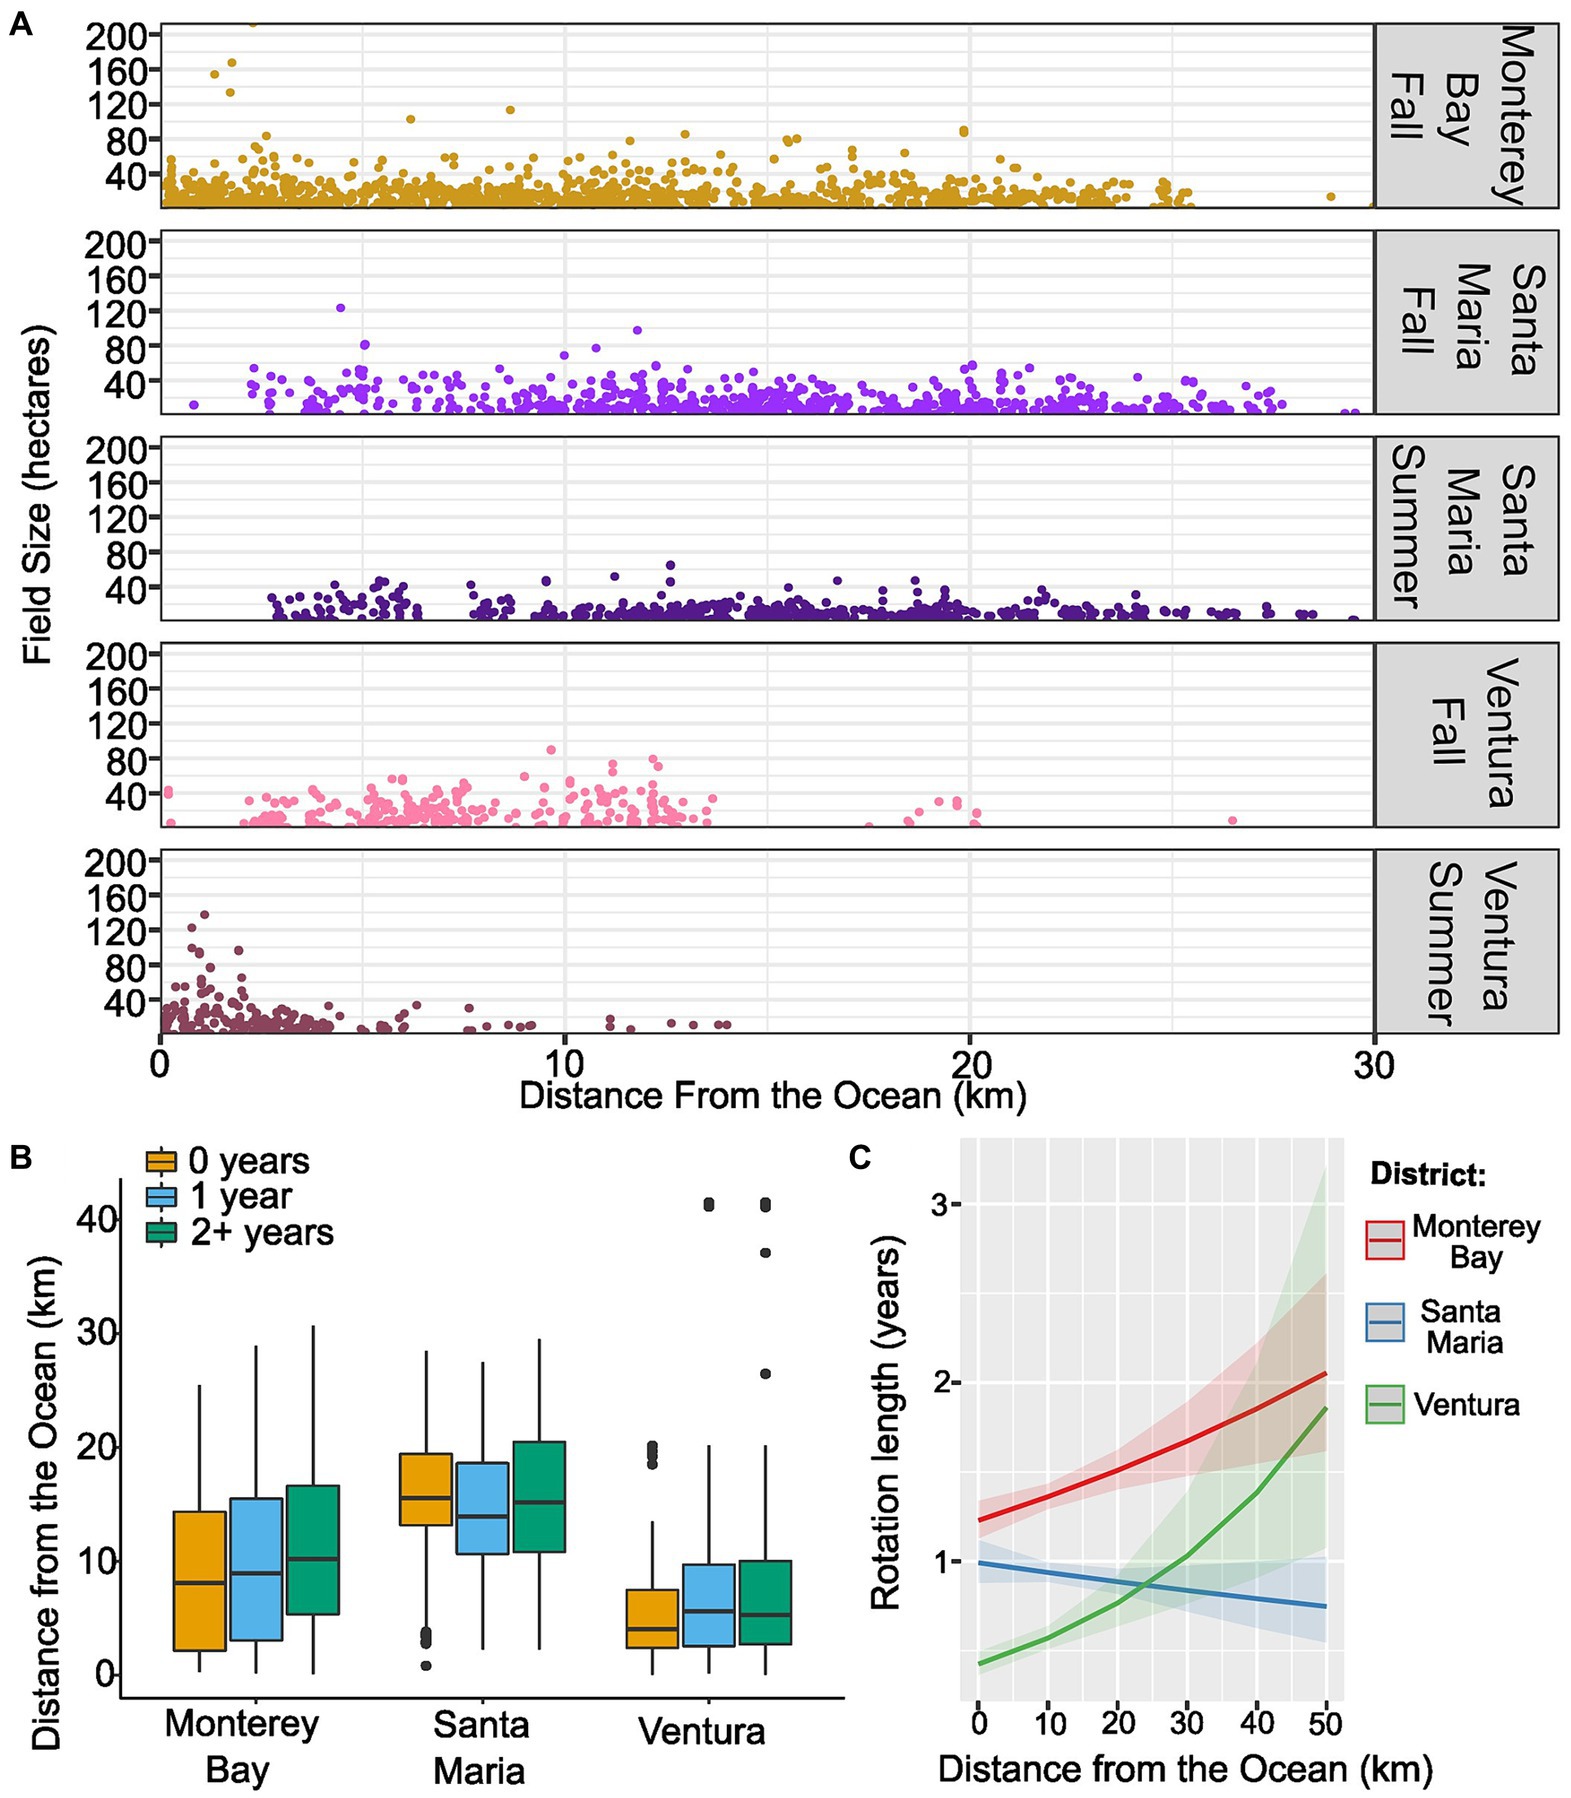
Figure 3. The association between distance from the ocean, crop rotation, and pathogen incidence. (A) Scatter plots depicting the size and distance from the ocean of strawberry fields from 2019 through 2022. (B) Boxplot depicting the distance from the ocean of fields under 1-, 2-, or 3+ year rotation types for all fields from 2019 through 2022. (C) The generalized linear model’s predicted relationship between rotation length and distance from the ocean, after accounting for the effects of field size, district, and mean percent sand. The shaded halo around each line indicates the 95% confidence interval.
Higher percent sand and larger field sizes were associated with shorter rotations
An increase in the coarseness of soil, approximated by the percent sand, was associated with a modest decrease in rotation length in all three districts (Figures 4A,C). The relationship between field size and rotation length differed between districts. In Santa Maria and Ventura, larger fields tended to have shorter rotations, whereas there was no obvious effect of field size no obvious effect of field size on rotation lengths in the Monterey Bay (Figures 4B,D).
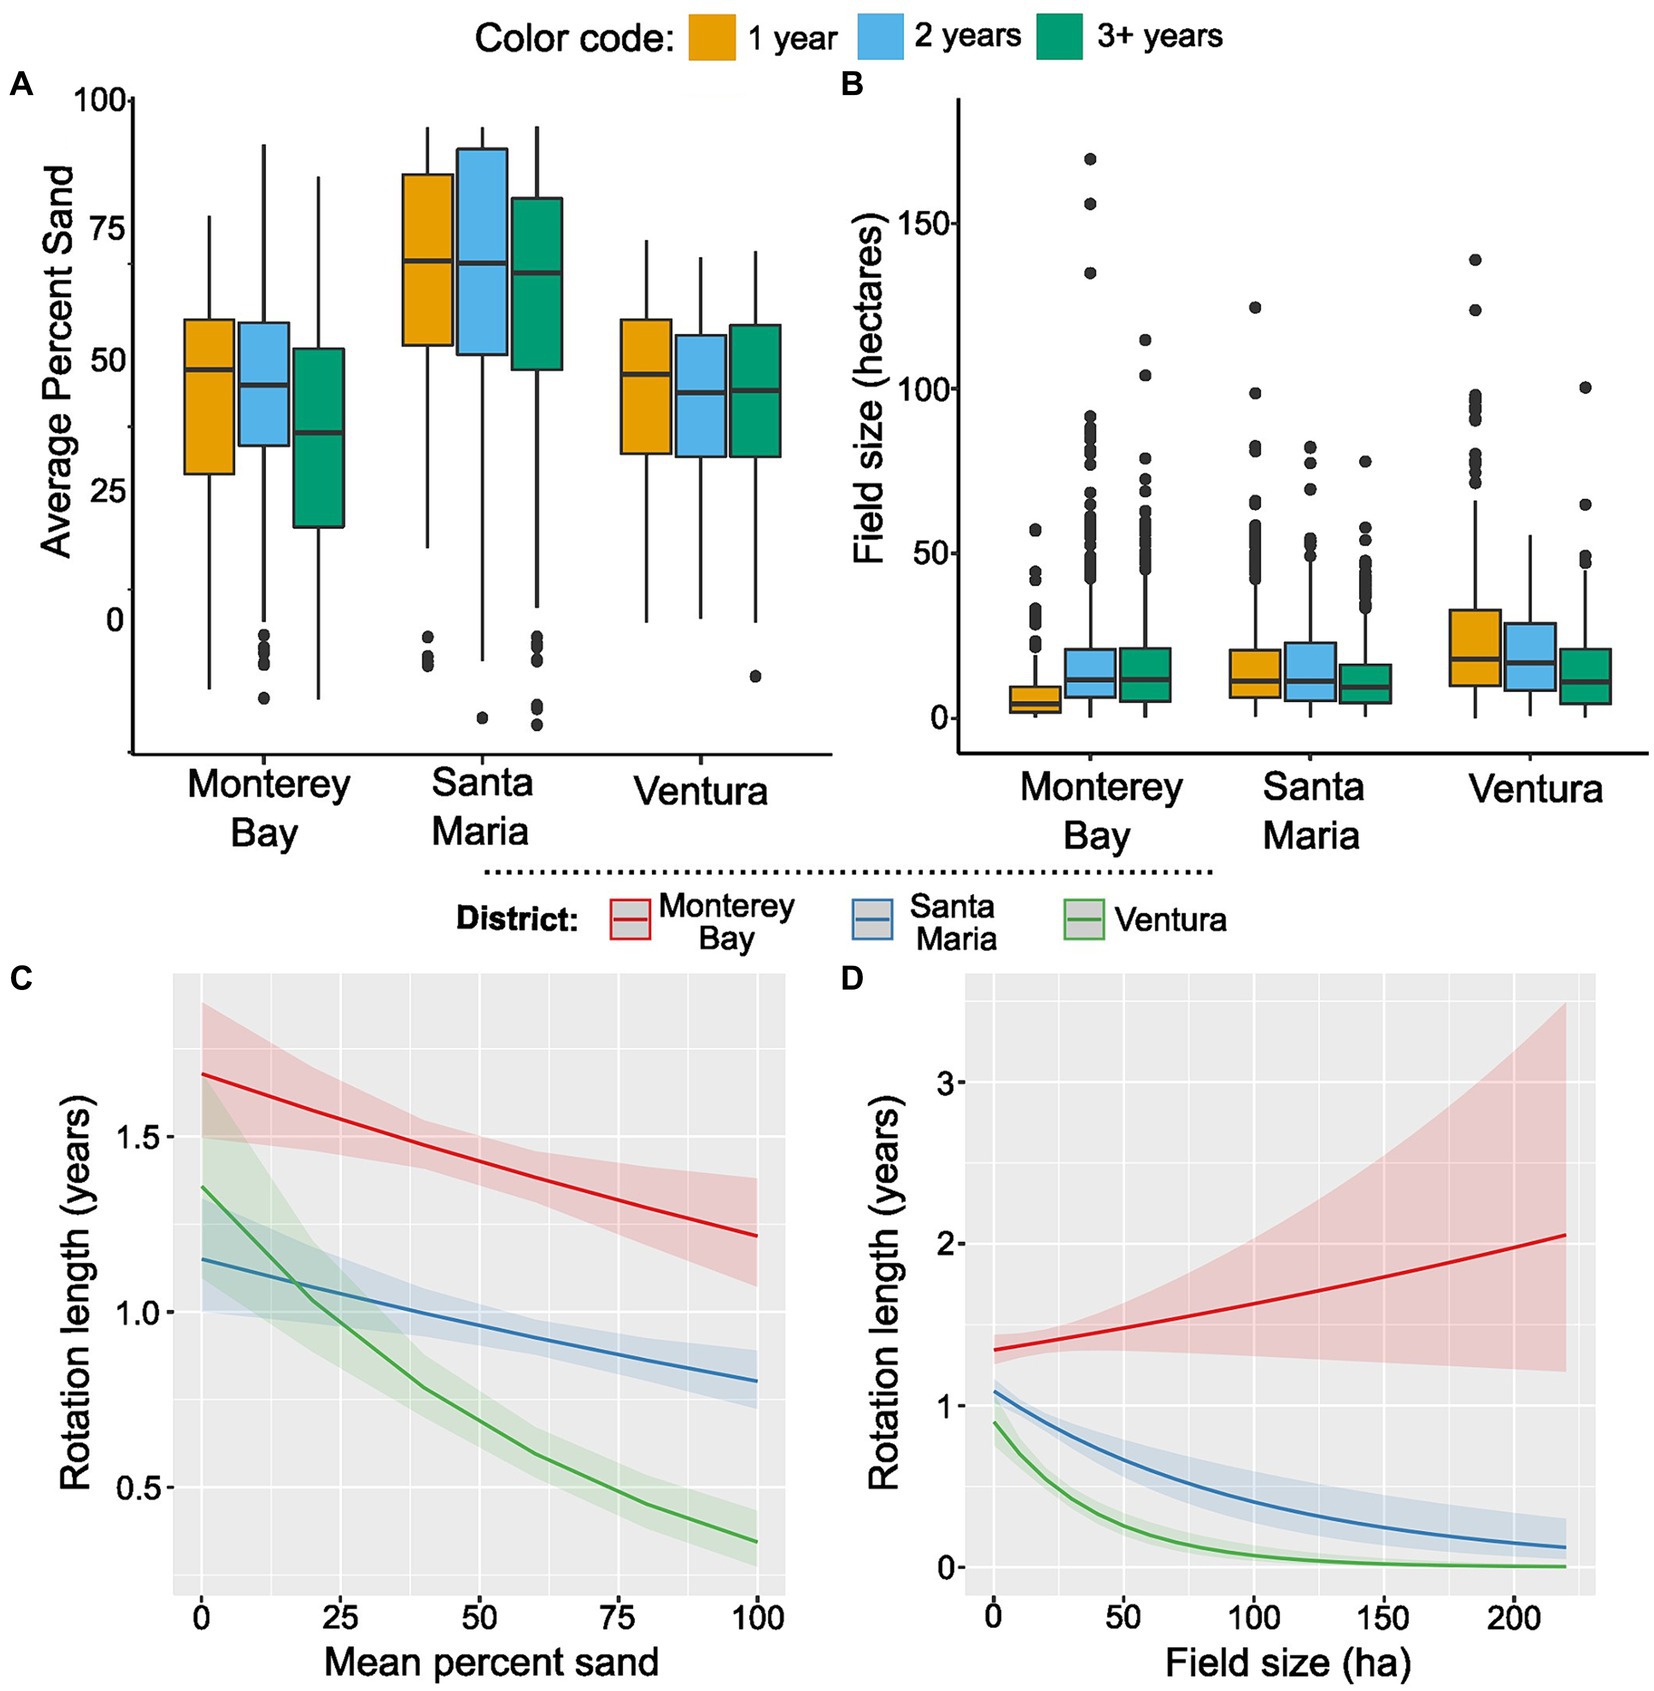
Figure 4. Relationships between crop rotation duration and average percent sand. Boxplots depicting the average percent sand (A) or average field size (B) of fields under 1-, 2-, or 3+ year rotation types for all fields from 2019 through 2022. In panel B, one extreme outlier with a value >200 ha is not shown for the 2-year rotation in Monterey Bay. The generalized linear model’s predicted relationship between rotation length and mean percent sand (C) or field size (D), after accounting for the effects of the other explanatory variables (distance from the ocean, mean percent sand, field size, and district). The shaded halo around each line indicates the 95% confidence interval.
Rotation length and distance from the ocean were associated with incidence of specific pathogens
The surveys of soilborne pathogens conducted in 2021 and 2022 in the Monterey Bay region recovered different numbers of samples for each pathogen (Figure 5). Across the 2 years, F. oxysporum f. sp. fragariae race 1 was recovered significantly more frequently from symptomatic plants than other pathogens (PFT; p < 0.001), and accounted for 41% of all pathogen detections. The incidence of other pathogens was lower: M. phaseolina = 25%, V. dahliae = 20%, and Phytophthora spp. = 14%. Longer rotation lengths were associated with a lower incidence of F. oxysporum f. sp. fragariae (GLRM; p < 0.001) after accounting for the effects of percent sand, distance from ocean, and field size. However, rotation length was not significantly associated with the incidence of any other tested pathogen (GLRM; p ≥ 0.160). The distance from the ocean only had significant effects on the incidence of F. oxysporum f. sp. fragariae and M. phaseolina: Fusarium oxysporum f. sp. fragariae was more likely to be detected in fields closer to the ocean (GLRM; p < 0.001), while M. phaseolina was more likely to be detected in fields further from the ocean (GLRM; p < 0.001) (Figure 5). In addition, pathogen incidence was not significantly associated with average percent sand for any of the four pathogens tested (p ≥ 0.162).
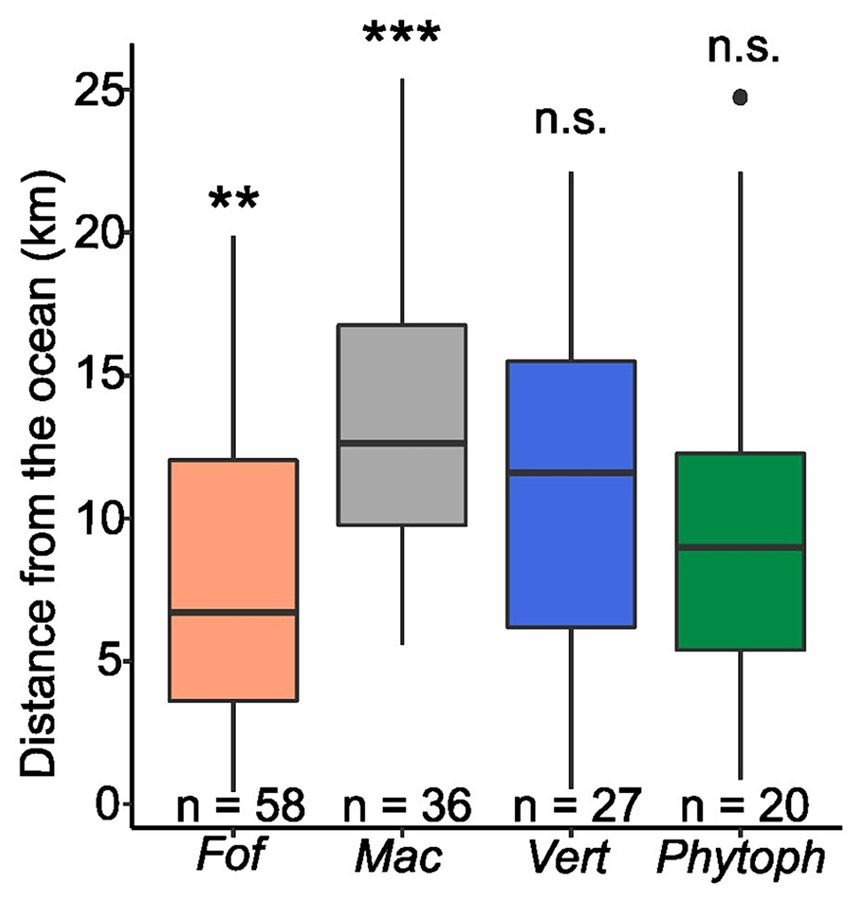
Figure 5. Boxplot depicting the distance from the ocean for diseased strawberry plant samples containing Fusarium oxysporum f. sp. fragariae race 1 (Fof), Macrophomina phaseolina (Mac), Verticillium dahliae (Vert), and Phytophthora spp. (Phytoph). Samples were only collected from the Monterey Bay region. The number of samples positive for each pathogen is listed above the x-axis identifier. Dots represent outliers, defined as points 1.5′ the interquartile range above the upper quartile or below the lower quartile. Significant differences by a generalized logistic regression model are depicted by asterisks, where *** is p < 0.001, ** is p < 0.01, * is p ≤ 0.05, and “n.s.” is p > 0.05.
Land availability suggests that crop rotation lengths could be increased in all three regions
Land was most scarce in the Ventura region. In this region, 3-year rotations were possible under the first and second scenarios at current production levels. However, there was not enough land to support current levels of strawberry production with 4-year rotations, even under the least conservative scenario (Table 2 and Figure 6). Land availability was greater in the Santa Maria and Monterey Bay regions, which support comparable strawberry production areas on an annual basis (Table 2). When considering scenarios 1 and 2, these two regions each contained enough land to support 4-year rotations at current production levels (Table 2 and Figures 7, 8). Under scenario 3, there was a shortage of 2,484 and 1,061 hectares in the Santa Maria and Monterey Bay regions, respectively, between available land and current production levels.
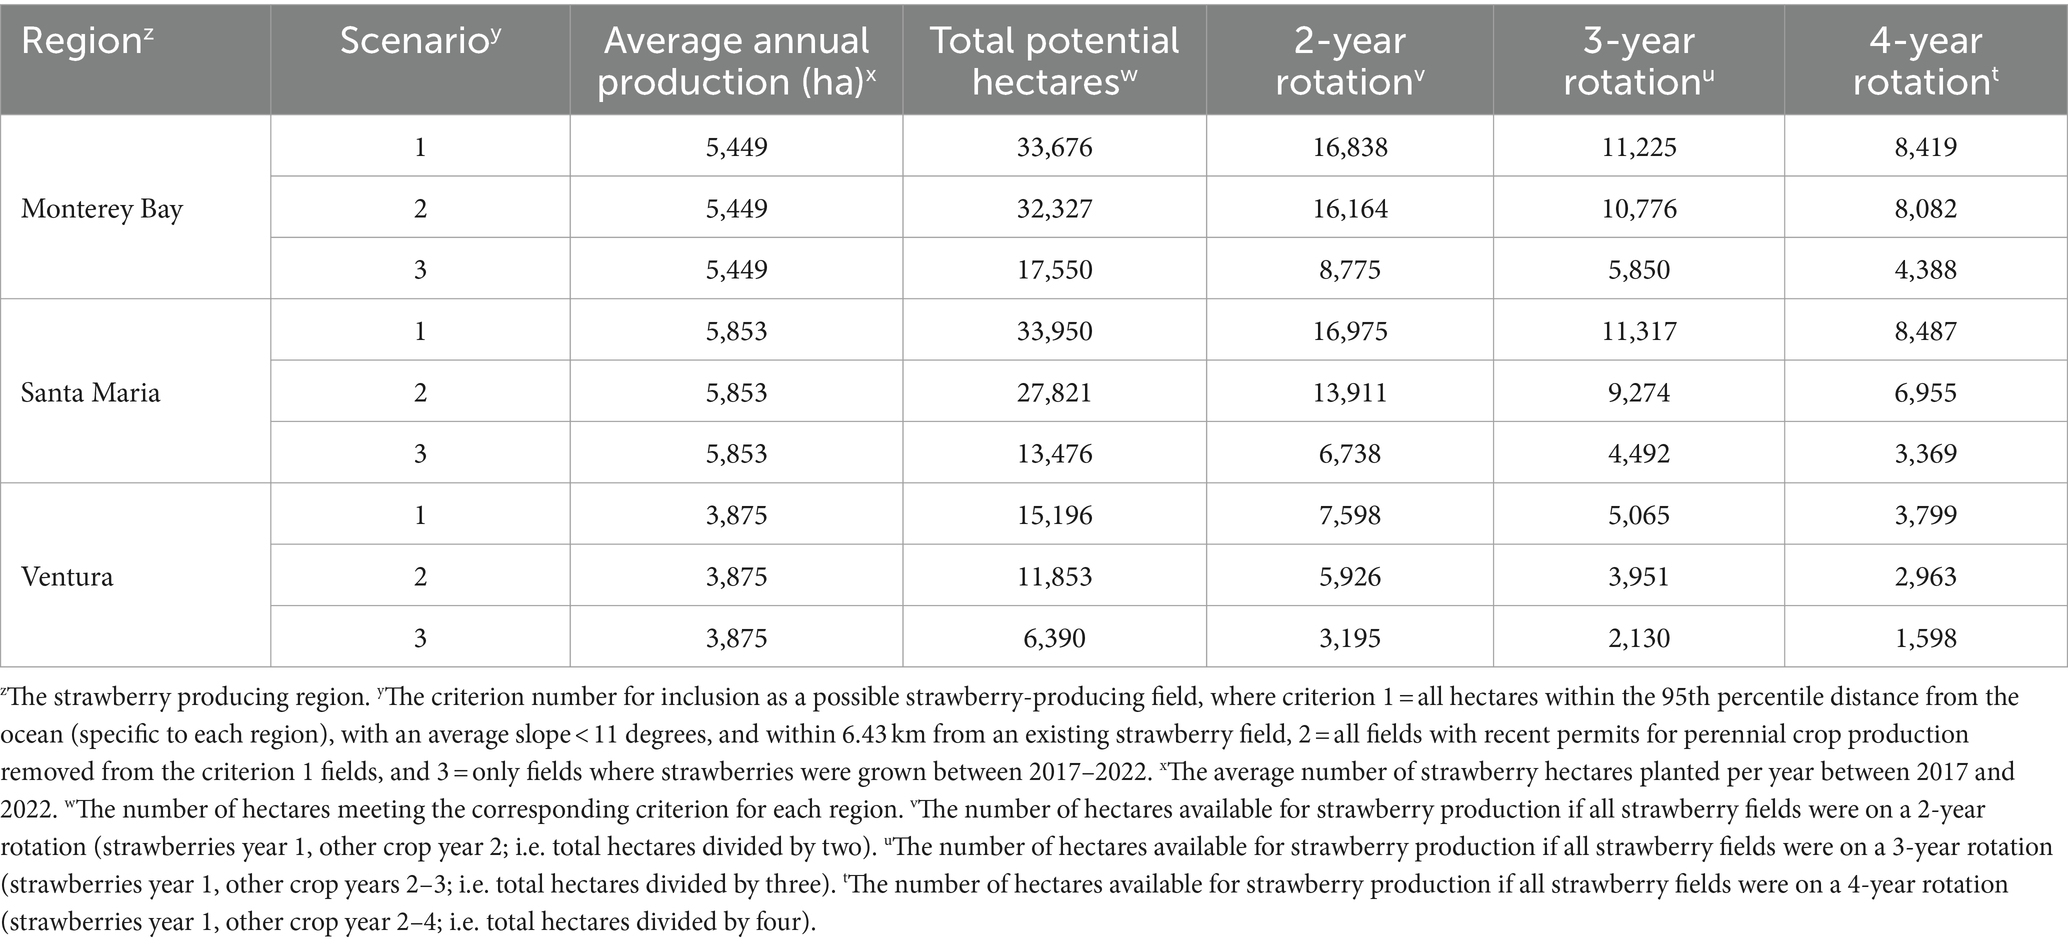
Table 2. Estimated land use requirement for strawberry production under three scenarios.
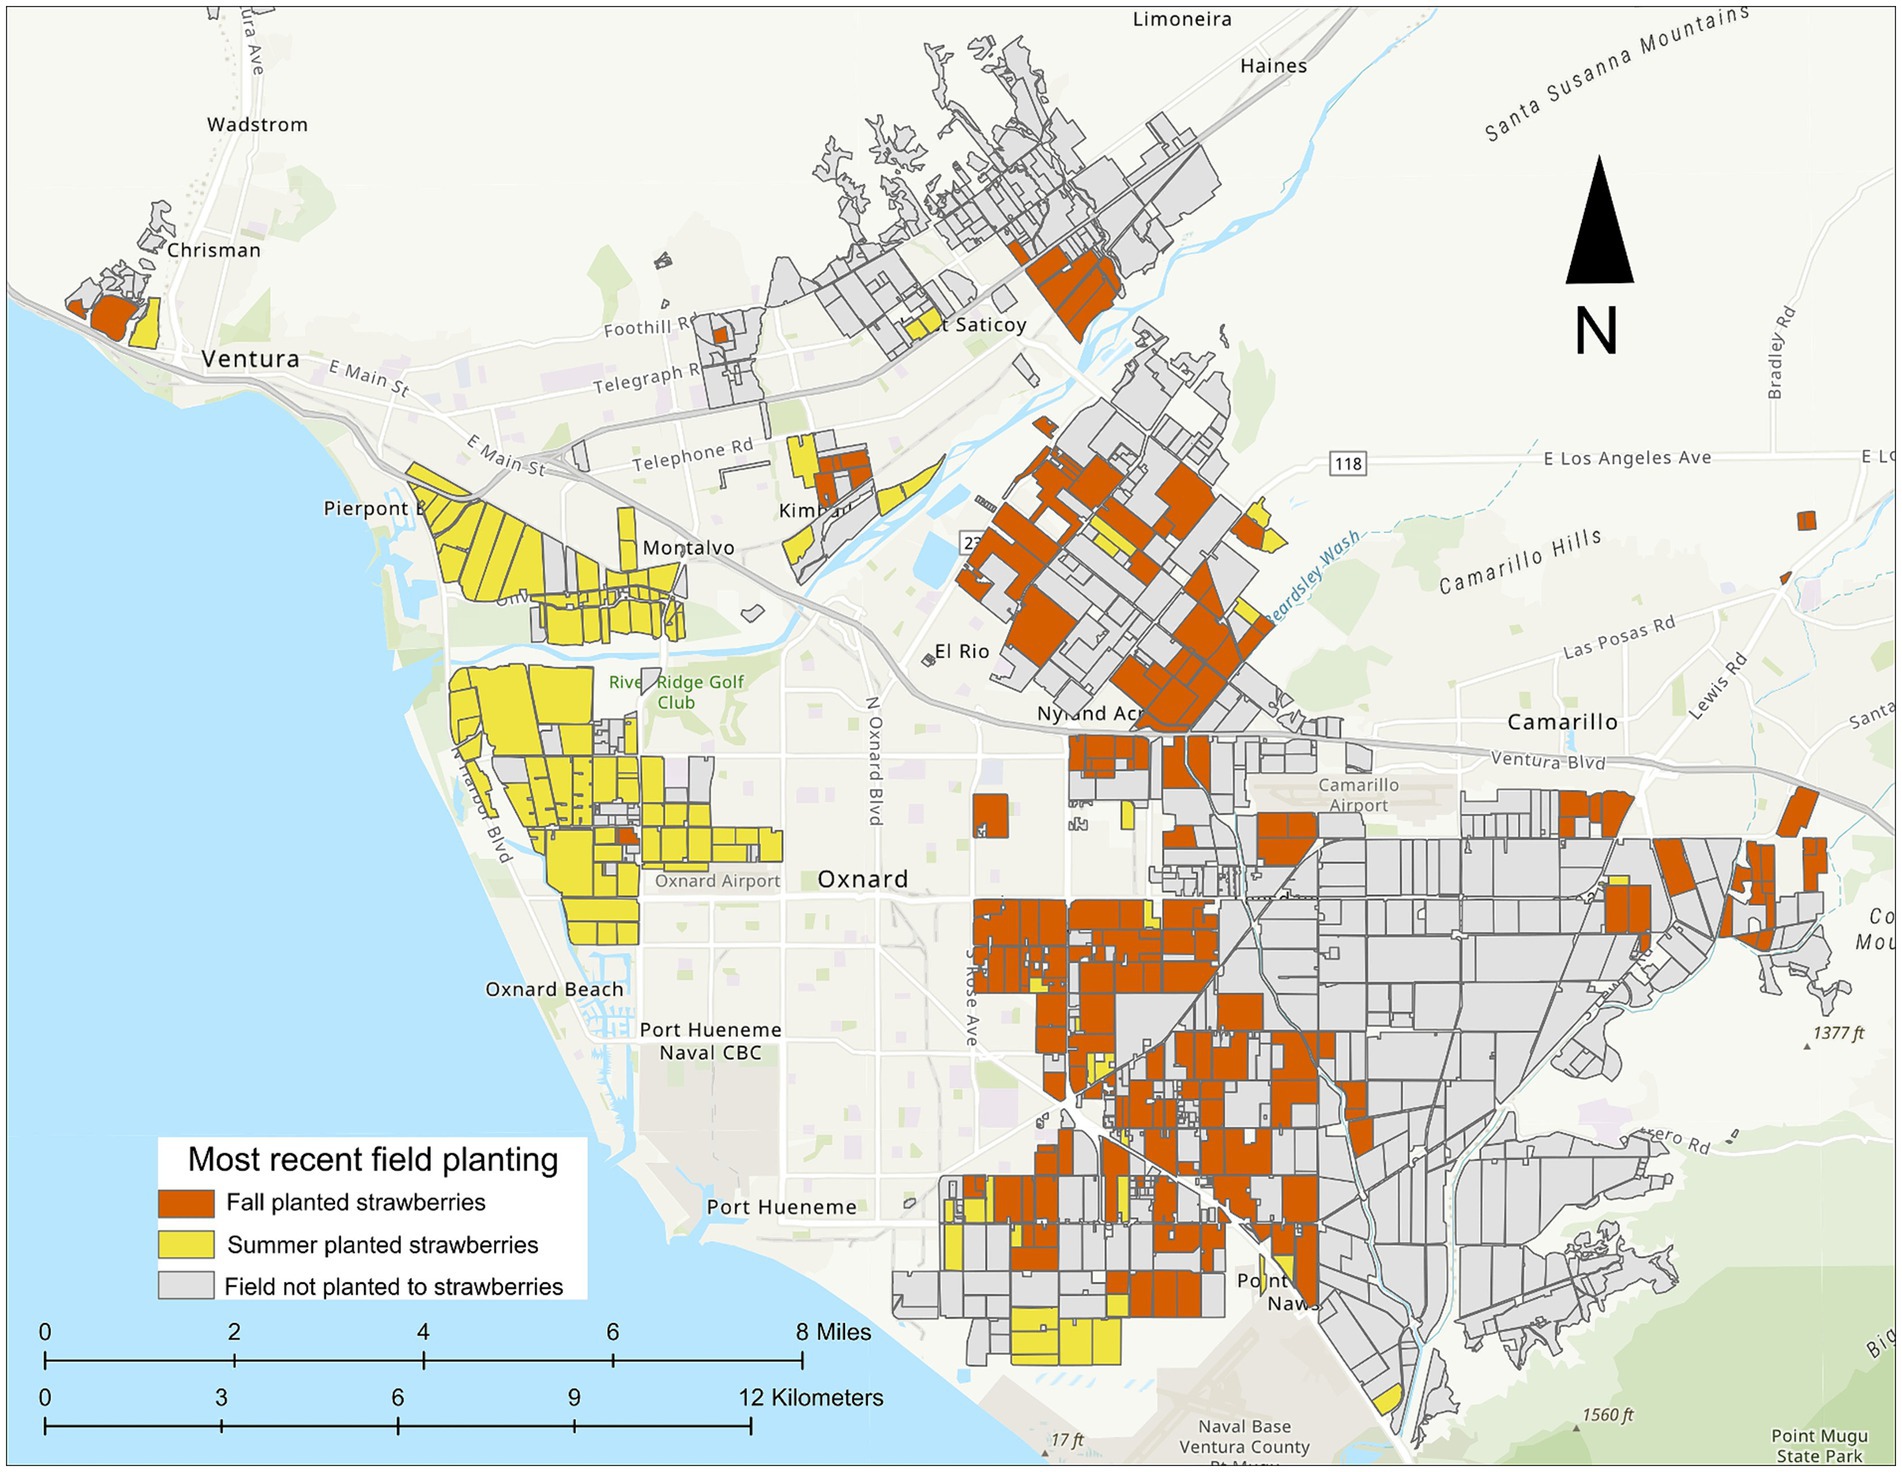
Figure 6. Ventura county strawberry fields between 2017 and 2022. Fields were compiled across years by: (1) starting with the map of 2022 strawberry fields, (2) adding strawberry fields from 2021 that were not present in 2022, and (3) repeating this process for all years sequentially, from most recent to oldest, until fields in all years were represented. Fields that were most recently fall-planted are colored orange, fields that were most recently summer-planted are colored yellow. Fields considered suitable for strawberry production based on criterion 1 but not planted to strawberries between 2017 and 2022 are filled gray. Most fields in the Ventura region are not rotated.
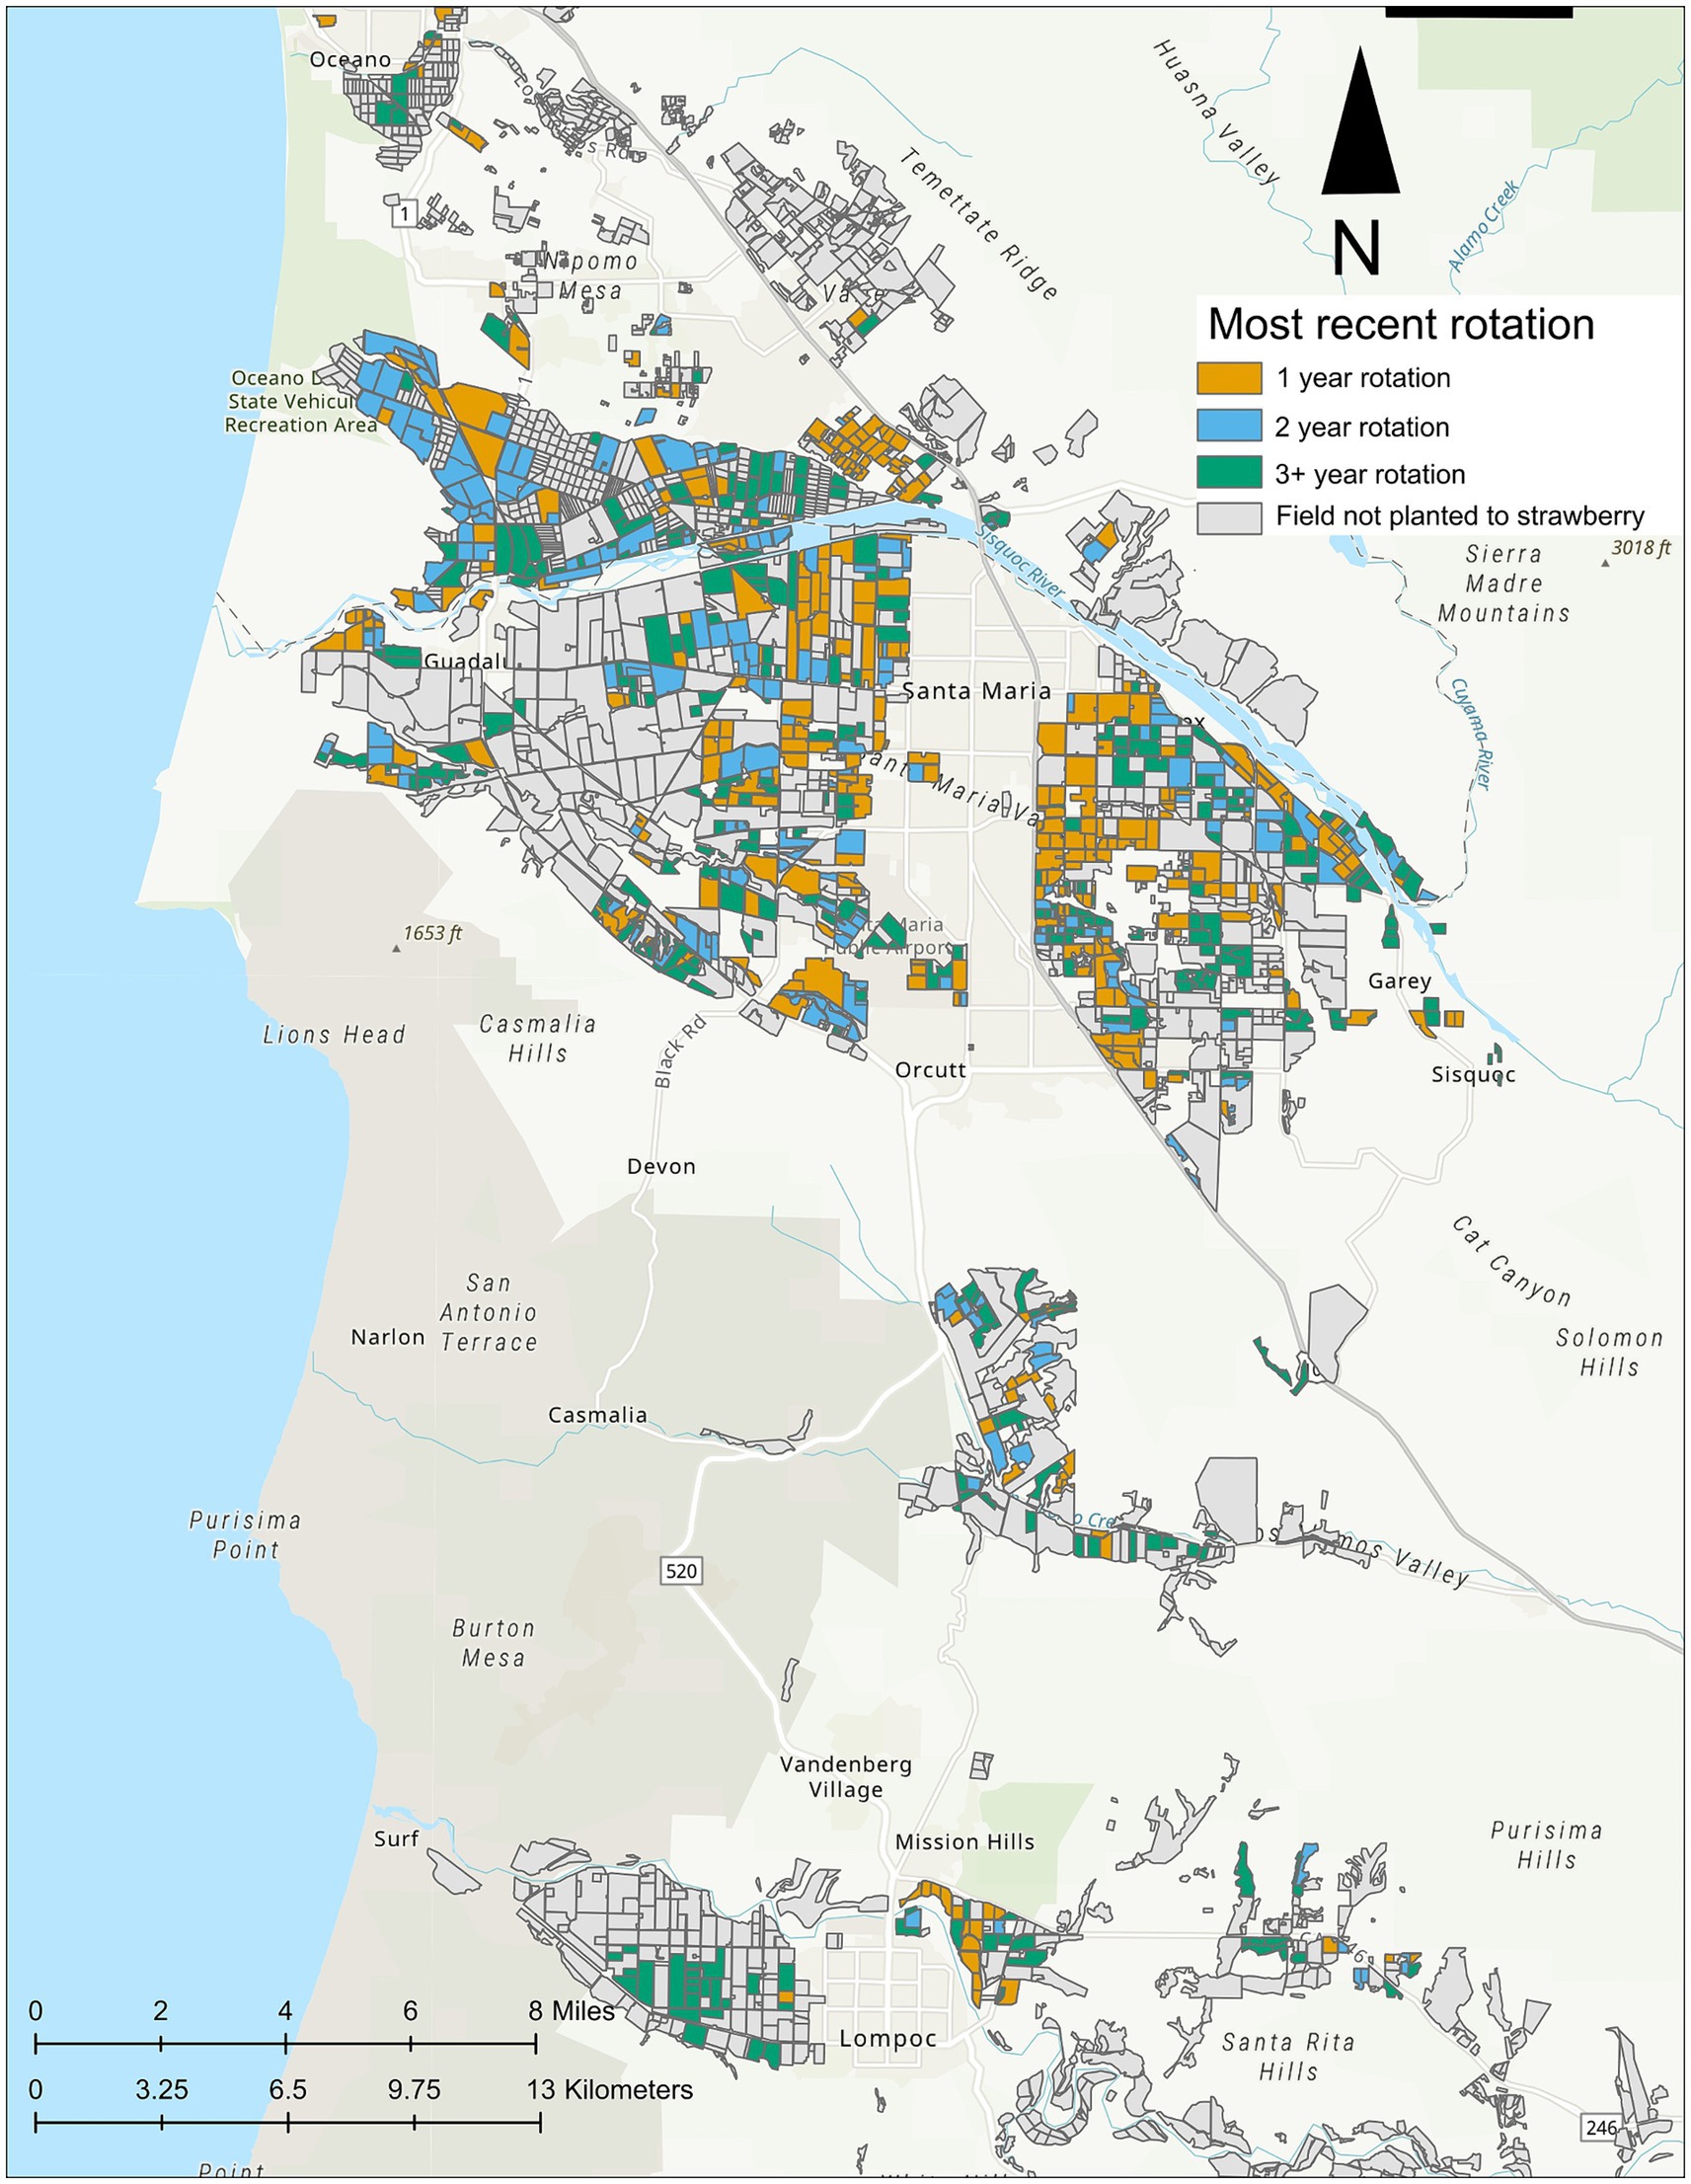
Figure 7. Santa Maria strawberry fields between 2017 and 2022. All summer- and fall-planted fields were compiled across years by: (1) starting with the map of 2022 strawberry fields, (2) adding strawberry fields from 2021 that were not present in 2022, and (3) repeating this process for all years sequentially, from most recent to oldest, until fields in all years were represented. The most recent crop rotation duration is color-coded and indicated by the legend. Fields considered suitable for strawberry production based on scenario 1 but have not had strawberry production between 2017 and 2022 are outlined and filled with gray.
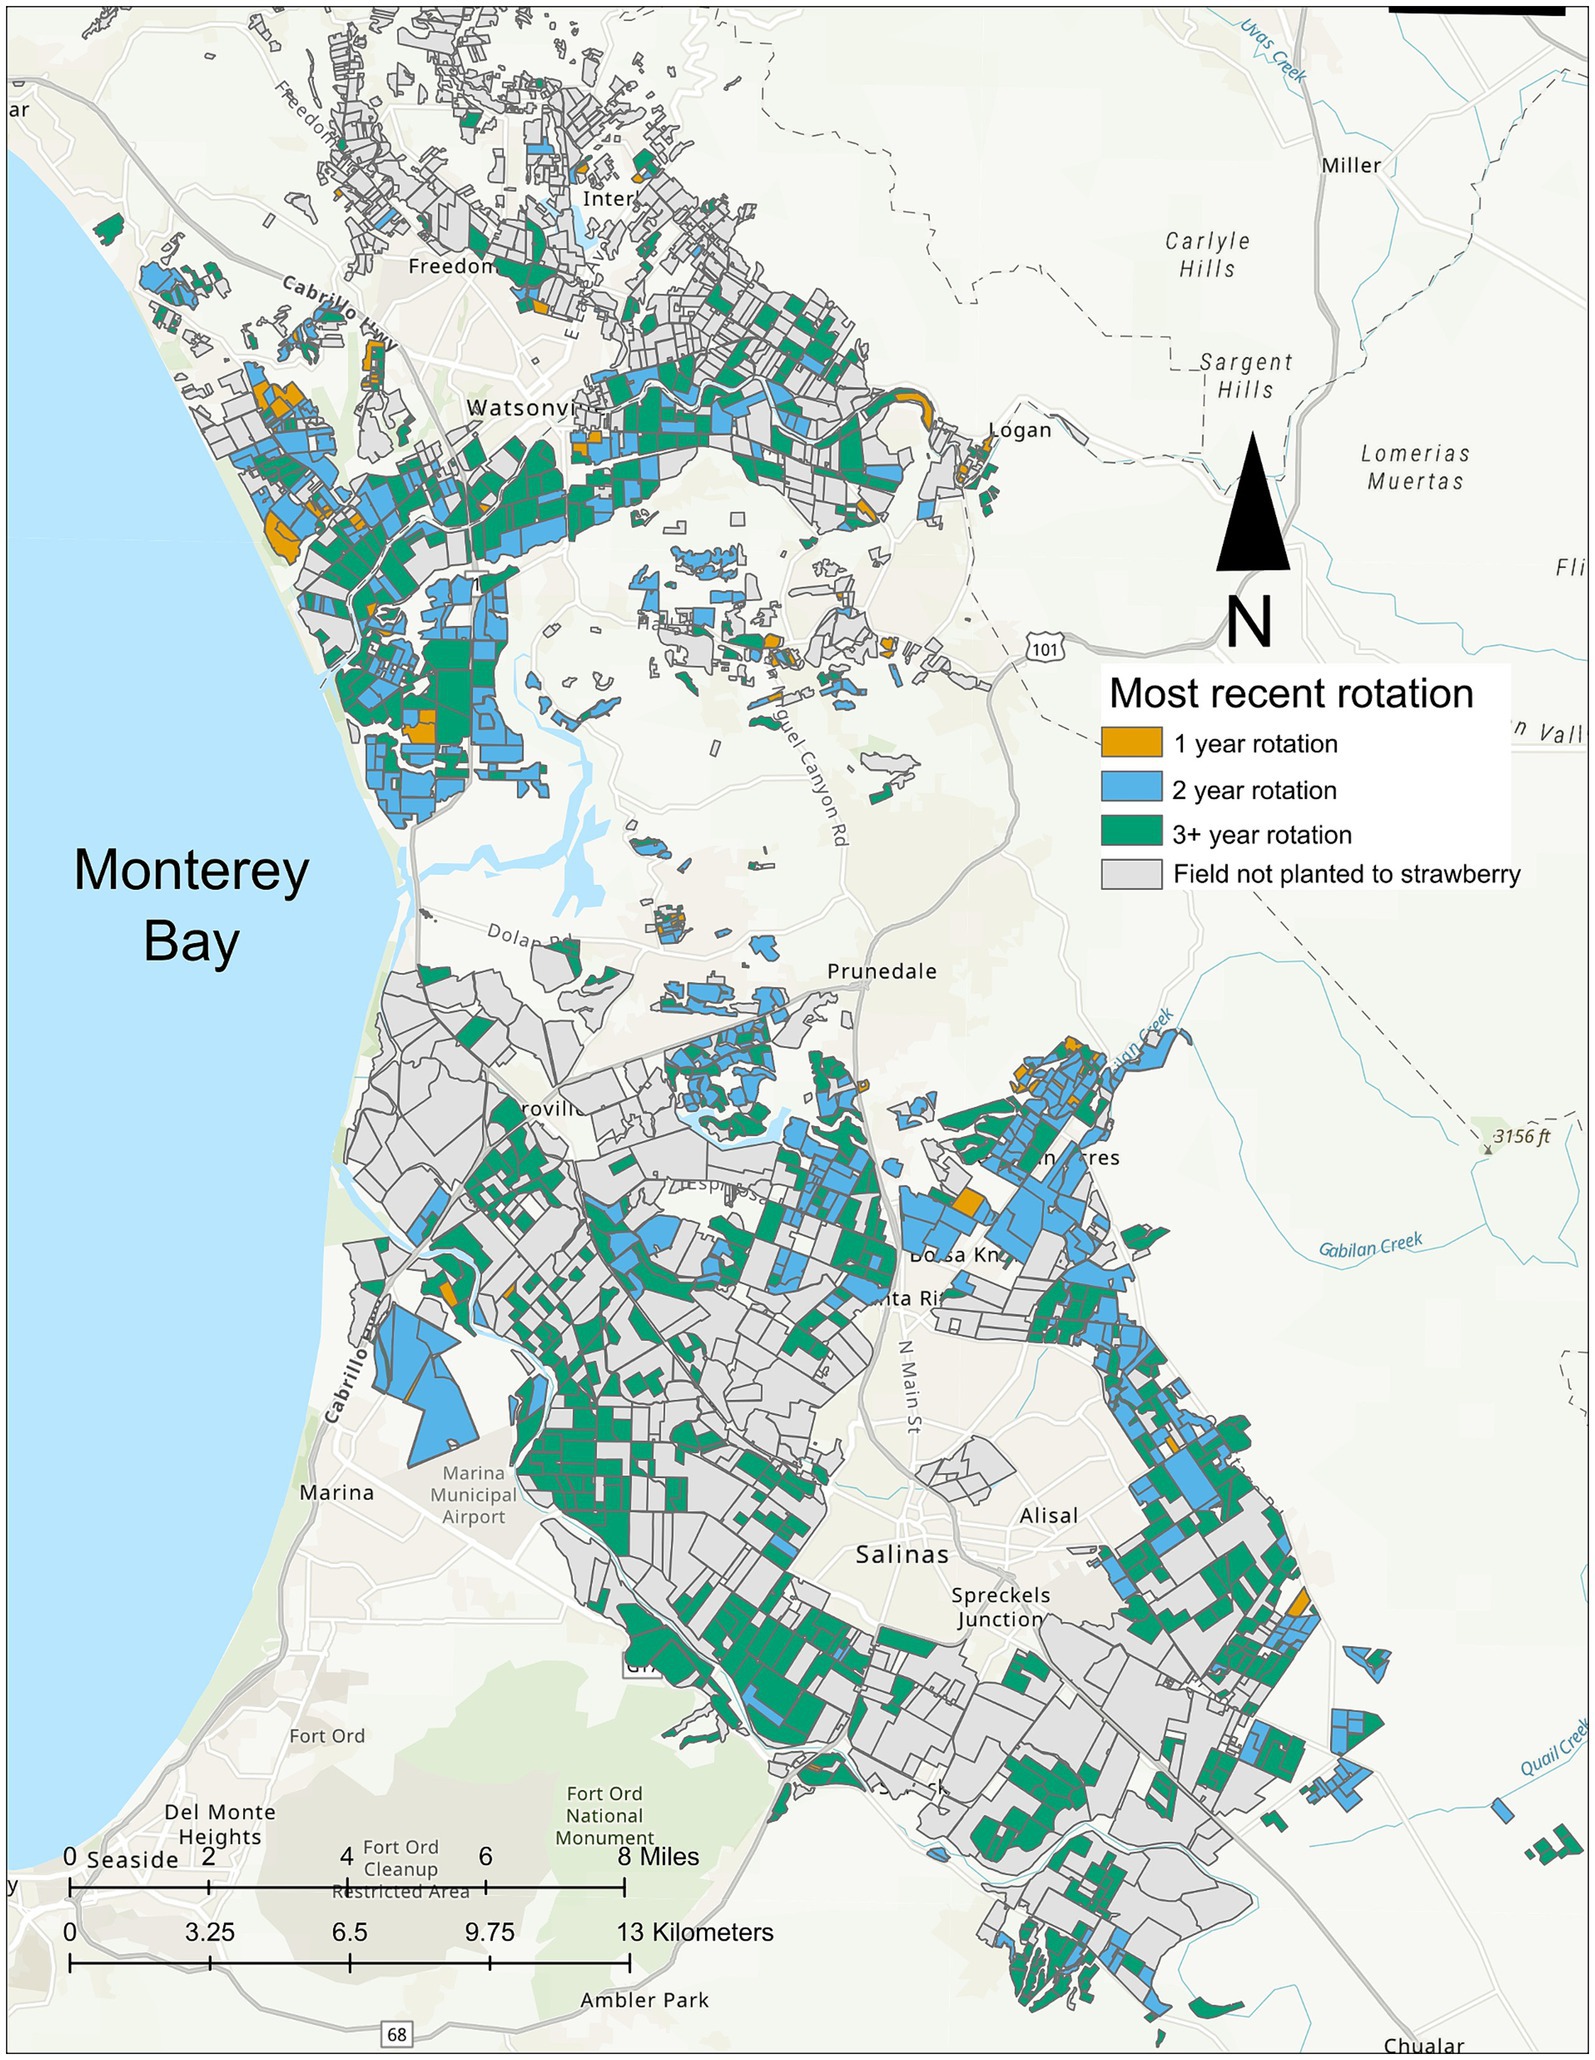
Figure 8. Monterey Bay area strawberry fields between 2017 and 2022. Fields were compiled across years by: (1) starting with the map of 2022 strawberry fields, (2) adding strawberry fields from 2021 that were not present in 2022, and (3) repeating this process for all years sequentially, from most recent to oldest, until fields in all years were represented. All fields were fall-planted. The most recent crop rotation duration is color-coded and indicated by the legend. Fields considered suitable for strawberry production based on criterion 1 but not planted to strawberries since 2017 are gray.
Discussion
Strawberries are an exceptional crop with respect to the specificity of climatic conditions required for high yields, high quality, and year-round production (Pathak et al., 2016). These exacting requirements have led to extreme geographic consolidation and motivated the development of techniques, including soil fumigation, designed to maximize the utility of scarce land (Wilhelm and Sagen, 1974). This work quantifies for the first time the specificity of geographic requirements for commercial strawberry production in California and the extent to which rotation patterns and land availability differ between the three main production regions.
Our results demonstrate that crop rotation is a common practice among strawberry growers in the Monterey Bay and Santa Maria production regions. On average, ~95% and ~50% of fields in the Monterey Bay and Santa Maria regions, respectively, were rotated between strawberries and other crops during each year of our study. Rotations were used least frequently in the Ventura region, where less than 25% of fields were rotated annually. These data can help guide future research on crop rotation in strawberry production by identifying areas where it is ubiquitous (Monterey Bay), somewhat common (Santa Maria), and areas where it is uncommon (Ventura). These regions may have different barriers to adopting this practice.
Geographic and edaphic considerations were associated with the duration of crop rotations in the Monterey Bay and Ventura regions. In these regions, reduced rotation lengths were associated with fields that had coarser soil textures (higher sand percentages) and were closer to the ocean. While there was not a significant trend in Santa Maria between rotation length and distance from the ocean, there was a small association between increased percent sand and reduced rotation length. Grower preference for these field characteristics, and potentially higher land values, appears to be motivating shorter rotations on desirable pieces of land.
There was also spatial separation between fall- and summer-planted fields in the Ventura region, with summer-planted fields usually occurring much closer to the ocean. This trend was likely driven by a desire to establish summer-planted fields in the slightly cooler areas near the ocean. This can be beneficial, as the plants are establishing and fruiting during a warmer time of year, and increased temperatures can create transpiration stress and reduce fruit quality (Wang and Camp, 2000; Ledesma and Sugiyama, 2005; Balasooriya et al., 2020; Menzel, 2021). By contrast, the further inland, fall-planted fields would benefit from higher winter temperatures that promote early establishment and lead to earlier harvests. Others have noted this pattern anecdotally, and our results have quantified it for the first time.
Contrary to expectations, our results suggest that raw land availability is not limiting the duration of crop rotations, especially in the Santa Maria and Monterey Bay regions. In those regions, enough land was estimated to be available for all strawberry fields to be on 4-year rotations under scenarios one and two. The maximum potential hectares available for strawberry production that we calculated were hypothetical, because land leases are not uniformly available to all growers. Access to leases relies on personal relationships and the desires of landowners who may themselves be growing crops that compete for land in the same areas where strawberries are grown (Guthman and Jiménez-Soto, 2021). We suspect that the true land availability lies between the second and third scenarios, as other factors that were not possible to include in our study, such as water availability and quality, may further limit land suitability. Nevertheless, these results suggest that sufficient land is available for longer rotations to be practiced with greater frequency in the Monterey Bay and Santa Maria.
The greater land availability in the Monterey Bay and Santa Maria was associated with higher rates of both crop rotation and organic production in these regions. Certified organic growers are required to practice crop rotation (United States Department of Agriculture Agricultural Marketing Service, 2024). In 2022, 12.6 and 15.2% of hectares in the Monterey Bay and Santa Maria (respectively) were certified organic, and crop rotation was common in these regions. In contrast, only 6.3% of hectares were certified organic in Ventura, where crop rotation is less common (California Strawberry Commission, 2022). Greater land availability in the Monterey Bay and Santa Maria could facilitate crop rotation generally, which would in turn make it easier to comply with this organic certification requirement. If so, land availability would influence both the observed rates of crop rotation and organic production in these regions. Regardless, organic production is unlikely to be a major driver of the overall trends we observed, as only 11.2% of acres statewide were certified organic in 2022 (California Strawberry Commission, 2022).
These findings point to the importance of social and economic factors influencing the decision to adopt or lengthen crop rotations. The California Strawberry Commission keeps records of all strawberry growers in the regions we surveyed, and their estimate is that ~300 companies are growing strawberries and distributed between regions (Jason Sharrett, personal communication). Guthman and Jiménez-Soto (2021) found that access to, and relationships with, landowners or “master” leaseholders was a major barrier for smaller, less-resourced growers to find fields for strawberry production. Master leaseholders hold a long-term lease and have the option of sub-leasing to others. Disconnectivity in these social networks may represent a significant barrier for adopting or lengthening crop rotations. Solutions to this issue could include the creation of public or membership-driven marketplaces for connecting landlords to prospective lessees.
The cost of land leases is also likely to be an important factor reducing the rate of crop rotation across the state (Esquivel et al., 2021; Carlisle et al., 2022). Land rents vary based on the location, soil type, and perceived agricultural productivity. Unfortunately, published surveys of the cost of leases for strawberry or vegetable growers are not available, possibly due to the sensitivity of the data or the challenges with achieving representative response rates to surveys (Guthman and Jiménez-Soto, 2021). However, several strawberry growers have reported to the authors that they pay more per hectare for land leases than growers of other commodities, usually vegetables, who are competing for access to the same land (Hillary Thomas, personal communication). Landowners can charge strawberry growers higher rates with the assumption that strawberry growers can afford to pay more, given their higher potential return per hectare. This means that if a strawberry grower holds the master lease and wants to sublease to a vegetable grower, they often cannot recoup their total cost. We note this observation here as a topic for future research, given that it was frequently mentioned by growers during informal conversations about crop rotation.
Production practices are also likely to play a significant role in structuring crop rotation patterns. Although their quantification was outside the scope of this article, common knowledge of production systems suggests cultivar selection plays a major role. For example, the Monterey Bay region is almost entirely planted with day-neutral cultivars that are planted in October or November and then harvested in the following spring through September or October (California Strawberry Commission, 2022). This long harvest period means there is little time available to terminate the growing crop and prepare land for planting strawberries again in late October or November. Personal communication with strawberry growers indicated these logistical challenges associated with continuous strawberry production as an important variable motivating crop rotations in the Monterey Bay region. This could also play a role in the Santa Maria region, where day neutral cultivars are also grown, sometimes with a harvest period that could make back-to-back planting difficult.
Recovery of F. oxysporum f. sp. fragariae was less likely in fields with longer rotations, which provided some evidence for the benefits of rotation on disease control. However, rotations alternating between intensive strawberry and vegetable production may not provide the maximum potential benefits for communities as a whole (Bowles et al., 2020). For example, strawberry/lettuce rotations are common in Monterey County, but both production systems rely on high nitrogen fertilizer inputs that can leach into and contaminate groundwater (Harter et al., 2017) and, when synthetic fertilizers are used, in certain cases can deplete organic matter (Mahal et al., 2019). These rotations allow time for soilborne pathogens to naturally decline in abundance over time but are unlikely to provide the most effective and sustainable outcomes for disease control, nutrient management, and water quality protection (Weisenburger 1993; Gordon and Koike, 2015; Norris and Congreves, 2018; Henry et al., 2019; Zavatta et al., 2021).
Cover cropping would be a beneficial addition to crop rotation practices with intensive vegetable systems, as it can mitigate nitrate leaching into groundwater, recycle nutrients to reduce external fertilizer inputs, increase soil organic matter and augment microbial activity, with the latter two outcomes potentially leading to reduced disease severity (Bonanomi et al., 2010; Brennan, 2017; Vendig et al., 2023). Unfortunately, this practice is relatively rare; only 5–6% of land in the Monterey Bay area is estimated to be winter cover cropped (Brennan, 2017; Thompson et al., 2023). Future investigations of the potential for crop rotation to provide disease control and yield benefits in non-fumigated strawberry production should consider the addition of cover cropping in combination with crop rotation.
There were some intriguing patterns of pathogen incidence relating to the distance from the ocean. Notably, the incidence of M. phaseolina tended to be greater as distance from the ocean increased. This concurs with previous studies showing elevated soil and air temperatures increase the severity of disease caused by M. phaseolina in strawberries and other crops (Baggio et al., 2021b; Wang et al., 2024), and a similar pattern was observed in a disease survey of the Santa Maria region (Steele et al., 2023). The relatively higher incidence of F. oxysporum f. sp. fragariae in fields that are closer to the ocean could be explained by increased humidity promoting the growth of sporodochia, fungal masses that produce airborne spores of F. oxysporum f. sp. fragariae. Sporodochia were recently discovered to be frequently produced by F. oxysporum f. sp. fragariae in the Monterey Bay area (Henry et al., 2023), and research with similar pathogens shows sporodochia production increases under conditions of higher humidity (Scarlett et al., 2015). If so, then increased aerial dissemination could lead to more fields becoming infested with F. oxysporum f. sp. fragariae in proximity to the ocean.
Although outside the scope of the present study, climate change has the potential to drastically alter the availability of land that is suitable for strawberry production. Under a warming climate, it is conceivable that summer planting will no longer be feasible in Ventura, if temperatures are too high during plant establishment. If this is the case, production in Ventura could shift to fall-planted or be relocated to the Santa Maria or Monterey Bay regions – continuing a trend that is already underway (California Strawberry Commission, 2022). While higher temperatures may motivate planting closer to the ocean, drought-related groundwater quality degradation from seawater intrusion may limit the utility of fields in these areas. Salinity issues are already becoming increasingly common in strawberry production (Biscaro and Cahn, 2019). Extreme climate events, such as frequent atmospheric rivers and flooding in 2023, and overall higher temperatures have already caused strawberry yield losses in coastal California (Wang and Camp, 2000; Ledesma and Sugiyama, 2005; Balasooriya et al., 2020; National Oceanic and Atmospheric Administration National Centers for Environmental Information, 2024). Future exacerbation of these trends is likely to make some land unsuitable for strawberry production.
Conclusion
The high per-hectare yields of strawberry production in coastal California mean that relatively few hectares are needed to fulfill the current demand for this fruit. However, these hectares are consolidated in small, highly specific regions where land is relatively scarce. Our results show that crop rotation practices among strawberry growers are highly heterogeneous in California and linked to specific climatic, edaphic, logistical, and social constraints. Achieving disease suppression through rotation may require implementing more diverse rotational crops and cover cropping to increase the abundance and quality of soil organic matter. At present, more land is theoretically available for strawberries than currently cultivated by strawberry growers, indicating that crop rotations could be lengthened without reducing the area in strawberry production. However, this may not remain true as the climate changes due to anthropogenic emissions and once-suitable land becomes unable to sustain economically viable strawberry production.
Data availability statement
The raw data supporting the conclusions of this article will be made available by the authors, without undue reservation.
Author contributions
GR: Data curation, Formal analysis, Investigation, Methodology, Visualization, Writing – original draft, Writing – review & editing. PG: Formal analysis, Methodology, Supervision, Visualization, Writing – review & editing. JS: Data curation, Writing – review & editing. GOS: Formal analysis, Methodology, Visualization, Writing – review & editing. KP: Formal analysis, Methodology, Supervision, Visualization, Writing – review & editing. CD-E: Data curation, Methodology, Visualization, Writing – review & editing. JJ: Data curation, Investigation, Methodology, Writing – review & editing. MS: Data curation, Investigation, Methodology, Writing – review & editing. SH: Supervision, Writing – review & editing. GH: Supervision, Writing – review & editing. HW: Methodology, Formal analysis, Writing – review & editing. JD-A: Funding acquisition, Supervision, Writing – review & editing. PH: Conceptualization, Data curation, Funding acquisition, Methodology, Supervision, Writing – original draft.
Funding
The author(s) declare that financial support was received for the research, authorship, and/or publication of this article. We thank our funding sources for making possible this work: the USDA Agricultural Research Service, the California Strawberry Commission, and the USDA National Institute of Food and Agriculture Specialty Crops Research Initiative grant #2022–51181-38328.
Acknowledgments
We thank staff at the County Agriculture Commissioner’s offices for Santa Cruz, Monterey, San Luis Obispo, Santa Barbara, and Ventura County for providing ‘Cal Ag Permit’ data and GIS shapefiles for agricultural fields in their jurisdiction. We thank Kyle Stephens from the United States Department of Agriculture (USDA) Natural Resource Conservation Service for providing sand percentage raster files for our areas of interest.
Conflict of interest
The authors declare that the research was conducted in the absence of any commercial or financial relationships that could be construed as a potential conflict of interest.
Publisher’s note
All claims expressed in this article are solely those of the authors and do not necessarily represent those of their affiliated organizations, or those of the publisher, the editors and the reviewers. Any product that may be evaluated in this article, or claim that may be made by its manufacturer, is not guaranteed or endorsed by the publisher.
References
Ajwa, H. A., and Trout, T. (2004). Drip application of alternative fumigants to methyl bromide for strawberry production. HortScience 39, 1707–1715. doi: 10.21273/HORTSCI.39.7.1707
Amundson, R., Berhe, A. A., Hopmans, J. W., Olson, C., Sztein, A. E., and Sparks, D. L. (2015). Soil and human security in the 21st century. Science 348:71. doi: 10.1126/science.1261071
Atlas of Urban Expansion (2016) Los Angeles. Atlas of Urban Expansion. Available at: http://www.atlasofurbanexpansion.org/cities/view/Los_Angeles (Accessed April 26, 2023)
Baggio, J. S., Marin, M. V., and Peres, N. (2021a). Phytophthora crown rot of Florida strawberry: inoculum sources and thermotherapy of transplants for disease management. Plant Dis. 105, 3496–3502. doi: 10.1094/PDIS-11-20-2476-RE
Baggio, J. S., Ruschel, R. G., Noling, J. W., and Peres, N. A. (2021b). Physical, cultural, and chemical alternatives for integrated management of charcoal rot of strawberry. Plant Dis. 105, 295–304. doi: 10.1094/PDIS-04-20-0917-RE
Balasooriya, B. L. H. N., Dassanayake, K., and Ajlouni, S. (2020). High temperature effects on strawberry fruit quality and antioxidant contents. Acta Horticulturae: Proceedings of the IV International Conference on Postharvest and Quality Management of Horticultural Products of Interest for Tropical Regions.
Biscaro, A., and Cahn, M. (2019). Assessing the impact of irrigation water quality on strawberry cultivars. Fresno, CA, USA: Progressive Crop Consultant, 18–24.
Bonanomi, G., Antignani, V., Capodilupo, M., and Scala, F. (2010). Identifying the characteristics of organic soil amendments that suppress soilborne plant diseases. Soil Biol. Biochem. 42, 136–144. doi: 10.1016/j.soilbio.2009.10.012
Bowles, T. M., Mooshammer, M., Socolar, Y., Calderón, F., Cavigelli, M. A., Culman, S. W., et al. (2020). Long-term evidence shows that crop-rotation diversification increases agricultural resilience to adverse growing conditions in North America. One Earth 2, 284–293. doi: 10.1016/j.oneear.2020.02.007
Brennan, E. B. (2017). Can we grow organic or conventional vegetables sustainably without cover crops? HortTechnology 27, 151–161. doi: 10.21273/HORTTECH03358-16
Burkhardt, A., Henry, P. M., Koike, S. T., Gordon, T. R., and Martin, F. (2019). Detection of Fusarium oxysporum f. sp. fragariae from infected strawberry plants. Plant Disease 103, 1006–1013.
Burkhardt, A., Ramon, M. L., Smith, B., Koike, S. T., and Martin, F. (2018). Development of molecular markers to detect Macrophomina phaseolina from strawberry plants and soil. Phytopathology 108, 1386–1394. doi: 10.1094/PHYTO-03-18-0071-R
California Department of Pesticide Regulation (2023) Accelerating sustainable pest management: a roadmap for California. Available at: https://www.cdpr.ca.gov/docs/sustainable_pest_management_roadmap/ (accessed October 20, 2023)
California Department of Water Resources (2023) California irrigation management information system. Available at: https://cimis.water.ca.gov (accessed April 26, 2023)
California Strawberry Commission (2022) Acreage survey. California Strawberry Commission. http://www.calstrawberry.com (accessed September 7, 2022)
Carlisle, L., Esquivel, K., Baur, P., Ichikawa, N. F., Olimpi, E. M., Ory, J., et al. (2022). Organic farmers face persistent barriers to adopting diversification practices in California’s central coast. Agroecol. Sustain. Food Syst. 46, 1145–1172. doi: 10.1080/21683565.2022.2104420
Davis, A. S., Hill, J. D., Chase, C. A., Johanns, A. M., and Liebman, M. (2012). Increasing cropping system diversity balances productivity, profitability and environmental health. PLoS ONE 7:e47149. doi: 10.1371/journal.pone.0047149
Duniway, J. M. (2002). Status of chemical alternatives to methyl bromide for pre-plant fumigation of soil. Phytopathology 92, 1337–1343. doi: 10.1094/PHYTO.2002.92.12.1337
Esquivel, K. E., Carlisle, L., Ke, A., Olimpi, E. M., Baur, P., Ory, J., et al. (2021). The “sweet spot” in the middle: why do mid-scale farms adopt diversification practices at higher rates? Front. Sustain. Food Syst. 5:734088. doi: 10.3389/fsufs.2021.734088
Feldmann, M. J., Pincot, D. D. A., Cole, G. S., and Knapp, S. (2024). Genetic gains underpinning a strawberry green revolution. Nat. Commun. 15:2468. doi: 10.1038/s41467-024-46421-6
Fox, J., and Weisberg, S. (2019). An {R} companion to applied regression. Third Edn. Thousand Oaks, CA: Sage.
Gordon, T. R., and Koike, S. T. (2015). Management of Fusarium wilt of lettuce. Crop Prot. 73, 45–49. doi: 10.1016/j.cropro.2015.01.011
Guthman, J., and Jiménez-Soto, E. (2021). Socioeconomic challenges of California strawberry production and disease resistant cultivars. Front. Sustain. Food Syst. 5:764743. doi: 10.3389/fsufs.2021.764743
Harter, T., Dzurella, K., Kourakos, G., Bell, A., King, A., and Hollander, A. (2017). Nitrogen fertilizer loading to groundwater in the Central Valley. Final report to the fertilizer research and education program, 1–36. Available at: https://www.cdfa.ca.gov/is/ffldrs/frep/pdfs/CompletedProjects/15-0454_partialFR-Harter.pdf (Accessed August, 2023).
Henry, P. M., Dilla-Ermita, C. J., Goldman, P., Jaime, J., and Ramos, G. (2023). Sporodochia formed by Fusarium oxysporum f. sp. fragariae produce airborne conidia and are ubiquitous on diseased strawberry plants in California. Phytopathology 113, 1399–1404. doi: 10.1094/PHYTO-10-22-0375-SC
Henry, P. M., Kirkpatrick, S. C., Islas, C. M., Pastrana, A. M., Yoshisato, J. A., Koike, S. T., et al. (2017). The population of Fusarium oxysporum f. sp. fragariae, cause of Fusarium wilt of strawberry, in California. Plant Dis. 101, 550–556. doi: 10.1094/PDIS-07-16-1058-RE
Henry, P. M., Pastrana, A. M., Leveau, J. H. J., and Gordon, T. R. (2019). Persistence of Fusarium oxysporum f. sp. fragariae in soil through asymptomatic colonization of rotation crops. Phytopathology 109, 770–779. doi: 10.1094/PHYTO-11-18-0418-R
Holmes, G. J. (2024). The California strawberry industry: Current trends and future prospects. Int. J. Fruit Sci. 24, 115–129. doi: 10.1080/15538362.2024.2342900
Hunt, N. D., Hill, J. D., and Liebman, M. (2017). Reducing freshwater toxicity while maintaining weed control, profits, and productivity: effects of increased crop rotation diversity and reduced herbicide usage. Environ. Sci. Technol. 51, 1707–1717. doi: 10.1021/acs.est.6b04086
Kim, J. H. (2019). Multicollinearity and misleading statistical results. Korean J. Anesthesiol. 72, 558–569. doi: 10.4097/kja.19087
Koike, S. T. (2008). Crown rot of strawberry caused by Macrophomina phaseolina in California. Plant Dis. 92:1253. doi: 10.1094/PDIS-92-8-1253B
Koike, S. T., Kirkpatrick, S. C., and Gordon, T. R. (2009). Fusarium wilt of strawberry caused by Fusarium oxysporum in California. Plant Dis. 93:1077. doi: 10.1094/PDIS-93-10-1077A
Ledesma, N., and Sugiyama, N. (2005). Pollen quality and performance in strawberry plants exposed to high-temperature stress. J. Am. Soc. Hortic. Sci. 130, 341–347. doi: 10.21273/JASHS.130.3.341
Mahal, N. K., Osterholz, W. R., Miguez, F. E., Poffenbarger, H. J., Sawyer, J. E., Olk, D. C., et al. (2019). Nitrogen fertilizer suppresses mineralization of soil organic matter in maize agroecosystems. Front. Ecol. Evol. 7:59. doi: 10.3389/fevo.2019.00059
Menzel, C. (2021). Higher temperatures decrease fruit size in strawberry growing in the subtropics. Horticulturae 7, 1–13. doi: 10.3390/horticulturae7020034
National Oceanic and Atmospheric Administration National Centers for Environmental Information . (2024). Climate at a glance: county time series. Available at: https://www.ncei.noaa.gov/access/monitoring/climate-at-a-glance/county/time-series (Accessed August, 2024).
Norris, C. E., and Congreves, K. A. (2018). Alternative management practices improve soil health indices in intensive vegetable cropping systems: a review. Front. Environ. Sci. 6:50. doi: 10.3389/fenvs.2018.00050
Pathak, T. B., Dara, S. K., and Biscaro, A. (2016). Evaluating correlations and development of meteorology based yield forecasting model for strawberry. Adv. Meteorol. 2016, 1–7. doi: 10.1155/2016/9525204
Pathak, T. B., Maskey, M. L., Dahlberg, J. A., Kearns, F., Bali, K. M., and Zaccaria, D. (2018). Climate change trends and impacts on California agriculture: a detailed review. Agronomy 8, 1–27. doi: 10.3390/agronomy8030025
R Core Team (2013). R: A language and environment for statistical computing. Vienna, Austria: R Foundation for Statistical Computing.
Scarlett, K., Tesoriero, L., Daniel, R., Maffi, D., Faoro, F., and Guest, D. I. (2015). Airborne inoculum of Fusarium oxysporum f. sp. cucumerinum. Eur. J. Plant Pathol. 141, 779–787. doi: 10.1007/s10658-014-0578-3
Sindelar, A. J., Schmer, M. R., Jin, V. L., Wienhold, B. J., and Varvel, G. E. (2016). Crop rotation affects corn, grain Sorghum, and soybean yields and nitrogen recovery. Agron. J. 108, 1592–1602. doi: 10.2134/agronj2016.01.0005
Steele, M. E., Hewavitharana, S., Henry, P. M., Goldman, P., and Holmes, G. (2022). Survey of late-season soilborne pathogens infecting strawberry in Watsonville-Salinas. California: Plant Health Progress.
Steele, M. E., Mendez, M., Hewavitharana, S. S., and Holmes, G. J. (2023). Survey of soilborne pathogens infecting strawberry in Santa Maria, California. Int. J. Fruit Sci. 23, 256–266. doi: 10.1080/15538362.2023.2292130
Thompson, J. B., Symonds, J., Carlisle, L., Iles, A., Karp, D. S., Ory, J., et al. (2023). Remote sensing of hedgerows, windbreaks, and winter cover crops in California's central coast reveals low adoption but hotspots of use. Front. Sust. Food Syst. 7:1052029. doi: 10.3389/fsufs.2023.1052029
United States Department of Agriculture Agricultural Marketing Service (2024) Guide for organic producers. Available at: https://www.ams.usda.gov/sites/default/files/media/CropProducersGuide.pdf (Accessed April, 2024)
United States Department of Agriculture Economic Research Service [USDA-ERS] (2019) U.S. per capita loss-adjusted fruit availability, 2019. Available at: https://www.ers.usda.gov/data-products/chart-gallery/gallery/chart-detail/?chartId=58322 (accessed September 7, 2022)
United States Department of Agriculture Economic Research Service [USDA-ERS] (2021) Fresh strawberry production from the top two producing states, 2000 and 2019. Available at: https://www.ers.usda.gov/data-products/chart-gallery/gallery/chart-detail/?chartId=101156 (accessed September 7, 2022)
United States Department of Agriculture National Agriculture Statistics Service [USDA-NASS] (2021) Quick stats. Available at: https://quickstats.nass.usda.gov (accessed April 26, 2023)
United States Department of Agriculture Natural Resources Conservation Service (2022) Gridded soil survey geographic (gSSURGO) database. Available at: https://www.nrcs.usda.gov/resources/data-and-reports/gridded-soil-survey-geographic-gssurgo-database
United States Geological Survey (2013) Tap owner reports preliminary water quality results. Available at: https://www.waterboards.ca.gov/centralcoast/water_issues/programs/gap/ (Accessed August 15, 2023).
University of California Cooperative Extension and Cachuma Resource Conservation District (2015). Strawberry production manual: for growers on the central coast. Second Edn. Davis, CA: University of California Agriculture and Natural Resources.
Vendig, I., Guzman, A., De La Cerda, G., Esquivel, K., Mayer, A. C., Ponisio, L., et al. (2023). Quantifying direct yield benefits of soil carbon increases from cover cropping. Nature Sustain. 6:Article 9. doi: 10.1038/s41893-023-01131-7
Voth, V., and Bringhurst, R. S. (1990). Culture and physiological manipulation of California strawberries. HortScience 25, 889–892. doi: 10.21273/HORTSCI.25.8.889
Wang, S. Y., and Camp, M. J. (2000). Temperatures after bloom affect plant growth and fruit quality of strawberry. Sci. Hortic. 85, 183–199. doi: 10.1016/S0304-4238(99)00143-0
Wang, Y.-C., Mansouripour, S. M., Hewavitharana, S. S., and Holmes, G. J. (2024). Effect of cultivar and temperature on disease development of Macrophomina root rot in strawberry. Plant Health Prog. 25, 255–261. doi: 10.1094/PHP-11-23-0100-RS
Ward, M. H., Jones, R. R., Brender, J. D., De Kok, T. M., Weyer, P. J., Nolan, B. T., et al. (2018). Drinking water nitrate and human health: an updated review. Int. J. Environ. Res. Public Health 15:1557. doi: 10.3390/ijerph15071557
Weisenburger, D. D. (1993). Human health effects of agrichemical use. Hum. Pathol. 24, 571–576. doi: 10.1016/0046-8177(93)90234-8
Wilhelm, S., and Paulus, A. O. (1980). How soil fumigation benefits the California strawberry industry. Plant Dis. 64, 264–270.
Wilhelm, S., and Sagen, J. E. (1974). A history of the strawberry: from ancient gardens to modern markets. Berkeley, CA: University of California.
Keywords: Macrophomina phaseolina, Fusarium oxysporum f. sp. fragariae, soilborne pathogen, climate change, land use, disease survey, remote sensing, sentinel 2
Citation: Ramos G, Goldman P, Sharrett J, Sacher GO, Pennerman KK, Dilla-Ermita CJ, Jaime JH, Steele ME, Hewavitharana SS, Holmes GJ, Waterhouse H, Dundore-Arias JP and Henry P (2024) Geospatial analysis of California strawberry fields reveals regional differences in crop rotation patterns and the potential for lengthened rotations at current levels of production. Front. Sustain. Food Syst. 8:1341782. doi: 10.3389/fsufs.2024.1341782
Edited by:
David Gonthier, University of Kentucky, United StatesReviewed by:
Bonnie McGill, American Farmland Trust, United StatesDavid Butler, The University of Tennessee, Knoxville, United States
Copyright © 2024 Ramos, Goldman, Sharrett, Sacher, Pennerman, Dilla-Ermita, Jaime, Steele, Hewavitharana, Holmes, Waterhouse, Dundore-Arias and Henry. This is an open-access article distributed under the terms of the Creative Commons Attribution License (CC BY). The use, distribution or reproduction in other forums is permitted, provided the original author(s) and the copyright owner(s) are credited and that the original publication in this journal is cited, in accordance with accepted academic practice. No use, distribution or reproduction is permitted which does not comply with these terms.
*Correspondence: Peter Henry, cGV0ZXIuaGVucnlAdXNkYS5nb3Y=
†ORCID: Christine Jade Dilla-Ermita, http://orcid.org/0000-0003-2115-4538
Shashika S. Hewavitharana, http://orcid.org/0000-0002-4617-7448
Gerald J. Holmes, http://orcid.org/0000-0002-2817-9239
José Pablo Dundore-Arias, http://orcid.org/0000-0002-4944-0125
Peter Henry, http://orcid.org/0000-0002-7319-7516