 David Michael Ochieng Ayieko
 David Jakinda Otieno1
95% of researchers rate our articles as excellent or good
Learn more about the work of our research integrity team to safeguard the quality of each article we publish.
Find out more
ORIGINAL RESEARCH article
Front. Sustain. Food Syst. , 06 February 2024
Sec. Agricultural and Food Economics
Volume 8 - 2024 | https://doi.org/10.3389/fsufs.2024.1334707
Hidden hunger, a condition that arises from eating a low legume-cereal mix, hinders the attainment of food security. It affects 25% of the world’s population and 20% of the African population. To address this problem, various crop improvement programs aimed at increasing the introduction of biofortified beans in households’ diets have been initiated. However, Kenya still has a deficit in protein intake despite the availability of biofortified beans. In western Kenya, specifically Busia and Migori counties, where there is high consumption of staple cereals, rice beans (Vigna umbellata) have been piloted on farmers’ fields, but the extent of uptake at the consumption level remains undocumented. Therefore, this study analyzed consumer preferences for improved rice beans through a discrete choice experiment (DCE) approach. The results showed that consumers were willing to pay 166.59 Kenya Shillings (Ksh) for high protein content, Ksh 225.69 for red color, Ksh 113.46 for short cooking time, Ksh 202.30 for good legume-cereal mix and Ksh 139.29 for sweet taste. These findings have important implications for policy interventions on crop breeding, food processing, healthy food and nutrition guidelines.
Global food and nutrition insecurity remains a critical challenge to sustainable development as the number of people with limited access to food is expected to rise by 8% from 3.1 billion in 2021 to nearly 3.35 billion by 2030 (Food and Agriculture Organization (FAO), 2021). In particular, about 2 billion people in the world, and 21% of the African population are affected by hidden hunger, due to the overconsumption of staple cereals and a diet with limited micronutrients from legumes (FAO, IFAD, UNICEF, WFP, WHO, 2020; Lowe, 2021). Hence, several crop improvement strategies, including biofortification, have been initiated to enhance the composition of foods by mixing and/or introducing nutritious crop attributes, to positively nudge consumer preferences and demand for such attributes (Kassie et al., 2017; Murekezi et al., 2017; Muange and Oparinde, 2018; Ridier et al., 2021). Specifically, legume crop improvements have been attempted in Madagascar (Bosch et al., 2017), Ghana (Martey et al., 2022), Rwanda (Oparinde et al., 2016) and Uganda (Aseete et al., 2018). However, most of the consumers still prefer old legume varieties, and therefore, low demand for new legume varieties persists in developing countries (Khanal et al., 2017; Talsma et al., 2017).
It is paradoxical that in Kenya, where there are about 3.6 million legume farmers, the global hunger index (GHI) of 23.5 is higher than the world average of 19 according to von Grebmer et al. (2022) and about 4.4 million people are food insecure (Shibia et al., 2023).
Moreover, the per capita consumption of protein has declined to a low level; 61 g/day compared to the recommended intake of 69 g/day, which leads to protein energy malnutrition (PEM) (FAO, IFAD, UNICEF, WFP, WHO, 2020). In recent decades, plant breeding institutions, including the Kenya Agricultural and Livestock Research Organization (KALRO), attempted to change the preference and demand for beans through crop improvement (Talsma et al., 2017). However, studies show that only 40% of the households in western Kenya bought improved biofortified bean varieties, yet they are considered to have more micronutrients than the older varieties (Mabeya et al., 2020). Therefore, KALRO piloted research in western Kenya with rice beans.1 Similar initiatives had previously been done in Asia; for example the Food Security through Rice Beans Research in India and Nepal (FOSRIN) (Andersen, 2007; Khanal et al., 2007).
The recent focus on rice beans is due to their rich nutritional value, which is equivalent to or exceeds other legumes; they contain between 22.24 and 26% proteins, versus 18–24% in common beans and 38% proteins in soybeans (Kaur et al., 2013; Anino et al., 2019). Also, rice beans have a lower glycemic index, which is a measure of how fast food raises blood glucose, compared to soybeans, green grams, common beans, and cowpeas (Bhagyawant et al., 2019). Moreover, rice beans have only 0.85–2.39% of sugars like raffinose, which reduces flatulence. It has a digestibility level of 64.12–88.50%, which is higher than in green grams and cowpeas, while common beans are 76.10–83.50% digestible (Kaur et al., 2013; Pattanayak et al., 2019; Katoch et al., 2023). Only soybeans have superior digestibility (76–96%) than rice beans. Finally, rice beans contain higher levels of ascorbic acid or Vitamin C (23.46%) and niacin or Vitamin B3 (3.87%), which help the cell functions and lower cholesterol, respectively compared to pigeon peas, cowpeas, and winged peas (Katoch et al., 2023). Cognizant of the role of rice beans in curbing hidden hunger (see Bepary et al., 2016), the current study that is based on data from the KALRO pilot intervention addresses the gaps in the FOSRIN intervention. The study considered macronutrient levels, specifically protein amounts, instead of micronutrients in recent legume improvement programs and legume-cereal mixes instead of treating rice beans as an isolated food.
While the literature is replete with studies on various aspects of legume attribute preferences, there are some critical knowledge gaps in design and analytical approaches. For example, Aseete et al. (2018) analyzed the preference and demand for cooking periods in industrial precooked beans, while Bepary and Wadikar (2018) analyzed cooking periods for soaked and pressure-cooked rice beans. However, these studies demonstrate insufficient evidence on the comparison of consumer preference and demand for traditional cooking periods. Similarly, Oparinde et al. (2016) analyzed consumer preferences for red iron-fortified beans and white iron-fortified beans through the Becker-DeGroot Marschak (BDM) approach. However, their findings were inconclusive due to respondents’ limited knowledge of the specific nutrients and defaulting in bid payment among consumers. Although a recent study by Petrontino et al. (2023) attempted to address the above shortcomings by analyzing nutritional attributes using a binary approach; presence or absence of micro-fortification, it ignored macronutrient levels including protein composition despite the high global PEM.
Furthermore, Carneiro et al. (2022) found that consumers had a higher preference and demand for dark than light green beans. While Oparinde et al. (2016) showed higher preference and demand for red color, no studies have empirically compared preference and demand for red and dark green beans. Moreover, Akaichi et al. (2021) used sugar levels to analyze consumer preference and demand for porridge, while Yue et al. (2017) used a Brix indicator in a binary form for low (<11o) and high (>11o). However, none of the above studies analyzed the tastes from traditional cooking methods including bitter, sour and sweet tastes. And, while recent studies have treated legumes as ingredients in preparation of other foods such as snacks (Petrontino et al., 2023), porridge (Wanyama et al., 2019) and composite flours (Chege et al., 2019), they ignored the fact that whole legumes, specifically rice beans, are often eaten alone or as legume-cereal mixes. Previous studies analyzed preferences for processed and unprocessed legume-cereal mixes. Specifically, they evaluated preferences for legumes in processed flours. Although most households consumed whole cereals, root crops, or tubers, most studies lumped them as unprocessed legume accompaniments. Therefore, the novelty of our study was the modification of this classification into whole grain mixes and other mixes (roots and tubers) accompaniments. Subsequently, we used these classes as two levels for the attribute of legume-cereal mixes into a DCE, unlike previous studies.
Therefore, it is important to understand how rice bean is eaten in various food mixes and the essential attributes that consumers care about for each case. This pursuit is in line with the observations by Martey et al. (2022) that potential losses from investing resources in low-priority attributes should be avoided by plant breeders and other actors. Similarly, the identification of the correct attributes would improve the diversification of household diets and curb hidden hunger (Lowe, 2021). Therefore, our study was guided by the following research questions: (1) Which attributes have an effect on the choice of rice beans? (2) What are the levels of consumers’ willingness to pay (WTP) for rice bean attributes? (3) What is the compensating surplus (CS) for rice beans under different policy scenarios? The current study uses the DCE approach to elicit consumer preferences for rice bean attributes in western Kenya. The insights from this study are necessary to inform policy design on which attributes to emphasize in the breeding of rice beans and how to package and market them based on consumers’ valuation of different components.
The rest of the paper is organized as follows. In section 2, the methodology applied in the study is described. Section 3 presents the results, while section 4 discusses the key findings. Finally, the conclusion and recommendations are provided in section 5.
Considering that rice bean is a relatively new commodity whose production and consumption are still in the pilot stage; this study used the DCE approach to measure consumer willingness to pay (WTP) for its attributes. The DCE method has recently been applied to estimate preferences for various products (Lancsar et al., 2017; Yue et al., 2017; Fu et al., 2022). In Kenya, the method has been recently used by Otieno and Ogutu (2020) to evaluate consumer WTP for chicken welfare attributes, while Okello et al. (2023) estimated consumer WTP for commercial insect-based chicken feed using the method. Owuor et al. (2023) applied the approach to analyze consumers’ preference for orange-fleshed sweet potato puree chapati in Kenya’s rural and urban areas. The only empirical application of DCE in an analysis of legume attributes is that of Marette (2021) who investigated the effect of production label information on consumer WTP for lentils in France. The current study thus contributes to the empirical literature on the use of DCE method in analysis of preferences for rice bean legume attributes in a developing country context.
Like previous DCE studies, attributes were identified through a review of the literature, two focus group discussions (FGDs), a baseline survey and key informant interviews (KIIs). The two FGDs were conducted in Busia County and Migori County with a minimum number of 7 participants required for FGDs. Moreover, the criteria for choosing FGD participants included gender, location and age. This was because key decision makers in households on the consumption of rice beans were mainly male, while female persons mainly purchased and cooked the rice beans in households in western Kenya. The elderly individuals were included due to their historical recall of the crops in western Kenya and trends in legume consumption. Hence, the FGD in Migori County had 11 participants, who included 6 males and 5 females, while that in Busia County included 9 participants; 4 males and 5 females. Moreover, for triangulation of the insights from FGDs and KIIs, we included seed experts, extension officers, nutritional experts, farmers, cereal traders and farm input suppliers from western Kenya.
We collected data from FGDs using pen and paper in the two venues. First, we used a checklist to guide discussions in the FGDs on the common legume attributes in western Kenya. Second, we asked the participants to list and rank the most common legume attributes on the cards that we provided. Subsequently, the respondents proceeded and placed their cards on a whiteboard. Third, we collected data on the legume consumption trends in Migori County and Busia County over the last 40 years. Finally, we triangulated the information collected by consulting the experts to confirm the validity of the attributes and the suitable levels for each attribute.
The DCE design included two sets of attributes; compulsory and optional/voluntary attributes. Compulsory or mandatory attributes are those attributes that must be observed for effective breeding. This includes the allowed nutrient levels, health regulations and policy on food processing, food handling, and specifically permitted proportion of legume and cereals in legume cereal mixes, sugar levels, and food colors to avoid contamination of food. On the other hand, the voluntary attributes that were included in the study are protein levels, cooking time, taste, legume-cereal mixes, color and price (Table 1).
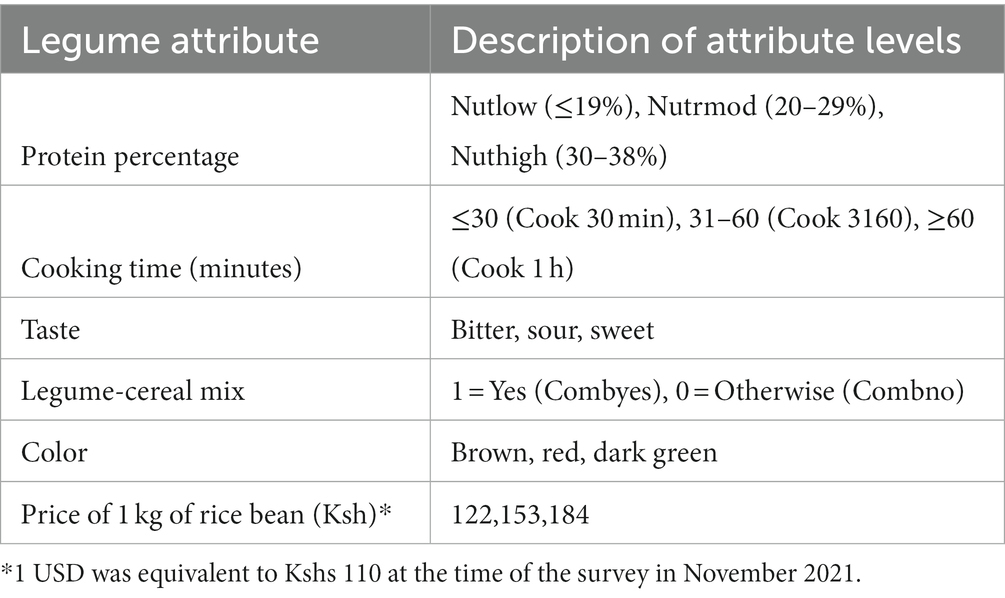
Table 1. Legume attributes and levels used in the CE design.
Protein percentage is used since legumes have proteins, carbohydrates, vitamins and other minerals in different proportions. These percentages were based on the maximum and minimum level of proteins in legumes (see Kaur et al., 2013). Cooking time was included as an attribute to account for the time needed to get edible rice beans from different cooking methods. In line with previous studies (Aseete et al., 2018; Bepary and Wadikar, 2018; Akaichi et al., 2021), the range of cooking time was obtained from the FGDs for soaked, precooked and unsoaked beans. Taste, which varies with the type of food, is a sensory attribute that measures degree of likeability of the food. Typically, some legumes are mixed with bitter herbs, pepper or fermented before they are consumed. A bitter taste is usually unpleasant and disagreeable, while sour is sharp taste with high acidity. But, some legumes like garden peas and snow peas have a sweet taste and others are seasoned for sweetness. Although Yue et al. (2017) used the Brix indicator to classify the sweetness, the present study was not confined to sweet taste, hence the Brix indicator was not applicable. Furthermore, legume mix levels were binary since the absence of a legume-cereal mix causes hidden hunger due to inadequate micronutrients, while the consumption of legume cereal mixes improves dietary diversity and lowers the hidden hunger. Therefore, the legume-cereal mix attribute was represented by two levels denoting the presence or absence of legume cereal mix. Likewise, color was included as an attribute that attracts consumers depending on their preference. Finally, the average market price for 1 Kilogram (Kg) of rice bean at the time of the survey was increased gradually by 25% to represent potential costs of improvements in providing a better variety with enhanced attributes.
Following Louviere et al. (2000) an orthogonal method was applied to generate a CE design, which was used for a pilot survey on 36 consumers to get prior coefficients for subsequent design procedures. Subsequently, a D-efficient design recommended by Scarpa and Rose (2008) was generated in Ngene software. The eventual design had 36 paired choice sets that were placed into six blocks. The design had a D-efficiency measure of 89%, a B-estimate of 95%, and an A-efficiency level of 88%; the design met the minimum threshold of 70% in all its efficiency measures (Larson et al., 2015). An example of a CE choice set presented to respondents is shown in Table 2. In line with previous CE studies (see for example, Otieno and Ogutu, 2020; Owuor et al., 2023) the opt-out option in which no attribute level was present, was included to allow respondents flexibility of not choosing either rice bean type A or type B if their preferred attribute combinations were missing.
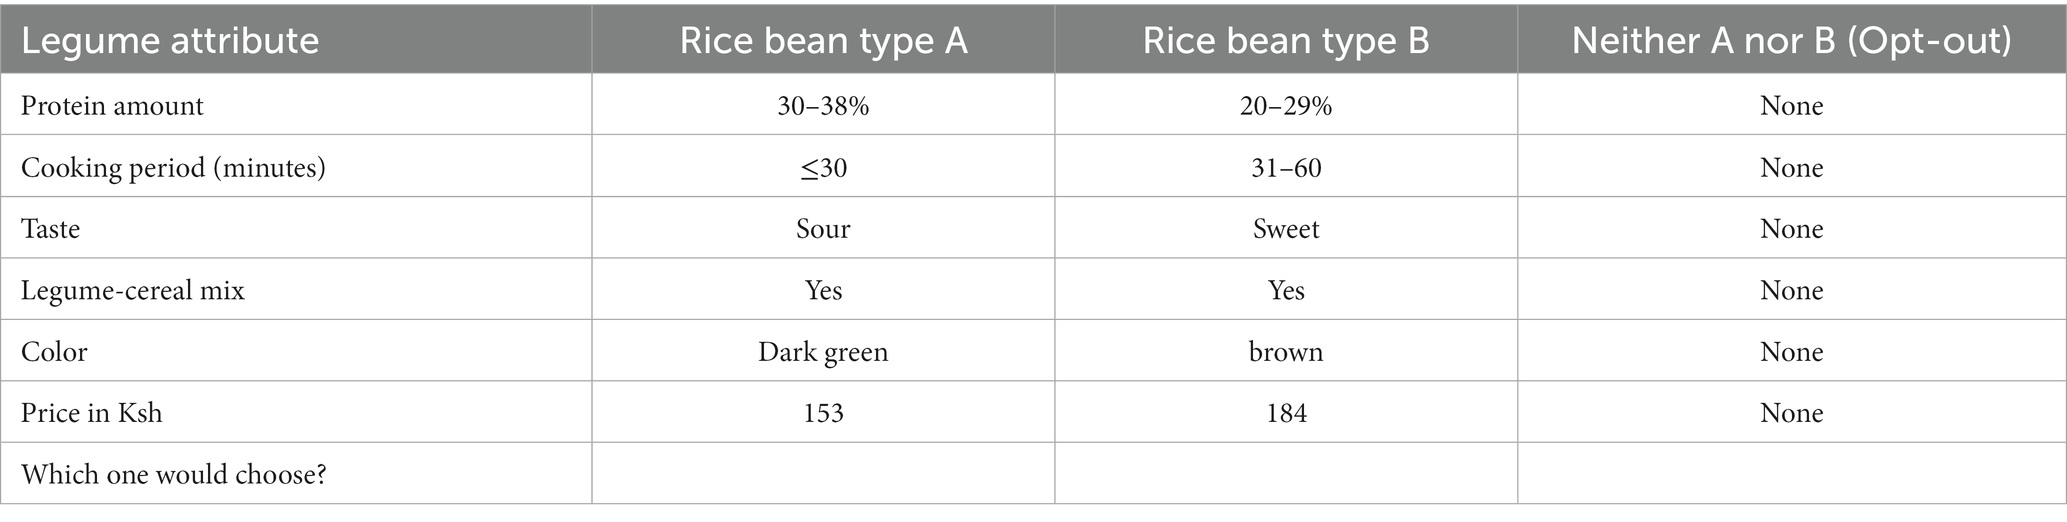
Table 2. Example of a choice set.
The study was conducted in Migori County (Figure 1) and Busia County (Figure 2) in western Kenya, which border Uganda and Tanzania, respectively. The two counties were purposively selected due to the high cross-border legume trade and consumption of staple cereals therein. Subsequently, Nambale and Teso North sub-counties were randomly selected from Busia County, while Suna East and Uriri sub-counties were selected in Migori County. Then Bukhayo North and Bukhayo South locations were randomly selected from Nambale sub-county. Likewise, Chakol North and Amukura West were randomly selected from Teso North sub-county. Finally, West Kanyamkago and North Kanyamkago locations were randomly selected from Suna East, while God Jope and Kakrao locations were randomly selected from Uriri (Figure 1).
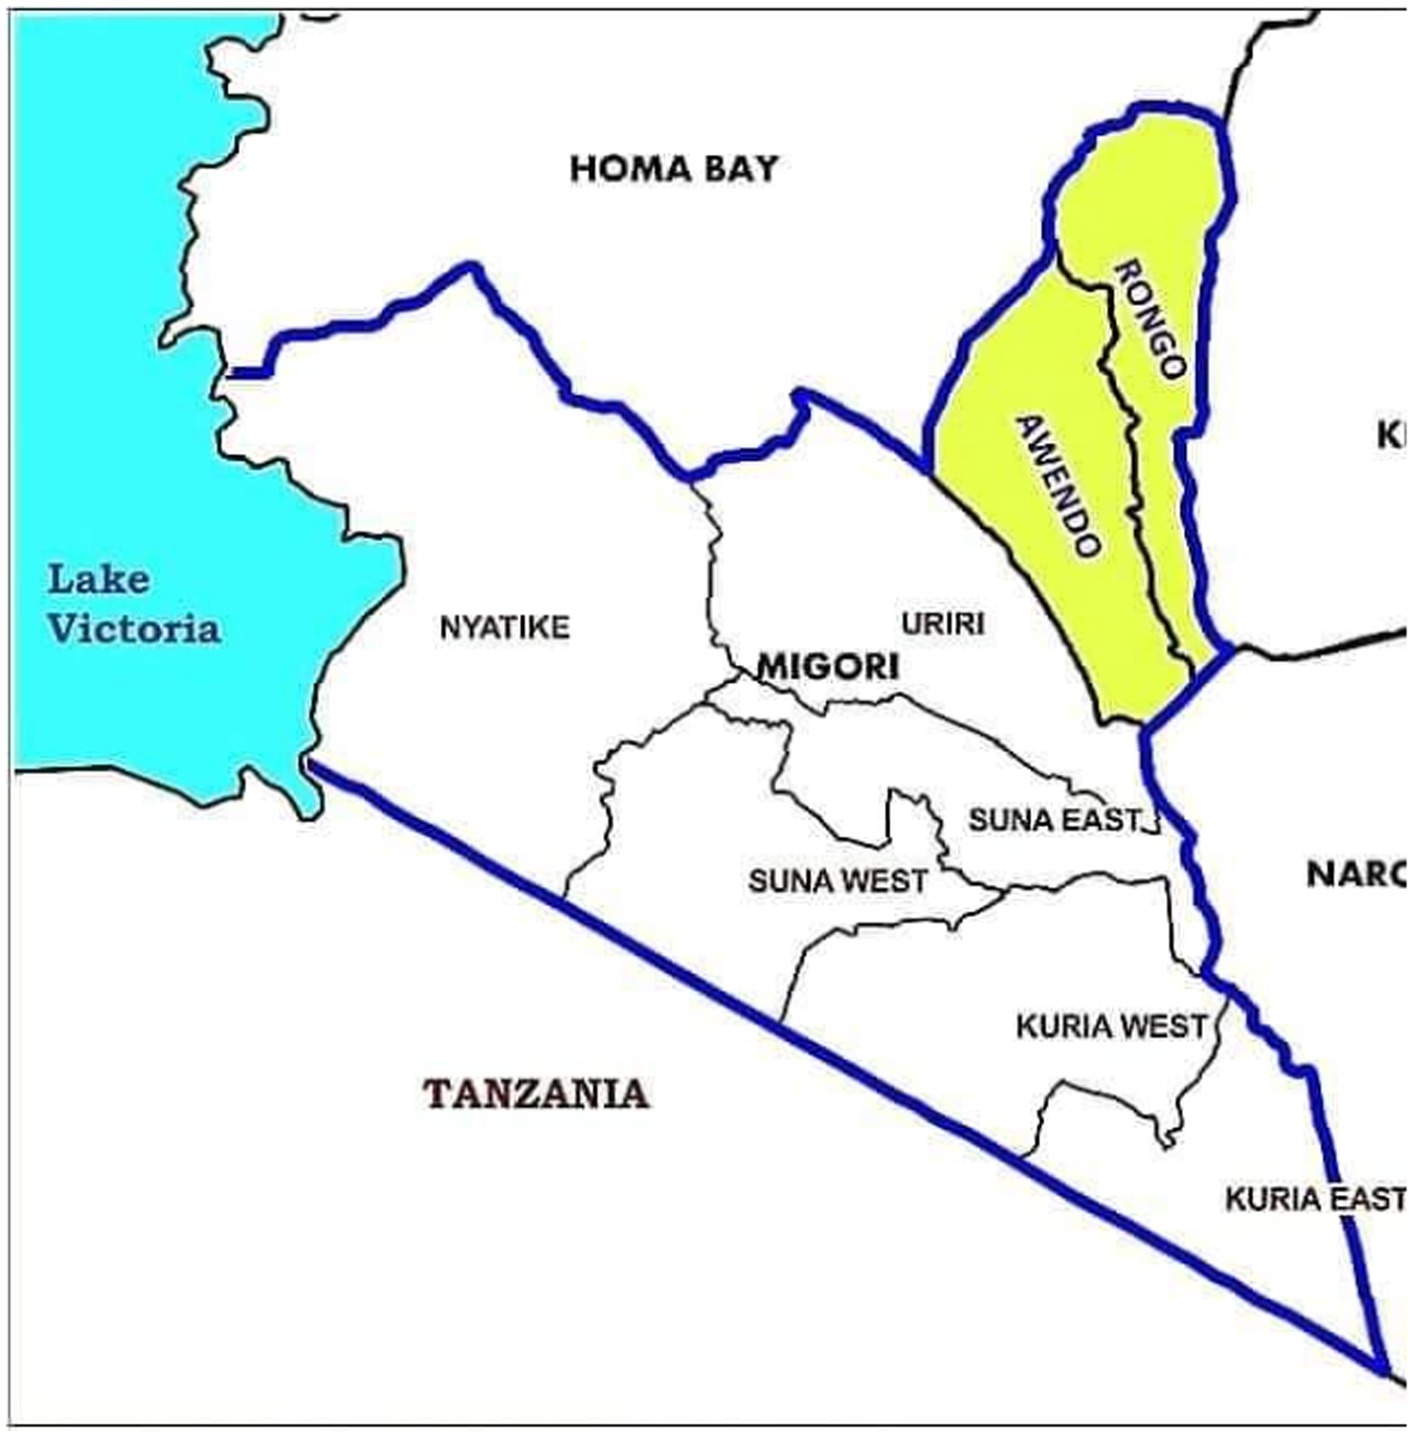
Figure 1. Map of Migori County.
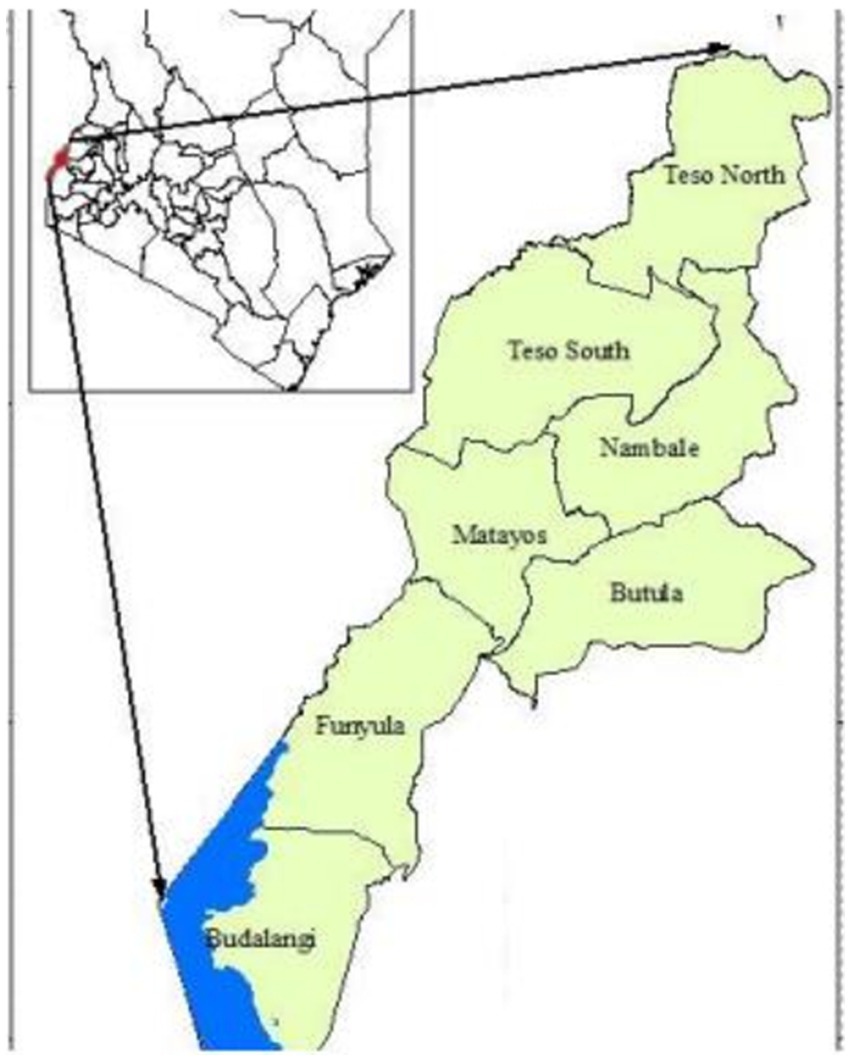
Figure 2. Map of Busia County.
The sample size was determined using Equation 1, which is considered the rule of thumb for determining sample sizes in CE studies (Johnson and Orme, 2003).
Where K = 3 is the maximum level of attributes, C = 3 is the number of alternatives in a choice set, and T is the number of choice situations = 6. Therefore, this gave a sample size of 83 respondents, which was above the minimum size of 50 that is recommended in other studies (Noor et al., 2022). But, to get 30 individuals for each of the 6 blocks a sample of 180 was required. However, to ensure balanced numbers in each block, 23 respondents were included in each block which resulted in a sample size of 138. During the survey, households were sampled through systematic random sampling. Furthermore, exit interviews or interviews from central locations such as hotels were a challenge due to the low commercialization of rice beans (Bhagyawant et al., 2019). Hence, the consumers’ households were randomly assigned to one of the six blocks and asked to select one alternative from each of the six choice sets. Data was collected from 29th November to 14th December 2021 through in-person face-to-face interviews that were administered by well-trained enumerators using local languages to ease respondents’ burden.
The data collection was done by trained enumerators using a pretested questionnaire, which had sections for preferences, choice experiment, and socioeconomic characteristics of consumers. We combined a pen on paper and an electronic data collection method to ensure accuracy of the data collection. Specifically, we did this to allow respondents with little exposure to electronics to make choices on paper. Furthermore, since we collected the data during the covid19 outbreak, this approach acted as a safety measure by minimizing physical contact.
The analysis of discrete choice data follows Lancasterian theory (Lancaster, 1966), which measures utility from individual attributes rather than the whole good. Considering that preferences are heterogeneous, this study applied the random parameter logit (RPL) model (Hess and Rose, 2012; Davis et al., 2016; Hensher and Greene, 2023). The RPL has been recently used to study consumer preference for legume attributes by Martey et al. (2022) and WTP for orange-fleshed sweet potato puree chapati (Owuor et al., 2023). Following McFadden and Train (2000) the utility derived by consumers from the rice bean type chosen can be expressed as shown in Equation 2.
Where X is a vector of rice bean attributes that are assumed to have a mean (μ) and a standard deviation (λ), while β is the marginal utility of the vector of rice beans attributes, and random parameters. The t is the sequence of choices from 1 to 6 by individual n. It was expected that an individual n picked alternative i if U ni > U nj . The density function is given by , where indicate the vector of parameters, including taste that varies with individual decision maker (n). On the other hand, describe covariance and means of . Therefore, the RPL model was estimated through the maximum log-like hood in Equation 3.
Subsequently, WTP was estimated as a ratio of the coefficient of each rice bean attribute to the price or cost coefficient as shown in Equation (4). The cost or price variable is specified as a fixed parameter to avoid extreme negative or positive values.
Finally, compensating surplus (CS) estimates were derived as shown in Equation 5 to understand how consumers in varying circumstances would consider different combinations of the rice bean attributes.
According to the results in Table 3, 73% of the household heads in the pooled sample were male and had an average age of 45 years. Furthermore, nearly half of them had completed primary level of education. Also, about two-thirds of households had a monthly income range of between Ksh. 30,001 and Ksh. 40,000 (Figure 3). Although the pooled sample had an average of 4 members per household, Busia County on average had more household members than Migori County. Moreover, 78% of respondents in Migori County, 80% in the pooled sample and 84% in Busia County belonged to social groups. In contrast, the women from households in Migori County attended women’s group meetings less frequently. Specifically, 71% of households purchased rice beans from open-air markets as dry beans, yet a smaller portion preferred to buy beans as boiled, canned, or fried beans (Table 4). Finally, households in Migori County were located far away from all-weather roads compared to those in Busia County.
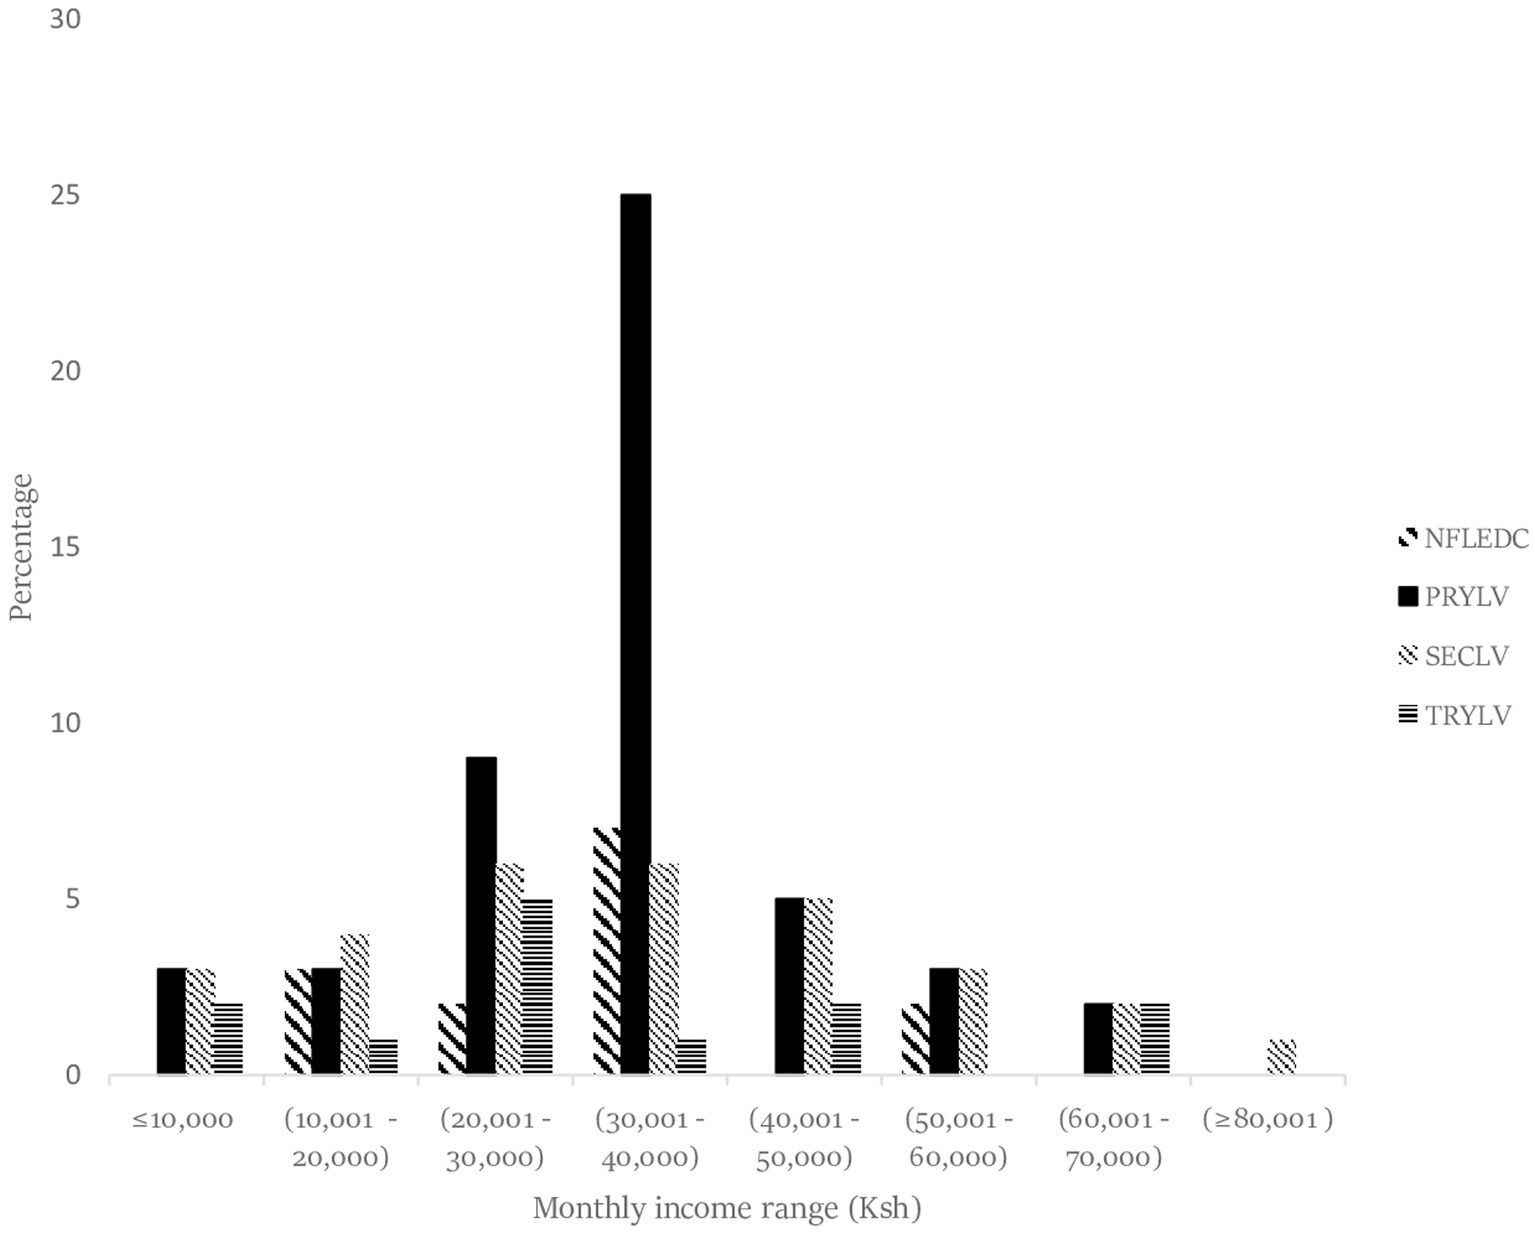
Figure 3. Consumer income range by educational level of household head.
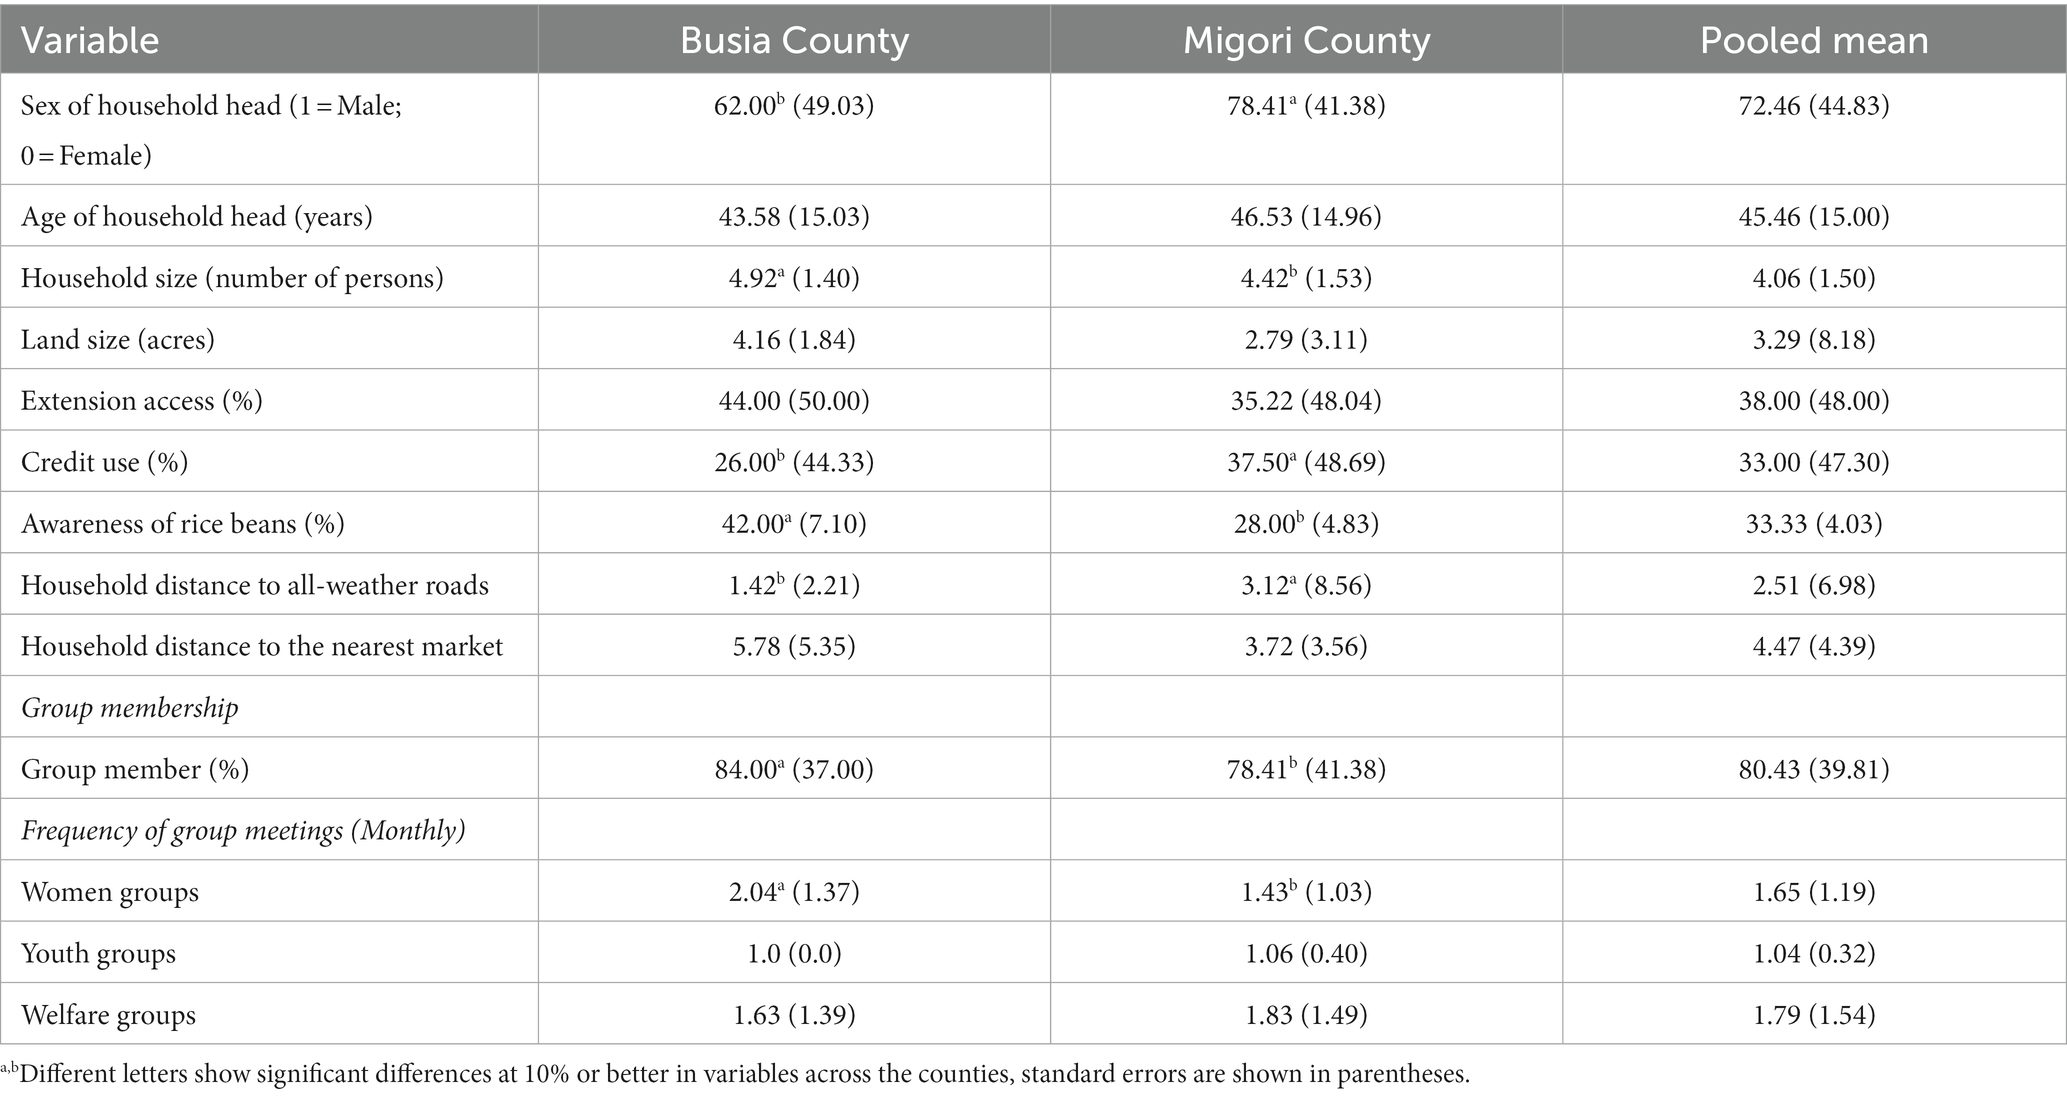
Table 3. Summary of socio-economic characteristics of consumers.
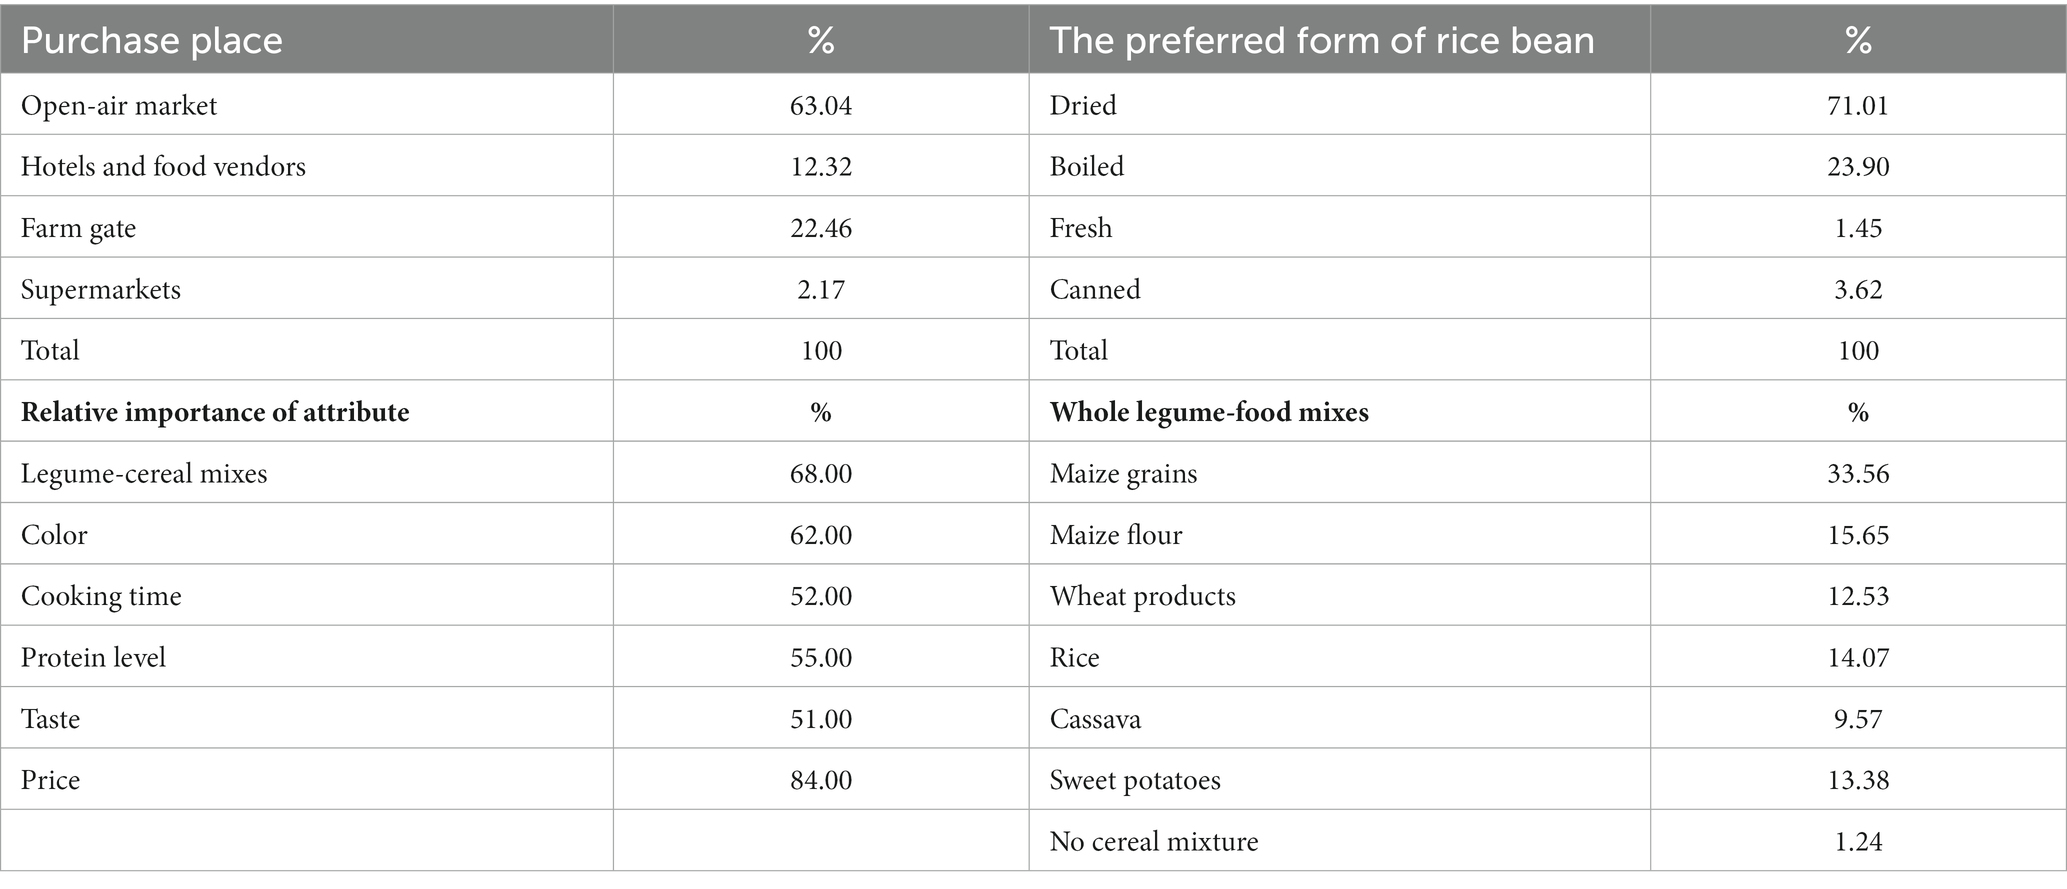
Table 4. Description of consumers’ preference for market outlets, attributes and form of rice beans.
The multinomial logit (MNL) had starting values with a loglikelihood of −695.48, Pseudo-R2 of 10% for the pooled sample, a loglikelihood of −404.25, Pseudo-R2 of 7% for Migori County, and loglikelihood of −195.64, Pseudo-R2 of 18% for Busia County. But the results in Table 5 show an improvement in the model fits and justified the choice of the RPL over the MNL, which had restrictive assumptions. Moreover, all the attributes in the pooled sample, except sour taste, had a statistically significant effect on choice of rice beans. The negative and significant sign of price allowed the estimation of trade-offs of the attributes in the choice sets. Generally, consumers had a higher preference for 30–38% protein than 20–29% protein levels, although this preference was lower for consumers in Busia County. Surprisingly, consumers had a higher preference for a cooking time of 31 min to 1 h compared to 30 min or less, apart from those in Migori County. As expected, consumers had a lower preference for sour taste and those in Busia County had a negative preference for a sour taste, yet surprisingly those in Migori County had a positive preference for a sour taste. Consumers had a higher preference for legume cereal mixes and red color compared to cereal alternative mixes and dark green color, respectively.
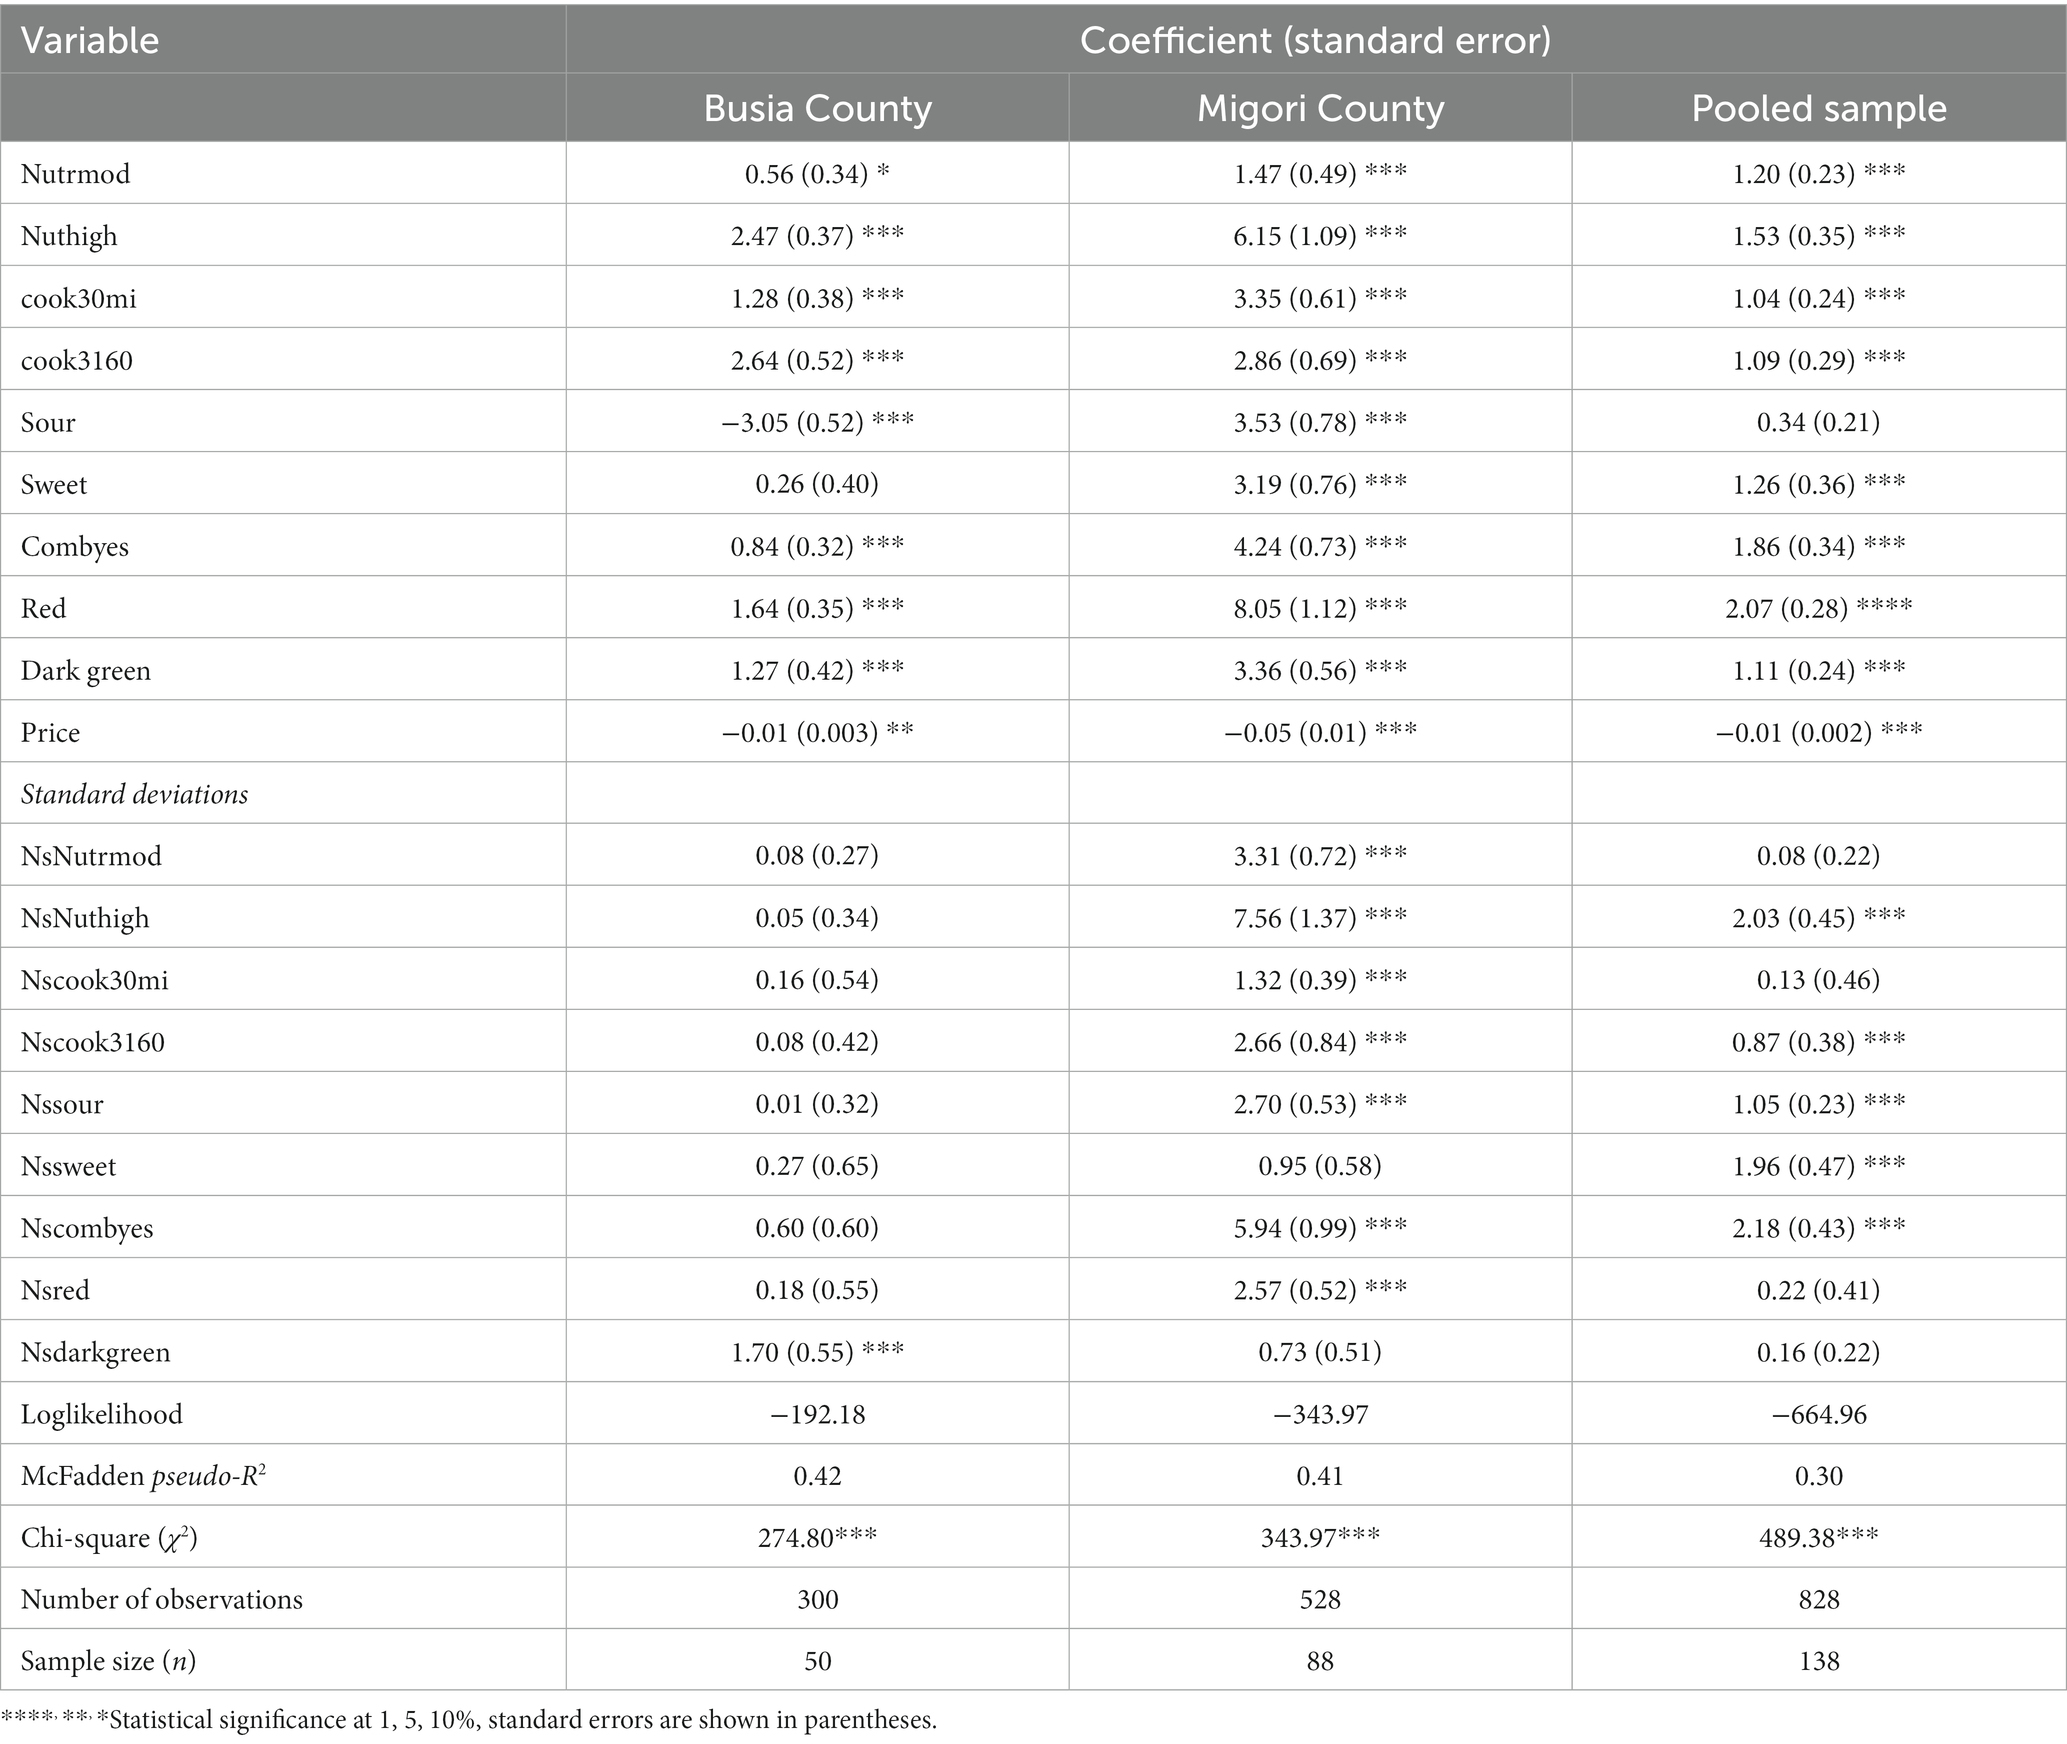
Table 5. RPL estimates for consumer preferences for rice bean attributes.
Furthermore, over half of the consumers had a positive preference for the individual rice bean attributes, apart from 28% who expressed a negative preference for 30–38% protein level; 10% who expressed a negative preference for cooking time of 31 min to 1 h; 45% who expressed negative preference for sour taste; 26% who expressed a negative preference for sweet taste, and 20% who expressed a negative preference for legume-cereal mixes (see Appendix 1). Table 6 shows the results of the WTP estimates on the rice bean attributes. Models with various covariates as interaction variables were estimated (see Appendices 2 and 3). However, we focus our discussion on the RPL models without interaction variables due to lower robustness in results from the RPL models with interaction variables. The pooled sample of consumers was willing to pay between Ksh 78 and Ksh 184 for 20–29% protein content in the rice bean; Ksh 89 to Ksh 244 for 30–38% protein content; Ksh 62 to Ksh 165 for a cooking time of 30 min or less; Ksh 67 to Ksh 171 for a cooking period of 31 min to 1 h; Ksh 64 to Ksh 210 for sweet taste; Ksh 116 to Ksh 288 for whole legume-cereal mixes; Ksh 148 to Ksh 304 for red color; and Ksh 75 to Ksh 167 for dark green color. The standard errors, which were used to estimate the confidence intervals (CI), were estimated through the delta method in LIMDEP 11 version 6.0.
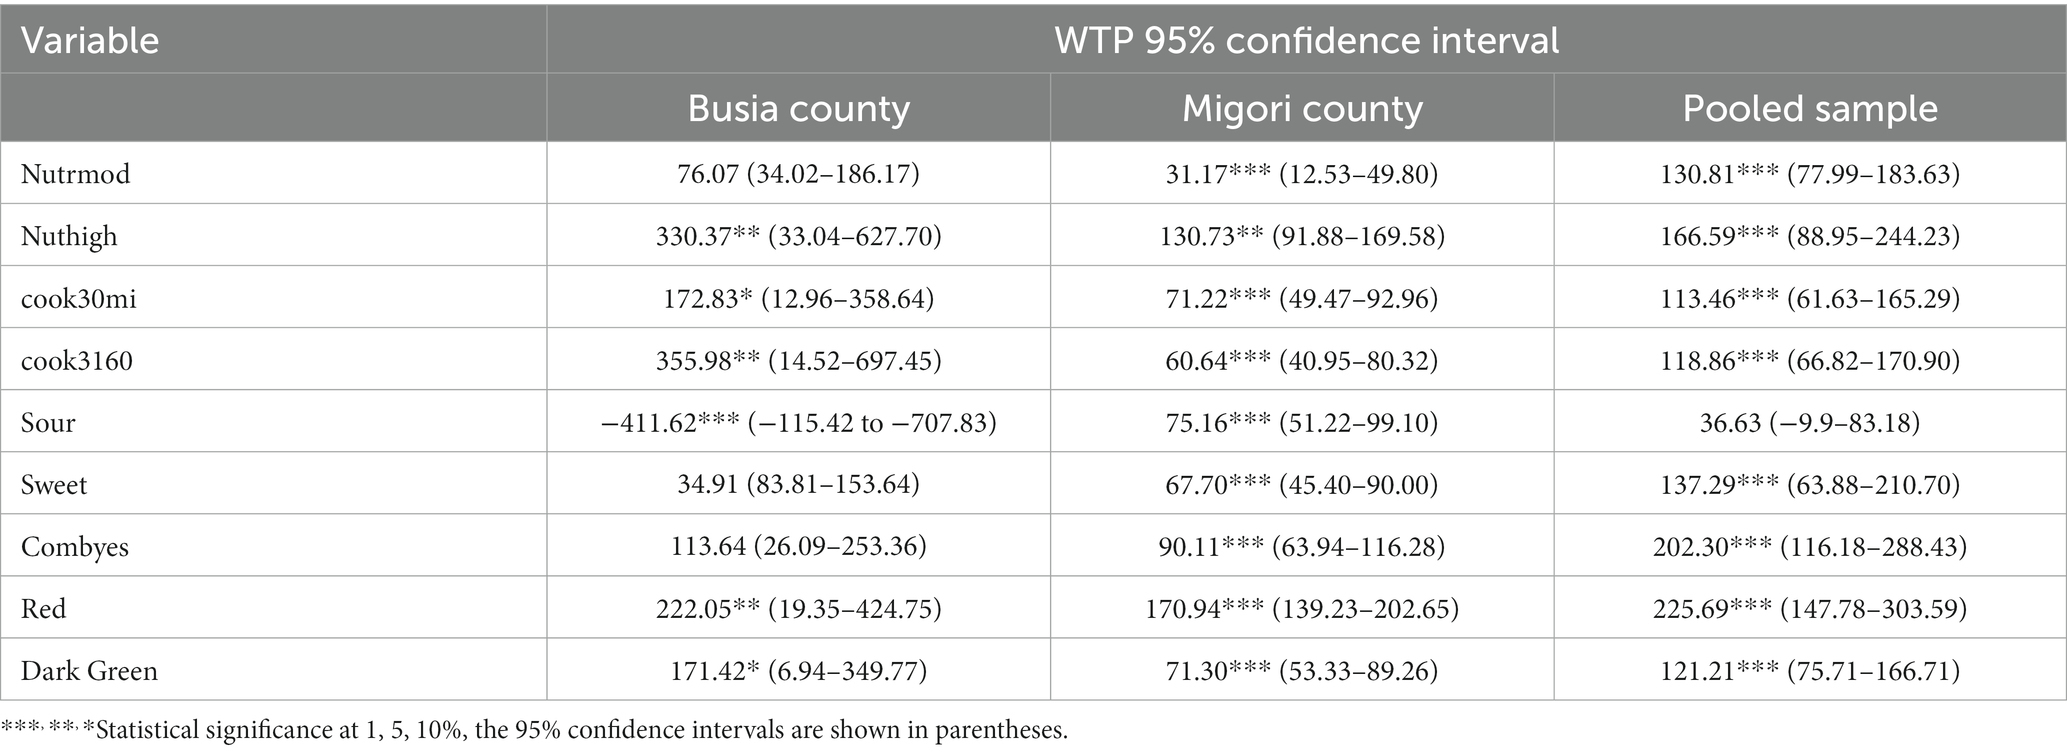
Table 6. Willingness to pay estimates for rice beans.
Rice bean improvement involves the combination of different attributes, which suit target consumers including children aged 10 years or younger, expectant women, youth, elderly, flatulence patient, and diabetic patient (Table 7). Generally, CS corresponding to each target consumer was positive and statistically significant. While the youth had the highest CS of Ksh 619.64 and patients with flatulence had the lowest CS of Ksh 407.52 in the pooled sample, children aged 10 years or younger had the highest CS in Migori County and Busia County.

Table 7. Compensating surplus estimates for rice beans for different consumer segments.
The differences in the socio-economic characteristics of consumers in Migori County and Busia County have potential influence on their preferences for rice bean. For instance, male-headed households allocate more resources to cash crops like cereals, while female-headed household and youth are likely to prioritize legumes, which are perceived to be less financially lucrative (Bosch et al., 2017). Although incomes in Busia County and Migori County were within the national average wages, they were lower than the global average income (Shibia et al., 2023). Therefore, most households in western Kenya required credit from social groups. According to the FGDs, one benefit of a being a member in a social group was access to information from training and group members. Muange and Oparinde (2018), found that social networks have a positive or negative effect on perception of legumes based on an individual’s demand for technological attributes. Hence, this could explain the differences in awareness of rice beans between the consumers in Busia and Migori County.
Consumers preferred to shop from open-air markets due to convenience and flexibility in bargain unlike in the supermarkets. Moreover, consumers could purchase smaller quantities from open-air markets compared to supermarkets, where goods were sold as expensive prepacked goods. For instance, the prices in supermarkets were Ksh 278/kg for yellow beans, Ksh 238/kg for Nyayo beans (common beans), 180 Ksh/kg for cowpeas, Ksh 280/kg for chickpeas, Ksh 250/kg for Mwitemania beans, Ksh 370/kg for lentils and Ksh 170/kg for rice beans. This confirms the observation by Mabeya et al. (2020) that due to relatively low prices, open-air markets were the leading sources of beans in western Kenya. Although, the precooked beans were sold in other parts of Kenya, the practice was not popular in western Kenya due to experience, cultural beliefs and the prevailing covid-19 pandemic at the time of the survey. The survey period coincided with the covid-19 lockdown period, which restricted public selling of food on the roadsides or food vendors.
The high preference for 30–38% protein by consumers in Migori County is explained by regular consumption of nutritious legumes such as soybeans and groundnuts. Oparinde et al. (2016) found high preference for nutritious beans even in the absence of nutritional information in Rwanda, while Murekezi et al. (2017) found a higher preference for nutritious legumes whenever consumers ate legumes more frequently. Similarly, consumers in Migori County had a higher preference for a cooking period of 30 min or less, which required less fuel and saved time, while consumers in Busia County and in the pooled sample had a higher preference for a moderate cooking time of 31 min to 1 h (Table 5). Although a cooking time of 31 min to 1 h used more fuel than 30 min or less, it was required to reduce flatulence, associated with stomach discomfort, from undercooked beans. But soaking of rice beans was not routinely done in Busia County, since according to FGDs it was a laborious and time-consuming process, yet soaked rice beans cooked faster and reduced flatulence, whenever the soaking water was replaced before cooking (Bepary and Wadikar, 2018). This behavior was unique since consumers tend to seek convenience and rarely make tradeoffs with less efficient techniques (Aseete et al., 2018; Akaichi et al., 2021).
The high preference for sour taste by consumers in Migori County was explained by the fact that, although substitutes for sweet legumes like black night shades (Solanum nigrum) were sour, they were readily available, and hence consumers made a trade-off between taste and availability. Moreover, according to FGDs, sweet legumes had a short shelf life, which was a form of risk in households without preservation facilities. According to Carneiro et al. (2021) sour taste in legumes is due to isoflavones, which are beneficial nutrient to diabetics. However, this preference for sour taste was limited by the location of households, since the preference for sweet taste was higher in the pooled sample. While these results conformed to those of Parker et al. (2018) on a high preference for sweet taste, they contradicted Akaichi et al. (2021) on a low preference for sweet taste in legume foods.
Likewise, consumers in Migori County, which had a variety of cereals, had a higher preference for legume-cereals mixes than for legume-cereal substitute mixes. This was because of low access to cereal substitutes, such as Irish potatoes, which were mainly sourced from outside Migori County. Wanyama et al. (2019) found that a low-income level confined consumer preference to readily available legume-food mixes, which confirms the high preference for legume-cereal mixes in Migori County. Similarly, consumers generally had a higher preference for red than dark green beans, which had a lower culinary appeal; it was established in the FGDs that red beans produced an attractive curry and were more appetizing compared to dark green beans. However, these results contrast those of Carneiro et al. (2022), who found a higher preference for dark than light-colored beans, although Ojwang et al. (2023) found high incidences of malnutrition in market segments with preference for white food due to lower levels of beta-carotene and iron.
The high WTP for 30–38% by consumers in Busia County was due to the perceived health benefits of eating nutritious beans, which were relatively affordable in Busia County. Although there was a higher preference for 30–38% protein content in Migori County, low household income reduced consumers WTP for this attribute level. Consumers in Busia and the pooled sample had a higher WTP for between 31 min to 1 hour cooking time to avoid the perceived inconvenience from soaking rice beans, yet soaking reduced their cooking time and flatulence (Bepary et al., 2016). However, since additional benefits from the short cooking periods, including lower energy expenses, outweighed other factors including the perceived inconvenience of soaking beans, consumers in Migori County had a higher WTP for a cooking time of 30 min or less (Mutegi et al., 2023). Although the consumers required a premium 23–27% less price of rice bean for this cooking period, Aseete et al. (2018) found that consumers were willing to pay a premium of 30–40% for such periods in precooked beans. Therefore, this difference in WTP is explained by the fact that, unlike precooked beans in previous studies, there were no industrial precooked rice beans in western Kenya, which was perceived as a risk by consumers and hence the lower premium.
Moreover, the differences in the WTP for taste was explained by availability of legumes in western Kenya. For instance, consumers in Busia County required a high discount for sour taste, since from the FGDs there was a decline in the varities of legumes over the last 40 years. Hence, consumers were not familiar with different taste of foods, and required a discount to try this new taste. In contrast, consumers in Migori County frequently mixed legumes and sour traditional foods, which were perceived to benefit expectant women, elderly, diabetic, hypertensive and reduced flatulence. But Pattanayak et al. (2019), noted that value addition, which includes legume-cereal mixes, may reduce undesirable taste attributes. The main forms of legume-cereal mixes include composite flour, which has a longer shelf life, and whole legume grains with cereals (Akaichi et al., 2021). Consequently, the pooled sample was willing to pay a premium of 41% for legume-cereal mixes, while consumers in Migori County required a discount for legume-cereal mixes. However, Wanyama et al. (2019) found a lower premium of 0.4–0.5% for cereal and beans mixtures in low-income settlements in urban areas in Kenya. These differences in WTP and discounts are explained by income levels in the informal settlement areas and rural areas, where most cereals were sourced. Finally, the premium of 55% for red color contrasted Oparinde et al. (2016), who found a WTP of 13–17% for red beans and 6–14% for white beans. The difference in WTP for the two studies was due to the absence of improved rice beans, unlike for the red and white beans.
Consumers in different socio-economic strata and with varying nutritional needs would typically be expected to choose different combinations of rice bean attributes. Nchanji et al. (2022) and Murekezi et al. (2017) proposed the identification of target consumers based on where they frequently purchase legumes including: the open-air market, hotels and food vendors, farm gates and supermarkets (Table 4). The households with children aged 10 years and younger and expectant women frequented the open-air markets, but the youth frequented hotels or food vending points. Moreover, elderly consumers mainly bought beans from farm gates due to their low mobility, while high-income earners frequented supermarkets; there were sections with foods for diabetic consumers and those affected by flatulence. Each of these target consumers has unique nutritional needs, which must be considered by breeders, food processors and traders (see Parker et al., 2018; Broeckhoven et al., 2021; Food and Agriculture Organization (FAO), 2021; Faralla et al., 2023). Compensating surplus (CS) measures were computed for six categories of consumers to understand how they perceived different attribute combinations. These categories were children aged 10 years or younger, expectant women, youth, elderly, fluctuance patients, and diabetic patients.
The CS was lower for the high-income market segment since low-income earners mainly get protein from cheap plants, while middle to high-income earners get protein from expensive meat (Broeckhoven et al., 2021). However, the youthful consumers would spend more on rice beans, since they were likely to experiment with novel food products, but the consumers affected by flatulence were cautious and would spend the least on improved rice beans. Moreover, the youth had a the high demand for convenient fast foods and snacks from legume-cereal mixes in hotels and from food vendors, unlike for the beans bought in supermarkets by people with flatulence (Babirye et al., 2023). Likewise, expectant women would spend more than households with children aged 10 years or younger on improved rice beans because they had a higher demand for protein and legume-cereal mixes than the children, who valued the sweetness and color of foods (Brunk and Møller, 2019; Saint-Eve et al., 2021; Faralla et al., 2023).
Moreover, the expectant women had nutritional needs that required legume-cereal mixes; composite porridge and legume-cereal foods had a blend of macro and micronutrients needed for foetus growth and development (Saint-Eve et al., 2021). Moreover, diabetic and elderly consumers demand legume mixes to manage blood sugar levels (Katoch et al., 2023). Consequently, implementation of the scenarios in most cases will depend on policy prioritization and funding. Specifically, if a conducive environment that harmonizes policy priorities and funds exist, the improved rice beans that targeted the youth is an ideal choice for implementation by concerned agencies. Moreover, the CS estimates can be used as guiding principles in the context of the established institutional frameworks and capacities. It is important to note that, although the CS measures are higher than the average price of 1 kg of rice beans, they are not indicative of proposed price hikes, but viable changes to rice beans. Furthermore, these CS estimates are approximately 1.5–2.2% of the monthly income range, which is shows that households would be able to afford the improved rice beans.
This study analyzed consumer preference for protein content, cooking time, taste, legume-cereal mixes, color, and price in western Kenya. The results indicated that consumers had a positive preference for all the attributes except sour taste in their choice of rice beans. Moreover, there was heterogeneity in consumer preferences, since consumers in Migori County had a higher preference for all the improved rice bean attributes compared to those in Busia County. As a whole, consumers were willing to pay the highest premium for red color and the lowest premium for sour taste. While consumers in Migori County would pay the highest premium for red color and the lowest premium for 20–29% protein, those from Busia County would pay the highest premium for 30–38% protein and the lowest premium for sour taste.
The CS estimates showed that youthful consumers were likely to spend the highest amount of money on improved rice beans, while the flatulence patients would spend the least on improved rice beans. Therefore, although consumers preferred red color and high protein content in rice beans, plant breeders should be careful when altering the taste of rice beans. Specifically, they should avoid breeding sour varieties, but in the event that such varities are found due to isoflavones, then nutritional experts should create awareness on the nutritional benefits of these sour foods through the appropriate communication channels. Likewise, breeding and release of fast-cooking varities must be preceded by creation of awareness by nutritional experts on techniques of lowering flatulence. Alternatively, plant breeders should breed varities with lower sugar levels, particularly raffinose, for diabetic and flatulence patients. Similarly, food processors should be sensitive to pricing, short cooking time, taste, legume-cereal mixes, and red color in production of novel products. In particular, they should process rice beans into attractive tasty infant foods, fermented composite porridge flour for the elderly, precooked rice beans and ready-to-eat snacks for the youthful consumers, and sugarless instant porridge flour for diabetic and flatulence patients.
Future studies could provide more insights on various aspects that were beyond the scope of this study First, future studies could improve on sample sizes by comparing consumers’ preference from different block designs. Second, future studies can explore interviews outside households or at shopping exits for consumers. Third, future nutritive attribute levels could include iron biofortification, glycemic index for diabetic individuals, and vitamin levels for individuals with high cholesterol. Finally, future studies could improve on the analysis of preference and demand for rice beans along gender and income classes in urban and rural areas.
The raw data supporting the conclusions of this article will be made available by the authors, without undue reservation.
Written informed consent was obtained from the individual(s) for the publication of any potentially identifiable images or data included in this article.
DA: Conceptualization, Data curation, Formal analysis, Software, Writing – original draft, Methodology. DO: Methodology, Supervision, Visualization, Writing – review & editing, Validation. SM: Funding acquisition, Investigation, Project administration, Resources, Supervision, Writing – review & editing. WO-K: Conceptualization, Methodology, Supervision, Validation, Visualization, Writing – review & editing.
The author(s) declare financial support was received for the research, authorship, and/or publication of this article. This research was funded by the National Research Fund (NRF) in Kenya. The project was done under NRF/2/MMC/475.
We acknowledge the financial support from the joint consortium on Rice Bean Research in Kenya, which consisted of the University of Nairobi, Kaimosi University, Kenyatta University, and the United States International University, towards data collection. We also thank the agriculture county directors and their staff in Busia County and Migori County in western Kenya for their technical inputs in the identification of relevant rice bean attributes. Finally, appreciate enumerators involved in the data collection and the respondents in Busia County and Migori County.
The authors declare that the research was conducted in the absence of any commercial or financial relationships that could be construed as a potential conflict of interest.
All claims expressed in this article are solely those of the authors and do not necessarily represent those of their affiliated organizations, or those of the publisher, the editors and the reviewers. Any product that may be evaluated in this article, or claim that may be made by its manufacturer, is not guaranteed or endorsed by the publisher.
The Supplementary material for this article can be found online at: https://www.frontiersin.org/articles/10.3389/fsufs.2024.1334707/full#supplementary-material
1. ^In Kenya, rice beans are called western dengu due to their popularity in the region.
Akaichi, F, Ciera, N, and Revoredo-Giha, C. Urban Consumers’ Preferences and Willingness to Pay for Orphan Crop Products: Evidence from a Choice Experiment on Porridge in Kenya. 2021 Conference, August 17–31, 2021, Virtual 315371, International-Conference of Agricultural Economists; (2021).
Andersen, P. European Commission 6th Framework Programme, Project no 032055 Food Security through Rice Beans Research in India and Nepal (FOSRIN). Bergen, Norway, Department of Geography, Universität Bergen and Bangor, Wales, UK, CAZS (2007).
Anino, C., Onyango, A. N., Imathiu, S., Maina, J., and Onyangore, F. (2019). Chemical composition of the seed and ‘milk’ of three common bean (Phaseolus vulgaris L) varieties. J Food Meas Charact. 13, 1242–1249. doi: 10.1007/s11694-019-00039-1
Aseete, P., Katungi, E., Bonabana-Wabbi, J., Birachi, E., and Ugen, M. A. (2018). Consumer demand heterogeneity and valuation of value-added pulse products: a case of precooked beans in Uganda. Agric Food Secur. 7:51. doi: 10.1186/s40066-018-0203-3
Babirye, I., Nakazi, F., Birachi, E. A., Wabbi, J. B., Ugen, M. A., and Elepu, G. (2023). Exploring processed common beans market in Kenya: implications for the business community. Cogent Food Agric. 9:2175538. doi: 10.1080/23311932.2023.2175538
Bepary, R. H., and Wadikar, D. D. (2018). Optimization of rice bean cooking parameters for the production of instant/convenience foods using response surface methodology. J. Food Process. Preserv. 42:e13547. doi: 10.1111/jfpp.13547
Bepary, R. H., Wadikar, D., Neog, S., and Patki, P. (2016). Studies on physico-chemical and cooking characteristics of rice bean varities grown in NE region of India. J Food Sci Tech. 54, 973–986.
Bhagyawant, S. S., Bhadkaria, A., Narvekar, D. T., and Srivastava, N. (2019). Multivariate biochemical characterization of rice bean (Vigna umbellata) seeds for nutritional enhancement. Biocatal. Agric. Biotechnol. 20:101193. doi: 10.1016/j.bcab.2019.101193
Bosch, C., Zeller, M., and De, D. (2017). Adoption of an improved bean seed variety and consumption of beans in rural Madagascar: evidence from a randomised control trial. J Agric Rural Dev Trop Sub Trop. 118, 217–231.
Broeckhoven, I., Verbeke, W., Tur-Cardona, J., Speelman, S., and Hung, Y. (2021). Consumer valuation of carbon labeled protein-enriched burgers in European older adults. Food Qual. Prefer. 89:104114. doi: 10.1016/j.foodqual.2020.104114
Brunk, L., and Møller, P. (2019). Do children prefer colored plates? Food Qual. Prefer. 73, 65–74. doi: 10.1016/j.foodqual.2018.12.011
Carneiro, R., Adie, K., Yu, D., Beverly, M., Neill, C., Zhang, B., et al. (2022). Understanding the role of overall appearance and color in consumers’ acceptability of edamame. Front Sustain Food Syst. 6:738453. doi: 10.3389/fsufs.2022.738453
Carneiro, R., Duncan, S., O’Keefe, S., Yu, D., Huang, H., Yin, Y., et al. (2021). Utilizing consumer perception of edamame to guide new variety development. Front Sustain Food Syst. 4:556580. doi: 10.3389/fsufs.2020.556580
Chege, C. G. K., Sibiko, K. W., Wanyama, R., Jager, M., and Birachi, E. (2019). Are consumers at the base of the pyramid willing to pay for nutritious foods? Food Policy 87:101745. doi: 10.1016/j.foodpol.2019.101745
Davis, K. J., Burton, M., and Kragt, M. E. (2016). Discrete choice models: Scale heterogeneity and why it matters. School of Agricultural and Resource Economics. Crawley, Australia: University of Western Australia.
FAO, IFAD, UNICEF, WFP, WHO . The State of Food Security and Nutrition in the World. Transforming Food Systems for Affordable Healthy Diets. Rome, Italy; (2020). Available at: http://www.fao.org/documents/card/en/c/ca9692en (Accessed on June 19, 2023)
Faralla, V., Savadori, L., Mittone, L., Novarese, M., and Ardizzone, A. (2023). Color and abundance: influencing children’s food choices. Food Qual. Prefer. 109:104918. doi: 10.1016/j.foodqual.2023.104918
Food and Agriculture Organization (FAO) . The State of Food Security and Nutrition in the World 2021. Rome, Italy; (2021). Available at: http://www.fao.org/documents/card/en/c/cb4474en (Accessed on June 18, 2023)
Fu, H., Zhang, Y., An, Y., Zhou, L., Peng, Y., Kong, R., et al. (2022). Subjective and objective risk perceptions and the willingness to pay for agricultural insurance: evidence from an in-the-field choice experiment in rural China. Geneva Risk Insur. Rev. 47, 98–121. doi: 10.1057/s10713-021-00071-6
Hensher, D. A., and Greene, W. H. (2023). Valuation of travel time savings in WTP and preference space in the presence of taste and scale heterogeneity. J Transp Econ Policy. 45, 505–525.
Hess, S., and Rose, J. M. (2012). Can scale and coefficient heterogeneity be separated in random coefficients models? Transportation 39, 1225–1239. doi: 10.1007/s11116-012-9394-9
Johnson, R, and Orme, B. Getting Most from the CBC. Sawtooth Software Research Paper. (2003). Available at: http://www.sawtoothsoftware.com/education/techpap.shtml (Accessed May 4, 2023).
Kassie, G. T., Abdulai, A., Greene, W. H., Shiferaw, B., Abate, T., Tarekegne, A., et al. (2017). Modeling preference and willingness to pay for drought tolerance (DT) in maize in rural Zimbabwe. World Dev. 94, 465–477. doi: 10.1016/j.worlddev.2017.02.008
Katoch, R., Sanadya, S. K., Pathania, K., and Chaudhary, H. K. (2023). Nutritional and nutraceutical potential of rice bean (Vigna umbellata) –a legume with hidden potential. Front. Nutr. 10:1126544. doi: 10.3389/fnut.2023.1126544
Kaur, A., Kaur, P., Singh, N., Virdi, A. S., Singh, P., and Rana, J. C. (2013). Grains, starch and protein characteristics of rice bean (Vigna umbellata) grown in Indian Himalaya regions. Food Res. Int. 54, 102–110. doi: 10.1016/j.foodres.2013.05.019
Kenyanest . Map of Busia County; (2023). Available at: https://kenyanest.com/wards-in-busia-county/ (Accessed March 16, 2023)
Khanal, U., Adhikari, A., and Wilson, C. (2017). Evaluating smallholder farmers’ demand for rice variety attributes in Nepal. J. Crop Improv. 31, 438–452. doi: 10.1080/15427528.2017.1311286
Khanal, A. R., Khadka, K., Poudel, I., and Joshi, K. D. (2007). “Report on farmers' local knowledge associated with the production, utilization and diversity of rice bean (Vigna umbellata) in Nepal” in The Ricebean Network: Farmers Indigenous Knowledge of Rice Bean in Nepal (Report N0 4) EC. 6th FP, Project No. 032055 (FOSRIN (Food Security through Ricebean Research in India and Nepal))
Lancaster, K. J. (1966). A new approach to consumer theory. J. Polit. Econ. 74, 132–157. doi: 10.1086/259131
Lancsar, E., Fiebig, D. G., and Hole, A. R. (2017). Discrete choice experiments: a guide to model specification, estimation and software. PharmacoEconomics 35, 697–716. doi: 10.1007/s40273-017-0506-4
Larson, E., Vail, D., Mbaruku, G. M., Kimweri, A., Freedman, L. P., and Kruk, M. E. (2015). Moving toward patient-centered Care in Africa: a discrete choice experiment of preferences for delivery care among 3,003 Tanzanian women. PLoS One 10:e0135621. doi: 10.1371/journal.pone.0135621
Louviere, J. J., Hensher, D. A., Swait, J. D., and Adamowicz, W. (2000). Stated Choice Methods: Analysis and Applications. 1st Edn. United Kingdom: Cambridge University Press.
Lowe, N. M. (2021). The global challenge of hidden hunger: perspectives from the field. Proc. Nutr. Soc. 80, 283–289. doi: 10.1017/S0029665121000902
Mabeya, J, Dey, B, Templer, N, Wilcox, M, Odhiambo, W, Buruchara, R, et al. Transforming Last-Mile Seed Delivery: A Case of High Iron Beans (HIBs) Niche Market Business Model in Western Kenya. A Feed the Future Global Supporting Seed Systems for Development Activity (S34D) Report. (2020). Available at: https://pdf.usaid.gov/pdf_docs/PA00XV64.pdf (Accessed September, 2023)
Marette, S. (2021). Sustainability and consumer willingness to pay for legumes: a laboratory study with lentils. Sustainability. 13:3408. doi: 10.3390/su13063408
Martey, E., Etwire, P. M., Adogoba, D. S., and Tengey, T. K. (2022). Farmers’ preferences for climate-smart cowpea varieties: implications for crop breeding programmes. Clim. Dev. 14, 105–120. doi: 10.1080/17565529.2021.1889949
McFadden, D., and Train, K. (2000). Mixed MNL models for discrete response. J. Appl. Econ. 15, 447–470. doi: 10.1002/1099-1255(200009/10)15:5<447::AID-JAE570>3.0.CO;2-1
Migoriassembly . Map of Migori County; (2023). Available at: http://migoriassembly.go.ke/county-map/ (Accessed October 31, 2023)
Muange, E, and Oparinde, A. Social Network Effects on Consumer Willingness to Pay for Biofortified Crops. HarvestPlus Working Paper 31. (2018). Washington, DC: HarvestPlus of International Food Policy Research Institute (IFPRI).
Murekezi, A., Oparinde, A., and Birol, E. (2017). Consumer market segments for biofortified iron beans in Rwanda: evidence from a hedonic testing study. Food Policy 66, 35–49. doi: 10.1016/j.foodpol.2016.11.005
Mutegi, J. G., Gido, E. O., Mathenge, M., and Karanja, D. (2023). Consumption frequency for precooked bean products among households in Machakos County, Kenya. Cogent Food Agric. 9:2247676. doi: 10.1080/23311932.2023.2247676
Nchanji, E, Chisorochengwe, N, Tsekenedza, S, Gutsa, F, Sondayi, L, Lutomia, C, et al. Market Segmentation(G+ Customer and Product Profile Tools) for Gender Responsive Bean Breeding in Zimbabwe, Piloting Report. PABRA Africa; (2022).
Noor, A. Y. M., Toiba, H., Setiawan, B., Muhaimin, A. W., and Kiloes, A. M. (2022). The application of choice experiments in a study on consumer preference for Agri-food products: a literature review. Agric Econ Zemědělská Ekon. 68, 189–197. doi: 10.17221/429/2021-AGRICECON
Ojwang, S. O., Okello, J. J., Otieno, D. J., Mutiso, J. M., Lindqvist-Kreuze, H., Coaldrake, P., et al. (2023). Targeting market segment needs with public-good crop breeding investments: a case study with potato and sweetpotato focused on poverty alleviation, nutrition and gender. Front. Plant Sci. 14:1105079. doi: 10.3389/fpls.2023.1105079
Okello, A. O., Otieno, D. J., Nzuma, J. M., Kidoido, M. M., and Tanga, C. M. (2023). Smallholder farmers’ willingness to pay for commercial insect-based chicken feed in Kenya. Int Food Agribus Manag Rev. 26, 67–87.
Oparinde, A., Birol, E., Murekezi, A., Katsvairo, L., Diressie, M. T., Nkundimana, J. D., et al. (2016). Radio messaging frequency, information framing, and consumer willingness to pay for biofortified Iron beans: evidence from revealed preference elicitation in rural Rwanda: consumers willingness to pay for biofortified Iron beans. Can J Agric Econ Can Agroeconomie. 64, 613–652. doi: 10.1111/cjag.12105
Otieno, D. J., and Ogutu, S. O. (2020). Consumer willingness to pay for chicken welfare attributes in Kenya. J Int Food Agribus Mark. 32, 379–402. doi: 10.1080/08974438.2019.1673275
Owuor, A. A., Otieno, D. J., Okello, J. J., Oluoch-Kosura, W., and Dufour, D. (2023). Assessment of consumers’ preference for orange-fleshed sweet potato puree chapati: a case of rural and urban consumers in Kenya. J. Sci. Food Agric. doi: 10.1002/jsfa.12734
Parker, M. N., Lopetcharat, K., and Drake, M. A. (2018). Consumer acceptance of natural sweeteners in protein beverages. J. Dairy Sci. 101, 8875–8889. doi: 10.3168/jds.2018-14707
Pattanayak, A., Roy, S., Sood, S., Iangrai, B., Banerjee, A., Gupta, S., et al. (2019). Rice bean: a lesser known pulse with well-recognized potential. Planta 250, 873–890. doi: 10.1007/s00425-019-03196-1
Petrontino, A., Frem, M., Fucilli, V., Labbate, A., Tria, E., and Bozzo, F. (2023). Ready-to-eat innovative legumes snack: the influence of nutritional ingredients and labelling claims in Italian consumers’ choice and willingness-to-pay. Nutrients 15:1799. doi: 10.3390/nu15071799
Ridier, A., Roussy, C., and Chaib, K. (2021). Adoption of crop diversification by specialized grain farmers in South-Western France: evidence from a choice-modelling experiment. Rev Agric Food Environ Stud. 102, 265–283. doi: 10.1007/s41130-021-00144-0
Saint-Eve, A., Irlinger, F., Pénicaud, C., Souchon, I., and Marette, S. (2021). Consumer preferences for new fermented food products that mix animal and plant protein sources. Food Qual. Prefer. 90:104117. doi: 10.1016/j.foodqual.2020.104117
Scarpa, R., and Rose, J. M. (2008). Design efficiency for non-market valuation with choice modelling: how to measure it, what to report and why*. Aust. J. Agric. Resour. Econ. 52, 253–282. doi: 10.1111/j.1467-8489.2007.00436.x
Shibia, A, Omanyo, D, Chemnyongoi, H, Kihiu, E, Waweru, G, Onsomu, E, et al. Kenya Economic Report 2023 Cost of Living and the Role of Markets. Nairobi, Kenya: Kenya Institute for Public Policy Research and Analysis (KIPPRA) (2023).
Talsma, E. F., Melse-Boonstra, A., and Brouwer, I. D. (2017). Acceptance and adoption of biofortified crops in low- and middle-income countries: a systematic review. Nutr. Rev. 75, 798–829. doi: 10.1093/nutrit/nux037
von Grebmer, K, Wiemers, M, Reiner, L, Bachmeier, M, Hanano, A, Towey, O, et al. (2022) Global Hunger Index: Food systems Transformation and Local Governance. Bonn: Welthungerhilfe (WHH), Dublin: Concern Worldwide (2022).
Wanyama, R., Gödecke, T., Jager, M., and Qaim, M. (2019). Poor consumers’ preferences for nutritionally enhanced foods. Br. Food J. 121, 755–770. doi: 10.1108/BFJ-09-2018-0622
Keywords: food, security, rice, beans, consumer, preferences, choice, experiment
Citation: Ayieko DMO, Otieno DJ, Makokha S and Oluoch-Kosura W (2024) Understanding consumer preferences for rice beans for enhanced food security: a choice experiment approach in western Kenya. Front. Sustain. Food Syst. 8:1334707. doi: 10.3389/fsufs.2024.1334707
Edited by:
Christian Bux, University of Bari Aldo Moro, ItalyReviewed by:
Charles Karani, Egerton University, KenyaCopyright © 2024 Ayieko, Otieno, Makokha and Oluoch-Kosura. This is an open-access article distributed under the terms of the Creative Commons Attribution License (CC BY). The use, distribution or reproduction in other forums is permitted, provided the original author(s) and the copyright owner(s) are credited and that the original publication in this journal is cited, in accordance with accepted academic practice. No use, distribution or reproduction is permitted which does not comply with these terms.
*Correspondence: David Michael Ochieng Ayieko, YXlpZWtvZGF2QGdtYWlsLmNvbQ==
Disclaimer: All claims expressed in this article are solely those of the authors and do not necessarily represent those of their affiliated organizations, or those of the publisher, the editors and the reviewers. Any product that may be evaluated in this article or claim that may be made by its manufacturer is not guaranteed or endorsed by the publisher.
Research integrity at Frontiers
Learn more about the work of our research integrity team to safeguard the quality of each article we publish.