 Dainan Hou1
 Xin Wang2,3*
- 1School of Business, Minnan Normal University, Zhangzhou, China
- 2College of Life Science, Longyan University, Longyan, China
- 3Chinese International College, Dhurakij Pundit University, Bangkok, Thailand
Introduction: China is the world’s largest producer and consumer of vegetables, with all provinces, cities, and autonomous regions cultivating vegetables. The main production areas for winter and spring vegetables have higher accumulated temperatures, allowing for multiple planting seasons throughout the year. Therefore, this article examines the competitiveness of vegetable production in China’s main winter and spring vegetable producing areas from the perspective of the dynamic evolution of comparative advantages.
Methods: Drawing on statistical data from 2000 to 2018 on the development of the vegetable industry in these key provinces, our analysis incorporates methods such as the Resource Endowment Coefficient, the Comprehensive Comparative Advantage Index, the entropy method, and systematic cluster analysis to explore the evolution of competitive advantages in vegetable production across various provinces and cities.
Results and discussion: The findings reveal significant regional disparities in resource endowments and overall advantages in vegetable production during the winter and spring seasons. Notably, Chongqing, Hubei Province, and Shanghai exhibit a Resource Endowment Factor (EF) averaging above 1, indicating a relative abundance of production resources and a comparative advantage. Similarly, Hainan Province, the Guangxi Zhuang Autonomous Region, Guangdong Province, Fujian Province, Shanghai, and Zhejiang Province each demonstrate an average Comprehensive Advantage Index (AAI) exceeding 1, affirming their comprehensive comparative strengths. Overall, the competitiveness of vegetable production in these regions exhibits a fluctuating yet ascending trend, with notable disparities in competitive strengths across different areas. The ranking of annual average competitiveness scores in vegetable production is as follows: Shanghai > Zhejiang > Hubei > Hunan > Guangdong > Sichuan > Chongqing > Fujian > Guangxi > Jiangxi > Hainan > Yunnan. Based on these outcomes, the study proposes tailored strategic recommendations for provinces and cities according to their unique resource endowments and comparative advantages, aiming to enhance the sector’s productivity and competitive stance.
1 Introduction
Vegetables are one of the main agricultural products for daily consumption (Ito et al., 2014), which can meet people’s basic needs of balanced nutrition and diet. In China, there are many kinds of vegetables with a long planting history (Su and Jiang, 2009). In recent years, the development of China’s vegetable industry has achieved remarkable results, playing a positive role in ensuring the living needs of urban and rural people and promoting farmers to increase their income and get rich. At present, with the deepening of agricultural supply side structural reform, China’s agricultural development has entered a new stage of accelerating transformation and upgrading, which puts forward new requirements for the development of vegetable production.
China is the world’s largest vegetable producer and consumer (Bao et al., 2018). Vegetables are grown in 31 provinces and regions of China. Due to the vast territory of China, spanning six temperate zones, natural conditions between provinces, especially the soil, water resources, climate, and other conditions show great differences. In regions with lower accumulated temperatures, vegetable cultivation can only be carried out once a year, or multiple seasons per year can be achieved through the use of greenhouses. However, greenhouse vegetables come with high costs and limited yields. In contrast, areas with higher accumulated temperatures can support multi-season cultivation annually. During the winter in China, the “South-to-North Vegetable Transport” initiative enriches the diets of people in the north. The main vegetable production areas during the winter and spring seasons are concentrated in the provinces of China with higher accumulated temperatures, capable of multi-season cultivation. These areas serve as the primary bases for the “South-to-North Vegetable Transport.” The relatively favorable temperature conditions and experience in multi-season cultivation prompt us to consider whether these factors can form a competitive advantage in vegetable production. This article focuses on the major vegetable-producing areas during the winter and spring seasons, exploring the competitive strengths of vegetable production in these regions.
There is abundant literature on vegetable production, including the research on vegetable production conditions and production technology. Russo et al. studied the effects of mulching on soil erosion and vegetable yields in fall and spring (Russo et al., 1997). Li et al. (2019) studied the changes of soil physical and chemical properties in greenhouse vegetable intensive cultivation regions in northern China. Wang et al. (2017) studied the effects of biological modifiers on vegetable production. Chen et al. (2004) analyzed the fertilizer use of vegetable production in the background area and evaluated the soil fertility. Sabzalian et al. (2014) studied red-blue LED incubators for high performance indoor plant production of vegetables, flowers, and medicinal plants and learned about local vegetable production. Walters et al. (2012) rebuilt the agricultural economy of Afghanistan and the vegetable production in Balkh province.
From the current research progress, the research on vegetable production and industrial development has important theoretical value and policy significance. The existing research status is that there is a lot of research on vegetable production conditions and vegetable production technology. Most of the research on vegetable production competitiveness is static analysis on export competitiveness, but there is no dynamic analysis (Li et al., 2015; Choudhary et al., 2017). In the selection of research methods and indicators, the comparative advantage research method is mostly used to further analyze the competitiveness by analyzing the comparative advantage index (Ma et al., 2020; Mao et al., 2022). This method has some one-sidedness and cannot comprehensively measure competitiveness. Therefore, we should find some breakthroughs in research perspective and research design. Based on the above analysis, in the context of China’s supply-side reform, this paper empirically investigated the vegetable production competitiveness of main winter and spring vegetable production regions (12 provinces, municipalities, and autonomous regions) in China from 2000 to 2018.
Compared with the existing literature, the contribution of this paper is mainly reflected in the following two aspects:
Firstly, from the perspective of research, unlike previous studies that focused on vegetable production within individual provinces, this paper examines regional production from the perspective of seasonal production. China’s vast territory spans several climatic zones, and some provinces cannot engage in large-scale vegetable planting during winter. As a result, winter and spring vegetable production becomes particularly significant. Therefore, the research area of this paper is China’s main winter and spring vegetable production regions.
Secondly, it reflects dynamic changes. Compared to existing literature, this paper includes an analysis of vegetable production during the research period and utilizes several methodological approaches: the resource endowment coefficient and the comprehensive comparative advantage index. Additionally, it constructs an evaluation indicator system from three dimensions—core competitiveness, potential competitiveness, and auxiliary competitiveness—and applies the entropy method to measure the competitiveness of vegetable production. This multi-dimensional approach aims to dynamically evaluate the competitiveness of vegetable production, effectively reflecting its dynamic changes.
The structure of the rest of this paper: Section 2 introduces the literature review, section 3 analyzes the current situation of vegetable production in the main producing regions of winter and spring vegetables in China, section 4 introduces the research methods and data sources, section 5 introduces the comparative analysis process and results of vegetable production competitiveness in the main producing regions of winter and spring vegetables, and section 6 concludes and puts forward suggestions.
2 Literature review
This paper makes a literature review on the competitiveness of vegetable production. The existing research mainly includes two aspects:
The first aspect of research focuses on regional vegetable production characteristics and the industrial situation. Choudhary et al. (2017) examined the profitability of Indian mountain vegetables, specifically studying four vegetables (pea, cabbage, kidney bean, and tomato) in the Dhari block of Nainital district, Uttarakhand. The study highlighted the benefits of vegetable cultivation in this area. Li et al. (2015), utilizing county data and ArcGIS software, analyzed the pattern and historical changes of vegetable production in the Beijing-Tianjin-Hebei region of China. They employed methods such as the Lorenz curve and Gini coefficient to investigate the production trends. Ma et al. (2020) analyzed the vegetable industry situation in Hunan province, emphasizing the need to leverage the advantages of characteristic vegetable resources and optimize the distribution of vegetable regions and varieties. Mao et al. (2022) examined the comparative advantages of vegetable production regions in 16 prefectures and cities of Yunnan province. Ozkan et al. (2004) analyzed the input–output dynamics of greenhouse vegetable production in Antalya, Turkey. Silva et al. (2020) analyzed the yield and income of a carrot and vegetable cowpea combination under green fee use and spatial layout.
The second aspect of research focuses on the analysis and promotion of vegetable competitiveness. Jaffee and Masakure (2005) reported significant differences in consumer preferences, structural dynamics, attention to and implementation of food safety standards, and other factors in the European fresh agricultural product market. They explored how major suppliers/exporters in Kenya and other developing countries can improve their international competitiveness. Stefan and Ferto (2016) used the comparative advantage index to analyze the levels and compositions of export competitiveness of European Union (EU-27) member states in differentiated fruit and vegetable products. Valpiani et al. (2015) studied the supply mode and price competitiveness of fruits and vegetables in farmers’ markets, roadside stands, and conventional supermarkets. They found that supermarkets in central and eastern North Carolina were more accessible for common fruits and vegetables compared to direct retail outlets. The price competitiveness of direct retail outlets varied for different fruits and vegetables. Riedel et al. (2009) analyzed the coordination of relationships in the horticulture business and its impact on competitiveness. Qtaishat et al. (2019) studied the competitiveness of vegetables produced in Jordan and exported to the Gulf countries using five competitive advantage indicators: export market share (EMS), displayed comparative advantage (RCA), trade entropy index (TEI), comparative export performance (CEP), and export performance index (EPI). Morris et al. (2013) analyzed the challenges and opportunities to enhance the competitiveness of vegetable production in Cambodia. Stoeva (2015) studied the competitiveness of Bulgarian vegetable crop production under the influence of the Common Agricultural Policy (CAP). Dhehibi and Frija (2009) used the domestic resource cost (DRC) index to analyze the export competitiveness of Tunisian olive oil, citrus, and tomato industries. Dastagiri et al. (2014) analyzed the production trend, market efficiency, and export competitiveness of Indian vegetables. They proposed that the Indian government should prioritize vegetable production, processing, and export. Li (2014) calculated and analyzed the trade competitiveness of China’s main export vegetable varieties using the international market share (IMS) and trade competitiveness index (TCI). Fonsah and Awondo (2013) studied the future domestic and international competitiveness of the southern fruit and vegetable industry. Ion et al. (2008) studied the competitiveness of Romanian vegetables and fruits in the external market.
To summarize, the existing literature provides valuable theoretical and empirical references for this paper. However, there are several areas that require further study. Firstly, the existing literature on vegetable competitiveness lacks a dynamic perspective. This paper addresses this gap by utilizing panel data and employing comprehensive methods such as the resource endowment coefficient, comprehensive comparative advantage index, and entropy method to dynamically analyze vegetable competitiveness. Secondly, the existing literature tends to have a one-sided approach in measuring vegetable production competitiveness. Previous studies often rely on the principle of comparative advantage and use the comparative advantage index alone, which may lead to incomplete results and analysis. In contrast, this paper employs three evaluation index systems—the resource endowment coefficient, comprehensive comparative advantage index, and vegetable production competitiveness—to comprehensively analyze vegetable competitiveness. Thirdly, the existing literature exhibits limited diversity in research methods. This paper takes a comprehensive approach by utilizing two indexes and employing comprehensive evaluation methods to study vegetable production competitiveness.
3 Analysis on the current production situation of China’s main winter and spring vegetable production regions
3.1 Planting area
In the research scope of this paper, which spans from 2000 to 2018, the vegetable planting area in the main winter and spring vegetable producing regions of China exhibited a fluctuating growth trend, mirroring the overall trend of national vegetable planting area. In 2000, the sown area of vegetables in these regions amounted to 7,417.37 square kilometers (khm2), accounting for 48.68% of the total vegetable sown area in China. By 2018, the sown area of vegetables in these regions had increased to 10,693.82 khm2, representing 52.32% of the total vegetable sown area in China. Moreover, during the period from 2000 to 2018, five provinces within the main winter and spring vegetable producing regions consistently had an average annual vegetable planting area of over 1,000 khm2. These provinces are Guangdong, Sichuan, Hunan, Hubei, and Guangxi Zhuang Autonomous Region.
As depicted in Figure 1, the growth rate of vegetable planting area in the main winter and spring vegetable producing regions of China exhibited a positive trend from 2001 to 2018, excluding the years 2004, 2007, and 2017. The overall fluctuation range during this period ranged from −4.39 to 4.92%, with an average growth rate of 2.05%. Yunnan province had the highest average growth rate of vegetable sown area in the region, standing at 6.68%, followed by Chongqing municipality at 4.63%, and Hunan province at 3.18%. Similarly, in China as a whole, the growth rate of vegetable planting area from 2001 to 2018, except for the years 2004, 2006, and 2010, also exhibited a positive trend with a significant fluctuation range. The overall fluctuation range during this period ranged from −6.16 to 10.49%, and the average growth rate was 1.65%.
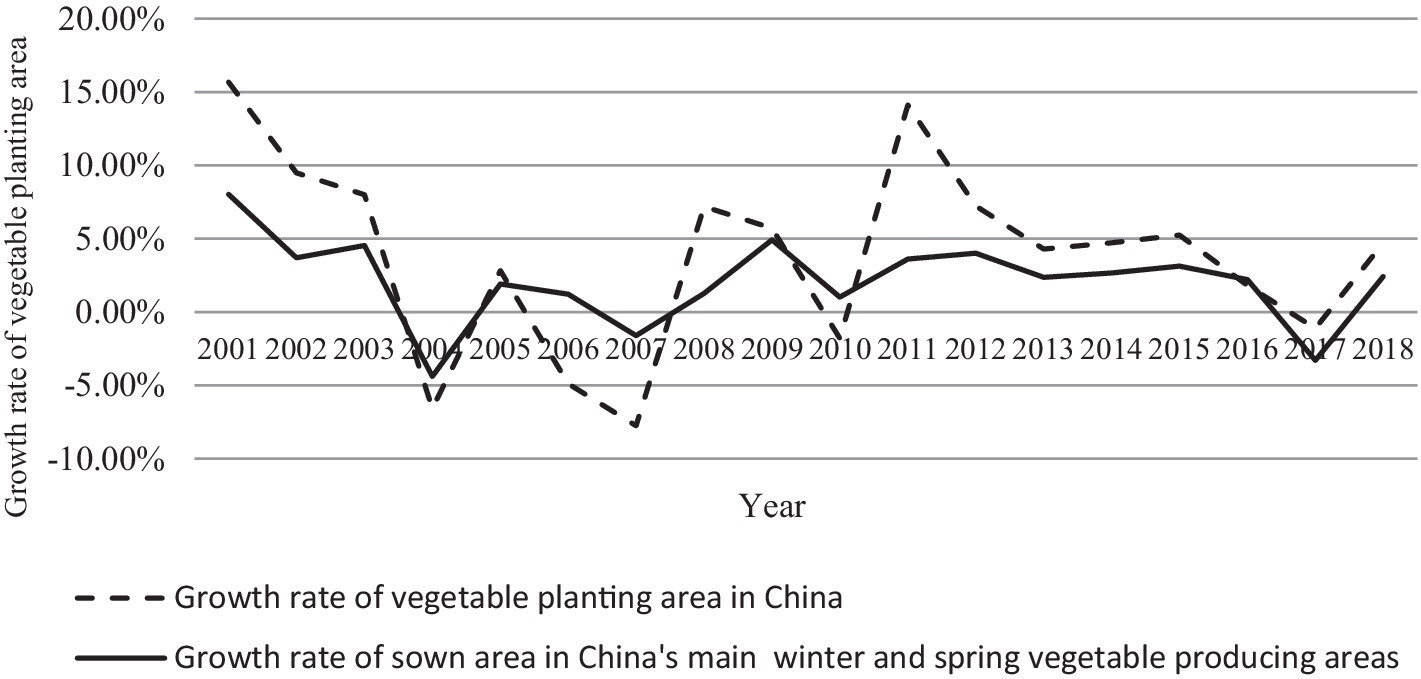
Figure 1. Growth rate of vegetable planting area in China’s main winter and spring vegetable producing regions (2001–2018). Data source: Statistical yearbook of provinces, cities, and autonomous regions in main winter and spring vegetable producing regions 1999–2019, China statistical yearbook 1999–2019.
3.2 Yield
From 2000 to 2018, the vegetable output in the main winter and spring vegetable producing regions of China demonstrated a fluctuating upward trend. The national vegetable output experienced an overall increase during this period, with a slight decline in 2006 but a subsequent continuous rise. The peak vegetable output within the range was achieved in 2016. In 2000, the vegetable output in the main winter and spring vegetable producing regions amounted to 16,382.23 million tons, representing 38.64% of the national vegetable output. By 2018, the vegetable output in these regions reached 28,768.49 million tons, accounting for 40.90% of the national vegetable output. Moreover, throughout the period from 2000 to 2018, five provinces and cities within the main winter and spring vegetable producing regions of China maintained a vegetable output exceeding 20 million tons. These provinces and cities are Hubei, Sichuan, Hunan, Guangdong, and Guangxi Zhuang Autonomous Region.
As depicted in Figure 2, the vegetable output in the main winter and spring vegetable producing regions of China followed a similar trend to the growth rate of national vegetable output, but the national output exhibited significant fluctuations. From 2001 to 2018 (excluding 2004 and 2007), the growth rate of vegetable output in the main regions was consistently positive, with an overall fluctuation range of −4.98 to 7.00% and an average growth rate of 3.18%. Among the provinces, Yunnan province (7.65%), Chongqing municipality (5.20%), and Hunan province (4.34%) had the highest average growth rates. During the same period (excluding 2006 and 2017), the growth rate of national vegetable output also showed positive values, with a fluctuation range of −13.29 to 14.00% and an average growth rate of 2.85%.
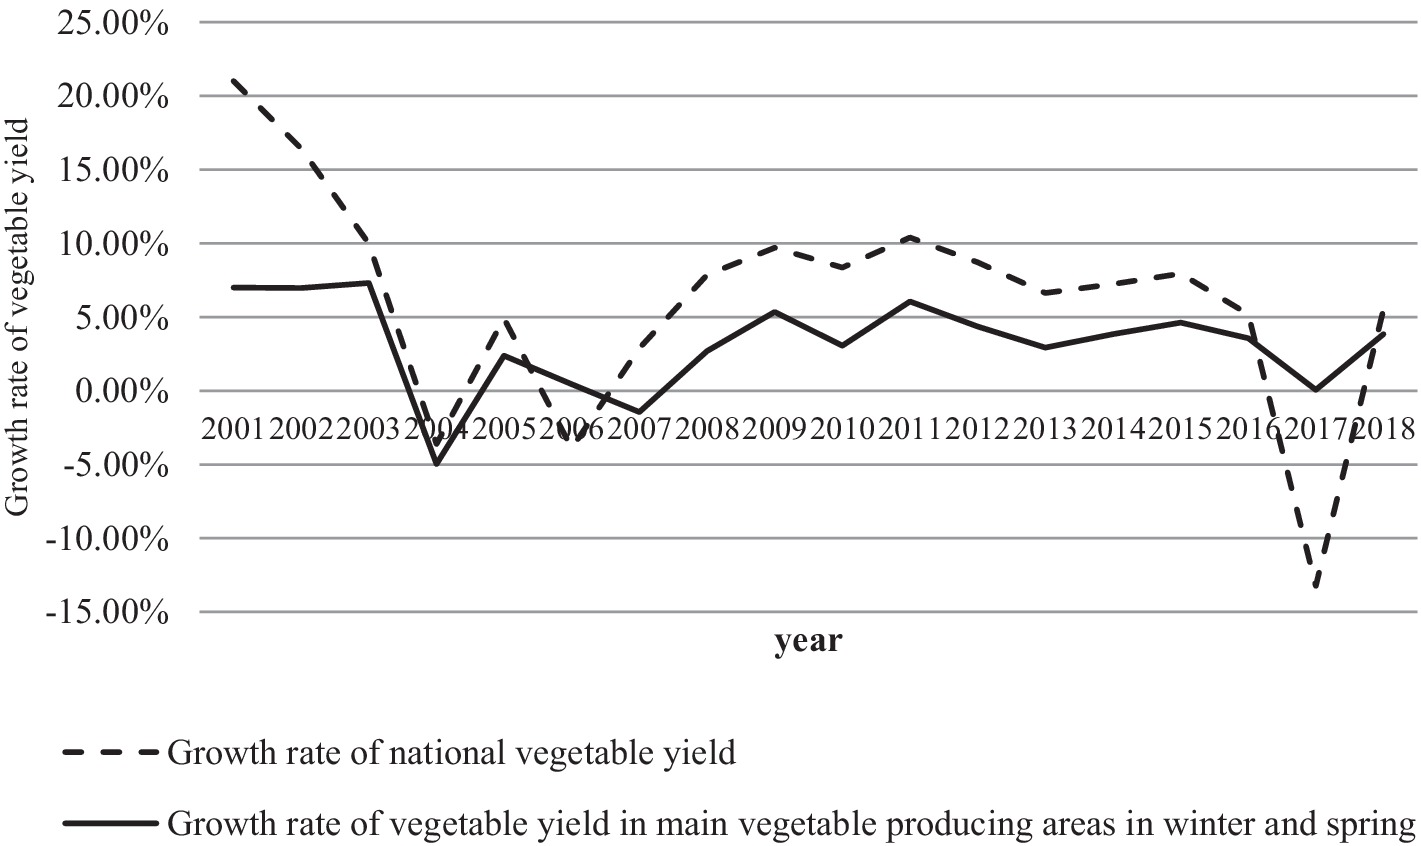
Figure 2. Growth rate of vegetable yield in China’s main winter and spring vegetable producing regions (2001–2018). Data source: Statistical yearbook of provinces, cities, and autonomous regions in main winter and spring vegetable producing regions 1999–2019, China statistical yearbook 1999–2019.
3.3 Total output value
Since some statistical data from 2000 to 2003 and 2018 are temporarily unavailable, this part analyzes and explains the total output value of vegetables from 2004 to 2017. As shown in Table 1, from 2004 to 2016, China’s main winter and spring vegetable production regions and the country’s total vegetable production continued to grow steadily, with a slight decrease in 2017. At the same time, within this range, the proportion of the total output value of vegetables in China’s main winter and spring vegetable production regions in the national total output value of vegetables is about 40%.
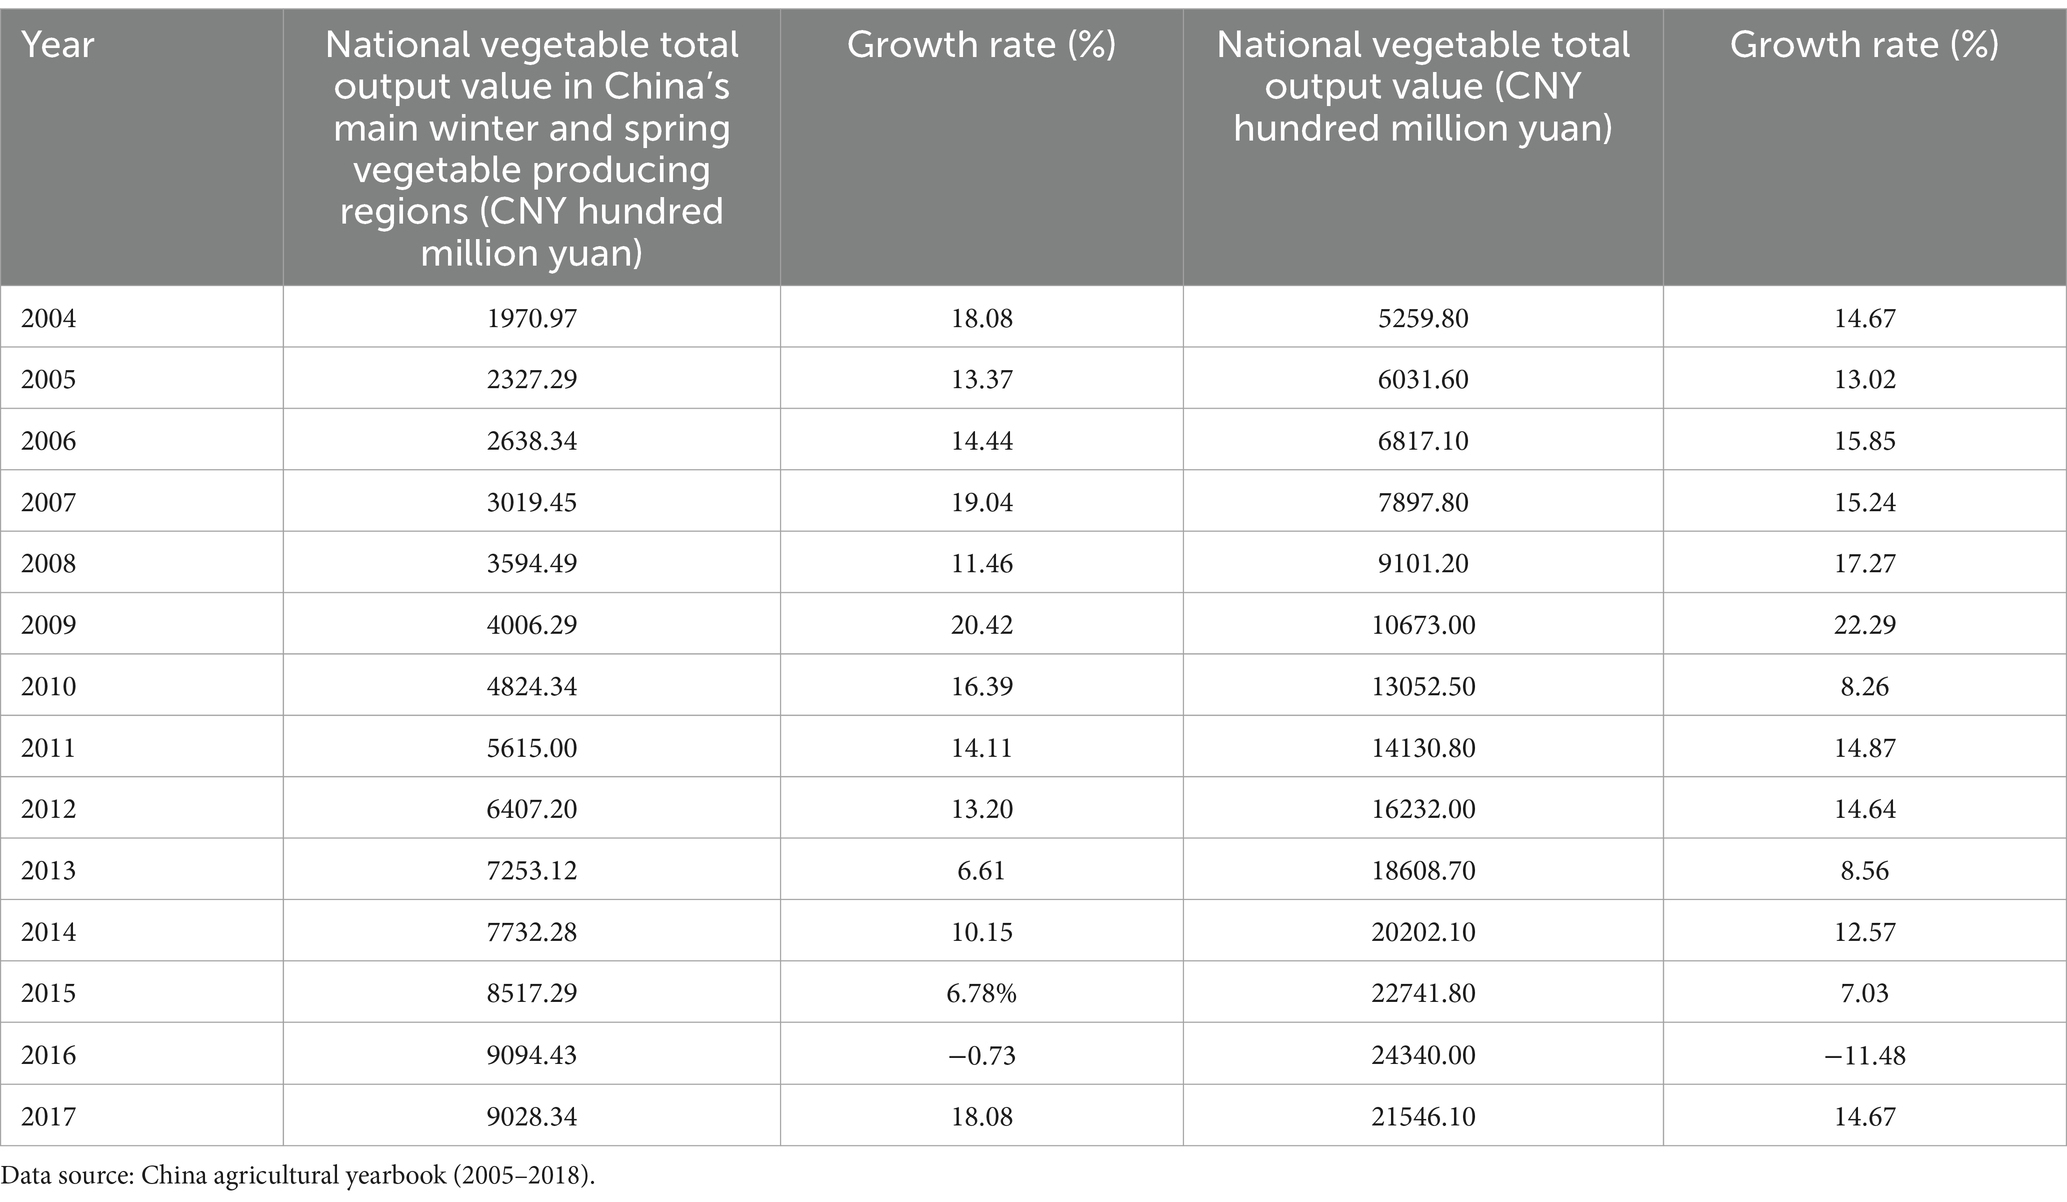
Table 1. National vegetable total output value and its growth rate in China’s main winter and spring vegetable producing regions (2004–2017).
Based on the provided information, the growth rate of the total output value of vegetables in China’s main winter and spring vegetable production regions from 2005 to 2017 follows a similar trend to that of the entire country. The growth rate of vegetable output value in the main winter and spring vegetable production regions ranges from −0.73 to 20.42%, with an average growth rate of 12.42%. Similarly, in the country as a whole, the growth rate of vegetable output value ranges from −11.48 to 22.29%, with an average growth rate of 11.46%. This suggests that both the main winter and spring vegetable production regions and the entire country experienced fluctuations in the growth rate of vegetable output value during the specified period, with generally positive growth rates.
4 Research methods and data sources
In terms of regional or national industry or product competitiveness, there are two main ideas. First, by using the advantage index, Chenery (1961) proposed in that resource allocation should be combined with comparative advantage. For example, Burianova and Belova (2012) and Hoang et al. (2017) used the comparative advantage index and the competitive advantage index when studying the comparative advantages of industries in different countries and regions. The second idea is to evaluate by concrete index or construct an evaluation index system, using principal component analysis, comprehensive evaluation method, and other methods. For example, Helmy (2010) adopts the Constant Market Share Analysis (CMSA) methodology; Martin and Duren (1991) adopted two indexes of market share and profit. Thorne (2005) uses income maximization as the standard to judge competitiveness. Mao et al. (2022) selected two indexes, international market share and trade competition index, and used the grey correlation method to compare and analyze the international competitiveness of the vegetable industry between China and five Lancang-Mekong countries. Qiao and Cui (2022) constructed an evaluation index system of vegetable industry competitiveness and analyzed regional competition of the vegetable industry in Shandong Province by using the factor analysis method.
4.1 Research method
4.1.1 Resource endowment coefficient analysis method
The resource endowment coefficient (EF) analysis method is a method to analyze the regional comparative advantage through the value of EF value. It is mainly used to reflect the measurement index of a country or region with relatively rich resources (Wang and Qi, 2018). Its calculation formula is:
Vjt is the vegetable output of j province in t period, and Vt is the vegetable output of the whole country in t period. Yjt is the total output value of j province in t period, and Yt is the total output value of the whole country in t period.
According to the characteristics of vegetable production reported in relevant literature, the value range and significance of EF are described as follows: if the value range of EF is (0, 1), it indicates that the region lacks comparative advantage in vegetable production resource endowment. If the EF value ranges from (1, 2), it indicates that the region has some comparative advantage in vegetable production resource endowment. If the EF value ranges from (2, +∞), it indicates that the region has a strong comparative advantage in vegetable production resource endowment.
4.1.2 Comprehensive comparative advantage index method
The comprehensive comparative advantage index method has the characteristics of clear meaning and simple calculation and has been applied by many scholars in the analysis of agricultural comparative advantage (Jiang et al., 2019). This method mainly calculates the comprehensive comparative advantage index, including efficiency advantage index (EAI), scale advantage index (SAI), and comprehensive advantage index (AAI), and calculates these three indexes to analyze the comparative advantage of a certain region (Li and Luo, 2002). The specific calculation formula and indicators are described as follows:
(1) The efficiency advantage index (EAI) refers to the ratio of the unit yield of vegetables in a certain region to the unit yield of all crops in the region in a certain period and the same ratio in another region in the same period. It reflects the comparative advantage of vegetable production efficiency in a certain region and reflects the vegetable production capacity under the comprehensive conditions of natural conditions, technical level, and material input in the region. Its calculation formula is:
is the efficiency advantage index, is the vegetable yield of i province, is the crop yield of i province, is the national vegetable yield, and is the national crop yield. If > 1, it means that compared with the national situation, the vegetable production efficiency in I province has a comparative advantage in efficiency. The greater , the more obvious the advantage; If < 1, it means that compared with the national situation, the vegetable production efficiency in i province is at a disadvantage. The smaller the value, the more obvious the disadvantage.
(2) The scale advantage index (SAI) refers to the ratio of the vegetable planting scale in a certain region to the crop planting scale in that region in a certain period and the same ratio in another region in the same period, reflecting the comparative advantage of the vegetable planting scale in a certain region. The scale advantage index is the result of the interaction of multiple reasons, such as natural endowment, market supply and demand, planting tradition, regional policies, and regulations, etc. The calculation formula is as follows:
is the scale advantage index, is the vegetable planting scale of i province, is the crop planting scale of i province, is the national vegetable planting scale, and is the national crop planting scale. If > 1, it indicates that the vegetable planting scale in i province has a comparative advantage compared with the national situation. The larger the is, the more obvious the advantage is; If < 1, it means that the vegetable planting scale of i province is inferior to that of the whole country. The smaller the value of , the more obvious the disadvantage.
(3) The comprehensive advantage index (AAI) is affected by efficiency advantage and scale advantage, and its calculation formula is:
is the comprehensive advantage index, > 1, indicating that compared with the national vegetable production, the vegetable production in i province has a comprehensive comparative advantage, and the greater the value, the more obvious the advantage. If < 1, it means that compared with the national vegetable production, the vegetable production in i province does not have a comprehensive comparative advantage. The smaller the value is, the more obvious the disadvantage is.
4.1.3 Entropy method
In this paper, the entropy method is used to calculate the weight of the evaluation index system of vegetable production competitiveness. The entropy method belongs to the objective weighting method, which can avoid weight error caused by subjective preference (Khaleie and Fasanghari, 2012; Idem and Burak, 2022). The specific calculation steps are as follows:
Step 1: Standardize indicators. Since the units and values of each indicator are quite different, the indicators are standardized to ensure the reliability of the evaluation results. The calculation formula is:
Where, and respectively represent the original value and standardized value of index j in the t year of the i province, and and are the maximum and minimum values of index j in the sample interval of 12 provinces, respectively.
Step 2: Calculate indicator weight The calculation process is as follows:
Calculate the proportion of the j index of the i province in the index in the t year:
Calculate the information entropy of the j index in the t year:
, . In this paper, n = 12, the value of M is .
Step 3: competitiveness evaluation. First, calculate the standardized scores of 9 indicators in t year, then calculate the product of the index weight and the standardized indicators, and finally calculate the weighted sum to obtain the score of the vegetable industry competitiveness of each province in t year.
Repeat the above steps to calculate the evaluation score of vegetable production competitiveness in China’s main winter and spring vegetable production regions.
4.1.4 Systematic cluster analysis
The system clustering method is the most commonly used method in cluster analysis. Its main principle is that in the initial stage, each sample is regarded as a class. According to the specified distance between samples and the distance between classes, the two nearest classes are combined into a new class (Fraley and Raftery, 1998), and then the distance between the new class and other classes is calculated. Repeat the merging of the two nearest classes, reducing one class each time until all samples are merged into one class (Peng and Zheng, 1999).
4.2 Construction of evaluation index system
As shown in Table 2, basis of a literature review and analysis of the current situation in winter and spring vegetable production regions, this paper constructs an evaluation index system from three dimensions: core competitiveness, potential competitiveness, and auxiliary competitiveness.
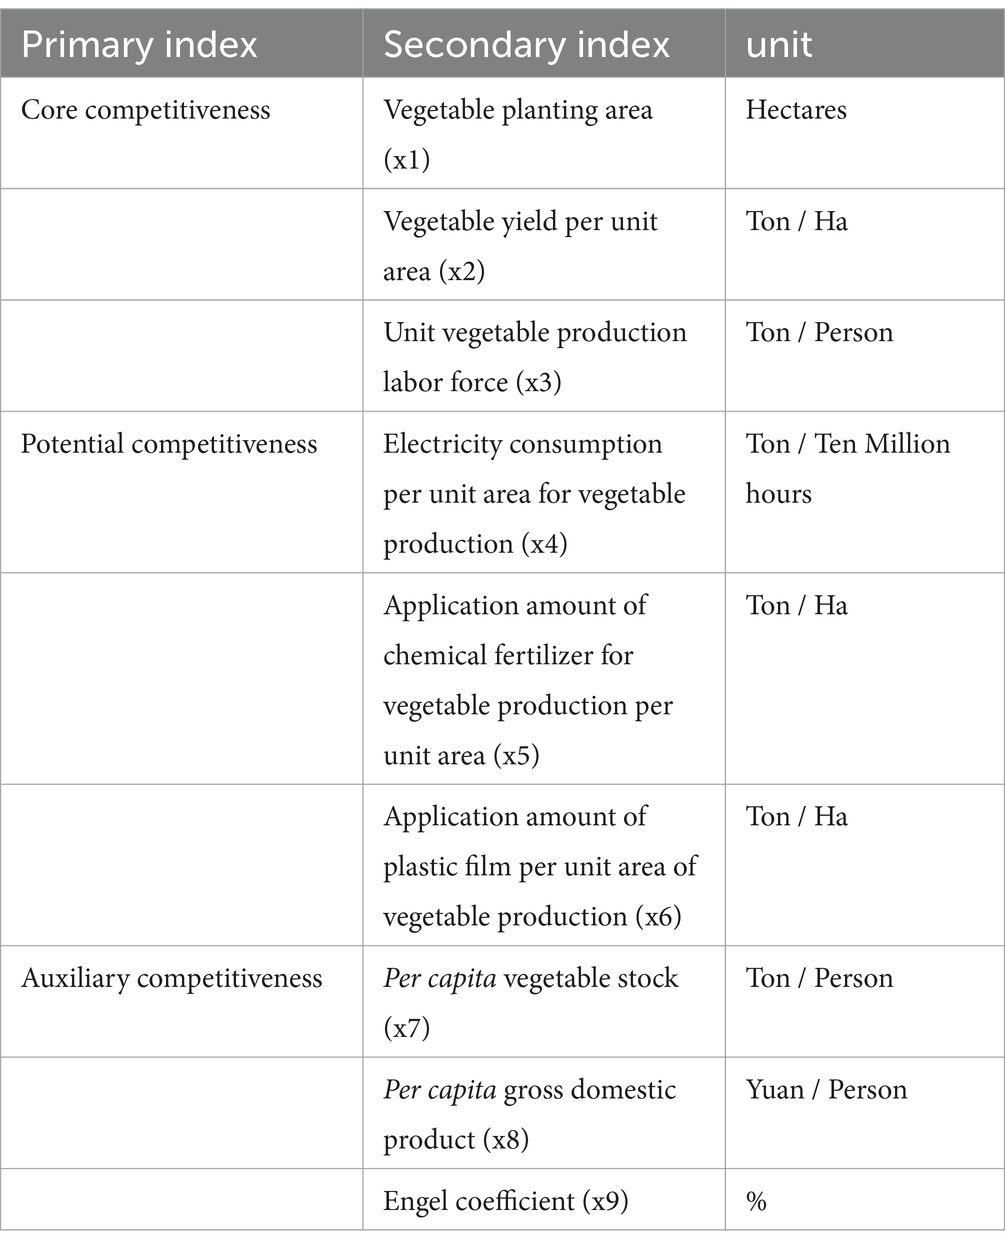
Table 2. Evaluation index system of vegetable production competitiveness.
4.3 Overview of the study area and data sources
4.3.1 Study area
In this study, the selection of provinces and cities in the main production regions of winter and spring vegetables is based on the planning and layout of China’s advantageous vegetable production regions in the national vegetable industry development plan (2011–2020) issued by the national development and reform commission and the ministry of agriculture in 2012. In the plan, two dominant regions of winter and spring vegetables are divided, namely, the dominant regions of winter and spring vegetables in South China and southwest hot regions (including Hainan, Guangdong, Guangxi, Fujian, southern Yunnan, Southern Guizhou, and Panxi region of Sichuan) and the dominant regions of winter and spring vegetables in the Yangtze River Basin (including Sichuan, Chongqing, Hubei, Hunan, Jiangxi, Zhejiang, Shanghai, central and southern Jiangsu, and southern Anhui). Therefore, 12 provinces, cities, and autonomous regions in the above-mentioned main production regions were selected as the study regions.
4.3.2 Data sources
The research data are from the China Statistical Yearbook (1999–2019), the statistical yearbook of provinces, cities, and autonomous regions in the study area (1999–2019), and the China Agricultural Yearbook (1999–2018). Some of the data in 2018 are from government work reports and authoritative websites.
The research time range is from 2000 to 2018. There are two reasons for choosing this time range. On the one hand, there is a serious lack of relevant research data before 2000. On the other hand, although the study area is selected according to the 2012 plan, the characteristics of the vegetable industry in the provinces and cities in the region can only be developed after time accumulation. Therefore, this study selected the above time range and study area.
5 Analysis of comprehensive competitiveness in vegetable production in main winter–spring vegetable producing areas
5.1 Analysis of resource endowment coefficient for vegetable production
The natural endowments of provinces in the main winter–spring vegetable producing areas differ, which impacts their vegetable production. Therefore, this paper first examines the resource endowment situation for vegetable production in these provinces. As shown in Table 3, according to the resource endowment coefficient calculation (Equation 1), the vegetable production resource endowment coefficients of provinces, cities, and autonomous regions in the main winter and spring vegetable producing regions from 2000 to 2018 are calculated. According to the average value of resource endowment coefficient (EF) of main winter and spring vegetable producing regions from 2000 to 2018, there are some differences in the resource endowment of vegetable production in major producing regions of provinces, cities, and autonomous regions, presenting a hierarchical nature.
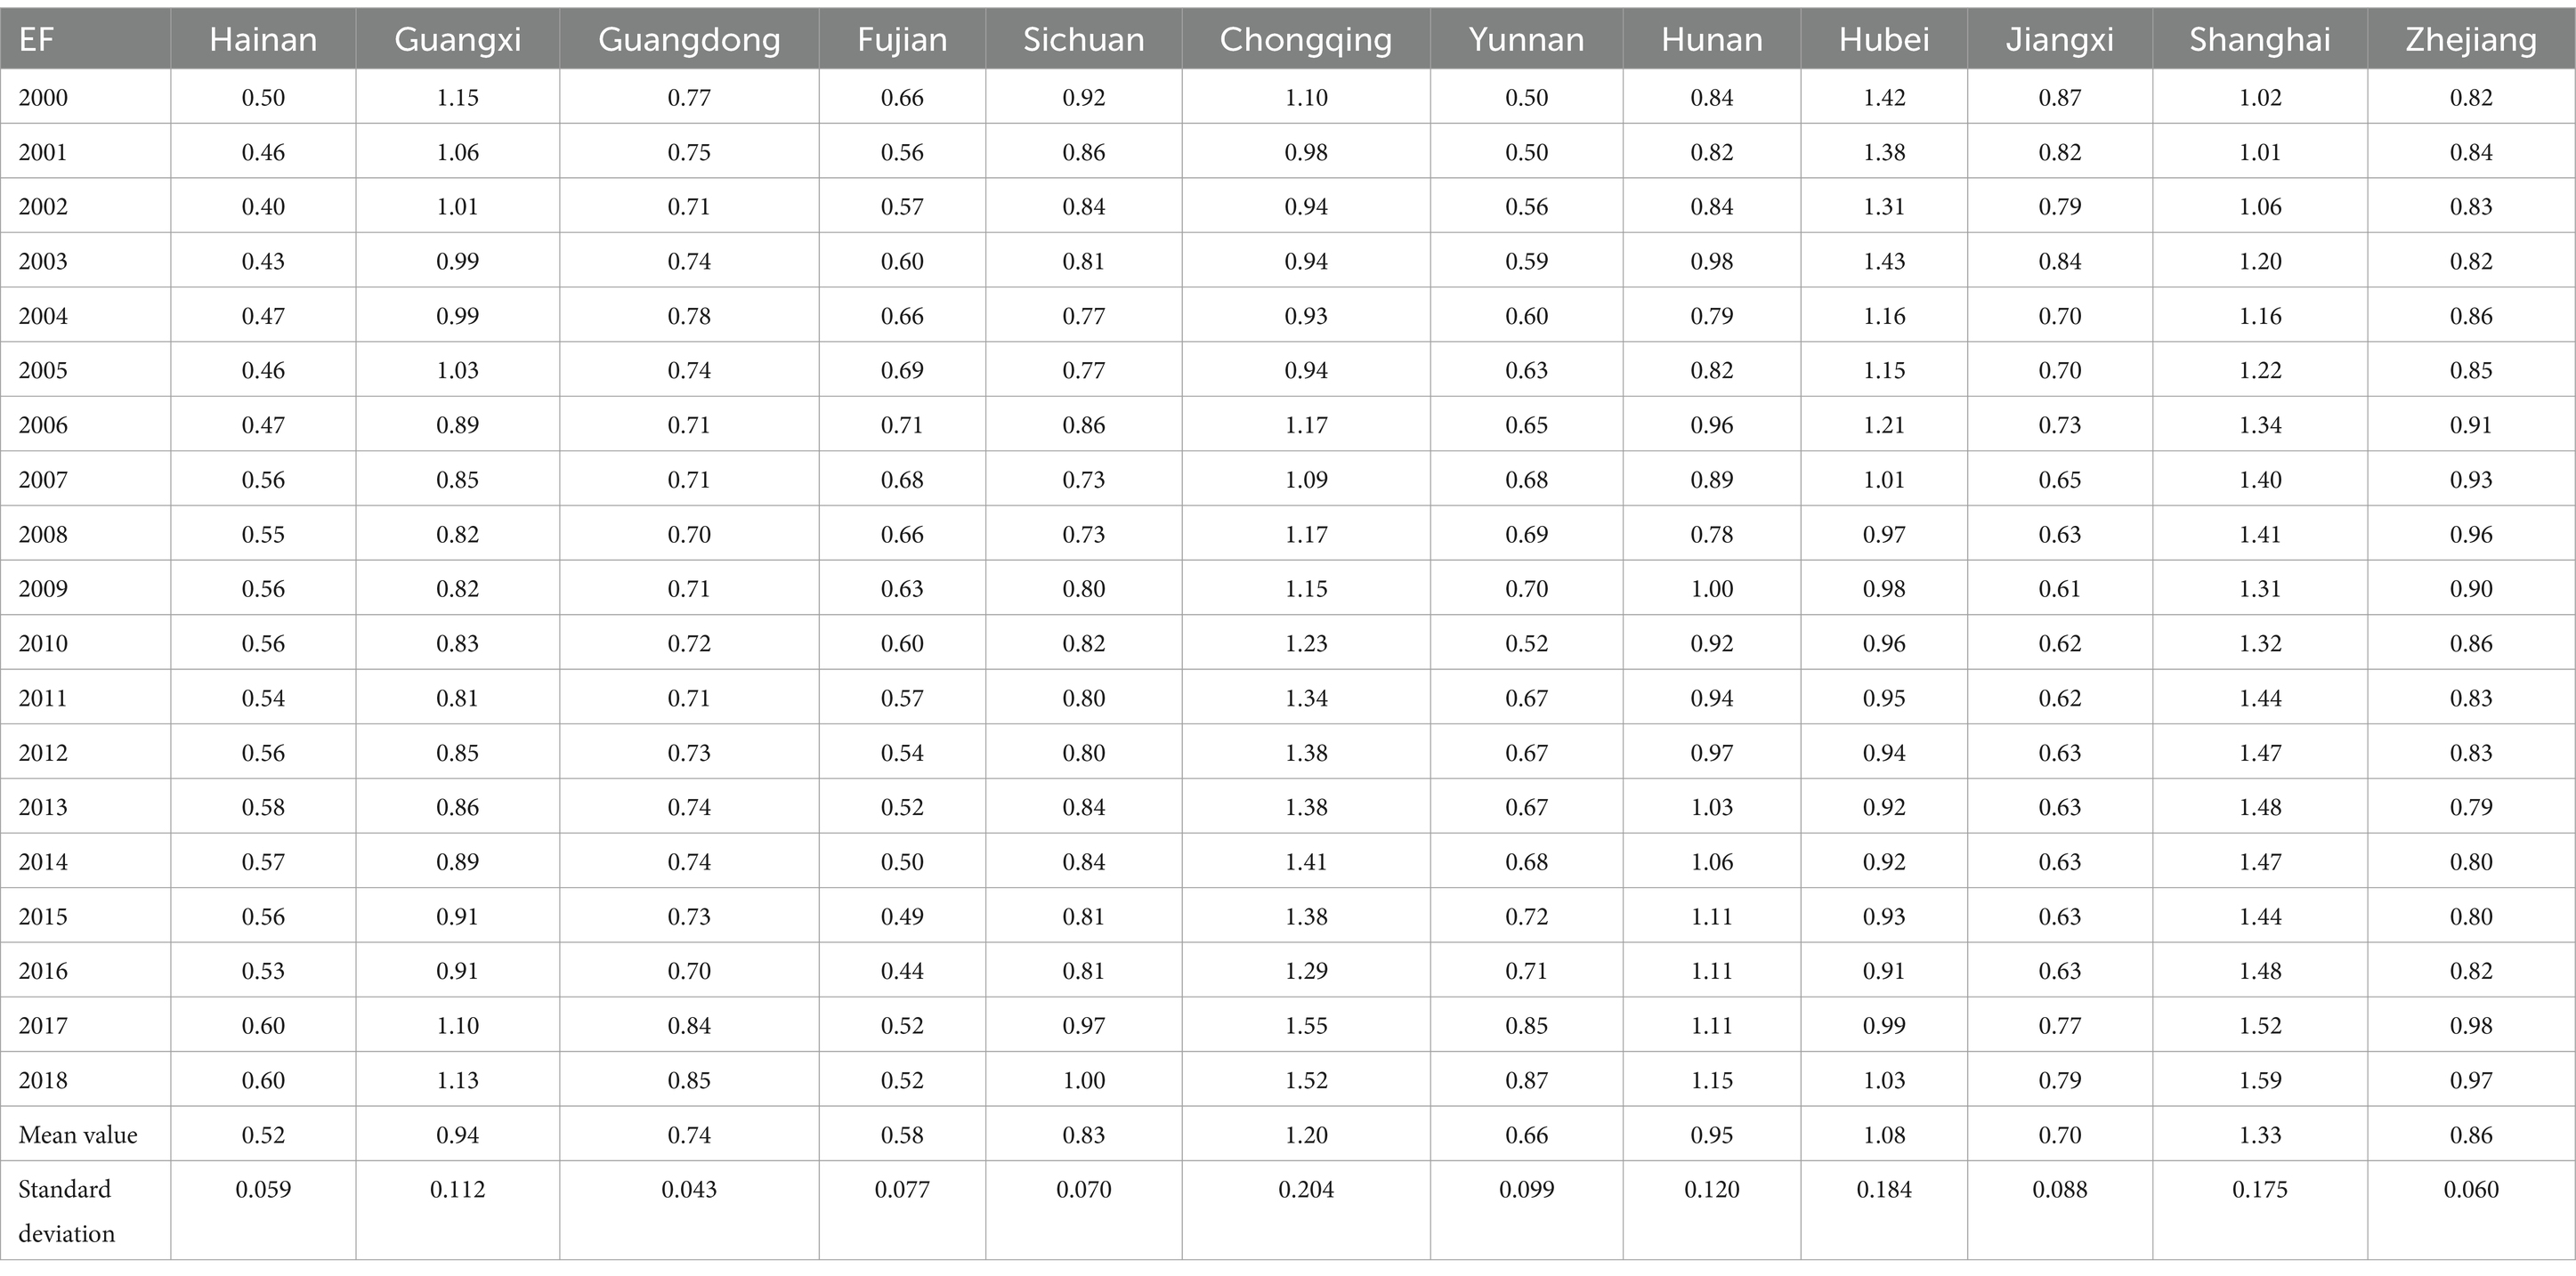
Table 3. Resource endowment coefficient (EF) of vegetable production in China’s main winter and spring vegetable producing regions (2000–2018).
According to the calculated values, the 12 main winter and spring vegetable producing regions are divided into three levels: The average EF value of Chongqing municipality, Shanghai municipality, and Hubei province is greater than 1, showing some comparative advantages in vegetable production resource endowment. The average EF of Guangxi Zhuang autonomous region and Hunan province is 0.94 and 0.95 respectively, which are close to 1, and there is no comparative advantage in vegetable production resource endowment (type I). The average EF of Hainan province, Guangdong province, Fujian province, Yunnan province, Jiangxi province, Zhejiang province, and Sichuan province is in the range of 0.52 ~ 0.86, and there is no comparative advantage in vegetable production resource endowment (type II).
Through further analysis of the calculation results of the endowment coefficient of vegetable production resources in the main winter and spring vegetable producing regions from 2000 to 2018, it is found that there are some amplitude fluctuations in the endowment coefficient of vegetable production resources in the main producing regions, including Guangxi Zhuang autonomous region, Hunan province, Hubei province, Chongqing municipality, and Shanghai municipality. Specifically, Shanghai municipality has a comparative advantage in vegetable production resource endowments within the research range. Chongqing municipality had a comparative advantage in vegetable production resource endowment in 2000 and 2006 ~ 2018, but did not have a comparative advantage in vegetable production resource endowment in 2001 ~ 2005, the EF value was above 0.9. Hubei province had some comparative advantages in vegetable production resource endowments from 2000 to 2007. Although it did not have comparative advantages in vegetable production resource endowments from 2008 to 2017, the EF value in this range was above 0.90, and it returned to the comparative advantage area in resource endowments in 2018. Guangxi Zhuang autonomous region, Sichuan province, and Hunan province have the comparative advantage of vegetable production resource endowment in some years within the study range and do not have the comparative advantage of resource endowment in other years. Hainan province, Guangdong province, Fujian province, Yunnan province, Jiangxi province, and Zhejiang province do not have the comparative advantage of vegetable production resource endowments within the study range.
5.2 Analyze comprehensive comparative advantages
As shown in Table 4, the efficiency comparative advantage (EAI), scale comparative advantage (SAI), and comprehensive advantage index (AAI) of provinces, cities, and autonomous regions in China’s main winter and spring vegetable production regions from 2000 to 2018 are calculated through (Equations 2–4).
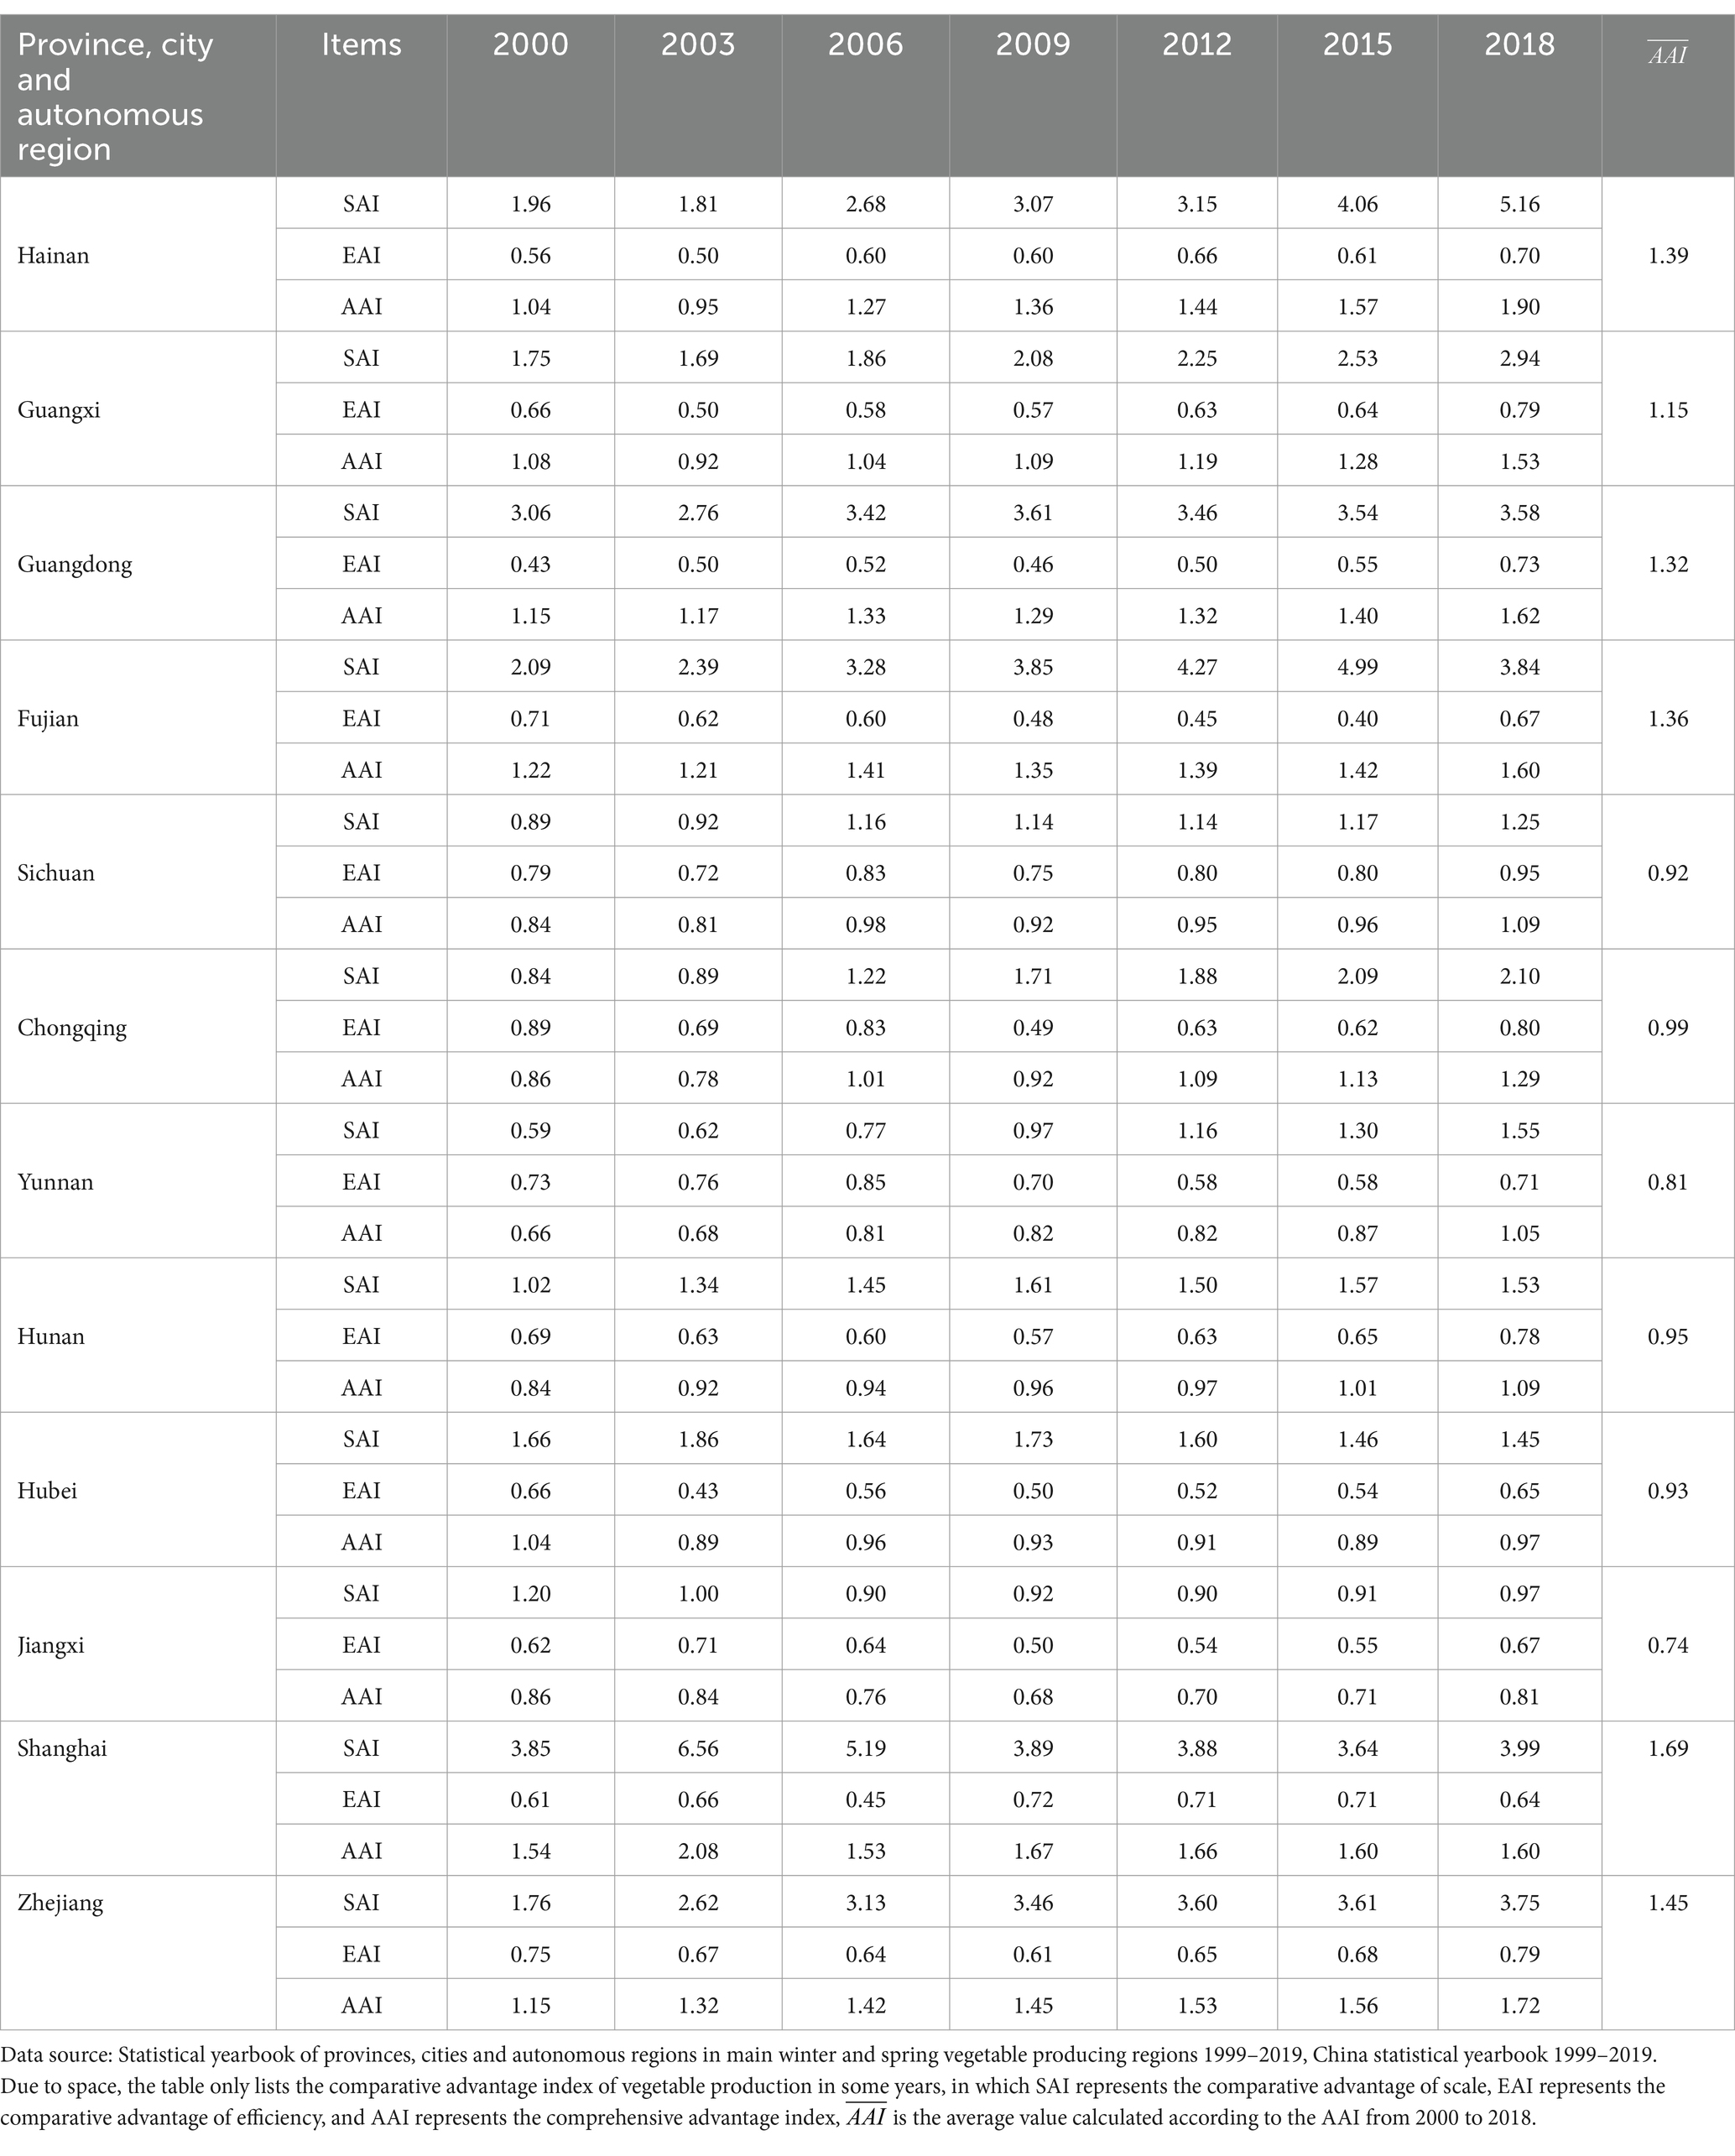
Table 4. Comparative advantage index of vegetable production in provinces, cities and autonomous regions of China’s main winter and spring vegetable producing regions.
5.2.1 Efficiency comparative advantage
The dominant index of vegetable production efficiency (EAI) of each province in the main winter and spring vegetable production regions within the study range is below 1, so it does not have the advantage of vegetable production efficiency. At the same time, EAI has the characteristics of volatility. The range of EAI in Chongqing municipality, Guangxi Zhuang autonomous region, Fujian province, and Guangdong province is large, which are 0.42, 0.38, 0.33, and 0.30, respectively.
5.2.2 Scale comparative advantage
Hainan province, Guangdong province, Fujian province, Hunan province, Hubei province, Zhejiang province, Guangxi Zhuang autonomous region, and Shanghai municipality have the advantage of vegetable planting scale with their vegetable production scale advantage index (SAI) greater than 1 within the study range. The vegetable production scale advantage index (SAI) of Sichuan province, Yunnan province, and Chongqing municipality in the study range generally shows an upward trend and has little fluctuation. Sichuan province and Chongqing municipality had no advantage in vegetable production scale (SAI > 1) during 2000–2005, Yunnan province had no advantage in vegetable production scale (SAI > 1) during 2000–2009, and other years had a comparative advantage in vegetable production scale (SAI > 1). Jiangxi province has the advantage of vegetable production scale from 2000 to 2003, but not from 2004 to 2018, but the SAI has been above 0.9.
5.2.3 Comprehensive comparative advantage
The average value of AAI of provinces, cities, and autonomous regions in the main production regions has obvious hierarchical characteristics. The average value of AAI of the provinces, cities, and autonomous regions in the main production regions can be divided into three levels: Hainan province, Guangdong province, Fujian province, Zhejiang province, Shanghai municipality, and Guangxi Zhuang autonomous region have a comprehensive comparative advantage. Sichuan province, Hunan province, Hubei province, and Chongqing municipality are between 0.90–1, less than 1. Although they do not have comprehensive comparative advantages, they have some potential. Yunnan Province and Jiangxi Province are 0.81 and 0.74 respectively, less than 1. They do not have comprehensive comparative advantages and have relatively weak potential.
From the time dimension of provinces, cities, and autonomous regions in the main producing regions, the comprehensive comparative advantage index (AAI) of vegetable production in Guangdong province, Fujian province, Zhejiang province, and Shanghai municipality showed a fluctuating upward trend and was greater than 1 from 2000 to 2018, indicating that the four main producing regions have comprehensive comparative advantages within the research range. Except 2003, Hainan province has a comprehensive comparative advantage with AAI greater than 1 and showing an upward trend in other years. Except for 2003, 2004 and 2007, Guangxi Zhuang autonomous region has a comprehensive comparative advantage with AAI greater than 1 in other years. From 2000 to 2010, Chongqing municipality has a comprehensive comparative advantage only in 2006 when the AAI is greater than 1, and other years do not have a comprehensive comparative advantage. However, from 2010 to 2018, the AAI of Chongqing municipality showed an upward trend and the value was greater than 1. During this period, Chongqing has a comprehensive comparative advantage. Within the study area, only a few years in Sichuan province, Yunnan province, Hunan province, and Hubei province have AAI greater than 1, and most years do not have comprehensive comparative advantages. The AAI of Sichuan province, Yunnan province, and Hunan province showed an upward trend, while the AAI of Hubei province showed a stable state of small fluctuations. With the study range, the AAI of Jiangxi province is less than 1, so it does not have a comprehensive comparative advantage, and the AAI value is in the range of 0.68–0.86, showing a trend of first decreasing and then increasing.
5.3 Evaluate competitiveness
5.3.1 Weight calculation
The entropy method in Section 3.1.3 is used to calculate the annual weight of each index in the evaluation index system of vegetable production competitiveness of 12 provinces and regions, and the calculation results are shown in Table 5.
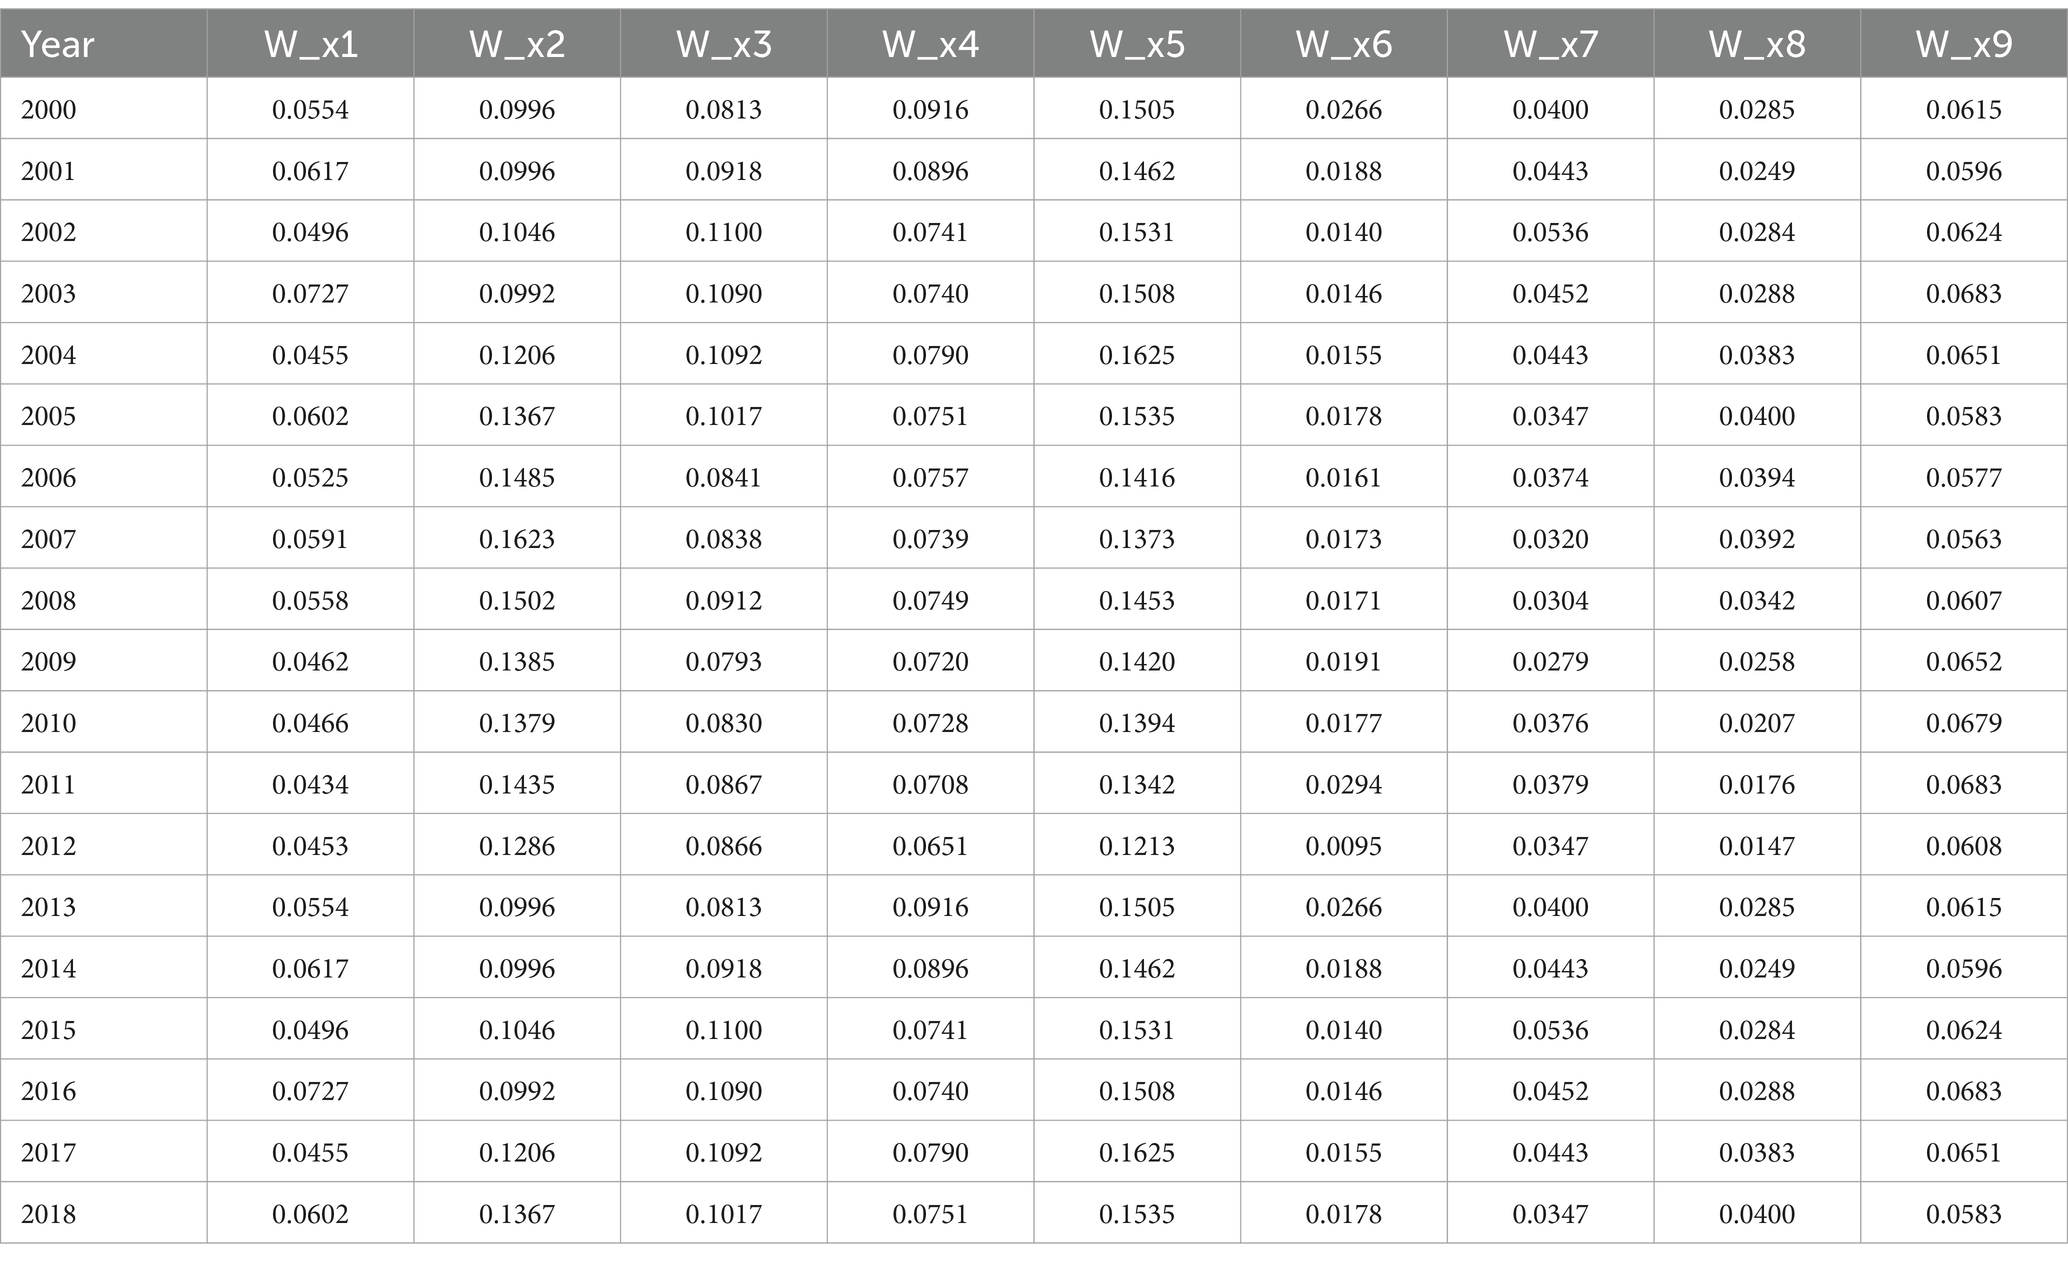
Table 5. Evaluation index weight of vegetable production competitiveness.
5.3.2 Analyze competitiveness
As shown in Table 6, the specific score of each province’s annual vegetable production competitiveness is calculated according to Equation 10. The greater the score competitiveness, the stronger the competitiveness. As shown in Figure 3, from the score point of view, during 2000–2018, the vegetable production competitiveness of provinces in the main winter and spring vegetable producing regions generally showed a fluctuating upward trend. The average annual score of the vegetable production competitiveness of Shanghai municipality, Zhejiang province, Hubei province, and Hunan province exceeded 0.55, that of Guangdong province, and Sichuan province exceeded 0.5, and that of Fujian province, Guangxi province, and Chongqing municipality ranged from 0.4 to 0.5 The average annual score of Hainan province vegetable production competitiveness is between 0.3–0.4, and that of Yunnan province is below 0.3. As shown in Figure 3, although the average annual score of the competitiveness of vegetable production in Jiangxi province, Hainan province, and Yunnan province is low, from the trend chart, the competitiveness score of the three vegetable production provinces shows a fluctuating rise, and it can be seen from the slope of the curve that the rising rate is faster. In addition, the competitiveness of vegetable production in various regions is unbalanced.
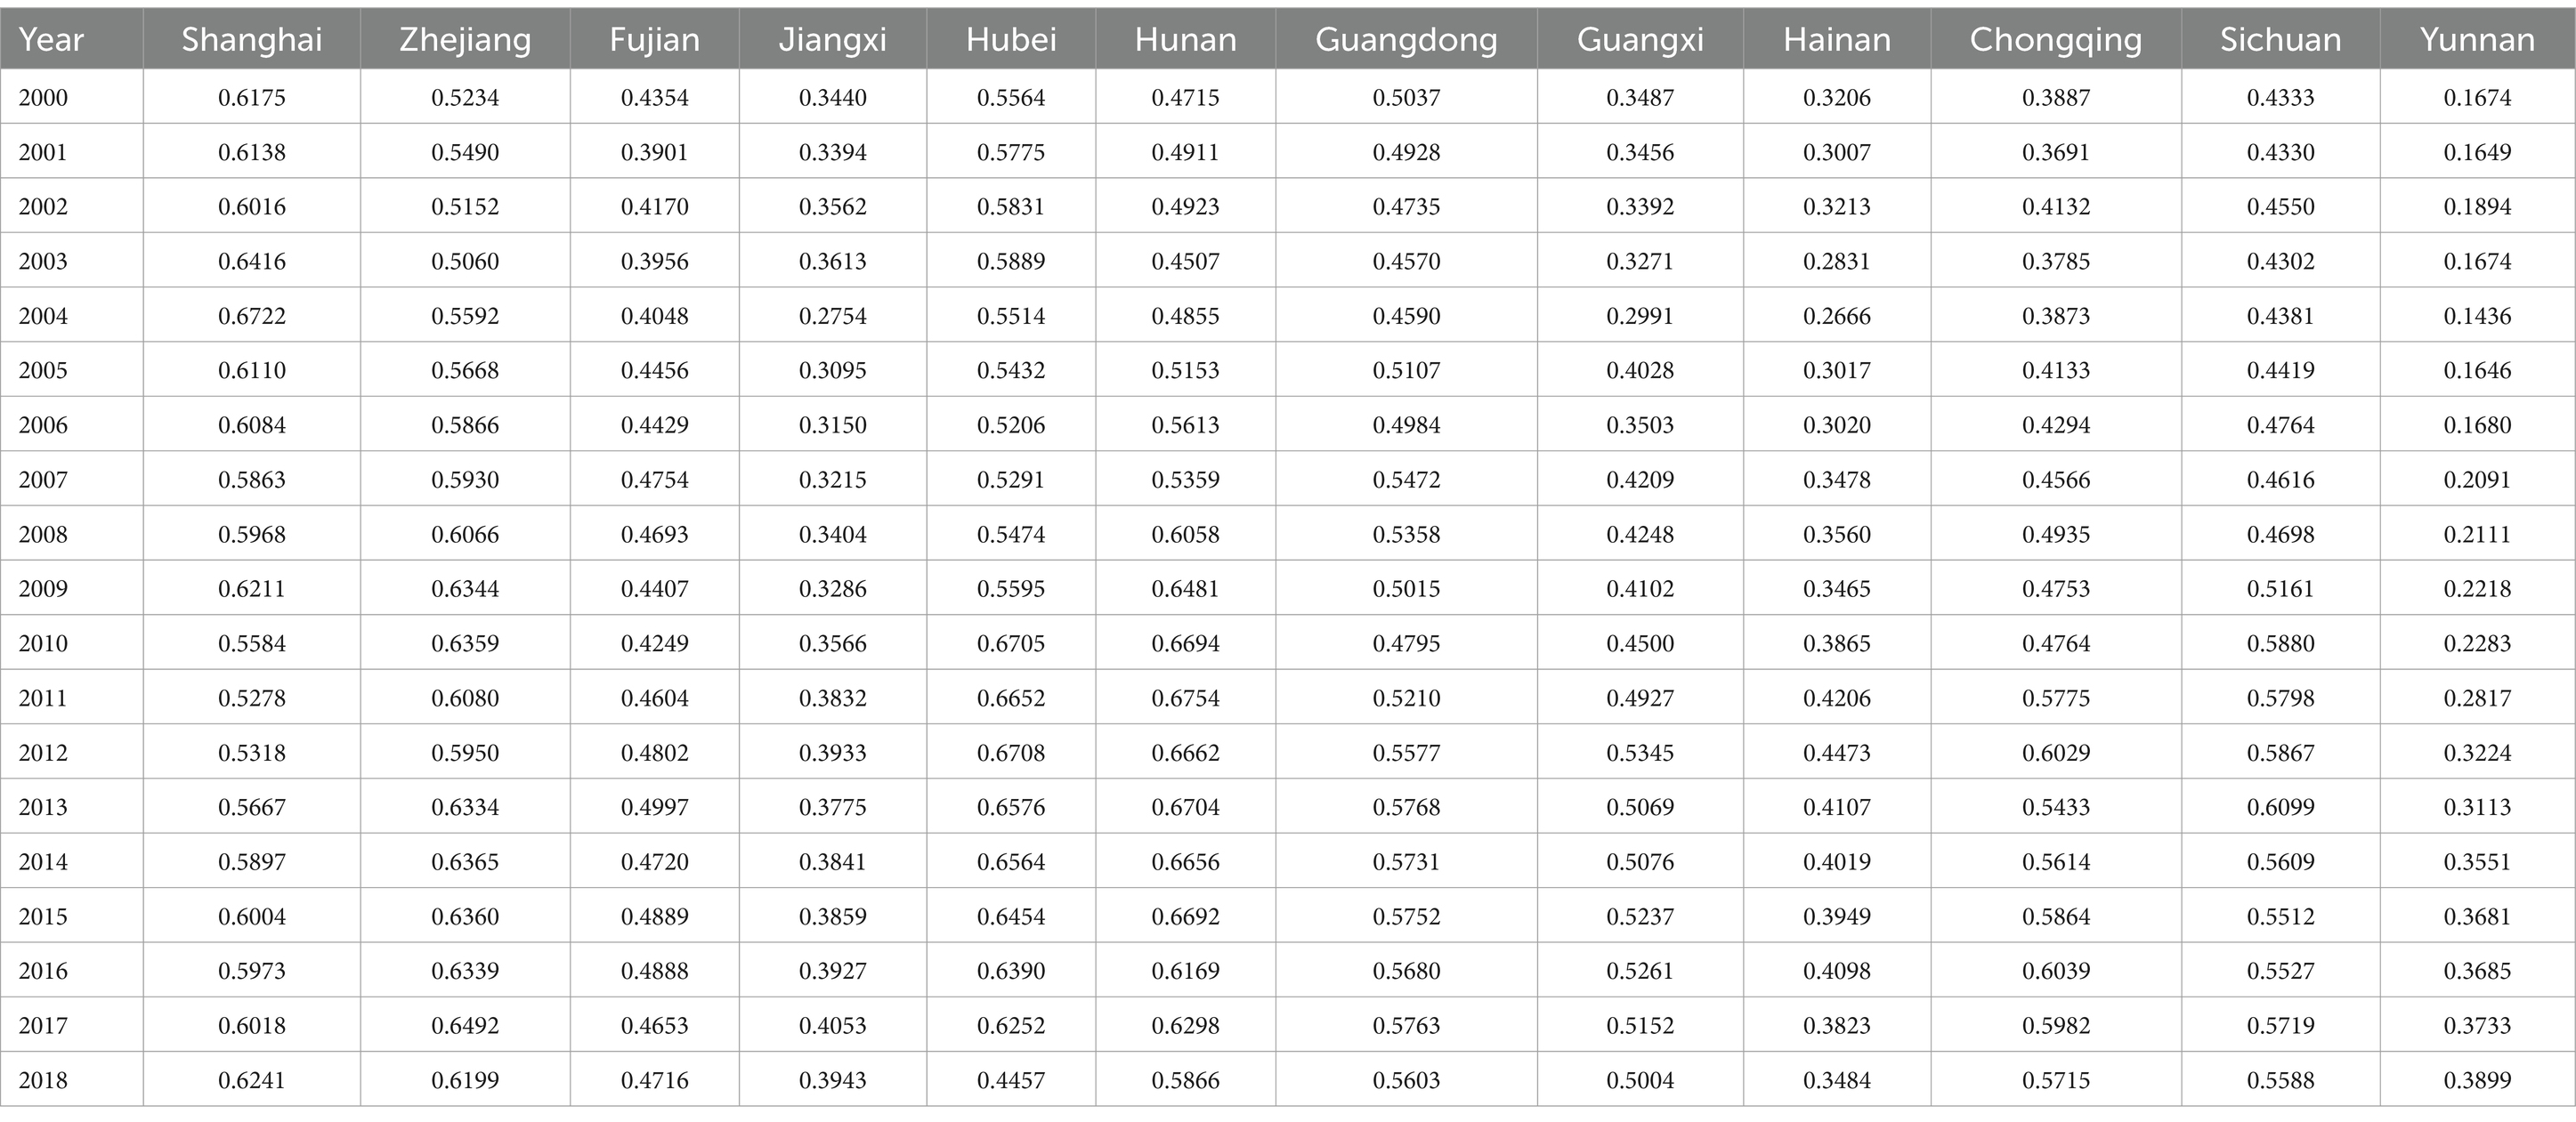
Table 6. Score of vegetable production competitiveness in China’s main winter and spring vegetable producing regions (2000–2018).
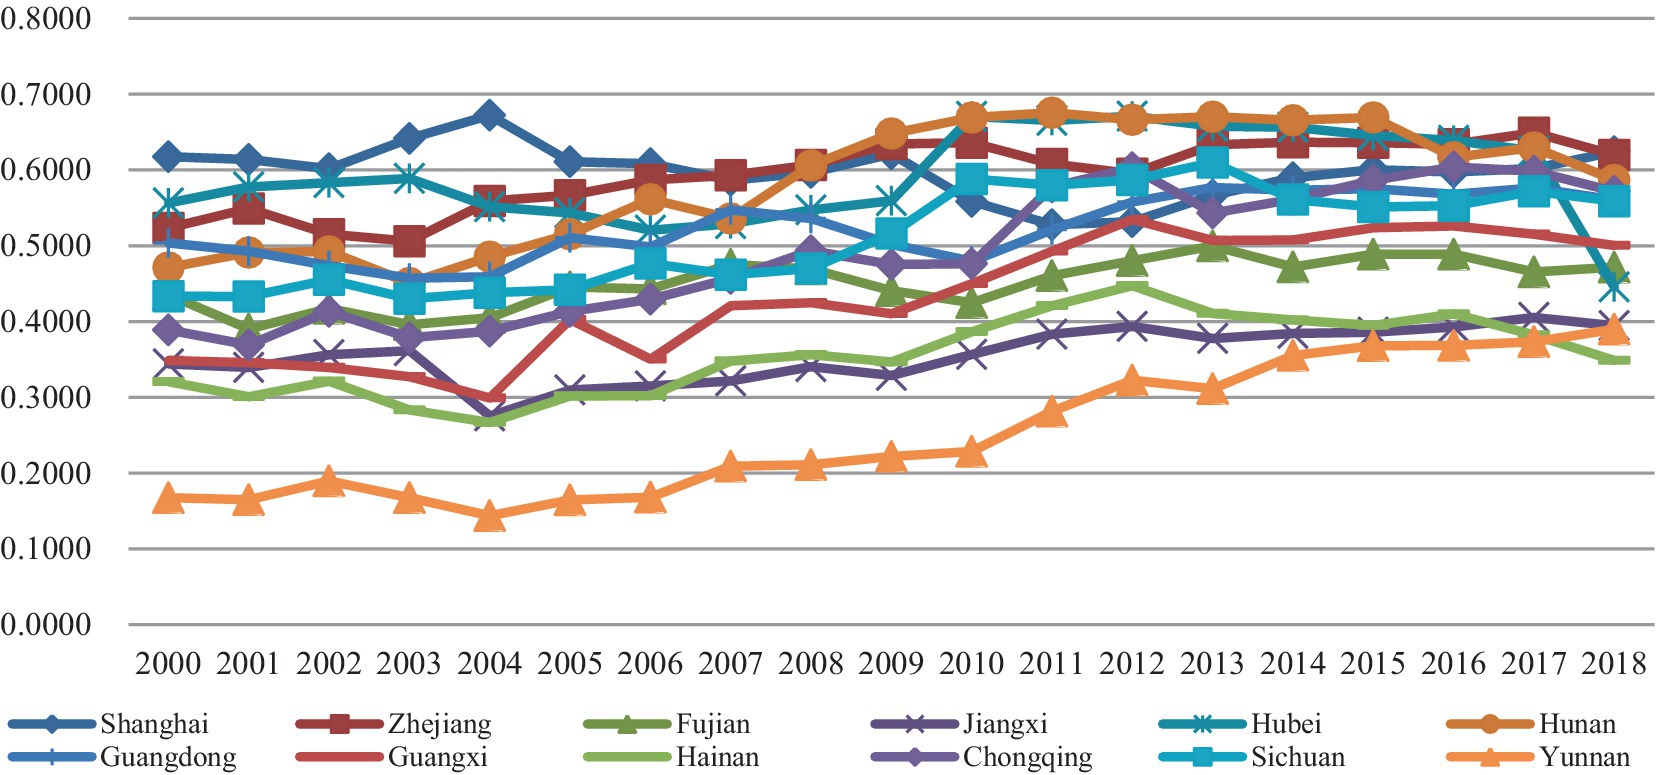
Figure 3. Competitiveness of vegetable production in China’s main winter and spring vegetable producing regions (2001–2018).
5.3.3 Analyze clustering results
The evaluation scores of the product competitiveness of the main winter and spring vegetable producing regions are systematically clustered. Ward method is selected as the clustering method, and the square Euclidean distance is used as the interval distance calculation method. The final classification results are shown in Figure 4. According to the results of cluster analysis, the competitiveness of vegetable production in China’s main winter and spring vegetable production regions is divided into three categories. The first is Shanghai municipality, Zhejiang province, Hubei province, and Hunan province, which have a good development trend. Shanghai is one of the important municipalities directly under the central government in China. With a high level of economic development and social consumption and a dense population, Shanghai is an important vegetable consumption area in China (Yu L. and Mu Y., 2019). Therefore, Shanghai attaches great importance to vegetable production. The vegetable industry accounts for a large proportion of agricultural production, and the intensive level of vegetable production is high. Zhejiang province, Hubei province, and Hunan province have good agricultural production conditions, dense populations, and convenient transportation. The second category is Fujian province, Guangdong province, Guangxi province, Sichuan province, and Chongqing municipality. The agricultural production conditions in these provinces are relatively weak. The land is mainly mountainous and hilly, and the competitiveness of vegetable production is slightly weaker than in the first category. The third category is Jiangxi province, Hainan province, and Yunnan province. Compared with the first two categories, these provinces have weak agricultural production conditions, poor geographical location, and inconvenient transportation. However, in recent years, the infrastructure and transportation conditions have improved, especially under the promotion of favorable policies such as the rural revitalization strategy, and the competitiveness of vegetable production in these three provinces has been improved.
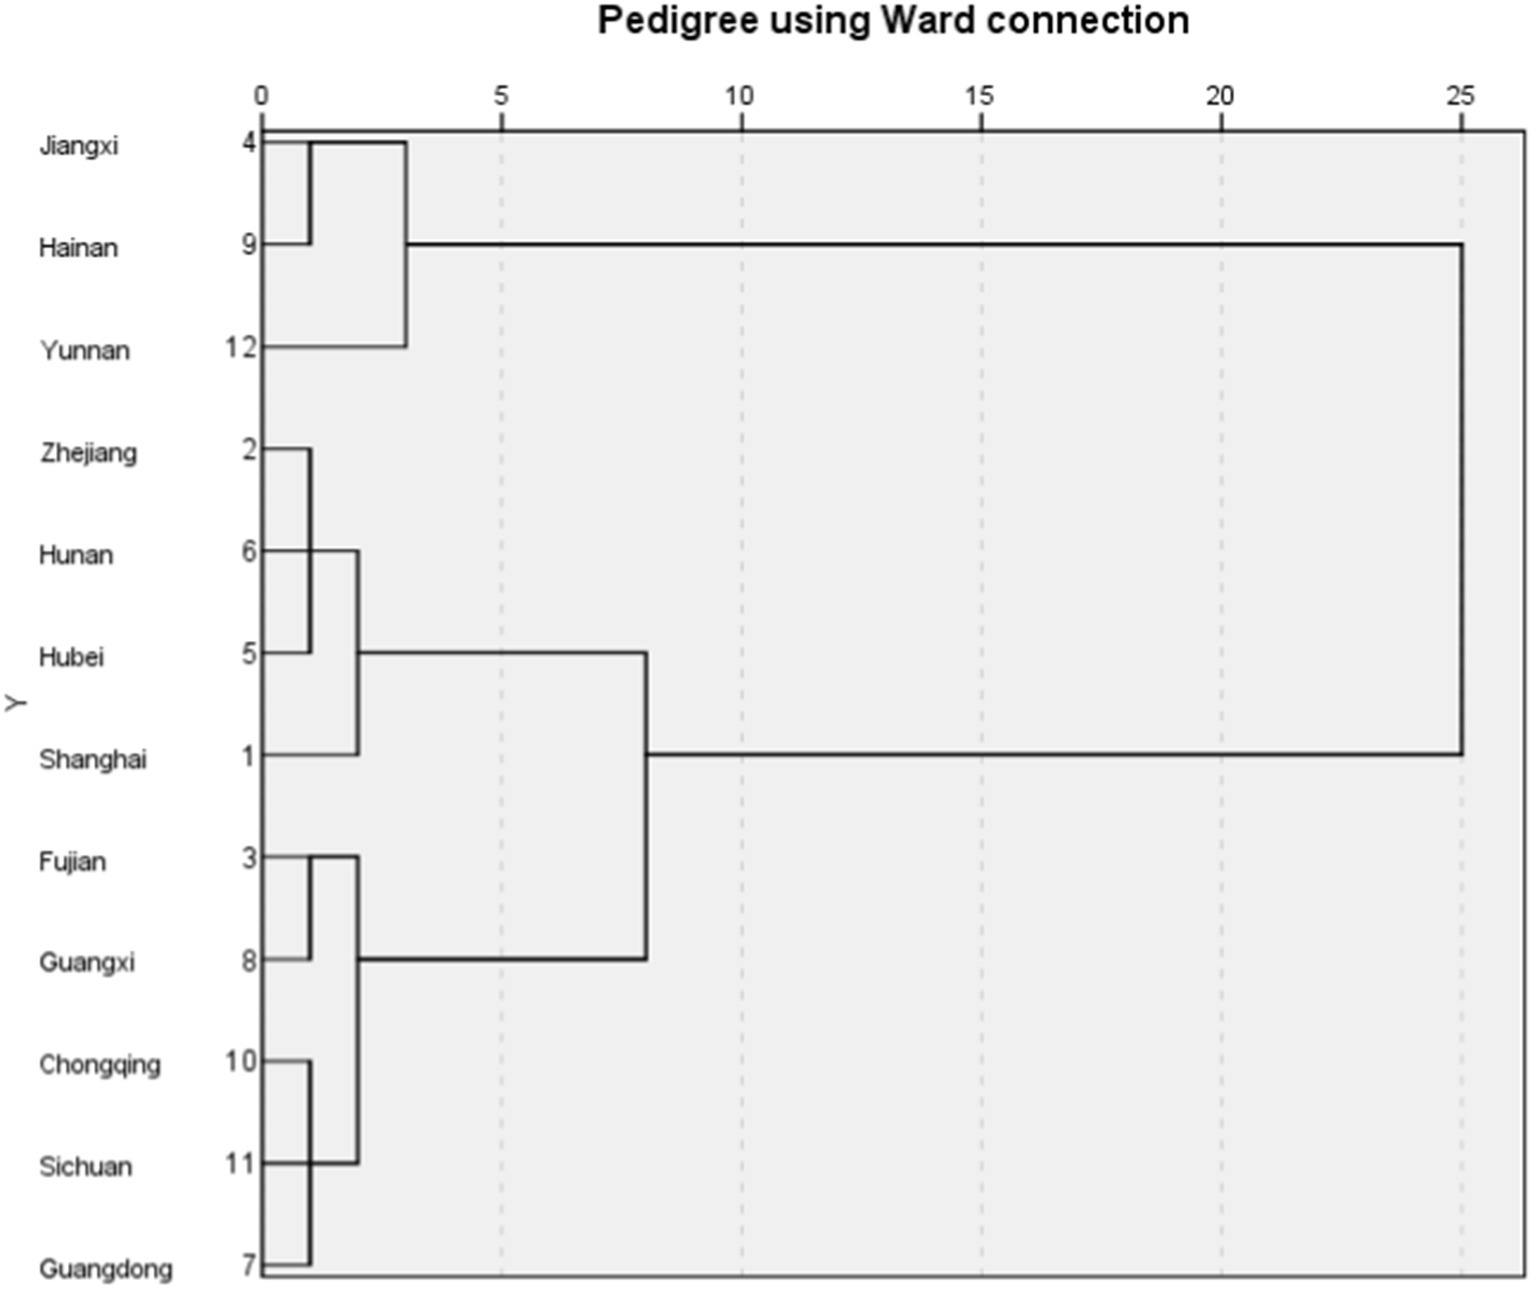
Figure 4. Tree view of cluster analysis.
6 Discussion
China’s main winter and spring vegetable production regions have different vegetable production advantages among provinces, cities, and autonomous regions: The main producing regions of provinces, cities, and autonomous regions do not have the comparative advantage of vegetable production efficiency. With the study range, Hainan province, Guangdong province, Fujian province, Hunan province, Hubei province, Zhejiang province, Shanghai municipality, and Guangxi Zhuang autonomous region have the advantage of vegetable production scale. Hainan province, Guangdong province, Fujian province, Zhejiang province, Shanghai municipality, and Guangxi Zhuang autonomous region have a comprehensive comparative advantage with an average of more than 1. Similar results were obtained, but the overall index score was small (Zhong and Zhang, 2014; Yu L. and Mu Y., 2019). The main reason is that when calculating comparative advantage, this paper adopted the sown area of crops instead of the sown area of grain. Based on the theory of comparative advantage, it is more appropriate to use the sown area of crops to calculate.
During the period from 2000 to 2018, the overall competitiveness of vegetable production in the main production areas of winter and spring vegetables in various provinces showed a fluctuating upward trend, and the competitiveness of vegetable production in different regions was unbalanced (Li et al., 2023; Xu et al., 2023). The ranking results derived from the principal component analysis by Yu L and Mu Y (2019) are similar; Zhang and Zhu (2017) and He et al. (2023) also found similar conclusions regarding the rankings of the provinces involved in this paper. Through research, we found that the overall competitiveness of vegetable production in the provinces of the main production areas of winter and spring vegetables has improved, but there is still a situation of unbalanced regional development.
7 Conclusions and policy implications
7.1 Conclusion
This study utilizes a comprehensive application of the Resource Endowment Coefficient, Comparative Advantage Coefficient, Entropy Method, and System Clustering Analysis to draw the following conclusions: there are significant differences in vegetable production resource endowments among the main vegetable-producing provinces (municipalities and autonomous regions) during the winter–spring season. Only Chongqing, Hubei Province, and Shanghai have an EF value greater than 1, indicating a certain comparative advantage in vegetable production resources. The remaining provinces do not possess a comparative advantage in vegetable production resources. However, Guangxi Zhuang Autonomous Region and Hunan Province, despite lacking a comparative advantage (with EF values between 0.90 and 1), show substantial potential for development.
7.2 Policy implications
(1) The region with the first category of vegetable production competitiveness has the comparative advantage of vegetable production resource endowment and vegetable production. On the premise of ensuring sustainable development, these regions should strengthen the input of various construction resources, adopt effective support policies, and improve the level of vegetable industrialization. Give full play to the advantages of resource endowment, and then form the advantages of scale benefit growth. In addition, we should rationally allocate factor inputs and promote the green production of vegetables to meet the continuous growth of people’s demand for green and organic agricultural products.
(2) The regions where the competitiveness of vegetable production is in the second category often do not have the comparative advantage of vegetable production efficiency in winter and spring. Basis of maintaining the scale advantage of the vegetable industry, these regions integrate science and technology into production, speed up the mechanization of vegetable production, improve vegetable production efficiency, and shorten the gap with the whole country. At the same time, these regions should cultivate quality and market advantages, optimize planting structure and varieties, focus on developing vegetable order planting mode, and improve supply efficiency.
(3) The regions in the third category of vegetable production competitiveness often do not have the comparative advantage of vegetable production resource endowment and vegetable production. These regions need to make full use of their good natural production conditions, deeply explore the potential of resources, promote the scale of the vegetable industry, quality, science, and technology, and improve vegetable production capacity. At the same time, these regions make full use of their geographical advantages and good climate conditions to establish large-scale vegetable production bases, give full play to their advantages to plant anti-seasonal vegetables, and enrich the vegetable supply market.
Due to limitations in the researcher’s knowledge and experience, this paper may have certain limitations in research methodology, selection of indicators, and choice of data. In the future, we plan to conduct systematic surveys to gain a deeper understanding of the production conditions in China’s winter–spring vegetable production regions. We aim to survey vegetable producers and analyze from the producers’ perspective, and to undertake the following studies: research on factors influencing winter–spring vegetable production and comparative studies on vegetable production capabilities between this region and other vegetable-producing regions in China.
Data availability statement
The original contributions presented in the study are included in the article/supplementary material, further inquiries can be directed to the corresponding author.
Author contributions
DH: Conceptualization, Data curation, Funding acquisition, Investigation, Methodology, Software, Writing – original draft. XW: Writing – review & editing.
Funding
The author(s) declare that financial support was received for the research, authorship, and/or publication of this article. This research was funded by the Minnan Normal University President’s Fund Project (Grant No. SK18017), Special Project on New Quality Productivity Research at Minnan Normal University in 2024 (Grant No. MSXZ2024005), the National Social Science Fund of China Western Project (Grant No. 23XJY011), and Fujian Provincial University Research Project on Basic Theoretical Research in Philosophy and Social Sciences Guided by Marxism (Grant No. FJ2024MGCA022).
Acknowledgments
We deeply thank the editors and reviewers for their valuable comments.
Conflict of interest
The authors declare that the research was conducted in the absence of any commercial or financial relationships that could be construed as a potential conflict of interest.
Publisher’s note
All claims expressed in this article are solely those of the authors and do not necessarily represent those of their affiliated organizations, or those of the publisher, the editors and the reviewers. Any product that may be evaluated in this article, or claim that may be made by its manufacturer, is not guaranteed or endorsed by the publisher.
References
Bao, Y. Z., Yu, Y., Zhou, Y., and Niu, M. J. (2018). Study on the distribution and evolution of vegetable industry in China from 1990 to 2014. J. Arid Land Resour. Environ. 11, 53–58. doi: 10.13448/j.cnki.jalre.2018.333
Burianova, J., and Belova, A. (2012). The competitiveness of agricultural foreign trade commodities of the CR assessed by way of the Lafay index. Agris On-line Pap. Econ. Inform. 4, 27–36. doi: 10.22004/ag.econ.146274
Chen, Q., Zhang, X. S., Zhang, H. Y., Christie, P., Li, X. L., Horlacher, D., et al. (2004). Evaluation of current fertilizer practice and soil fertility in vegetable production in the Beijing region. Nutr. Cycl. Agroecosyst. 69, 51–58. doi: 10.1023/B:FRES.0000025293.99199.ff
Choudhary, H., Bisht, D., Badal, P. S., Singh, V., and Saryam, M. (2017). Profitability of vegetables in hill agriculture: an economic analysis. Int. J. Curr. Microbiol. Appl. Sci. 6, 1674–1682. doi: 10.20546/ijcmas.2017.608.201
Dastagiri, M. B., Chand, R., Kingsly, I., and Hanumanthaiah, C. V. (2014). Indian vegetables: production trends, marketing efficiency and export competitiveness. Am. J. Agric. For. 1, 1–11. doi: 10.11648/j.ajaf.20130101.11
Dhehibi, B., and Frija, A. (2009). Impact of domestic resource costs on the competitiveness of Tunisian fresh fruit and vegetable products exports. 5ème colloque international: "Energie, changements climatiques et développement durable" -15-16 et 17 juin 2009 à Hammamet Yasmine. (Hammamet: Tunisie).
Fonsah, E. G., and Awondo, S. N. (2013). Discussion: future domestic and international competitiveness of the southern fruit and vegetable industry. J. Agric. Appl. Econ. 45, 481–484. doi: 10.1017/S1074070800004995
Fraley, C., and Raftery, A. E. (1998). How many clusters? Which clustering method? Answers via model-based cluster analysis. Comput. J. 41, 578–588. doi: 10.1093/comjnl/41.8.578
He, W., Fan, B., and Li, M. Y. (2023). The impact of agglomeration in vegetable production in China on technical efficiency. North. Hortic. 18, 142–149. doi: 10.11937/bfyy.20230989
Helmy, O. (2010). Competitiveness of Egypt in the EU market for fruits and vegetables. J. Int. Agric. Trade Dev., 215–255.
Hoang, V. V., Tran, K. T., Tu, B. V., Nguyen, V. N., and Nguyen, A. Q. (2017). Agricultural competitiveness of Vietnam by the RCA and the NRCA indices, and consistency of competitiveness indices. Agris On-line Pap. Econ. Inform. 9, 53–67. doi: 10.22004/ag.econ.276072
Idem, Z. G., and Burak, A. (2022). Developing a harvest plan by considering the effects of skidding techniques on Forest soil using a hybrid TOPSIS-entropy method. For. Sci. 68, 312–324. doi: 10.1093/forsci/fxac010
Ion, R. A., Turekrahoveanu, A., Istudor, N., and Manole, V. (2008). Competitiveness of Romanian foreign trade with vegetables and fruits. Bull. Univ. Agric. Sci. Vet. Med. Cluj-Napoca Hort. 2, 197–202. doi: 10.15835/buasvmcn-hort:936
Ito, H., Wang, Q., and Yamashita, M. (2014). Potential of environmental education through agriculture to increase the adaptability and resilience of individuals. World Environ. 4, 185–198. doi: 10.5923/j.env.20140404.05
Jaffee, S., and Masakure, O. (2005). Strategic use of private standards to enhance international competitiveness: vegetable exports from Kenya and elsewhere. Food Policy 30, 316–333. doi: 10.1016/j.foodpol.2005.05.009
Jiang, Y. M., Wang, T., Zhao, H. H., and Shao, X. D. (2019). Big data analysis applied in agricultural planting layout optimization. Appl. Eng. Agric. 35, 147–162. doi: 10.13031/aea.12790
Khaleie, S., and Fasanghari, M. (2012). An intuitionistic fuzzy group decision making method using entropy and association coefficient. Soft. Comput. 16, 1197–1211. doi: 10.1007/s00500-012-0806-8
Li, S. (2014). Research on the vegetable trade current situation and its trade competitiveness in China. Springer Berlin Heidelberg 420, 414–422. doi: 10.1007/978-3-642-54341-8_43
Li, L., Chen, L. Z., Dong, X. B., and Mao, Z. Q. (2023). Research on the competitiveness of vegetable industry in Yunnan Province. Hubei Agric. Sci. 62, 221–226. doi: 10.14088/j.cnki.issn0439-8114.2023.05.038
Li, J. P., and Luo, Q. Y. (2002). A case study of the comparative advantage of China's livestock products and the international competitiveness. Manag. World. 1, 83–92.
Li, Y. M., Sun, Y. X., Liu, Y., and Liao, S. Q. (2015). Zoning of vegetable production in Beijing-Tianjin-Hebei region at county level. Econ. Geogr. 35, 89–95. doi: 10.15957/j.cnki.jjdl.2015.01.013
Li, J. G., Wan, X., Liu, X. X., Chen, Y., Slaughter, L. C., Weindorf, D. C., et al. (2019). Changes in soil physical and chemical characteristics in intensively cultivated greenhouse vegetable fields in North China. Soil Till. Res. 195:104366. doi: 10.1016/j.still.2019.104366
Ma, Y. Q., Yin, W. P., Wang, D. H., and Zheng, J. Y. (2020). Analysis of vegetable industry situation in Hunan. Chin. Veg. 11, 1–9. doi: 10.19928/j.cnki.1000-6346.2020.11.001
Mao, Z. Q., Dong, X. B., Chen, L. Z., and Li, L. (2022). Comparative empirical analysis of international competitiveness of vegetable industry between China and five Lancang-Mekong countries. Acta Agric. Jiangxi. 4, 238–246. doi: 10.19386/j.cnki.jxnyxb.2022.04.038
Mao, Z. Q., Li, L., Chen, L. Z., and Wang, X. J. (2022). The regional comparative advantages of vegetable production in Yunnan Province. J. Agron. 12, 90–100. doi: 10.11923/j.issn.2095-4050.cjas2020-0241
Martin, L., and Duren, W. (1991). Agribusiness competitiveness across national boundaries. Am. J. Agric. Econ. 73, 1456–1464. doi: 10.2307/1242402
Morris, S. J., Davies, W. P., and Baines, R. N. (2013). Challenges and opportunities for increasing competitiveness of vegetable production in Cambodia. Acta Hortic. 1006, 253–260. doi: 10.17660/ActaHortic.2013.1006.31
Ozkan, B., Kurklu, A., and Akcaoz, H. (2004). An input–output energy analysis in greenhouse vegetable production: a case study for Antalya region of Turkey. Biomass Bioenergy 26, 89–95. doi: 10.1016/S0961-9534(03)00080-1
Peng, Y., and Zheng, Z. (1999). The application of systematic cluster analysis method in maize inbred line classification. Acta Agric. Boreali-occid. Sinica. 8, 34–36.
Qiao, J. Y., and Cui, M. S. (2022). Empirical study on competitiveness of vegetable industry in Shandong Province. Acta Agric. Jiangxi. 2, 203–209. doi: 10.19386/j.cnki.jxnyxb.2022.02.030
Qtaishat, T., El-Habbab, M. S., Salti, A., and Antary, T. M. (2019). The competitiveness of selected vegetables produced in Jordan and exported to the Gulf states. Fresenius Environ. Bull. 29, 559–565.
Riedel, B., Bokelmann, W., and Canavari, M. (2009). Regional competitiveness of fresh vegetable production in Europe - a cluster and value chain perspective. Acta Hortic. 18, 2846–2854. doi: 10.1017/S1368980015000981
Russo, V. M., Cartwright, B., and Webber, C. (1997). Mulching effects on Erosion of soil beds and on yield of autumn and spring planted vegetables. Biol. Agric. Hortic. 14, 85–93. doi: 10.1080/01448765.1997.9754799
Sabzalian, M. R., Heydarizadeh, P., Zahedi, M., Boroomand, A., Agharokh, M., Sahba, M. R., et al. (2014). High performance of vegetables, flowers, and medicinal plants in a red-blue LED incubator for indoor plant production. Agron. Sustain. Dev. 34, 879–886. doi: 10.1007/s13593-014-0209-6
Silva, J. N., Neto, F. B., de Lima, J. S. S., and dos Santos, E. C. (2020). Production and benefits in carrot and vegetable cowpea associations under green manuring and spatial arrangements. Rev. Cienc. Agron. 51, 1–11. doi: 10.5935/1806-6690.20200064
Stefan, B., and Ferto, I. (2016). Export competitiveness of the European Union in fruit and vegetable products in the global markets. Agric. Econ. 62, 299–310. doi: 10.17221/156/2015-AGRICECON
Stoeva, T. (2015). Competitiveness of Bulgarian vegetable production after the EU enlargement. Sci. Pap. Ser. Manag. Econ. Eng. Agric. Rural Dev. 15, 391–395.
Su, H. W., and Jiang, J. (2009). Viewing the vegetable planting industry of Qi state in the spring and autumn period and the warring states period from Guanzi. Linzi Pre Qin Anc. Capit. Acad. Semin. China Anc. Capit. Soc. 108–109.
Thorne, F. S. (2005). Examining the competitiveness of cereal production in selected EU countries. J. Farm Manag. 6, 313–328.
Valpiani, N., Wilde, P., Rogers, B., and Stewart, H. (2015). Patterns of fruit and vegetable availability and price competitiveness across four seasons are different in local food outlets and supermarkets. Public Health Nutr. 18, 2846–2854. doi: 10.1017/S1368980015000981.
Walters, S. A., Groninger, J. W., and Myers, O. (2012). Rebuilding Afghanistan's agricultural economy vegetable production in Balkh Province. Outlook Agric. 41, 7–13. doi: 10.5367/oa.2012.0073
Wang, L. Q., and Qi, C. J. (2018). Study on regional comparative advantage and its influencing factors of major Citrus producing regions in China: an empirical analysis based on provincial panel data. J. China Agric. Resour. Reg. Plan. 39, 121–128. doi: 10.7621/cjarrp.1005-9121.20181117
Wang, H. F., Zhang, H., Jiang, Z. X., Dai, Y. H., Liu, G. C., Chen, L., et al. (2017). Efficacies of biochar and biochar-based amendment on vegetable yield and nitrogen utilization in four consecutive planting seasons. Sci. Total Environ. 593-594, 124–133. doi: 10.1016/j.scitotenv.2017.03.096
Xu, M. Y., Tang, X. F., Ren, H. K., Wei, L. J., Lin, J. J., and Wei, X. (2023). Regional comparison and competitiveness analysis of Guangxi vegetable industry. China Veg. 8, 6–13. doi: 10.19928/j.cnki.1000-6346.2023.1026
Yu, L., and Mu, Y. (2019). Cluster analysis of vegetable industry competitiveness in different regions of China. China Veg. 8, 21–27. doi: 10.19928/j.cnki.1000-6346.2019.08.006
Yu, Y. L., and Mu, Y. Y. (2019). Analysis of the temporal and spatial changes and comparative advantages of vegetable production in China. Xinjiang Agric. Sci. 10, 1948–1958. doi: 10.6048/j.issn.1001-4330.2019.10.21
Zhang, P., and Zhu, Z. Q. (2017). Analysis on the comprehensive competitiveness of Shandong vegetable industry. J. Shandong Technol. Bus. Univ. 5, 27–32. doi: 10.3969/j.issn.1672-5956.2017.05.003
Keywords: China’s main winter and spring vegetable production regions, resource endowment coefficient, comparative advantage, entropy method, competitiveness analysis
Citation: Hou D and Wang X (2024) Unveiling the dynamic evolution of comparative advantage: assessing the competitiveness of China’s main winter and spring vegetable production regions. Front. Sustain. Food Syst. 8:1333496. doi: 10.3389/fsufs.2024.1333496
Edited by:
Andrea Marchini, University of Perugia, ItalyReviewed by:
Hassan Azarm, Shiraz University, IranJiban Shrestha, Nepal Agricultural Research Council, Nepal
Copyright © 2024 Hou and Wang. This is an open-access article distributed under the terms of the Creative Commons Attribution License (CC BY). The use, distribution or reproduction in other forums is permitted, provided the original author(s) and the copyright owner(s) are credited and that the original publication in this journal is cited, in accordance with accepted academic practice. No use, distribution or reproduction is permitted which does not comply with these terms.
*Correspondence: Xin Wang, ODIwMTkwMDhAbHl1bi5lZHUuY24=