 Egbal Elmsaad
 Abdelnaser Omran
 Abda Emam
 Omer Elmahi1
 Baher Amer
- 1Department of Agricultural Systems Engineering, Faculty of Agricultural and Food Sciences, King Faisal University, Al Hofuf, Saudi Arabia
- 2Department of Agricultural Engineering, Faculty of Agricultural Sciences, University of Gezira, Wad Medani, Sudan
- 3Libyan Academy for Postgraduate studies, Ajdabiya, Libya
- 4Departments of Agribusiness and Consumer Science, College of Agricultural and Food Sciences, King Faisal University, Al Hofuf, Saudi Arabia
- 5Department of Agricultural Engineering, Faculty of Agriculture, Cairo University, Giza, Egypt
To provide food supply chains, reduce losses from various crops after the harvesting process, and also to preserve vegetable and fruit crops purchased for consumption from rotting and not being wasted. The drying process is one of the most appropriate ways to solve such problems. In this research, several simple thermal modeling methods were proposed to perform the drying process through open sun drying (OSD) under forced pressure (FGD) and natural convection (NGD). This study was conducted at the King Faisal University Training and Research Station (25.4° latitude). North, longitude 49.6° east, height 142 meters above sea level). The thermal performance analysis of the models was evaluated by calculating the amount of solar radiation, air temperature, product temperature, moisture evaporation rate, and wind speed. The results obtained showed that drying inside the greenhouse is the best alternative to drying under direct sunlight, so that the maximum temperatures were obtained, ranging between 55 to 52 in FGD and 40−45 inside NGD. Also, the heat transfer coefficient was highest in the amount of moisture removed from the product, reaching its maximum. The weight of the product was reduced to 83%, 80 and 73%, in GFD, NGD and OSD, respectively Accordingly, it was found that drying gave the highest expected results, and the temperature of the product ranged between 9.25 to 14.36 and 4.93 to 10.32, and the correlation coefficient ranged between 0.95−0.52 and 0.95. −0.89 at OSD and NGD respectively. Moisture evaporation from the product is 28.92−2.77 at NGD and moisture evaporation exerted for FGD is 31.35 and the correlation coefficient for the product at FGD ranges from 0.93−0.84. The product and greenhouse temperature range are between 0.99−0.96. The moisture evaporation rate indicating that the values obtained were well matched. Finally, the economic analysis of the different methods of drying was done through a mathematical model.
Highlights
• A detailed explanation was provided about the use of greenhouses as a tool for solar drying, in addition to the fact that they protect the product from other factors such as dust and insects.
• The thermal performance was analyzed with the heat transfer coefficient of the product.
• Experimental investigations on OSD, FGD, and NGD were conducted in three different modes of working.
• Potatoes are considered one of the crops that contain a high percentage of moisture, as the initial humidity reached about 89%, which exposes them to rapid spoilage, so they were dried using simple greenhouse dryers to reduce the loss of the product.
• Use inexpensive techniques economically.
• Lack of research in the field of potato drying, especially on the climate of the Kingdom of Saudi Arabia.
• Reducing crop losses through drying helps achieve food security and environmental sustainability.
1 Introduction
Drying of agricultural products is gaining great importance as an effective method for preserving fruits and vegetables, as well as reducing high energy consumption, thus reducing the cost of the product and gas emissions harmful to the environment to achieve the goals of food security and environmental sustainability (Vasileios et al., 2022). Drying is one of the most important processes for preserving agricultural products as they are preserved for long-term storage through the process of removing moisture. Drying enhances foods by reducing loss, wastage, and spoilage in many food products such as tomatoes, dry grapes, potatoes, peas, cabbage, meat, fish, nuts, tea, and coffee (Kanti and Ganguly, 2016). To increase the effectiveness of drying and maintain the food quality of many dried crops and reduce spoilage, especially those with high vitamins, antioxidants, and phenolic content, pretreatments by plasma are carried out with the help of ultrasound (Ashtiani et al., 2022). In tropical, subtropical, and hot regions, solar radiation is estimated at 12 h per day, and it can be harnessed as an energy source for sustainable drying operations. Thus, solar-based systems, such as greenhouses, have received much research attention recently (Tong et al., 2018). One of the traditional methods used to dry crops is direct sunlight drying, which involves sunlight falling on the surface of the crop, absorbing it, and then evaporating the moisture. The amount of sunlight falling on the crop surface is examined through several stages, such as reflection, radiation, convection, or conduction. These solar dryers use clean, environmentally friendly and cost-effective energy for the sake of sustainable development and environment, which stimulated the production and design of these dryers so that they work with high efficiency to dry crops and fruits with high quality without affecting the components of the food material to ensure that it is preserved from spoilage (Öztürk et al., 2024). The drying rate that can be achieved by solar drying depends on several external factors such as wind speed, relative humidity, and the ambient sunlight temperature; other internal factors also affect the drying rate, such as initial moisture content, crop type, and degree of absorption the crop, as well as the mass of the crop per unit area exposed to sunlight (Singh and Kumar, 2023). Greenhouse systems are structures closed with polyethylene plastic sheeting because they allow the passage of short wavelengths of solar radiation. Such systems provide climatic conditions by preserving infrared radiation in the environment (Prakash and Kumar, 2004; Chauhan and Kumar, 2016). Solar energy is considered one of the most important sources of renewable energy, and it plays a major and fundamental role in ensuring sustainability, especially environmental sustainability, which makes it suitable for future generations and sustainable development. In addition, systems that use solar energy are of great importance, such as greenhouses (Kamil and Mehmet, 2019). The use of greenhouses as a dryer is one of the modern methods of temperature and humidity control; this feature makes it a suitable choice for drying applications (Tiwari, 2003).
The process of heat and mass transfer in the greenhouse happens through perceived heat, which happens when the product’s temperature rises, and latent heat through moisture evaporation (Rovense, 2015). Tawfik et al. (2023) investigated different techniques developed in solar tunnel greenhouse dryers based on the natural and forced convection process. This type of dryer is considered very suitable in rural areas, saves fuel consumption, and improves the condition of the product in terms of taste, color, and smell. Solar drying using tunnels and a greenhouse is one of the most suitable applications in rural areas. The quality of dried agricultural products is important and can be achieved through pretreatments. By using it, the product can be preserved and its appearance improved. The most important methods of thermal modeling in greenhouses for air circulation in the drying room are carried out in two different ways, one of which is greenhouse dryers with natural convection, and is carried out through the passage of sunlight into the greenhouse to heat the crop to be dried (it is carried out based on physical influences) (Singh and Kumar, 2012). The other method of drying in greenhouses is forced convection, which contributes to the removal of moisture from the crop to be dried by increasing the air through a fan (Chauhan et al., 2015).
Solar drying reduces energy consumption by contributing to increasing temperatures. However, there are some factors that need improvement, such as reducing relative humidity and air movement, which are controlled through ventilation and air circulation. For example, in industrial drying, the air is circulated using fans that consume a large amount of electricity and energy for its work (Ye et al., 2021). Radwan et al. (2016) demonstrated that an analytical study was conducted to evaluate and analyze the thermal performance of three different designs of protected type solar dryers that can be used for drying dates. The different shapes are Quonset shape (SD1), double gable (SD2), and pyramid shape (SD3). The different dryers tested were operated under conditions of three different air speeds at 0.5, 1, and 1.5 m/s. The thermal performance analysis of the dryers was performed on the basis of heat balance equations. The results obtained showed the overall thermal efficiency of the three different solar dryers (SD1, 2, and 3) and found that the expected thermal energy of the three solar dryers is very close to that measured during the experimental period. Among the three different shapes, the study recommended that the Quonset shape (SD1) is the best shape for the solar dryer due to the largest observed surface area, largest amount of solar radiation, and increased solar energy and dry air temperature (Hemant et al., 2021). Solar drying is considered one of the important processes and effective ancient methods for preserving food and agricultural products. By inhibiting and removing bacterial growth and moisture in the process, it preserves food products for longer. Solar dryers are classified on the basis of drying methods such as air circulation and type and arrangement of solar air collectors. In this study, an indirect type food dryer powered by solar energy was designed and developed. The dryer design consists of a solar collector plus an absorber consisting of an expanded aluminum sheet surface with a platform, a drying chamber with three columns per rack, a chimney for exhaust air, and a solar-powered fan. The dryer manifold and drying chamber are connected by a hose pipe installed at both ends. The solar dryer project model consists of a monitoring unit to record constantly updated parameter data such as temperature inside the dryer, temperature in the ambient condition, humidity inside and outside the dryer, and atmospheric pressure. To verify the effectiveness of the solar dryer’s performance, the parameters mentioned above are used.
The natural convection greenhouse system is designed to dry crops. To estimate the temperature and air temperature inside the sheltered house, the amount of humidity, and solar radiation, the obtained results were validated with experimental results. Bala et al. (2003) studied a solar dryer from tunnel-type greenhouses and reported impressive results; the crops were also protected from external factors that lead to damage. Simple and multiple regression techniques were used by Goyal and Tiwari (1998) to study the convection mass transfer coefficient for wheat and gram; the results showed that the values when using the simple regression approach were 12.68 and 9.62 W/m2C°, respectively, and using the multiple regression technique, the values were 9.67 and 10.85 W/m2C°, respectively. Anwar and Tiwari (2001a) studied the coefficients of mass and heat transfer of some crops under the simulation of forced load in the open state and open indoor; the cat values of the coefficients were 1.31–12.8 W/m2oC in the required range.
Potatoes are among the vegetables and foods that are consumed daily all over the world to a very large extent. Vegetables are considered one of the most important basic elements in a healthy diet. The majority of health and nutrition experts recommend eating appropriate portions of them daily (Głąbska et al., 2020). One of the advantages of potatoes is that they are produced and consumed on a large scale around the world and are easily available in the markets. Therefore, it is considered a vital crop for food security (Devaux et al., 2019). To preserve potatoes, the most appropriate method is drying because it reduces the rate of microbiological, physical, and chemical decomposition reactions (Krokida et al., 2001). Potatoes are one of the most important vegetable crops in the Kingdom of Saudi Arabia, as the area cultivated with potatoes reached 19.15 thousand hectares, representing 22.3% of the total area of exposed and protected vegetables. Potato production reached 482.31 thousand tons, representing 24.42% of the total vegetable production in 2018 (Ministry of Environment, Water and Agriculture, 2019). The country was compelled to import potatoes and their derivatives (fresh potatoes, seeds, potato chips, potato starch, and frozen potatoes) from overseas since domestic production could not keep up with consumer demand, leading to the importation of 263.26 thousand tons of potatoes at a cost of 259.86 $.
The Kingdom of Saudi Arabia is considered one of the countries whose climate is characterized by being hot and dry, and this characteristic causes a rapid and noticeable deterioration in potato tubers, whether produced or imported; hence, potatoes are preserved as dried flakes. In the Kingdom of Saudi Arabia (KSA), the location of the study, there has been a lot of research done on drying different types of crops as products (Azam et al., 2020). A detailed study was conducted on the thermal analysis of the photovoltaic system and the solar energy collector, an integrated greenhouse dryer for drying tomatoes, and the result was that the overall average efficiency ranges from 6.14 to 17.96%. Depending on the experimental conditions, the logarithmic model was the best model for thin-bed solar greenhouse drying for different treatments of tomatoes both within the GD zone and under drying in open sunlight. Amer and Chouikhi (2020) designed a software application on the smartphone to avoid and reduce errors. It works and applies mathematical operations for drying and verifies some of the mathematical equations that were used in the research. The application is installed on mobile phones. It was integrated using the visual programming language for the Android system to save time and effort. It was developed to calculate mathematical modeling for calculating drying.
Amer and Albaloushi (2021) designed an advanced design to improve the performance of a solar dryer supported by reasonable heat storage and a photovoltaic unit for drying cantaloupe. This advanced design of the solar drying system helped reduce post-harvest losses of vegetables and fruits to a large extent, in addition to saving energy and time. It provides protection for vegetables and fruits from damage and improves quality. It enhances food security and enables farmers and merchants to produce dried vegetables and fruits themselves, which leads to reducing dependence on imported dried products. Almuhanna (2012) evaluated the feasibility of using a solar greenhouse as a solar dryer for drying dates and attempted to analyze the thermal performance and thermal balance of the solar greenhouse in KSA.
The steady increase in the world’s population has led to the search for ways to save food and reduce famine and disease, which in turn enhances global food security. From this point of view, researchers began to conduct studies related to food and conservation by reducing losses in harvesting and processing some crops by various conservation methods to reduce damage caused by poor storage, wind, rain, high temperatures, and humidity, as well as damage caused by insects. The methods of preserving crops after harvesting may include drying them in ways that are less expensive and highly efficient. The main objective of this research was to develop three simple thermal models for improving the performance of greenhouse dryers and predicting crop drying temperatures through the three models (open sun drying, natural and forced convection) using Excel 2016 program and SPSS statistical analysis (regression and correlation).
2 Research method
2.1 Experimental setup
To carry out the research, a small-scale Gable—even span greenhouse dryer—is constructed at the King Faisal University Training and Research Station (latitude 25.4oN, longitude 49.6°E, and altitude 142 m above sea level). The dryer was covered with a transparent polyethylene plastic film designed for the determination of heat transfer coefficient (convection) during drying in the greenhouse. The greenhouse bottom surface was covered with PVC to decrease the heat loss through the ground. The dimensions of the greenhouse dryer were a height of 0.40 (cm), a length of 1.20(cm), and width of 0.80(cm), the greenhouse floor was covered with PVC to decrease the heat loss through the ground, and this dimensions of dryer is in line with Jain and Tiwari (2004). The roof of the greenhouse was sloped at 25° as that of the latitude of the place (i.e., 25.4° of Al-Ahsa) for maximum trapping of solar rays. The greenhouse orientation was north–south during the experiment. The drying tray is made of black wire mesh for absorbing maximum solar radiations with an effective area of 20 × 20 (cm2) used to dry potatoes. For the air entrance inside the dryer, circular holes of diameter 25 (cm) are provided on the greenhouse roof over the tray position. One AC exhaust fan of 14.2 × 39.4 × 38.2 (cm) and 2,400 (rpm), 3 speed control and 20 (W), is provided in the upper side portion of north wall of the dryer for removing the air in forced convection mode. Other parameters were set the same as for the inclined roof greenhouse dryer. The drying procedure was performed in three different modes: open sun drying, simple greenhouse dryer, and modified greenhouse dryer under forced convection (active mode). Figures 1, 2 show the experimental setup and instruments used and the tools used. There were nine replications for each design with six treatments. Ambient parameters were solar radiation, temperature, relative humidity, wind speed, product temperature, and heat transfer coefficient (hc).
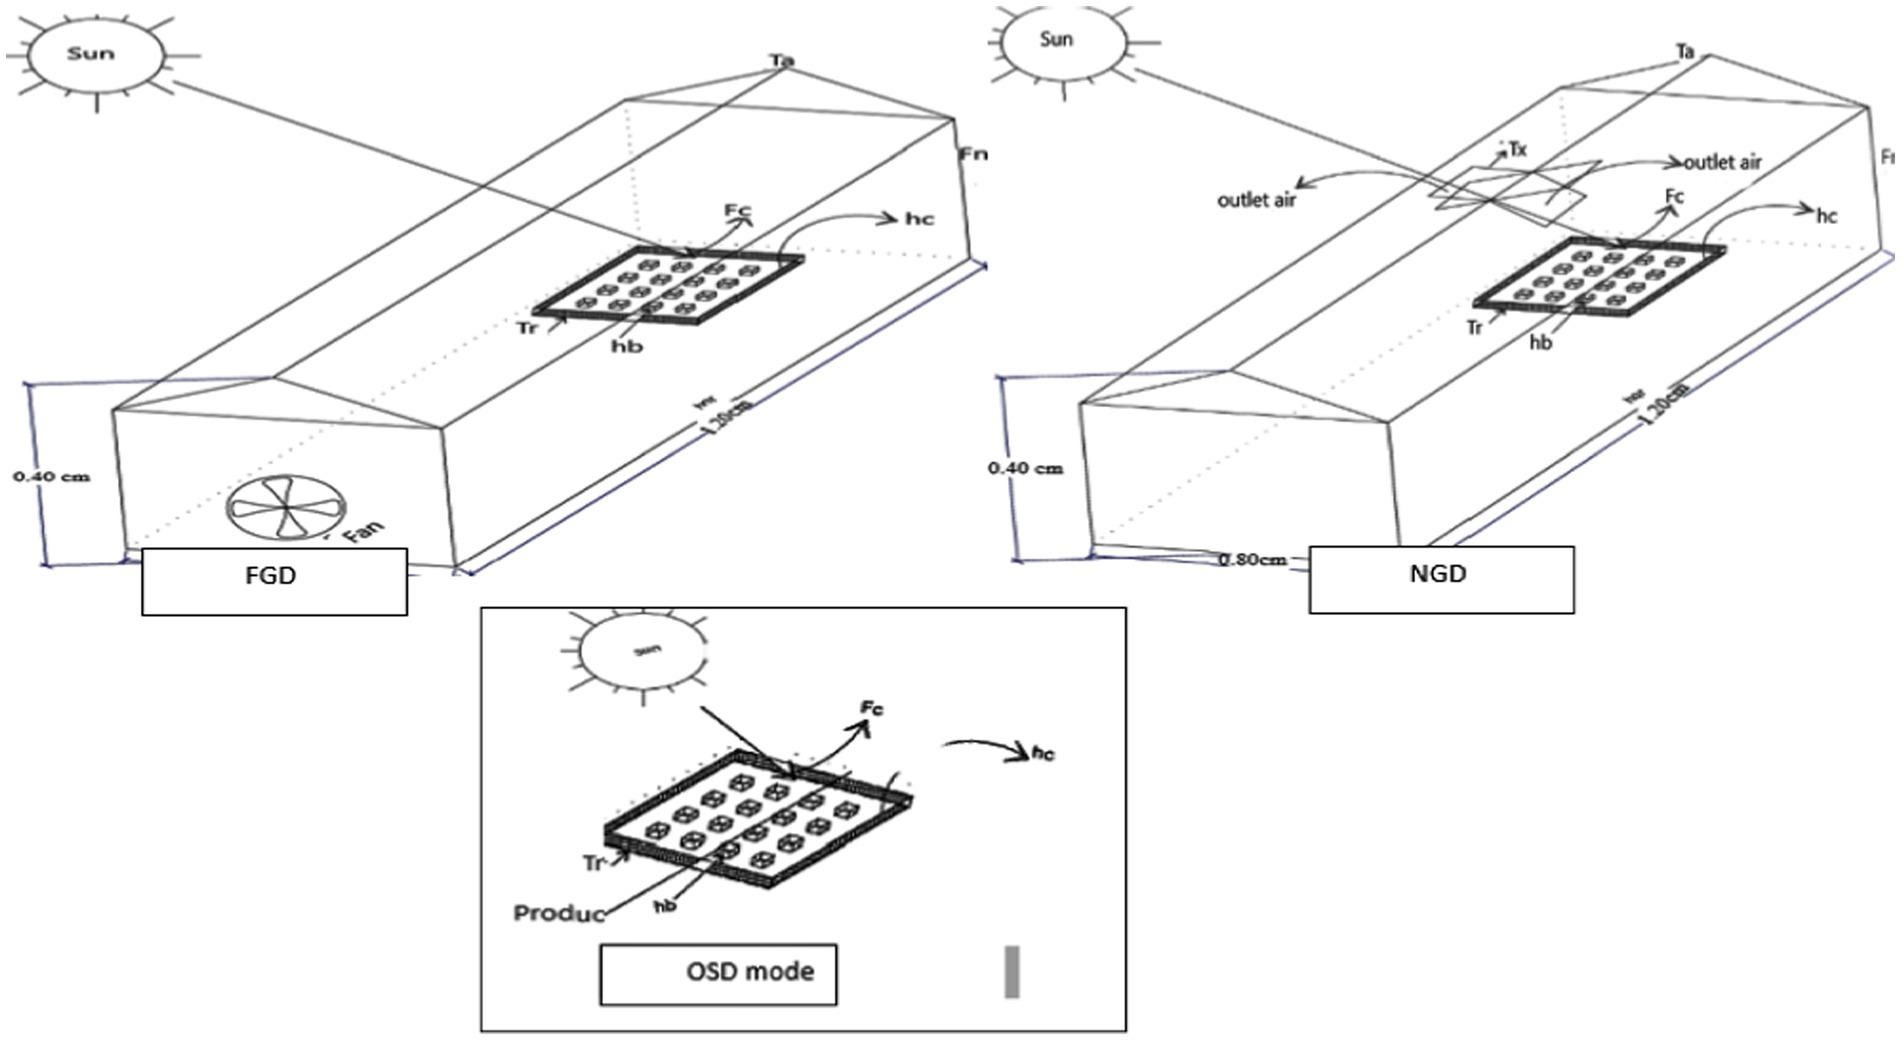
Figure 1. Arrangement of different modes dryer (FGD, NGD, and OSD).
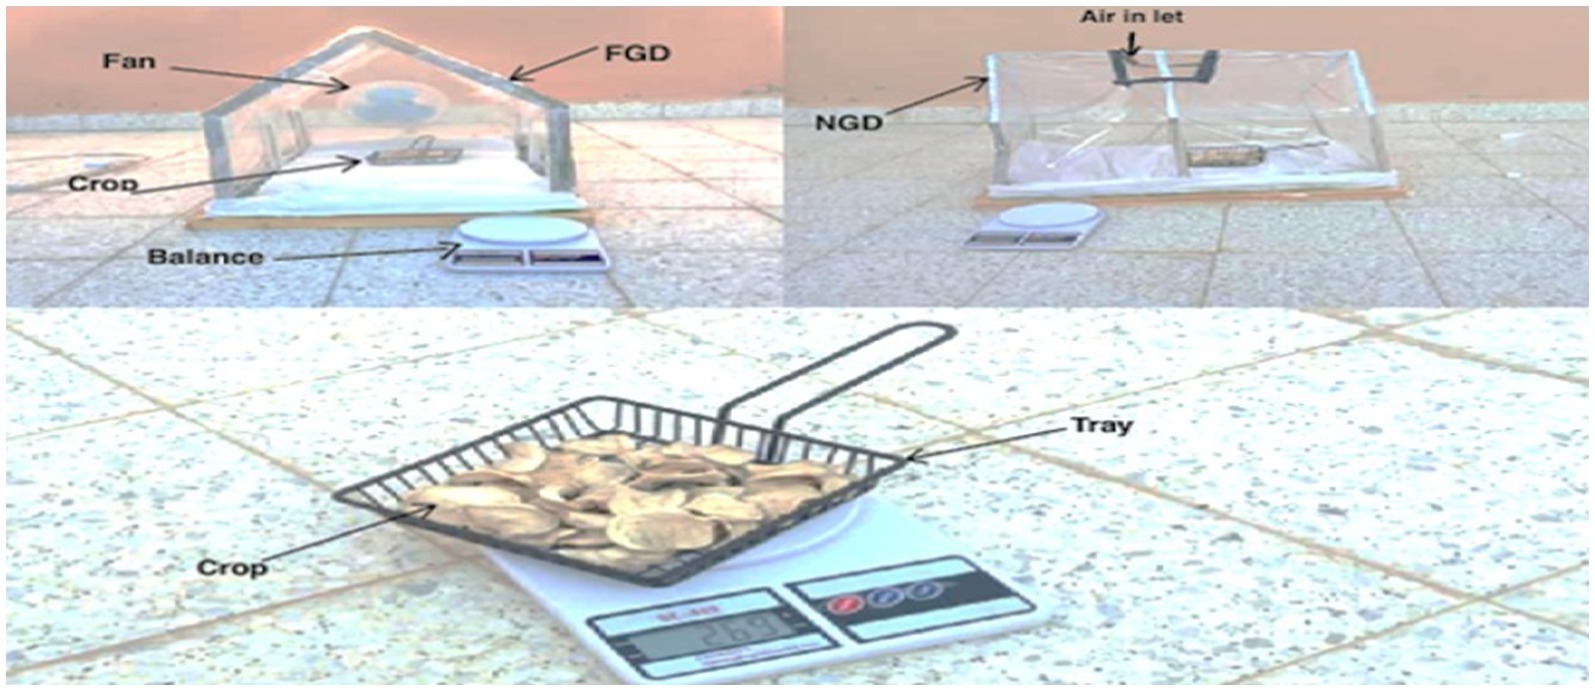
Figure 2. Experimental setup.
2.2 Instruments used
A digital balance was used to measure the potato weight before drying and after drying. The environmental parameters affected by the drying process were measured using the relevant instruments: A pyranometer was used to measure solar radiation (W/m 2) on a horizontal surface; the temperature was measured by digital temperature indicators; relative humidity (%) outside and inside the setup were measured using Amprobe THWD-3; an airflow meter/Hot Wire anemometer was used to measure the airflow rate and wind speed of the dryer. The experimental records were taken from 7 a.m. at every hour of continuous drying, and the drying process was repeated 4–5 times.
2.3 Products
Fresh potatoes of 500 g were procured from the local market of Al-Ahsa, KSA. Then, all fresh potatoes were washed by water to remove the soil and dirt from the skin of the potatoes. After that, they were cut into a thin layer of 15 mm thickness. Equal quantity of potato flakes was kept on the wire mesh dryers. The initial humidity ranged between 78 and 89%.
2.4 Drying procedure
The drying of potato flakes is performed in open sun drying, simple greenhouse dryer, and modified greenhouse dryer under forced convection modes. The experiment is performed between 7 am and 5 pm, and this time was chosen because the amount of solar radiation is high to benefit from in removing moisture and activating the drying process and the dryer in June 2023. The dryer is kept on the ground which is far from the shade of the buildings and trees. All the experimental observation is carried out on hourly basis, and the drying process was repeated 4–5 times. The temperature of the product rises through the sunlight falling through the greenhouse cover dried on it in drying trays, as it absorbs part of it and is responsible for heating and raising the temperature of the product, helps in the evaporation of moisture from it, and raises the temperature of the greenhouse through forced convection, and the remaining part of the rays is reflected. Microsoft Excel was used to calculate the thermal performance of solar dryers using the previous equations as well as a data set containing fixed parameters (Table 1). The data were measured, stored in microcomputer files, and statistically analyzed using Excel, and a significance level of 0.05 has traditionally been accepted as the minimum level of significance. If levels higher than significance were found, these values were included in the text (p ≤ 0.01 and p ≤ 0.001).
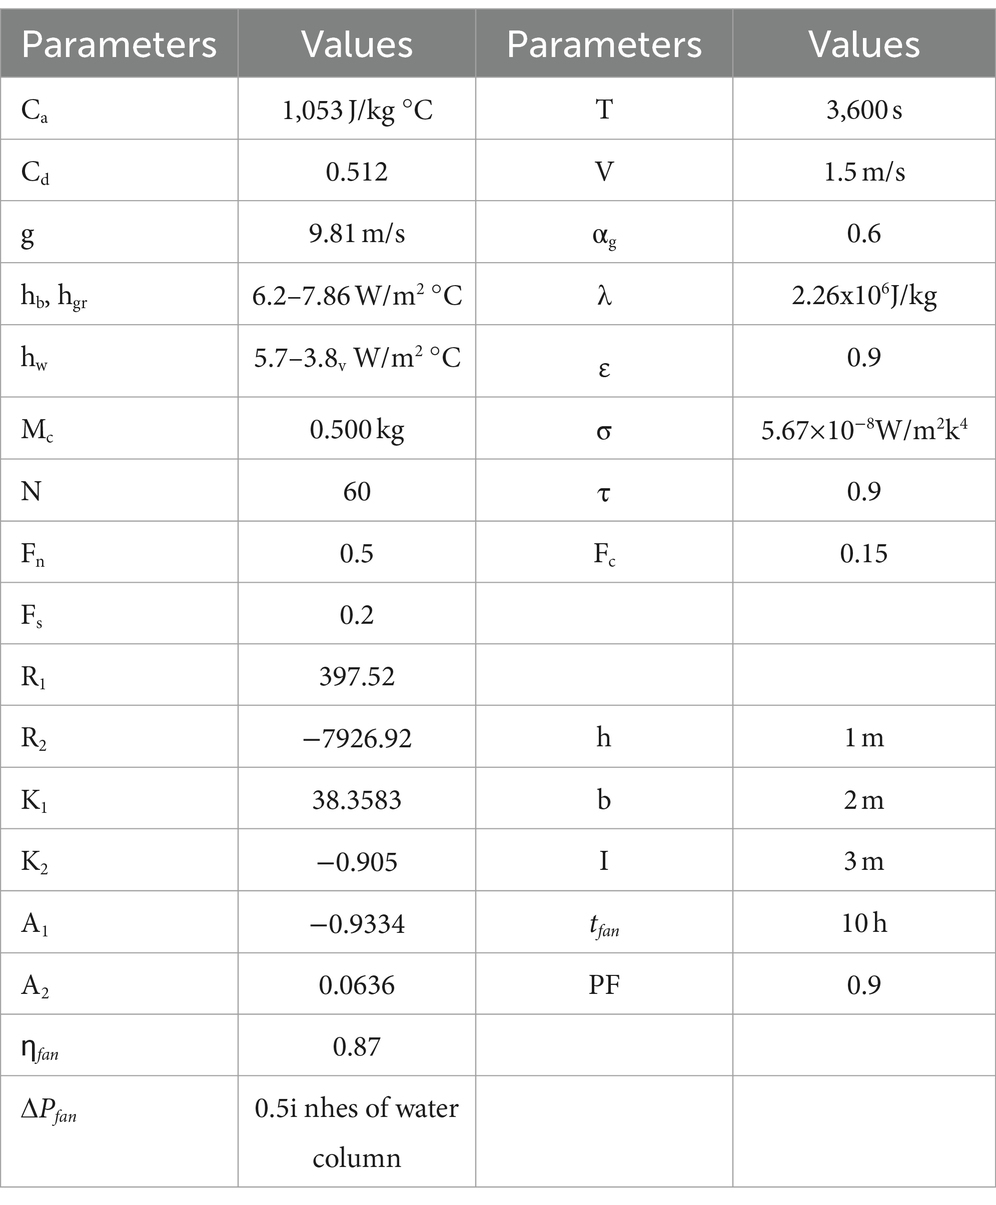
Table 1. Constants and input values of crop and fan parameters were used of mass and heat transfer models.
3 Mathematical modeling
3.1 Determination of convective mass heat transfer coefficient
Under natural convection coefficient (hc) by Eq. (1) (Tiwari, 2003).
where Gr and Pr are Grashof and Prandtl numbers, and C and n are constant to be determined. Kv and X are thermal conductivity of vapor characteristic length. The rate of heat to evaporate moisture is given as follows:
where P and γ are partial vapor pressure and relative humidity.
The convective heat transfer coefficient shows an overprediction of 16% if the experiment is vortexed. The deviation between the experimental results and the model is larger at higher operating temperatures. Jamil and Akhtar (2017) reported a 30% increase in prediction compared to their experiments. In other studies, different values have been proposed for the constant values in the Eq. (3). To improve the accuracy of estimates, the modeling method relies on a set of mathematical equations that explain the drying process and the energy that controls and regulates the operation of the dryer. The main goal of modeling is to search for the best method and operating conditions for drying the desired product. The application of modeling is known as a very valuable and useful tool to predict the performance of the drying system and the drying behavior of agricultural products under different conditions (Daliran et al., 2023).
The moisture evaporated Is calculated By dividing Eq. (3) By latent heat of vaporization(λ) and multiplying area of The tray (At) and time interval (t).
where:
The convective mass heat transfers under forced convection
where (Re) is Reynolds number.
The Equations from (1, 7), evaluate the values of Transfer coefficient under convection and forced mode from some Parameters such as moisture evaporation rate, crop temperature, relative humidity, and temperature above the crop surface are known then the values of (Y) and (X0) can be computed to put into the liner from find out the (m) and (C0) now the m and (C0) give the values of n and C, then to calculating the physical properties of humid air such as specific heat (Cv), thermal conductivity (Kv) density (pv) and dynamic viscosity (μv) and the partial vapor pressure (P), and V(a) and (Ti) was taken as mean of the average crop temperature (Tc) and average temperature just above the crop Surface (Tc or Tr) to obtain the physical properties of humid air. Exponential curve fitting (two-term) has been used to do regression analysis on a number of mathematical models for thin-layer solar drying in the following ways: The convective mass transfer coefficient determines the drying time (T in hours).
These formulas were used to compute the constants (A1, A2, K1, and K2). Using Eq. (8), it was possible to estimate the relationship between the convective heat transfer coefficient and drying time. The correlation coefficient and the mean square of the variation together determine the quality of fit (Yaldiz et al., 2001). A1 and A2 are the constants, while K1 and K2 are the expression coefficients whose values for the selected product (potatoes) for drying in the greenhouse under forced convection mode are obtained from the literature (Jain and Tiwari, 2004) and are shown in Table 1.
The average crop temperature (Tc) and the temperature above the surface of the crop (Tc or Tr) for the crop inside the greenhouses were calculated hourly for evaporated moisture. The physical characteristics of moist air were estimated for the average temperature (Tc and Te or Tr), while the C and n values were derived using a linear regression technique at increasing monitoring times. The hc values were then determined at the appropriate drying hours. The computer program was set up in Excel 2016 and used a two-term exponential curve model to fit the time variations in the convective heat transfer coefficient during the experiments. The correlation coefficient and the mean square deviation of the experimental hc over the expected were calculated to fit the model.
3.2 Exponential curve
A two-term exponential curve was used to fit the experimental heat transfer coefficient as a function of the drying time (h); the equation and R2 as well as the mean square of deviation X2 showed that the model was well fit (r = 0.99 in most of the cases). However, the more deviation observed in the case of GHD natural convection and GHD forced convection were within experimental error.
3.3 Determination of experimental error
The determination of the experimental error was based on the percent uncertainty (external and internal) for the rate of moisture evaporation (which is the most sensitive parameter).
3.4 Internal uncertainty
The percentage of internal uncertainty has been determined for all the modes of drying using Eq. 3.9.2.
3.5 External uncertainty
External uncertainty has been calculated by considering the least count of instruments used in taking observation. Therefore, the possibility of errors in taking measurements of crop and air temperature, air relative humidity, and weight of moisture evaporated has been considered. So, the external uncertainty may be as follows:
% Error measuring crop temperature = 0.523%, Error measuring air temperature = 0.134%, Error measuring air relative humidity =0.121%, Error measuring moisture evaporated =0.143%, Total percent external uncertainty = 0.9%. Similarly, the percentage uncertainties of experiments with different modes of drying for potatoes have been evaluated and are given in Table 2.
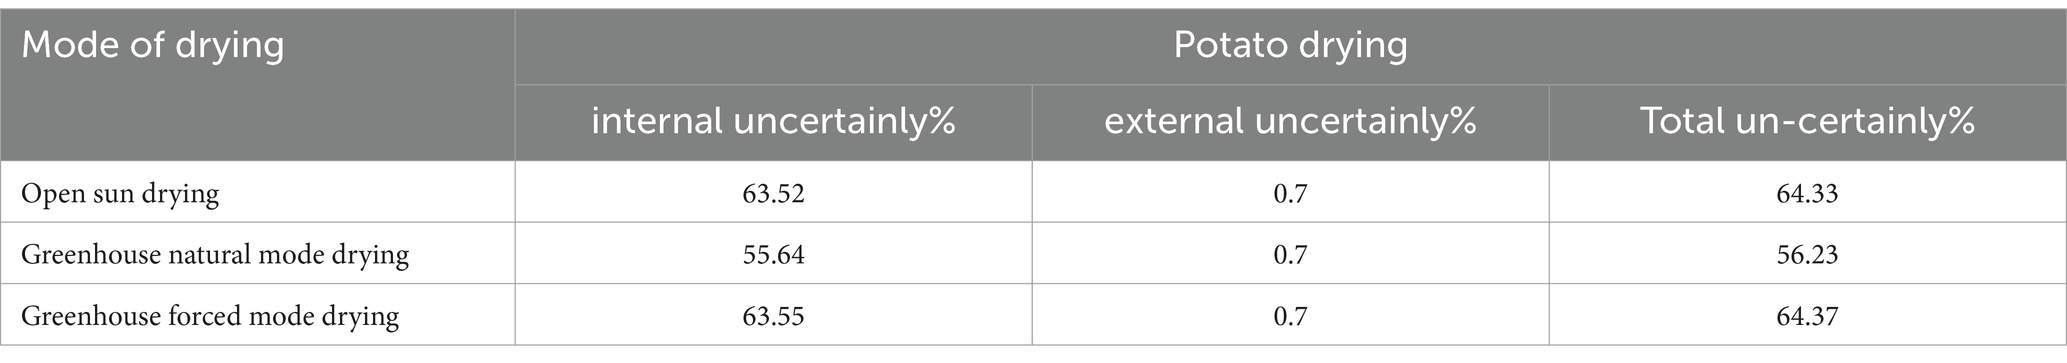
Table 2. Experimental percent for potato under different mode of drying.
4 Thermal model
4.1 Basic assumptions and energy balance
To evaluate the mass transfer for moist air and to develop the thermal model, the following assumptions have been made for predicting the crop temperature and moisture evaporation during greenhouse drying under forced and natural modes, as well as during open sun drying mode:
i. Thin-layer drying (Potato crop).
ii. Surface area of crop.
iii. Heat capacity of the cover is neglected.
iv. The greenhouse is east–west oriented.
4.2 For moisture evaporation
where I(t) is solar energy falling on the crop, At is the trays’ area, αc is the crops’ absorptivity, Tc, Te, and Ta are the temperature of the crop, moist air above the crop, and air, Mc and Cc are mass and specific heat of crop, hce, hc, and hb are the total convective and relative heat transfer from crop to moist air. An overall bottom heat transfer coefficient from crop to ambient through tray (λe) is relative humidity between crop and moist air.
4.3 For moist air above the crop
where hw is the total convective and radiative heat transfer coefficient from moist air to ambient air. A higher value of the convective heat transfer coefficient (hc) indicates faster evaporation of moisture and is one of the important parameters that determine the rate of heat transfer and mass of the dried crop and the moisture rate in the dried crop, as it varies from one crop to another, as well as with the drying method. These differences were obtained when measuring the hourly convective heat transfer rate of potatoes from a two-term exponential expression (Jain and Tiwari, 2004).
4.4 For moisture evaporated
where λ = 2.24×10⁶ is the latent heat of evaporation, and t is the time in seconds.
The solar drying temperature ranges between 25 and 55°C; hence, the partial vapor pressure can be expressed linearly as follows:
where R1 and R2 are constants derived from the linear regression analysis. From the recorded values of hourly solar energy intensity on a horizontal plane and with the help of Liu and Jordan’s equation, the average hourly solar radiation intensity over the north and south canopy of the greenhouse (Ii) was calculated. ∑IiAiτi represents the amount of solar radiation per hour transmitted through the greenhouse cover. Fn refers to the fraction of solar radiation lost through the north wall of the greenhouse, while Fs is the fraction of solar radiation blocked due to nearby structural obstacles. The term Fc represents the proportion of solar radiation received by the dried crop, while αc represents the absorption capacity of the dried crop. The values of Fn, Fc, and αc were obtained from the literature (Tiwari, 2003) and are presented in the Eq. (13) and Table 1.
4.5 Crop surface
where Fn is the solar function for the north canopy cover, Fc is the function of incidence solar radiation on the crop, and αc is the absorptivity of the crop.
LHS is the rate of thermal energy on the surface of the product, while RHS in the first term is the rate of thermal energy stored in the product, the second term is the rate of thermal energy lost due to convection, and the third term is the rate of thermal energy lost as a result of moisture evaporation. Convection heat transfer coefficient (hc) it determines the rate of heat and mass transfer of product. Depending on the moisture content in the product. But it varies from one product to another, as well as the drying method. If its value is high, it indicates that moisture evaporates faster. Hourly variations in potato convective heat transfer were measured from a two-term exponential expression (Brewster and Li, 2020).
4.6 Ground surface
where hgb represents the total bottom heat transfer coefficient from the floor of the greenhouse to the ground at large depth, and T0 and hg represent the overall heat transfer coefficient from the floor of the greenhouse to the greenhouse room air. Ag is the area of the ground floor and also represents the ratio of latent heat to heat, that is, the heat lost in the ground to the heat received on the surface of the ground due to convection and radiation (Kanti and Ganguly, 2016).
4.7 Greenhouse chamber
The diffusion coefficient and the variation in partial pressure were used to account for variations in the greenhouse chamber’s air and temperature. In Eq. (17), the first term represents the thermal energy rate in the greenhouse air, the second term represents the rate of received thermal energy (convection) from the dried crop, the third term represents the rate of received thermal energy due to moisture escape from the crop, and the fourth term represents the rate of received thermal energy from the dried crop due to convection, which are all representations of latent heat. Owing to radiation and convection, the earth receives thermal energy. The latent heat rate is divided into two terms: the total heat loss rate from the greenhouse air to the surrounding air and the rate of heat energy loss from the greenhouse air to the surrounding air due to forced convection.
Equations (12, 18, 19) were used to determine the greenhouse air temperature under forced convection which can be given by the following equation:
The first term in the LHS is the rate of heat energy in the greenhouse air, the second term is the rate of heat energy from the product due to convection, the third term to the rate of heat energy is the evaporation of moisture from the product, and the fourth term is the rate of heat energy radiated from the ground due to convection and radiation. In RHS, the first term is the rate of heat energy lost from greenhouse air to ambient air due to forced convection, while the second term refers to the total heat loss rate from greenhouse air to ambient air (Sarbu and Sebarchievici, 2018).
Where:
Equation (26) arranged below results from the assumption that the temperature of the Earth’s interior (T∞) is the same as the ambient air temperature (Ta) (Tiwari, 2003).
Equation (26) determines to predict the crop drying temperature, which can be represented as follows:
where
The moisture evaporation rate can be determined from Eq. (29) after crop temperature was determined. From Eq. 28, Tco is determined for the initial product temperature at the beginning of the drying process (t = 0) and f(t) is the same as the average value of f(t) during the specified time period. Jain and Tiwari (2004) found that the initial temperature of the crop is lower than the greenhouse air temperature. In the present study, this was assumed to be 2°C lower than the greenhouse air temperature. The values of the different parameters used in the thermal model are given in Table 1. The difference in vapor pressure between the crop and the surrounding air in the greenhouse determines the moisture evaporation rate; it can be expressed as follows:
The expression of coefficient of diffusion under natural mode is as follows:
Energy balance for greenhouse drying under forced mode is as follows:
From linear regression, the partial vapor pressure at Tr and Ta was estimated from Eq. (12), and then Eq. (32) was solved to determine the greenhouse room temperature by assuming the initial value of the crop temperature, such as follows:
From the ventilation rate and pressure drop, the estimated theoretical power of induced draft fans (Pfan) can be estimated as shown in Ganguly and Ghosh (2009).
where.
ΔPfan is the pressure drop across the fan, and ηfan is the drive efficiency of the fans. Fan operation and daily electrical energy consumed (Ah) is given by Ganguly and Ghosh (2009).
where tfan is the daily designed duty hour of fan operation (i.e., the drying period). PF is the power factor of AC load, and Vsystem is the system voltage of the PV array shown in Table 1.
5 Economic model of the proposed greenhouse dryer
The capital invested in drying technology in greenhouses is not economical, whether in terms of initial cost or operating cost. It is important that the cost of drying is low so that entrepreneurs and emerging small companies can achieve profits. Therefore, from a commercial point of view, the economic feasibility of the proposed greenhouse dryer must be justified. To establish the yearly cost method in terms of the payback period for the greenhouse dryer, the cost analysis of the proposed greenhouse dryer is described in this part. It is based on the payback period, operating cost, life of the dryer, and its salvage value. The present net value of the designed dryer in this study can be given as follows (Barnwal and Tiwari, 2008):
In (Equation 37), Pi is the initial investment cost of the greenhouse dryer which is calculated from the different components and presented in Table 1. ‘n’ is the expected life of the dryer which is presumed to be 20 years. Rm is the annual maintenance cost, which is 1% of the initial investment cost. The term Rp refers to the replacement cost which includes the cost of replacing the UV-protected polyethylene sheets, while “i” is the payable interest rate to any financial institution and the money was borrowed from De and Ganguly (2016).
The present net value can equally be given in terms of annual cash flow and payback period as follows (Barnwal and Tiwari, 2008).
In Eq. (38), CF expresses the net cash flow generated at the end of each operating year. It is assumed that the costs for the raw product (fresh potatoes) and the dried product (dried potatoes) are (US$)1.25/(kg) and (US$)0.353/(kg), respectively, in the local market. It was found that approximately 6 kg of dried potatoes per day can be obtained from 10 kg of fresh potatoes. So, the cash flow is ($)1.622/(day). If the greenhouse dryer is kept in operation for 310 days per year, the annual cash flow is ($)784.92. The payback period (np) can be expressed as follows (Barnwal and Tiwari, 2008):
Table 3 represents the cost of greenhouse dryer.
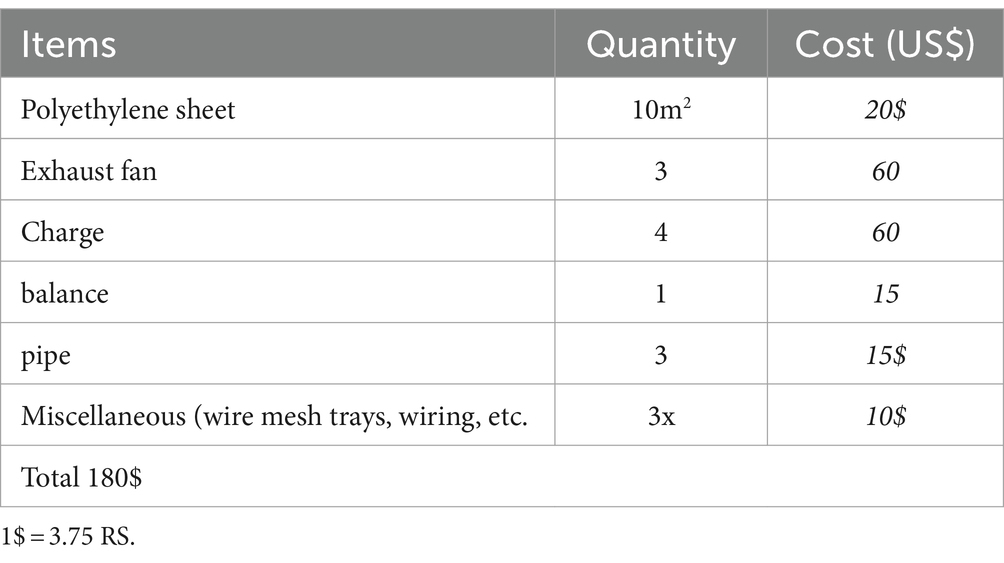
Table 3. Cost of greenhouse dryer.
6 Results and discussion
6.1 Variation of different parameters with time of the day and different dryer modes
There are many ambient factors that play a fundamental role and have a major impact on the drying process of any type of dryer. These factors include the intensity of solar radiation, the ambient air temperature, as well as the temperature inside the dryers, the air speed, meaning the amount of air flow, as well as moisture content and the geometric characteristics of the dryers, because these parameters are involved in evaluating the efficiency and performance of dryers and the thermal model of the solar greenhouse.
Regarding to Amer and Albaloushi (2019) during the drying period, the intensity of solar radiation, temperature, and humidity change, the air speed is constantly changing with sunlight, and the moisture content and drying rate of agricultural products also varies constantly with time. The rate of their decrease depends on weather conditions, and it is important to take these factors into consideration because they affect the quality of the solar dryer.
Figure 3 mentions that during the experimental period, the sky was clear and there were no clouds, and the daily average of solar radiation energy was 5,731(kWh). These rays are considered the source of energy for drying inside the greenhouse and have a significant impact on the drying process. As the radiation increases, the air temperature increases, reaching 52(C°) in the FGD. It reached 46(C°) in NGD, while the OSD was 38(C°). Based on the data from the greenhouse, the temperature rose by 15.3(C°), which led to a decrease in the humidity percentage to 37.7(%) and the abscess by 11.4(%). There are differences and variations in the amount of solar radiation during the daylight hours as the maximum temperature reached at 1(pm). This confirms that the temperature of the greenhouse air from the outside contributed significantly to the drying process, although it was slow in the beginning due to the high initial humidity, and over time, with the rise in sunlight and temperature, the drying process increased due to the presence of the direct relationship between the change in temperature and solar radiation. This result agrees with Purusothaman and Valarmathi (2021) who reported that increasing the intensity and amount of solar radiation falling on the dryers leads to an increase in the temperature inside the dryer, which leads to rapid removal of moisture from the products inside the dryer.
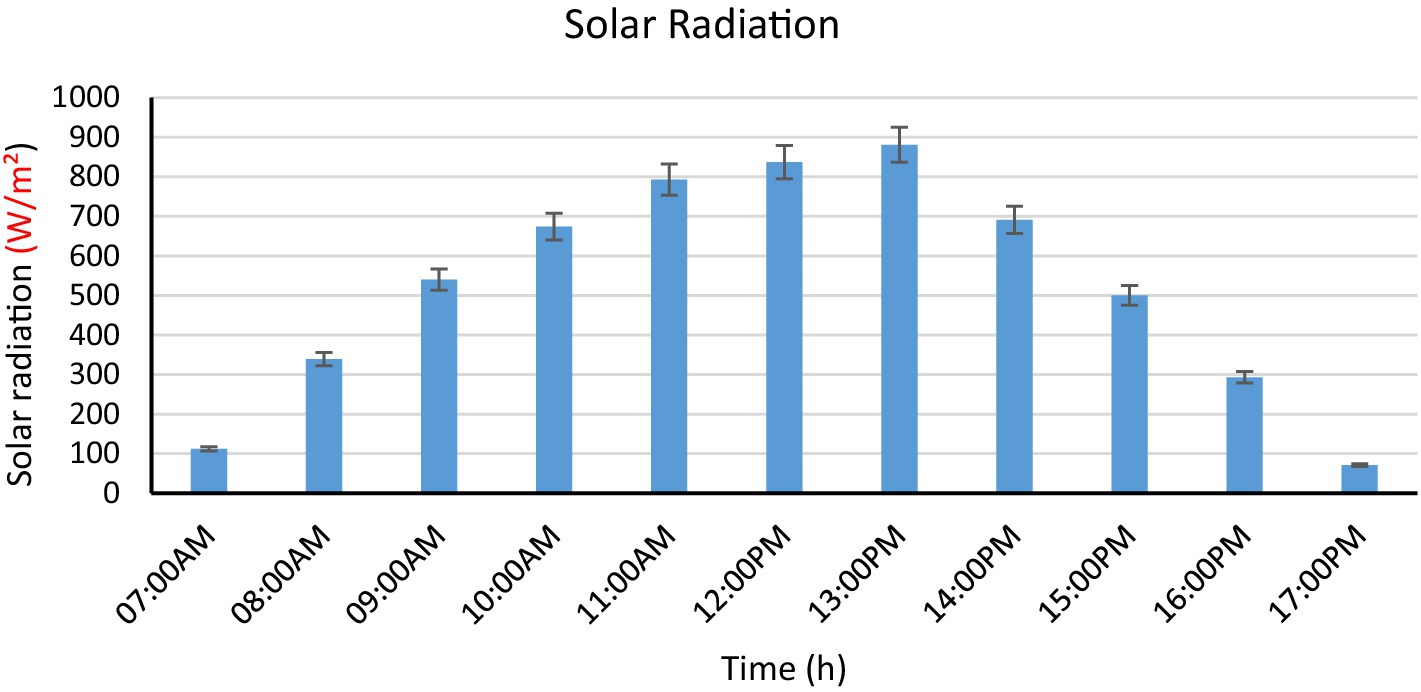
Figure 3. Variation of solar radiation with time of the day.
Tables 4, 5 and Figure 4 are also showing data for the product to be dried as well as the greenhouse and predict the hourly values of the product temperature, greenhouse air temperature, and convective heat transfer coefficient during the drying period. The warm temperature ranged from 52(°C) to a maximum of 55(°C) at 1(pm). The FGD temperature ranges from 52 to 55(°C), and the NGD temperature ranges from 45(°C) to 48(°C). Ambient temperatures range from 39 to 42(°C). Initially, the drying process was low due to the product containing a high degree of moisture, and the drying process gradually began to increase due to the continuous removal of moisture from the product. This resulted in the line with the previous study (Kondori and Saravia, 1998; Jimoh et al., 2023) who conducted some analytical tests to study the moisture content in dried red pepper in greenhouses using two different methods of forced convection and simulation using a drying chamber. The results showed significant improvement in drying efficiency, that is, 90% (Ndirangu et al., 2020) The temperature changes with solar radiation over time. It was observed that the average temperature is during the first 5 h of drying. The temperature changes increase with the increase in solar radiation and also decrease with the decrease in solar radiation. It was also found that sunlight has a direct effect on the temperatures of the dryers.
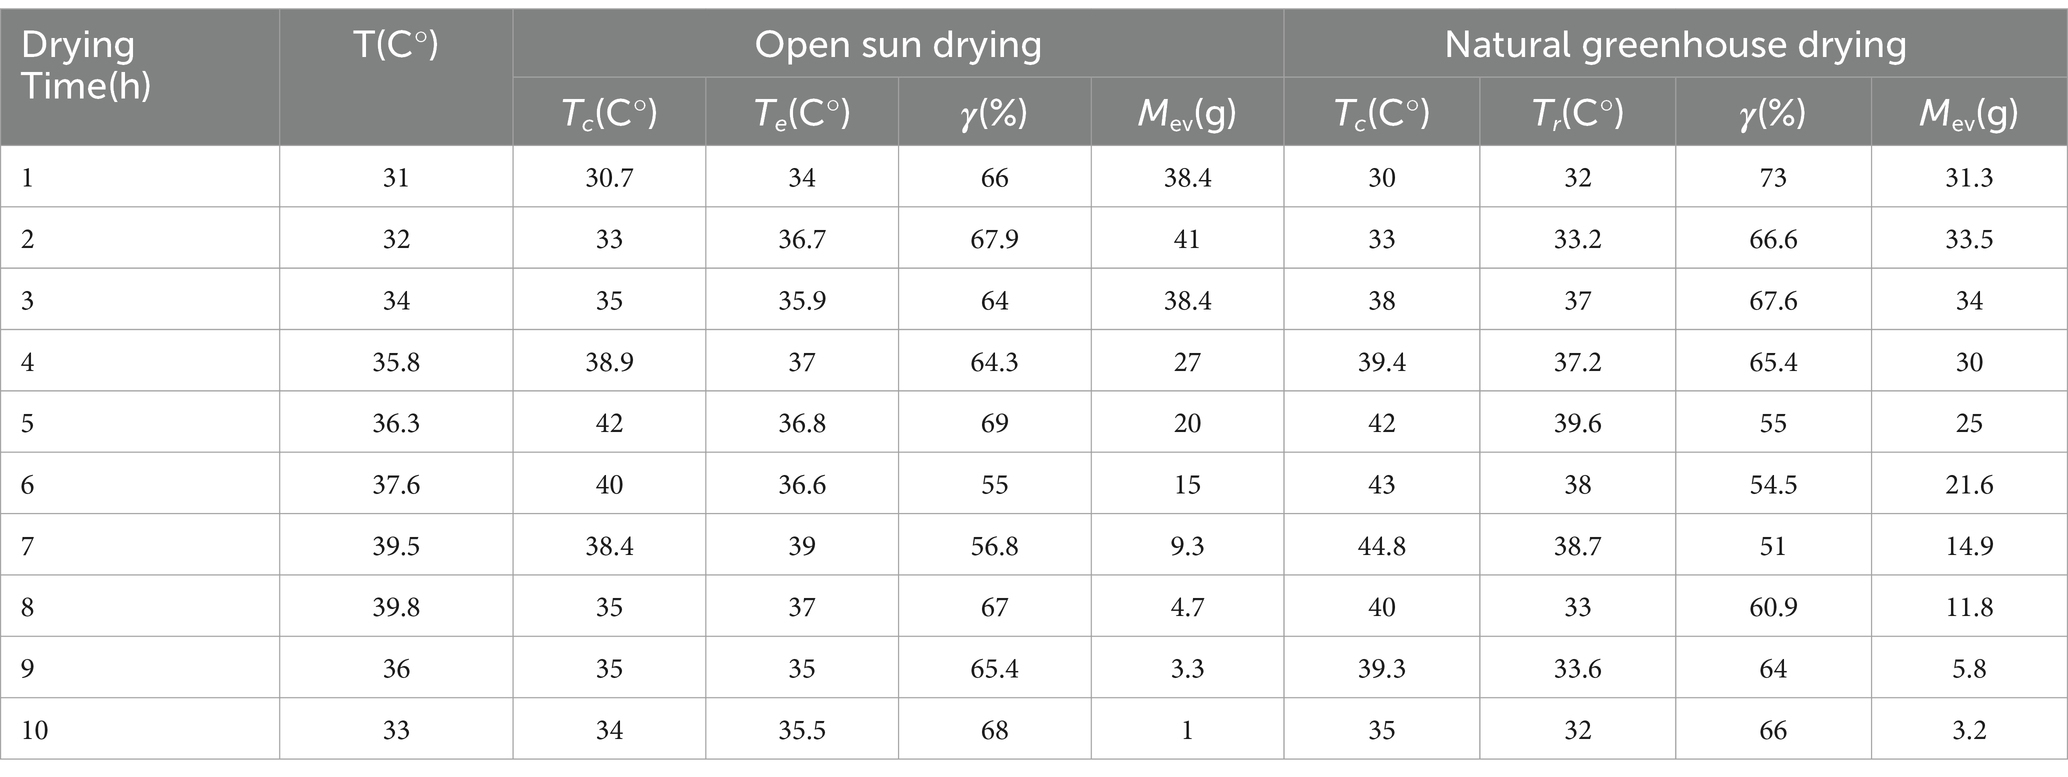
Table 4. Temperature of product and moisture content under open sun drying and natural convection greenhouse drying.
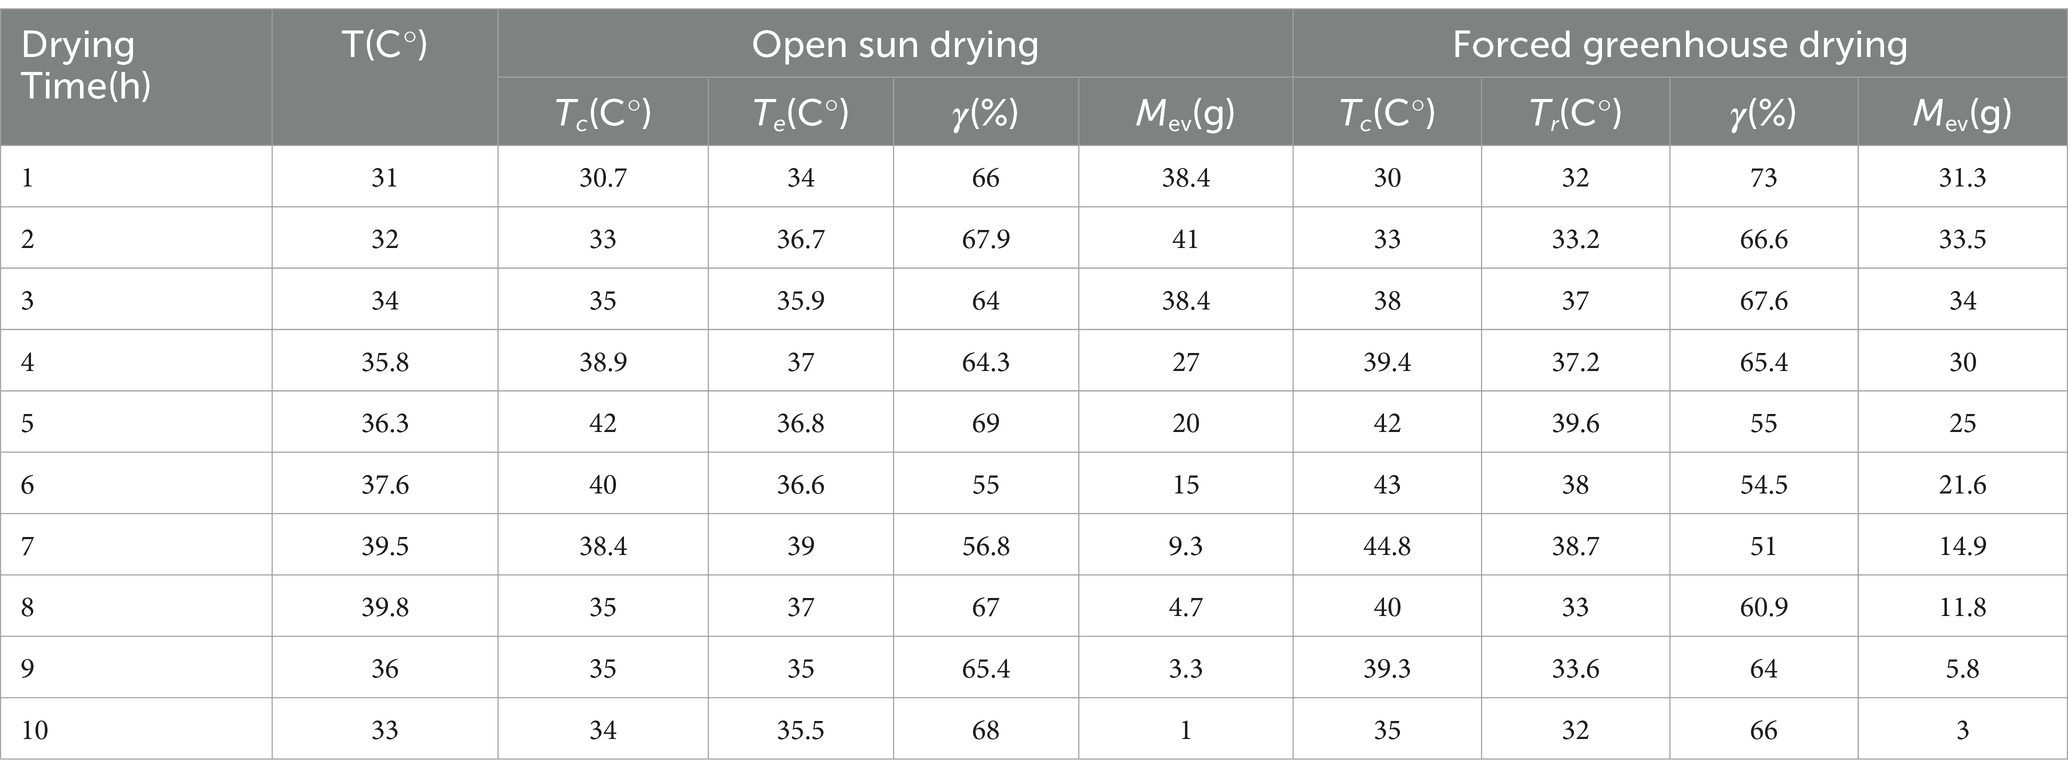
Table 5. Temperature of product and moisture content under open sun drying and forced convection greenhouse drying.
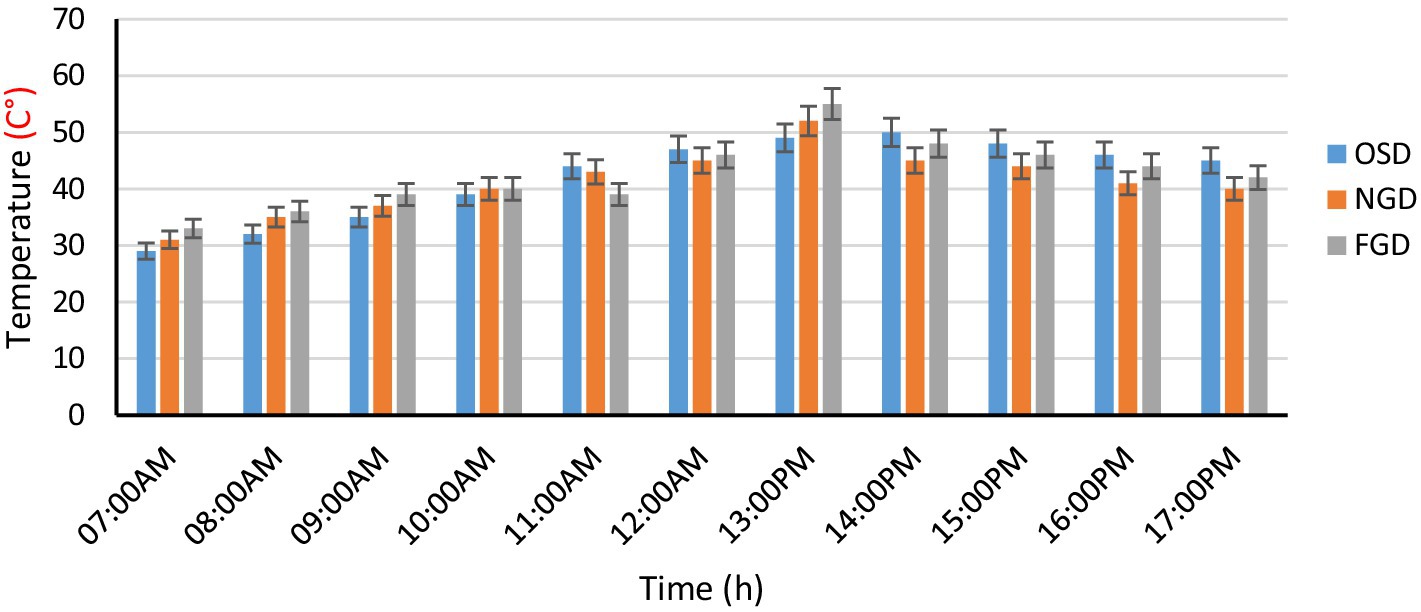
Figure 4. Variation of temperature with time of the day inside dryer modes.
6.2 Variation of relative humidity with time of the day and different dryer modes
Figure 5 shows the variation in relative humidity value over time. The relative humidity of the air ranged from 38 to 24(%), the NGD dryer ranged from 35 to 20.1(%), and the FGD dryer ranged from 32.1 to 19.4(%). It turns out that the relative humidity within the FGD area is lower than that of NGD, and the atmospheric relative humidity is considered a suitable condition for drying the crop with NGD and open sun. As a result of the decrease in density, the hot air moves upward. In FGD, the humid air is on the upper side, where the extractor fans constantly draw it in and remove it. The relative humidity inside the NGD area is lower than the outside relative humidity, but it is higher than the FGD, and because there is no fan to be able to remove the humid air, this result is consistent with Almuhanna (2012). To validate the refractory model, parameters listed in Table 1 are used. Figure 5 shows hourly changes in product temperature and greenhouse air temperature, and they reached their maximum values approximately 1 (pm). It was also noted that the rate of increase in the temperature of the greenhouse air is higher than the temperature of the product. This is due to the loss of heat (in the form of latent heat) from the product due to the evaporation of moisture. Thus, the temperature difference between the product and the greenhouse air increases. As the rate of moisture evaporation from the product decreases, the temperature difference is also significantly reduced, which is observed during the late afternoon hours. This result agrees with Sahu et al. (2024).
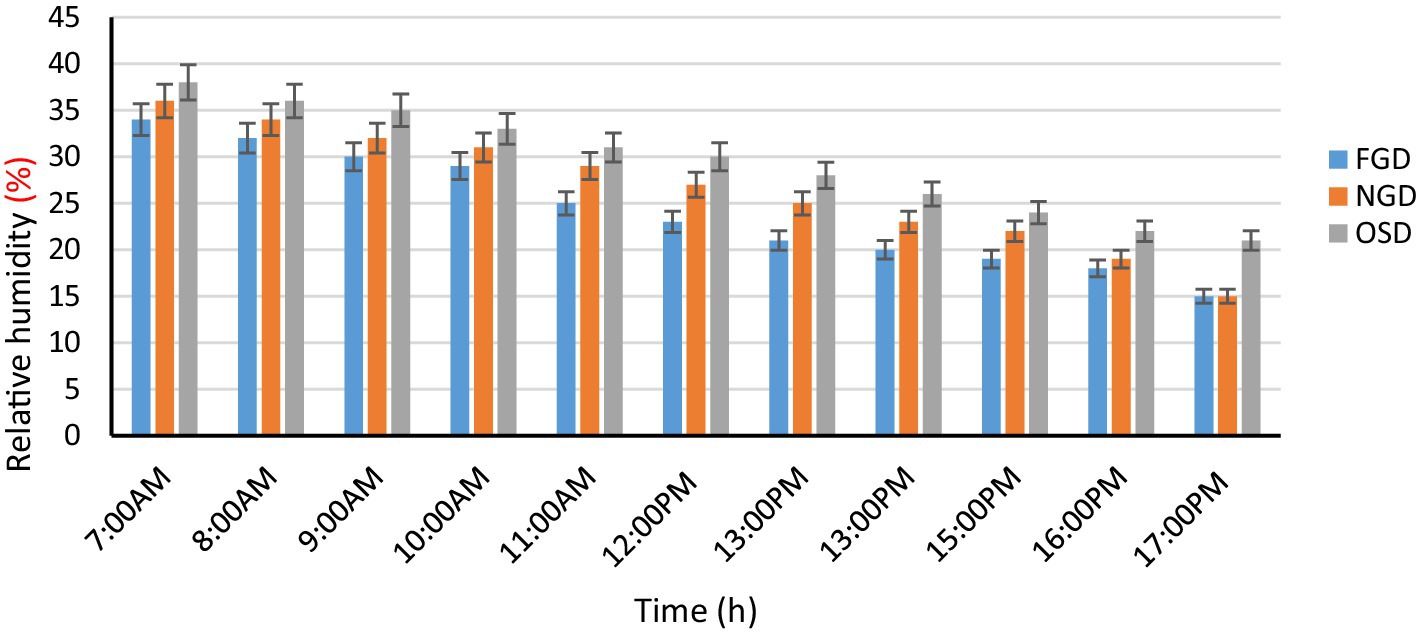
Figure 5. Variation of relative humidity with time of the day inside dryer modes.
Figure 6 shows the change in wind speed over time because it has an important role in drying potato chips. It was observed that at a speed from 1 to 2.5 (m/s) at 1 (pm), the wind speed and solar radiation are at the highest value. At this speed, the ambient temperature of the NGD and FGD dryer decreased slightly. There is also a slight decrease in relative humidity. It was found that the ambient temperature was highest at 1 (pm), and the wind speed at that time was quite low, that is, 1.2 (m/s). The internal space of FGD for drying crops is a little big compared to NGD due to the slope of the roof and the presence of the extractor fan. So, the air is circulated inside. It is also noted that the relative humidity increases with increasing wind speed, then decreases in temperature, and decreases with decreasing wind speed and increasing temperature. Temperature with lower relative humidity is a suitable condition for drying any type of crop which is achieved with FGD compared to NGD and drying in the OSD. This result agrees with Abuelnuor et al. (2023) who reported that the use of fans enhances the drying process; if the air flow inside the tunnel dryer increases greenhouse type with a certain rate, the drying rate can be increased by approximately 12–13(%), and if the flow rate increases above a certain rate, it has no positive effect on the drying process. Air flow is achieved with the help of fans. If the air speed is constant, it leads to an increase in temperature and a decrease in energy consumption and drying time (Kaveh et al., 2021).
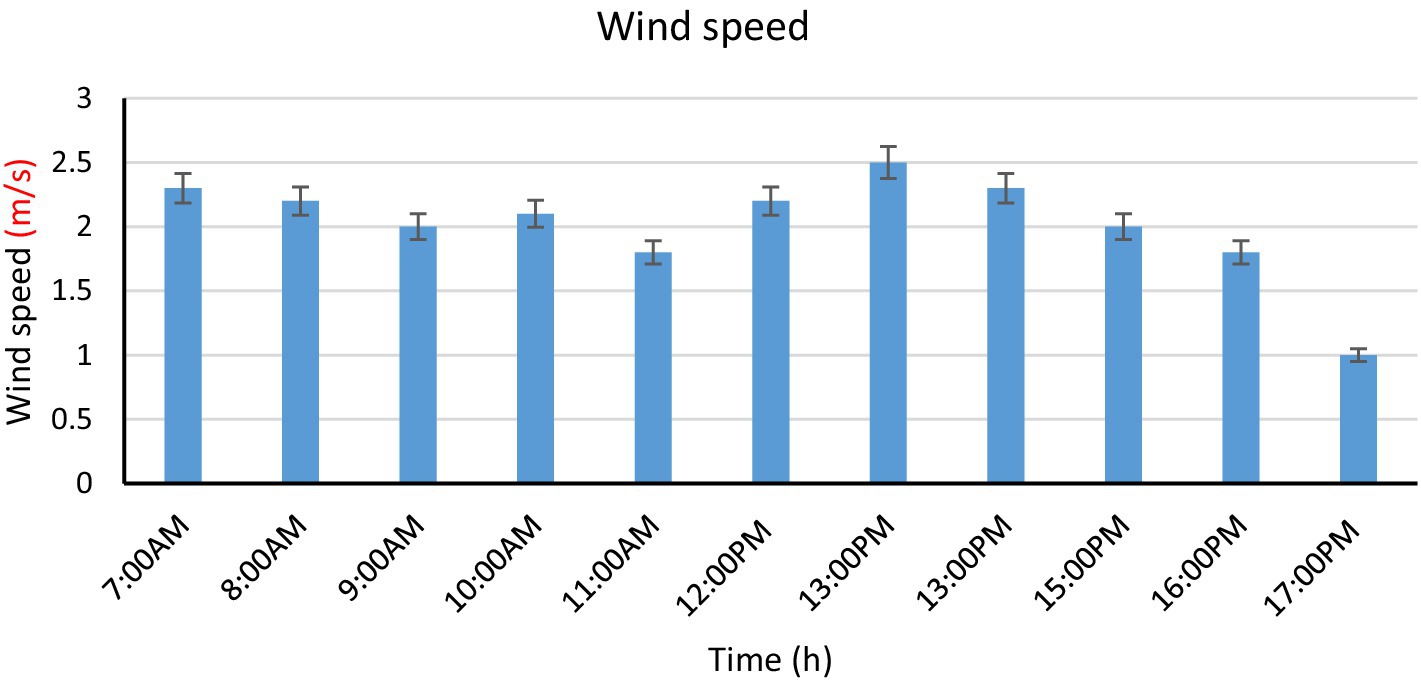
Figure 6. Variation of wind speed with time of the day.
Figure 7 shows the variation of the convective heat transfer coefficient (hc) of the product with time of day. It was found that there was a decrease in the heat transfer coefficient by convection with time, and the value of the heat transfer coefficient by convection reached approximately 36 (W/m2) at the beginning of the drying process in the morning at 7(am), and it gradually decreased to approximately 13 (W/m2) at the end of drying at 5(pm). This is due to the dependence of the convective heat transfer coefficient on the instantaneous value of the moisture content in the product and also because the surface of the product contains a high percentage of moisture at the beginning of the drying period, which gradually decreases as the drying process continues. Therefore, the value of the convective heat transfer coefficient of the product gradually decreases.
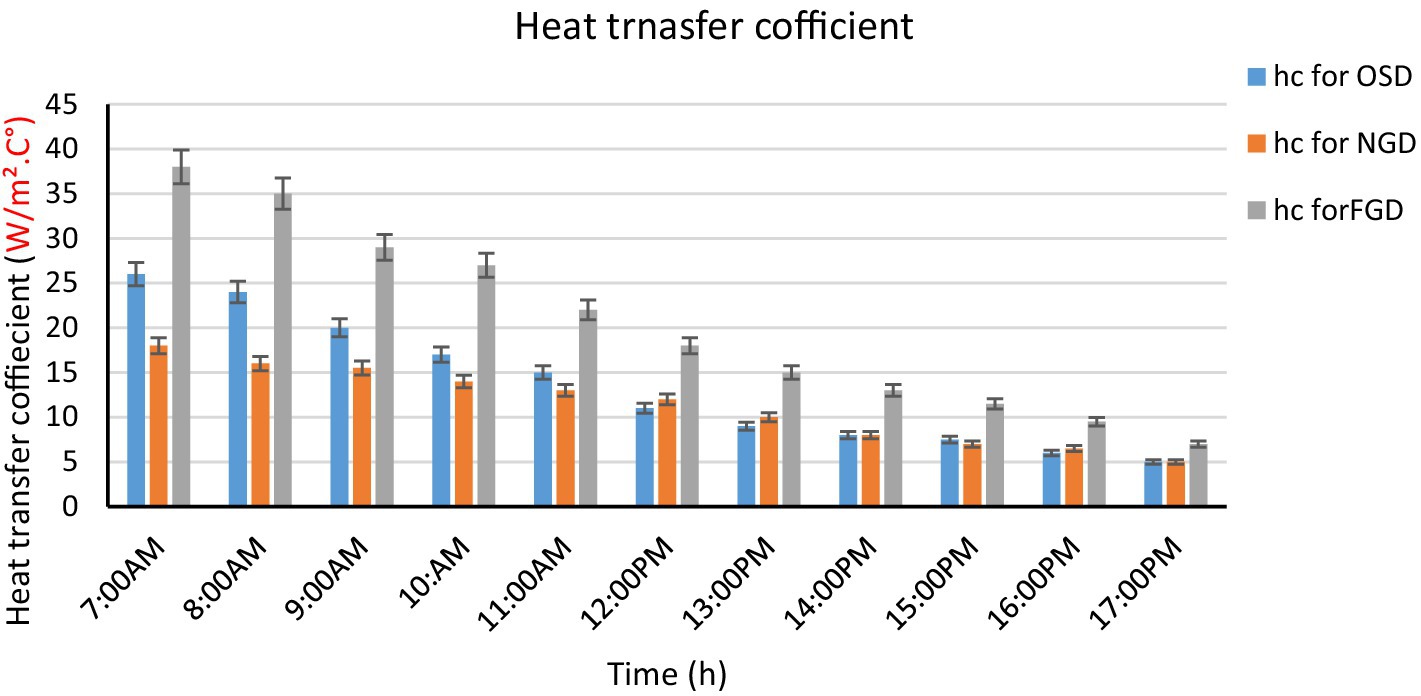
Figure 7. Variation of heat transfer coefficient with time of the day inside dryer modes.
Figure 8 shows the change in moisture evaporated from the product every hour of the day during the drying process. The value of moisture evaporated from the product was approximately 100 gm at the beginning of the drying process at 1(pm). With the rate of moisture evaporation increasing as drying continued, the maximum value reached approximately 320(gm) at 1(pm), and then, it began to decrease because the rate of moisture evaporation from the product at any time depends on Initial product humidity, absorbed solar radiation, ambient conditions, and air speed as stated by De and Ganguly (2016); in such an experiment, the speed of the air flowing over the product must be constant during the drying process. It is also found that maximum moisture removal occurs in the first 6 to 7 h of drying. This drying period falls within the fixed rate of drying classification. The amount of moisture evaporated from the product during the drying period is also evaluated on an hourly basis. As shown in Figure 5, there is a large variation in product temperature during open solar drying OSD and natural convection drying NGD in the greenhouse due to the high initial moisture content and the moisture evaporation (Mev). Equation (4) mentions the wet surface of the product because the rate of moisture evaporation is constant, and since hc is a function of Mev, this period is the minimum constant drying rate. This means that the maximum rate of moisture evaporation occurred in the first 6 h from the beginning of drying. This result is consistent with the previous study (Sahu et al., 2016; Pringal et al., 2024).
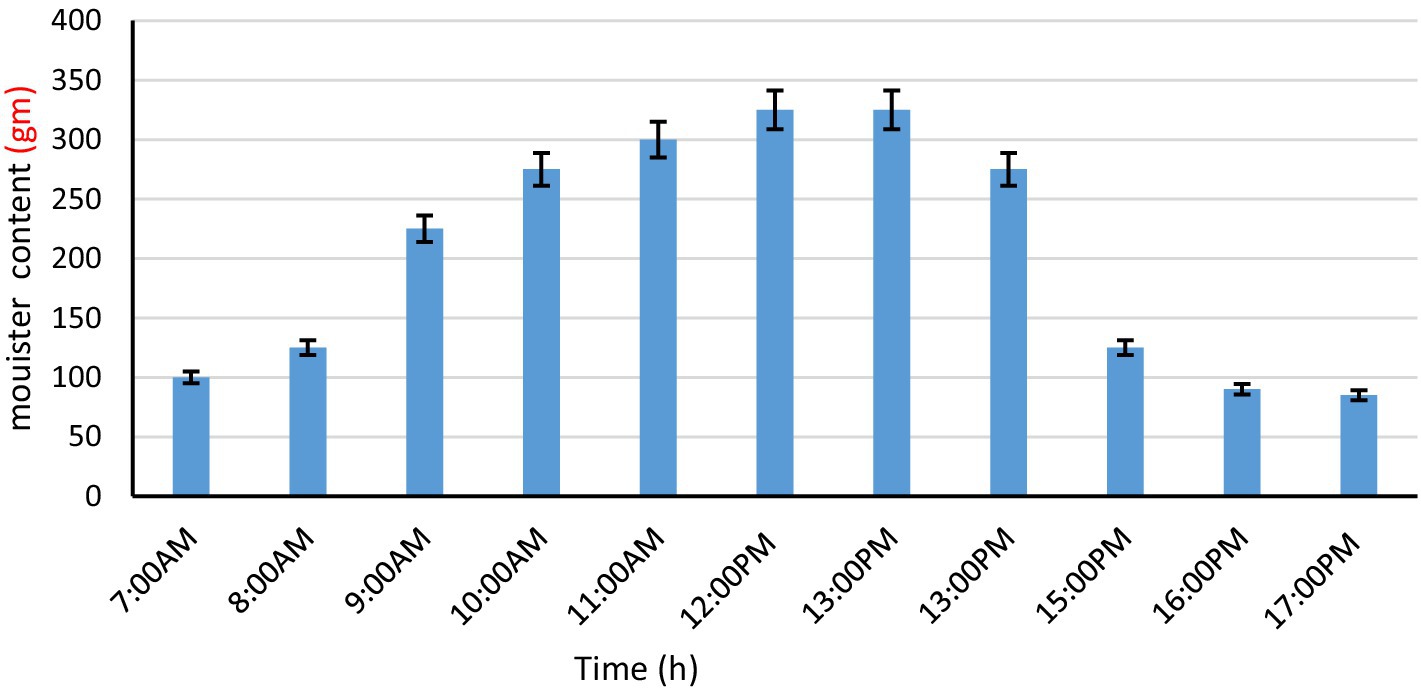
Figure 8. Variation of product drying coefficient with time of the day.
6.3 Economic model of the proposed greenhouse dryer
Effect of interest rate on the payback period of the proposed greenhouse dryer for a given value of total cost It was found that there is an increase in the payback period of the dryer from 5.7 years to 15 years with an increase in the interest rate from 5 to 13 (%). It turns out that as the interest rate increases, the net present value of the dryer decreases significantly. This result is in line with De and Ganguly (2016).
7 Conclusion
In this research, three models were designed, and their performance was evaluated for drying potatoes in a greenhouse under an open sun dryer and natural and forced convection to predict the product temperature, the greenhouse air temperature, and the convective heat transfer coefficient. The importance of the convective heat transfer coefficient lies in the speed and movement of drying, due to the difference in temperature of the air and the product to be dried. Finally, an economic analysis of the dryer was performed to estimate the payback period. The results were as follows:
1. At the beginning of drying, the value of the convective heat transfer coefficient was higher compared to the end of drying, and the first 10 h of drying are considered the maximum for moisture removal.
2. The maximum temperatures in FGD, NGD, and OSD are 55(C°), 45, and 39(C°), respectively.
3. The maximum temperature of potato slice was 52 (°C) which is in FGD whereas in NGD, OSD with value of 19.4 (%) and 20.1 (%) respectively. NGD is suitable for high moisture content crops because relative humidity can be maintained by exhaust fan.
4. The drying in FDG is found to be faster as compared to NGD and OSD.
5. The initial moisture content of the product was 89(%) and the final moisture content removed was 82.1(%) in the FGD and 80(%) and 73(%) in NGD and OSD, respectively.
6. Based on the economic analysis, it was found that the total cost of manufacturing greenhouse dryers is not high, which encourages community members, businessmen, and small farmers to adopt it and calculate the payback period for the dryer.
7. The correlation coefficient values ranged from 0.95 to 0.52 for yield and protected room air temperature and from 0.99 to 0.96 for moisture evaporation rate, indicating that the values obtained were well matched.
The current study focuses on analyzing the thermal model and testing the solar dryer in a specific environment. Several recommendations for future studies are given as follows:
1. The solar photovoltaic system to operate the dryer must be designed to make greater use of the sun’s energy, in addition to introducing modern renewable energy technologies.
2. Increasing the area of the dryer by increasing the dimensions of the dryer, thus increasing the amount of dried product and diversifying the types of dried crops
3. Develop, design, and study a mathematical model for economic analysis to calculate the annual interest rate because it has a significant impact on the payback period of the dryer and the interest rate.
4. Conducting studies in which several techniques are used to analyze the quality of the dried product, such as change in color, appearance, nutritional content, texture analysis, structure analysis, sensory evaluation, statistical analysis, and how to avoid unwanted effects.
Strength of research
Analyzing mathematical models of dryers to evaluate their performances helps in determining how dryers work better, more effectively, and with less cost and effort. Encouraging the adoption of this type of technology contributes more in reducing food loss during harvest and after harvest, and even in the markets and points of sale, as well as for the individual. It contributes more to food security and environmental sustainability.
Data availability statement
The datasets presented in this article are not readily available because they need to be requested from the research coordinator. Requests to access the datasets should be directed to ZWVsbXNhYWRAa2Z1LmVkdS5zYQ==.
Author contributions
EE: Supervision, Writing – original draft. AO: Writing – review & editing, Resources. AE: Conceptualization, Writing – review & editing, Formal analysis. OM: Writing – review & editing, Project administration. BA: Writing – review & editing, Supervision.
Funding
The author(s) declare that financial support was received for the research, authorship, and/or publication of this article. The authors extend their appreciation to the Deputyship for Research and Innovation, Ministry of Education in Saudi Arabia, for funding this research study (Project number INST111).
Conflict of interest
The authors declare that the research was conducted in the absence of any commercial or financial relationships that could be construed as a potential conflict of interest.
Publisher's note
All claims expressed in this article are solely those of the authors and do not necessarily represent those of their affiliated organizations, or those of the publisher, the editors and the reviewers. Any product that may be evaluated in this article, or claim that may be made by its manufacturer, is not guaranteed or endorsed by the publisher.
References
Abuelnuor, A., Amin, M., Abuelnour, M., and Younis, O. (2023). A comprehensive review of solar dryers incorporated with phase change materials for enhanced drying efficiency. J. Energy Storage 72:108425. doi: 10.1016/j.est.2023.108425
Almuhanna, A. E. (2012). Utilization of a solar greenhouse as a solar dryer for drying dates under the climatic conditions of the Eastern Province of Saudi Arabia part I: thermal performance analysis of a solar dryer. J. Agric. Sci. 4:3. doi: 10.5539/jas.v4n3p237
Amer, B., and Albaloushi, A. (2019). Thermal and environmental analysis of development solar dryer enhanced by PV module and heat storage unit for drying cantaloupe. Misr J. Agric. Eng. 36, 239–258. doi: 10.21608/mjae.2019.94450
Amer, B., and Albaloushi, N. (2021). A developed design to improve the performance of solar dryer supported by sensible heat storage and photovoltaric module for drying cantaloupe. Fresenius Environ. Bull. 30, 2920–2930.
Amer, B., and Chouikhi, H. (2020). Smartphone application using a visual programming language to compute drying/solar drying characteristics of agricultural products. Sustain. For. 12:8148. doi: 10.3390/su12198148
Anwar, S. I., and Tiwari, G. N. (2001a). Evaluation of convective heat transfer coefficient in crop drying under open sun drying conditions. Energy Convers. Manag. 42, 627–637. doi: 10.1016/S0196-8904(00)00065-0
Anwar, S. I., and Tiwari, G. N. (2001b). Convective heat transfer of crops in forced convection drying – an experimental study. Energy Convers. Manag. 42, 1687–1698. doi: 10.1016/S0196-8904(00)00160-6
Ashtiani, S., Rafiee, M., Mina, M., and Martynenko, A. (2022). Cold plasma pretreatment improves the quality and nutritional value of ultrasound-assisted convective drying: the case of golden berry. Dry. Technol. 40, 1639–1657. doi: 10.1080/07373937.2022.2050255
Azam, M. M., Eltawil, M. A., and Amer, B. M. A. (2020). Thermal analysis of PV system and solar collector integrated with greenhouse dryer for drying tomatoes. Energy 212:118764. doi: 10.1016/j.energy.2020.118764
Bala, B. K., Mondol, M. R. A., Biswas, B. K., Das Chowdury, B. L., and Janjai, S. (2003). Solar drying of pineapple using solar tunnel drier. Renew. Energy 28, 183–190. doi: 10.1016/S0960-1481(02)00034-4
Barnwal, P., and Tiwari, A. (2008). Design, construction and testing of hybrid photovoltaic integrated greenhouse dryer. Int. J. Agric. Res. 3, 110–120. doi: 10.3923/ijar.2008.110.120
Brewster, M., and Li, X. (2020). Analysis of radiation-induced cooling and growth of mist and cloud droplets. Int. J. Heat Mass Transf. 166:120674. doi: 10.1016/j.ijheatmasstransfer.2020.120674
Chauhan, P. S., and Kumar, A. (2016). Performance analysis of greenhouse dryer by using insulated north-wall under natural convection mode. Energy Rep. 2, 107–116. doi: 10.1016/j.egyr.2016.05.004
Chauhan, P. S., Kumar, A., and Tekasakul, P. (2015). Applications of software in solar drying systems: a review. Renew. Sust. Energ. Rev. 51, 1326–1337. doi: 10.1016/j.rser.2015.07.025
Chokphoemphun, S., Hongkong, S., and Chokphoemphun, S. (2023). Evaluation of drying behavior and characteristics of potato slices in multi–stage convective cabinet dryer: application of artificial neural network. Inf. Process. Agric., 1–19. doi: 10.1016/j.inpa.2023.06.003
Daliran, A., Taki, M., Marzban, A., Rahnama, M., and Farhadi, R. (2023). Experimental evaluation and modeling the mass and temperature of dried mint in greenhouse solar dryer; application of machine learning method. Case Stud. Therm. Eng. 47:103048. doi: 10.1016/j.csite.2023.103048
De, R., and Ganguly, A. (2016). Thermal model development and performance analysis of a solar photovoltaic supported greenhouse dryer. Int. J. Renew. Energy Technol. 7:361. doi: 10.1504/IJRET.2016.080116
Devaux, A., Goffart, J. P., Petsakos, A., Kromann, P., Gatto, M., Okello, J., et al. (2019). “Global food security, contributions from sustainable potato agri-food systems” in The potato crop: its agricultural, nutritional and social contribution to humankind (Berlin/Heidelberg, Germany: Springer International Publishing), 3–35.
Ganguly, A., and Ghosh, S. (2009). Model development and experimental validation of a floriculture greenhouse under natural ventilation. Energy Build. 41, 521–527. doi: 10.1016/j.enbuild.2008.11.021
Głąbska, D., Guzek, D., Groele, B., and Gutkowska, K. (2020). Fruit and vegetable intake and mental health in adults: a systematic review. Nutrients 12:115. doi: 10.3390/nu12010115
Goyal, R. K., and Tiwari, G. N. (1998). Heat and mass transfer relations for crop drying. Dry. Technol. 16, 1741–1754. doi: 10.1080/07373939808917490
Hemant, P., Laxman, G., Sampat, A., and Wagh, H. (2021). Design analysis and performance of greenhouse based solar dryer. International Journal of Advanced Research in Science, Communication and Technology (IJARSCT) 7 Available at: www.ijarsct.co.in
Jain, D., and Tiwari, G. N. (2004). Effect of greenhouse on crop drying under natural and forced convection I: evaluation of convective mass transfer coefficient. Energy Convers. Manag. 45, 765–783. doi: 10.1016/S0196-8904(03)00178-X
Jamil, B., and Akhtar, N. (2017). Comparative analysis of diffuse solar radiation models based on sky-clearness index and sunshine period for humid-subtropical climatic region of India: a case study. Renew. Sust. Energ. Rev. 78, 329–355. doi: 10.1016/j.rser.2017.04.073
Jimoh, A., Hashim, N., Shamsudin, R., Man, H. C., Jahari, M., and Onwude, D. I. (2023). Recent advances in the drying process of grains. Food Eng. Rev. 15, 548–576. doi: 10.1007/s12393-023-09333-7
Kamil, C., and Mehmet, D. (2019). Modeling of heat transfer coefficient in solar greenhouse type drying systems. Sustain. For. 11:5127. doi: 10.3390/su11185127
Kaveh, M., Gilandeh, Y., Fatemi, F., and Chen, G. (2021). Impact of different drying methods on the drying time, energy, and quality of green peas. J. Food Process. Preserv. 45:e15503. doi: 10.1111/jfpp.15503
Kondori, M., and Saravia, L. (1998). The performance of forced convection greenhouse driers. Renew. Energy 13, 453–469. doi: 10.1016/S0960-1481(98)00030-5
Krokida, M. K., Oreopoulous, V., and Maroulis, Z. B. (2001). Water loss and oil uptake as a function of frying time. J. Food Eng. 44, 39–46. doi: 10.1016/S0260-8774(00)00233-8
Ministry of Environment, Water and Agriculture. (2019). Statistical book for the year 2018. Available at: https://www.mewa.gov.sa/en/InformationCenter/Researchs/Reports/Pages/default.aspx
Ndirangu, S., Ronoh, E., Kanali, C., and Mutwiwa, N. (2020). Design and performance evaluation of a solar-biomass greenhouse dryer for drying of selected crops in western Kenya. Agric. Eng. Int. J. 22, 219–229.
Öztürk, M., Yüksel, C., and Çiftçi, E. (2024). Investigation of a photovoltaic–thermal solar dryer system with double-pass solar air collectors and absorber surfaces enhanced with graphene nanoparticles. Arab. J. Sci. Eng., 1–19. doi: 10.1007/s13369-024-08717-z
Prakash, O., and Kumar, A. (2004). A solar greenhouse drying: a review. Renew. Sust. Energ. Rev. 29, 905–910. doi: 10.1016/j.rser.2013.08.084
Pringal, P., Rathod, V., and Patel, V. (2024). Development and enhancement in drying performance of a novel portable greenhouse solar dryer. J. Stored Prod. Res. 105:102228. doi: 10.1016/j.jspr.2023.102228
Purusothaman, M., and Valarmathi, T. (2021). Comparative study of modified greenhouse solar dryer with north wall materials. Mater. Today Proc. 44, 3786–3791. doi: 10.1016/j.matpr.2020.11.923
Radwan, S., El-Kholy, M., El-Sheikh, H., and Salwa, O. (2016). Thermal performance analysis for three different geometric shapes of greenhouse type solar dryer. J. Soil Sci. Agric. Eng. 7, 857–863. doi: 10.21608/jssae.2016.40484
Rovense, A. (2015). Case of study of a concentrating solar power plant with unfired joule-Brayton cycle. Energy Procedia 82, 978–985. doi: 10.1016/j.egypro.2015.11.855
Sahu, T., Gupta, V., and Singh, A. (2016). Experimental analysis of open, simple and modified greenhouse dryers for drying potato flakes under forced convection. Int. J. Eng. Res. Appl. 6, 56–60.
Sarbu, I., and Sebarchievici, C. (2018). A comprehensive review of thermal energy storage. Sustain. For. 10:191. doi: 10.3390/su10010191
Singh, S., and Kumar, S. (2012). Testing method for thermal performance-based rating of various solar dryer designs. Sol. Energy 86, 87–98. doi: 10.1016/j.solener.2011.09.009
Singh, P., and Kumar, M. (2023). A review on thermal analysis of hybrid greenhouse solar dryer (HGSD). J. Thermal Eng. 8, 103–119. doi: 10.18186/thermal.1067047
Tawfik, M., Oweda, K. H., Abd El-Wahab, M., and Abd Allah, W. (2023). A new mode of a natural convection solar greenhouse dryer for domestic usage: performance assessment for grape drying. Agriculture 13:1046. doi: 10.3390/agriculture13051046
Tiwari, G.N. (2003). Greenhouse Technology for Controlled Environment. New Delhi, India: Narosa Publishing House, Alpha Science.
Tong, X., Sun, Z., Sigrimis, N., and Li, T. (2018). Energy sustainability performance of a sliding cover solar greenhouse: solar energy capture aspects. Biosyst. Eng. 176, 88–102. doi: 10.1016/j.biosystemseng.2018.10.008
Vasileios, K., Zoi, D., Sotirios, D., Antonios, A., Anastasia, G., and Thomas, A. (2022). A prototype passive solar drying system: exploitation of the solar chimney effect for the drying of potato and Banana. Appl. Sci. 12:11784. doi: 10.3390/app122211784
Yaldiz, O., Ertekin, C., and Uzun, H. I. (2001). Mathematical modeling of thin layer solar drying of sultana grapes. Energy 26, 457–655. doi: 10.1016/S0360-5442(01)00018-4
Keywords: thermal model, drying, greenhouse, natural convection, forced convection
Citation: Elmsaad E, Omran A, Emam A, Elmahi O and Amer B (2024) Performance evaluation and analysis of different simple thermal modeling of greenhouse dryer. Front. Sustain. Food Syst. 8:1304584. doi: 10.3389/fsufs.2024.1304584
Edited by:
B. N. Dar, Islamic University of Science and Technology, IndiaReviewed by:
Seyed-Hassan Miraei Ashtiani, Dalhousie University, CanadaCristian Torres-León, Autonomous University of Coahuila, Mexico
Copyright © 2024 Elmsaad, Omran, Emam, Elmahi and Amer. This is an open-access article distributed under the terms of the Creative Commons Attribution License (CC BY). The use, distribution or reproduction in other forums is permitted, provided the original author(s) and the copyright owner(s) are credited and that the original publication in this journal is cited, in accordance with accepted academic practice. No use, distribution or reproduction is permitted which does not comply with these terms.
*Correspondence: Egbal Elmsaad, ZWVsbXNhYWRAa2Z1LmVkdS5zYQ==; Baher Amer, YmFtZXJAa2Z1LmVkdS5zYQ==