
94% of researchers rate our articles as excellent or good
Learn more about the work of our research integrity team to safeguard the quality of each article we publish.
Find out more
ORIGINAL RESEARCH article
Front. Sustain. Food Syst. , 19 July 2024
Sec. Crop Biology and Sustainability
Volume 8 - 2024 | https://doi.org/10.3389/fsufs.2024.1288579
This article is part of the Research Topic Speed Breeding Systems For Food View all 12 articles
 Muhammad Fuad Anshori1*
 Yunus Musa1Novaty Eny Dungga1Nuniek Widiayani1Arfina Sukmawati Arifin2Andi Masniawati3
 Firmansyah Firmansyah4Muh Farid1
 Andi Dirpan2Azmi Nur Karimah Amas5
The development of cayenne pepper varieties can be optimized by multiple crossings, transgressive segregant selection based on the selection index, and identification of potential anthocyanins. The study objectives were (1) to develop a transgressive segregation index, and (2) to select transgressive segregation cayenne peppers with high productivity and anthocyanins from F3 multiple cross-generation. The study conducted two experiments at the experimental field, Hasanuddin University, from November 2022 to November 2023. The first experiment implemented an augmented design with a randomized complete block design (RCBD) as an environmental design. The genotypes as treatment consisted of two types: 110 lines of cayenne pepper were not repeated, and the 4 older chili varieties as controls were repeated in each block. All genotypes were categorized and divided into five blocks. The second experiment was the validation of the first trial. There were 13 genotypes tested with RCBD design one factor and repeated three times. Based on the study, developing a semi-objective-based selection index with canopy width, fruit weight, and yield was an innovative and effective approach to selecting F3 transgressive segregants of cayenne pepper. High-yielding transgressive lines were identified as G3-2-7-3, G2.6.9–10, G5-12–1-8, and G4.5.2–12. The G3-2-7-3 line was suggested due to its high yield potential and anthocyanin content. However, the anthocyanin content must be examined more deeply, such as using an omics approach. Nevertheless, these lines are still recommended to be continued in yield testing or crossing to produce hybrid lines that have high yield potential and anthocyanin content.
Cayenne pepper (Capsicum frutescens L.) is a horticultural commodity commonly cultivated in various parts of the world. It is an integral commodity frequently incorporated to enhance the peppery flavor of the dish (Andrade et al., 2020; Kusumiyati et al., 2022; Johnson et al., 2023). The high capsaicin content in cayenne pepper makes this product effective as a spicy seasoning for cooking (Rajametov et al., 2021; Stan et al., 2021; Bu et al., 2022; Kusumiyati et al., 2022). Additionally, cayenne pepper is predominantly preferred in various dishes as it is a rich source of nutrients, vitamins, antimicrobials and antioxidants (Yashin et al., 2017; Hernández-Pérez et al., 2020; Olasupo et al., 2021; Bu et al., 2022; Johnson et al., 2023). Therefore, the demand for cayenne pepper will continue to advance with the increasing world population.
The necessity for cayenne pepper in Indonesia is unresolved (Hanani et al., 2020). According to Hanani et al. (2020), Sundari et al. (2021), and Surya and Tedjakusuma (2022), the urgency for cayenne pepper in Indonesia is relatively high and will persistently advance with the increasing population. In a study by Sundari et al. (2021), it was reported that Indonesian chili consumption reached 5 kg/capita/year in 2019, ceaselessly expanding yearly. However, the cayenne pepper production has considerably proliferated to 1.55 tons in 2022 or an increase of 11.5% (Statistic Indonesia, 2023). However, due to production inconsistencies, the price fluctuates dynamically (Jayanti et al., 2021; Diansari et al., 2023). Therefore, developing adaptive and high-yielding cayenne pepper varieties is imperative to alleviate the challenges of the supply deficit.
Adaptive and high-yielding cayenne pepper varieties can be developed through plant breeding programs. There are various concepts in forming essential populations in plant breeding, one of which is multiple cross (Bandillo et al., 2013; Pathy et al., 2018; Sekine et al., 2021). This crossing technique is carried out by hierarchically crossing more than two pure parental lines (Acquaah, 2012; Syukur et al., 2015). Multiple crosses aim to combine various parental traits into a primary population so that the basic population has a high diversity (Bandillo et al., 2013; Pathy et al., 2018; Sekine et al., 2021). This diversity is very effectively incorporated in the selection process for plotting, for both characters with a unidirectional or opposite orientation. Several studies have reported this concept’s effectiveness in establishing essential populations, including hot peppers (Pathy et al., 2018; Arrones et al., 2020). Multiple cross-based varieties must be developed to assemble high-productivity cayenne pepper varieties in that context.
The assembly of a variety cannot be segregated from the process and stages of distribution. This stage takes time and costs to increase line stability (Acquaah, 2012; Ridzuan et al., 2018). There are several approaches to minimizing the straining process, one of which is transgressive segregation (TS) selection (de los Reyes, 2019; Koide et al., 2019; Pabuayon et al., 2021). TS is a collection of lines in the outer region of the distribution of variance in a population (Maryono Yuniawati et al., 2019; Nascimento et al., 2019). The breeding process is swifter as the selection of TS lines can be identified in the early generations of F3 and F4 (Koide et al., 2019; Pabuayon et al., 2021; Shwetha et al., 2022). The selected TS lines have a high level of homozygosity with better stability and adaptation than other test lines or varieties. The application of this concept has also been reported by Nascimento et al. (2019) on ornamental chilies, Alimi et al. (2013), Yunandra et al. (2018), and Rostini et al. (2019) on Capsicum annum L. red chilies. However, the effectiveness of TS requires further development. This selection concept is still focused on the main character and does not involve the accumulative role of secondary characters. Therefore, the development of TS selection requires maximal optimization to support the effective and precise assembly of cayenne pepper. One of the concepts that can be offered is the selection index approach.
The selection index is a multiple linear equation for various selection criteria (Lopez-Cruz and de los Campos, 2021; Cerón-Rojas and Crossa, 2022). Each selection criterion is weighted in the equation by the priority value, economics, and the genetic role of each selection criterion (Anshori et al., 2022; Cerón-Rojas and Crossa, 2022; Chung and Liao, 2022). The results of the accumulated weighting multiplication and absolute scores for each selection criterion serve as a ranking reference in the selection process (Lopez-Cruz and de los Campos, 2021; Anshori et al., 2022; Cerón-Rojas and Crossa, 2022; Farid et al., 2022). Several studies have reported the effectiveness of using the selection index in the grafting process (Padjung et al., 2021; Anshori et al., 2022; Chung and Liao, 2022; Fadhilah et al., 2022; Farid et al., 2022). The concept of this selection index can be integrated into selecting transgressive lines in the F3 generation. This combination has yet to be widely reported, especially in the selection of cayenne pepper distribution. Therefore, a transgressive segregated selection index can effectively develop cayenne pepper lines in multiple cross-F3 populations.
The development of cayenne pepper also postulates concentration on the potential quality of the fruit (Johnson et al., 2023). One of the qualities that can strengthen the added value of cayenne pepper is its anthocyanin content. Anthocyanin content is an effective antioxidant substance in the eradication of free radicals and fortification of body immunity (Marszałek et al., 2017; Mahendradatta et al., 2021; Meng et al., 2022). This is relatively beneficial in the current era, where the focus is on healthy living trends that alleviate various disease pandemics, such as COVID-19. Anthocyanins are abundantly found in fruits with red, blue, purple, and black colors (Aza-González et al., 2012; Zhang et al., 2015; Liu et al., 2022; Meng et al., 2022), so these substances can be in high amounts of cayenne pepper. Several studies have reported the effectiveness of the anthocyanin content in chilies (Lahbib et al., 2021; Meng et al., 2022; Zhou et al., 2022). Therefore, it is equivalently crucial to identify the anthocyanin content of the selected F3 cayenne pepper transgressive lines. This makes cayenne pepper F3 transgressive as a food biofortification product in encouraging the healthy living trend (Olasupo et al., 2021). In this framework, the research had various objectives, namely, (1) to develop an effective transgressive segregation index in the F3 multiple-cross population of cayenne pepper; (2) to select transgressive segregation of cayenne pepper with high productivity in the multiple-cross F3 population; and (3) selecting a transgressive group of cayenne pepper with high productivity as well as substantial anthocyanins.
The study had two experiments conducted at the experimental garden of the Faculty of Agriculture, Hasanuddin University, Tamalanrea District, Makassar City, South Sulawesi Province, Indonesia (5°7′40” South Latitude, 119°28′59″ Longitude, and 14 m above seawater (asw) altitude). The first experiment was from November 2022 to April 2023 and June 2023 to November 2023. The climate parameters in this study are shown in Supplementary 1, where F3 was mostly the rainfall season, and F4 was the mostly dry season. Meanwhile, soil characteristics in this study showed that the soil texture was clay, the percentage of clay was 44%, percentage of dust was 47%, percentage of sand was 10%, C-Organic was 1.23%, total nitrogen was 0.1%, C/N ratio was 13 ppm, pH(H2O) was 5.85, P Olsen was 10.34 ppm, K content was 0.46 cmol (+) kg−1, Ca content was 4.91 cmol (+) kg−1, Mg content was 0.93 cmol (+) kg−1, Na content was cmol (+) kg−1, and cation exchange capacity was 22.29 me 100 g-1.
The study implemented an augmented design with a randomized group design as an environmental design. The genotypes as treatment consisted of 2 types, namely 110 lines of cayenne pepper, which were not repeated, and the 4 older chili varieties as controls, which were repeated in each block. All genotypes were categorized into five blocks. The lines planted were the result of selection from 10 combinations of multiple cross populations originating from 4 elders, namely, Dewata F1 (D), Ungara (U), Bara (B), and Katokkon (K) (Table 1 and Figure 1). The four are unrelated, and the selection was based on their genetic background and specific characteristics. Dewata F1 (D) is a hybrid F1 variety with a high yield and is spicy. Ungara (U) is an ornamental pure line variety with a purple fruit color. Bara (B) is a common pure line variety and is pungent. The last, Katokkon (K), is a local pure line variety, and it is very spicy. The different phenotype fruits among parents are shown in Figure 2. Meanwhile, each line consisted of 12 plants, while the older variety in each block was planted with eight plants.
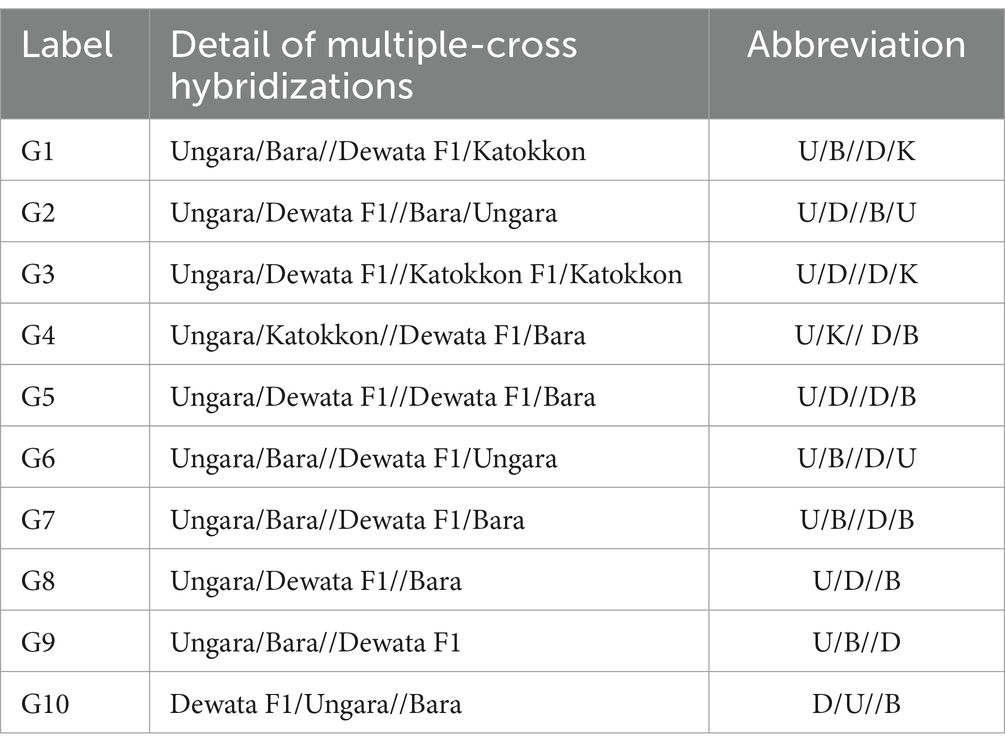
Table 1. Details of multiple cross-hybridization in this cayenne breeding study.
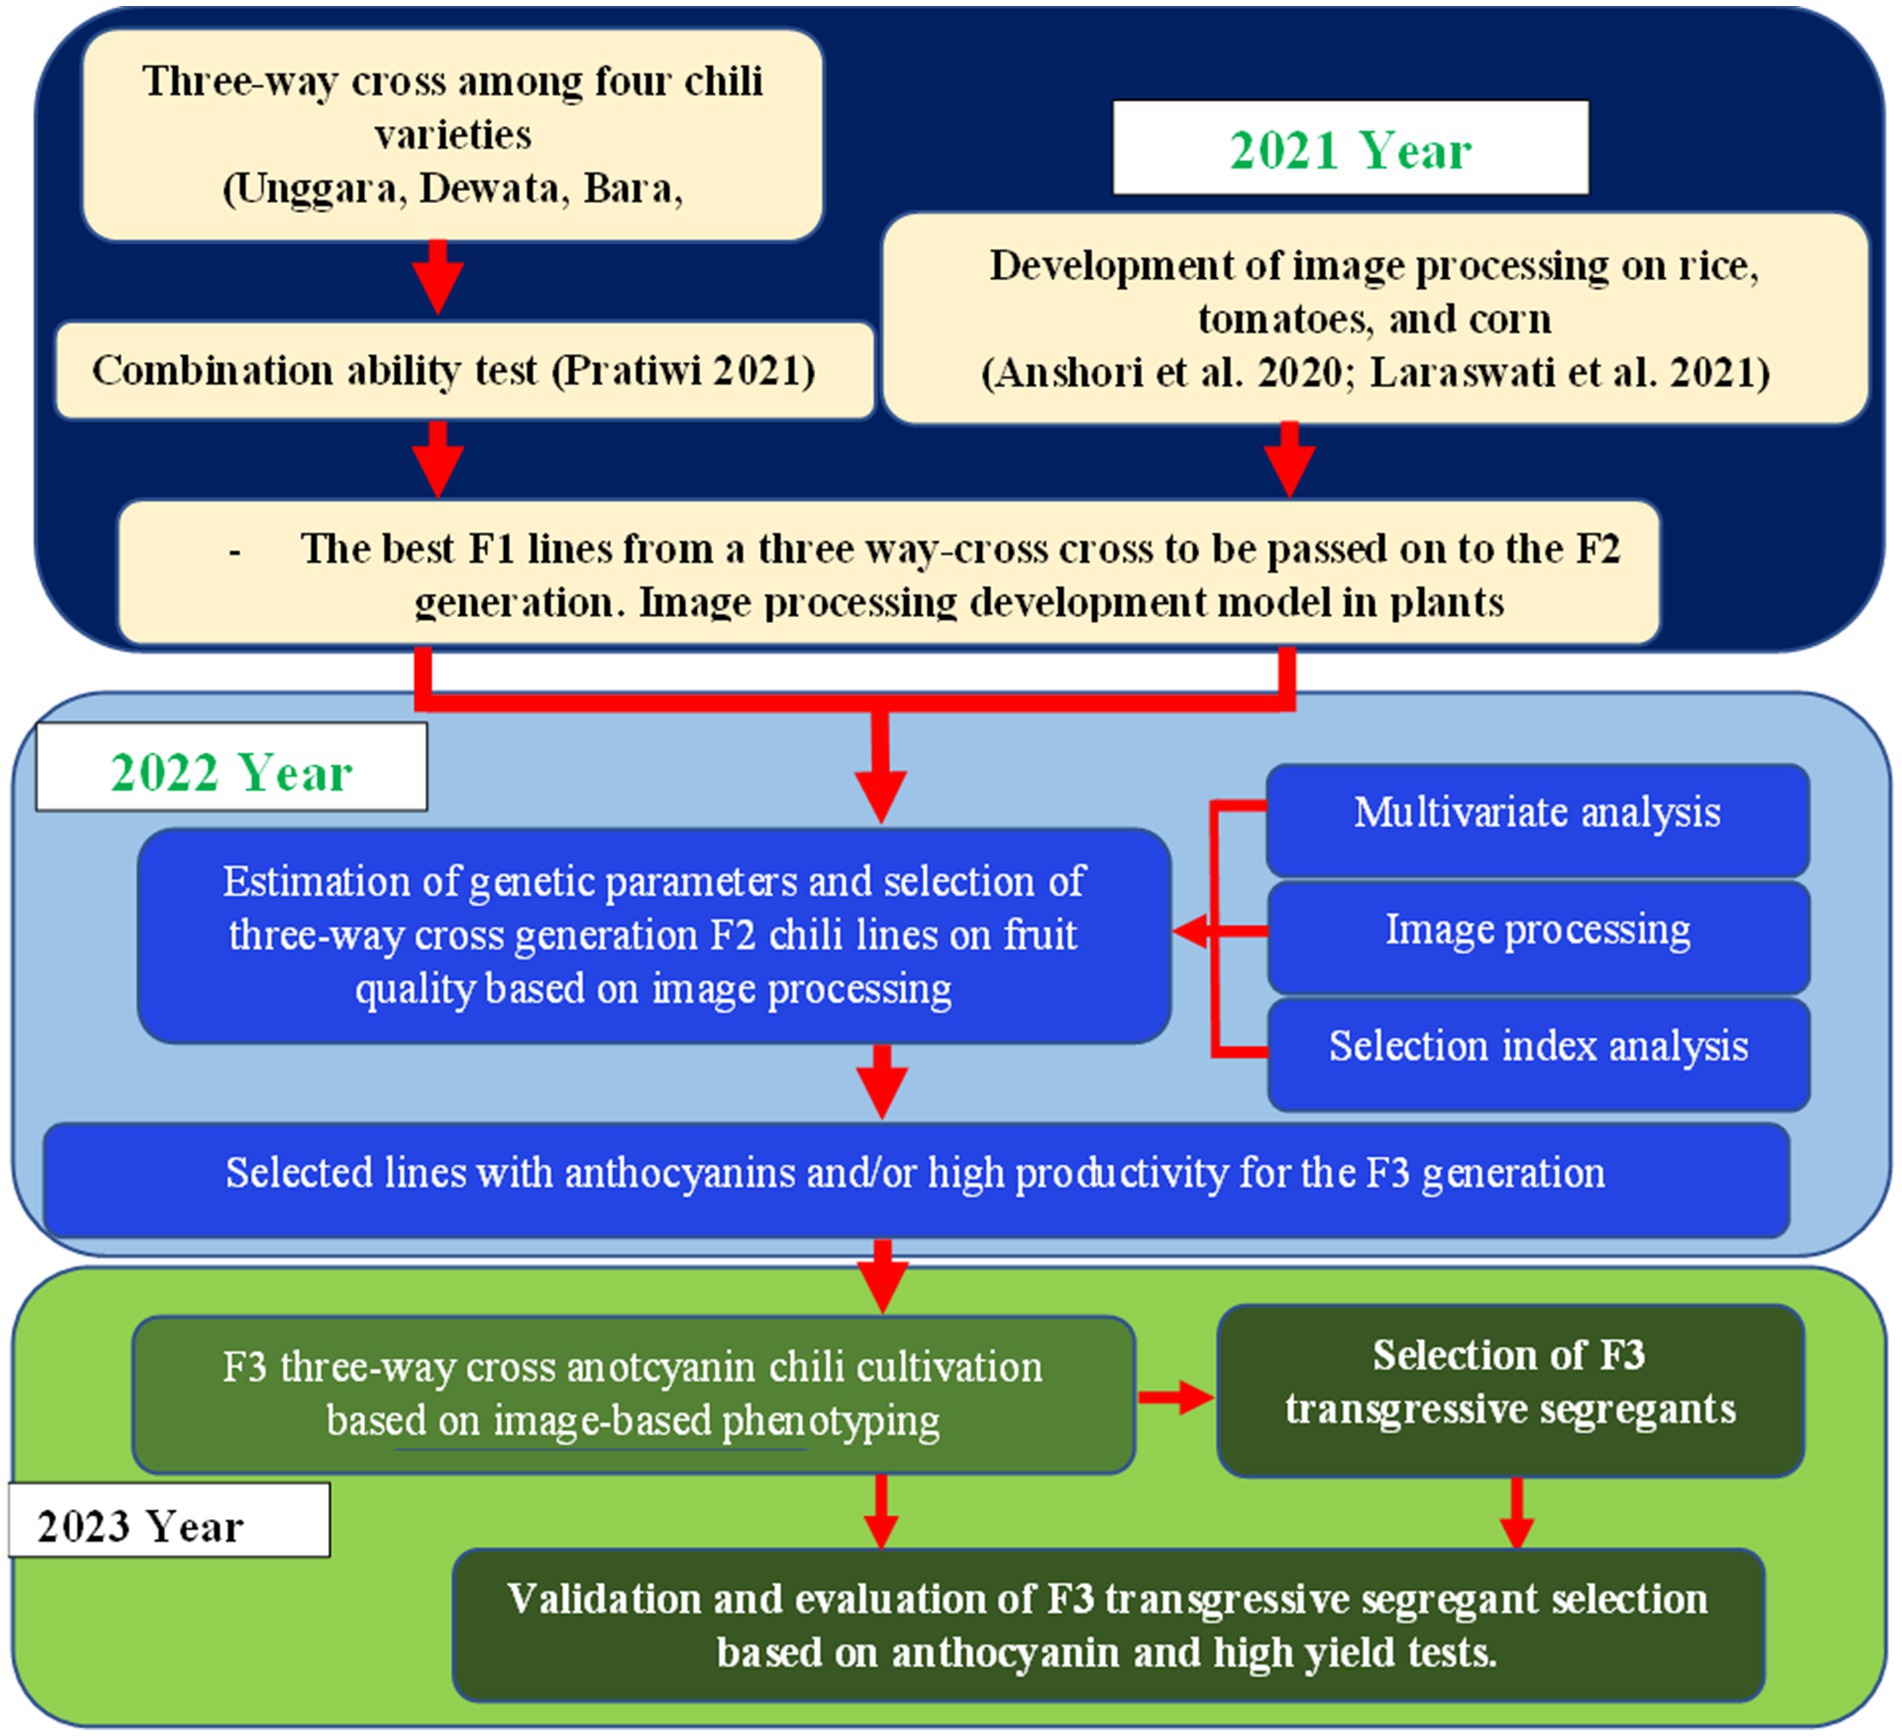
Figure 1. Diagrammatic representation of the breeding scheme of cayenne F3 multiple crosses.

Figure 2. Phenotype of young and maturity fruits among parents.
The second trial was the validation of the first trial; 10 genotypes were taken out of the 20 best genotypes in the first experiment. These 10 genotypes were based on various considerations, such as rank line spread, seed growth capacity, and seed quality for transplantation. In addition, there were 3 check varieties, Dewata F1, Bara, and Ungara, so 13 genotypes were tested. As for the experimental design, it used RCBD one factor and repeated three times. So, there were 39 experimental units. Each experimental unit planted as many plants as in the first experiment.
All experiments had the same research procedure. The implementation of this research consisted of several steps, namely, (1) tillage, (2) nursery, (3) transplanting, (4) maintenance, and (5) harvesting. (1) Soil preparation was carried out by perfect tillage using a tractor, followed by making beds. Beds were made with a length of 6 m and a width of 1 m with a distance between beds of 50 cm. The beds were then given black silver mulch, which was perforated using a mulch punch tool in the form of a can with a diameter of 10 cm as a place to plant the cayenne pepper seeds. Seeding (2) comprised a planting medium consisting of soil, compost, and burnt husks with a volume ratio of 1:1:1. Furthermore, the planting medium was saturated with water until it was evenly distributed. The cayenne pepper seeds were transferred to the seedling tray while sprinkled with Furadan to avoid disturbance or pest attack. Applying AB Mix of hydroponic nutrition at 5 mL/L of water was given when the seedlings were 10 days after sowing (DAS) by watering around the plant roots. Then, the cayenne pepper seedlings were maintained until they were 21 DAS and eventually transferred to the beds (transplanting). Transplanting (3) was done with a spacing of 50 cm x 60 cm between rows in a zig-zag manner. So, in F3 planting, there were 23 plants in each bed. Each cayenne pepper plant was supported with a stake so that the plant did not collapse or break. (4) Cayenne pepper plant maintenance consisted of several procedures: watering, replanting, fertilizing, pruning, weeding, and pest and disease control. Watering was done twice daily, in the morning and the evening, using a water hose until the soil looked moist. Stitching was done 2 weeks after planting (WAP) for plants that experienced abnormal growth, withered, and were attacked by pests or diseases based on the variety code and the same age. Fertilization was performed from 1 WAP using AB Mix at a dose of 5 mL/L of water. Subsequent fertilization was carried out using the Mutiara NPK fertilizer (16–16–16), and KNO3 was given at a dose of 5 g at 3 WAP and 6 WAP around the plant root area. Pruning was done by removing small shoots on the lower stem to focus the growth of chilies on the main stem (central stem) and was conducted at least once a week. Weeding was done to remove weeds that interfere with growth around the plant. Weeding was carried out manually and chemically using the herbicide Gramoxone 276SL at two g/L of water. Pest and disease control used the insecticide Curacron 500 EC with a concentration of 2 cc/L of water and the fungicide Antracol 70 WP with 2 g/L of water. These insecticides and fungicides were applied by surface spraying using a hand sprayer. Meanwhile, (5) harvesting was started when the fruit had entered physiological maturity, marked by reddish fruit in each line or approximately 70 days after planting (DAP), and continued six times, with a weekly frequency.
The observation parameters were recorded quantitatively. These parameters included vegetative and generative growth parameters. Vegetative growth parameters consisted of plant height (cm) measured from the stem basal to the highest shoot, dichotomous height (cm) measured from the stem basal to the dichotomous branch, canopy width (cm) measured diagonally to the widest canopy, and stem diameter (mm) measured 15 cm from the stem basal. Meanwhile, the generative growth parameters consisted of the number of productive branches (branches) calculated from the branches that produce fruit, flowering age (DAP) measured at the time of first flowering, harvest time (DAP) measured when fruit starts the first time, fruit length (cm), stalk length (cm), fruit diameter (mm) measured at the center of the fruit, weight per fruit (g), production per plant (g), and anthocyanin content (mg). All data were tabulated and analyzed.
The performed analysis comprised various analytical concepts. Analysis of variance becomes the fundamental basis for further analysis in developing the basis. The analysis was performed using SAS 9.1 software. Significant parameters at the 5% level were subjected to correlation analysis. The correlation results were followed by path analysis to determine the selection criteria (Anshori et al., 2022). The selected selection criteria were combined into a selection index. Determination of the selection index weight was carried out using several approaches, namely, the value of direct influence, realized narrow-sense heritability, transgressive segregation ratio, and the z-value. The transgressive segregation selection index results were ranked. The lines with the best transgressive segregation level were categorically selected according to the criteria. Each selected F3 transgressive line was tested again for its fruit anthocyanin properties, leading to several transgressive segregated lines with high productivity and anthocyanin. Meanwhile, an explanation of the concepts from various analyses was presented as follows:
Heritability uses the concept of comparing selection progress with selection differential. This was explained in the formulation below (Acquaah, 2012):
where, G = selection gain, S = selection differential, = narrow-sense heritability. However, heritability also considers differences in variance or standard deviation between populations, so progress and differential selection were first converted into z-values for two populations with the independence concept. The formula for the z-value was as follows:
where = selected genotype means, for both gain selection and differential selection, = the general means of the F2 population, = selected genotype variance, = the general variance of the F2 population, = number of selected genotypes, = number of all genotypes in the F2 populations.
The transgressive segregation ratio was the z-value of the lines to the best parents on a specific selection criterion. The z-value followed the concept of the z-value formula in general. However, the difference lies in the standard deviation or variance used. The standard deviation was not the general population total standard deviation but the within-row deviation of each genotype. Meanwhile, the details of the analysis formula used in this study are as follows:
Note: X = means of genotype (lines or check variety).
μ = means of all population.
σ = standard deviation.
n = number of samples.
z = standardization value.
Five young fruits were selected for each line to analyze their anthocyanin properties. The analysis was conducted by the method reported by Lee et al. (2005) and Teng et al. (2020). Anthocyanin analysis was performed by extracting anthocyanin pigments. This activity was carried out by crushing the flesh of the cayenne pepper and centrifuging it for 10 min. The juice or water from the extraction of the cayenne pepper fruit was retrieved in 10 mL for anthocyanin analysis. Determination of total anthocyanins using the differential pH method at pH 1.0 and pH 4.5. At pH 1.0, anthocyanins are oxonium compounds, and at pH 4.5, they are colorless carbinols. This was performed by making anthocyanin solutions in water with a pH of 1.0 and 4.5 and then measuring the anthocyanin content. The process involved dual stages of stock solution preparation, namely:
• pH 1.0 solution, prepared by dissolving 1.213 g of K2CrO4 (potassium chloride) in 250 mL of distilled water in a volumetric tube. Add HCl until the pH reaches 1.0.
• pH 4.5 solution, prepared by dissolving 10.599 g of Na2CO3 (sodium acetate) in 250 mL of distilled water in a volumetric tube. HCl was added until the pH reached 4.5.
The anthocyanin test solution was prepared by dissolving 5 mL of cayenne pepper fruit extract in 50 mL of each stock solution. Then, each test solution was measured with a spectrophotometer at the A510 and A700 wavelengths. Then, the results of the spectrophotometer analysis were calculated using the formula (Lee et al., 2005; Teng et al., 2020):
where MW (molecular weight) = 449.2 g/mol for cyanidin-3-glucoside (cyd-3-glu); DF = dilution factor established in D; l = path length in cm; = 26,900 molar extinction coefficients, in L mol−1 cm−1, for cyd-3-glu; and 103 = factor for conversion from g to mg.
The results of the ANOVA demonstrated that all sources of variation significantly affected almost all agronomic characters of cayenne pepper with a low coefficient of variation (below 20%) (Table 2). The variance source of variety in the control did not have a significant effect, only on the length of the fruit stalk. The source of line variation had no significant effect on flowering time and fruit stalk length. Meanwhile, the interaction of differences between control varieties and lines had no significant impact on fruit stalk length and stem diameter.
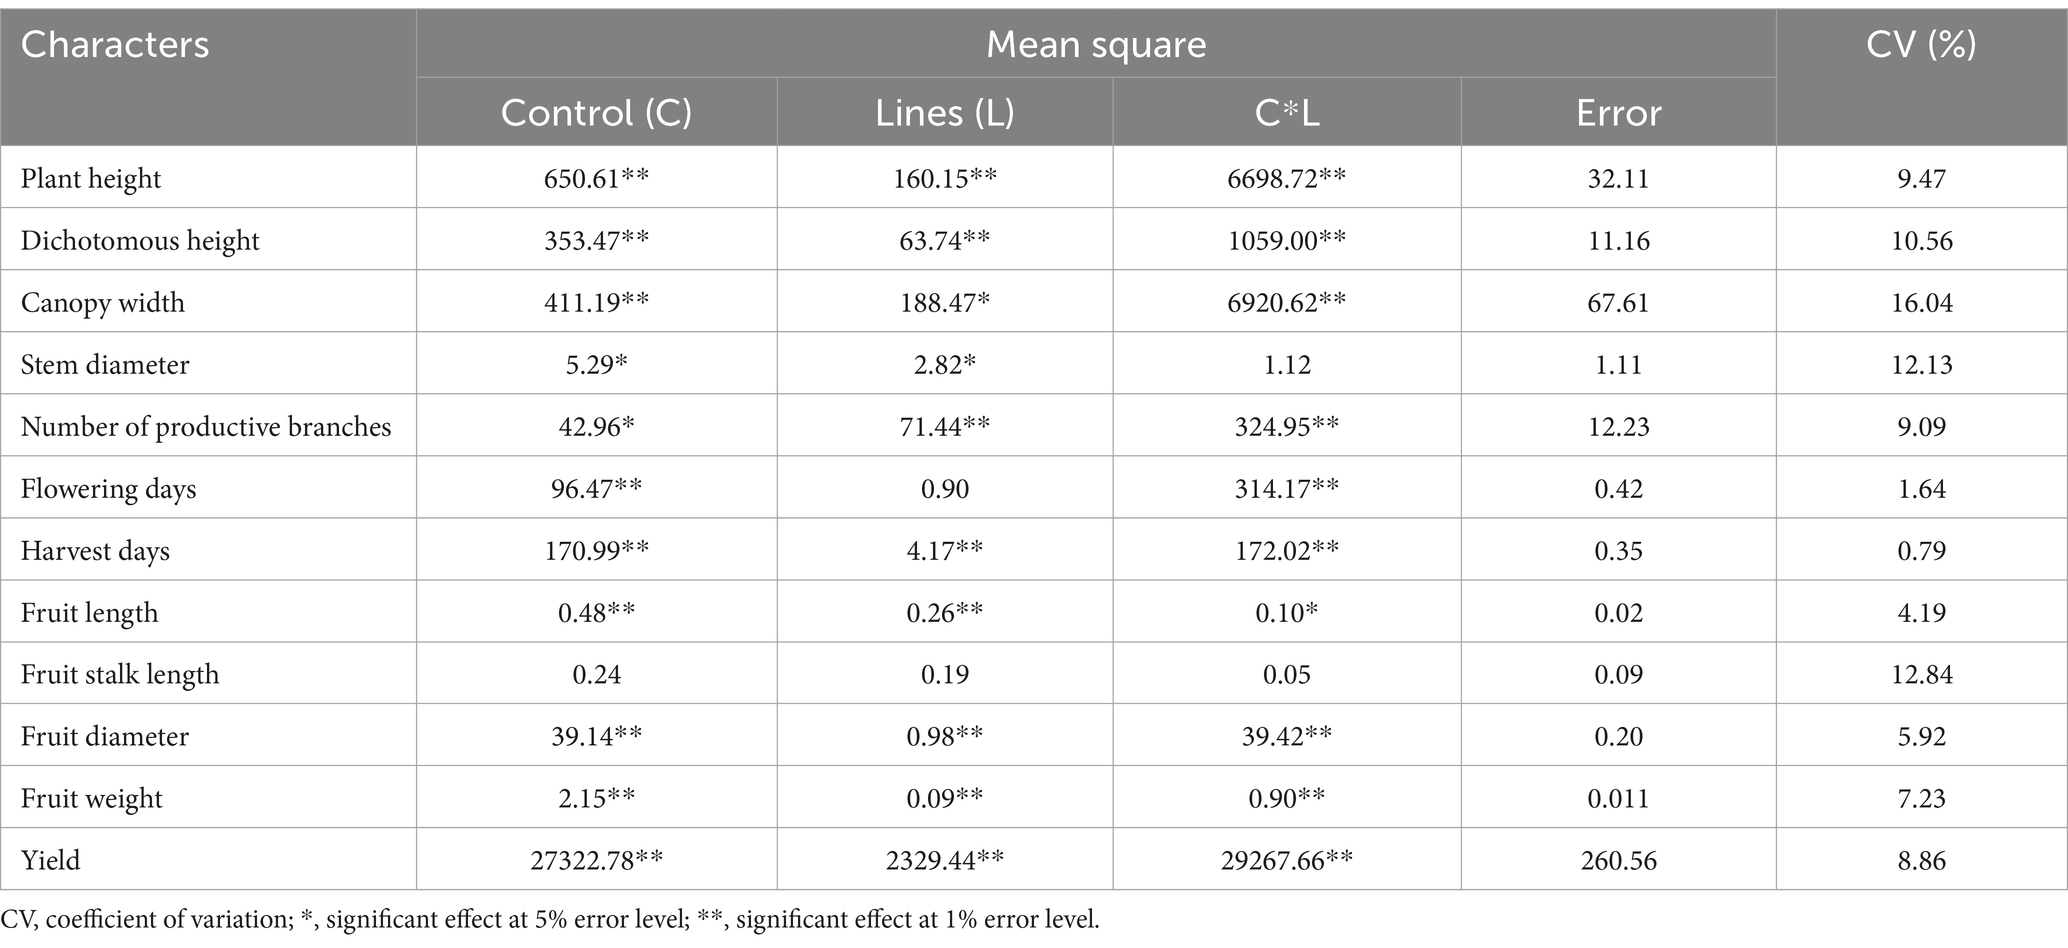
Table 2. Population variance of F3 cayenne pepper on agronomic characters.
The results of the correlation analysis focused on the yield characteristics and several important characteristics that correlated with the yield (Figure 3). Based on the figure, the characters that were significantly correlated with the yield were canopy width (0.38), plant height (0.20), fruit diameter (0.27), fruit weight (0.47), and flowering age (0.24). Fruit weight character also significantly correlated with plant height (0.26), fruit length (0.36), fruit diameter (0.57), and flowering time (0.23). However, these characteristics did not correlate with plant height and canopy width. Canopy width character also significantly correlated with plant height (0.65), dichotomous height (0.46), flowering age (0.21), harvest age (0.32), and number of productive books (0.54). However, this character also did not correlate with fruit diameter. Fruit diameter also had a significant positive correlation with fruit length (0.28) but did not correlate with plant height. The character of flowering age was also significantly correlated with plant height (0.20), dichotomous height (0.28), and number of productive nodes (0.22). However, this character was not correlated with flowering age. Meanwhile, the character of plant height also demonstrated a significant correlation with harvesting age (0.31), dichotomous height (0.75), and number of productive nodes (0.51).
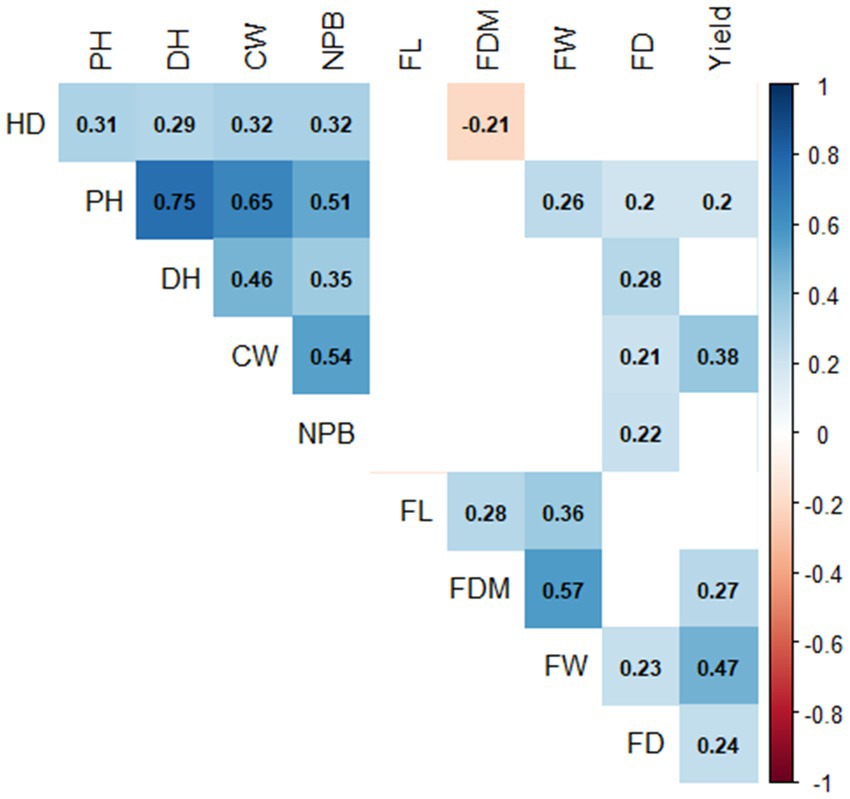
Figure 3. Correlation of agronomic characters in populations of cayenne F3 multiple crosses. (PH, plant height; DH, dichotomous height; CW, canopy width; SD, stem diameter; NPB, number of productive branches; FD, flowering days; HD, harvest days; FL, fruit length; FDM, fruit diameter; FW, fruit weight).
The path analysis results exhibited that the canopy width (CW) and fruit weight (FW) character had a substantially significant positive direct effect on the yield (0.46 and 0.44, respectively) (Table 3). Both characters also had the most significant indirect effect compared to the others (0.48 and 0.52, respectively). Conversely, the character of plant height (0.24) significantly negatively affected the yield. This character also had a negative impact (0.30) on the correlation of other characters on productivity. Meanwhile, the characteristics of flowering age and fruit diameter had a shallow direct effect on the yield (0.09 and 0.03, respectively).
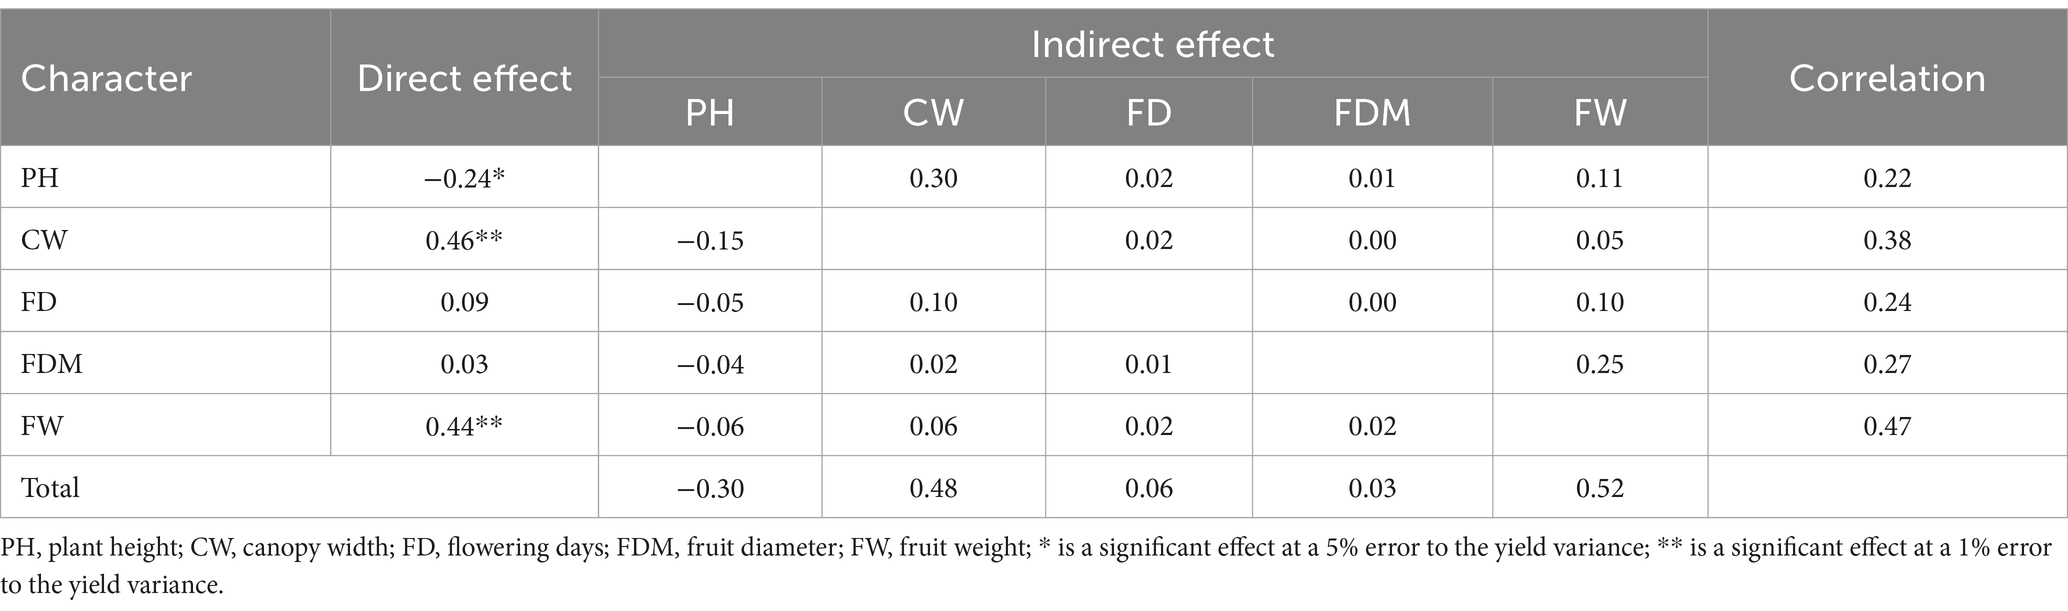
Table 3. Path analysis of several agronomic characters on the yield.
The narrow-sense heritability analysis results focused on the yield and characters that had a significant direct effect (Table 4). Based on this analysis, the yield had a high and stable broad-meaning heritability, namely, 95.85%. The fruit weight character also had high heritability but was not stable at 177.27%, or 100%. In contrast, the canopy width character had a low. The narrow-sense heritability reached a negative value of −24.71 or can be considered with a value of (0).
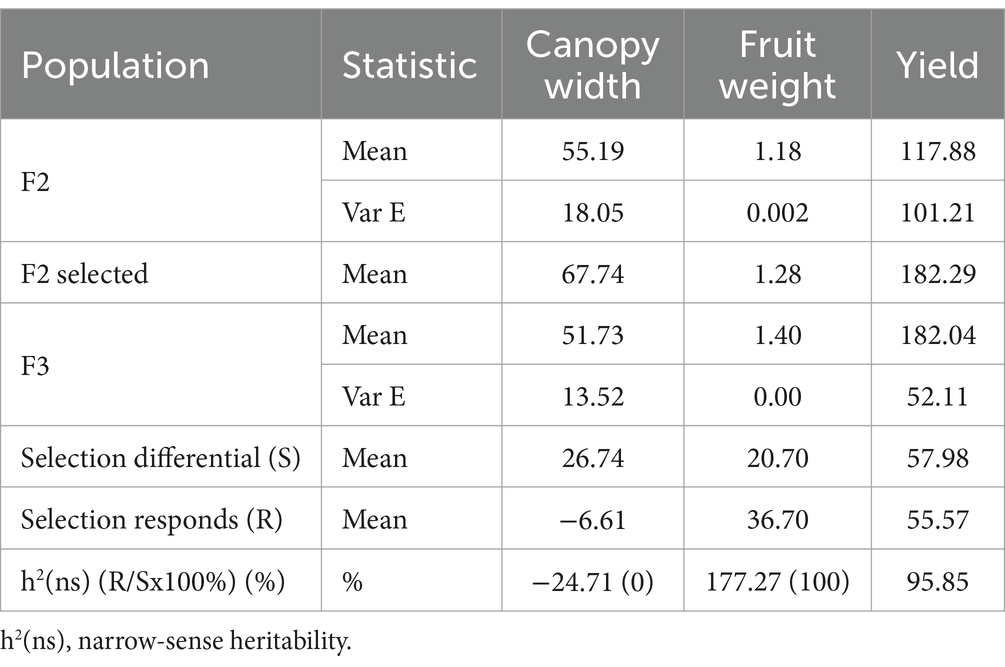
Table 4. Realized of narrow-sense heritability on F3 chili multiple-cross population.
Information from heritability and path analysis was considered in forming a selection index called the transgressive selection index (TSI). This TSI consisted of three selection criteria: yield, CW, and FW. These three criteria were weighted based on direct influence from path analysis with subjective heritability weights. The yield was given a subjective weight of 3, fruit weight of 2, and finally, canopy width was given a weight of 1. The combination of these two considerations formed an index formula:
Or
The TSI results demonstrated that 41 lines had better index values than the best control varieties (Dewata F1 = 1.07) (Table 5). Among these lines, seven lines had an index value above 6. In addition, six lines have a transgressive selectivity ratio value above 1 for the yielding character and positive for other selection criteria. The 13 lines were continued for anthocyanin analysis in Table 6. Based on the table, G3.2.7 (34.09) and G2.6.9 (64.01) had higher anthocyanins than the best parent, Dewata F1 (25.07). In addition, lines G2.6.5 (16.54), G1.12.9 (22.59), G10.5.8 (12.53), and G5.12.1 (12.03) had anthocyanins under the control of Dewata F1 but were above 10. On the other hand, lines G3.1.5, G7.12.3, G6.5.10, G4.7.2, G7.12.2, G7.7.5, and G4.5.2 had low anthocyanins below a value of 10.

Table 5. Transgressive Segregation Index on the F3 population of multiple-cross cayenne pepper.
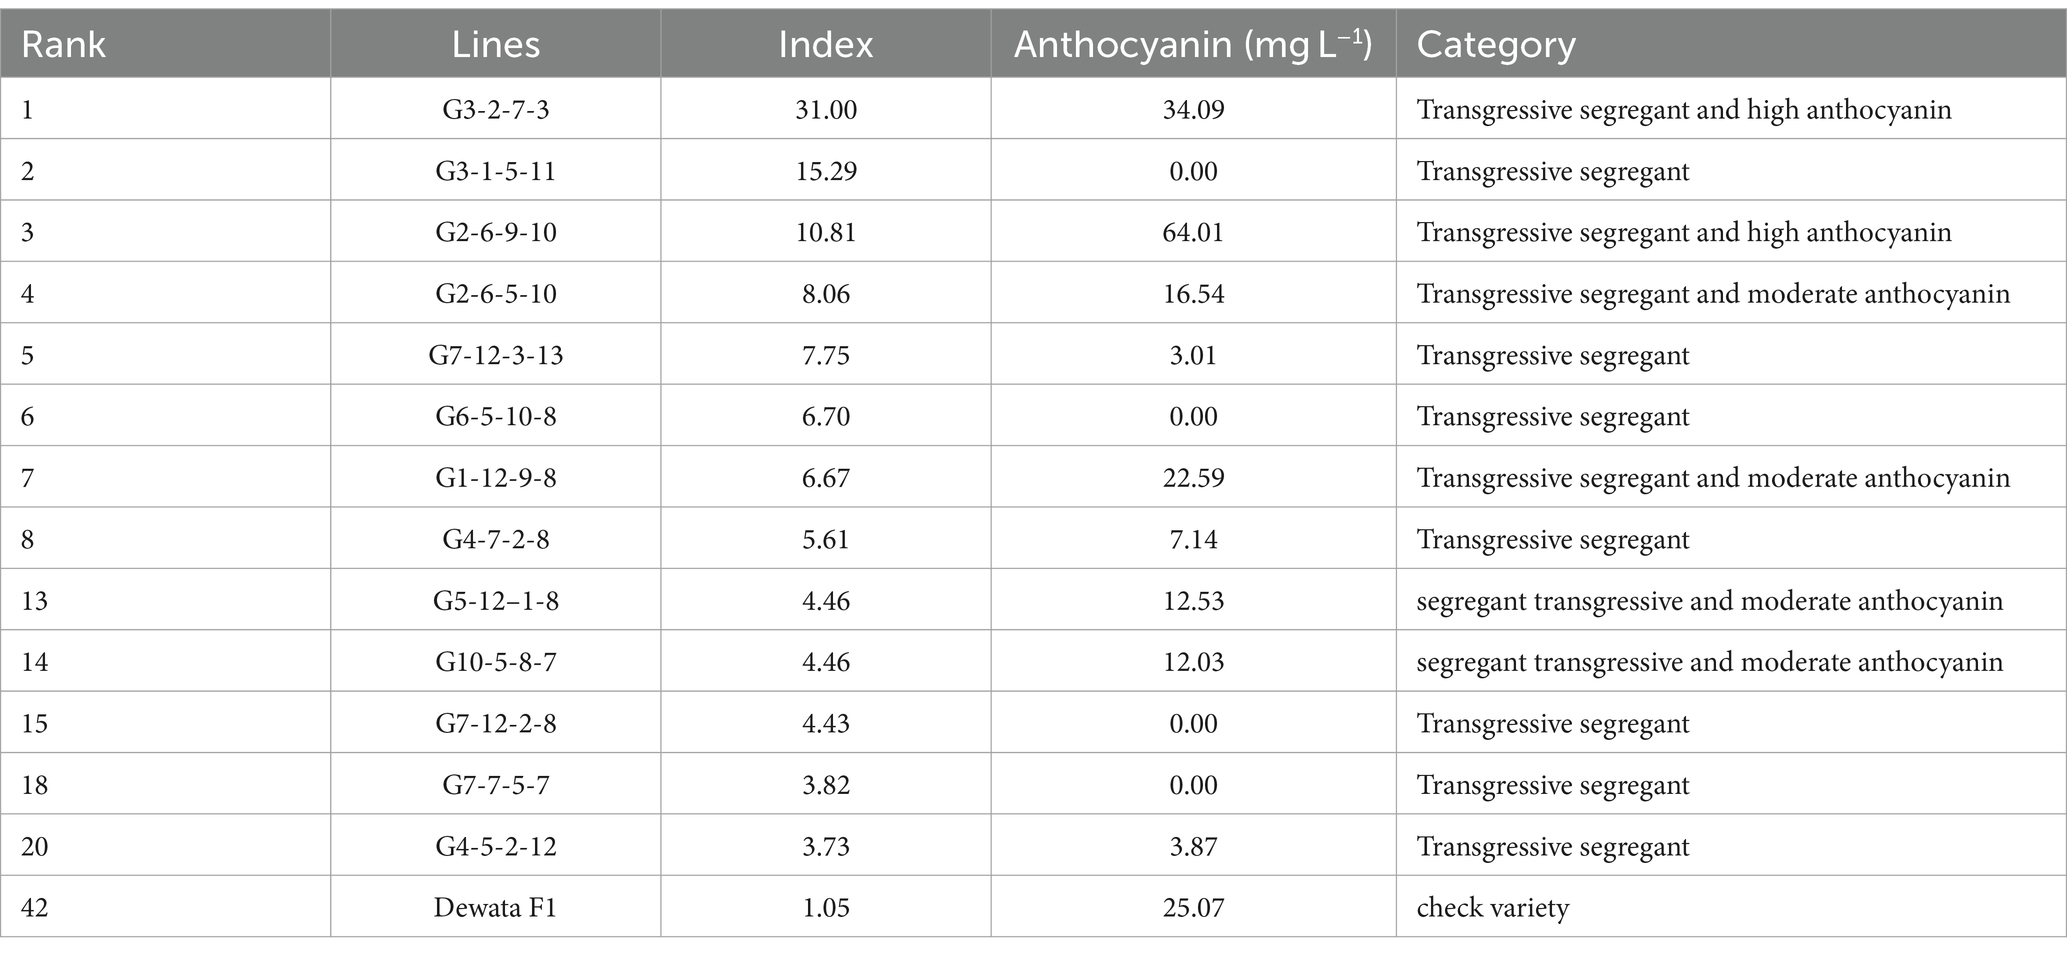
Table 6. Transgressive segregation of F3 cayenne pepper with potential anthocyanins.
The results of the validation analysis are shown in Table 7 and Figure 4. Based on the table, G1-9-2-10, G10-9-6-11, G4-5-2-12, G5-12–1-8, G2-6-9-10, G3-2-7-3, G9-5-4-7, Bara and Dewata F1 were genotypes that had a positive transgressive segregant index value in validation test (F4 Population). G3-2-7-3 (8.80) and G4-5-2-12 (5.25) were genotypes whose index values were better than the check variety Dewata F1 (4.20). On the other hand, the genotype with the lowest index was the Ungara variety (−9.70). In addition to the transgressive segregation index, Table 7 also shows the anthocyanin content. Based on anthocyanin content, lines G1.9.2–10 (58.00), G10.5.8–5 (35.00), G10.9.6–11 (63.00), G3.2.7–3 (27.50), and G9.5.4–7 (63.50) were better lines than the Ungara variety (24.00). Apart from that, G1.9.2–10, G10.9.6–11, and G9.5.4–7 are varieties with higher anthocyanin content than Dewata. (56.00).
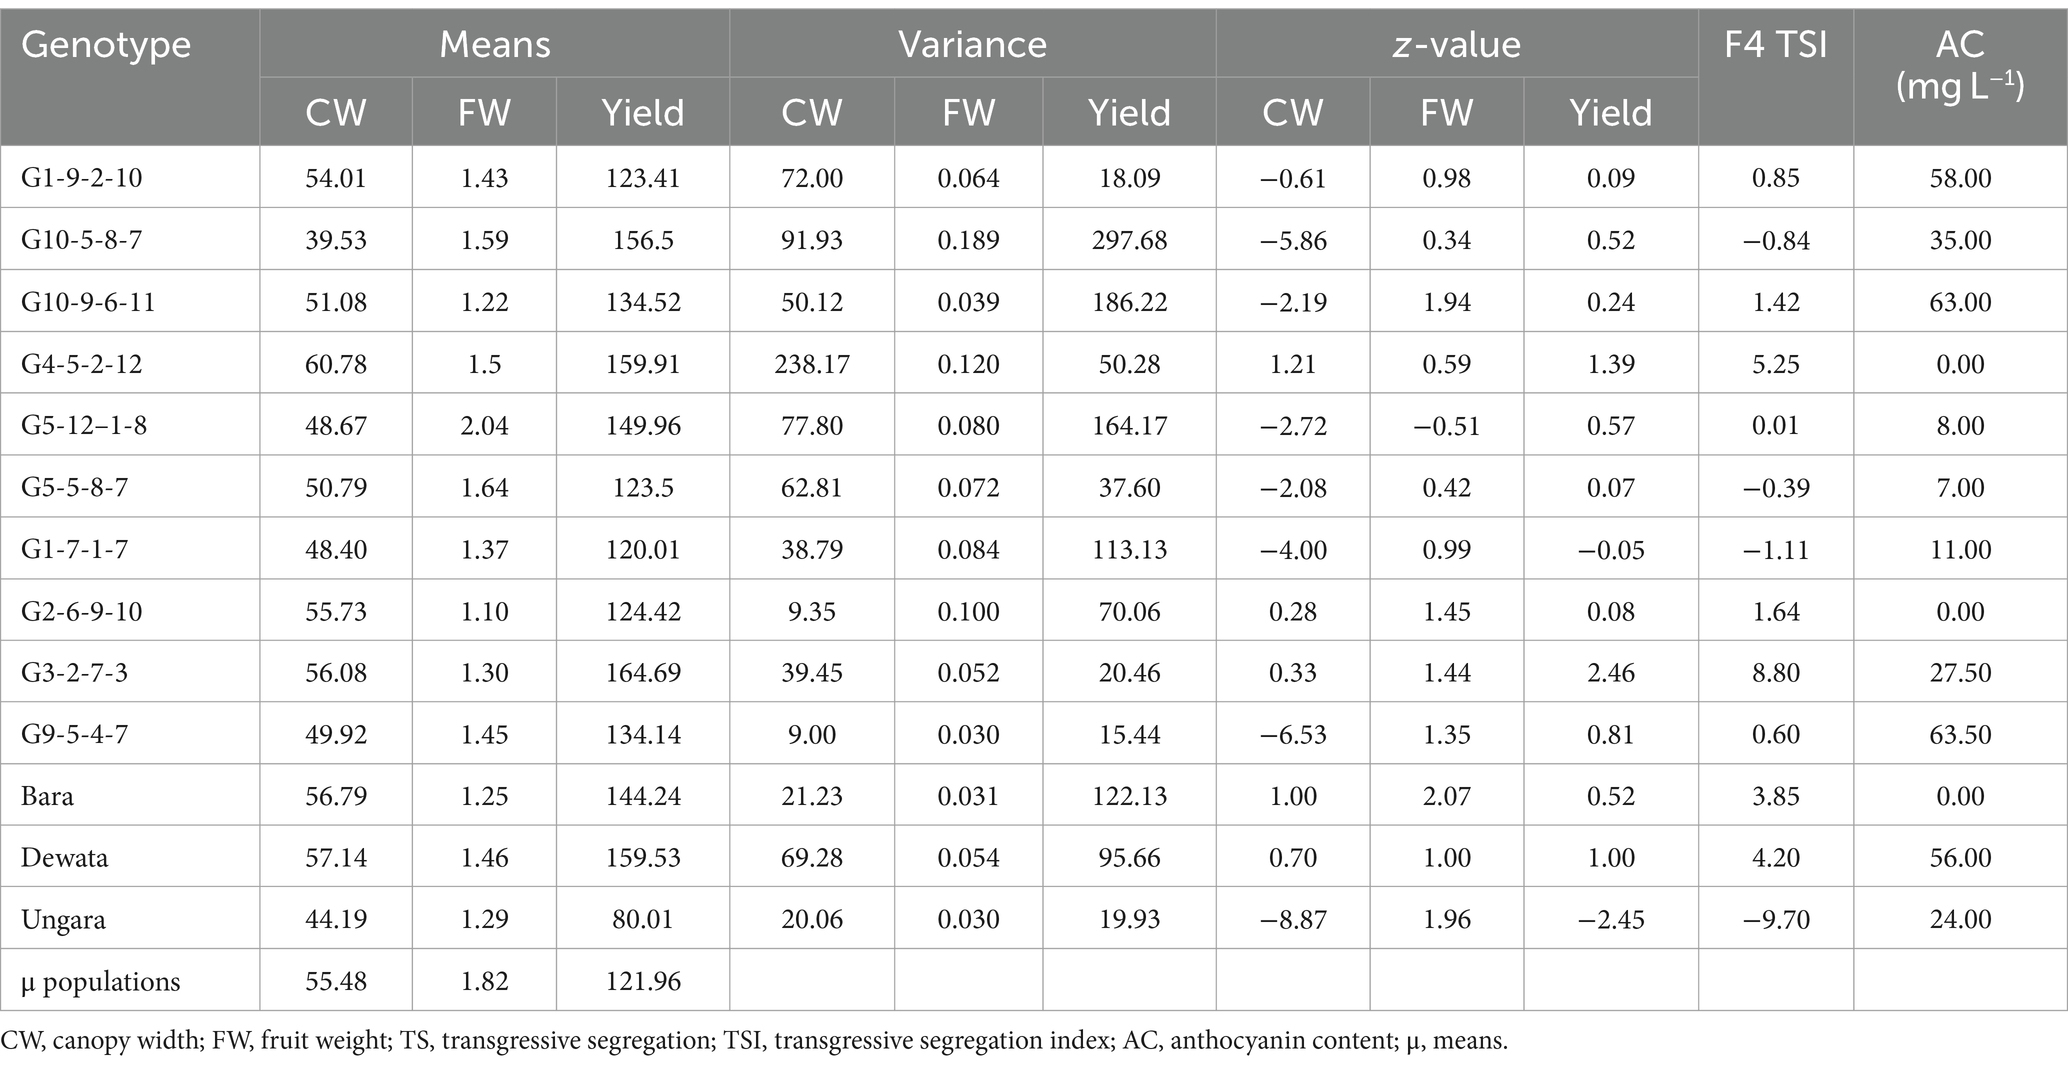
Table 7. Validation of transgressive segregation index and anthocyanin content in the F4 population.
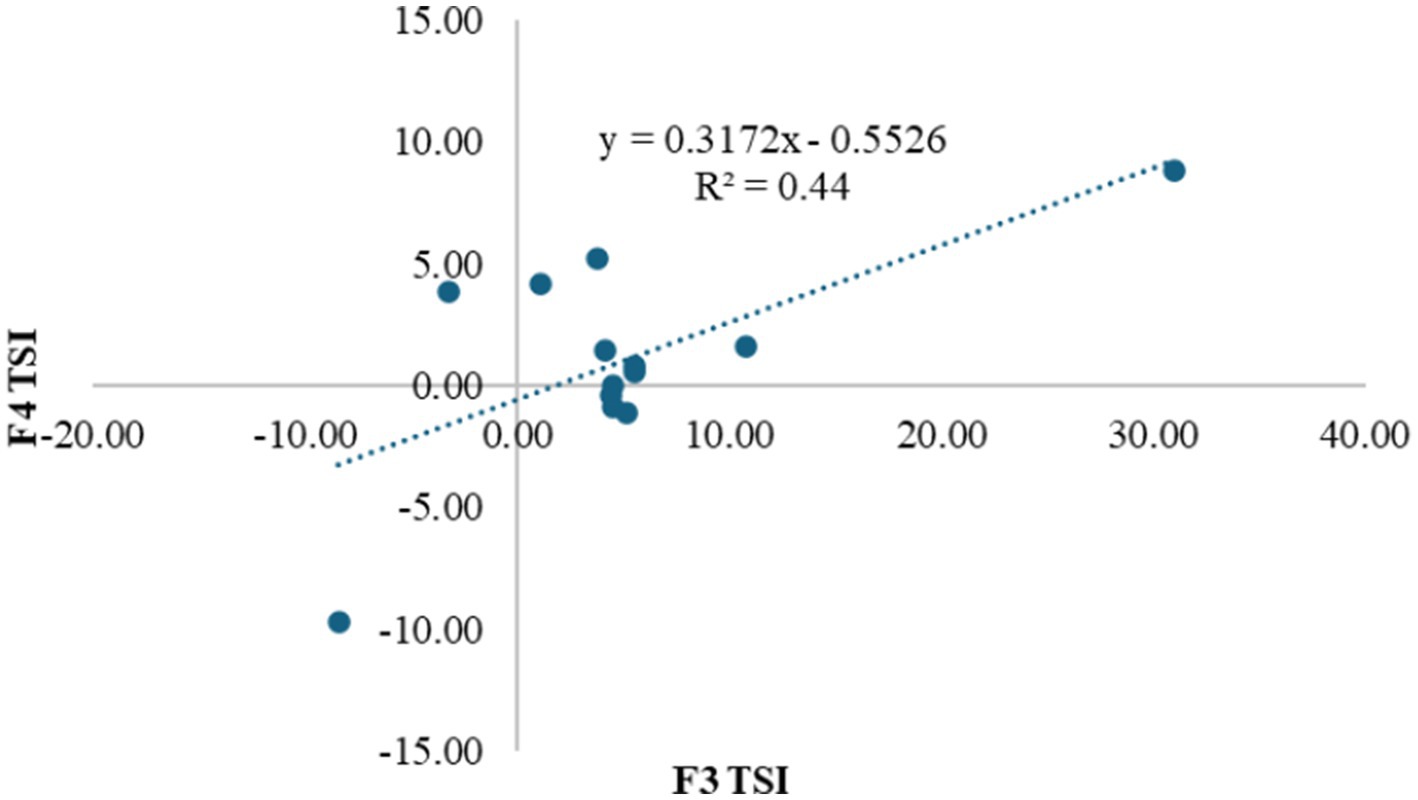
Figure 4. Interaction of F3 transgressive segregation index to its validation in the F4 population.
Figure 4 validation results showed that the 13 genotypes were divided into 4 quadrants. There were seven genotypes in quadrant I (F3-F4 positive). The second quadrant (F3 negative-F4 positive) and the third quadrant (F3-F4 negative) each comprised one genotype. Finally, the fourth quadrant (F3 positive-F4 negative) consisted of three genotypes. Meanwhile, the results of this mapping had a linear regression determination value of 0.44.
The ANOVA results illustrate that almost all characters are influenced by the three sources of diversity. However, in augmented design-based plotting, the assessment of sources of diversity is more focused on the effect of line diversity and the diversity of differences between lines and controls (Fadhilah et al., 2022; Amas et al., 2023). This indicates that the line diversity functions as the locomotive or basis for selection. Without wide diversity, selection will stagnate for development (Litrico and Violle, 2015; Carena, 2021; Anshori et al., 2022). In addition, the difference in response between lines and controls is also an important indicator in mapping the potential of lines. So, the selected lines have better agronomic potential than commercial varieties in general (Fadhilah et al., 2022; Amas et al., 2023). Accounting on this basis, stem diameter and petiole length are two characteristics that do not meet these standards. This indicates that the two lines need to be more effective to be continued in analyzing selection criteria. Effective selection criteria are an important factor in the breeding process and correlate with the expected breeding goals (Marulanda et al., 2021; Rutkoski et al., 2022). In cultivated plants, productivity is the principal character in the evaluation. However, this character is strongly influenced by multiple production component factors; hence, production components are often included with productivity to enhance selection effectiveness (Kassahun et al., 2013; Fellahi et al., 2018; Brinton and Uau, 2019). One of the basic steps in estimating selection criteria is the significant influence of diversity on both sources of diversity (Anshori et al., 2022; Fadhilah et al., 2022; Amas et al., 2023). Therefore, all agronomic characteristics of the F3 cayenne population can be utilized as candidate selection criteria, except stem diameter and fruit stalk length.
Determination of the selection criteria to strengthen the yield can be done with correlation and path analysis. Correlation analysis can distinguish the relationship between one character and another (Oladosu et al., 2018; Sahid et al., 2020; Saleh et al., 2020; Khan et al., 2022; Uhlarik et al., 2022). However, this relationship is still considered rough due to the interference of other characters that potentially influence the correlation value (Anshori et al., 2022; Khan et al., 2022). Correction of the role of other characters can be conducted with path analysis. This analysis can separate the independent influence of a character on other characters in influencing a certain main character. This independent influence is expressed as a direct effect (Saleh et al., 2020; Khan et al., 2022; Tilahun et al., 2022). However, the implementation of path analysis with multiple character values is less effective; hence, it requires prior reduction with correlation analysis (Fadhilah et al., 2022). With this context, a combination of correlation and path analysis can be the solution to distinguishing the selection criteria. Several studies have also reported this effectiveness on chili (Tilahun et al., 2022; Amas et al., 2023; Lestari et al., 2023), rice (Alsabah et al., 2019; Saleh et al., 2020), and tomatoes (Fadhilah et al., 2022).
Based on these two analyses, characters, namely, canopy width and fruit weight, can be effectively applied as selection criteria along with the yield. The canopy width is identical to the vegetative properties of fruit chili (Virga et al., 2020; Gupta et al., 2022; Naves et al., 2022). The similarity can also be attributed to the significant positive correlation between canopy width characters and other vegetative characters. Reports of a strong correlation between the canopy width character on chili productivity and the characteristics of other production components also support the correlation results (da Silva et al., 2016; Virga et al., 2020; Arain and Sial, 2022; Bedjaoui et al., 2022; Gupta et al., 2022). Fruit weight is a generative character methodically conjugated with chili yield. This relationship has also been widely reported by Sahid et al., 2020; Tripodi et al., 2021; Amas et al., 2023. This character is also interlinked with the character of other generative result components, unlike its disassociation with canopy width. This indicates that the two characters have distinct roles in supporting the yield. The combination of uncorrelated criteria will make the selection more stringent (Acquaah, 2012). Hence, the combination of the three characters makes the selection more comprehensive, especially in the formation of the selection index (Anshori et al., 2021, 2022). However, establishing a selection index also requires consideration of the genetic role of the three characters (Reddy and Jabeen, 2016; Farid et al., 2022; Amas et al., 2023). This is crucial in predicting the response of the next generation to selected genotypes. One of the effective genetic parameters in F3 selection is the narrow-sense heritability.
Narrow-sense heritability is a direct approach that entails a comparison of selection responses and selection differentials (Acquaah, 2012; Lstibůrek et al., 2018). This concept is considered effective in evaluating the stability of the selection response of a character from two different generations with distinct environmental influences (Acquaah, 2012; Lstibůrek et al., 2018; Farid et al., 2022). The effectiveness of this concept was also reported by Farid et al. (2022) on tomato F3 populations. Following this narrow-sense heritability, the yielding principle is a character that is considered relatively stable in comparison with the other two characters. This demonstrates that the heritability value of the yield is high, exceeding 50%, and is still in the rational range of 0–100 (Acquaah, 2012). Contrastingly, the other two characters are outside the optimal range of heritability. However, the fruit weight character has a high heritability in comparison to the canopy width, thereby prioritizing the fruit weight character in comparison with the canopy width character. These results entail good consideration when constructing a selection index, especially when assessing the transgressive segregation of cayenne pepper in a multiple-cross F3 population.
Forming a transgressive segregated selection index has an auxiliary approach to the selection index in general. This selection index is approximated by the value of the transgressive segregation ratio (Koide et al., 2019). This ratio refers to the concept of transgressive segregation itself, where the assessment is based on the best mean and lowest variance of a strain against the best comparison parents (Alimi et al., 2013; de los Reyes, 2019; Koide et al., 2019; Pabuayon et al., 2021). However, the assessment of more than one character requires standardized comparisons. So, the overall value of the selection criteria is converted to a z-value or selection intensity utilizing the standard deviation of each of these genotypes (Acquaah, 2012; Syukur et al., 2015; Shwetha et al., 2022). This allows the z-value to distinguish the characteristics of variance and the median values of the lines to parents and to integrate the potential of the lines for each selection criterion (Feng et al., 2020; Chung and Liao, 2022; Farid et al., 2022; Shwetha et al., 2022). Therefore, the z-value ratio approach between lines and parents is innovative in the selection concept, especially for the accumulative transgressive segregation potential.
The formation of the selection index is also inextricable from the weighting system for each character (Chung and Liao, 2022). The weighting system can be carried out subjectively, objectively, and semi-objectively (Alsabah et al., 2019; Chung and Liao, 2022; Fadhilah et al., 2022; Farid et al., 2022). This is following the objectives and consideration of various factors in the selection (Chung and Liao, 2022; Farid et al., 2022). Established on the considerations in this study, the weighting system can be carried out semi-objectively. This is derived from considerations that can be objectively and subjectively together. The direct influence of the path analysis can be the basis for weighting the selection criteria. The principal selection criteria are assessed with a weight of 1, while the supporting selection criteria are given a weight according to their direct influence. Sabouri et al. (2008) and Fadhilah et al. (2022) have also reported this hypothesis. However, the weighting cannot elucidate the role of genetics in the index. Hence, the consideration of genetic factors, such as narrow-sense heritability, is imperative for harmonization (Acquaah, 2012; Lstibůrek et al., 2018; Farid et al., 2022). However, the narrow-sense heritability in this study is still considered to be overestimated so that heritability assessment can be done subjectively (Farid et al., 2022). The yield, as the predominant character constituting high heritability, is rationally given more priority than fruit weight and canopy width, so the weight is multiplied by 3. The fruit weight character is also a character with high heritability. However, this character has a heritability value above its rational value; hence, the weight of this character is multiplied by 2. Meanwhile, the canopy width character with low heritability is not multiplied.
The selection results established on the transgressive segregation selection index demonstrated that 41 lines were better than the index value of the best parents. This is the basis for determining lines that can be continued in the F4 generation. The concept of comparison with the best parents has also been reported by Suwarno Lubis et al. (2009), Fadhilah et al. (2022), Anshori et al. (2022), and Farid et al. (2022). However, determining the reality of transgressive segregation is predicated on two criteria. First, these lines have an index value above 6. This is achieved by the minimum optimization for each transgressive segregation ratio, which is 1, so the minimum TSI from transgressive segregation accumulation is 6. The second criterion is that these lines have an index value below 6. Still, the transgressive segregation ratio is above 1 for the yielding character and positive for fruit weight and canopy width criteria. This criterion tolerates the process, so the transgressive selection does not become too stringent. In addition, this criterion considers the minimum potential of a line transgressive to the main character by considering the stability of adaptation to other selection criteria. Based on these two criteria, G3.2.7, G3.1.5, G2.6.9, G2.6.5, G7.12.3, G6.5.10, G1.12.9, G4.7.2, G10.5.8, G5.12.1, G7.12.2, G7.7.5, and G4.5.2 are recommended as F3 transgressive segregated lines in cayenne pepper.
Anthocyanin levels identified the 13 transgressive segregated lines. Several lines have anthocyanin responses, categorized as high or moderate. This category also refers to the best comparison principle owned by Dewata F1. This concept was also introduced by Arnnok et al. (2012) On Capsicum annum L. Accounting for this, lines G3.2.7, G2.6.9, G2.6.5, G1.12.9, G10.5.8, and G5.12.1 are recommended as lines with high productivity potential and superior anthocyanins. The six lines require validation for the stability of the anthocyanin content in the next generation or at the preliminary yield test stage. The stability of the yield and anthocyanins will be a desirable novelty to be released into functional cayenne pepper varieties with high anthocyanins.
The validation results showed an excellent TSI value between F3 and F4. This was indicated by the percentage of genotypes with consistent TSI between F3 and F4. In addition to that, inconsistent genotypes have small negative values in their F4. This inconsistency is also caused by the influence of different agroclimates on the cultivation of the F3 population and its validation (F4). According to Widowati et al. (2023), differences in climatological parameters significantly influence the response of genotypes. This difference was also reported by Sayekti et al. (2021) and Sahmat et al. (2024), which show drastic differences in response between chili genotypes to differences in environmental and climatological factors. This indicates that the TSI value can still be used as a good reference in assessing the potential for transgressive segregants, especially for segregants with high TSI values in the F3 population. It was reflected in the genotypes G3-2-7-3, G2.6.9–10, G5-12–1-8, and G4.5.2–12, which consistently have positive TSI values in their F4. Apart from that, genotype G3-2-7-3 also has good anthocyanin potential, along with G10.5.8–5. These two genotypes also have consistent anthocyanin content in F3 and F4. However, this concept still needs to be developed by linking the concepts of other approaches so that a selection formulation with a higher determination value is formed. In addition, the anthocyanin content also needs to be analyzed precisely, such as metabolomics, proteomics, transcriptomics, and genomics. Nevertheless, based on the overall validation results, the TSI approach can still be used as a reference in assessing the potential of transgressive segregants.
This study demonstrates the effectiveness of developing a semi-objective-based selection index as an innovative methodology in segregated transgressive F3 chili pepper selection. Fruit weight and canopy width are recommended for selection criteria, along with the yield. The transgressive selection index formed in this study was 3 yield +0.88 fruit weight + 0.46 canopy width. This index is considered adequate based on its validation in predicting transgressive segregants. The recommended lines as transgressive segregants with high productivity were G3-2-7-3, G2.6.9–10, G5-12–1-8, and G4.5.2–12. Meanwhile, line G3-2-7-3 was recommended as a line with high productivity potential and superior anthocyanins. However, this concept still needs to be developed by linking the concepts of other approaches so that a selection formulation with a higher determination value is formed. In addition, the anthocyanin content also needs to be analyzed precisely, like the omics concept. Nevertheless, these segregant lines can still be recommended to proceed to the yield testing stage or be crossed to form hybrid lines with high yield potential and anthocyanin content.
The project uses STAR 2.0.1 from IRRI, Rstudio with the corrplot package, and the Excel Office 2016 version. For lines resources from multiple cross-generations.
The datasets presented in this study can be found in online repositories. The names of the repository/repositories and accession number(s) can be found in the article/supplementary material.
MA: Writing – original draft, Visualization, Validation, Resources, Methodology, Funding acquisition, Formal analysis, Data curation, Conceptualization. YM: Writing – review & editing, Supervision, Resources, Conceptualization. ND: Writing – original draft, Conceptualization. NW: Writing – original draft, Investigation, Conceptualization. AA: Writing – original draft, Investigation, Conceptualization. AM: Writing – original draft, Conceptualization. FF: Writing – original draft, Investigation. MF: Writing – review & editing, Supervision, Resources. AD: Writing – review & editing, Supervision, Data curation. AN: Writing – original draft, Investigation.
The author(s) declare that financial support was received for the research, authorship, and/or publication of this article. This research was supported by the Ministry of Education, Culture, Research, and Technology of the Republic of Indonesia through the scheme of Penelitian Fundamental Kolaboratif UNHAS (UNHAS Fundamental Research Collaborative) with grant Number: 00323/UN4.22/PT.01.03/2023.
The authors are grateful to the Ministry of Education, Culture, Research, and Technology of the Republic of Indonesia through the UNHAS Fundamental Research Collaborative scheme. Furthermore, we thank publication management center of Hasanuddin University for providing facilities, such as training workshops and Enago proofreading for this article.
The authors declare that the research was conducted without any commercial or financial relationships that could be construed as a potential conflict of interest.
All claims expressed in this article are solely those of the authors and do not necessarily represent those of their affiliated organizations, or those of the publisher, the editors and the reviewers. Any product that may be evaluated in this article, or claim that may be made by its manufacturer, is not guaranteed or endorsed by the publisher.
The Supplementary material for this article can be found online at: https://www.frontiersin.org/articles/10.3389/fsufs.2024.1288579/full#supplementary-material
Alimi, N. A., Bink, M. C. A. M., Dieleman, J. A., Nicolaï, M., Wubs, M., Heuvelink, E., et al. (2013). Genetic and QTL analyses of yield and a set of physiological traits in pepper. Euphytica 190, 181–201. doi: 10.1007/s10681-012-0767-0
Alsabah, R., Purwoko, B. S., Dewi, I. S., and Wahyu, Y. (2019). Selection index for selecting promising doubled haploid lines of black rice. Sabrao J. Breed. Genet. 51, 430–441.
Amas, A. N. K., Musa, Y., Farid, M., and Anshori, M. F. (2023). Genetic characteristics of F2 populations obtained through double and three-way crosses in cayenne peppers. Sabrao J. Breed. Genet. 52, 309–318. doi: 10.54910/sabrao2023.55.2.4
Andrade, N. J. P., Monteros-Altamirano, A., Bastidas, C. G. T., and Sørensen, M. (2020). Morphological, sensorial and chemical characterization of chilli peppers (Capsicum Spp.) from the Catie Genebank. Agronomy 10:1732. doi: 10.3390/agronomy10111732
Anshori, M. F., Purwoko, B. S., Dewi, I. S., Ardie, S. W., and Suwarno, W. B. (2021). A new approach to select doubled haploid rice lines under salinity stress using indirect selection index. Rice Sci. 28, 368–378. doi: 10.1016/j.rsci.2021.05.007
Anshori, M. F., Purwoko, B. S., Dewi, I. S., Suwarno, W. B., and Ardie, S. W. (2022). Salinity tolerance selection of doubled-haploid rice lines based on selection index and factor analysis. AIMS Agric. Food 7, 520–535. doi: 10.3934/agrfood.2022032
Arain, S. M., and Sial, M. A. (2022). Association analysis of fruit yield and other related attributes in four chilli (Capsicum annum L.) genotypes grown in Sindh Province, Pakistan. Pak. J. Bot. 54, 817–822. doi: 10.30848/PJB2022-3(12)
Arnnok, P., Ruangviriyachai, C., Mahachai, R., Techawongstien, S., and Chanthai, S. (2012). Determination of total phenolics and anthocyanin contents in the pericarp of hot chilli pepper (Capsicum annuum L.). Int. Food Res. J. 19, 235–243.
Arrones, A., Vilanova, S., Plazas, M., Mangino, G., Pascual, L., Díez, M. J., et al. (2020). The Dawn of the age of multi-parent magic populations in plant breeding: novel powerful next-generation resources for genetic analysis and selection of recombinant elite material. Biology 9:229. doi: 10.3390/biology9080229
Aza-González, C., Núñez-Palenius, H. G., and Ochoa-Alejo, N. (2012). Molecular biology of chili pepper anthocyanin biosynthesis. J. Mex. Chem. Soc. 56, 93–98. doi: 10.29356/jmcs.v56i1.281
Bandillo, N., Raghavan, C., Muyco, P. A., Sevilla, M. A. L., Lobina, I. T., Dilla-Ermita, C. J., et al. (2013). Multi-parent advanced generation inter-cross (MAGIC) populations in rice: progress and potential for genetics research and breeding. Rice 6:11. doi: 10.1186/1939-8433-6-11
Bedjaoui, H., Boulelouah, N., Mehaoua, M. S., Baississe, S., Badache, S., Boutiba, S., et al. (2022). Exploring agro-morphological diversity of algerian hot pepper (Capsicum Annuum L.) accessions using multivariate statistics. EmiR. J. Food Agric 34, 836–849. doi: 10.9755/ejfa.2022.v34.i10.2939
Brinton, J., and Uau, C. (2019). A reductionist approach to dissecting grain weight and yield in wheat. J. Integr. Plant Biol. 61, 337–358. doi: 10.1111/jipb.12741
Bu, S., Kar, W., Tucker, R. M., and Comstock, S. S. (2022). Minimal influence of cayenne pepper on the human gastrointestinal microbiota and intestinal inflammation in healthy adult humans—a pilot study. Life 12:1849. doi: 10.3390/life12111849
Carena, M. J. (2021). Germplasm enhancement and cultivar development: the need for sustainable breeding. Crop breed. Appl. Biotechnology 21:e385621S4. doi: 10.1590/1984-70332021v21Sa17
Cerón-Rojas, J., and Crossa, J. (2022). The statistical theory of linear selection indices from phenotypic to genomic selection. Crop Sci. 62, 537–563. doi: 10.1002/csc2.20676
Chung, P. Y., and Liao, C. T. (2022). Selection of parental lines for plant breeding via genomic prediction. Front. Plant Sci. 13:934767. doi: 10.3389/fpls.2022.934767
da Silva, A. R., do Rêgo, E. R., dos Santos Pessoa, A. M., and do Rego, M. M. (2016). Correlation network analysis between phenotypic and genotypic traits of chili pepper. Pesq. agropec. bras. 51, 372–377. doi: 10.1590/S0100-204X2016000400010
de los Reyes, B. G. (2019). Genomic and epigenomic bases of transgressive segregation – new breeding paradigm for novel plant phenotypes. Plant Sci. 288:110213. doi: 10.1016/j.plantsci.2019.110213
Diansari, P., and Rukmana, D.Wahyudi (2023). Examining the economic impact of cayenne pepper in traditional markets of Makassar City: a price analysis study. Agriecobis 6, 34–41. doi: 10.22219/agriecobis.v6i01.24139
Fadhilah, A. N., Farid, M., Ridwan, I., Anshori, M. F., and Yassi, A. (2022). Genetic parameters and selection index of high-yielding tomato F2 population. SABRAO J. Breed. Genet. 54, 1026–1036. doi: 10.54910/sabrao2022.54.5.6
Farid, M., Anshori, M. F., and Ridwan, I. (2022). Tomato F3 lines development and its selection index based on narrow-sense heritability and factor analysis. Biodiversitas 23, 5790–5797. doi: 10.13057/biodiv/d231132
Fellahi, Z. E. A., Hannachi, A., and Bouzerzour, H. (2018). Analysis of direct and indirect selection and indices in bread wheat (Triticum aestivum L.) segregating progeny. Int. J. Agron. 2018, 1–11. doi: 10.1155/2018/8312857
Feng, S., Liu, Z., Hu, Y., Tian, J., Yang, T., and Wei, Z. (2020). Genomic analysis reveals the genetic diversity, population structure, evolutionary history and relationships of Chinese Pepper. Hortic. Res. 7:158. doi: 10.1038/s41438-020-00376-z
Gupta, C., Tewari, V. K., Machavaram, R., and Shrivastava, P. (2022). An image processing approach for measurement of chili plant height and width under field conditions. J. Saudi Soc. Agric. Sci. 21, 171–179. doi: 10.1016/j.jssas.2021.07.007
Hanani, A. A., Anindita, R., and Mutisari, R. (2020). Analysis of market integration cayenne pepper (Capsicum Frutescens L.) in Malang District. Agric. Soc. Econ. J. 20, 23–30. doi: 10.21776/ub.agrise.2020.020.1.4
Hernández-Pérez, T., Gómez-García, M. D. R., Valverde, M. E., and Paredes-López, O. (2020). Capsicum annuum (hot pepper): an ancient latin-american crop with outstanding bioactive compounds and nutraceutical potential. A review. Compr. Rev. Food Sci. Food Saf. 19, 2972–2993. doi: 10.1111/1541-4337.12634
Jayanti, A. L., Prapti, K. P., and Hadi, A. (2021). The performance efficiency of cayenne pepper supply chain in Wongsorejo District Banyuwangi regency. Jurnal Manajemen Dan Agribisnis 18, 101–112. doi: 10.17358/jma.18.1.101
Johnson, J. B., Orche, A. E., Mani, J. S., Aït-Kaddour, A., Walsh, K. B., and Naiker, M. (2023). Prediction of phytochemical constituents in cayenne pepper using MIR and NIR spectroscopy. Appl. Sci. 13:5143. doi: 10.3390/app13085143
Kassahun, B. M., Alemaw, G., and Tesfaye, B. (2013). Correlation studies and path coefficient analysis for seed yield and yield components in Ethiopian coriander accessions. Afr. Crop. Sci. J. 21, 51–59.
Khan, M. M. H., Rafii, M. Y., Ramlee, S. I., Jusoh, M., and Mamun, M. A. (2022). Path-coefficient and correlation analysis in bambara groundnut (Vigna subterranea [L.] Verdc.) accessions over environments. Sci. Rep. 12:245. doi: 10.1038/s41598-021-03692-z
Koide, Y., Sakaguchi, S., Uchiyama, T., Ota, Y., Tezuka, A., Nagano, A. J., et al. (2019). Genetic properties responsible for the transgressive segregation of days to heading in rice. G3 9, 1655–1662. doi: 10.1534/g3.119.201011
Kusumiyati, K., Putri, I. E., Hamdani, J. S., and Suhandy, D. (2022). Real-time detection of the nutritional compounds in green ‘Ratuni UNPAD’ cayenne pepper. Horticulturae 8:554. doi: 10.3390/horticulturae8060554
Lahbib, K., Dabbou, S., Bnejdi, F., Pandino, G., Lombardo, S., El Gazzah, M., et al. (2021). Agro-morphological, biochemical and antioxidant characterization of a Tunisian chili pepper germplasm collection. Agriculture 11:1236. doi: 10.3390/agriculture11121236
Lee, J., Durst, R. W., Wrolstad, R. E., Eisele, T., Giusti, M. M., Hach, J., et al. (2005). Determination of total monomeric anthocyanin pigment content of fruit juices, beverages, natural colorants, and wines by the ph differential method: collaborative study. J. AOAC Int. 88, 1269–1278. doi: 10.1093/jaoac/88.5.1269
Lestari, P., Syukur, M., Trikoesoemaningtyas, T., and Widiyono, W. (2023). Genetic variability and path analysis of chili (Capsicum annuum L.) associated characters under drought stress from vegetative to generative phases. Biodiversitas 24, 2315–2323. doi: 10.13057/biodiv/d240445
Litrico, I., and Violle, C. (2015). Diversity in plant breeding: a new conceptual framework. Trends Plant Sci. 20, 604–613. doi: 10.1016/j.tplants.2015.07.007
Liu, Y., Schouten, R. E., Tikunov, Y., Liu, X., Visser, R. G. F., Tan, F., et al. (2022). Blue light increases anthocyanin content and delays fruit ripening in purple pepper fruit. Postharvest Biol. Technol. 192:112024. doi: 10.1016/j.postharvbio.2022.112024
Lopez-Cruz, M., and de los Campos, G. (2021). Optimal breeding-value prediction using a sparse selection index. Genetics 218:iyab030. doi: 10.1093/GENETICS/IYAB030
Lstibůrek, M., Bittner, V., Hodge, G. R., and Picek, J. (2018). Estimating realized heritability in panmictic populations. Genetics 208, 89–95. doi: 10.1534/genetics.117.300508
Mahendradatta, M., Alri, U. M., Bilang, M., and Tawali, A. B. (2021). Utilization of black rice (Oryza sativa L. indica) extract in making sarabba as functional drink. Canrea J.: Food Technol. Nutr. Culin. J. 4, 75–82. doi: 10.20956/canrea.v4i2.511
Marszałek, K., Woźniak, L., Kruszewski, B., and Skapska, S. (2017). The effect of high pressure techniques on the stability of anthocyanins in fruit and vegetables. Int. J. Mol. Sci. 18:277. doi: 10.3390/ijms18020277
Marulanda, J. J., Mi, X., Utz, H. F., Melchinger, A. E., Würschum, T., and Longin, C. F. H. (2021). Optimum breeding strategies using genomic and phenotypic selection for the simultaneous improvement of two traits. Theor. Appl. Genet. 134, 4025–4042. doi: 10.1007/s00122-021-03945-5
Maryono Yuniawati, M., Trikoesoemaningtyas Wirnas, D., and Human, S. (2019). Genetic Analisys and transgressive segregant selection of F2 sorgum population derived from B69 × Numbu and B69 × Kawali crosses. J. Agron. Indonesia 47, 163–170. doi: 10.24831/jai.v47i2.24991
Meng, Y., Zhang, H., Fan, Y., and Yan, L. (2022). Anthocyanins accumulation analysis of correlated genes by metabolome and transcriptome in green and purple peppers (Capsicum annuum). BMC Plant Biol. 22:358. doi: 10.1186/s12870-022-03746-y
Nascimento, M. F., Rêgo, E. R. D., Nascimento, N. F. F. D., Leite, P. S. D. S., Finger, F. L., Bruckner, C. H., et al. (2019). Heritability of morpho-agronomic traits in ornamental pepper. Crop. Breed. Appl. Biotechnol. 19, 253–261. doi: 10.1590/1984-70332019v19n3a36
Naves, E. R., Scossa, F., Araújo, W. L., Nunes-Nesi, A., Fernie, A. R., and Zsögön, A. (2022). Heterosis and reciprocal effects for agronomic and fruit traits in capsicum pepper hybrids. Sci. Hortic. 295:110821. doi: 10.1016/j.scienta.2021.110821
Oladosu, Y., Rafii, M. Y., Magaji, U., Abdullah, N., Miah, G., Chukwu, S., et al. (2018). Genotypic and phenotypic relationship among yield components in rice under tropical conditions. Biomed. Res. Int. 2018:8936767. doi: 10.1155/2018/8936767
Olasupo, I. O., Liang, Q., Zhang, C., Islam, M. S., Li, Y., Yu, X., et al. (2021). Agronomic biofortification of cayenne pepper cultivars with plant growth-promoting rhizobacteria and chili residue in a chinese solar greenhouse. Microorganisms 9:2398. doi: 10.3390/microorganisms9112398
Pabuayon, I. C., Kitazumi, A., Cushman, K. R., Singh, R. K., Gregorio, G. B., Dhatt, B., et al. (2021). Novel and transgressive salinity tolerance in recombinant inbred lines of rice created by physiological coupling-uncoupling and network rewiring effects. Front. Plant Sci. 12:615277. doi: 10.3389/fpls.2021.615277
Padjung, R., Farid, M., Musa, Y., Anshori, M. F., Nur, A., and Masnenong, A. (2021). Drought-adapted maize line based on morphophysiological selection index. Biodiversitas 22, 4028–4035. doi: 10.13057/biodiv/d220951
Pathy, L. T., Rao, A. M., and Ramesh, S. (2018). Assessing breeding potential of three-way cross and double-cross hybrids in chilli (Capsicum annuum). Agric. Res. 7, 129–134. doi: 10.1007/s40003-018-0318-6
Rajametov, S. N., Lee, K., Jeong, H. B., Cho, M. C., Nam, C. W., and Yang, E. Y. (2021). The effect of night low temperature on agronomical traits of thirty-nine pepper accessions (Capsicum annuum L.). Agronomy 11:1989. doi: 10.3390/agronomy11101986
Reddy, V. R., and Jabeen, F. (2016). Narrow sense heritability, correlation and path analysis in maize (Zea mays L.). Sabrao J. Breed. Genet. 48, 120–126.
Ridzuan, R., Rafii, M. Y., Ismail, S. I., Mohammad Yusoff, M., Miah, G., and Usman, M. (2018). Breeding for anthracnose disease resistance in chili: progress and prospects. Int. J. Mol. Sci. 19:3122. doi: 10.3390/ijms19103122
Rostini, N., Yenny, R. F., and Amien, S. (2019). Inheritance pattern of capsaicin content of indonesian chili landraces (Capsicum annum L.). IOP Conf. Ser. 334:012018. doi: 10.1088/1755-1315/334/1/012018
Rutkoski, J. E., Krause, M. R., and Sorrells, M. E. (2022). “Breeding methods. Population improvement and selection methods” in Wheat improvement: Food security in a changing climate. eds. M. P. Reynolds and H.-J. Braun (Springer Cham), 83–96.
Sabouri, H., Rabiei, B., and Fazlalipour, M. (2008). Use of selection indices based on multivariate analysis for improving grain yield in rice. Rice Sci. 15, 303–310. doi: 10.1016/S1672-6308(09)60008-1
Sahid, Z. D., Syukur, M., and Maharijaya, A. (2020). Diversity of capsaicin content, quantitative, and yield components in chili (Capsicum annuum) genotypes and their F1 hybrid. Biodiversitas 21, 2251–2257. doi: 10.13057/biodiv/d210555
Sahmat, S. S., Rafii, M. Y., Oladosu, Y., Jusoh, M., Hakiman, M., and Mohidin, H. (2024). Unravelling the dynamics of genotype and environment interactions on chilli (Capsicum annuum L.) yield-related attributes in soilless planting systems. Sci. Rep. 14:1698. doi: 10.1038/s41598-023-50381-0
Saleh, M. M., Salem, K. F., and Elabd, A. B. (2020). Definition of selection criterion using correlation and path coefficient analysis in rice (Oryza sativa L.) genotypes. Bull. Natl. Res. Cent. 44:143. doi: 10.1186/s42269-020-00403-y
Sayekti, T. W. D. A., Syukur, M., Hidayat, S. H., and Maharijaya, A. (2021). Diversity and genetic parameter of chili pepper (Capsicum Annuum) based on yield component in three location. Biodiversitas 22, 823–829. doi: 10.13057/biodiv/d220236
Sekine, D., Tsuda, M., Yabe, S., Shimizu, T., Machita, K., Saruta, M., et al. (2021). Improving quantitative traits in self-pollinated crops using simulation-based selection with minimal crossing. Front. Plant Sci. 12:729645. doi: 10.3389/fpls.2021.729645
Shwetha, H. R., Marappa, N., Ramachandra, V., Angadi, V., Patil, K. A. G., Ramesh, S., et al. (2022). Breeding potential of crosses derived from genetically divergent parents differing for yield and its attributes in cowpea [Vigna unguiculata (L.) Walp]. Electron. J. Plant Breed. 12, 1345–1350. doi: 10.37992/2021.1204.184
Stan, T., Munteanu, N., Teliban, G. C., Cojocaru, A., and Stoleru, V. (2021). Fertilization management improves the yield and capsaicinoid content of chili peppers. Agriculture 11:181. doi: 10.3390/agriculture11020181
Statistic Indonesia . (2023). Statistical yearbook of indonesia 2022. Available at: https://www.bps.go.id/indicator/55/61/1/produksi-tanaman-sayuran.html (Accessed August 15, 2023).
Sundari, M. T., Sutrisno, J., and Antriyandarti, E. (2021). Analysis of chili farming in Indonesia. IOP Conf. Ser. 905:012046. doi: 10.1088/1755-1315/905/1/012046
Surya, R., and Tedjakusuma, F. (2022). Diversity of sambals, traditional Indonesian chili pastes. J. Ethnic Foods 9:25. doi: 10.1186/s42779-022-00142-7
Suwarno Lubis, E., Hairmansis, A., and Santoso, (2009). “Development of a package of 20 varieties for blast management on upland rice” in Advances in genetics, genomics and control of Rice blast disease. eds. G.-L. Wang and B. Valent (Dordrecht, NL: Springer Netherlands), 347–357.
Teng, Z., Jiang, X., He, F., and Bai, W. (2020). Qualitative and quantitative methods to evaluate anthocyanins. eFood 1, 339–346. doi: 10.2991/efood.k.200909.001
Tilahun, T., Bezie, Y., Petros, Y., Dessalegn, Y., and Taye, M. (2022). Correlation and path coefficient analysis of green pod yield and yield attributing traits of chili (Capsicum annum L.) genotypes in Ethiopia. All Life 15, 203–210. doi: 10.1080/26895293.2022.2037472
Tripodi, P., Schiavi, M., and Lo Scalzo, R. (2021). Multi-scale evaluation on two locations and digital fruit imaging highlight morpho-agronomic performances and antioxidant properties in chilli pepper hybrids. Agronomy 11:805. doi: 10.3390/AGRONOMY11040805
Uhlarik, A., Ćeran, M., Živanov, D., Grumeza, R., Skøt, L., Sizer-Coverdale, E., et al. (2022). Phenotypic and genotypic characterization and correlation analysis of pea (Pisum sativum L.) diversity panel. Plan. Theory 11:1321. doi: 10.3390/plants11101321
Virga, G., Licata, M., Consentino, B. B., Tuttolomondo, T., Sabatino, L., Leto, C., et al. (2020). Agro-morphological characterization of sicilian chili pepper accessions for ornamental purposes. Plan. Theory 9:1400. doi: 10.3390/plants9101400
Widowati, I., Dhamira, A., Anggrasari, H., and Seleky, R. N. (2023). Climatic factors and its effect on chili production: one step forward combating climate change. BIO Web Conf. 69:04001. doi: 10.1051/bioconf/20236904001
Yashin, A., Yashin, Y., Xia, X., and Nemzer, B. (2017). Antioxidant activity of spices and their impact on human health: a review. Antioxidants 6:70. doi: 10.3390/antiox6030070
Yunandra, Y., Syukur, M., and Maharijaya, A. (2018). Inheritance study for yield components of pepper (Capsicum annuum L.). IOP Conf. Ser. 196:012009. doi: 10.1088/1755-1315/196/1/012009
Zhang, Z., Li, D. W., Jin, J. H., Yin, Y. X., Zhang, H. X., Chai, W. G., et al. (2015). VIGS approach reveals the modulation of anthocyanin biosynthetic genes by CaMYB in chili pepper leaves. Front. Plant Sci. 6:500. doi: 10.3389/fpls.2015.00500
Keywords: antioxidant, Capsicum frutescens L., genetic parameters, transgressive segregation, Z-value
Citation: Anshori MF, Musa Y, Dungga NE, Widiayani N, Arifin AS, Masniawati A, Firmansyah F, Farid M, Dirpan A and Amas ANK (2024) A new approach for selection of transgressive segregants in F3 populations based on selection index and anthocyanin content in cayenne pepper. Front. Sustain. Food Syst. 8:1288579. doi: 10.3389/fsufs.2024.1288579
Edited by:
Kenny Paul, Reliance Industries, IndiaReviewed by:
Palchamy Kadirvel, Indian Institute of Oilseeds Research (ICAR), IndiaCopyright © 2024 Anshori, Musa, Dungga, Widiayani, Arifin, Masniawati, Firmansyah, Farid, Dirpan and Amas. This is an open-access article distributed under the terms of the Creative Commons Attribution License (CC BY). The use, distribution or reproduction in other forums is permitted, provided the original author(s) and the copyright owner(s) are credited and that the original publication in this journal is cited, in accordance with accepted academic practice. No use, distribution or reproduction is permitted which does not comply with these terms.
*Correspondence: Muhammad Fuad Anshori, ZnVhZC5hbnNob3JpQHVuaGFzLmFjLmlk
Disclaimer: All claims expressed in this article are solely those of the authors and do not necessarily represent those of their affiliated organizations, or those of the publisher, the editors and the reviewers. Any product that may be evaluated in this article or claim that may be made by its manufacturer is not guaranteed or endorsed by the publisher.
Research integrity at Frontiers
Learn more about the work of our research integrity team to safeguard the quality of each article we publish.