 George A. Awuni1*
 Daniel B. Reynolds1,2
 Darrin Dodds1Nicholas N. Denwar3
 Alhassan L. Abdulai3
 Peter A. Asungre3
 Iddrisu Yahaya3Peter D. Goldsmith4
- 1Department of Plant and Soil Sciences, College of Agriculture and Life Sciences, Mississippi State University, Mississippi State, MS, United States
- 2International Institute and Programs, Mississippi State University, Mississippi State, MS, United States
- 3Department of Crop Breeding and Agronomy, CSIR-Savanna Agricultural Research Institute (SARI), Tamale, Ghana
- 4Department of Agricultural and Consumer Economics, College of Agricultural, Consumer and Environmental Sciences, University of Illinois at Urbana-Champaign, Champaign, IL, United States
Introduction: Recent prices in soybean have spurred interest in motivating growers into input integration to improve yields across the northern savannas of Ghana. This requires more knowledge of input integration to increase soybean yield and profitability across production areas.
Materials and method: A 3-yr study was conducted in three locations at Manga, Nyankpala, and Wa in Ghana's northern savanna to identify the best-yielding input combination under a rain-fed environment. The experiment used “Jenguma” soybean cultivar with lime, inoculum, and phosphorus in a 2 × 2 × 2 factorial arrangement with four replications. Eight treatment combinations (control included) were used to assess soybean yield, yield components, rain use efficiency, and economic profitability. The single-input application of lime (T1), inoculum (T2), and phosphorus (T4) was the low-input, lime × inoculum (T3), lime × phosphorus (T5), and (inoculum × phosphorus) (T6) as medium input, T7 (lime × inoculum × phosphorus) was high input, and a no-input treatment (control).
Results: The soils were inherently low in fertility, and weather variability during the reproductive stages was a significant limiting factor to improving grain yield across locations. Grain yield was highest in 2017 at Manga and Nyankpala, but in 2019 at Wa. Except at Manga, grain yield and rain use efficiency (RUE) were highest in the high input system (T7). However, marginal net benefits (MNB) and marginal rate of returns (MRR) were highest in the low input system (T2) across locations. The low (T1) and medium (T3) input systems (except Nyankpala) were dominant for MNB and MRR due to the high cost of the lime product.
Discussion: These results suggest that smallholder farmers prefer low input (T2) with the least cost of production and the highest marginal net benefit and marginal rate of returns. Nevertheless, producers would have to evaluate their resource base and the cost of nutrient integration for sustainability.
Conclusion: This paper recommends further studies on lime rates to determine profitability, lime's long-term (residual) effect, and the synergic impact of inoculum and phosphorus.
1. Introduction
Soybeans, Glycine max (L.) Merrill, are relatively recent in Ghana's agriculture but has become one of the most important economic crops in smallholder cropping systems. The crop was introduced in northern Ghana to improve soil fertility, human and livestock nutrition, and as a cash crop for alternative incomes for smallholder farmers (Mercer-Quarshie and Nsowah, 1974; Ocran et al., 1998). Currently, soybeans are an essential cash crop comparable to the staple crops, like rice (Oryza sativa L.), maize (Zea mays L.), pear millet (pennisetum glaucum (L.)) R. Br., and sorghum (Sorghum bicolor (L.)) Moench in Ghana's northern savannas.
Ghana's soybean production began seriously in northern savannas during the early 1990s by selling certified seeds to growers, with later expansion to the middle and forest zones (Ocran et al., 1998). Available statistics suggest Ghana's annual soybean production increased within a decade by more than double, from 75,000 MT (2008) to 177,000 Mt (2018), with an on-farm yield average of 1.68 (Mg ha−1) (MoFA-SRID, 2018; Ritchie et al., 2022). However, the average soybean yields obtained from smallholder farmers are <1.0 (Mg ha−1) (World Bank, 2017; Ritchie et al., 2022). Meanwhile, Ghana's soybean yield potential is estimated at 3.00 (Mg ha−1) (MoFA-SRID, 2018; Ritchie et al., 2022). This presents a yield gap of 66.7 and 44.0 (%) of the smallholder farmers and the on-farm average, respectively. The observed yield gap in the country's soybean production is probably a combination of factors, including the erratic rainfall pattern and high temperatures, insufficient input use in a low soil nutrient environment, and insufficient knowledge of the best agronomic management practices.
Human-made activities such as population growth have generated several yield-limiting factors that affect crop production, including seasonal rainfall variability, low soil fertility, and soil acidification (Von Uexküll and Mutert, 1995; Buri et al., 2005). The global per capita arable land area is estimated to decline from 0.45 in 1950 to 0.15 (ha) by 2050 (Lal and Stewart, 2010). Thus, better alternative soil and crop management practices are needed to increase crop yields to meet the ever-increasing food demand (Lal and Stewart, 2010). Additionally, developing high-yielding crop cultivars requires applying external inputs such as N, P, and K to enhance crop yields (Singh and Ryan, 2015).
Soil acidity affects soil health by causing low crop productivity, reducing and slowing the soil microbial and physical activity impeding the biological nitrogen-fixing process (Buri et al., 2005; Farida and Fariya, 2015; Zhang et al., 2016). In Ghana, acidic soils have been reported in many parts of the country, limiting crop productivity (Buri et al., 2005; Tetteh et al., 2016). Tetteh et al. (2016) observed that most topsoil from Ghana's northern savannas ranges from strongly acidic (5.1–5.5) to slightly acidic (6.1–6.5). Additionally, the soils have low total exchangeable acidity that lower soil pH, resulting in soil acidification (Tetteh et al., 2016). The use of lime has been proposed as an alternative to combat the detrimental effects of soil acidity. Lime provides Ca+2, and Mg+2, needed to alleviate the impact of H+1, Al+3, and Mn+3 (Farida and Fariya, 2015) that negatively impact the activity of N2-fixing rhizobia (Abera and Abebe, 2018). In Ghana, however, lime use among smallholder farmers is limited due to accessibility and knowledge of the potential agricultural benefits.
Phosphorus is a significant plant nutrient required in large amounts in the form of H2 and within a narrow soil pH range of 6.5–7.0 (Etesami et al., 2021). This macronutrient plays a significant role in rapid root development and growth, ensuring good flowering, pod development, quality seed, and disease resistance. At lower soil pH, aluminum (Al), iron (Fe), and manganese (Mn) readily bind with P to form Al-P, Fe-P, and Mn-P compounds, respectively (Etesami et al., 2021). Phosphorus becomes insoluble and unavailable for plant uptake in these forms, which can result in 5–15 (%) reduction in crop yield (Schachtman et al., 1998; Shenoy and Kalagudi, 2005). In such a situation, applying lime is an alternative remedy to ameliorate the detrimental effects of soil acidity (Farida and Fariya, 2015).
Although the soils in northern Ghana harbor indigenous Bradyrhizobium spp. (Jaiswal and Dakora, 2019), there is often the need to inoculate soybean with commercial Bradyrhizobium inoculants known to be highly effective in N2-fixation (Klogo et al., 2016). Significant yield increase has been reported with inoculation alone or in synergy with phosphorus on several soybean cultivars (Awuni et al., 2020). This study included lime in a 1-way, 2-way, or 3-way synergy with inoculum and phosphorus in a low, medium, or high-input system. The objective was to identify the best-yielding input combination under a rain-fed environment and other abiotic stressors, such as temperature and soil fertility, across three sites in Ghana's northern savannas.
2. Materials and methods
2.1. Description of study sites
A 3-year (2017–2019) soybean input trial was conducted in three locations in Ghana's northern savannas (Supplementary Figure S1). The experiments were set up at the research fields of the CSIR-Savanna Agricultural Research Institute (SARI) located across the region. The study sites were chosen across three ecoregions of northern savannas at Manga (11.01347°N, −0.2674°W; 218 m AMSL) in the Eastern Sudan Savanna (E.S.S.), Nyankpala (9.3897°N, −1.0036°; 184 m AMSL) in the Opened Guinea Savanna (O.G.S.), and Wa (9.8864°N, −2.4631°W; 234 m AMSL) in the Western Sudan Savanna (W.S.S) CILSS (2016). The soils are Savanna Ochrosols developed from Birrimian and granitic origin (Adjei-Gyapong and Asiamah, 2002) or Plinthosols (IUSS Working Group WRB, 2015). Ghana's northern savanna has unimodal rainfall between 150 and 200 days from May to October, with a mean annual seasonal variation between 1,000 and 1,100 mm (MoFA-SRID, 2018).
2.2. Weather and soil data
Weather data on rainfall and temperature were obtained from stationed weather monitors and used to compute total monthly precipitation and mean temperature for each study location. A 30-year weather data (1991–2021) was obtained (https://en.climate-data.org/africa/ghana-121/) (Attribution-NonCommercial 4.0 International) (CC BY-NC 4.0) and used as the long-term weather average. Soil fertility data were generated from soil core samples (n = 15) with a cylindrical (2.5 × 36.6 cm) soil probe (A.M.S. Inc., ID., USA) sampled to 15 (cm) soil depth (topsoil) and composited for each location. The composited soils were processed, packaged, and shipped to Waypoint Analytical Laboratories Inc. (Memphis, USA) for physiochemical analysis with the internationally accepted protocol. Waypoint Analytical Laboratories Inc. (Memphis, USA) classified and reported the soil fertility status after the soil analysis (Supplementary Table S1).
2.3. Experimental materials and treatments
The planting material used was “Jenguma” (TGX 825-18D × TGX 814-27D) soybean cultivar released and registered in 2003 and 2015, respectively, by the CSIR–SARI (NVRRC, 2019). The “Jenguma” cultivar is medium maturity between 110 and 115 (days), drought-tolerant (shattering <3%) with a yield potential between 2.5 and 2.8 (Mg ha−1) (Denwar and Wohor, 2012; NVRRC, 2019). The “Jenguma” seeds were obtained from Heritage Seed Ltd, Ghana. The experiment consisted of three input factors of lime, inoculum, and phosphorus at two treatment levels (with or without) in a 2 × 2 × 2 factorial arrangement with four replications.
Based on a recommendation from soil analysis, Omya Calciprill® 110 lime [CaCO3 (37% Ca) and MgCO3 (0.6 % Mg), Omya International, AG] was applied at 3,375 g (plot−1) by broadcast and incorporated into 75 (cm) ridged seedbeds by hand hoeing before planting. Nodumax inoculant [Bradyrhizobium japonicum (strain USDA 110); IITA-BIP, Nigeria] was used to coat seed at 0.72 (g) per 720 seed (plot−1) using the two-step method of seed inoculation. Gum Arabic adhesive was dissolved in warm water at 10 (% w/v) and mixed to coat the seed. The inoculant was then added and mixed to a fine brown powder dispersed evenly on the seeds. The seeds were protected from direct sunlight and were planted soon after application. Uninoculated plots were planted before inoculant plots to prevent contamination. Once planted, the seeds were immediately covered with soil to avoid drying and to ensure good seed-soil moisture contact for germination. Triple superphosphate (46% P2O5) fertilizer was applied at 58.5 (g) of P (plot−1) by side-dressing. Experimental units were six-row plots that measured 4.5 × 5 m (22.5 m2) with a 1-m alley between replications.
2.4. Field preparation, planting, and crop management
Table 1 indicates site-specific coordinates, elevations (AMSL), input application, and harvest dates. The fields were plowed with a tractor disc, harrowed, and ridged to 75 (cm) rows spacing. The planting dates were 8 July 2017, 28 June 2018, and 5 July 2019 for Manga; 12 July 2017, 28 June 2018, and 8 July 2019 for Nyankpala; and 24 July 2017, 17 July 2018, and 13 July 2019 for Wa. Seeding density was set at 40 (kg ha−1) and counted at the two-leaf stage (Petersen, 2009) to 720 plants (plot−1) to represent 75 × 4 (cm) plant spacing. Weed management included a mixture of 1.15 (kg a.i. ha−1) sunphosate 460 SL [glyphosate, N-(phosphonomethyl) glycine; Wynca Sunshine Ltd, Ghana] and 1.12 (kg a.i. ha−1) Stomp 455 CS [pendimethalin, N-(l-ethyl propyl)-3,4-dimethyl-2, 6-dinitrobenzenamine); Cama Agro Consulting Ltd, Ghana] in a 15-L knapsack sprayer fitted with a flat fan nozzle in a 200 (L ha−1) spray volume equivalent applied the same day after planting to slow weed growth. Two-hand weeding was done at V4 and V6 growth stages (Petersen, 2009). Lambda Super 2.5 EC (Lambda-cyhalothrin; Kumark Company Ltd) was applied at 0.025 (kg a.i ha−1) in a 150 (L ha−1) spray volume equivalent during the beginning flowering (R1) and pod development (R3) stages (Petersen, 2009) to minimize flower and pod feeding insect damage.
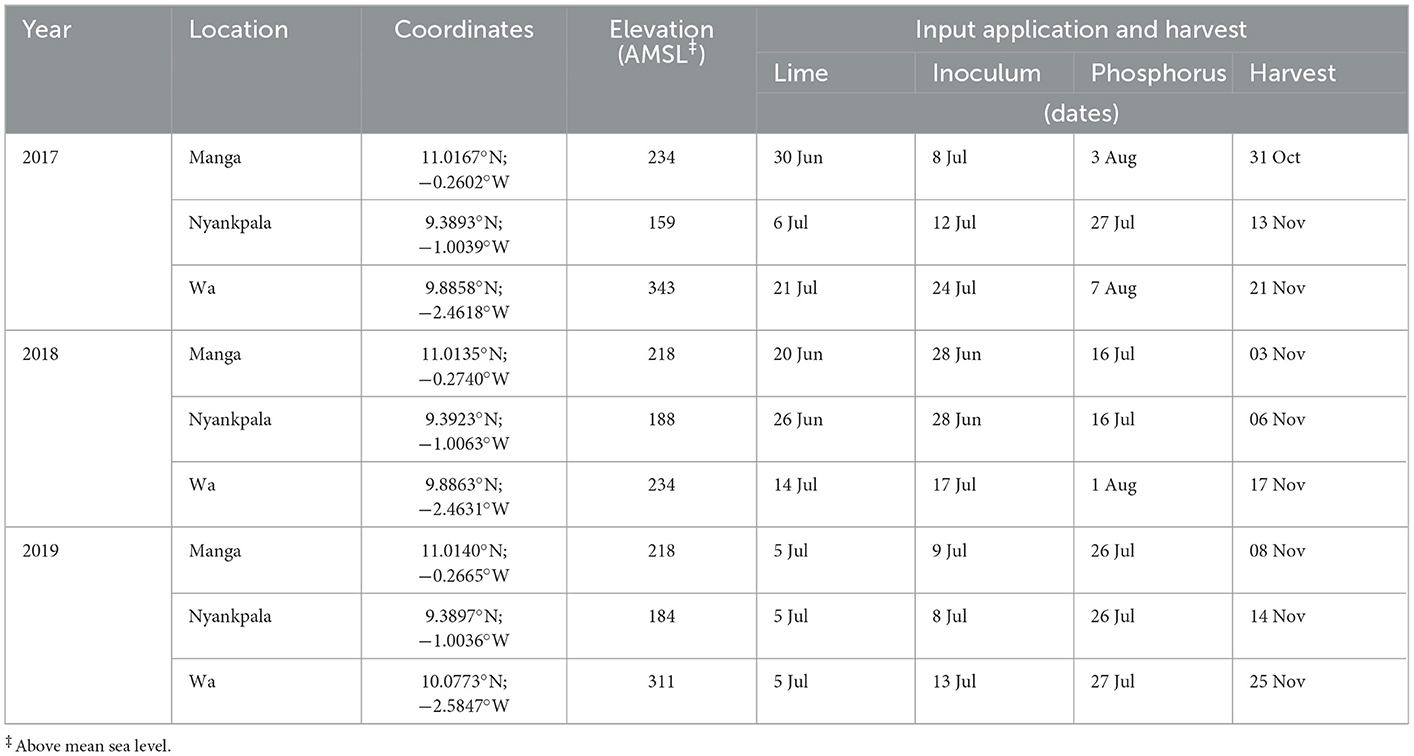
Table 1. Site-specific coordinates, elevation, input application, and harvesting dates at Manga, Nyankpala, and Wa in northern Ghana (2017–2019).
2.5. Measurements of grain yield and yield components
Data was taken on days to 50 (%) flowering time measured from the date of planting to 50 (%) flowering of the soybean in a net plot (7.5 m2). The plant height (cm) data were taken randomly from six plants and measured above ground to the apex of soybean plants at 50 (%) flowering time. The plants were then tagged for later identification. Yield component data were the number of pods (plant−1) calculated as the average of six plants randomly selected from each net plot at maturity. The seed number (pod−1) was calculated as a ratio of the seed number (plant−1) to the pod number (plant−1). Hundred seed weight (g) was determined from the average of four sets of 100 seed weights (g) per treatment plot. Grain yield (Mg ha −1) and harvest index were evaluated as described by Awuni et al. (2020).
2.6. Rain use efficiency (kg ha−1 mm−1)
Rain use efficiency (RUE; kg ha−1 mm−1) was calculated as the ratio of grain yield (kg ha−1) to the cumulative seasonal rainfall (CSR; mm) received from planting to crop maturity (Sharma et al., 2013).
2.7. Economic assessment
The partial budget by dominance analysis was used to estimate the marginal net benefit of each treatment in increasing order of the total cost that varies. A treatment with a net benefit less than or equal to the treatment input (s) below or above is dominated (CIMMYT, 1988). The total costs that vary (TCV) included the cost of lime, inoculum, and TSP fertilizer (Supplementary Table S2). Grain yield was adjusted to 12 (%) moisture to estimate gross revenue on a 3-yr average soybean price. Soybean prices were valued in local currency (GHS) and converted to U.S. dollars ($) at the prevailing average exchange rate of $0.4272 (kg−1) (Supplementary Table S2). The cost of land rental and preparation, crop management and harvest, transportation of harvested produce, and storage were considered fixed variables. The partial budget analysis by dominance approach was used on pooled data across years for each treatment for each trial location. The computed net benefit and marginal rate of returns were as below:
Where, i = subscript, which denotes each treatment.
The Marginal rate of return, defined as the change in marginal net benefits divided by the marginal cost that varies, expressed as a percentage, was calculated as below (CIMMYT, 1988):
Where; MRRi is the Marginal rate for each treatment,
NBi1 is the Gross revenue for the treatment 1,
NBi2 is the Gross revenue for treatment 2,
TCVi1 is the total cost that varies for treatment 1,
TCVi2 is the total cost that varies for treatment 2.
The marginal rate of return suggests what farmers, on average, could expect to gain in return for the investment when deciding to change from one agronomic practice (s) to new technology (CIMMYT, 1988). The calculations are based on the prevailing market prices of all inputs and outputs at the time of experiments averaged across years.
3. Statistical analysis
Data were subjected to analysis of variance (ANOVA) using the MIXED procedure in S.A.S. version 9.4 (SAS Institute, 2016) (Supplementary Table S3). When the effects of treatments were significant, means were separated using Fisher's Protected LSD with DIFFS option on LSMEANS statement for letter grouping at P < 0.05 (Saxton, 1998).
4. Results
4.1. Seasonal rainfall and temperature
The mean crop growth period (CGP) of the “Jenguma” cultivar from planting to harvest averaged 123 (days) across sites (Table 2). At Manga, the CGP varied between 116 and 129 (days), while Nyankpala and Wa ranged from 120 and 126 (days). The monthly crop seasonal rainfall (MCSR) distribution varied from 236.7 (mm) in July to 87.7 (mm) in Oct at Manga, 219.5 (mm) in Sept to 99.9 (mm) in Oct at Nyankpala, and 238.0 (mm) in July to 108.4 (mm) in Oct at Wa. The total crop seasonal rainfall (TCSR) received was variable, with the lowest in 2017 in all the study sites. The mean TCSR were 718.4, 675.4, and 737.4 (mm) for Manga, Nyankpala, and Wa, respectively. At Manga, the yearly TCSR recorded were 627.3, 737.8, and 790.0 (mm) for 2017, 2018, and 2019, respectively; 566.7, 829.6, and 630.0 (mm) for 2017, 2018, and 2019, respectively, at Nyankpala; and 459.9, 888.2, and 864.2 (mm) for 2017, 2018, and 2019, respectively, at Wa.
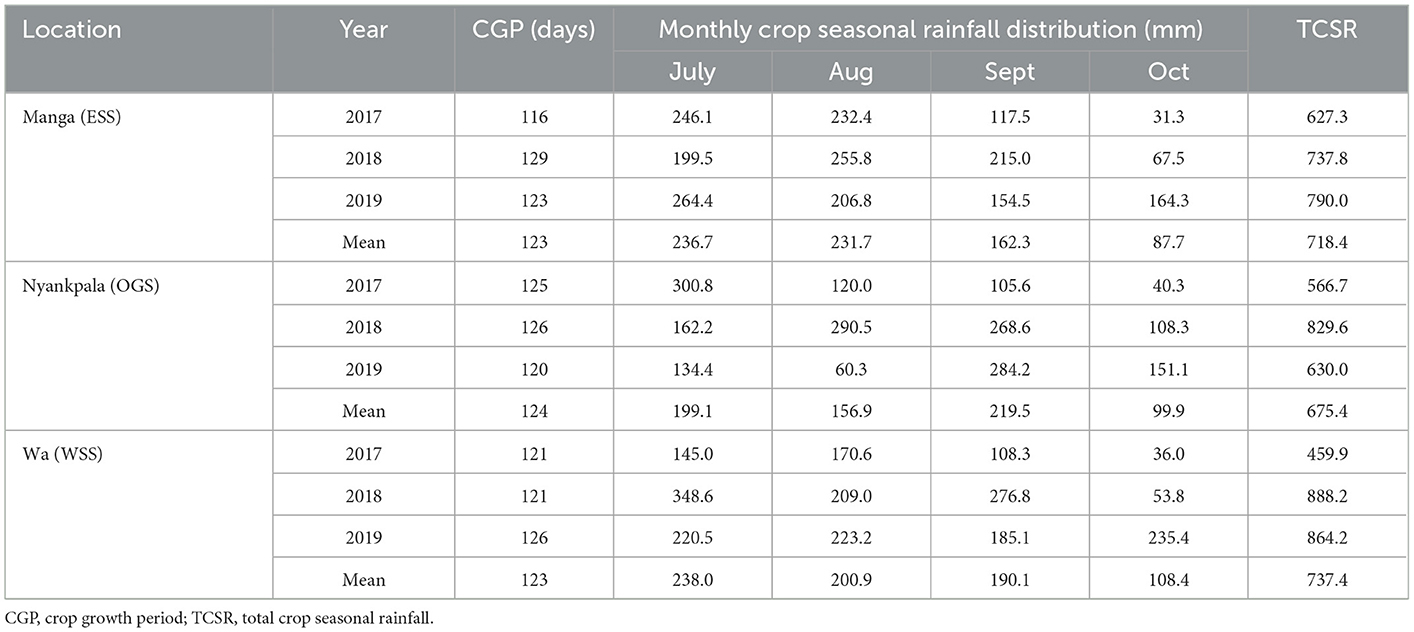
Table 2. The CGP, seasonal crop rainfall, and TCSR for Manga, Nyankpala, and Wa (2017–2019).
The annual seasonal rainfall was erratic across months and sites, with rainfall deficits experienced in all study sites in 2017 and 2019 (Table 3). The yearly seasonal rainfall, when compared with the 30-year average, indicated that 2017 had the highest rainfall deficits of −28.6, −127.1, and −105.0 (mm) for Manga, Nyankpala, and Wa, respectively. However, the 2019 cropping season also experienced dry spells at late vegetative (Aug.) through flowering (Aug) to seed fill (Sept.) or at maturity stages (Oct.). Compared with the 30-yr average, the mean monthly temperatures increased in all study sites (Table 3). The mean seasonal temperature increase above the 30-year average was 1.2, 0.1, and 0.2 (°C) for 2017, 2018, and 2019, respectively at Manga; 1.1, 1.4, and 1.5 (°C) for 2017, 2018, and 2019, respectively, at Nyankpala; and 1.1, 0.3, and 0.3 (°C) for 2017, 2018, and 2019, respectively, at Wa. Nyankpala recorded the highest mean seasonal temperature increase between 1.1 and 1.5 (°C) above the 30-year average, while Manga experienced the lowest increase between 0.1 and 1.2 (°C).
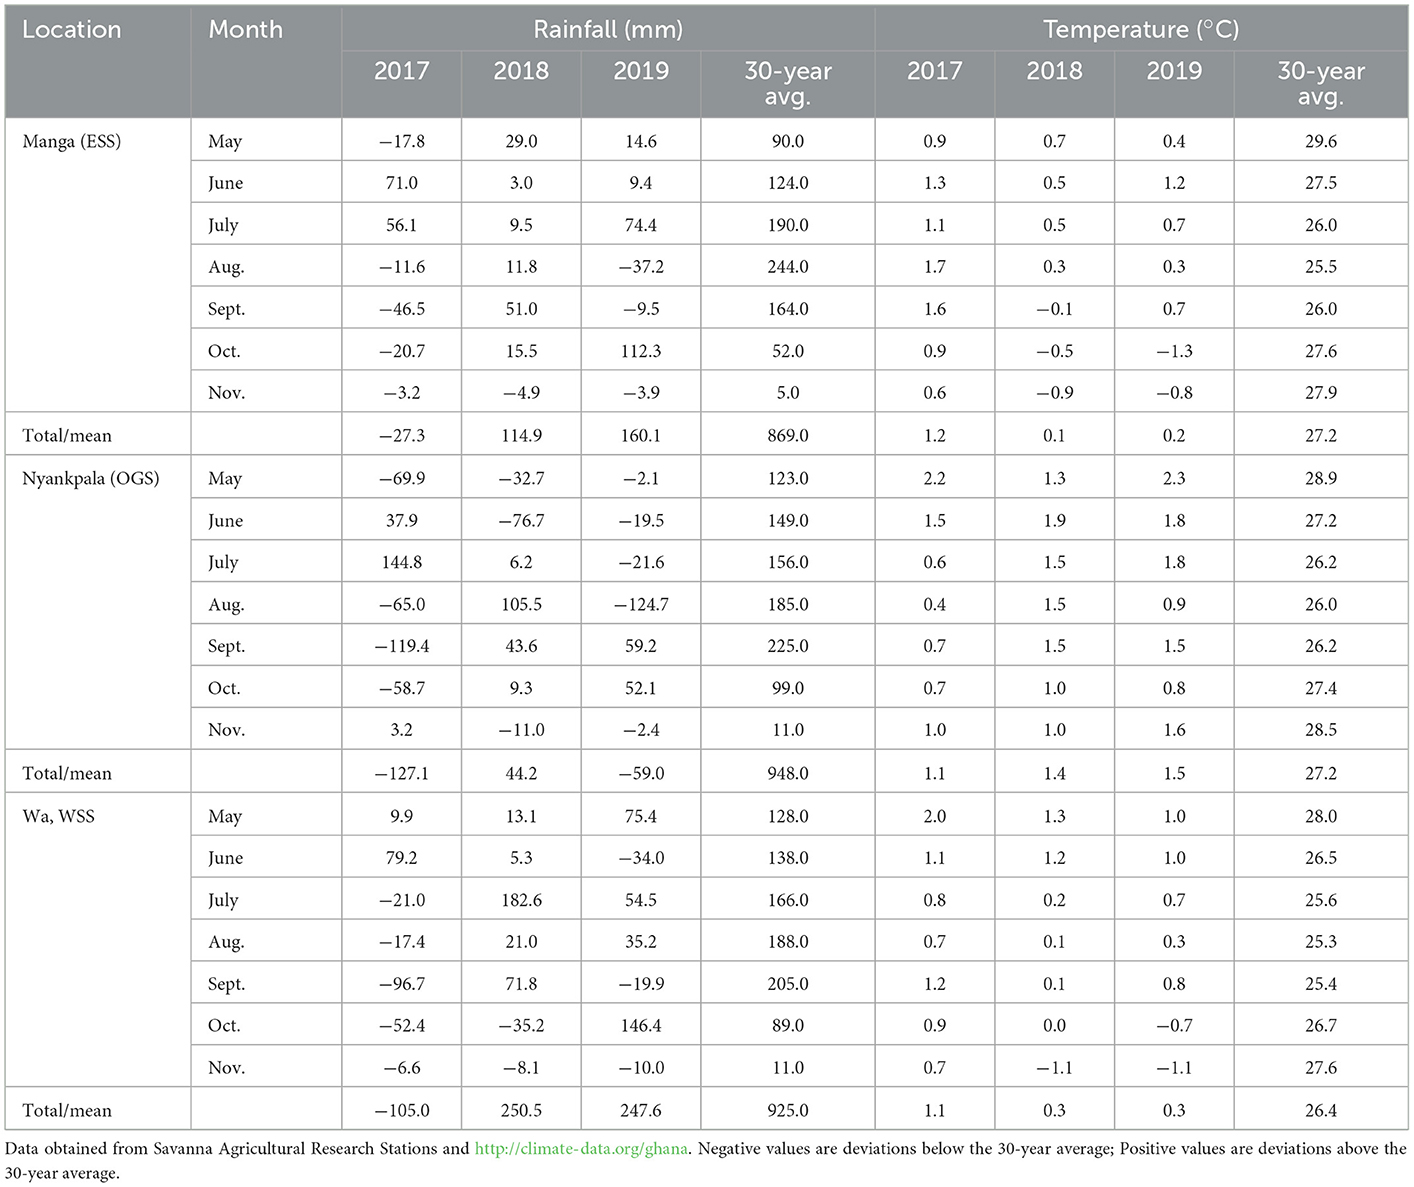
Table 3. Total seasonal monthly rainfall and mean temperature deviations from the 30-year average for Manga, Nyankpala, and Wa in Ghana's northern savannas (2017–2019).
4.2. Soil properties and fertility status
The results of the soil analysis were averaged across the 3-year experiments for each study location (Table 4). The soils were sandy loam with strong acidity at Manga and Nyankpala, and loamy sand with moderate acidity at Wa. The buffer pH averaged between 6.78 and 6.81 across the study locations.
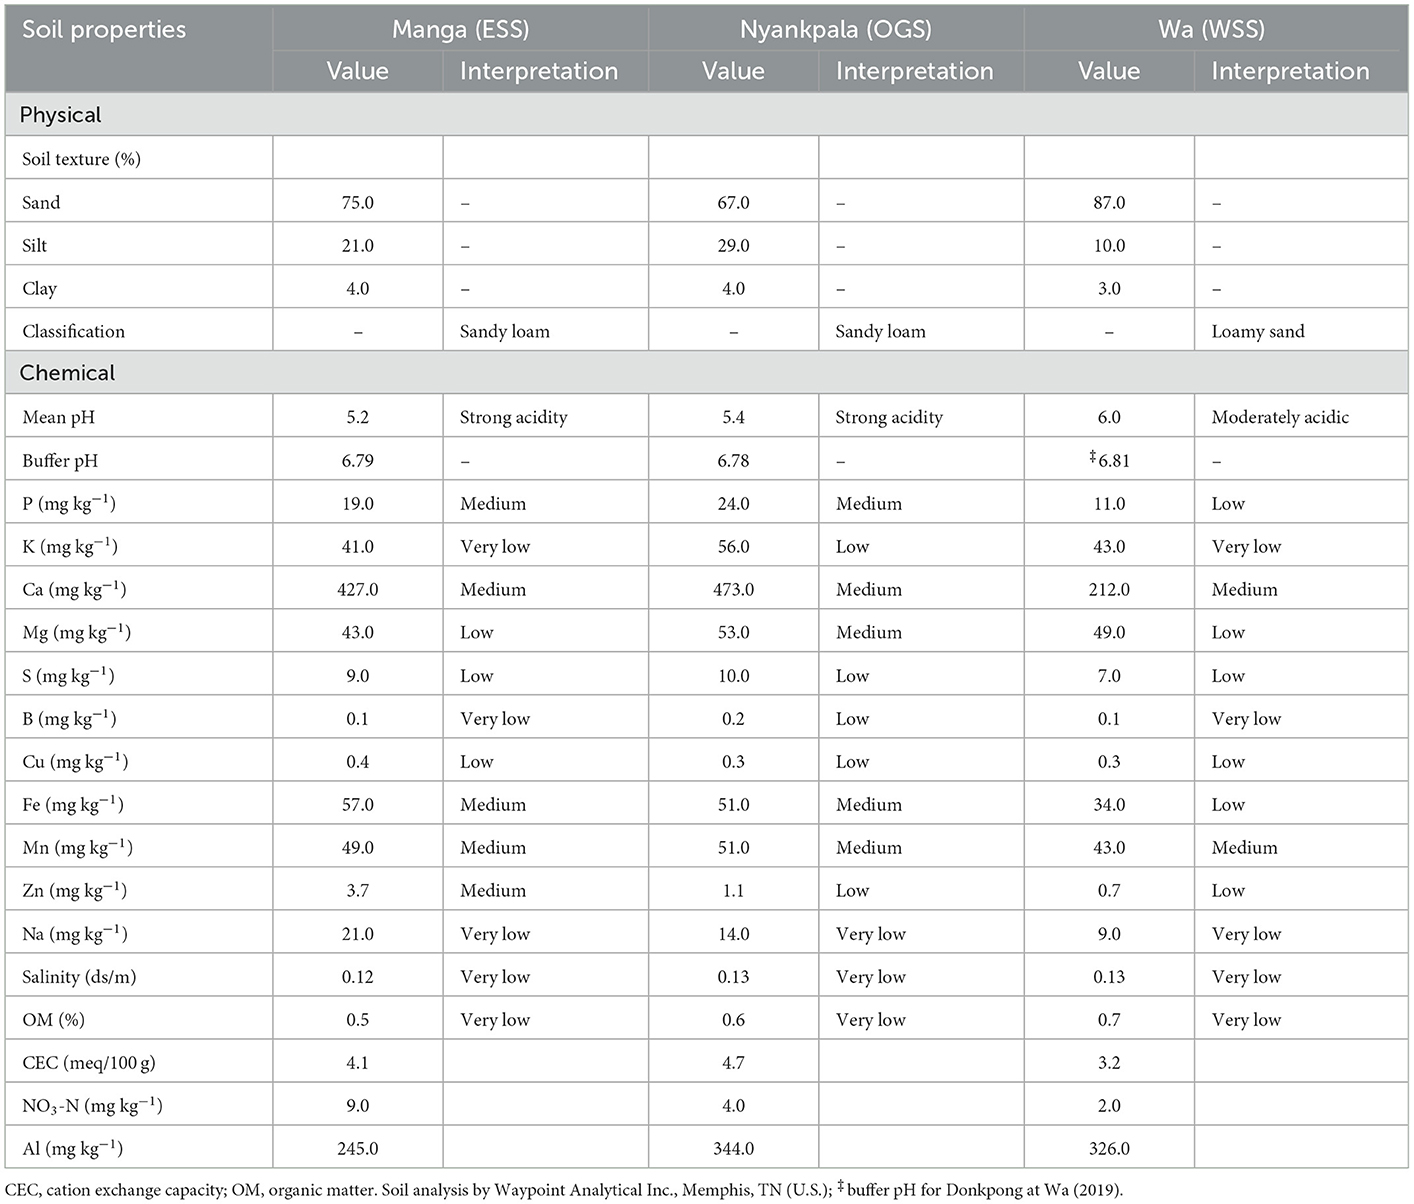
Table 4. Soil properties and fertility status at 0–15 (cm) soil depth for Manga, Nyankpala, and Wa in Ghana's northern savannas across a 3-year average (2017–2019).
The macronutrient analysis for P varied from medium at Manga and Nyankpala to low at Wa. The available K went from low at Nyankpala to very low at Manga and Wa. Calcium and S were medium and low across sites with Mg ranging between medium at Nyankpala and low at Manga and Wa.
For the micronutrient, B varied between very low at Manga and Wa, and low at Nyankpala. The ratings for Cu and Mn were low and medium across the sites. The values for Fe ranged from medium at Manga and Nyankpala to low at Wa. The rating for Zn went from the medium at Manga to low at Nyankpala and Wa, while Na, salinity, and OM were very low across the sites. The NO3-N and CEC values varied between 2.0 and 9.0 and 3.2 and 4.7, respectively, while Al varied from 245.0 to 344.0 (mg kg−1) across the study sites.
4.3. The one-way effects of year and nutrient inputs
The main effects of year, lime, inoculum, and phosphorus on 50 (%) flowering time, plant height, RUE, yield, and yield components differed across the study locations (Table 5).
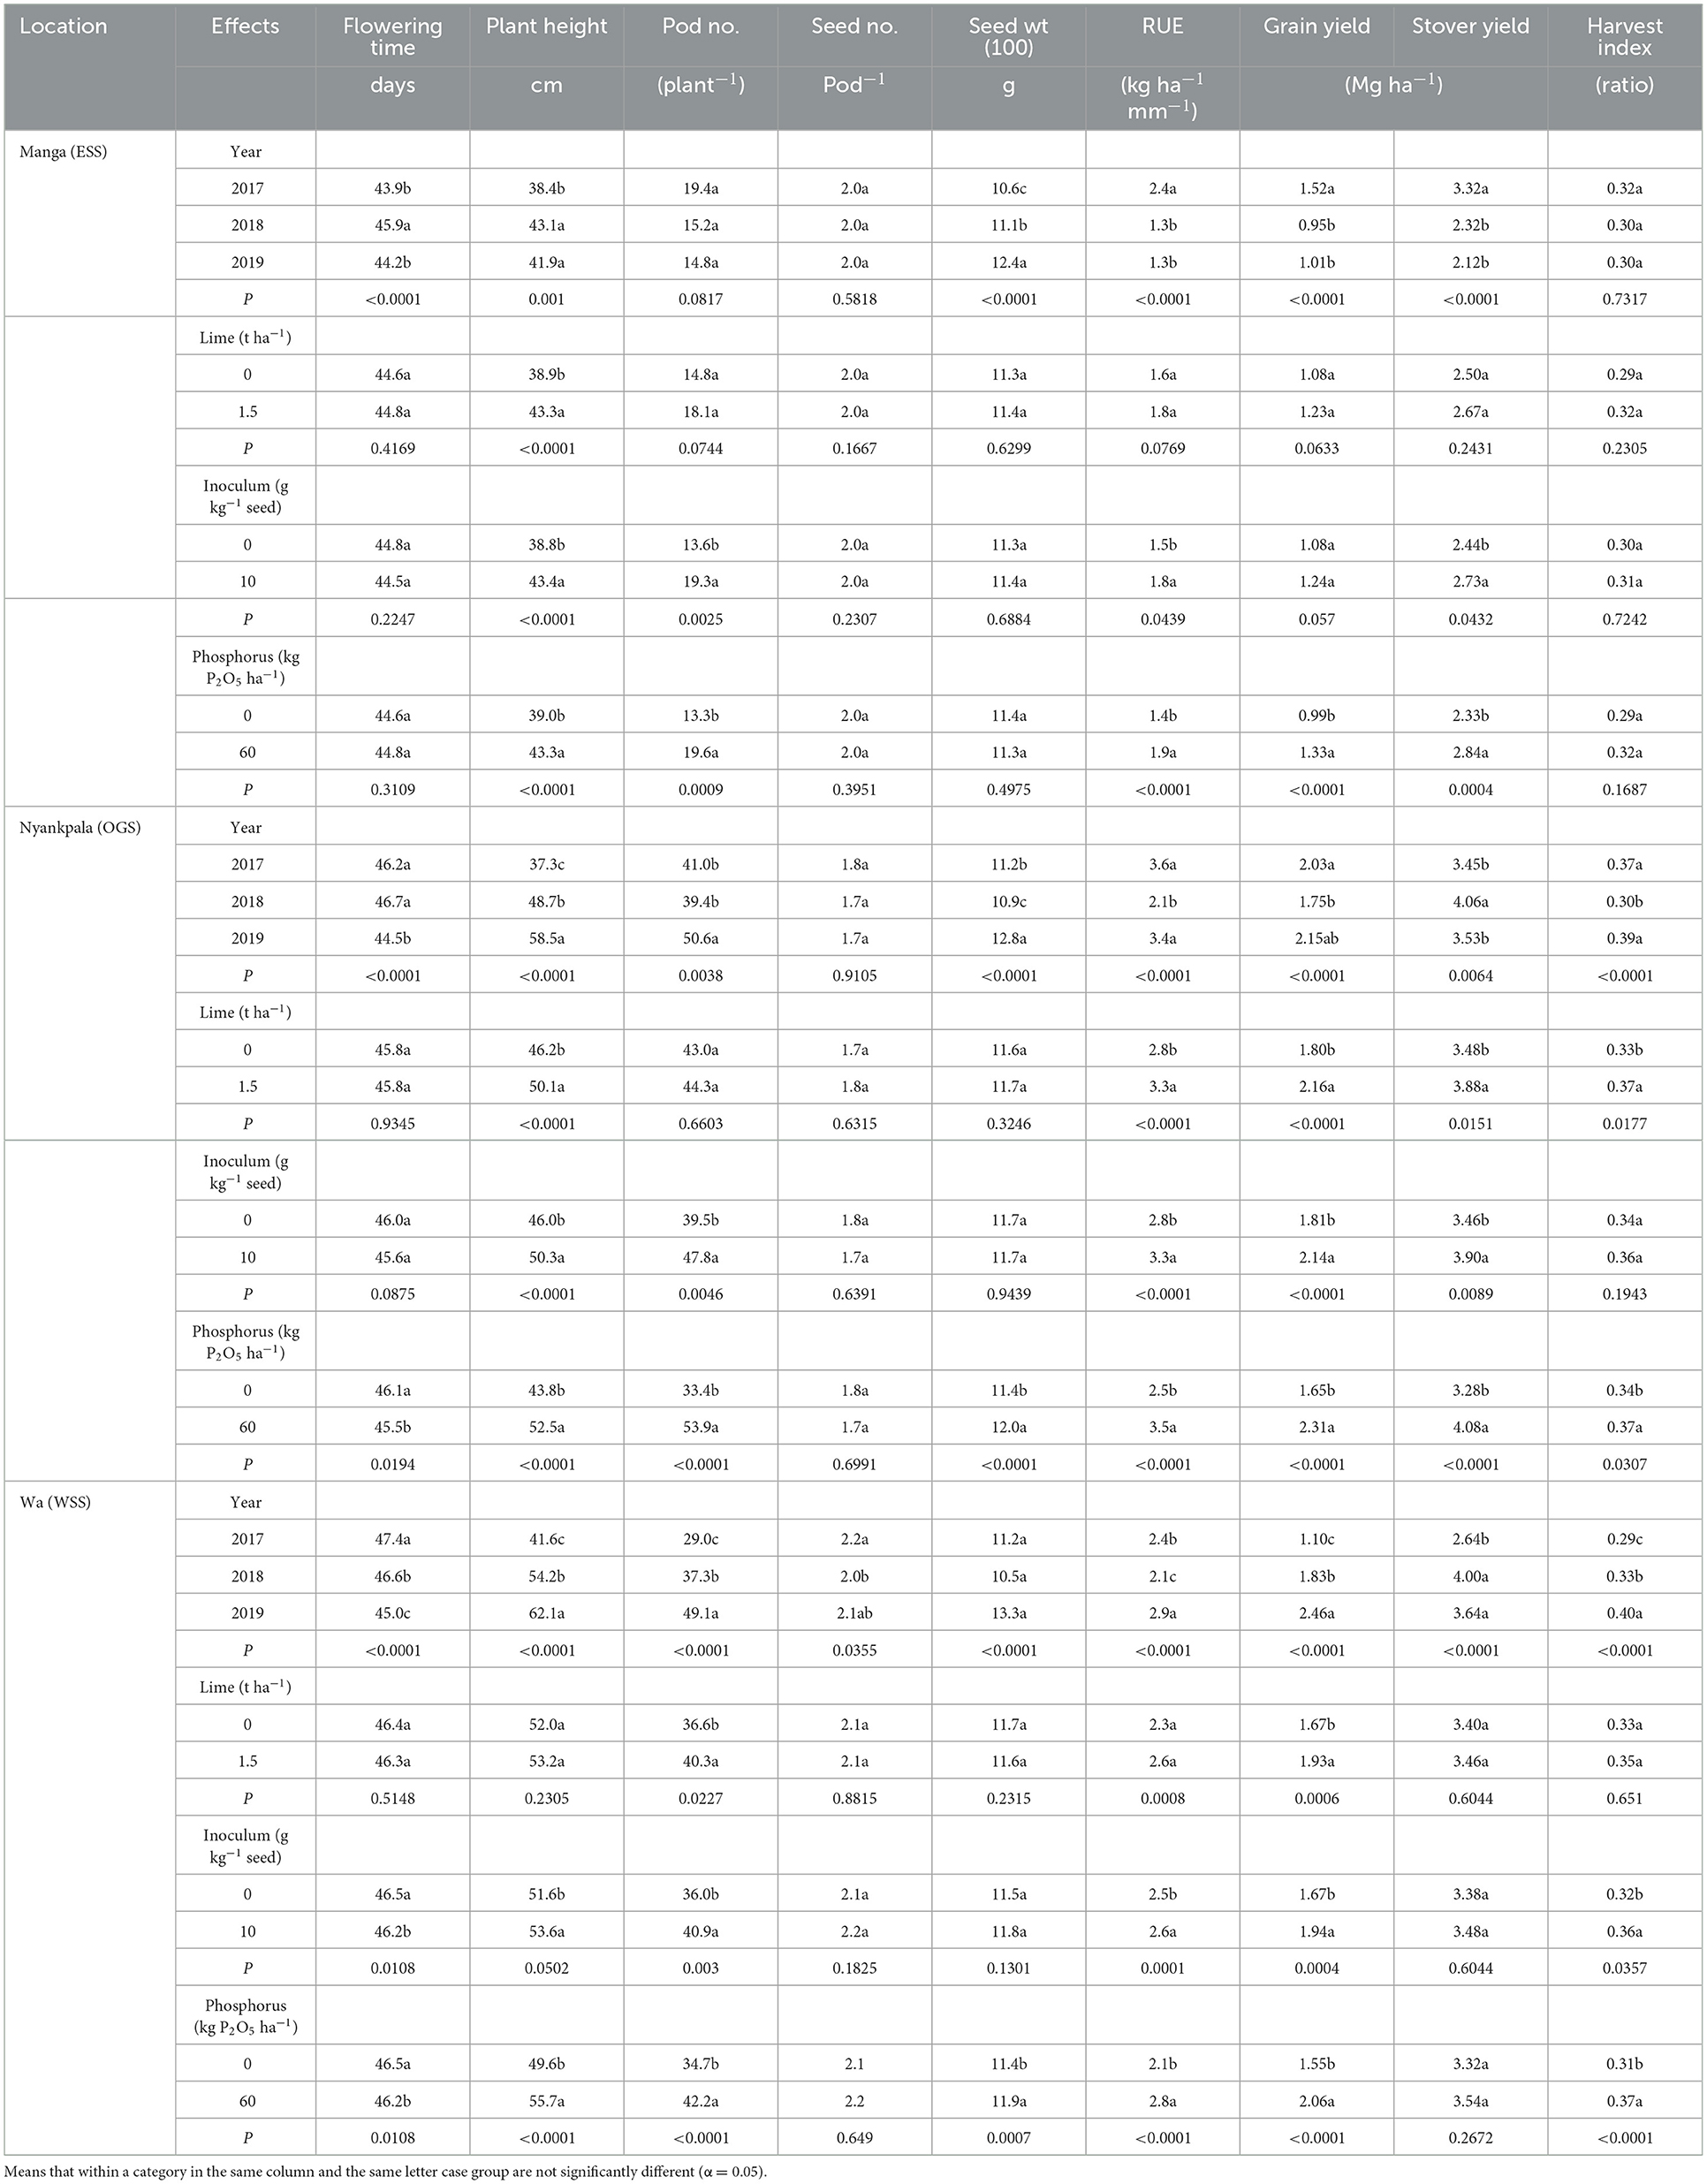
Table 5. Main effects of year, lime, inoculum, and phosphorus on yield, yield components, and rain use efficiency at Manga, Nyankpala, and Wa locations in the northern savannas of Ghana.
4.3.1. Days to 50 (%) flowering (time)
The effect of year on flowering time differed significantly in all three trial locations (Table 5). At Manga, the flowering time was shorter by 2 (days) in 2017 and 2019 compared to 2018. Similarly, the flowering time at Nyankpala was shorter by 2 (days) in 2019 relative to 2017 and 2018, while the flowering time at Wa was 2 (days) shorter in 2018 and 2019 compared to 2017. Application of P reduced the flowering time over the control by 0.6 (days) and 0.3 (days) at Nyankpala and Wa, respectively. However, inoculation reduced flowering time over the control by 0.3 (days) at the Wa study location only. At the same time, the application of lime did not differ significantly from the control treatment on flowering time in all three locations.
4.3.2. Plant height (cm)
The effect of the year significantly influenced plant height at flowering across sites (Table 5). At Manga, plant height at the flowering time increased significantly in 2018 over 2017 by 12.2 (%) but not in 2019. At Nyankpala, plant height increased significantly at flowering time in 2019 over 2017 and 2018 by 56.8 and 20.1 (%), respectively. At Wa, plant height increased significantly at flowering time in 2019 over 2017 and 2018 by 49.3 and 14.6 (%), respectively.
Except for the lime application at Wa, the input application significantly improved plant height at the flowering time over the controls across sites. At Manga, the main effects of lime, inoculum, or phosphorus increased plant height over the controls by 11.3, 11.9, and 11.0 (%), respectively. At Nyankpala, the effects of lime, inoculum, or phosphorus application did increase plant height over the controls by 8.4, 9.3, and 12.9 (%), respectively. In contrast, at Wa, the effects of inoculum or phosphorus significantly increased plant height flowering time over the controls by 3.9 and 12.3 (%), respectively.
4.3.3. Yield components
The year effect significantly influenced the number of pods (plant−1) at Nyankpala and Wa (Table 5). At Nyankpala, the pod number (plant−1) increased significantly in 2019 over 2017 and 2018 by 23.4 and 28.4 (%), respectively. At Wa, pod number (plant−1) increased in 2019 relative to 2017 and 2018 by 69.3 and 31.6 (%), respectively.
The effects of inoculum or phosphorus at Manga significantly increased the pod number (plant−1) over the controls by 41.9 or 47.4 (%), respectively. At Nyankpala, pod number (plant−1) increased with inoculum or phosphorus over the controls by 21.0 and 61.4 (%), respectively. In contrast, at Wa, lime, inoculum, or phosphorus significantly increased the pod number (plant−1) over the controls by 10.1, 13.6, and 21.6 (%), respectively.
Except for the year effect at Wa, where the seed number (pod−1) increased significantly by 10 (%) in 2017, similar to 2019 over 2018, the seed number (pod−1) did not differ significantly with year, lime, inoculum, or P application across locations. There was a general increase in seed weight across sites in 2019 over 2017 and 2018. At Manga, the 100 seed weight average increased in 2019 over 2017 and 2018 by 17.0 and 11.7 (%), respectively. At Nyankpala, the 100 seed weight average increased in 2019 over 2017 and 2018 by 14.3 and 17.4 (%), respectively. Similarly, the 100 seed weight average at Wa increased in 2019 over 2017 and 2018 by 18.8 and 26.7 (%), respectively. Phosphorus application significantly increased the 100 seed weight average over no P by 5.3 and 4.4 (%) at Nyankpala and Wa, respectively.
4.3.4. Rainfall use efficiency (kg ha−1 mm−1)
Except for lime application at Manga and Wa, year and input application effects significantly influenced rainfall use efficiency (RUE) across sites (Table 5). At Manga, RUE increased significantly in 2017 over 2018 and 2019 by 84.6 (%). At Nyankpala, RUE increased in 2017 over 2018 and 2019 by 71.4 and 5.9 (%), respectively. However, RUE at Wa increased in 2019 over 2017 and 2018 by 20.8 and 38.1 (%), respectively. Inoculum or P applications significantly increased RUE over the controls by 20 and 35.7 (%), respectively, at Manga. At Nyankpala, lime, inoculum, or phosphorus applications significantly increased RUE over the controls by 17.9, 17.9, and 40.0 (%), respectively, and by similar trend at Wa by 13.0, 4.0, and 33.3 (%), respectively.
4.3.5. Grain yield (Mg ha−1), stover yield (Mg ha−1), and harvest index (ratio)
The effects of year, lime, inoculum, or phosphorus significantly influenced grain yield, stover yield, and harvest index (Table 5). Grain yield at Manga increased significantly in 2017 over 2018 and 2019 by 60.0 and 50.5 (%), respectively. At the Nyankpala location, grain yield increased significantly in 2019 over 2017 and 2018 by 5.9 and 22.9 (%), respectively, and a similar trend at Wa in 2019 over 2017 and 2018 by 123.6 and 34.4 (%), respectively.
At Manga, the P application did increase grain yield over the control by 34.3 (%). At Nyankpala, input applications of lime, inoculum, or phosphorus significantly increased grain yield over the controls by 20, 18.2, and 40.0 (%), respectively, and at Wa by 15.6, 16.2, and 32.9 (%), respectively.
Stover yield, defined as the aboveground dry biomass weight, was significantly influenced by year across sites. At Manga, stover yield increased significantly in 2017 over 2018 and 2019 by 43.1 and 56.6 (%), respectively. Stover yield at Nyankpala increased significantly in 2018 over 2017 and 2019 by 17.7 and 15.0 (%), respectively. Similarly, at Wa, the stover yield increased in 2018 over 2017 and 2019 by 51.5 and 9.9 (%), respectively. The effects of inoculum or phosphorus significantly increased stover yield over the controls by 11.9 and 21.9 (%), respectively, at Manga. However, the effects of lime, inoculum, or phosphorus significantly increased stover yield over the controls by 11.5, 12.7, and 24.4 (%), respectively, at Nyankpala.
The year effect significantly influenced the harvest index at the Nyankpala and Wa locations (Table 5). At Nyankpala, the harvest index increased significantly in 2019 over 2017 and 2018 by 5.4, and 30 (%), respectively, and a similar trend at Wa in 2019 over 2017 and 2018 by 37.9, and 8.1 (%), respectively. At Nyankpala, the effect of lime or phosphorus significantly increased the harvest index over the controls by 12.1 and 8.8 (%), respectively. In contrast, at Wa, inoculum or phosphorus applications significantly increased the harvest index over control by 8.8 and 21.9 (%), respectively.
4.4. The two-way interactive effects of the years on nutrient inputs applied
The interactive effect of the year on nutrient application probably needed to be clarified (confounded) with the impact of the seasonal weather variability. Therefore, the data was not discussed but presented as an attachment in the Supplementary material for reference (Supplementary Tables S4, S5).
4.5. The three-way interactive effects of input application
4.5.1. Manga location
The interactive effect of lime × inoculum × phosphorus application for all the parameters measured was not significant at the Manga location (Supplementary Table S2) and was excluded from Table 6 for further discussion.
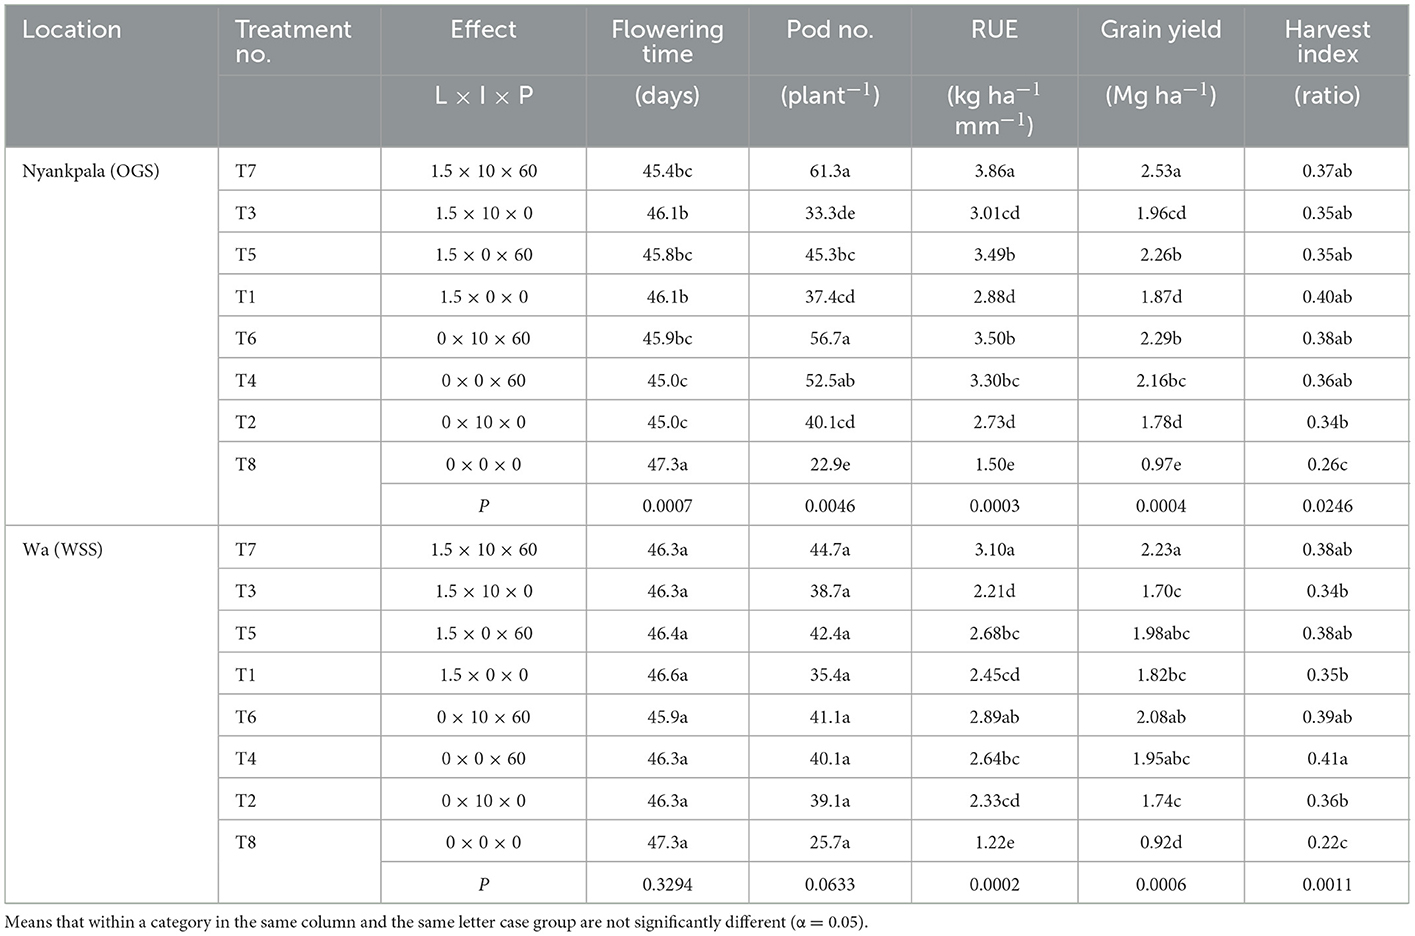
Table 6. Interactive effects of lime (L) × inoculum (I) × phosphorus (P) on yield components, rainfall use efficiency, yield, and harvest index at Nyankpala, and Wa locations in the northern savannas of Ghana.
4.5.2. Nyankpala location
The interactive effect of lime × inoculum × phosphorus was significant for 50 (%) of flowering time, pod number (plant−1), RUE, grain yield, and harvest index (Table 6). The flowering time was delayed in treatment T8 (control) by ~2 (days) compared to T2 (inoculum alone), T4 (P alone), T6 (I × P synergy), T5 (L × P synergy), and T7 (L × I × P synergy). The pod number (plant−1) was highest in treatment T7, similar to treatments T6 and T4, and differed significantly from treatments T3, T5, T1, T2, and T8 by a percentage increase between 35.3 and 167 (%). The RUE was highest in treatment T7 and differed significantly from treatments T3, T5, T1, T6, T4, T2, and T8 by an increase between 10.3 and 157.3 (%). Similarly, grain yield was highest with treatment T7 and differed significantly from treatments T3, T5, T1, T6, T4, T2, and T8 by a percentage increase between 10 and 160 (%). The harvest index was highest in treatment T1, similar to treatments T4, T3, T5, T7, and T6 but differed significantly from treatments T2 and T8 by 17.6 and 53.3 (%), respectively.
4.5.3. Wa location
At Wa, the lime × inoculum × phosphorus interaction significantly influenced RUE, grain yield, and harvest index (Table 6). The RUE was highest in treatment T7, similar to treatment T6 but differed significantly from treatments T3, T5, T1, T4, T2, and T8 by a percentage increase between 154.1 and 15.7 (%). Similarly, the grain yield was similar for treatments T7, T5, T6 and T4 but differed significantly from treatments T3, T1, T2, and T8 by a percentage increase between 22.5 and 142.4 (%). The harvest index was highest with treatment T4, similar to treatments T7, T5, and T6 but differed significantly from treatments T3, T1, T2, and T8 by a percentage increase between 13.9 and 86.4 (%).
4.6. Partial budget analysis
The partial budget analysis indicated a positive total net benefit in soybean production across the study sites, including the control treatment (Table 7). The marginal net benefits were generally lower with treatments T1, T3, and T5 than with the control treatment in all three locations. However, the marginal net benefit (MNB) and the marginal rate of returns (MRR) were highest with treatment T2 in all locations. At Manga, the MNBs for treatments T2, T4, T6, T5, and T7 varied between 13.24 and 106.90 (US$ ha−1), and at Nyankpala between 19.14 and 325.58 (US$ ha−1) with treatment (T3 included), and between 35.66 and 330.27 (US$ ha−1) at Wa. The MRRs for treatments T2, T4, T6, T5, and T7 varied between 27.1 and 520.5 (%) at Manga; and between 93.2 and 1585.1 (%), including treatment (T3) at Nyankpala, and at Wa between 78.5 and 1607.9 (%).
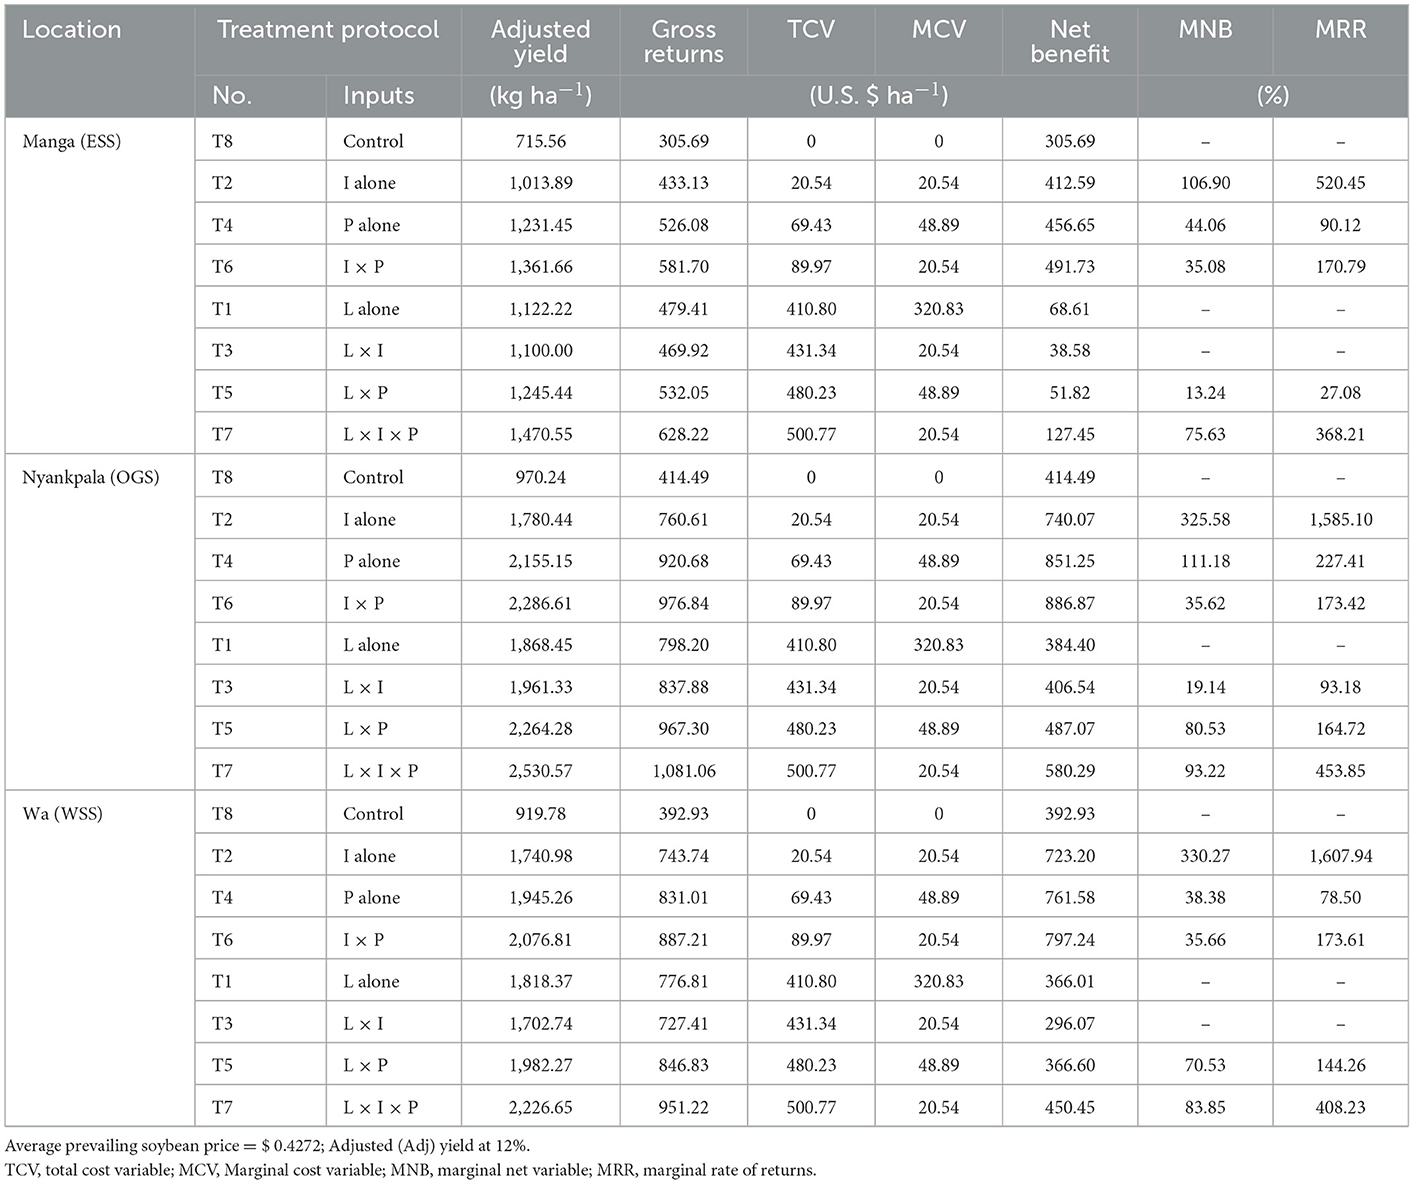
Table 7. A 3-yr (2017 to 2019) partial budget analysis of lime, Bradyrhizobium inoculum, and phosphorus effects on soybean at Manga, Nyankpala, and Wa locations.
5. Discussion
5.1. Weather and soil fertility
Soybean is perhaps the fastest-growing cash crop amongst smallholder farmers across Ghana's northern savannas. This is attested by a decade increase of more than double in production from 2008 to 2018, as reported by MoFA-SRID (2018) and Ritchie et al. (2022). The demand for soybeans continues to soar in response to population increase as diets shift toward less resource-intensive protein foods for humans and livestock and soil fertility amendments in smallholder farming systems (Tilman et al., 2011; Islam et al., 2022). However, low soil fertility and erratic rainfall are significant limiting factors to soybean yield improvement in some parts of the savanna (Bebeley et al., 2022). In Ghana, the amount and duration of rainfall decrease from the south toward Ghana's northern savanna (MoFA-SRID, 2018). Hence, farm yields in this climatic region experience seasonal weather variability and associated problems that impede crop growth. Although soybean is a drought-tolerant crop, its sensitivity to stress varies across growth stages with several factors, some of which can be mitigated through management. The major abiotic factors identified in this study were weather, mainly rainfall and temperature, low soil fertility, and nutrient management.
In this study, moisture stress and high temperatures were the most limiting factors to soybean production in all three locations. Most farmers across Ghana's northern savanna rely exclusively on rainfed agriculture, depending on seasonal rainfall for moisture to meet crop demands (Radeny et al., 2019). The amount of rain received varied widely across years and seasons, with some seasonal dry spells in 2017 and 2018 in all three study locations. The rainfall and temperature analysis indicated periods of rainfall deficits and increasing temperatures above the 30-year average, suggesting a warming climate. As a result, fluctuations and uncertainty in planting dates shifted from June to July in all these locations. The dry spells occurred erratically from planting through flowering (August) to pod filling (September) and maturity (Oct.) stages. The annual increase in seasonal temperature above the 30-year average varied from 0.2 to 1.2 (°C) for Manga, 1.1 to 1.5 (°C) for Nyankpala, and 0.3 to 1.1 (°C) for the Wa location. Consistent with the World Bank Group (2010), projected 2.1 to 2.4 (°C) rise in temperature across the northern savannas of Ghana by 2050. Although soybean can be resilient during the vegetative stage, yield penalty can be high under moisture stress and high temperatures at reproductive stages, as observed at Wa in 2017, where the total seasonal rainfall was <500 (mm). Flower abortion, pod drying, and seed weight loss can be affected under these stressful conditions. Meckel et al. (1984) observed that yield reduction in soybean could occur during flowering (R1) and seed fill period (R5–R7) due to moisture stress, the stages most sensitive to moisture stress. The combined effects of moisture stress and high temperatures on soybean production are biological and economical (Thorp, 2019); hence are significant sources of yield gap (Zipper et al., 2016; Battisti and Sentelhas, 2017; Leng and Hall, 2019; Wijewardana et al., 2019). Depending on the climate change scenario (Yu et al., 2021) predicted a yield reduction in soybean by 86–92 (%) relative to current yields by 2050. Hence, accurately determining when to plant soybean to avoid early or late-season dry spells is the first step to maximizing yield (Bebeley et al., 2022). In Ghana's northern savannas, most farmers plant soybean within a narrow window from mid-June to the first week of July based on resource availability. Soybean producers in the region need to understand the extent to which planting time could be delayed and the yield penalty expected due to late planting.
The major challenges identified through the soil analysis were inherent low soil fertility, low C.E.C., low organic matter, low soil pH, and the sandy nature of the soils. Soil acidity was a significant concern considering the strong to moderately acidic soil that varied between 5.2 and 6.0 (pH) in the study locations, as Tetteh et al. (2016) reported earlier. Soil pH considerably impacts soil physical, chemical, and biological processes, and crop productivity (Ketterings et al., 2005; Farida and Fariya, 2015; Keino et al., 2015). Soil productivity involves nutrient availability (Ketterings et al., 2005; Farida and Fariya, 2015), soil microbial activity (Keino et al., 2015; Abera and Abebe, 2018), and reduced solubility of toxic elements (Farida and Fariya, 2015; Keino et al., 2015). Keino et al. (2015) noted that acidic soil could limit phosphorus availability, exchangeable cations (Mg, Ca, and K), and molybdenum, while increasing the solubility of noxious substances (Fe, Al, H, Cu, and Mn) that adversely affect crop yield. The C.E.C. recorded in this study varied from very low to low, including very low organic matter in all three locations. Pagani and Mallarino (2012) reported that soils with low C.E.C. and organic matter could have low water retention and experience nutrient deficiency through leaching. Soils of this nature may require better nutrient and soil management practices to improve fertility to optimize crop yield (Hodges, 2010). The nutrient management options proposed include the addition of organic matter, inorganic fertilizers, or lime to ameliorate the effects of soil acidity (Farida and Fariya, 2015). The soil fertility analysis indicated a wide range of nutrient deficiencies across study locations, suggesting the need for site-specific fertility recommendations.
5.2. Input use and yield optimization
Feeding the ever-increasing global population sustainably requires alternative means to improve crop yields on existing crop farms to close the “yield gap” between current and potential yields. However, agronomic practices in smallholder farming systems in Ghana's northern savannas have yet to increase grain production with input integration, especially in soybean. This study aimed to enhance soybean yield using two mineral inputs of lime and P while reducing N fertilizer use by applying a biofertilizer input (inoculant). The hypothesis was that managing these inputs would optimize soybean productivity across Ghana's northern savannas. The low crop productivity in Ghana's northern savannas and across sub-Saharan Africa is associated with poor soils (CIMMYT, 2015) and the inefficient use of the primary inputs required to sustain crop productivity. Efficient use of fertilizer, improved seeds and pesticides, and protection against soil erosion enhance crop yields (Thomas, 2020).
Soybean production is one of the most complex cropping systems, requiring knowledge of multiple mitigating factors to optimize yields and profitability while being conscious of environmental safety. The current input assessment study of lime, inoculum, and phosphorus reduced flowering time and improved plant height, pod number, seed weight, RUE, grain and stover yields, and harvest index over the controls. The flowering time differed significantly among years, a reflection of differences in seasonal variability. This implies that applying inputs helped mitigate environmental stress for yield optimization. The interaction of soybean genetic potential, environment and farming practices improves soybean growth, development, and yield. Therefore, with input integration and proper agronomic practices, farmers could maximize the yield potential of their choice of soybean cultivar.
Temperature and photoperiod have long been known to influence the flowering time of soybean. The input application of phosphorus (T4) or in combination with lime (T5) or inoculum (T6) reduced the flowering time by ~2 (days) in all three study locations. Plant circadian timing (24-h cycle), which involves endogenous plant activities, influences the flowering time (Schaffer et al., 1998; Venkat and Muneer, 2022). The input pathway is one of the components that make up the endogenous timing of plants (Venkat and Muneer, 2022) and may have interrupted the expected circadian timing to cause reduced flowering time. The average seed number (pod−1) was unaffected, with ~2 seeds (pod−1) in all three study locations. The seed number (pod−1) is probably one of the tremendous agronomic traits with the potential to improve soybean yield, but genes and the environment regulate it. The significant yield increase across sites in 2017 over 2018 and 2019 reflects the considerable contribution of seed weight to yield since seed weight was highest in 2017. The role of P may have been a “catalyst,” to enhance the biological and physical soil activity to improve soil fertility, crop development, and yield. Khanam et al. (2016) noted that phosphorus was the most critical nutrient for soybean growth and development, with demand exceeding 60 (%) for pod and seed development during the reproductive stages. Consistent with Khanam et al. (2016), higher yields and RUE were observed in treatments with phosphorus applied alone or synergic with lime, inoculum, or both.
5.3. Economic viability of soybean in northern Ghana
CIMMYT (1988) noted that the minimum acceptable rate of returns for farmer adoption ranges between 50 and 100 (%). This study implies that farmers will be more willing to adopt treatment T2 (inoculum alone), which has the least cost of production and the highest MNB and MRR in all three study locations. Ragsdale et al. (2022) reported that smallholder farmers, particularly women that dominate Ghana's agriculture, will readily accept a low-cost soybean input bundle to maximize production cost. Additionally, the resource base of smallholder farmers is limited and given the assurance of higher financial returns on investment, would accept the lowest cost of production. However, the synergistic effect of phosphorus on lime (T5) or inoculum and phosphorus on lime (T7) increased the MNB and MRR considerably. Applied phosphorus has been reported to improve N fixation and may have influenced the increase in MNB and MRR in those treatments. Hence, in a high-input soybean system, well-resourced farmers could be motivated to adopt treatment T7. Lime applied alone (T1) or synergy with inoculum (T3) was a disincentive to farmer adoption as the MNB and MRR were dominant, probably due to the high cost associated with the lime product. However, the benefits of lime are not limited to economic gains only but residual and non-economic benefits that sustain farmers (Asodina et al., 2020). The long-term benefits of lime include the residual benefits of enhancing seedling development, nutrient availability, and improving soil pH for the sustenance of smallholder agriculture (Acevedo-Siaca and Goldsmith, 2020; Dabesa and Tana, 2021). Lime is known to have a long-term benefit; hence the yearly evaluation may not reflect the profitability and economic benefits desired associated with the cost of the lime product. Therefore, long-term residual benefits require investigation in soybean production across the northern savannas of Ghana.
6. Conclusion and implication
Erratic rainfall, higher temperatures, and low soil fertility were identified as potential yield-limiting factors in soybean production in the study. However, soybean yield could be improved with proper agronomic practices and input integration. Farmers would opt for a low input system that lowest the cost of production and maximizes benefits. The low input treatment T1 (lime alone) and medium input treatment T3 (lime × inoculum) were economically disincentives for farmer adoption due to the high cost of lime, but in synergy with phosphorus (T5) or with inoculum and phosphorus (T7) provided acceptable marginal returns. Therefore, the study brings the resource base of soybean producers into the best decision-making process for sustainability in soybean production. Soybean producers with a high source base could adopt the high-input system T7, with the most increased total cost but acceptable marginal benefits, which could be an alternative input production system for medium to large-scale soybean production. Therefore, the study recommends further investigation into the short- to long-term (residual) benefits of lime to understand the dynamics of lime in soybean production in the northern savannas of Ghana.
Data availability statement
The original contributions presented in the study are included in the article/Supplementary material; further inquiries can be directed to the corresponding author.
Author contributions
GA, AA, and PA conducted the field research. DR, DD, and PG provided funding logistics. GA, DR, and DD designed experiments. ND and IY facilitated research and performed economic analysis, respectively. All authors contributed to the article and approved the submitted version.
Funding
The USAID Feed the Future Innovation Lab for Soybean Value Chain Research (Cooperative Agreement no. AID OAA-L-14-00001), USDA National Institute of Food and Agriculture (USDA-NIFA), and Mississippi Agricultural and Forestry Experimental Station (MAFES) supported this research.
Acknowledgments
The authors gratefully acknowledge the collaborative research support from the CSIR-Savanna Agricultural Research Institute, Mississippi State University, and Waypoint Analytical Inc., Memphis, TN (U.S.) for the soil analysis.
Conflict of interest
The authors declare that the research was conducted in the absence of any commercial or financial relationships that could be construed as a potential conflict of interest.
Publisher's note
All claims expressed in this article are solely those of the authors and do not necessarily represent those of their affiliated organizations, or those of the publisher, the editors and the reviewers. Any product that may be evaluated in this article, or claim that may be made by its manufacturer, is not guaranteed or endorsed by the publisher.
Supplementary material
The Supplementary Material for this article can be found online at: https://www.frontiersin.org/articles/10.3389/fsufs.2023.992644/full#supplementary-material
Supplementary Figure S1. Map indication of study sites in Guinea and Sudan Savannas: Manga (Eastern Sudan Savanna, ESS); Nyankpala (Opened Guinea Savanna, OGS); Wa (Western Sudan Savanna, WSS).
Supplementary Table S1. Soil properties (0- to 15-cm depth) at Manga, Nyankpala, and Wa in the savannas of northern Ghana (2017–2019).
Supplementary Table S2. Probability (F-values) of year, lime, inoculum, and phosphorus on yield, yield components, and rainfall use efficiency at Manga, Nyankpala, and Wa locations in the northern Savannas of Ghana.
Supplementary Table S3. Input costs that vary, field price of soybean, and mean exchange rates averaged across three years (2017–2019) for Manga, Nyankpala, and Wa locations.
Supplementary Table S4. Interactive effects of input application across years on yield and yield components at Manga, Nyankpala, and Wa in the northern Savannas of Ghana.
Supplementary Table S5. Interactive effects of the year (Y) × inoculum (I) × phosphorus (P) on flowering time, rainfall use efficiency (RUE), stover yield, and harvest index at Wa location in the northern savannas of Ghana.
Abbreviations
MCSR, monthly crop seasonal rainfall; CGP, crop growth period; OM, organic matter; CEC, cation exchange capacity.
References
Abera, T., and Abebe, Z. (2018). Effects of fertilizer, Rhizobium inoculation, and lime rates on growth and yields of field pea in Horror and Gedo Highlands. Adv. Crop. Sci. Tech. 6, 397. doi: 10.4172/2329-8863.1000397
Acevedo-Siaca, L., and Goldsmith, P. D. (2020). Soy-maize crop rotations in Sub-Saharan Africa: a literature review. Inter J. Agron. 1, 1–14. doi: 10.1155/2020/8833872
Adjei-Gyapong, T., and Asiamah, R. D. (2002). The Interim Ghana Soil Classification System and Its Relation With the World Reference Base for Soil Resources. FAO, Quatorzième réunion Du Sous-Comité Ouest Et Centre Africain De Corrélation Des Sols, Abomey, Benin, 9–13 Oct 2000. World Soil Resources Report No. 98, 51–76. FAO, Rome
Asodina, F. A., Adams, F., Nimoh, F., Weyori, E. A., Wongnaa, C. A., and Bakang, J. E. (2020). Are non-market benefits of soybean production significant? An extended economic analysis of smallholder soybean farming in Upper West region of northern Ghana. Agric. Food Secur. 9, 13. doi: 10.1186/s40066-020-00265-7
Awuni, G. A., Reynolds, D. B., Goldsmith, P. D., Tamimie, C. A., and Denwar, N. N. (2020). Agronomic and economic assessment of input bundle of soybean in moderately acidic Savanna soils of Ghana. Agrosyst Geosci Environ. 3, e20085. doi: 10.1002/agg2.20085
Battisti, R., and Sentelhas, P. C. (2017). Improvement of soybean resilience to drought through deep root system in Brazil. Agron. J. 109, 1612–1622. doi: 10.2134/agronj2017.01.0023
Bebeley, J. F., Kamara, A. Y., Jibrin, J., Akinseye, F. M., Tofa, A. I., Adam, A. M., et al. (2022). Evaluation and application of the CROPGRO soybean model for determining optimum sowing windows of soybean in the Nigeria savannas. Sci. Rep. 12, 6747. doi: 10.1038/s41598-022-10505-4
Buri, M. M., Issaka, R. N., and Wakatsuki, T. (2005). Extent and management of low pH soils in Ghana. Soil Sci. Plant Nutri. 5, 755–759. doi: 10.1111/j.1747-0765.2005.tb00107.x
CILSS (2016). Ecoregions and Topography of Ghana. West Africa—Land Use and Land Cover Dynamics. Available online at: https://eros.usgs.gov/westafrica/ecoregions-and-topography/ecoregions-and-topography-ghana (accessed June 26, 2022).
CIMMYT (1988). From Agronomic Data to Farmer Recommendations: An Economics Training Manual. Completely revised edition. Mexico, DF: CIMMYT.
CIMMYT (2015). Poor Soils a Huge Limitation for Africa's Food Security. International Maize and Wheat Improvement Center. Available online at: https://www.cimmyt.org/news/poor-soils-a-huge-limitation-for-africas-food-security/ (accessed January 23, 2023).
Dabesa, A., and Tana, T. (2021). Response of Soybean (Glycine max L. (Merrill)) to Bradyrhizobium inoculation, lime, and phosphorus applications at Bako, Western Ethiopia. Inter. J. Agron. 2021, 6686957. doi: 10.1155/2021/6686957
Denwar, N. N., and Wohor, Z. (2012). “Development of improved soybean varieties adapted to the agroecologies and farming systems of the savanna zones of northern Ghana,” in CSIR-Savannah Agricultural Research Institute Annual Report 2012, eds. S. S. Buah, I. D. K. Atokple, J. M. Kombiok, M. Abdulai, M. Fosu, and R. K. Owusu (Accra: CSIR-INSTI), pp. 27–31
Etesami, H., Jeong, B. R., and Glick, B. R. (2021). Contribution of arbuscular mycorrhizal fungi, phosphate -solubilizing bacteria, and silicon to P uptake by plant. Front. Plant Sci. 12, 699618. doi: 10.3389/fpls.2021.699618
Farida, A., and Fariya, A. (2015). Soil acidity amendment technologies and their limitations in sub-Saharan African soil. Int. J. Ext. Res. 5, 19–21. Available online at: https://www.journalijer.com
Hodges, S. C. (2010). Soil Fertility Basics. Raleigh, NC: Soil Science Extension, North Carolina State University. Available online at: https://scholar.google.com/scholar_lookup?hl=en&publication_year=2010&author=S.+C.+Hodges&title = +Soil+Fertility+Basics (accessed March 10, 2022).
Islam, M. S., Muhyidiyn, I., Md. Islam, R., Md. Hasan, K., Hafaez, A. M. S. G., et al. (2022). “Soybean and sustainable agriculture for food security,” in Soybean—Recent Advances in Research and Application, eds. T. Ohyama, Y. Takahashi, N. Ohtake, T. Sato, and S. Tanabatabook (London: InTech).
IUSS Working Group WRB (2015). World Reference Base for Soil Resources 2014, Update 2015. International Soil Classification System for Naming Soils and Creating Legends for Soil Maps. World Soil Resources Reports No. 106. FAO, Rome.
Jaiswal, S. K., and Dakora, F. D. (2019). Widespread distribution of highly adapted Bradyrhizobium species nodulating diverse legumes in Africa. Front. Microbiol. 10, 310. doi: 10.3389/fmicb.2019.00310
Keino, L., Baijukya, F., Ng'etich, W., Otinga, A. N., Okalebo, J. R., Njoroge, R., et al. (2015). Nutrients limiting soybean (Glycine max L.) growth in acrisols and ferralsols of Western Kenya. PLoS ONE 10, e0145202. doi: 10.1371/journal.pone.0145202
Ketterings, Q. M., Albrecht, G., and Beckman, J. (2005). Soil pH for Field Crops. Agronomy Fact Sheet Series, Fact Sheet 5, Nutrient Management Spear Program. Cornell University. Available online at: http://cceonondaga.org/resources/soil-ph-for-field-crops (accessed March 22, 2022).
Khanam, M., Islam, M., Ali, M. H., Chowdhury, I. F., and Masum, S. M. (2016). Performance of soybean under different levels of phosphorus and potassium. Bangl. Agron. J. 19, 99–108. doi: 10.3329/baj.v19i1.29876
Klogo, P. Y., Avumegah, P. K., Danso, S. K. A., Glover, M., and Owusu-Gyimah, V. (2016). Genetic variability among soybean [Glycine max (Merrill)] varieties in nitrogen fixation in five Ghanaian soils. Agric. Biol. Sci. J. 2, 15–21. Available online at: http://www.aiscience.org/journal/absj
Lal, R., and Stewart, B. A. (2010). “Introduction: Food security and soil quality,” in Advances in Soil Science—Food Security and Soil Quality, eds. R. Lal, and B. A. Stewart (CRC Press: Boca Raton, FL). doi: 10.1201/EBK1439800577
Leng, G., and Hall, J. (2019). Crop yield sensitivity of global major agricultural countries to droughts and the projected changes in the future. Sci. Total Environ. 654, 811–821. doi: 10.1016/j.scitotenv.2018.10.434
Meckel, L., Egli, D. B., Phillips, R. E., Radcliffe, D., and Leggett, J. E. (1984). Effect of moisture stress on seed growth in soybeans. Agron. J. 76, 647–650. doi: 10.2134/agronj1984.00021962007600040033x
Mercer-Quarshie, H., and Nsowah, G. F. (1974). “Soybean in Ghana,” in Soybean Production, Protection, and Utilization, ed. D. K. Whigham. INTSOY Series No. 6. (Urbana-Champaign: The University of Illinois), 200–208.
MoFA-SRID (2018). Agriculture in Ghana: Facts and Figures. Accra: Ministry of Food and Agriculture, Statistics, Research, and Information Directorate (SRID).
NVRRC (2019). Catalogue of Crop Varieties Released and Registered in Ghana. Directorate of Crop Research Services, Ministry of Food and Agriculture, Accra. Available online at: https://nastag.org/docx/resources/2019%20NATIONAL%20CROP%20VARIETY%20CATALOGUE.pdf (accessed January 1, 2023).
Ocran, V. K., Delimini, L. L., Asuboah, R. A., and Asiedu, E. A. (1998). Seed Management Manual for Ghana. Accra: Ministry of Food and Agriculture, Buck Press Ltd, 39–60.
Pagani, A., and Mallarino, A. P. (2012). Soil pH and crop grain yield as affected by the source and rate of lime. Nutr. Manage. Soil Plant Anal. Soil Sci Soc Am J. 76, 1877–1886. doi: 10.2136/sssaj2012.0119
Petersen, P. (2009). Soybean Growth and Development. Ames: Iowa State University Extension. Available online at: https://crops.extension.iastate.edu/files/article/SoybeanGrowthandDevelopment_0.pdf (accessed March 21, 2022).
Radeny, M., Desalegn, A., Mubiru, D., Kyazze, F., Mahoo, H., Recha, J., et al. (2019). Indigenous knowledge for seasonal weather and climate forecasting across East Africa. Clim Change 156, 509–526. doi: 10.1007/s10584-019-02476-9
Ragsdale, K., Read-Wahidi, M. R., Zhou, Q. M., Clark, K., Asigbee, M. A. K., Tamimie, C., et al. (2022). Low-cost soybean input bundles impact women farmers' subsistence livelihood traps: evidence from Ghana. Food Sec. 14, 1045–1062. doi: 10.1007/s12571-022-01263-2
Ritchie, H., Roser, M., and Rosado, P. (2022). Crop yields. OurWorldInData.org. Available online at: https://ourworldindata.org/crop-yields (accessed March 1, 2022).
SAS Institute (2016). SAS Software, version 9.4: Statistics. Cary, NC: SAS Institute. Available online at: https://sas.com/en_my/software/sas9 (accessed September 2, 2022).
Saxton, A. M. (1998). “A macro for converting mean separation output to letter groupings in PROC-mixed,” in Proc. 23rd S.A.S. Users Group International. Cary, NC: S.A.S. Institute, 1243–1246
Schachtman, D. P., Reid, R. J., and Ayling, S. M. (1998). Phosphorus uptake by plants: from soil to cell. Plant Physiol. 116, 447–453. doi: 10.1104/pp.116.2.447
Schaffer, R., Ramsay, N., Samach, A., Corden, S., Putterill, J., Carré, I. A., et al. (1998). The late elongated hypocotyl mutation of Arabidopsis disrupts circadian rhythms and the photoperiodic control of flowering. Cell 93, 1219–1229. doi: 10.1016/S0092-8674(00)81465-8
Sharma, A., Sankar, G. R. M., Arorac, S., Gupta, V., Singha, B., Kumar, J., et al. (2013). Analyzing rainfall effects for sustainable rainfed maize productivity in foothills of Northwest Himalayas. Field Crops Res. 145, 96–105. doi: 10.1016/j.fcr.2013.02.013
Shenoy, V. V., and Kalagudi, G. M. (2005). Enhancing plant phosphorus use efficiency for sustainable cropping. Biotechnol. Adv. 23, 501–513. doi: 10.1016/j.biotechadv.2005.01.004
Singh, B., and Ryan, J. (2015). Managing Fertilizers to Enhance Soil Health. Paris: International Fertilizer Industry Association (IFA). Available online at: https://www.fertilizer.org/images/Library_Downloads/2015_ifa_singh_ryan_soils.pdf (accessed March 25, 2022).
Tetteh, F., Larbi, A., Nketia, K. A., Senayah, J. K., Hoeschle-Zeledon, I., and Abdulrahman, N. (2016). Suitability of Soils for Cereal Cropping in Northern Ghana. Ibadan, Nigeria: IITA.
Thomas, H. A. (2020). Improving crop yields in sub-Saharan Africa: what does the East African Data Say? IMF Work. Pap. 2020, 95. doi: 10.5089/9781513546223.001
Thorp, E. E. (2019). Drought Tolerance in Soybean: Methods for Improvement, Creative Components, Vol 434. Available online at: https://lib.dr.iastate.edu/creativecomponents/434 (accessed March 16, 2022).
Tilman, D., Balze, C., Hill, J., and Befort, B. L. (2011). Global food security demand and the sustainable intensification of agriculture. PNAS 108, 20260–20264. doi: 10.1073/pnas.1116437108
Venkat, A., and Muneer, S. (2022). Role of circadian rhythms in major plant metabolic and signaling pathways. Front. Plant Sci. Sec. Plant Physiol. doi: 10.3389/fpls.2022.836244
Von Uexküll, H. R., and Mutert, E. (1995). Global extent, development, and economic impact of acid soils. Plant Soil 171, 1–15. doi: 10.1007/BF00009558
Wijewardana, C., Reddy, K. R., Krutz, L. J., Gao, W., and Bellaloui, N. (2019). Drought stress has transgenerational effects on soybean seed germination and seedling vigor. PLoS ONE 14, e0214977. doi: 10.1371/journal.pone.0214977
World Bank (2017). Ghana Agriculture Sector Policy Note: Transforming Agriculture for Economic Growth, Job Creation, and Food Security. Available online at: https://openknowledge.worldbank.org/handle/10986/28394 (accessed February 21, 2022).
World Bank Group (2010). Ghana—Economics of Adaptation to Climate Change (EACC): Main Report (English). Washington, DC: The World Bank Group. Available online at: http://documents.worldbank.org/curated/en/278431468337213682/Main-report (accessed April 1, 2022).
Yu, C., Miao, R., and Khanna, M. (2021). Maladaptation of U.S. corn and soybeans to a changing climate. Sci. Rep. 11, 12351. doi: 10.1038/s41598-021-91192-5
Zhang, Y., He, X., Liang, H., Zhao, J., Zhang, Y., Xu, C., et al. (2016). Long-term tobacco plantation induces soil acidification and soil base cation loss. Environ. Sci. Pollut. Res. Int. 23, 5442–5450. doi: 10.1007/s11356-015-5673-2
Keywords: lime, inoculum, phosphorus, rain use efficiency, soil fertility, partial budget, soybean
Citation: Awuni GA, Reynolds DB, Dodds D, Denwar NN, Abdulai AL, Asungre PA, Yahaya I and Goldsmith PD (2023) Lime, inoculum, and phosphorous input supplementation under rain-fed soybean in Ghana's northern savannas. Front. Sustain. Food Syst. 7:992644. doi: 10.3389/fsufs.2023.992644
Received: 12 July 2022; Accepted: 30 January 2023;
Published: 16 February 2023.
Edited by:
Sanjay Kumar Jaiswal, Tshwane University of Technology, South AfricaReviewed by:
Jacob Ulzen, University of Ghana, GhanaStephen Boahen, International Institute of Tropical Agriculture (IITA), Nigeria
Copyright © 2023 Awuni, Reynolds, Dodds, Denwar, Abdulai, Asungre, Yahaya and Goldsmith. This is an open-access article distributed under the terms of the Creative Commons Attribution License (CC BY). The use, distribution or reproduction in other forums is permitted, provided the original author(s) and the copyright owner(s) are credited and that the original publication in this journal is cited, in accordance with accepted academic practice. No use, distribution or reproduction is permitted which does not comply with these terms.
*Correspondence: George A. Awuni,  Z2F3dW5pQHBzcy5tc3N0YXRlLmVkdQ==