 Pradyot Ranjan Jena
 Purna C. Tanti
94% of researchers rate our articles as excellent or good
Learn more about the work of our research integrity team to safeguard the quality of each article we publish.
Find out more
ORIGINAL RESEARCH article
Front. Sustain. Food Syst. , 12 May 2023
Sec. Crop Biology and Sustainability
Volume 7 - 2023 | https://doi.org/10.3389/fsufs.2023.922038
An increase in farm productivity and income is crucially linked to farm mechanization. Labour shortage in rural areas and frequent extreme weather events have made a resounding pitch for the deepening of farm mechanization in India. Our study examines the effect of agricultural machinery adoption on net agricultural income, household income, and household consumption in India; the latter is considered as an indicator of food security. A nationwide household survey of 10253 households drawn from the majority of states of India has been used. To assess the impact of machinery adoption on the outcome variables, the endogenous switching regression (ESR) model is used. Of the three types of machineries investigated, such as tractors, electric pumps, and diesel pumps, the average adoption rates are found to be low in the country, i.e., 8% for tractors, 24% for electric pumps, and 14% for diesel pumps. The wide heterogeneity in terms of adoption is mostly rooted in the large geographical differences among the states of India, as machinery adoption is concentrated in the north and north-central plains of the country. The first stage of ESR, which is a probit model, reveals the determinants of mechanization as access to credit, climatic shocks, access to irrigation, and farmer cooperative membership. The average treatment effect estimates from the second stage outcome regression reveal that the adoption of machineries has increased net agricultural income by 31%, household income by 19%, and food consumption by 5%. Given these demonstrable positive effects of mechanization in agriculture, there is a need for deepening of low-cost scale appropriate farm machines suitable for small holders. Government support would play a pivotal role in this direction by making farm credits accessible to smallholders, providing timely subsidies on machinery purchase, and providing required extension services.
The sustainable development goals (SDGs) 1 and 2 of the United Nations have targeted the complete eradication of poverty and hunger by 2030. Achieving these targets requires a higher than the business-as-usual level of growth in farm production (Ruttan, 2002; Tilman et al., 2002; Godfray et al., 2010; Gregory and George, 2011). Godfray et al. (2010) estimated that farm production needs to be increased by 70–100% to achieve SDGs 1 and 2. Labor shortage has been a key obstacle for the farming communities as more and more younger folks from rural areas migrate for better-earning jobs to cities. This rural exodus has also increased labor costs, putting agricultural mechanization in the spotlight.
Furthermore, climate change’s current challenges, which led to erratic rainfall and a steady temperature rise, have negatively affected farm production by creating widely uncertain outcomes for farming communities. Farm machinery plays a big part in climate change adaptation strategies. Machinery used in farming enables farmers to cultivate multiple crops in multiple seasons in a year, saves labor time, reduces production cost through precise and timely use of inputs, and so forth, which enhances farm productivity (Sims and Kenzle, 2006; Pingali, 2007; Hatibu, 2013; Benin, 2015). As Biggs and Justice (2015) observed that the green revolution was not just about high-yielding varieties but also about small machines helping in land preparation, fertilization, and harvesting. Furthermore, certain adaptation practices, such as conservation agriculture, a basket of three specific practices, namely minimum tillage, crop residue retention, and crop rotation, require appropriate machines to implement (Jaleta et al., 2016; Jena, 2019). Especially small machines such as seeders, chisel ploughs, hand-operated weeders, and manual sprayers help adopt some climate adaptation practices. Hence, agricultural machinery adoption is a part of the broader climate adaptation strategy.
The earliest agricultural mechanization theory is well articulated in the works of Hayami and Ruttan (1971, 1985). They theorized that the rapid agricultural development in the United States of America (USA) around 1880 and thereafter was induced by continuous innovation in agricultural machinery, hence, known as induced innovation theory. This induced innovation in mechanization was spurred by a substantial reduction in the price of machinery and the relative price of land with respect to labor in the USA. Hayami and Ruttan found a similar linkage of induced innovation in agriculture to factor price ratios in Japan, Taiwan, Korea, the Philippines, France, Denmark, Germany, and the United Kingdom (UK). Thus, the theory has become the most influential narrative in agricultural development literature. However, later researchers such as Olmstead and Rhode (1993) showed that the induced innovation theory might not be the only explanation for generalizing agricultural development in the USA. According to them, there is widespread regional heterogeneity in the USA. The mechanization-induced rise in the nineteenth-century land/labor ratio applies primarily to the interior, small grain-growing states; vast areas do not conform. Technology adoption in agriculture is slower in South Asia and Sub-Saharan Africa compared to Latin America, East Asia, and the Caribbean (Gollin et al., 2005). Jack (2013) highlighted that the market inefficiencies prevailing in these countries constrain technology adoption. Examples of these market imperfections include “missing markets” for risk, credit, or land (i.e., a lack of formal insurance providers, financial institutions or the ability to buy, sell, own, or reliably hold onto one’s land). De Janvry et al. (2017) explained that the underlying production function in agriculture is only partially understood as many non-observable phenomena cloud it. A high degree of heterogeneity of conditions can yield unexpected outcomes. Furthermore, the production function is subject to random shocks, principally in weather events with incompletely known probability distribution due to limited records or climate change. As a result of this complexity, slow diffusion of technology is expected, and hence, extension services need to find effective ways of accelerating the learning process. Foster and Rosenzweig (2010) advocated the decisions to adopt technology choice, and input allocations are determined by the financial and nonfinancial returns to adoption, self-learning, social learning, technological externalities, schooling, credit constraints, and incomplete insurance.
The benefits of farm mechanization in the agriculture sector have been well articulated in Hatibu (2013) and Pingali (2007). The adoption of mechanical technologies helped enhance agricultural productivity and lowered the unit cost of crop production in Asian countries. Power-intensive mechanization operations have taken place rapidly in countries like India, Bangladesh, Nepal and the Philippines, where high population densities and low wages persist (Pingali, 2007). Several recent studies using household survey data establish that mechanization has helped lowering input costs, increase yield, and save man-days per hectare compared to traditional farms (Cunguara and Darnhofer, 2011; Kassie et al., 2011; Rahman et al., 2011; Abid et al., 2016; Adebayo et al., 2018; Adu-Baffour et al., 2019; Liu et al., 2021; Vortia et al., 2021; Yan et al., 2021). While showing that adoption of mechanization is beneficial for farmers on average, these studies also express concern about large heterogeneity existing among the smallholders that may undermine the magnitude of the impact. Wealthier farmers largely adopt it since investing in capital expenditure is a big decision which needs initial capital. The ability of small and marginal farmers to adopt machinery is constrained by inadequate access to credit facilities. Despite this heterogeneity some studies have shown significant poverty reduction impact of agricultural mechanization (Ali et al., 2016; Paudel et al., 2019a,b). Aryal et al. (2020) have found that the land laser levelling through tractors has a significant positive impact on yields (rice and wheat) and net returns in the rice-wheat production system in Haryana of India. Naresh et al. (2014) estimated that laser land levelling practices could save irrigation water by 21% and energy by 31% and increase the yield by 6.6, 5.4 and 10.9% in rice, wheat and sugarcane production, respectively in Uttar Pradesh of India.
Smallholder farmers have widely adopted farm mechanization services in China by substituting self-owned equipment for labor. Qing et al. (2019) showed that those who owned mechanization services could improve farm productivity and profitability via substituting labor but may not necessarily improve crop yield in China. The growth of the use of larger machinery and reducing the labor intensity of farm production have significantly improved the potential for economies of scale in China (Jetté-Nantel et al., 2020; Zhu et al., 2022). Qiu et al. (2022) show that agricultural mechanization services benefit medium farms more than small and large farms in China. Medium-sized farms are more likely to use agricultural mechanization services, and that adoption increases farm output. Land productivity is also associated with the adoption of the level of mechanization. Semi and Full farm mechanization has a positive impact on productivity. Full farm mechanization has higher productivity than semi-mechanization1 (Zhou and Ma, 2022). Wang et al. (2015) compared the productivity, land size and mechanization between China and India. They found out that the operational land size has a direct and proportional relationship with crop yields in China, while the former has an inverse relationship in India. However, mechanization has a positively significant impact on yield and productivity in both China and India.
Previous studies show that the rate of mechanization has grown by 10% in India between 1960 and 2011 (Tiwari et al., 2019). Over this period, use of animal power source in agriculture has declined gradually from 93% in 1960 to 12% in 2011 and replaced by tractors, power tillers, diesel engines, and electric motors in the country. Hence, there is a need for systematic evaluation of the impact of mechanization on agricultural productivity and farm incomes in India. Most of the existing studies have observed a positive contribution of mechanized farming to farm production and household income. However, there is little evidence of the impact of machinery used in agriculture on household consumption and food security. This is one of the few studies that systematically examines the nationally representative data of India to assess the impact of machinery adoption in agriculture on household income and food security. The 1996 World Food Summit in Rome stated that “food security exists when all people, at all times, have physical and economic access to sufficient, safe and nutritious food to meet their dietary needs and food preferences for an active and healthy life” (Food and Agricultural Organization [FAO], 1996). Hence, there is no single way of measuring food security. Most of the empirical studies on food security, including those by Babatunde et al. (2008), Feleke et al. (2005), Iram and Butt (2004) and Lemba (2009), concentrate on objective food security measures at the household level. These measures look at consumption (converted into calories) or expenditure data. However, we are aware that consumption has a large seasonal volatility and most studies use only a single-round survey that frequently focuses on the last month before the survey was run. Therefore, consumption data may systematically under- or over-report the true food security scenario, depending on the time of year the survey was conducted. Mallick and Rafi (2010) adopted subjective food security measures to overcome this shortcoming of the food consumption method. The IHDS data that we used in this study does not have these subjective measures of food availability and security. It has detailed information on household consumption. Hence, we have used household consumption expenditure as food security variable.
Furthermore, this study uses a dataset that has reached out to most of the states in India and collects very detailed data on net agriculture income, total household income, consumption and several other indicators. Our literature review shows that most studies have smaller sample sizes over a district or micro-region. Our study covers a national picture; moreover, this study’s calculation of net agricultural income is all the costs and revenues during the entire farming seasons of the individual households in each state have been recorded. Similarly, household income and consumption also account for each constituent of these outcome indicators.
The remaining sections of the paper are as follows. The materials and methods used in this study have been elaborated on in section 2. The results and findings are discussed in section 3. Finally, section 4 lays out the overall discussion of the findings and concluding remarks.
This study uses the India Human Development Survey (IHDS II) data conducted in 2011–12 by the National Council of Applied Economic Research, New Delhi, and the University of Maryland. This is a nationally representative dataset consisting of multiple socio-economic indicators. The final sample size for IHDS-II is 42,152 households, of which 27,579 are rural and 14,573 are urban dwellers. These households are spread across 33 states and union territories, 384 districts, 1,420 villages, and 1,042 urban blocks. The stratified sample of towns and villages within states (or groups of states) is selected using probability proportional to population (PPP).
Table 1 shows the distribution of the sample across the country. We have extracted 10,253 households’ data out of 42,152 households based on two criteria. First, 21 states out of the 28 and seven union territories (UTs) are purposefully selected based on the size of the states and the priority of the agriculture sector in the states. Second, we have selected only the rural areas across the country. We filtered out the data and found that Karnataka has the highest (12.25%) number of rural farmers, and Arunachal Pradesh has the lowest (0.45%). Uttar Pradesh, Madhya Pradesh, West Bengal, Gujarat, Odisha, Chhattisgarh, Jharkhand, and Andhra Pradesh have a higher number of rural farmers. The sampling weights used to draw the sample size from each state and UT are published by the IHDS survey team, and we use those weights in the regression models in this paper.
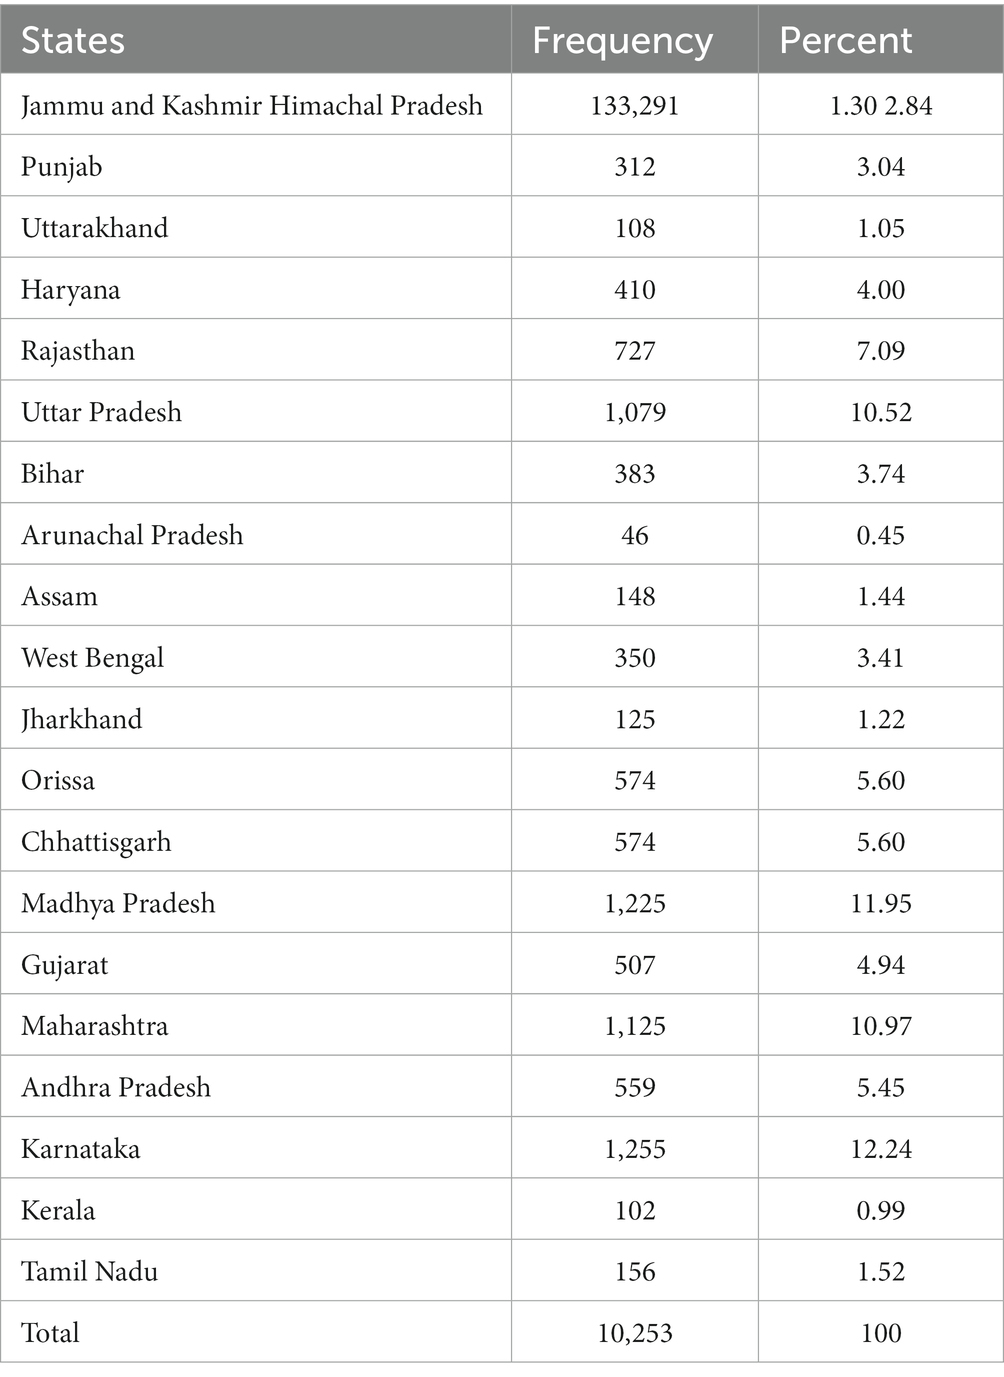
Table 1. Distribution of samples across the states of India.
In a typical impact evaluation study, if the intervention is not administered through a randomization process, there is a high likelihood of selection bias (Wooldridge, 2002). This bias results from economic agents self-selecting themselves into the development intervention based on a host of pre-existing factors, some of which are observable and others not. For example, whether the farmer household owns agricultural machinery and thus performs mechanized farming is not a random assignment; hence it is not exogenous. Instead, the farmer’s adaptation to mechanization in farming activity depends on several factors. Some of these factors may be unobserved yet and may be correlated with the outcome variable that we are intended to assess for impact evaluation. Such omitted variables can disrupt the effective estimation of the impact of the development program in question. Regression estimations typically would not pick up the self-selection by the observations leading up to endogeneity. This will create inaccurate standard errors and, in turn, inefficient slope coefficients.
To formalize the selection bias, let us assume that a farmer either adopts mechanized land preparation, irrigation, and harvesting, thus a package of mechanized farming practices (MFP) or follows the manual labor farming practice. Thus, the Adoption of MFP happens if the expected utility of the adoption is more than non-adoption , i.e., . Let be the latent variable showing the expected utility from adopting MFP by the farmer and is referred to as:
where has a binary outcome taking the value 1 if a farmer adopts MFP and zero if he or she uses only manual labor; Z represents the household characteristics, landholdings, and other control variables that affect the decision to adopt or not adopt MFP, and ɛ is an error term normally and independently distributed with mean 0 and variance . Agricultural productivity is denoted as (Y) of household is stated as:
where Xi represents the household characteristics, land holdings, extension service, and other village-level variables that affect crop productivity. captures the effect of MFP adoption on crop productivity. In the self-selection problem, the effect of might be biased, and it may happen when relatively more informed and prosperous farmers choose to follow MFP. Then the yield or the income effect is over (under) estimated. This self-selection may occur due to observable and unobservable factors correlated with the potential outcomes. The observable factors can be explicitly included in the regression model. However, the unobservable factors are far more serious and create the endogeneity bias.
The propensity score matching (PSM) method has been used to correct self-selection bias in some studies (Becerril and Abdulai, 2010; Kassie et al., 2011; Jena et al., 2012; Jena and Grote, 2017). However, PSM does not account for the unobservable variables, such as skills in crop management, motivation, etc., that may have influenced the outcome. Several studies have used the endogenous switching regression (ESR) model to deal with the unobservable bias (Teklewold et al., 2013; Kleemann et al., 2014; Jaleta et al., 2015, 2016; Jena et al., 2017; Jena, 2019). Hence, the current study uses the ESR model for impact evaluation.
There are two regimes in the ESR model –the primary regime consists of the households that adopt farm mechanization, and the households that do not adopt mechanization come under the secondary regime. The specifics of the ESR have been discussed in Kleemann et al. (2014), Jaleta et al. (2016), Jena (2019).
The outcome in these two regimes can be expressed as follows:
where, is the outcome variable (such as net agriculture income, total income, and total consumption) by the th household under regimes 1 (Adoption) and 2 (non-adoption) and represents the covariates. The ratios and are called the inverse Mill’s ratios (IMR) estimated from the first-stage selection regression (often a Logit or Probit model). Any self-selection bias that confounds the data is corrected by including these inverse Mill’s ratios in Equations (3a) and (3b). Further, bootstrapping standard errors have been used to correct for heteroskedasticity arising from the regressions. and are the variances of the error terms from the two regimes, respectively.
For each of the two regimes, the real and counterfactual scenarios for the expected conditional and average treatment effects are estimated. They are –
The Equations (4a) and (4b) are the conditional expectations of the adopters and non-adopters, respectively. However, the true average treatment effect on treated (ATT) will be known by comparing the actual outcome of adopters with a counterfactual of what would have happened if they decided not to adopt mechanization. This counterfactual outcome is estimated in Equation (4c). So, the ATT is calculated as Equations (4a)–(4c). Similarly, the counterfactual for non-adopters is Equation (4d). and the average treatment effect on untreated (ATU) is calculated as Equations (4b)–(4d).
The ESR model uses exclusion restriction to identify the first stage regression from the second stage. The exclusion restriction could be an exogenous variable which is used in the first stage adoption model but is not included in the second stage outcome regression. However, in the absence of a suitable instrument to serve the purpose of identification, the nonlinearity in the model can be used as an exclusion restriction (Jaleta et al., 2016).
Table 2 shows the percentage of farmer households in possession of the three main categories of machinery, i.e., tractor, diesel pump and electric pump. Among the three machinery types, the tractor has an adoption rate of 8%. Tractor has been mostly used in states like Punjab, Haryana, and Western UP, with large tracts of agricultural land in the Indo-Gangetic plains (Figure 1).
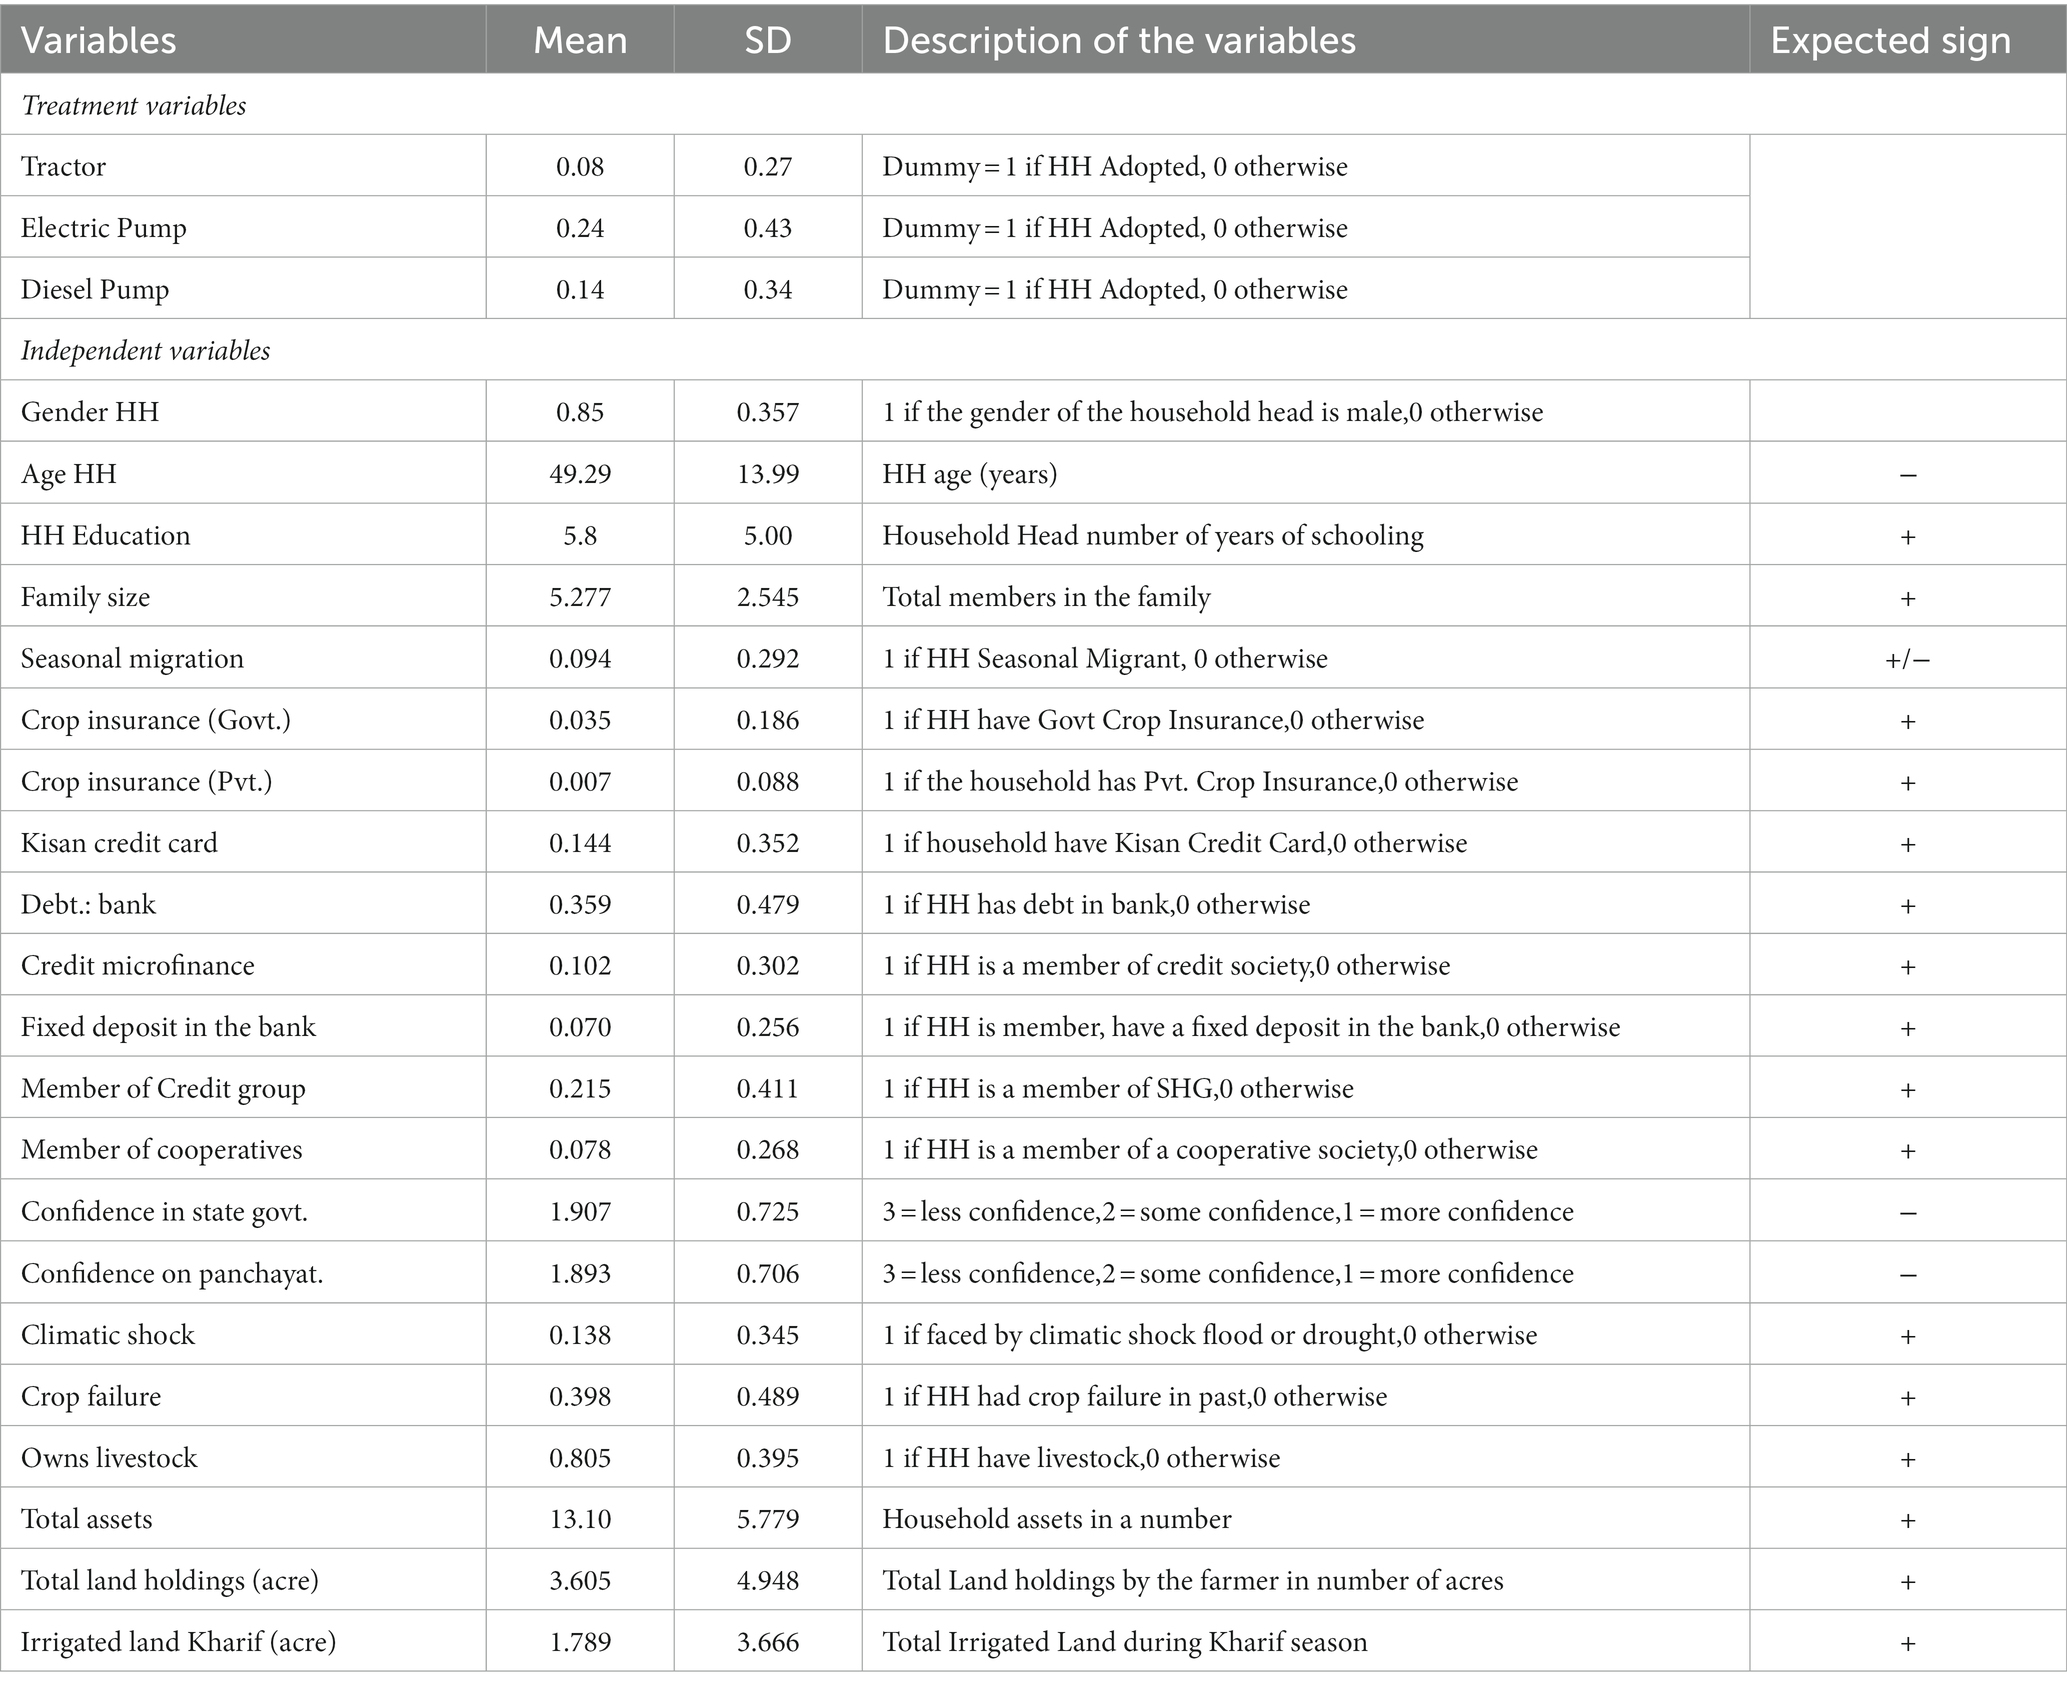
Table 2. Descriptive statistics of dependent and independent variables.
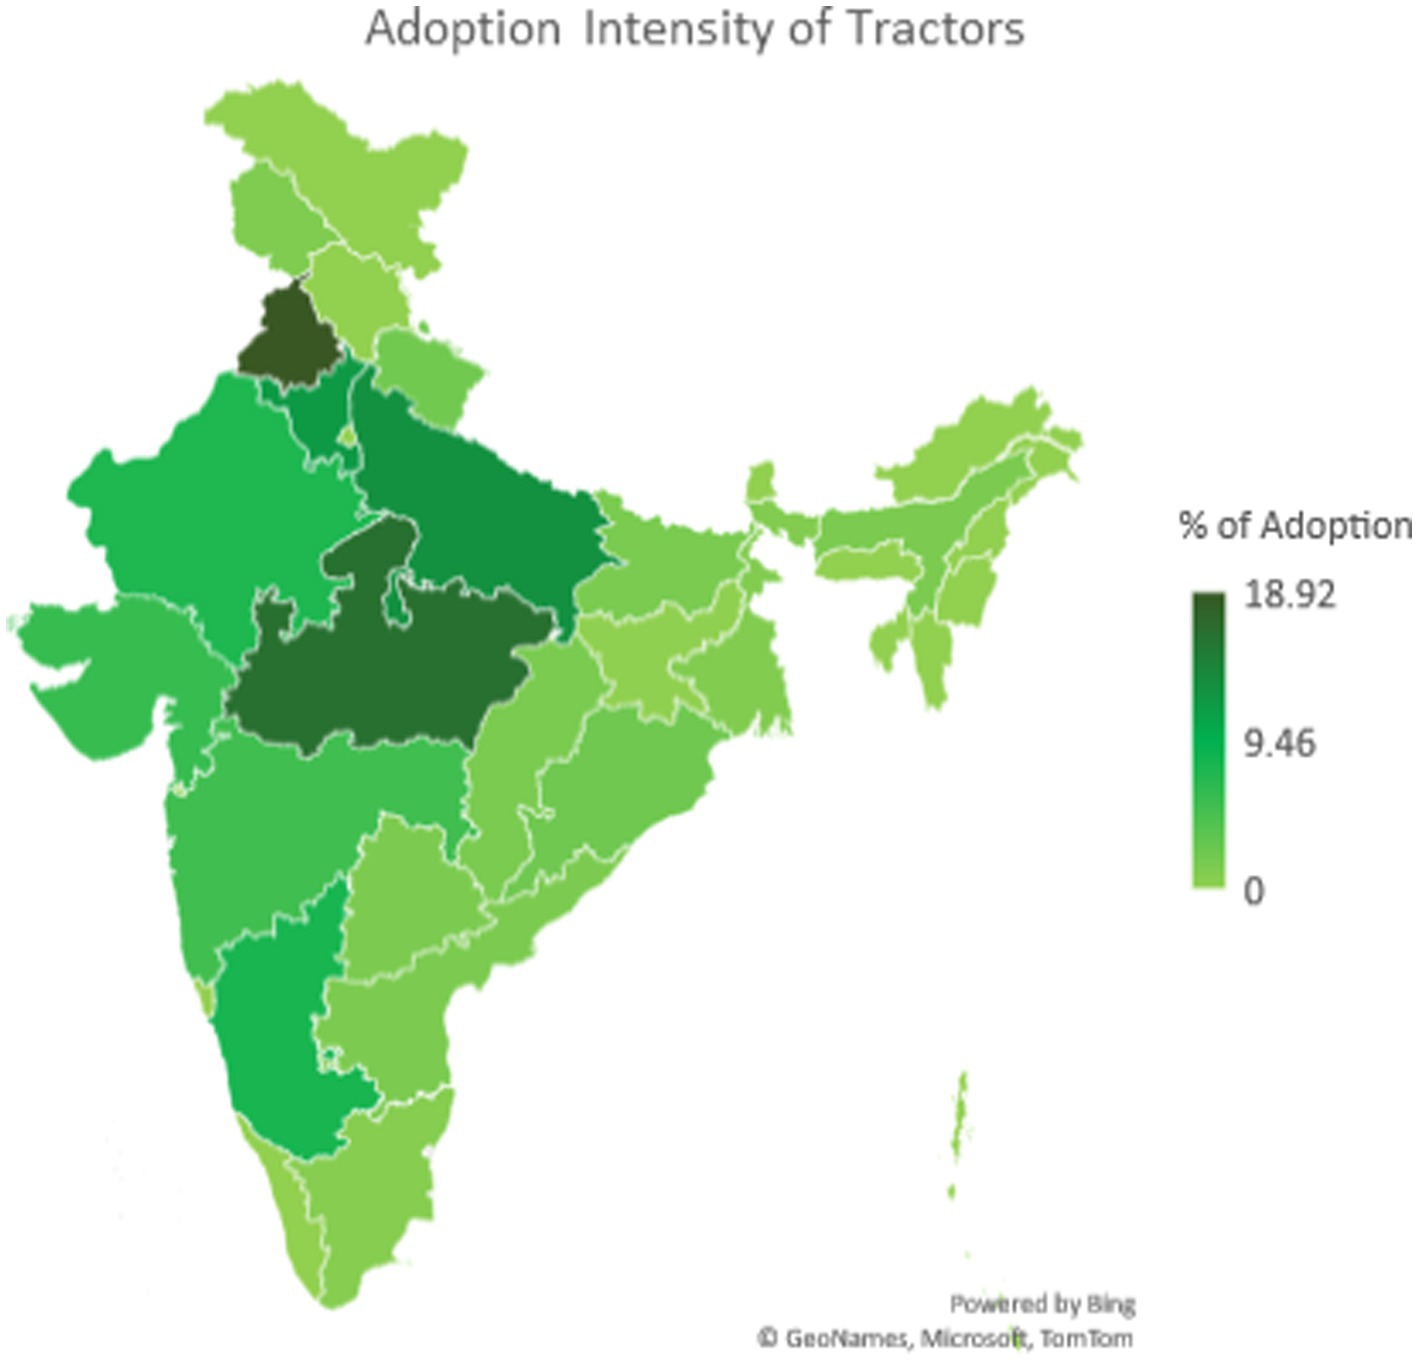
Figure 1. State-wise adoption intensity of tractors.
The electric pump has the highest adoption rate among the three machinery categories, with a 24% adoption rate (Figure 2). Electric pumps are widely used because there is a subsidy for using electricity for agricultural purposes, which reduces it’s per unit price. Shallow tube wells, driven by electric power, are gaining popularity in India due to less and erratic rainfall in the country. The third machinery, i.e., diesel pump, has a 14% adoption rate. We calculated the adoption of multiple machineries too. About 14% of electric pump adopters also adopted diesel pumps and 17% of electric pump adopters adopted tractors. So, the multiple adoption rate of implements is not too high.
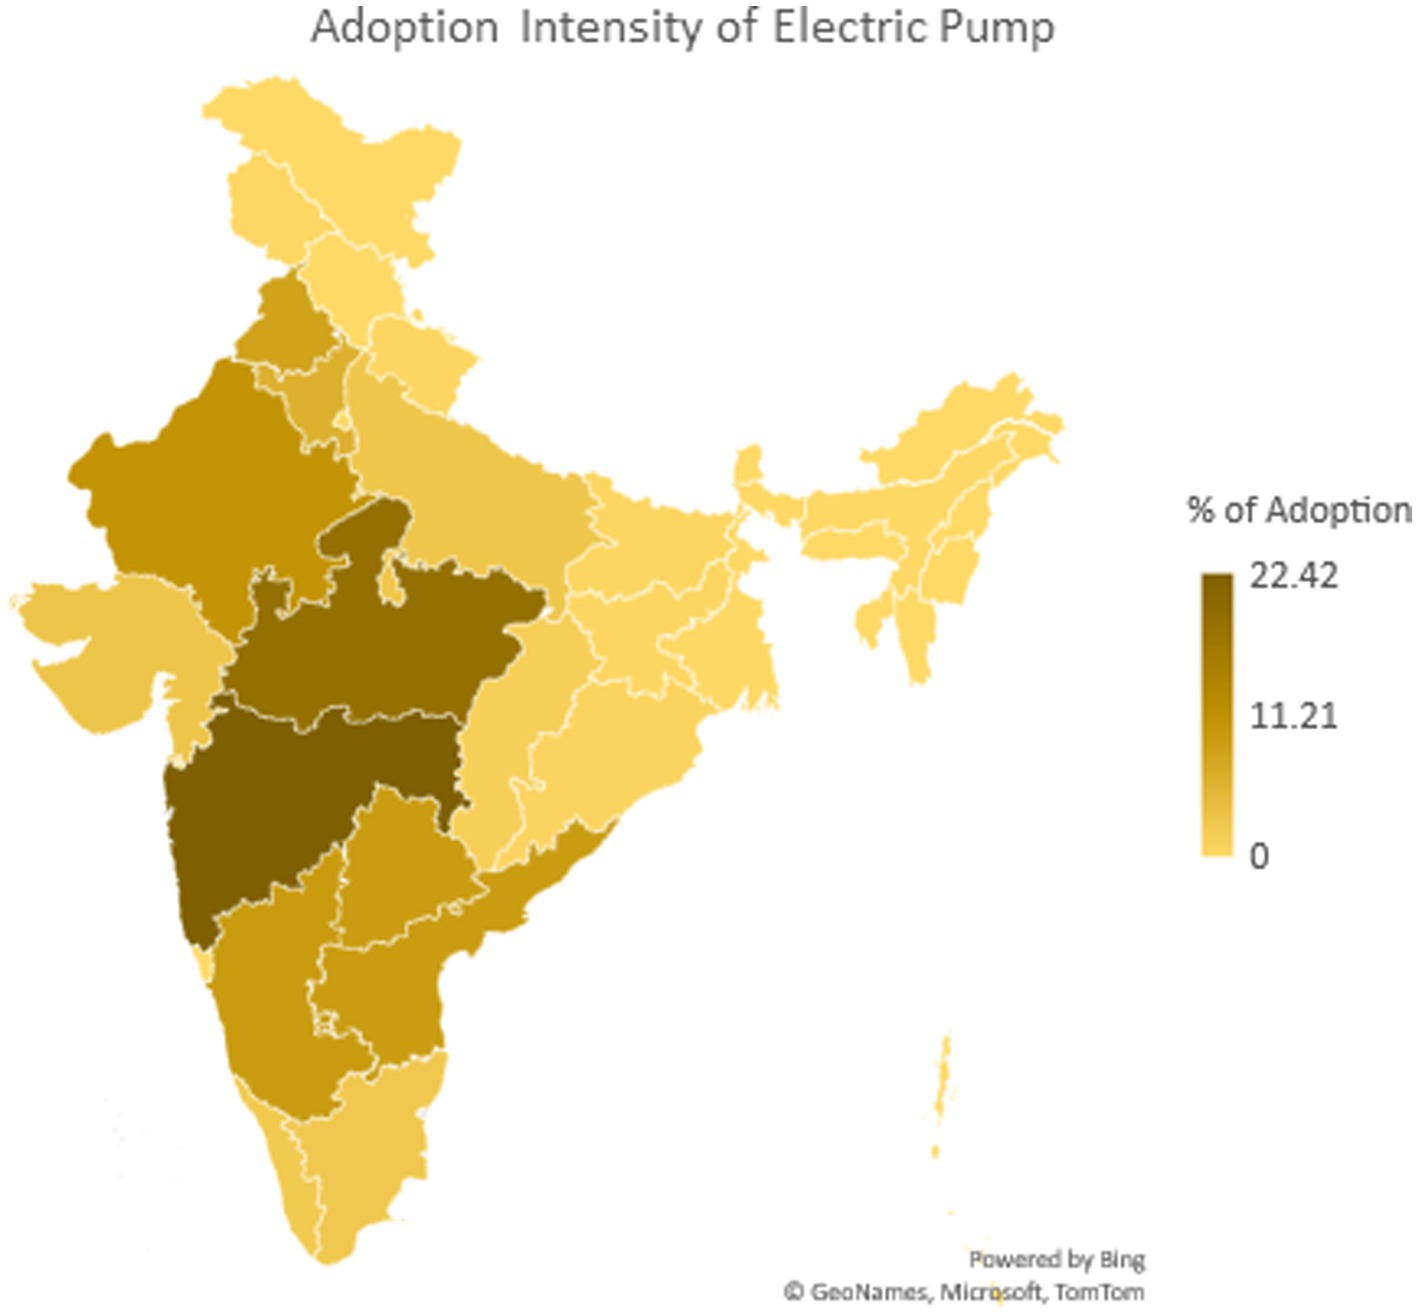
Figure 2. State-wise adoption intensity of electric pumps.
The distribution of mechanization is uneven across different regions of India, depending on the area’s topography. The tube wells and dip borewells are the major water-based adoption in the north, south, and central plains of India. In the hilly areas of eastern and western parts, the number of tube wells is relatively low. In central plains, people use more electric pumps than diesel pumps. Tractors are widely used in the north and central plains. North-central farmers use chaff cutters because they have a secondary source of income from cattle rearing and the maintenance of livestock. The seed drill machine is widely used in the north-central region, as cereal is a major crop in this region. The seed drill machine helps adopt minimum tillage practice, which is one of the strategies for climate change mitigation. There is low farm mechanization in southern states, followed by eastern states, compared to other parts of India.
Furthermore, we analyzed whether mechanization rate is higher in the states where agricultural labor shortage is higher too. It is observed that the states such as Bihar (58%), Andhra Pradesh (49%), Madhya Pradesh (49.33%), Tamil Nadu (50%), Chhattisgarh (49%), and Odisha (45%) have a larger percentage of agricultural laborers in their total workforce (NABARD, 2021). These states have a lower level of farm mechanization (35–45%) due to smaller and more fragmented landholdings and a higher participation rate in the agricultural labor force (Tiwari et al., 2019). The states of Punjab, Haryana, and Uttar Pradesh have a lower percentage of their workforce employed in agriculture, with an average participation rate of 20–30% (NABARD, 2021). These northern states have a higher overall farm mechanization level of 70–80%, with 80–90% mechanization for rice and wheat. This is not only due to a declining agricultural workforce but also to highly productive land and government support, which may include subsidies, technological assistance, and infrastructure development (Tiwari et al., 2019; Figure 3).
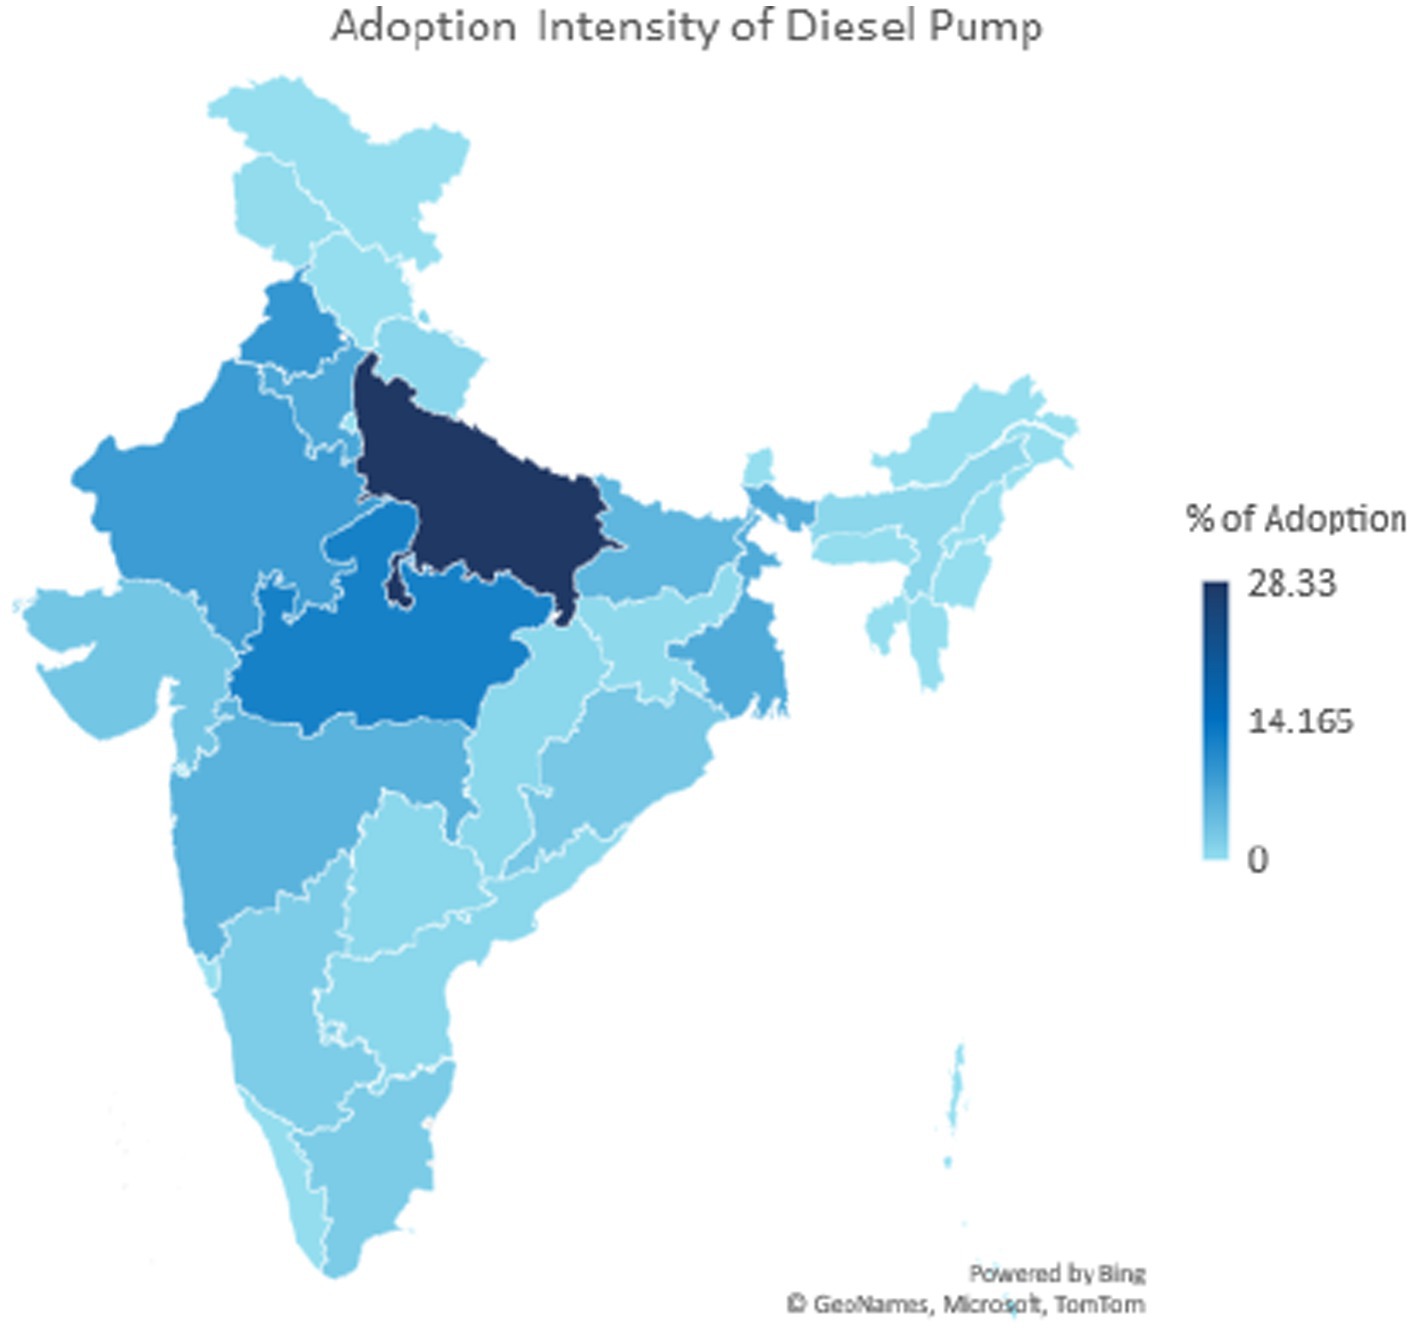
Figure 3. State-wise adoption intensity of diesel pumps.
Tables 3–5 compare the key factors such as household income, consumption, assets, household characteristics, and access to credit between the adopters and non-adopters of the three types of machinery considered in this study, such as tractors, electric pumps, and diesel pump. The mean difference test results show a statistically significant difference between the adopters and non-adopters of all three types of machines regarding land ownership, possession of livestock, and other assets. Regarding household characteristics, we use the education level of the household head. It was observed that adopters of agricultural machines have a higher education level in their families compared to non-adopters.
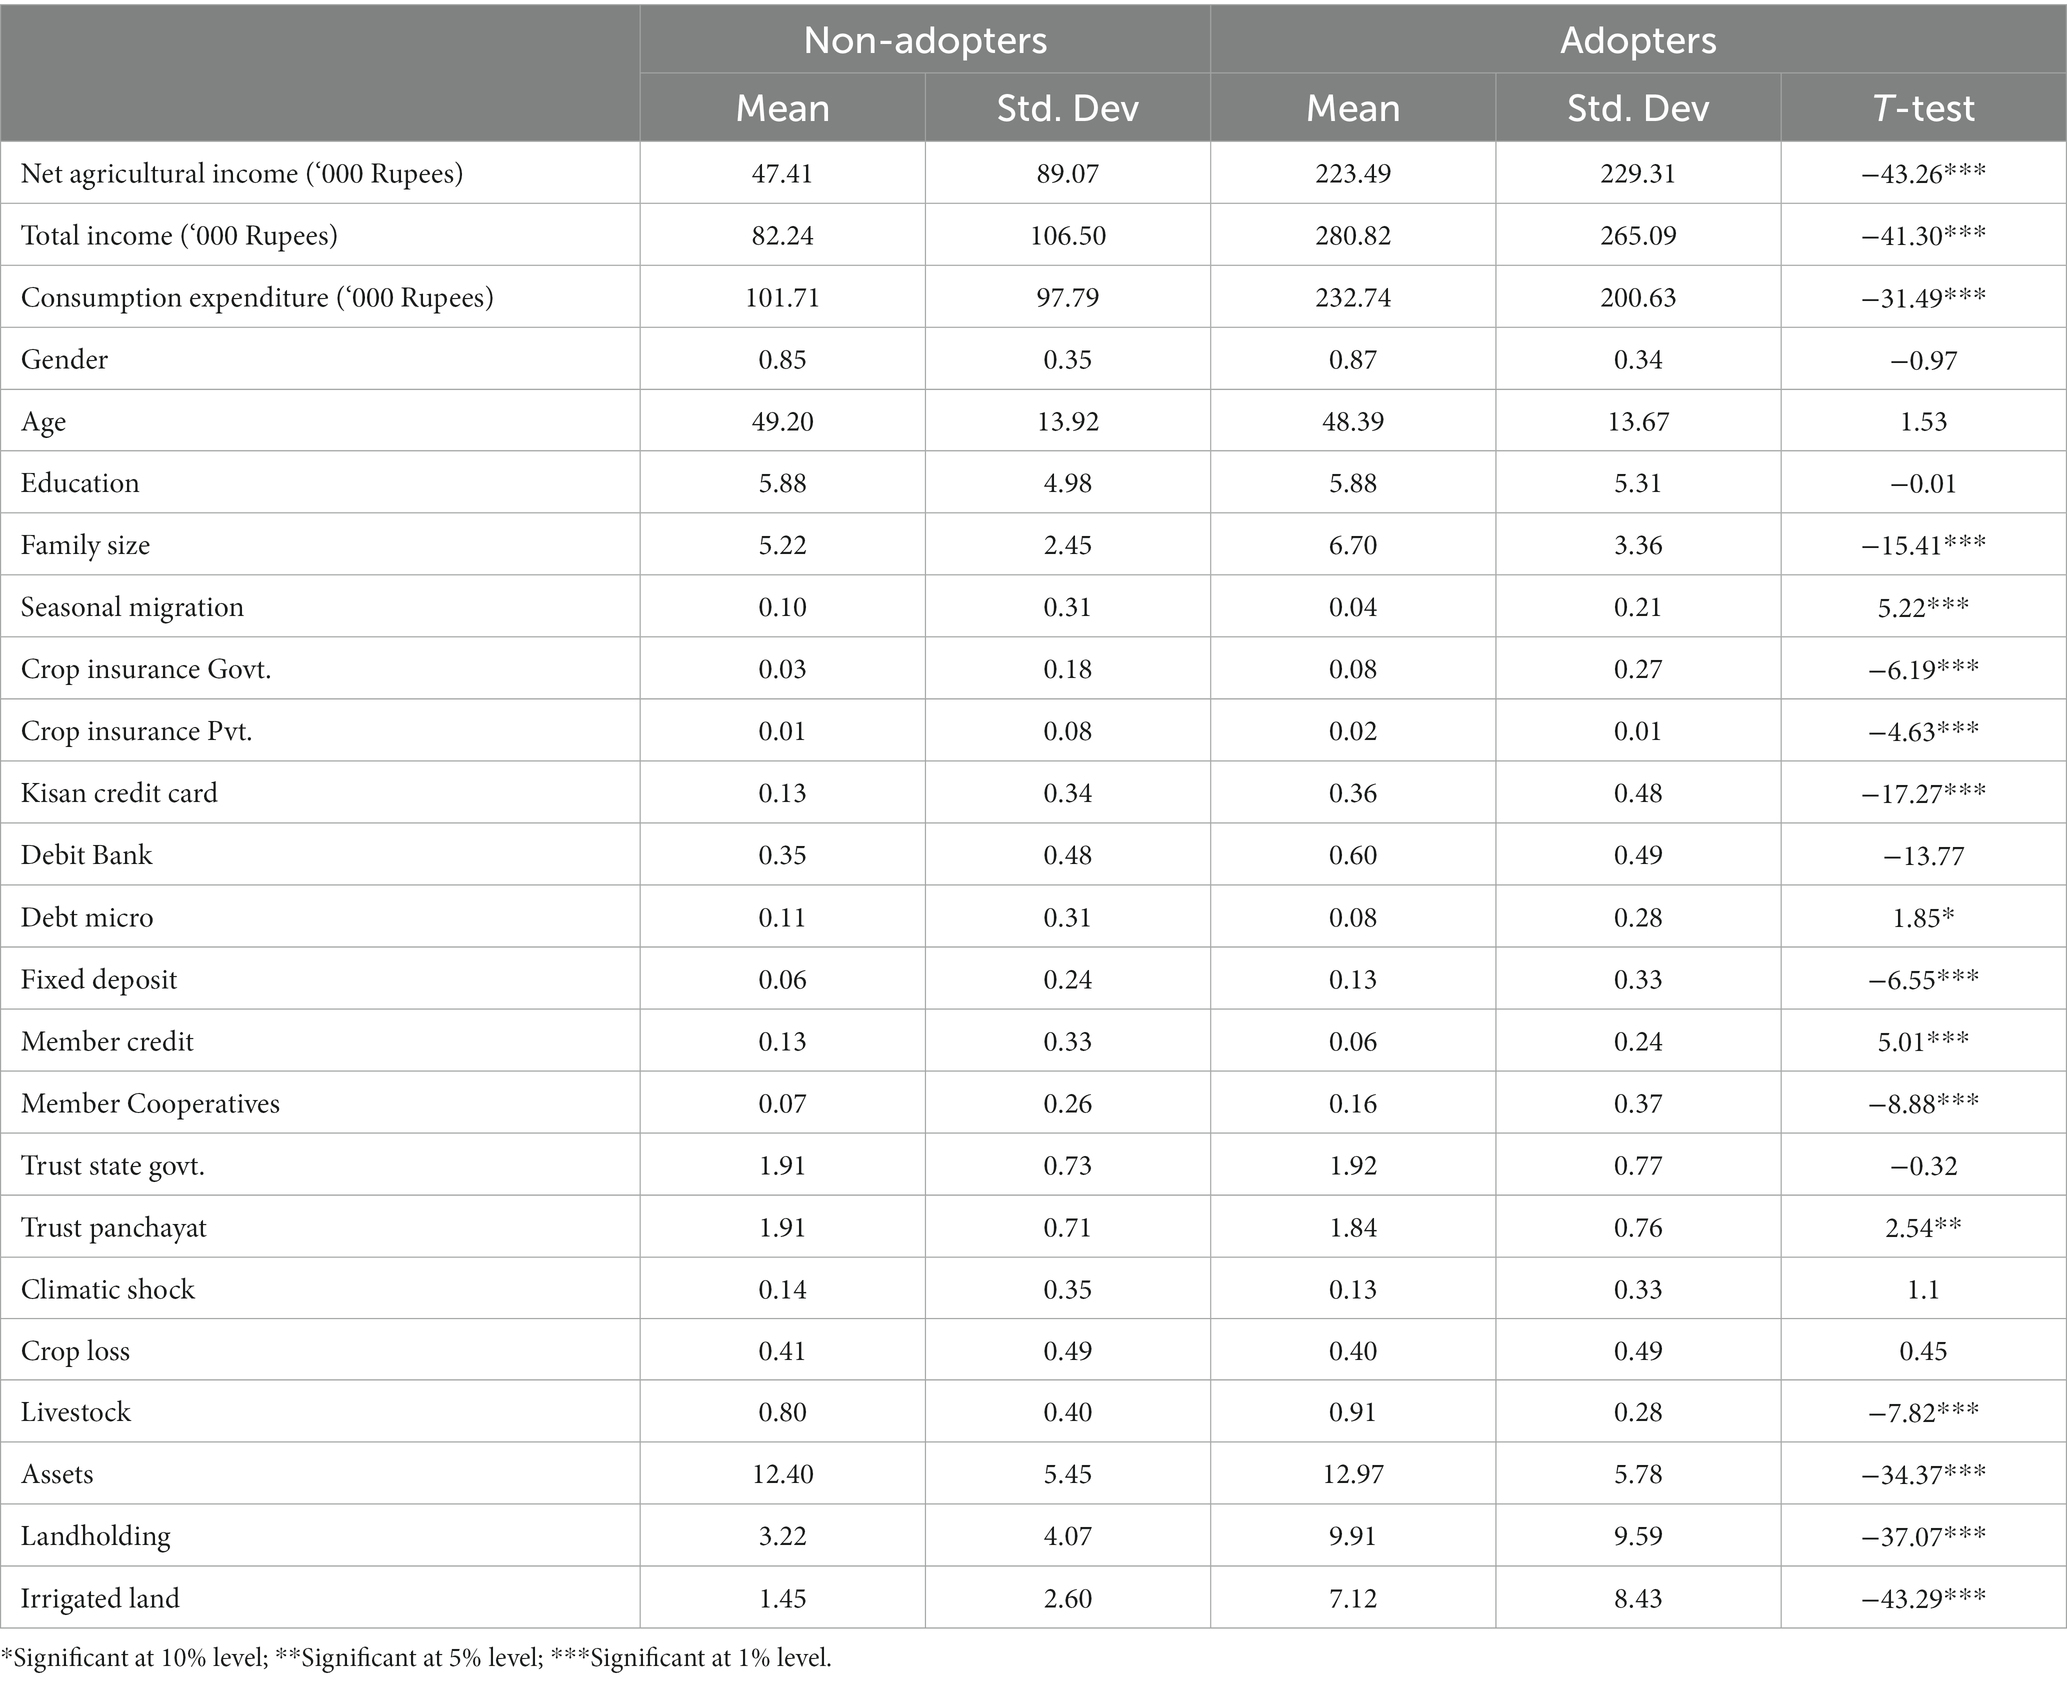
Table 3. T-test of the covariates of tractor adoption.
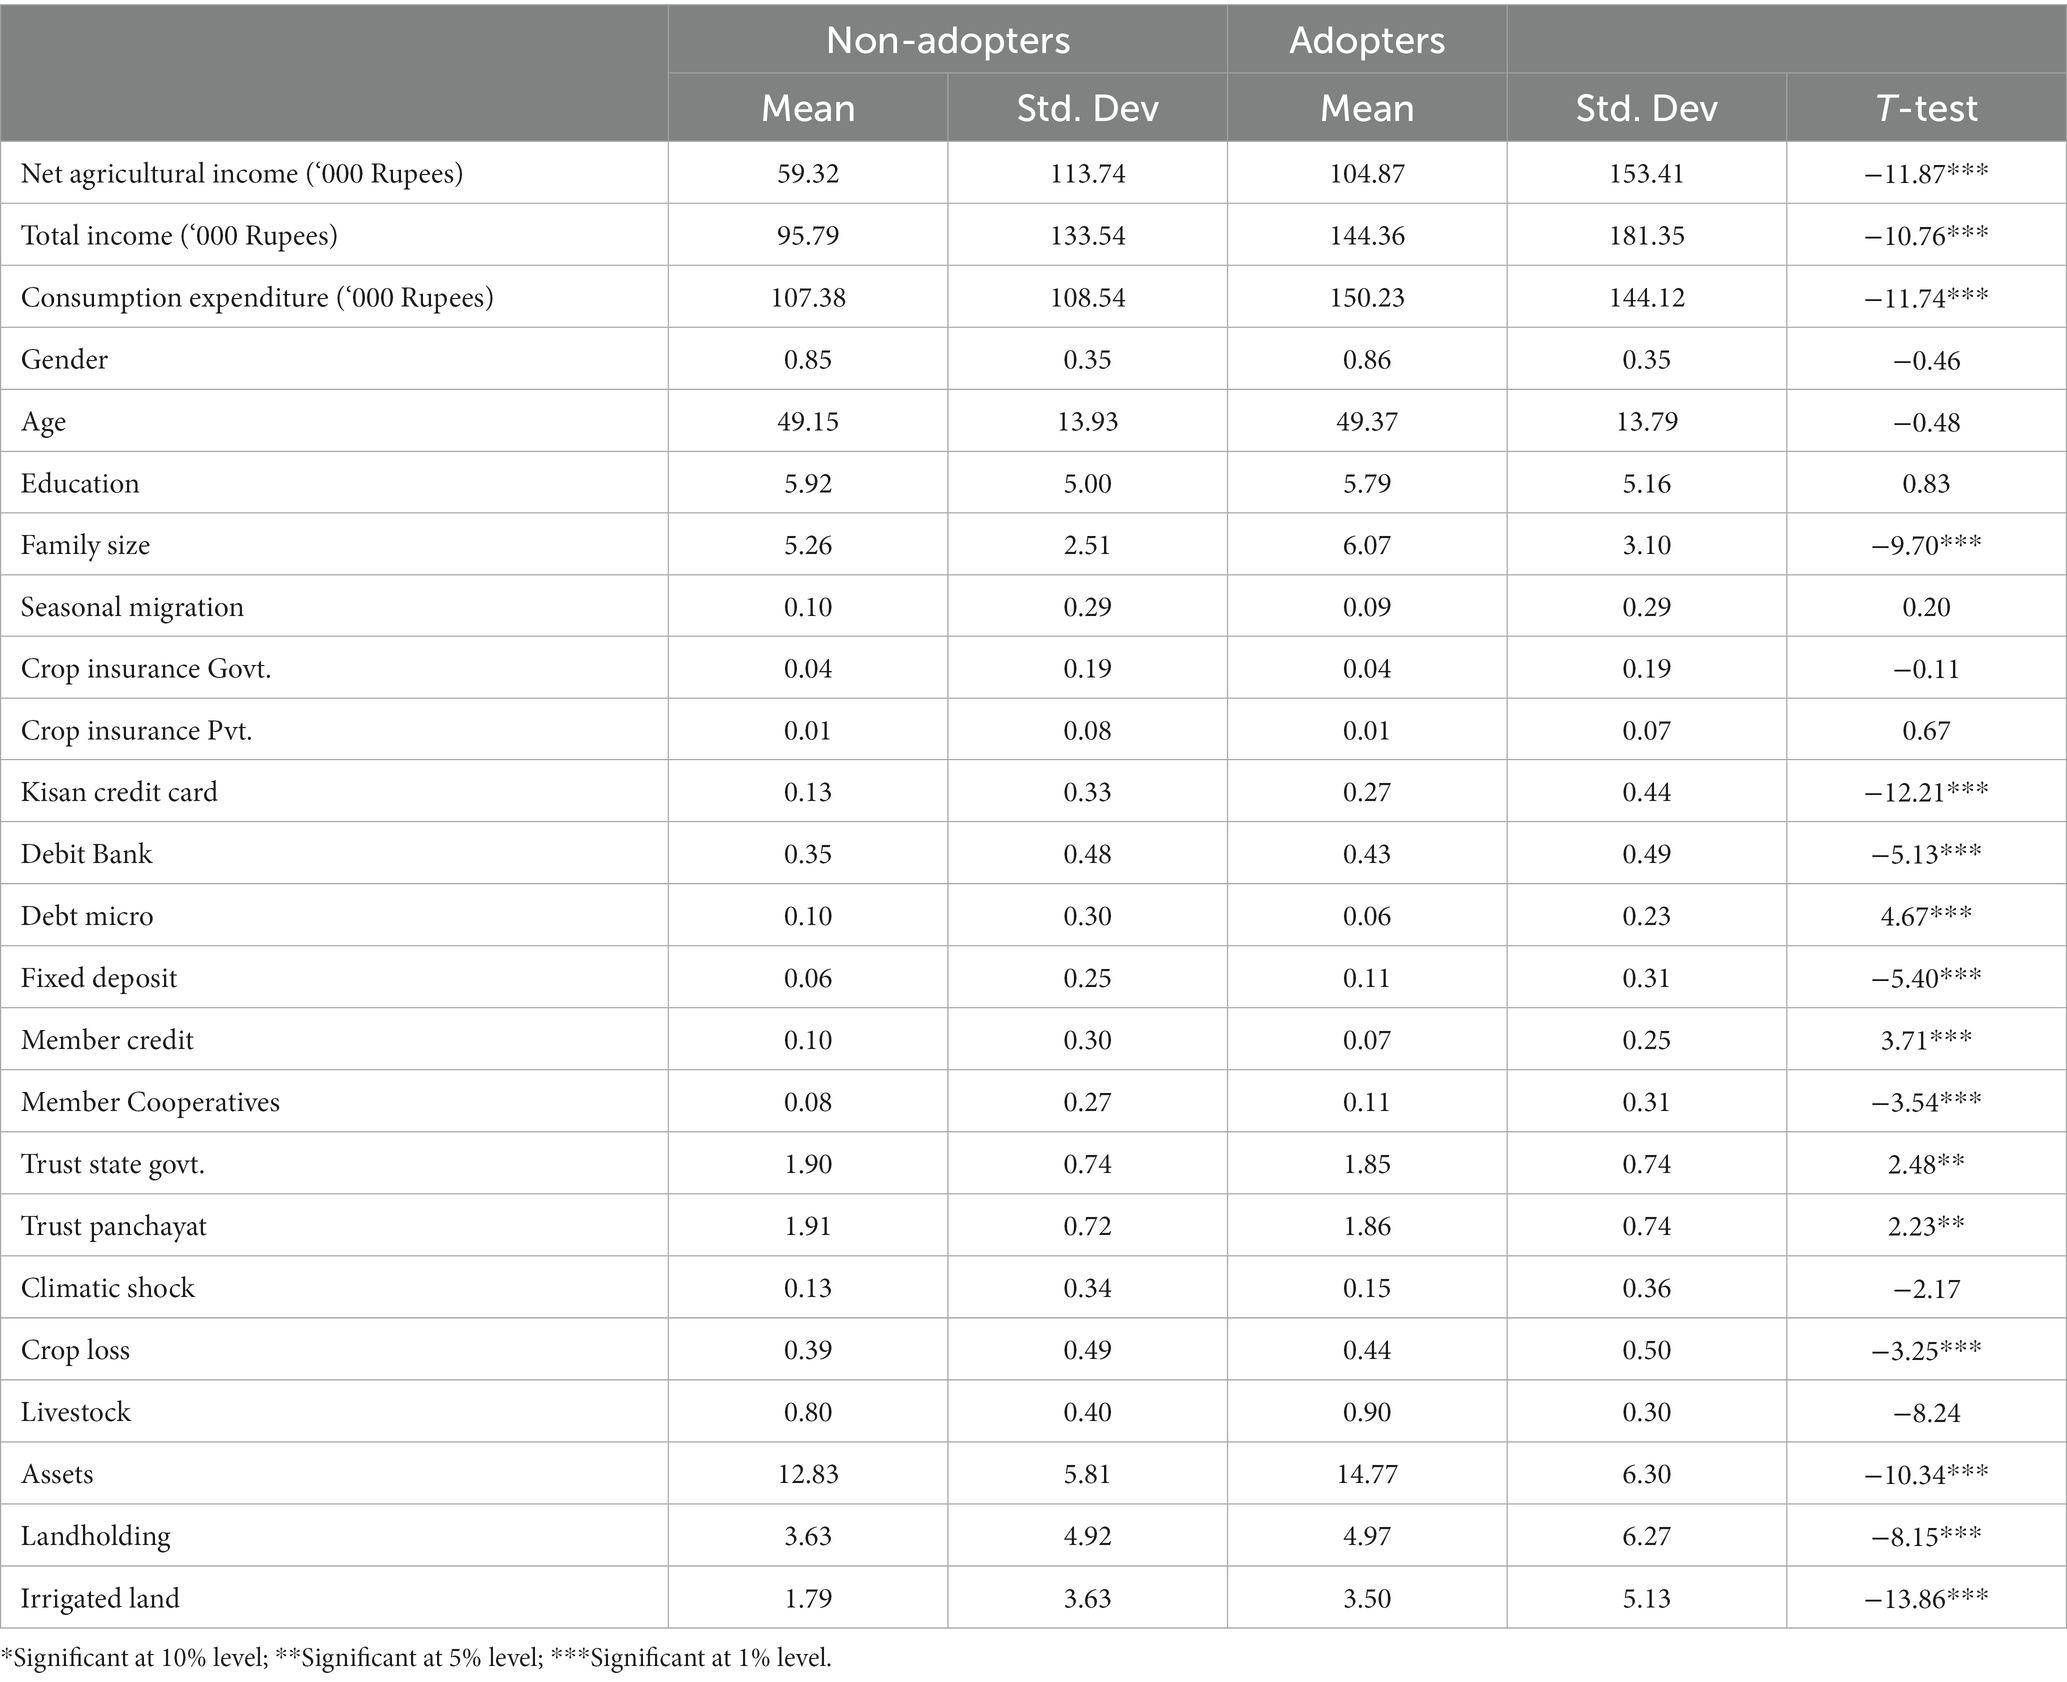
Table 4. T-test of the covariates of diesel pump adoption.
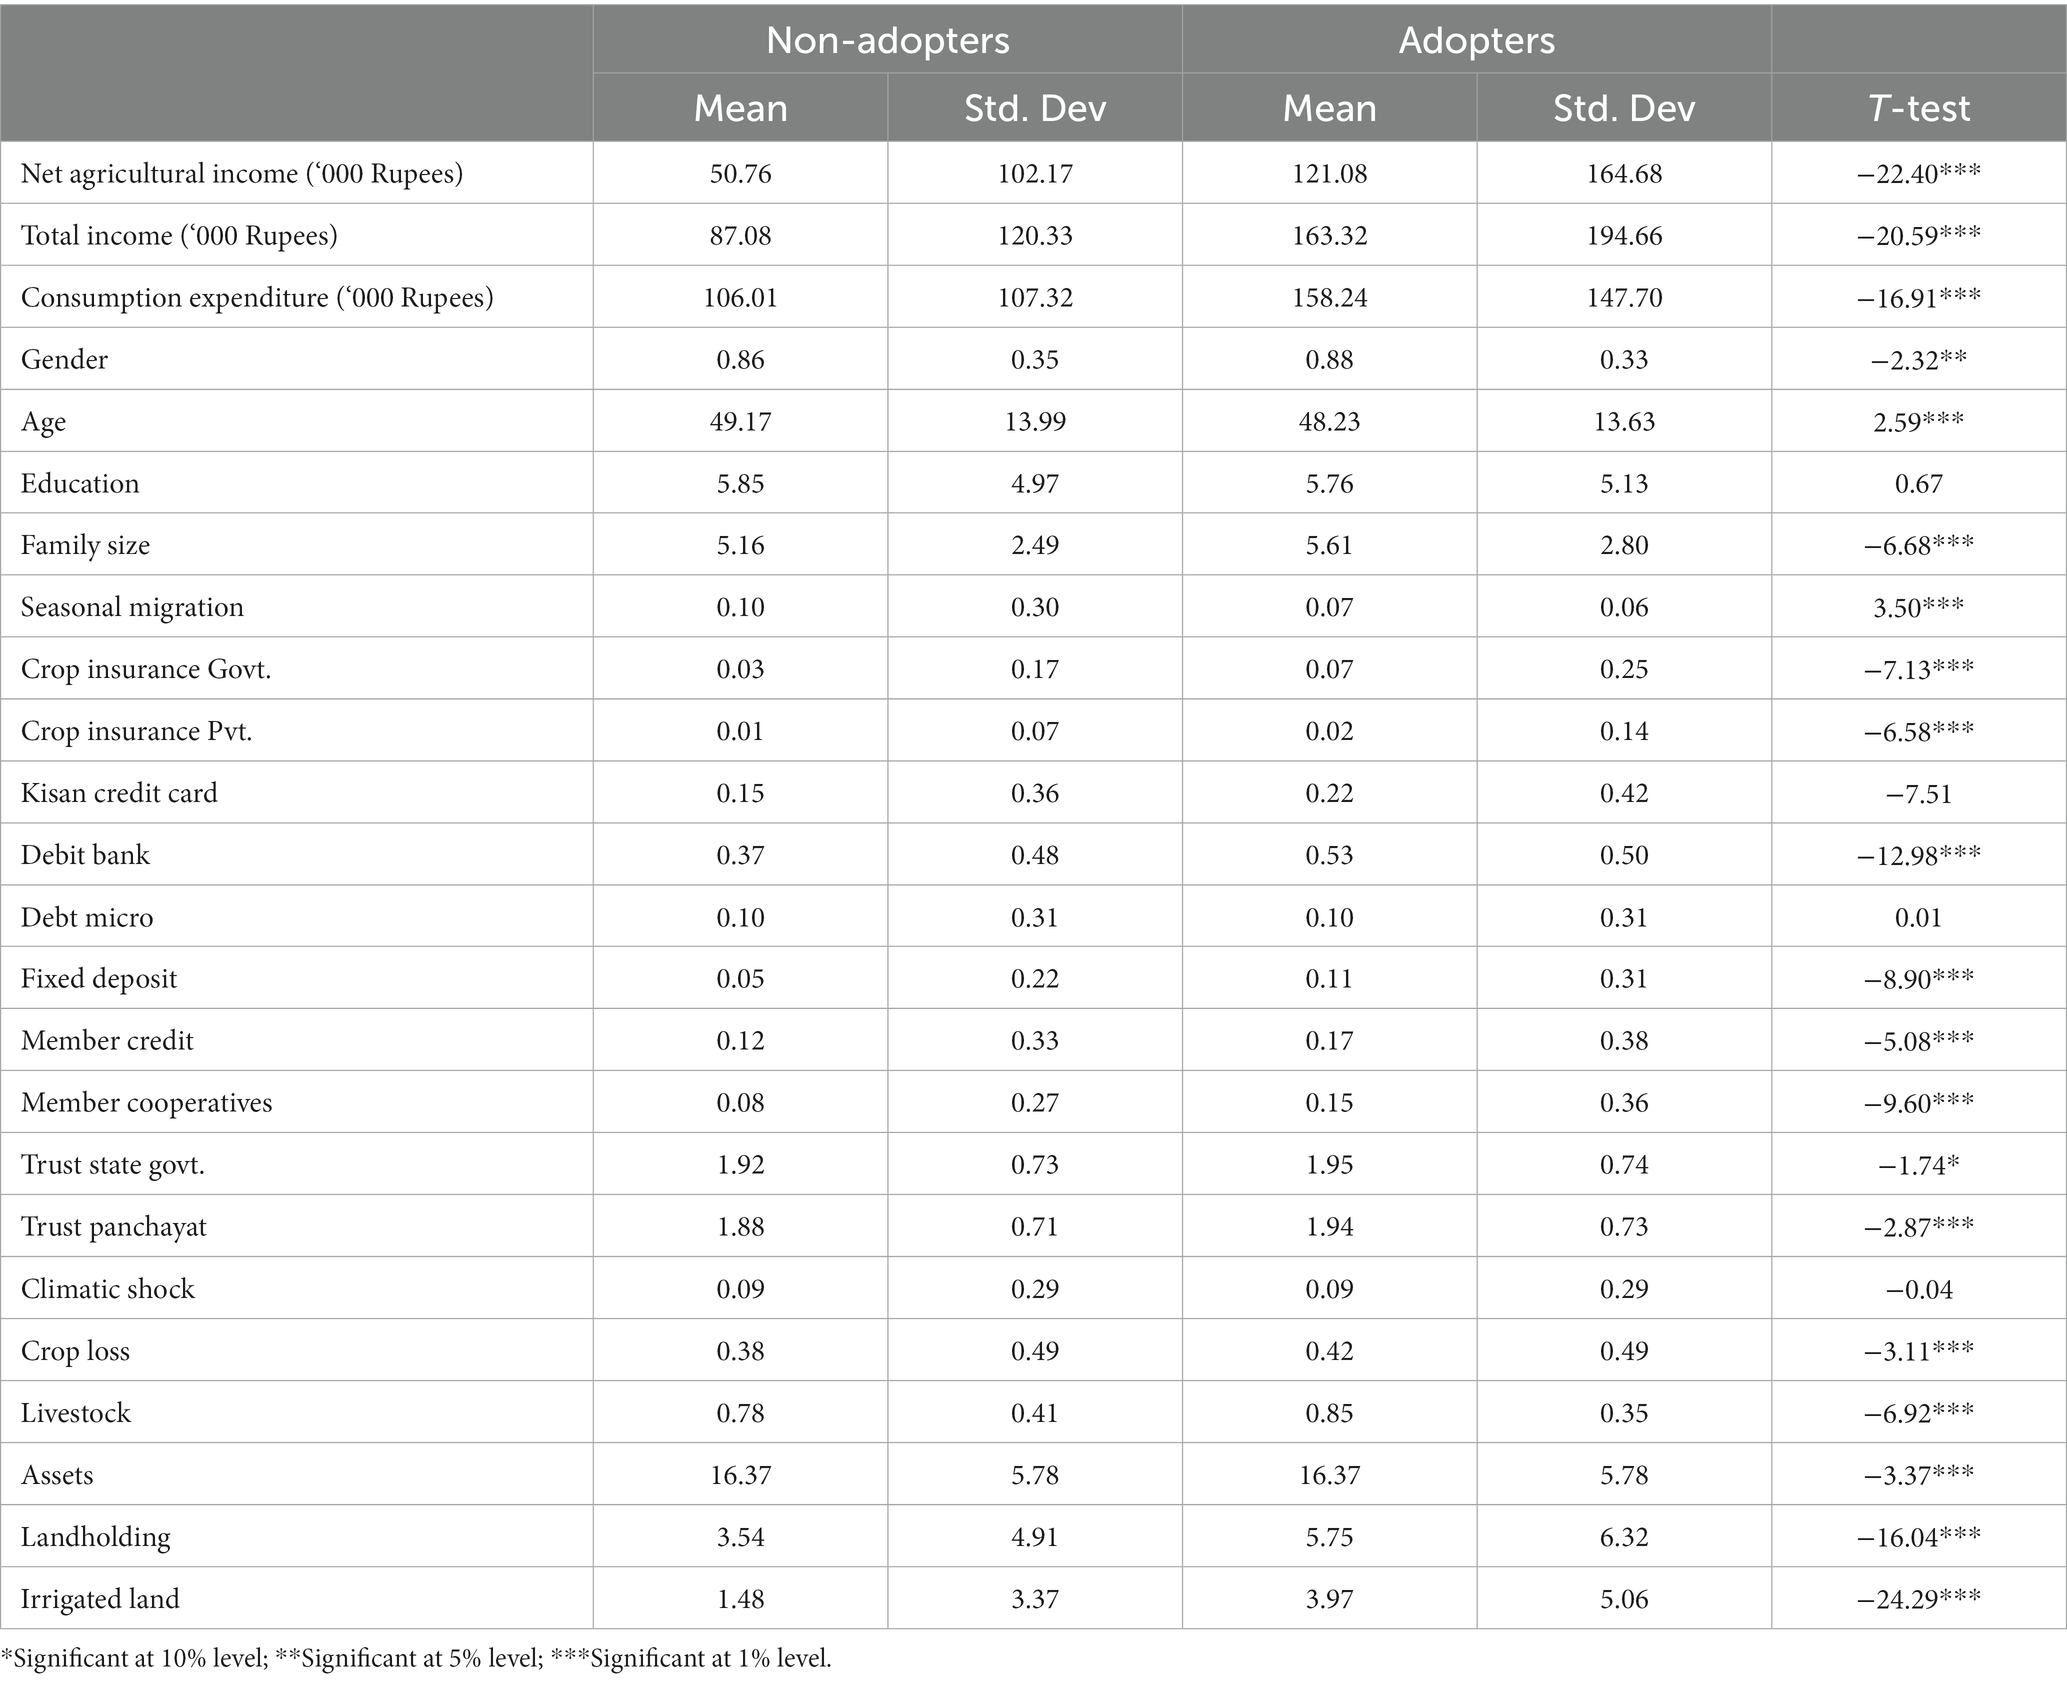
Table 5. T-test of the covariates of electric pump adoption.
Considering the discussion above, it may seem plausible that the adopters self-select themselves into adopting mechanized farming practices owing to their higher levels of land ownership and access to credit, the two most important inputs required for the success of mechanized farming. For this reason, we resort to ESR models for gauging the impact of farm machinery adoption on household income.
Furthermore, the distribution of the three outcome variables, namely net agricultural income, total household income, and household consumption, shows that the few considerably richer households in the adopters and non-adopters groups skew the distribution (See Figures 4–12). The income distribution in developing countries generally shows this pattern. Several outlier tests have been done to identify and weed out the outliers in all three outcome variables; however, the skewness in the distribution remains. The Kernel density function of these outcome variables indicates that, on average, the adopters have higher household income and consumption levels. This finding is confirmed by the mean comparison test results shown in Tables 3–5. An interesting point to note is that in Figures 4–12, we have compared the Kernel densities of outcome variables between adopters and non-adopters of different types of machinery both before and after the ESR estimations. The Figures show that the skewness, apparent before the ESR estimations, has reduced significantly after it. The pattern of distributions moves toward normal distribution after the ESR because the first stage selection regression has been able to capture some of the selection bias arising both from observable and unobservable covariates.
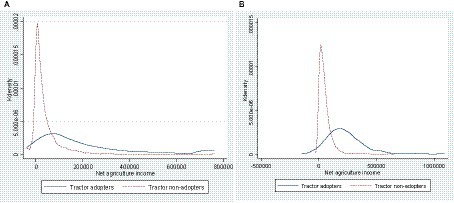
Figure 4. Net agricultural income distribution of adopters and non-adopters of tractors, (A) before and (B) after the ESR estimations.

Figure 5. Total household income distribution of adopters and non-adopters of tractors, (A) before and (B) after the ESR estimations.
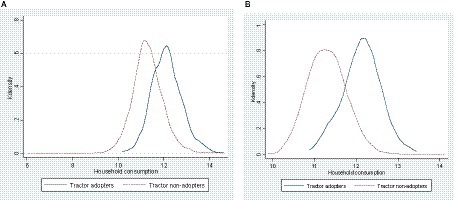
Figure 6. Household consumption distribution of adopters and non-adopters of tractors, (A) before and (B) after the ESR estimations.
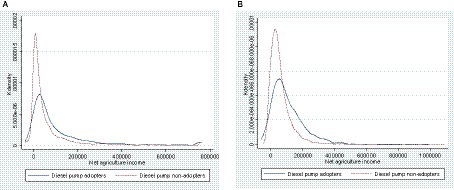
Figure 7. Net agricultural income distribution of adopters and non-adopters of diesel pump, (A) before and (B) after the ESR estimations.
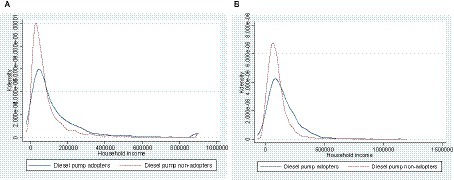
Figure 8. Total household income distribution of adopters and non-adopters of diesel pump, (A) before and (B) after the ESR estimations.

Figure 9. Household consumption distribution of adopters and non-adopters of diesel pump, (A) before and (B) after the ESR estimations.
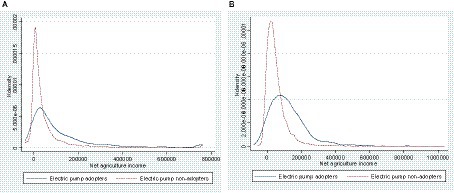
Figure 10. Net agricultural income distribution of adopters and non-adopters of electric pump, (A) before and (B) after the ESR estimations.
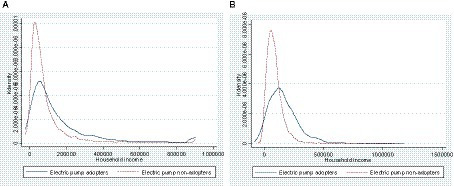
Figure 11. Total household income distribution of adopters and non-adopters of electric pump, (A) before and (B) after the ESR estimations.
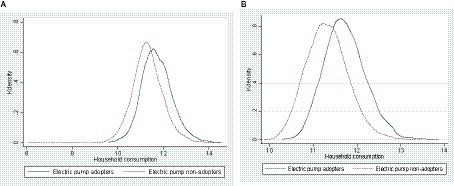
Figure 12. Household consumption distribution of adopters and non-adopters of electric pump, (A) before and (B) after the ESR estimations.
Table 6 presents the results from the first-stage probit model of the 2-stage ESR for adopting tractors, electric pumps, and diesel pumps. In all the regressions, we have used the population sampling weights to account for the ratio of the samples drawn to population size in the states (provinces). Further, the number of states and sample size used in the estimation vary from one type of machinery to another, depending on the percentage of adopters of these types of machinery. We have considered those states with at least 1% or more adopters in the sample from that state, hence, dropping the non-relevant states for the respective machinery. For example, states such as Arunachal Pradesh, Nagaland, and Sikkim are dropped for tractors.
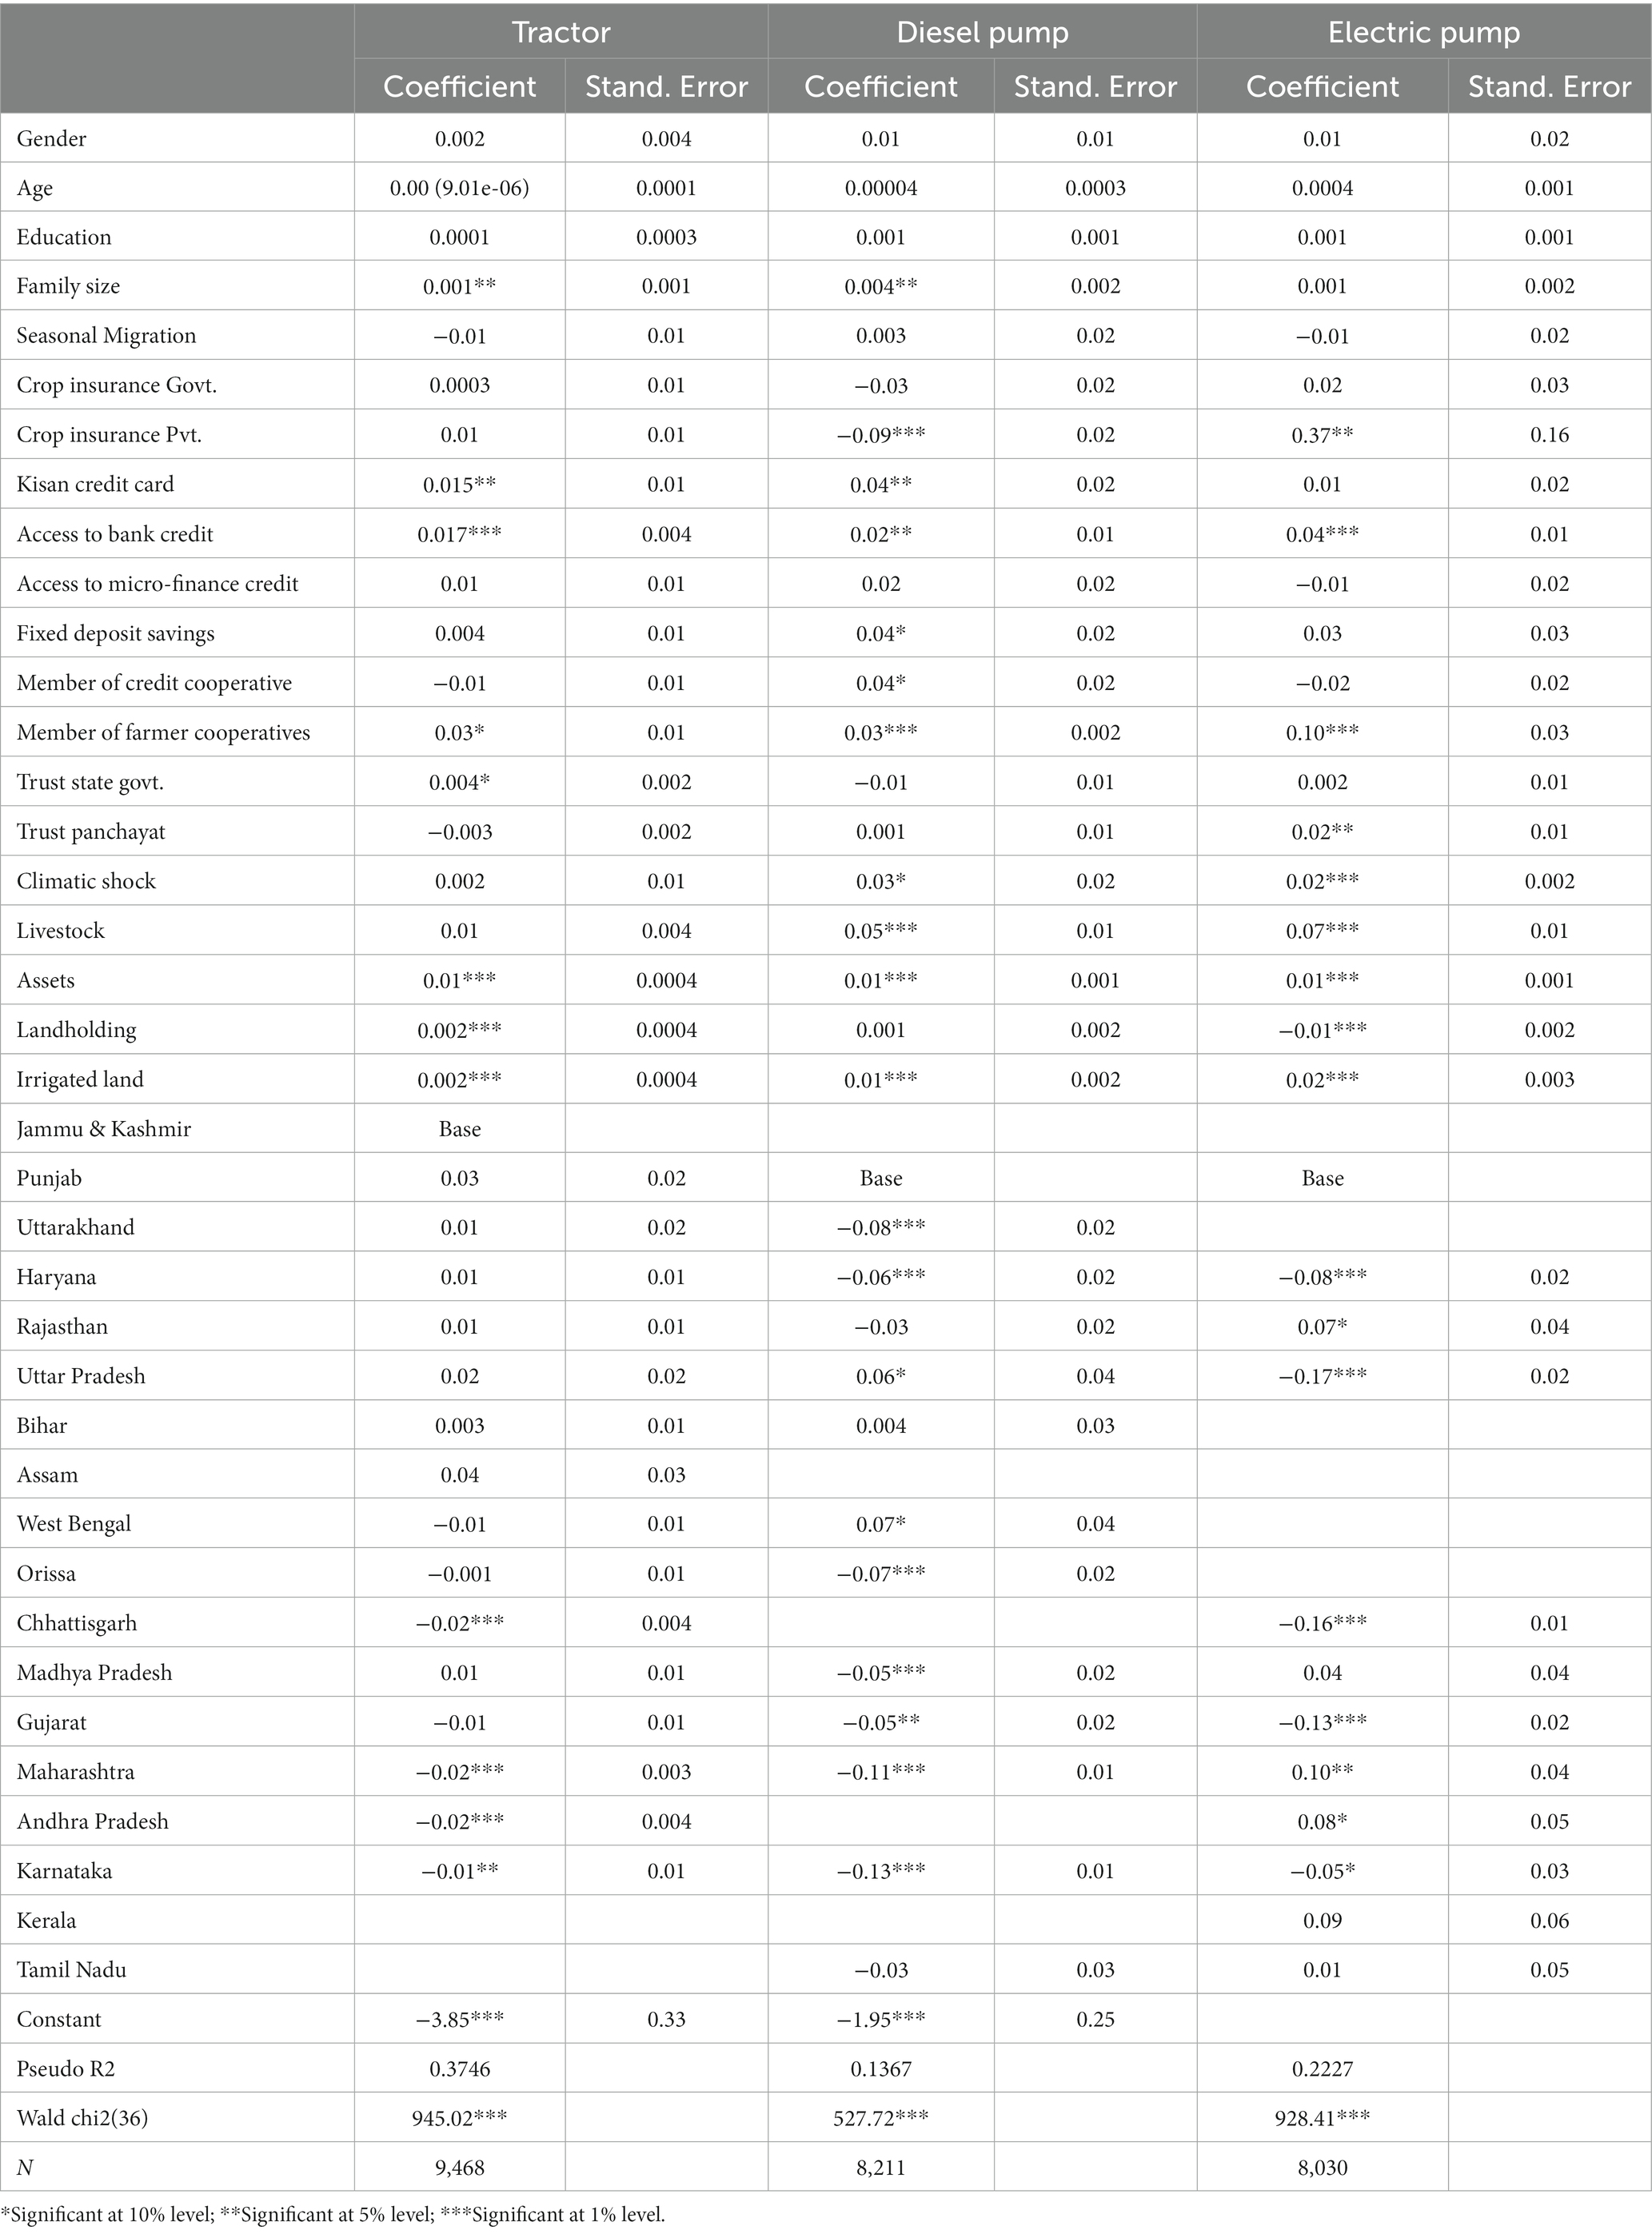
Table 6. Determinants of adoption of different machinery (marginal effects).
A perusal of the results shows that access to credit positively contributes to the adoption of machinery. Both the access to bank credit and possession of Kisan credit cards are positive and statistically significant for all three types of machinery. Previous studies have also confirmed that access to key institutional support such as credit facilities has increased the adoption of agricultural technology (Ali et al., 2016; Mottaleb et al., 2016; Wossen et al., 2017; Chandio et al., 2019; Paudel et al., 2019a,b; Akram et al., 2020; Saliou et al., 2020). Furthermore, plot-specific characteristics like access to irrigation facilities and land size positively affect the adoption of these types of machinery. Irrigation facility increases the adoption of mechanized farming, as shown by the positive and significant coefficient of the variable, irrigated land. Family size is positive and statistically significant for adopting machines like tractors and electric pumps. a finding that is corroborated by existing studies such as Adekunle et al. (2016); Takeshima and Bhattarai (2019); and Sarkar (2020).
Both household assets and possession of livestock variables have a positive and statistically significant influence on the adoption decision. This indicates that households with a relatively higher stock of wealth may be able to adopt the types of machinery. Farmer households with a fixed deposit in the bank are more likely to adopt mechanization. This may happen because the deposit in the bank provides them with a cushion against any default on the bank loan, they might have taken to purchase such types of machinery. Membership in a farmer cooperative is positive and statistically significant for all three types of machinery, indicating that the former acts as both an information catalyst and a peer effect. This inference is in line with the studies of Aryal et al. (2019), Paudel et al. (2019a,b), Aweke (2013), and Ketema et al. (2016).
As expected, and hypothesized in Table 2, climatic stress may have induced farmers to adopt mechanized farming. The results show that the experience of climate shock-like drought, uncertain rainfall, and flood have increased the likelihood of adopting tractor and electric pumps. For example, with mechanized tilling, farmers can prepare the land and sow the seeds on short notice and similarly can harvest in a short span of time using the harvesters in the event of untimely storms and flash floods.
As obtained from the ESR model, the adoption effects have been furnished in Tables 7–9. The income values have been rescaled by dividing them by 1000 to keep the coefficient values within the presentable limits. While discussing though, we present these values in their original form. The second aspect of impact evaluation is to examine the impact of mechanization on food security; the latter is represented as the log of household consumption. There are negative incomes for some of the households. In the case of net agricultural income, at least 10% of the households have negative income, and for total household income, at least 3% of households have negative income. Because of the negative values in income variables, we have not done any logarithmic transformation for these variables. For the consumption variables, though, the logarithmic transformation has been done, transforming the distribution into a near-normal one. The ESR model employed to examine this question produces the average treatment effect on treated (ATT) and the average treatment effect on untreated (ATU).

Table 7. ESR results of the adoption of tractor.
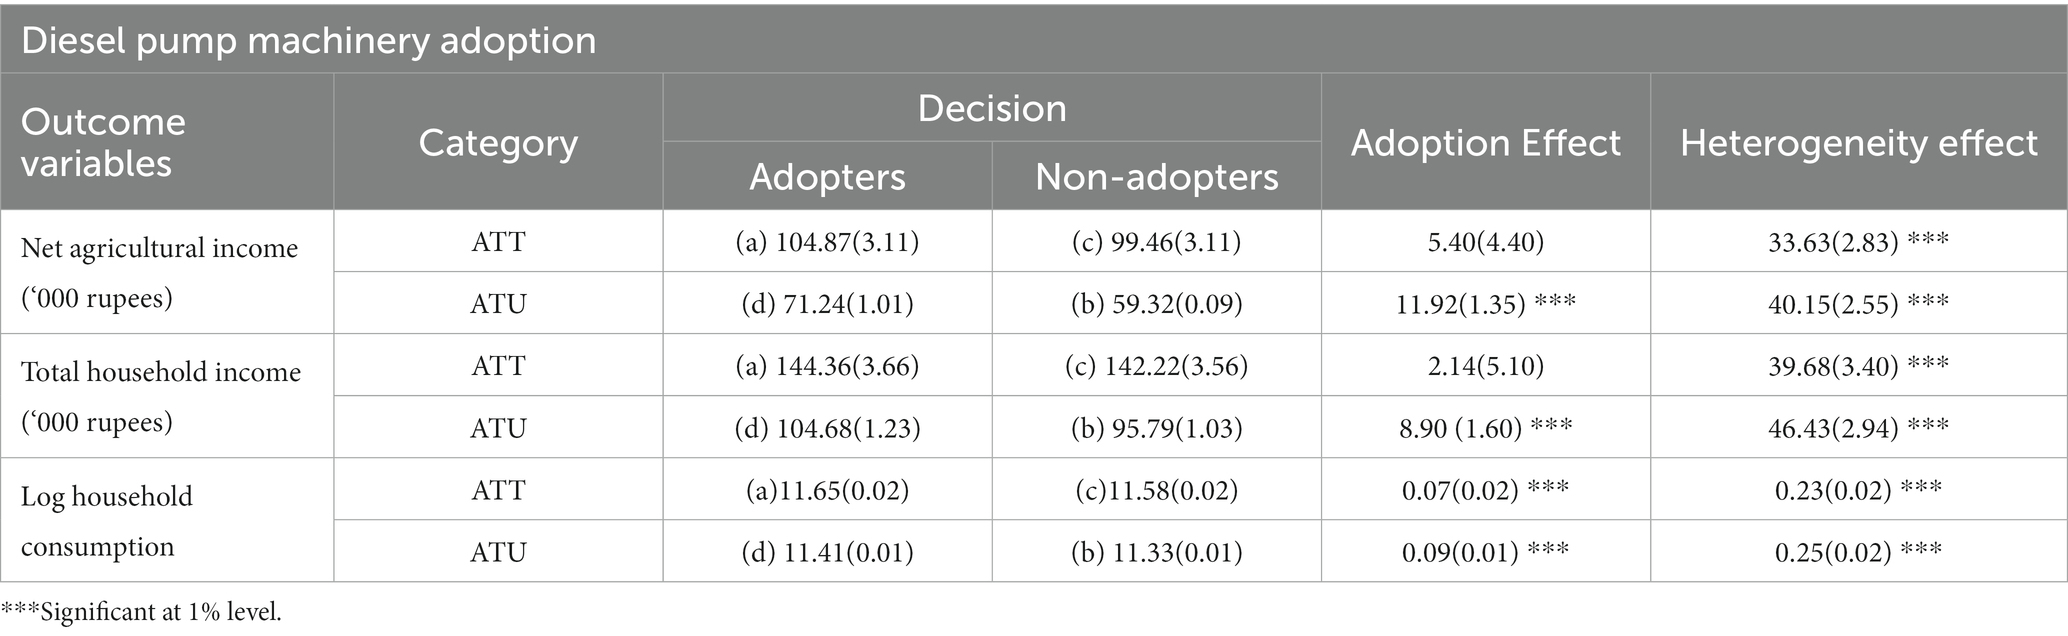
Table 8. ESR results of adoption of diesel pump.

Table 9. ESR results of adoption of electric pump.
The tilling machinery used examined in this paper are both 4-wheeler and 2-wheeler tractors. The impact of adopting these machines in agricultural production has been assessed on net agricultural income, total household income, and log consumption expenditure. The ATT and ATU results are displayed in Table 7. The ATT of tractor adoption on net agricultural income is positive and statistically significant at a 1% significance level. The impact is an increase in net agricultural income by USD 3,302.392, which is 31% higher for adopters than their counterfactual scenario of non-adoption. The ATU, which shows the average treatment effect on non-adopters had they decided to adopt, is also positive with an impact of USD 236.9 9, about 8%. This shows that if the non-adopters had chosen to adopt tractors, they would have gained 8% more net agricultural income.
The ATT for tractors with respect to total household income is positive and statistically significant at 1% level of significance, with an impact of USD 2,895.24 which shows that adopters have been better off using the machinery than the counterfactual scenario by 19%. Although we also find positive ATU, it turns out to be statistically insignificant. Such findings are not uncommon where ATT has statistical significance, but ATU does not (Jena et al., 2021). The consumption expenditure, which is considered the food security indicator, has also been enhanced due to machinery adoption. This can be observed from Table 7, as both the ATT and the ATU are positive and statistically significant at a 1% level of significance.
The second stage outcome regression results of ESR with respect to the adoption of tractors for net agricultural income, total household income, and household consumption are provided in Table 9. A perusal of the results reveals that family size is positively associated with higher incomes and consumption. A larger family can provide the required labor time in agricultural activities and, thus, reduce the hired labor cost. Since agricultural wages are on the rise in India, having adequate family labor can increase the net agricultural income. Crop insurance from the government is linked negatively to the income variables for non-adopters. This may be because the non-adopters who lost income due to crop loss have obtained insurance from the government, but the amount could be insufficient to overcome their loss.
The variable livestock has a positive effect on the outcome variables. Livestock is reared in the plain and hilly regions for milk and meat, which is a source of income. An increase in landholding and the proportion of irrigated land is found to have increased both the income and consumption variables for the adopters and non-adopters. Having a fixed deposit in the bank increases the adopters’ net agricultural income and consumption. Fixed savings may provide the households with the required avenue for investment in farming and may have contributed to higher farm incomes. Similarly, consumption expenditures are buoyed by having a sum of savings in the bank. On the other hand, bank credit tends to reduce the net household income of the non-adopters of the tractor. Experience of climatic shock and crop loss negatively impacts income and consumption for both the adopters and non-adopters, as both the variables have appeared with negative and statistically significant coefficients, which is in the expected lines.
The estimated ATT and ATU for the irrigation machinery, such as diesel and electric pumps, are reported in Tables 8, 9, respectively. The ATT for diesel pumps is positive but not statistically significant for agricultural and household income. However, the adopters have a positive edge over the non-adopters regarding the food security indicator. In the case of ATU, the non-adopters would have received USD 737.57 more agricultural income and USD 550.70 in total household income had they adopted the machine. Similarly, positive ATU is found for food security indicators as well.
The results in Table 9 show that the ATT of electric pump adoption on net agricultural income is positive with an impact size of USD 1254.87, meaning that the adopters are better off by this amount compared to a state of non-adoption of the machine. Similarly, the ATT on household income is USD 1115.64. A positive and statistically significant ATT is also found for the food security indicator. The ATU that reports the benefit of adoption by the non-adopters is positive for both net agricultural and household income. So, the overall findings from Tables 8, 9 suggest that irrigation machinery adoption has been beneficial for the adopters by increasing their incomes and consumption.
Table 11 presents the switching regression results for both the adopters and non-adopters of diesel pumps for net agricultural income, net household income, and household consumption. The household size is found to be positively influencing all three outcome variables of the adopters and the non-adopters alike. Seasonal migration seems to be reducing the net agricultural income of the adopters and the household income of the non-adopters of the diesel pump. A possible reason for this is that since the migrating households may primarily depend upon hired labor for farming activities, it will increase the cost of farming and reduce the margin of agricultural income. The variable, crop insurance from the private companies, shows a positive association with the net agricultural income of the non-adopters. The household asset variables, such as total land holding and percentage of irrigated land, positively associated with both the income and food security indicators for adopters and non-adopters alike. Fixed deposit savings in the bank also has a favorable effect on all three outcome variables. As expected, the experience of climatic shock reduces household income and worsens their food security condition.
The switching regression results for both the adopters and non-adopters of electric pumps are provided in Table 12. The findings are similar to what has been observed in Tables 10, 11, except that the households possessing the Kisan credit card are the ones that obtained higher net agricultural and total household income in Table 12. The mills’ ratio variables (mills 1 and mills2) are statistically significant in all the outcome regressions suggesting that there was, in fact, considerable selection bias due to unobservable factors. Hence, the use of the ESR model is justified. The state dummies are used in all the regressions to capture any state-specific time-invariant heterogeneity, such as differences in geographical terrains and socio-cultural habits. The coefficients of these dummy variables are shown in the Tables but are not discussed in the text.

Table 10. ESR estimates of adoption of tractor machinery on outcome variables.

Table 11. ESR estimates of adoption of diesel pump on outcome variables.

Table 12. ESR estimates of adoption of electric pump on outcome variables.
Although the experts have highlighted the role and significance of mechanization in the current sustainable agricultural production, there is limited research to understand the exact impacts of mechanization on agricultural income and food security in India. The current study taps a household survey conducted in all the states of India to examine the impact of agricultural mechanization on net agricultural income, household income, and food security represented by household consumption. The adoption rate of mechanized farming is still low, and its distribution is uneven in India. A higher percentage of machinery adoption is observed in the central plains and north-central regions. Since these region is situated in the Indo-Gangetic plains, they have large tracts of fertile land that may have induced the farmers in these states to adopt mechanization.
The findings from the adoption model show that access to credit through usual bank credit and kisan credit cards has increased the probability of adoption. Furthermore, plot-specific characteristics like access to irrigation facilities and land size positively affect the adoption of these types of machinery. Experience of climatic shocks and crop loss triggers positive adoption decisions because the farm mechanization helps farmers to adapt to climatic shocks. Being a member of a farmer cooperative was also found to be a determinant of adoption decisions in our study. This suggests that social capital has a positive influence on agricultural technology adoption.
The impact evaluation estimates show that the adoption of tilling implements such as tractor and power tiller have the biggest positive impact on net agricultural income, which is 31% higher compared to the non-adopters. Similarly, the impact on household income and consumption were in tune of 19 and 5%, respectively. Adoption of other machineries such as diesel and electric pumps too increased income and consumption for the adopters significantly.
Although the use of tractors in farming is mostly concentrated in the north and central plains of India, the smaller variants of the machine, such as power tillers, can be adopted in the upland regions. Much of agricultural research in the country by academic and non-academic research institutions and the extension efforts of the state government officials in the past decades were focused on promoting high-yielding and hybrid seeds and fertilizer and pesticide use. Little attention was paid to popularizing the adoption of small and medium-sized motorized equipment. There is a need to promote and make available smaller machines and equipment such as 2-wheeler tractors and power tillers in the fragmented landholding regions of East and North-east India. Recently, there has been a surge in small and medium-sized machines in south, east and north-eastern regions. The rental service of agricultural machines has supported this expansion in mechanization. However, there is a need to further deepen the mechanization drive in the Indian agricultural sectors. The prevalent view that mechanized farming suits only large landholding settings should change. More research should be devoted to developing scale-appropriate machines such as mini-tillers (5–9 horsepower) in small and fragmented landholding settings.
Appropriate policies that increase the likelihood of getting credit support from a government and a non-government organization, frequent extension contacts, improved farmers’ access to equipment and machinery at the right time and price, and infrastructural development like improved irrigation facilities could boost farm mechanization in the agricultural sector. Mechanization will accelerate if farmers can easily access or enrol in primary agricultural cooperative societies for loans, subsidies, and training.
The original contributions presented in the study are included in the article/Supplementary material, further inquiries can be directed to the corresponding author.
The studies involving human participants were reviewed and approved by National Institute of Technology Karnataka. The patients/participants provided their written informed consent to participate in this study.
PJ: study conception and design. PT: data collection. PJ and PT: analysis, interpretation of results, and draft manuscript preparation. All authors reviewed the results and approved the final version of the manuscript.
This study is funded by Scheme for Promotion of Academic Research and Collaboration (SPARC) project, Ministry of Education, Government of India (grant no. P-302).
The authors declare that the research was conducted in the absence of any commercial or financial relationships that could be construed as a potential conflict of interest.
All claims expressed in this article are solely those of the authors and do not necessarily represent those of their affiliated organizations, or those of the publisher, the editors and the reviewers. Any product that may be evaluated in this article, or claim that may be made by its manufacturer, is not guaranteed or endorsed by the publisher.
The Supplementary material for this article can be found online at: https://www.frontiersin.org/articles/10.3389/fsufs.2023.922038/full#supplementary-material
1. ^There are three levels of farm mechanization: non-mechanized farming, semi-mechanized farming, and fully mechanized farming (Ma et al., 2022). If the machines are not used at any stage of agricultural activities, it is called "no mechanization." Semi-mechanized farming refers to using machines at some stages of agricultural production. Full mechanization refers to using machines in every stage of agricultural activities (Zhou and Ma, 2022).
2. ^INR is converted to USD by using PPP exchange rate 16.161 of 2012.
Abid, M., Schneider, U. A., and Scheffran, J. (2016). Adaptation to climate change and its impacts on food productivity and crop income: perspectives of farmers in rural Pakistan. J. Rural. Stud. 47, 254–266. doi: 10.1016/j.jrurstud.2016.08.005
Adebayo, O., Bolarin, O., Oyewale, A., and Kehinde, O. (2018). Impact of irrigation technology use on crop yield, crop income and household food security in Nigeria: a treatment effect approach. AIMS Agric. Food 3, 154–171. doi: 10.3934/agrfood.2018.2.154
Adekunle, A., Osazuwa, P., and Raghavan, V. (2016). Socio-economic determinants of agricultural mechanisation in Africa: a research note based on cassava cultivation mechanisation. Technol. Forecast. Soc. Chang. 112, 313–319. doi: 10.1016/j.techfore.2016.09.003
Adu-Baffour, F., Daum, T., and Birner, R. (2019). Can small farms benefit from big companies’ initiatives to promote mechanization in Africa? A case study from Zambia. Food Policy 84, 133–145. doi: 10.1016/j.foodpol.2019.03.007
Akram, M. W., Akram, N., Wang, H., Andleeb, S., Ur Rehman, K., Kashif, U., et al. (2020). Socioeconomics determinants to adopt agricultural machinery for sustainable organic farming in Pakistan: a multinomial probit model. Sustainability 12:9806. doi: 10.3390/su12239806
Ali, A., Rahut, D. B., and Behera, B. (2016). Factors influencing farmers' adoption of energy-based water pumps and impacts on crop productivity and household income in Pakistan. Renew. Sust. Energ. Rev. 54, 48–57. doi: 10.1016/j.rser.2015.09.073
Aryal, J. P., Khatri-Chhetri, A., Sapkota, T. B., Rahut, D. B., and Erenstein, O. (2020). Adoption and economic impacts of laser land levelling in the irrigated rice-wheat system in Haryana, India using endogenous switching regression. Nat. Res. Forum 44, 255–273. doi: 10.1111/1477-8947.12197
Aryal, J. P., Maharjan, S., and Erenstein, O. (2019). Understanding factors associated with agricultural mechanization: a Bangladesh case. World Dev. Perspect. 13, 1–9. doi: 10.1016/j.wdp.2019.02.002
Aweke, M. (2013). Factors influencing adoption of improved maize varieties: the case of Goro-Gutu Woreda of Eastern Hararghe, Ethiopia (Doctoral dissertation). Haramaya, Ethiopia: Haramaya University.
Babatunde, R. O., Omotesho, O. A., Olorunsanya, E. O., and Owotoki, G. M. (2008). Determinants of vulnerability to food insecurity: a genderbased analysis of farming households in Nigeria. Indian J. Agric. Econ. 63, 1–10.
Becerril, J., and Abdulai, A. (2010). The impact of improved maize varieties on poverty in Mexico: a propensity score-matching approach. World Dev. 38, 1024–1035. doi: 10.1016/j.worlddev.2009.11.017
Benin, S. (2015). Impact of Ghana's agricultural mechanization services center program. Agric. Econ. 46, 103–117. doi: 10.1111/agec.12201
Biggs, S., and Justice, S. (2015). Rural and agricultural mechanization: a history of the spread of small Engines in Selected Asian Countries. Available at: http://csisa.org/wp-content/uploads/sites/2/2014/06/BiggsJusticeIFPRI_DP_01443.pdf
Chandio, A. A., Jiang, Y., Geese, A. T., and Dunay, R. (2019). The nexus of agricultural credit, farm size and technical efficiency in Sindh, Pakistan: a stochastic production frontier approach. J. Saudi Soc. Agric. Sci. 18, 348–354. doi: 10.1016/j.jssas.2017.11.001
Cunguara, B., and Darnhofer, I. (2011). Assessing the impact of improved agricultural technologies on household income in rural Mozambique. Food Policy 36, 378–390. doi: 10.1016/j.foodpol.2011.03.002
De Janvry, A., Macours, K., and Sadoulet, E (eds.). (2017). Learning for adopting: Technology adoption in developing country agriculture (Ferdi). 1–120. Available at: https://are.berkeley.edu/esadoulet/wp-content/uploads/2018/10/learning_for_adopting.pdf
Food and Agricultural Organization [FAO] . (1996). Rome declaration on world food security and world food. FAO, Rome, Italy
Feleke, S. T., Kilmer, R. L., and Gladwin, C. H. (2005). Determinants of food security in Southern Ethiopia at the household level. Agric. Econ. 33, 351–363. doi: 10.1111/j.1574-0864.2005.00074.x
Foster, A. D., and Rosenzweig, M. R. (2010). Microeconomics of technology adoption. Annu. Rev. Econ. 2, 395–424. doi: 10.1146/2Fannurev.economics.102308.124433
Godfray, H. C. J., Crute, I. R., Haddad, L., Lawrence, D., Muir, J. F., Nisbett, N., et al. (2010). The future of the global food system. Philos. Transact. R. Soc. B 365, 2769–2777. doi: 10.1098/rstb.2010.0180
Gollin, D., Morris, M., and Byerlee, D. (2005). Technology adoption in intensive post-green revolution systems. Am. J. Agric. Econ. 87, 1310–1316. doi: 10.1111/j.1467-8276.2005.00824.x
Gregory, P. J., and George, T. S. (2011). Feeding nine billion: the challenge to sustainable crop production. J. Exp. Bot. 62, 5233–5239. doi: 10.1093/jxb/err232
Hatibu, N. (2013). “Investing in agricultural mechanization for development in East Africa” in Mechanization for rural development: a review of patterns and progress from around the world. eds. J. Kienzle, J. Ashburner, and B. G. Sims, vol. 20 (Rome, Italy: Food and Agriculture Organization of the United Nations), 1–13.
Hayami, Y., and Ruttan, V. W. (1971). Agricultural development: an international perspective. Baltimore, Md/London: The Johns Hopkins Press.
Hayami, Y., and Ruttan, V. W. (1985). Agricultural development: an international perspective. Revised and Expanded version. Baltimore, Md/London: The Johns Hopkins Press
Iram, U., and Butt, M. S. (2004). Determinants of household food security: an empirical analysis for Pakistan. Int. J. Soc. Econ. 31, 753–766. doi: 10.1108/03068290410546011
Jack, B. Kelsey (2013) Market inefficiencies and the adoption of agricultural technologies in developing countries. White Paper. Agricultural Technology Adoption Initiative, JPAL (MIT) and CEGA (UC Berkeley). Available at: https://escholarship.org/uc/item/6m25r19c
Jaleta, M., Kassie, M., and Erenstein, O. (2015). Determinants of maize Stover utilization as feed, fuel and soil amendment in mixed crop-livestock systems, Ethiopia. Agric. Syst. 134, 17–23. doi: 10.1016/j.agsy.2014.08.010
Jaleta, M., Kassie, M., Tesfaye, K., Teklewold, T., Jena, P. R., Marenya, P., et al. (2016). Resource saving and productivity enhancing impacts of crop management innovation packages in Ethiopia. Agric. Econ. 47, 513–522. doi: 10.1111/agec.12251
Jena, P. R. (2019). Can minimum tillage enhance productivity? Evidence from smallholder farmers in Kenya. J. Clean. Prod. 218, 465–475. doi: 10.1016/j.jclepro.2019.01.278
Jena, P. R., Chichaibelu, B. B., Stellmacher, T., and Grote, U. (2012). The impact of coffee certification on small-scale producers’ livelihoods: a case study from the Jimma Zone, Ethiopia. Agric. Econ. 43, 429–440. doi: 10.1111/j.1574-0862.2012.00594
Jena, P. R., De Groote, H., Nayak, B. P., and Hittmeyer, A. (2021). Evolution of fertiliser use and its impact on maize productivity in Kenya: Evidence from multiple surveys. Food Security 13, 95–111. doi: 10.1007/s12571-020-01105-z
Jena, P. R., and Grote, U. (2017). Fairtrade certification and livelihood impacts on small-scale coffee producers in a tribal community of India. Appl. Econ. Perspect. Policy 39, 87–110. doi: 10.1093/aepp/ppw006
Jena, P. R., Stellmacher, T., and Grote, U. (2017). Can coffee certification schemes increase the incomes of smallholder farmers? Evidence from Jinotega, Nicaragua. Environ. Dev. Sustain. 19, 45–66. doi: 10.1007/s10668-015-9732-0
Jetté-Nantel, S., Hu, W., and Liu, Y. (2020). Economies of scale and mechanization in Chinese corn and wheat production. Appl. Econ. 52, 2751–2765. doi: 10.1080/00036846.2019.1696933
Kassie, M., Shiferaw, B., and Muricho, G. (2011). Agricultural technology, crop income, and poverty alleviation in Uganda. World Dev. 39, 1784–1795. doi: 10.1016/j.worlddev.2011.04.023
Ketema, M., Kebede, D., Dechassa, N., and Hundessa, F. (2016). Determinants of adoption of potato production technology package by smallholder farmers: evidences from Eastern Ethiopia. Rev. Agric. Appl. Econ. 19, 61–68. doi: 10.22004/ag.econ.254158
Kleemann, L., Abdulai, A., and Buss, M. (2014). Certification and access to export markets: adoption and return on investment of organic-certified pineapple farming in Ghana. World Dev. 64, 79–92. doi: 10.1016/j.worlddev.2014.05.005
Lemba, J.K. (2009). Intervention model for sustainable household food security in the drylands of Kenya: Case study of Makueni district. PhD thesis Ghent Ghent University
Liu, Z., Ying, H., Chen, M., Bai, J., Xue, Y., Yin, Y., et al. (2021). Optimization of China’s maize and soy production can ensure feed sufficiency at lower nitrogen and carbon footprints. Nat. Food 2, 426–433. doi: 10.1038/s43016-021-00300-1
Ma, W., Zhu, Z., and Zhou, X. (2022). Agricultural mechanization and cropland abandonment in rural China. Appl. Econ. Lett. 29, 526–533. doi: 10.1080/13504851.2021.1875113
Mallick, D., and Rafi, M. (2010). Are female-headed households more food insecure? Evidence from Bangladesh. World Develop. 38, 593–605. doi: 10.1016/j.worlddev.2009.11.004
Mottaleb, K. A., Krupnik, T. J., and Erenstein, O. (2016). Factors associated with small-scale agricultural machinery adoption in Bangladesh: census findings. J. Rural. Stud. 46, 155–168. doi: 10.1016/j.jrurstud.2016.06.012
NABARD (2021). Farmers’ Welfare in India: A state-wise analysis Department of Economic Analysis and Research, NABARD. Mumbai
Naresh, R. K., Singh, S. P., Misra, A. K., Tomar, S. S., Kumar, P., Kumar, V., et al. (2014). Evaluation of the laser leveled land leveling technology on crop yield and water use productivity in Western Uttar Pradesh. Afr. J. Agric. Res. 9, 473–478. doi: 10.1016/j.landusepol.2019.104113
Olmstead, A. L., and Rhode, P. (1993). Induced innovation in American Agiculture: a reconsideration. J. Polit. Econ. 101, 100–118. doi: 10.1086/261867
Paudel, G. P., Kc, D. B., Khanal, N. P., Justice, S. E., and McDonald, A. J. (2019a). Smallholder farmers' willingness to pay for scale-appropriate farm mechanization: evidence from the mid-hills of Nepal. Technol. Soc. 59:101196. doi: 10.1016/j.techsoc.2019.101196
Paudel, G. P., KC, D. B., Rahut, D. B., Justice, S. E., and McDonald, A. J. (2019b). Scale-appropriate mechanization impacts on productivity among smallholders: evidence from rice systems in the mid-hills of Nepal. Land Use Policy 85, 104–113. doi: 10.1016/j.landusepol.2019.03.030
Pingali, P. (2007). Agricultural mechanization: adoption patterns and economic impact. Handb. Agric. Econ. 3, 2779–2805. doi: 10.1016/S1574-0072(06)03054-4
Qing, Y., Chen, M., Sheng, Y., and Huang, J. (2019). Mechanization services, farm productivity and institutional innovation in China. China Agric. Econ. Rev. 11, 536–554. doi: 10.1108/CAER-12-2018-0244
Qiu, T., Choy, S. B., and Luo, B. (2022). Is small beautiful? Links between agricultural mechanization services and the productivity of different-sized farms. Appl. Econ. 54, 430–442. doi: 10.1080/00036846.2021.1963411
Rahman, M. S., Miah, M. M., and Hossain, S. (2011). Impact of farm mechanization on labour use for wheat cultivation in northern Bangladesh. J. Animal Plant Sci. 21, 589–594.
Ruttan, V. W. (2002). Productivity growth in world agriculture: sources and constraints. J. Econ. Perspect. 16, 161–184. doi: 10.1257/089533002320951028
Saliou, I. O., Zannou, A., Aoudji, A. K., and Honlonkou, A. N. (2020). Drivers of mechanization in cotton production in Benin, West Africa. Agriculture 10:549. doi: 10.3390/agriculture10110549
Sarkar, A. (2020). Agricultural mechanization in India: a study on the ownership and investment in farm machinery by cultivator households across agro-ecological regions. Millennial Asia 11, 160–186. doi: 10.1177/0976399620925440
Sims, B., and Kenzle, J. (2006). Farm power and mechanization for small farms in sub-Saharan Africa. Rome FAO
Takeshima, H., and Bhattarai, M. (2019). “Agricultural mechanization in Nepal—patterns, impacts, and enabling strategies for promotion” in Agricultural transformation in Nepal. eds. G. Thapa, A. Kumar, and P. Joshi (Singapore: Springer)
Teklewold, H., Kassie, M., Shiferaw, B., and Köhlin, G. (2013). Cropping system diversification, conservation tillage and modern seed adoption in Ethiopia: impacts on household income, agrochemical use and demand for labor. Ecol. Econ. 93, 85–93. doi: 10.1016/j.ecolecon.2013.05.002
Tilman, D., Cassman, K., Matson, P., Naylor, R., and Polasky, S. (2002). Agricultural sustainability and intensive production practices. Nature 418, 671–677. doi: 10.1038/nature01014
Tiwari, P. S., Singh, K. K., Sahni, R. K., and Kumar, V. (2019). Farm mechanization–trends and policy for its promotion in India. Indian J. Agric. Sci. 89, 1555–1562. doi: 10.56093/ijas.v89i10.94575
Vortia, P., Nasrin, M., Bipasha, S. K., and Islam, M. M. (2021). Extent of farm mechanization and technical efficiency of rice production in some selected areas of Bangladesh. Geo J. 86, 729–742. doi: 10.1007/s10708-019-10095-1
Wang, J., Chen, K. Z., Das Gupta, S., and Huang, Z. (2015). Is small still beautiful? A comparative study of rice farm size and productivity in China and India. China Agric. Econ. Rev. 7, 484–509. doi: 10.1108/CAER-01-2015-0005
Wooldridge, J.M. , (2002). Econometric analysis of cross section and panel data. The MTP Press, London
Wossen, T., Abdoulaye, T., Alene, A., Haile, M. G., Feleke, S., Olanrewaju, A., et al. (2017). Impacts of extension access and cooperative membership on technology adoption and household welfare. J. Rural. Stud. 54, 223–233. doi: 10.1016/j.jrurstud.2017.06.022
Yan, L., Yin-He, S., Qian, Y., Zhi-Yu, S., Chun-Zi, W., and Zi-Yun, L. (2021). Method of reaching consensus on probability of food safety based on the integration of finite credible data on block chain. IEEE access 9, 123764–123776. doi: 10.1109/ACCESS.2021.3108178
Zhou, X., and Ma, W. (2022). Agricultural mechanization and land productivity in China. Int. J. Sustain. Develop. World Ecol. 29, 530–542. doi: 10.1080/13504509.2022.2051638
Keywords: agricultural mechanization, farm income, impact evaluation, endogenous switching regression, food security
Citation: Jena PR and Tanti PC (2023) Effect of farm machinery adoption on household income and food security: evidence from a nationwide household survey in India. Front. Sustain. Food Syst. 7:922038. doi: 10.3389/fsufs.2023.922038
Edited by:
Erhan Akça, Adiyaman University, TürkiyeReviewed by:
Le Yu, Renmin University of China, ChinaCopyright © 2023 Jena and Tanti. This is an open-access article distributed under the terms of the Creative Commons Attribution License (CC BY). The use, distribution or reproduction in other forums is permitted, provided the original author(s) and the copyright owner(s) are credited and that the original publication in this journal is cited, in accordance with accepted academic practice. No use, distribution or reproduction is permitted which does not comply with these terms.
*Correspondence: Pradyot Ranjan Jena, anByYWR5b3RAZ21haWwuY29t
Disclaimer: All claims expressed in this article are solely those of the authors and do not necessarily represent those of their affiliated organizations, or those of the publisher, the editors and the reviewers. Any product that may be evaluated in this article or claim that may be made by its manufacturer is not guaranteed or endorsed by the publisher.
Research integrity at Frontiers
Learn more about the work of our research integrity team to safeguard the quality of each article we publish.