 Jia He1
 Duan Ran
- 1School of Public Administration and Policy, Renmin University of China, Beijing, China
- 2School of Art and Design, Wuhan University of Technology, Wuhan, Hubei, China
- 3Hubei Geological Survey, Wuhan, China
This study investigates the 40-year spatiotemporal evolution of cropland in Northeast China’s black soil region at the county scale. Utilizing land use/cover maps from 1980 to 2020 with a 30 m × 30 m resolution, we employed various analytical methods, including mathematical statistics, GIS spatial analysis, land use transition matrix, landscape pattern analysis, and hotspot analysis. The findings of this study are as follows: (1) Cropland area expanded by 51,976.76 km2 from 1980 to 2020, mainly concentrated in the Sanjiang Plain, Songnen Plain, and Liaohe Plain. Notably, areas near prefecture-level city locations experienced a decrease in cropland, while regions farther from cities witnessed an increase. (2) Cropland primarily transitioned from woodland, grassland, and unused land to cropland, covering substantial areas. Conversely, cropland was converted mainly into woodland, built-up land, and grassland. (3) Over the same period, cropland in the region exhibited increased elevation and slope, with average altitude rising by 2.06 m and average slope increasing by 0.0369 degrees. (4) The study revealed an increase in cropland proportion, predominance, and aggregation, alongside more irregular shapes and reduced subdivision. These findings highlight significant changes in the cropland landscape in Northeast China’s black soil region and offer insights for policy recommendations and land management strategies. The research findings of this paper can offer valuable insights for the protection and utilization of cropland in the region. They can provide scientific references for the formulation of policies related to China’s food security.
1 Introduction
Research on land use change is a crucial aspect of global change studies and remains a prominent area of investigation (Turner et al., 1995; Liu et al., 2003; Ning et al., 2018; Chen et al., 2021). Among the various facets of land use change, the study of cropland change holds particular significance, because grain needs to be produced from cropland (Guo et al., 2023). Cropland is the most basic natural resource, which is a basic necessity for human survival, and the Chinese government is always focused on protecting cropland (Lichtenberg and Ding, 2008; Zhou et al., 2021). With the development of industrialization and urbanization, many problems arise, such as a large amount of cropland converted to non-agricultural land, non-grain production on cropland, decrease in quality of cropland, subdivision of cropland, soil pollution, and other problems (Deng et al., 2011; Yu et al., 2018; Liu et al., 2019; Qiu M. et al., 2020; Qiu B. et al., 2020; Chen et al., 2021, 2022; Wang et al., 2021; Guo et al., 2022; Ran et al., 2022). The black soil region of Northeast China as the third largest black soil region in the world is very important for China’s food security, and the Outline of the Northeast Blackland Conservation Plan (2017–2030) shows its grain production accounts for 1/4 of the country, grain commodity volume accounts for 1/4 of the country, and grain transfer accounts for 1/3 of the country. To protect the black soil in the black soil region of Northeast China, the Black Soil Protection Law of the People’s Republic of China was adopted after a vote at the closing meeting of the 35th standing committee session of the 13th National People’s Congress on June 24, 2022. The law take effect on Aug. 1, 2022. Therefore, it is important to study the spatiotemporal changes of cropland in the black soil area of northeast China for the protection of cropland in this region.
The cropland changes study’s contents include the process characteristics, the spatiotemporal heterogeneity and intensity, different modes, and driving mechanisms of the cropland expansion (Pendrill and Persson, 2017; Zhang et al., 2017; Ma et al., 2019; Cai et al., 2021; Chen et al., 2022; Wang et al., 2022), and cropland use efficiency (Zhou et al., 2022), and cropland land multifunction assessment (Jiang et al., 2020; Li et al., 2023), cultivated land use protection pressure (Chen et al., 2017), cultivated land quality evaluation (Wang et al., 2012; Shi et al., 2020; Song et al., 2022), and etc. From the impact of cropland change. Some scholars studied the impacts of cropland expansion on carbon storage (Tang et al., 2020; Huang et al., 2022), forests (Ngoma et al., 2021), grassland (Pool et al., 2014; Wimberly et al., 2017), ecosystem services (Lu et al., 2017), water quantity and quality (Fitton et al., 2019; Hu et al., 2019), agricultural pests (Zhao et al., 2015), surface air temperature (Xiong, 2015), soil erosion (Mancino et al., 2016), climate change (Abera et al., 2020), biodiversity conservation (Moraes et al., 2017), and etc. From the causes of the change in cropland. Andrade de Sá et al. found that agriculture competes with forests for land in Brazil (Andrade de Sá et al., 2013). Wang et al. found that more than 80% of total cultivated land consumption in Shanghai, Tianjin, and Beijing is satisfied by other provinces (Wang et al., 2021). Xi et al. found that land occupied by rural settlements/residential land resulted in the loss of cultivated land (Xi et al., 2012). Radwan et al. found that cities expansion led to the large decrease in the cultivated land (Radwan et al., 2019). From the study scale, including global, national, provincial, county, basin, and etc. Hu et al. found that China was the only country which experienced cropland decrease on Global the cropland expansion based on GlobeLand 30 (Hu et al., 2020). Liu et al. found that croplands were the primary contributor to urban expansion with a sample of 75 cities in China (Liu et al., 2019). Wang et al. found that large areas of cropland expansion were mainly clustered in the middle of this area in the Yangtze River Economic Belt (Wang et al., 2022). Wang et al. found that croplands were the primary contributor to urban expansion in Shandong Province (Wang et al., 2021). Meng et al. found that croplands were the primary contributor to urban expansion in Chengdu (Meng et al., 2022). Xiong et al. found that cultivated land area increased originally and subsequently decreased from 2000 to 2020 in Qishan County, China (Xiong et al., 2022). From the cropland protection policy, some scholars studied the role of the requisition–compensation balance of farmland (Song and Pijanowski, 2014; Shen et al., 2017; Wu et al., 2017), basic farmland protection system (Wu et al., 2017), and linking the increase in urban construction land with a decrease in rural construction land (Liu et al., 2019) on quality of cropland protection were minimally, and the policy evolution of cultivated land use (Wang et al., 2018), land use and rural transformation (You et al., 2018).
This paper addresses these shortcomings by conducting a comprehensive analysis, using nearly four decades of land use/cover maps from 1980 to 2020 with a 30 m × 30 m resolution. The study employs various analytical methods, such as mathematical statistics, GIS spatial analysis, land use transition matrix, landscape pattern analysis, and hotspot analysis, to systematically and thoroughly examine the spatiotemporal evolutionary characteristics of cropland quantity, spatial distribution, conversion patterns, altitude, slope, and landscape pattern within Northeast China’s black soil region at the county scale. The research findings of this study can offer scientific references for the protection of arable land in the Northeast Black Soil Region. Additionally, they can serve as scientific references for the national food security policies targeted at this region.
2 Materials and methods
2.1 Study area
The black soil of northeast China is one of the four largest black soil areas in the world and is mainly located in Northeast China in Heilongjiang Province, Jilin Province, Liaoning Province, and Inner Mongolia’s four eastern leagues (Figure 1). The black soil area of northeast China covers 1.09 million km2, accounting for 12% of the total global black soil area, and its total grain production accounts for a quarter of the country. “Black Soil Protection Law of the People’s Republic of China” was adopted to protect the black soil of northeast China. Therefore, it is important to explore the spatial and temporal characteristics of cropland in the black soil area of northeast China for the conservation of the black soil area.
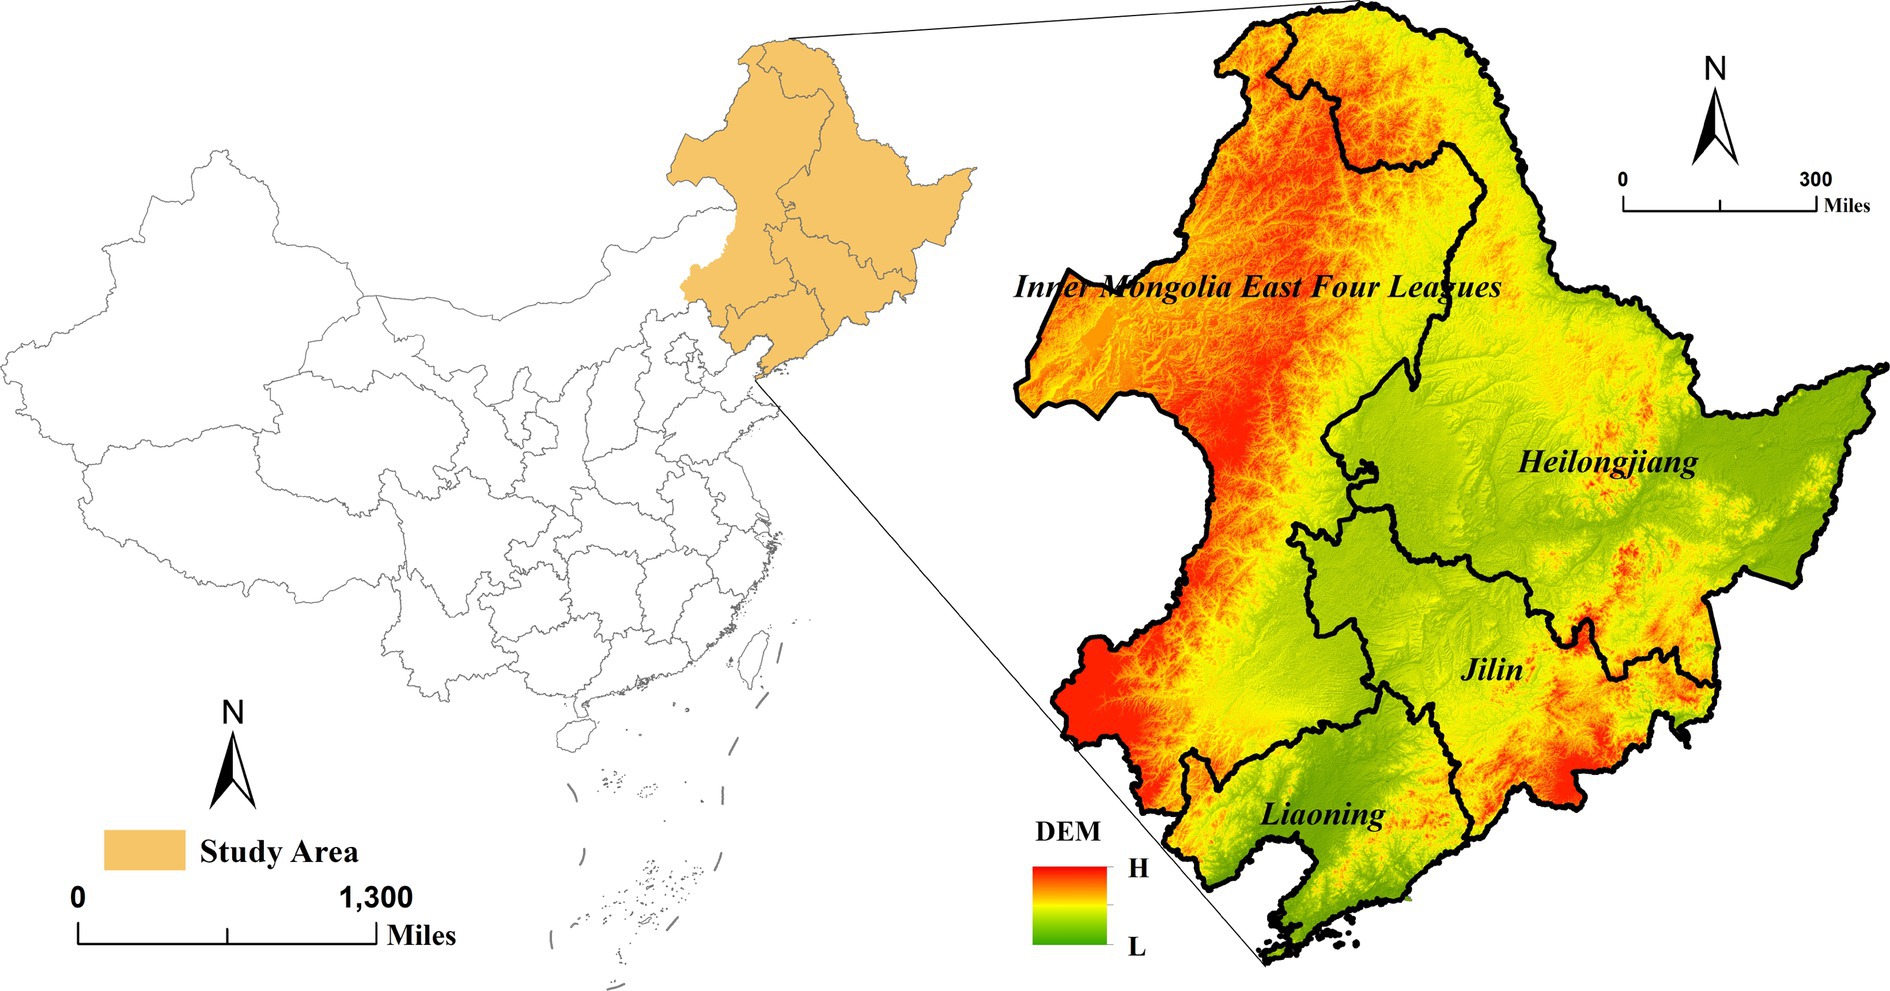
Figure 1. Location of the study area.
2.2 Data sources
The data were collected from the following sources: (1) land use/cover maps data include six land use/cover types as follows, cropland, woodland, grassland, water body, built-up land, unused land in 1980, 1990, 1995, 2000, 2005, 2010, 2015, and 2020, with a cell size of 30 m × 30 m, from the Resource and Environmental Sciences and Data Center, Chinese Academy of Sciences (1accessed on 5 June 2022); (2) Altitude, slope data from OpenTopography, with a cell size of 30 m × 30 m (2accessed on20 November 2022); (3) administrative boundary data from the National Basic Geographic Information Center (3accessed on 5 June 2022).
2.3 Methods
To understand the spatiotemporal evolution characteristics of cropland in the Northeast Black Soil Region, the transformation features between cropland and other land use types, the variations in cropland with respect to altitude and slope, as well as the landscape pattern characteristics of cropland under human influence, various tools and analyses can be employed.
A land use matrix can provide insights into the transformation features between cropland and other land use types. Zonal statistics as table can be applied to comprehend the characteristics of cropland changes with respect to altitude and slope. Landscape pattern indices can reveal the features of cropland landscape patterns under human influence. Hotspot analysis tools can be utilized to understand the changing characteristics of the aforementioned features. The above methods can provide us with a comprehensive understanding of the characteristics of cropland changes in the Northeast Black Soil Region.
2.3.1 Land use transition matrix
The land use matrix, which defines the transition among various land use types at the beginning and end of a period of time, is crucial for analyzing the change in land types in a region (Shi et al., 2018; Zhu et al., 2021). The Equation 1 is as follows (Zhang et al., 2023):
where L represents the area, Lij indicates the area in transition from landscape i to j at the beginning and end of a period of time.
2.3.2 Zonal statistics as table (spatial analyst)
Summarizes the values of a raster within the zones of another dataset and reports the results as a table. We used this tool to calculate the change in altitude and slope of cropland in a region. Please refer to Arc Gis 10.8 software for the details of the zonal statistics as table tool.
2.3.3 Analysis of cropland using landscape metrics
Landscape metrics are frequently used methods for quantitatively describing regional landscape pattern changes. We analyzed the spatial variation characteristics of cropland in the black soil area of northeast China in five dimensions: landscape proportion, landscape shape, landscape predominance, landscape subdivision, and landscape aggregation (Li et al., 2005; Zhang et al., 2016; Dadashpoor et al., 2019; Yin et al., 2022). Therefore, five class-level metrics were chosen to reflect these spatial characteristics of cropland landscape patterns, including percentage of landscape (PLAND), landscape shape index (LSI), largest patch index (LPI), landscape division index (DIVISION), and clumpiness index (CLUMPY). Table 1 contains a list of each of the chosen landscape metrics, and landscape metrics were calculated in Fragstats4.2.1 (University of Massachusetts in Amherst, Amherst, MA, United States) (McGarigal and Marks, 1995). Please refer to Fragstats4.2.1 software for more details on the five metrics.
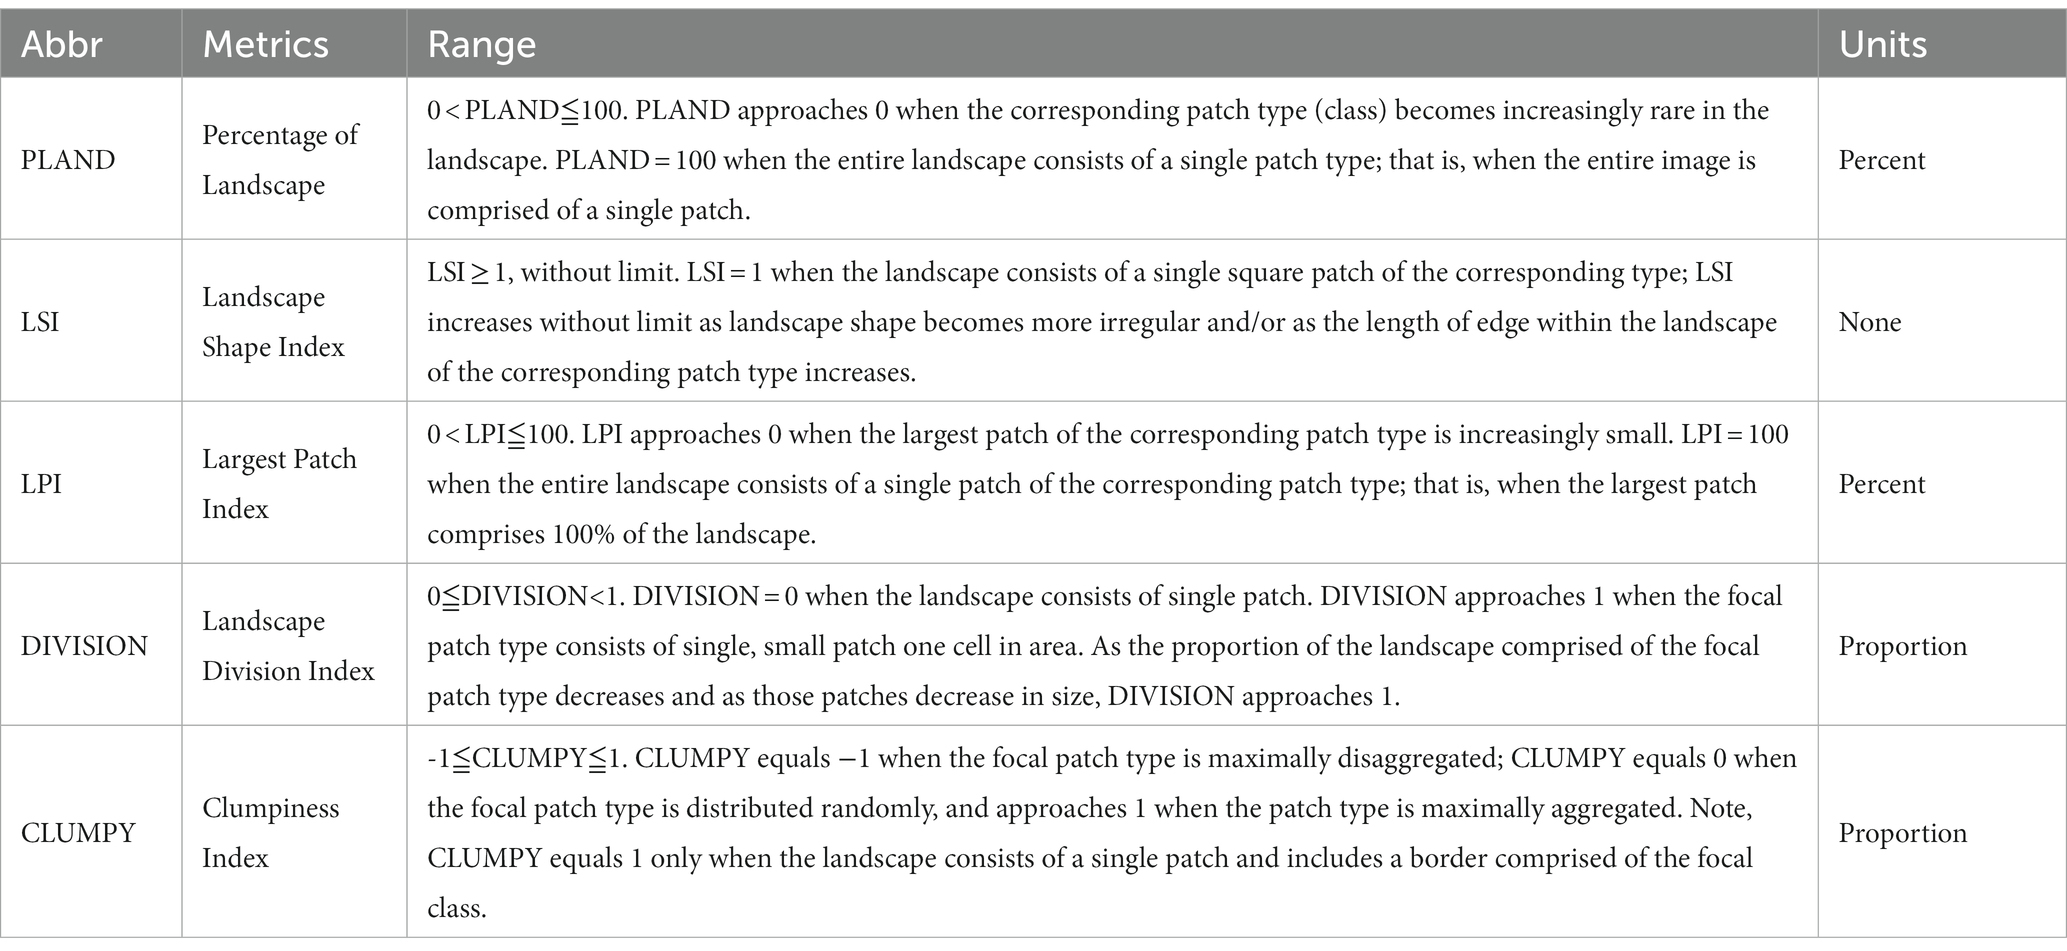
Table 1. The landscape metrics selected in this study.
2.3.4 Hot spot analysis
The hot spot analysis tool identifies statistically significant spatial clusters of high values (hot spots) and low values (cold spots) (Tran et al., 2017; Singh et al., 2021; Zhou et al., 2023). we used this tool to analyze the hot and cold spot distribution characteristics of statistical significance in the changes in PLAND, LSI, LPI, DIVISION, and CLUMPY of cropland. Please refer to Arc Gis 10.8 software for the details of the hot spot analysis tool.
3 Results
3.1 Spatiotemporal characteristics of cropland
3.1.1 Spatial distribution of cropland
Figure 2 shows the spatial distribution of cropland in 1980 and 2020. From the geographical distribution, cropland in the black soil region of northeast China was mainly located in Sanjiang Plain, Songnen Plain, and Liaohe Plain in 1980 and 2020.
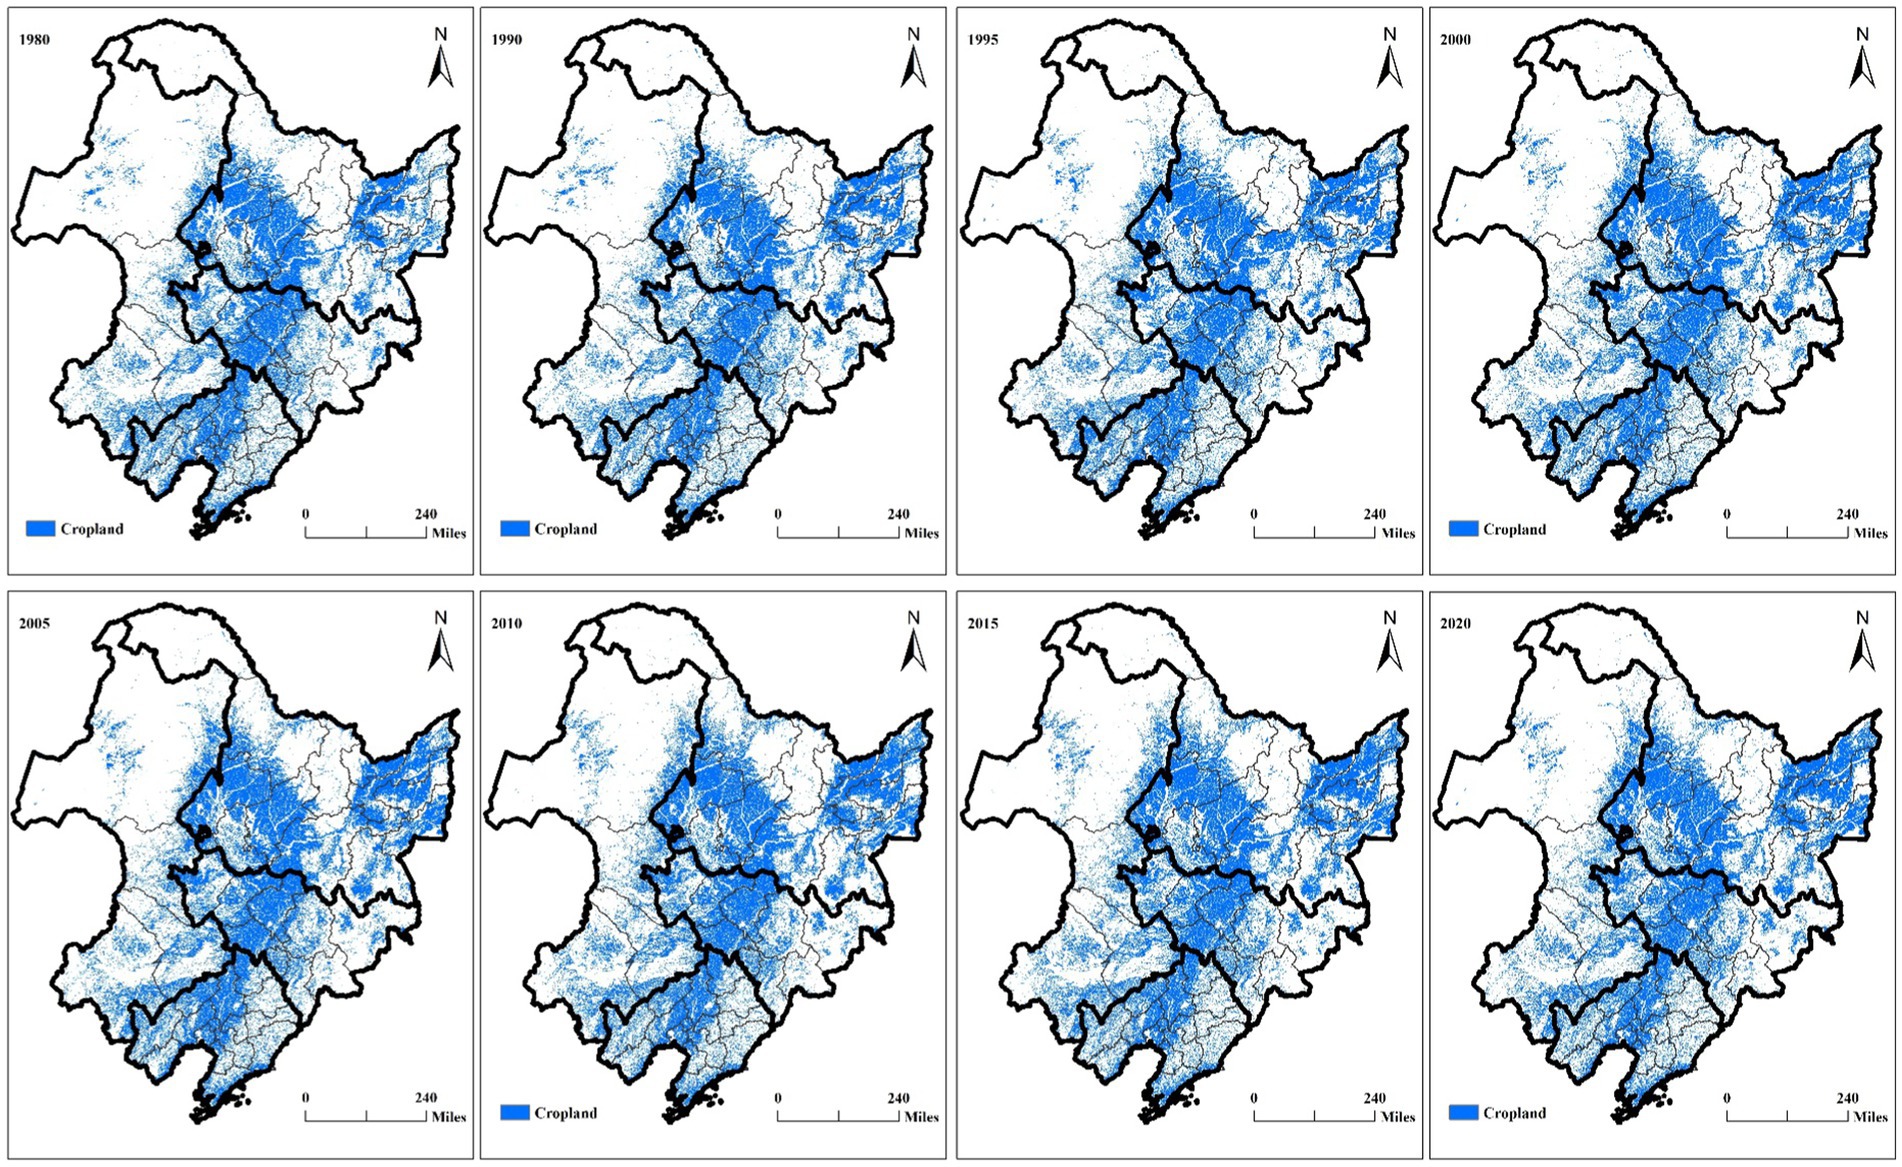
Figure 2. Spatial distribution of cropland. The thick black line is the provincial boundary (Including the four eastern leagues of Inner Mongolia), and the thin black line is the prefecture-level city boundary.
From the administrative distribution, cropland in the black soil region of northeast China in 2020 was predominantly located in areas including Qiqihar, Suihua, Daqing, Jiamusi, Shuangyashan, Qitaihe, Jixi, east-central Hegang, and west-central and north Harbin of Heilongjiang Province, Changchun, Siping, Songyuan, Baicheng, and Liaoyuan of Jilin Province, North-central Tieling, Shenyang, Jinzhou, Panjin, Dalian, west-central Liaoyang and northwestern Yingkou of Liaoning Province, and the regions of Inner Mongolia East Four Leagues neared Heilongjiang Province, Jilin Province, and Liaoning Province. From 1980 to 2020, the increase in cropland in the Sanjiang Plain of Heilongjiang Province and the regions of Hulunbuir, Inner Mongolia neared Heilongjiang Province were very significant.
3.1.2 Spatiotemporal characteristics of cropland change
Figure 3 and Table 2 show the cropland area, change value, and change ratio in the black soil area of northeast China from 1980 to 2020. During 1980–2020, Changes in cropland area in the black soil region of northeast China showed an increasing trend, the cropland area increased from 319,480.75 km2 to 371,457.51 km2, the change value was 51,976.76km2, and the change ratio was 16.27%. By study period, the value and ratio of change of 1980–1990, 1990–1995, 1995–2000, 2000–2005, 2005–2010, and 2010–2015 showed an increasing trend, and the value and ratio of change of 2015–2020 showed a decreasing trend. The order of the size of the changes in the values and ratios of cropland area in each study period is as follows: 1990–1995 (22063.20 km2, 6.57%), 1980–1990 (16377.12 km2, 5.13%), 1995–2000 (12088.53 km2, 3.38%), 2015–2020 (−2202.73 km2, −0.59%), 2000–2005 (1706.38 km2, 0.46%), 2005–2010 (1137.60 km2, 0.31%), 2010–2015 (806.66 km2, 0.22%). The value and ratio of change of cropland in the black soil area of northeast China in the first three study periods were significantly higher than those in the last four study periods. The value and ratio of change of cropland land in the black soil area of northeast China showed a decreasing trend in each study period, except for 1980–1990.
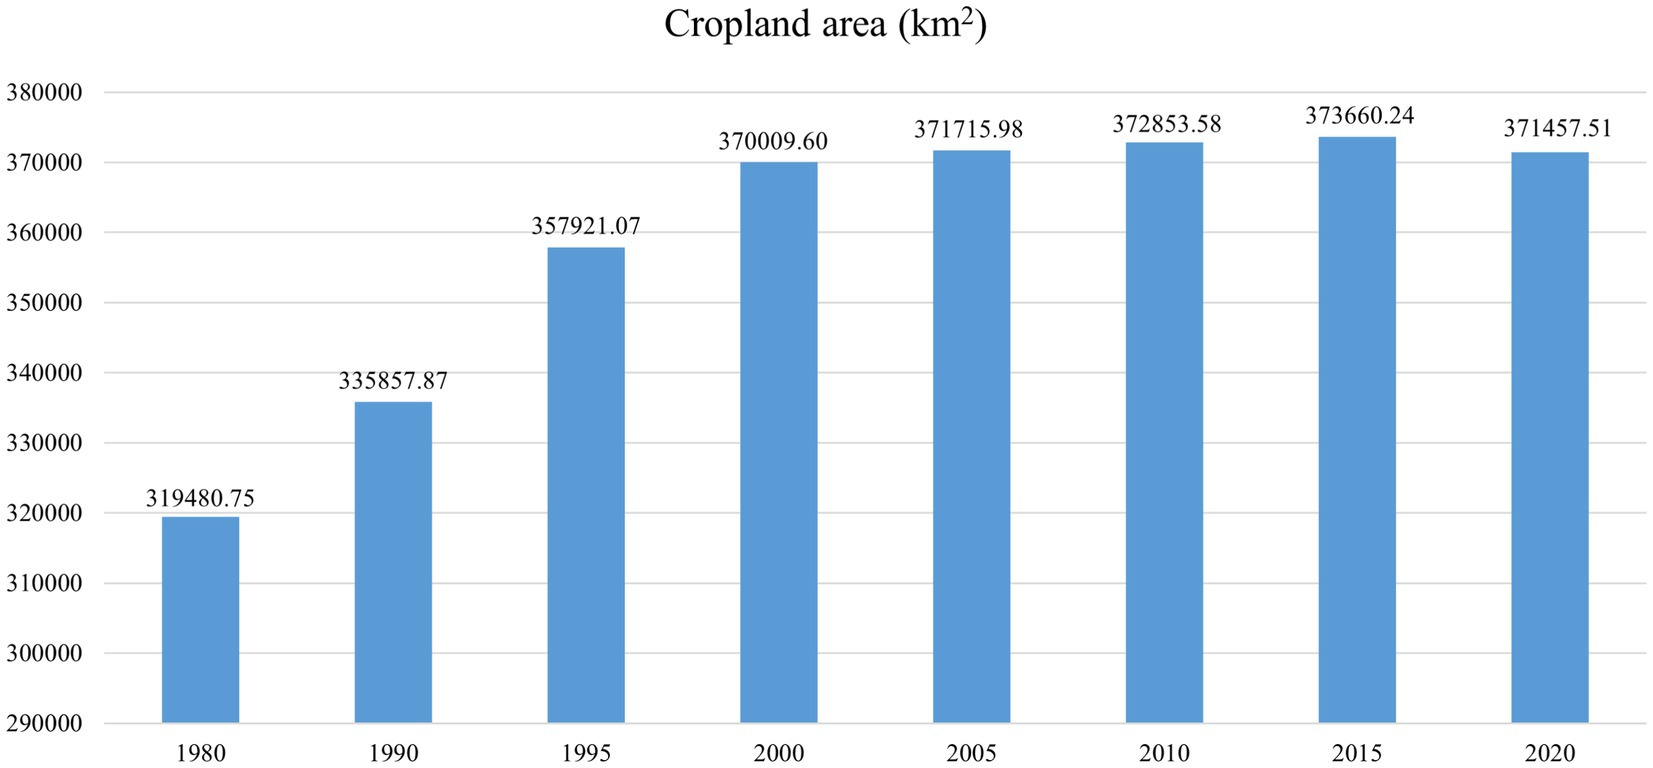
Figure 3. The trend of cropland area during 1980–2020.
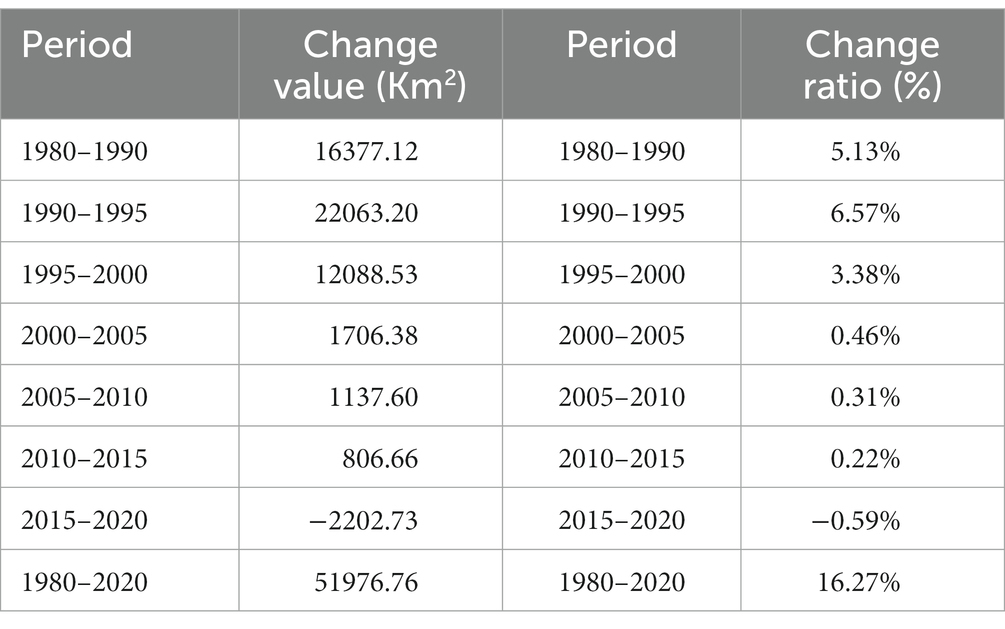
Table 2. Cropland change during 1980–2020.
Figure 4 displays the spatial distribution of changes in cropland amounts, featuring three types of information: increase (in red), decrease (in green), and change values. In the first step, changes in cropland area were categorized into two groups based on whether they increased or decreased. In the second step, the values of all periods that had been classified were categorized into five categories using the natural breakpoint method.
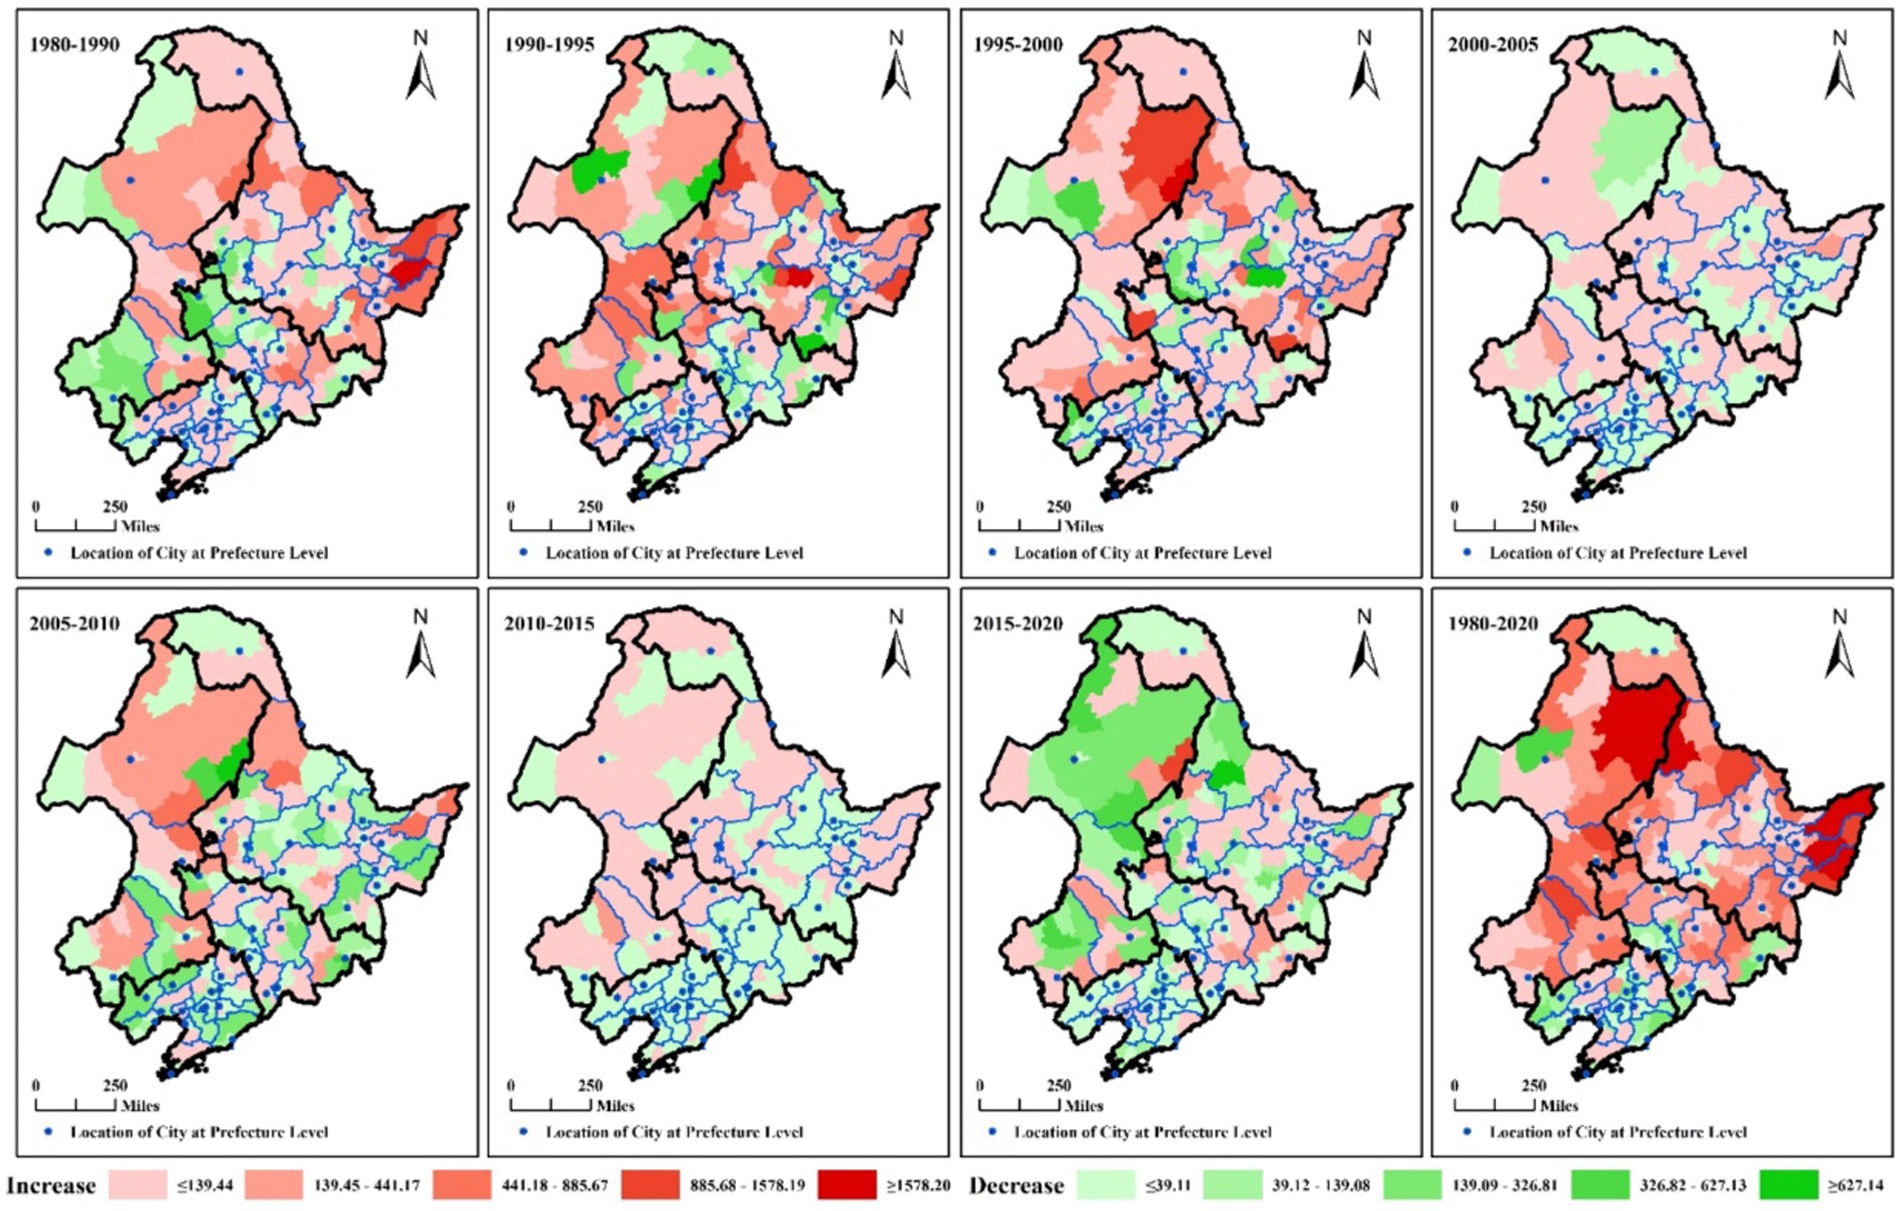
Figure 4. Spatial distribution of cropland area change values (Unit: km2). Note: The thick black line is the provincial boundary (Including the four eastern leagues of Inner Mongolia) (The same as below), and the thin blue line is the prefecture-level city boundary (The same as below), red indicates an increase in the value of cropland change, and red indicates a decrease in the value of cropland change.
Based on the trends in cropland change values from 1980 to 2020, Figure 4 (1980–2020) displays the locations of prefecture-level city locations and their surrounding areas where cropland change values exhibited either a decreasing trend or a non-significant increasing trend. Notably, areas with an increasing trend in cropland change values were situated at a considerable distance from the prefecture-level city locations. Prefecture-level cities experiencing an increasing trend in the value of cropland area change were primarily concentrated in Heilongjiang Province, the four eastern leagues of Inner Mongolia, and Jilin Province. In contrast, prefecture-level cities with a decreasing trend in the value of cropland area change were mainly found in Liaoning Province and certain parts of Jilin Province. Additionally, Figure 4 (1980–2020) identifies regions with a significant increasing trend in the value of cropland change (≥441.18 km2). These regions were primarily located in the Sanjiang Plain, Heihe, Harbin, Qiqihar, Heilongjiang Province, as well as in the northwest and southeast of Tongliao, the east of Chifeng, and east-central Hulunbuir in Inner Mongolia. Similar trends extended to Baicheng in Jilin Province, Yanbian Korean Autonomous Prefecture in Jilin Province, and other areas. Conversely, regions with a decreasing trend in the value of cropland change were mainly concentrated in Siping, Jilin Province, as well as in Chaoyang, Huludao, Dandong, Shenyang, and other areas in Liaoning Province.
The trend of spatial movement of the regions with a high increase in the change in the value of cropland area (≥441.18km2) was from the east (Figure 4, 1980–1990) to the west (Figure 4, 1990–1995) and then to the north (Figure 4, 1995–2000). Figure 4 (1980–1990, 1990–1995, 1995–2000) show the regions with a high increase in the change in the value of cropland area (≥441.18km2) were mainly located in the Sanjiang Plain, Heihe, Heilongjiang Province, and Jilin, Jilin Province (Figure 4, 1980–1990), and the regions with a high increase in the change in the value of cropland area (≥441.18km2) were mainly located in Xing’an League and Tongliao City in Inner Mongolia, Daqing, Harbin, Heihe, Suihua, and Hegang in Heilongjiang Province, Baicheng and Songyuan in Jilin Province, etc. (Figure 4, 1990–1995), and the regions with a high increase in the change in the value of cropland area (≥441.18km2) were mainly located in Hulunbeier East Region, Inner Mongolia, and Heihe, Heilongjiang Province (Figure 4, 1995–2000). Figure 4 (2000–2005) shows the change value of cropland was not significant.
Figure 4 (2005–2010, 2010–2015, 2015–2020) show that there were more areas with a decreasing trend in the value of cropland change. This includes the number of regions and the size of change values.
The regions with a decreasing trend in the change in the value of cropland area were mainly located in Chaoyang, Huludao, Fuxin, Shenyang, Tonghua, and most other regions in Liaoning Province, as well as Tongliao, Chifeng, and other regions in Inner Mongolia, Baicheng, Siping, Jilin, and other regions in Jilin Province, and Suihua, Qiqihar, Harbin, Yichun, Shuangyashan, and other regions in Heilongjiang Province. During the period of 2010–2015, these regions were mainly located in central Heilongjiang Province, central and southeastern Jilin Province, and Liaoning Province, as depicted in Figure 4. For the years 2015–2020, the regions with a decreasing trend in the change in the value of cropland area were mainly located in Inner Mongolia East Four League, and Heihe, Harbin, Qiqihar, Daqing, Heilongjiang Province, Baicheng, Songyuan, Jilin Province, and Liaoning Province, as shown in Figure 4.
3.2 Spatiotemporal characteristics of cropland conversion
Table 3, covering the period from 1980 to 2020, provides insights into cropland transformations. During this period, cropland was primarily converted into woodland, built-up land, and grassland, spanning areas of 11,906.62 km2, 10,809.33 km2, and 6,406.81 km2, respectively. The corresponding percentages were 35.13, 31.89, and 18.90%. Conversely, cropland was primarily derived from woodland, grassland, and unused land, with areas of 32,230.00 km2, 31,945.30 km2, and 15,421.20 km2, representing proportions of 37.53, 37.19, and 17.96%. Within Table 3, specific periods reveal further details of cropland conversion and derivation. Cropland was converted into woodland, covering 20,495.97 km2 (2005–2010), 15,146.69 km2 (2015–2020), 9,833.13 km2 (1990–1995), and 9,829.29 km2 (1995–2000). Cropland was converted into grassland, spanning 17,304.61 km2 (2015–2020), 16,381.82 km2 (2005–2010), 11,026.61 km2 (1990–1995), and 8,253.09 km2 (1980–1990). Additionally, cropland was converted into built-up land, with areas of 9,652.68 km2 (2005–2010), 6,017.78 km2 (2015–2020), 1,787.50 km2 (1990–1995), and 1,667.18 km2 (1980–1990). Table 3 also illustrates that cropland was derived from woodland, covering 22,655.57 km2 (2005–2010), 17,328.72 km2 (1990–1995), 14,519.07 km2 (1995–2000), and 13,772.18 km2 (2015–2020). Similarly, cropland was derived from grassland, with areas of 21,850.91 km2 (1990–1995), 19,691.74 km2 (2005–2010), 15,649.51 km2 (2015–2020), and 15,320.24 km2 (1980–1990). Finally, cropland was derived from unused land, covering 8,395.56 km2 (2015–2020), 7,776.65 km2 (2005–2010), 6,651.40 km2 (1990–1995), and 6,642.35 km2 (1980–1990).
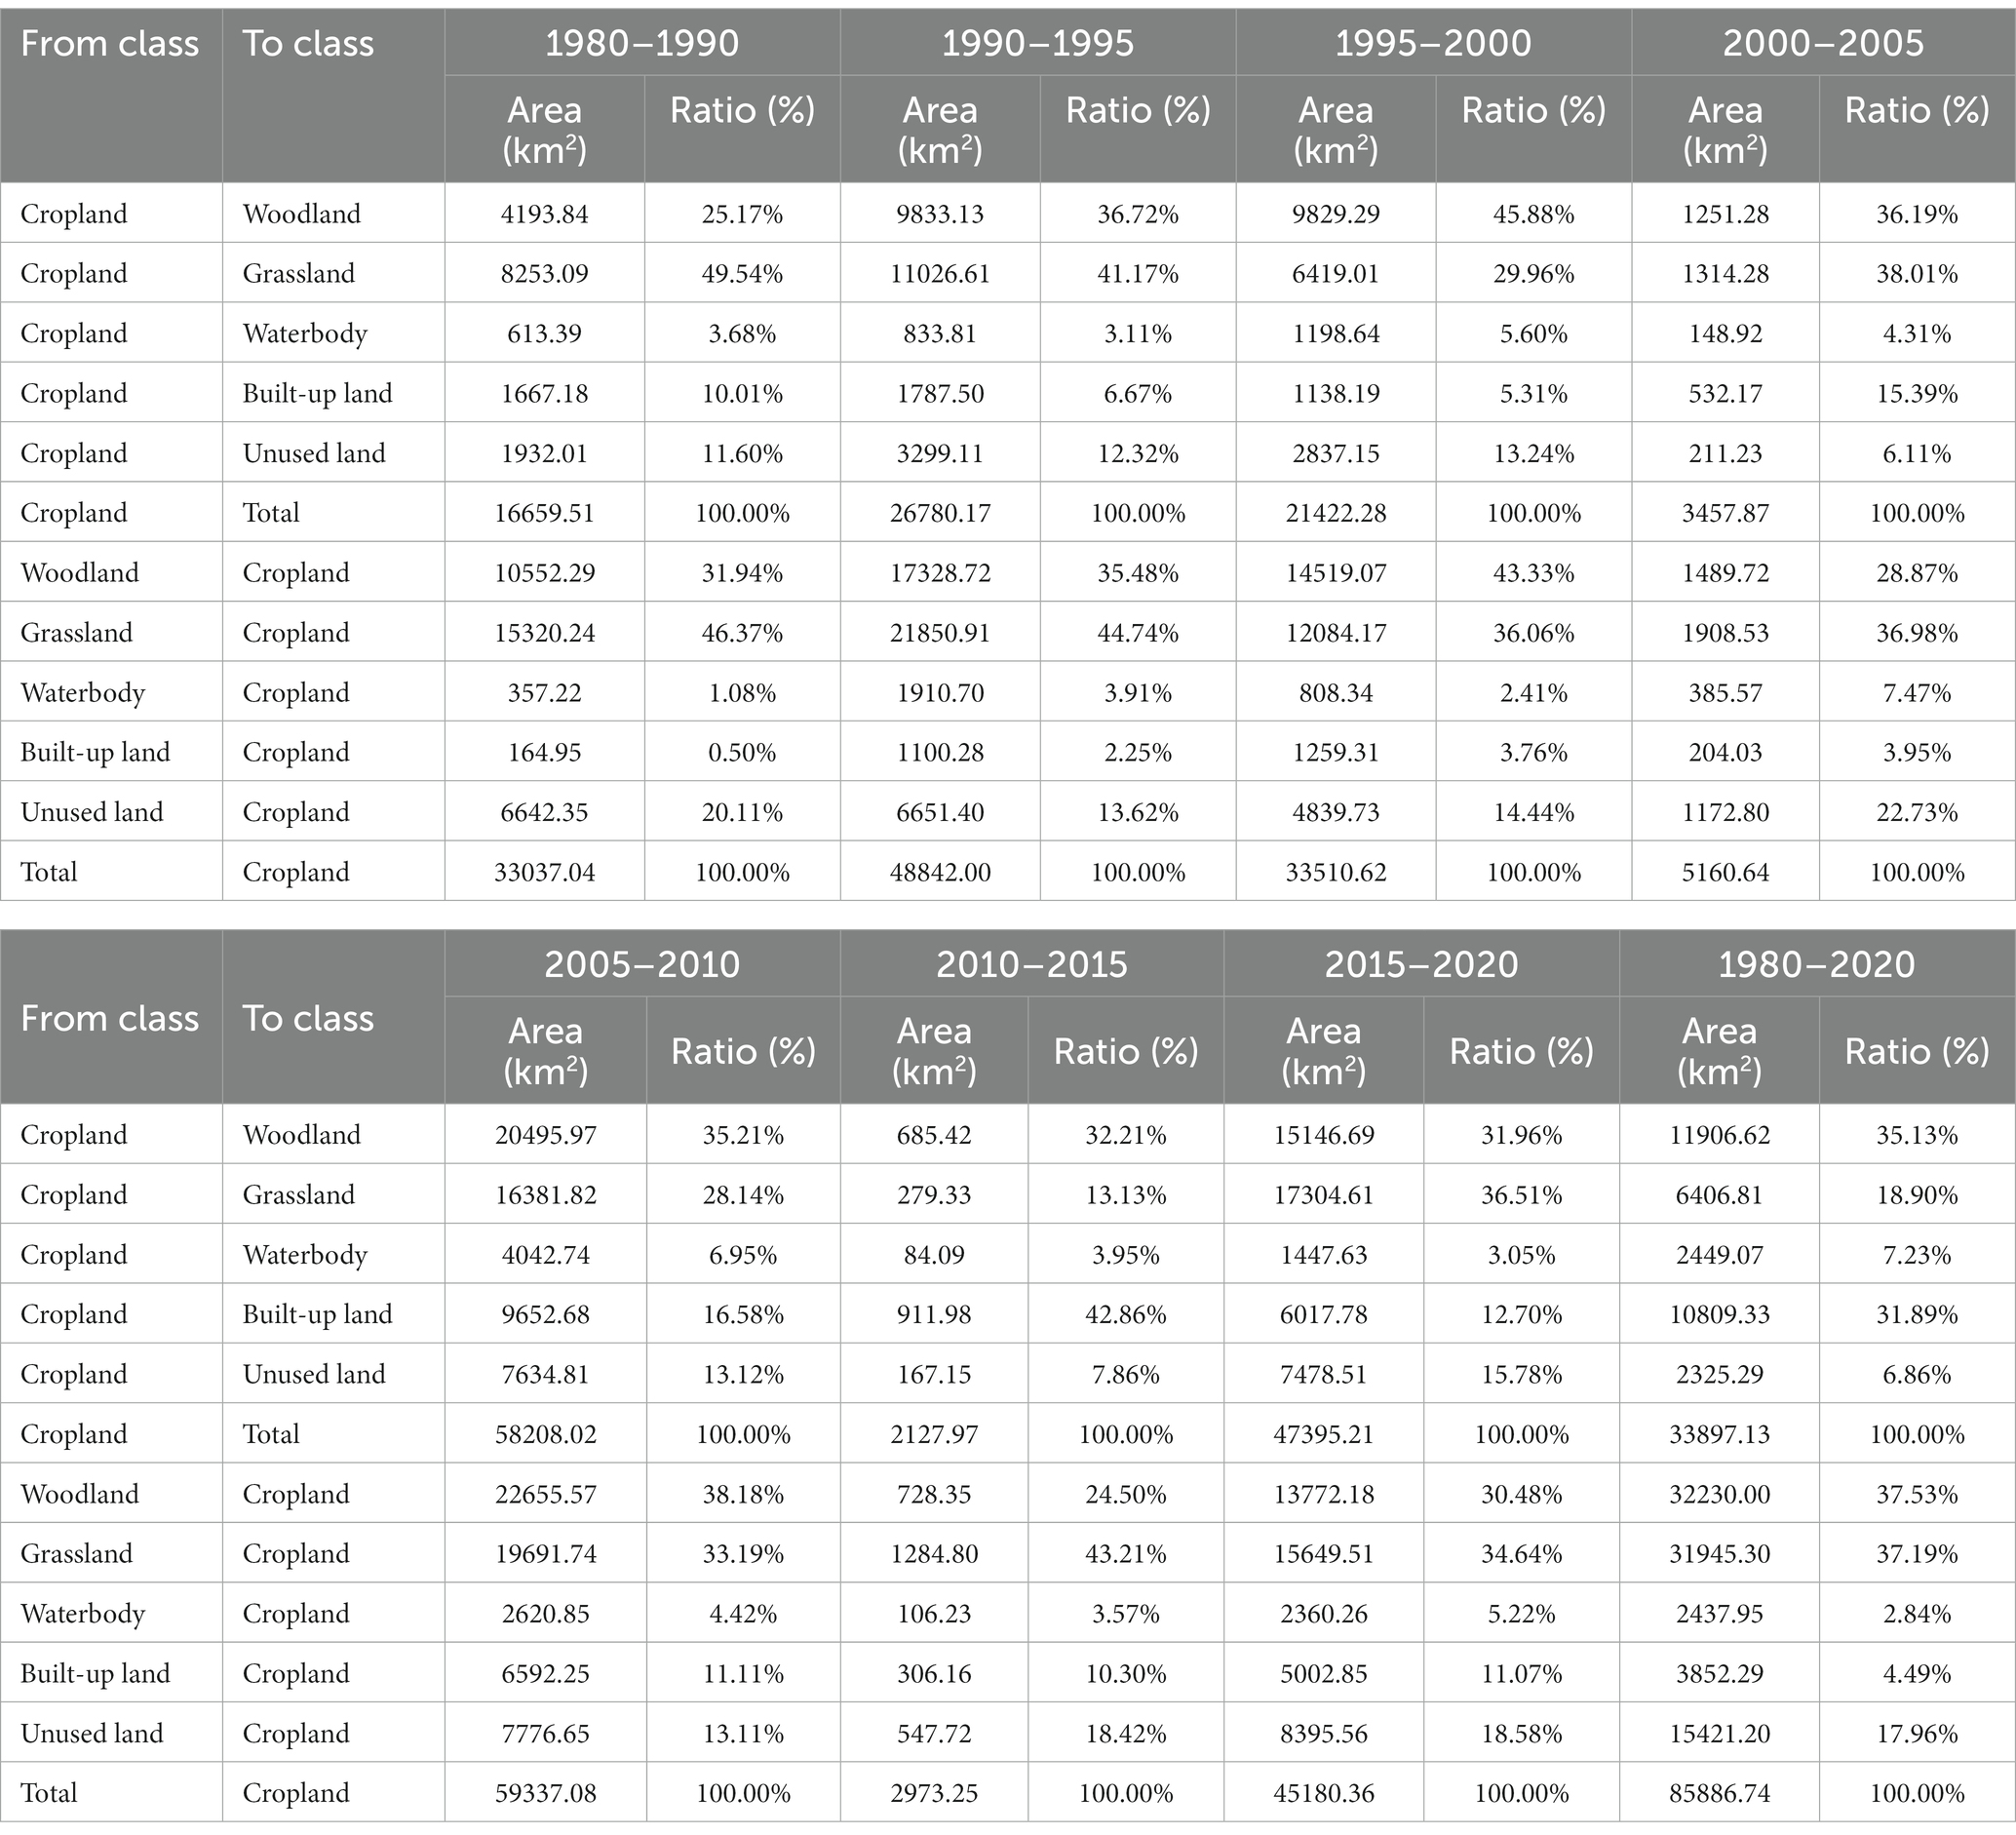
Table 3. The results of the land use transition matrix.
3.2.1 Spatiotemporal characteristics of cropland converted into woodland
Between 1980 and 2020, as shown in Figure 5 (1980–2020), the regions with cropland conversions into woodland (≥37.90 km2) were primarily located in Jilin Province, Liaoning Province. Figure 5 (2005–2010, 2015–2020, 1990–1995, 1995–2000) demonstrates significant changes in patch colors for regions (≥37.90 km2) of cropland converted into woodland. Conversely, Figure 5 (1980–1990, 2000–2005, 2010–2015) shows different patterns. Specifically, during 2005–2010, Figure 5 (2005–2010) reveals that regions (≤37.89 km2) of cropland converted into woodland were mainly located in Qiqihar, Daqing, Suihua, Yichun in Heilongjiang Province, Baicheng, Songyuan, and Changchun in Jilin Province, as well as Shenyang, Jinzhou, Panjin, and Liaoyang in Liaoning Province, and western Hulunbeier in Inner Mongolia. In the period of 2015–2020, Figure 5 (2015–2020) shows that regions (≤37.89 km2) of cropland converted into woodland were mainly located in Suihua, Qiqihar, Daqing, Yichun in Heilongjiang Province, Baishan, Tonghua, Baicheng, Changchun, and Yanbian Korean Autonomous Prefecture in Jilin Province, and most of Jilin Province. In the same period, regions (≥253.66 km2) of cropland converted into woodland were primarily found in Heihe in Heilongjiang Province and the eastern parts of Hulunbeier in Inner Mongolia.
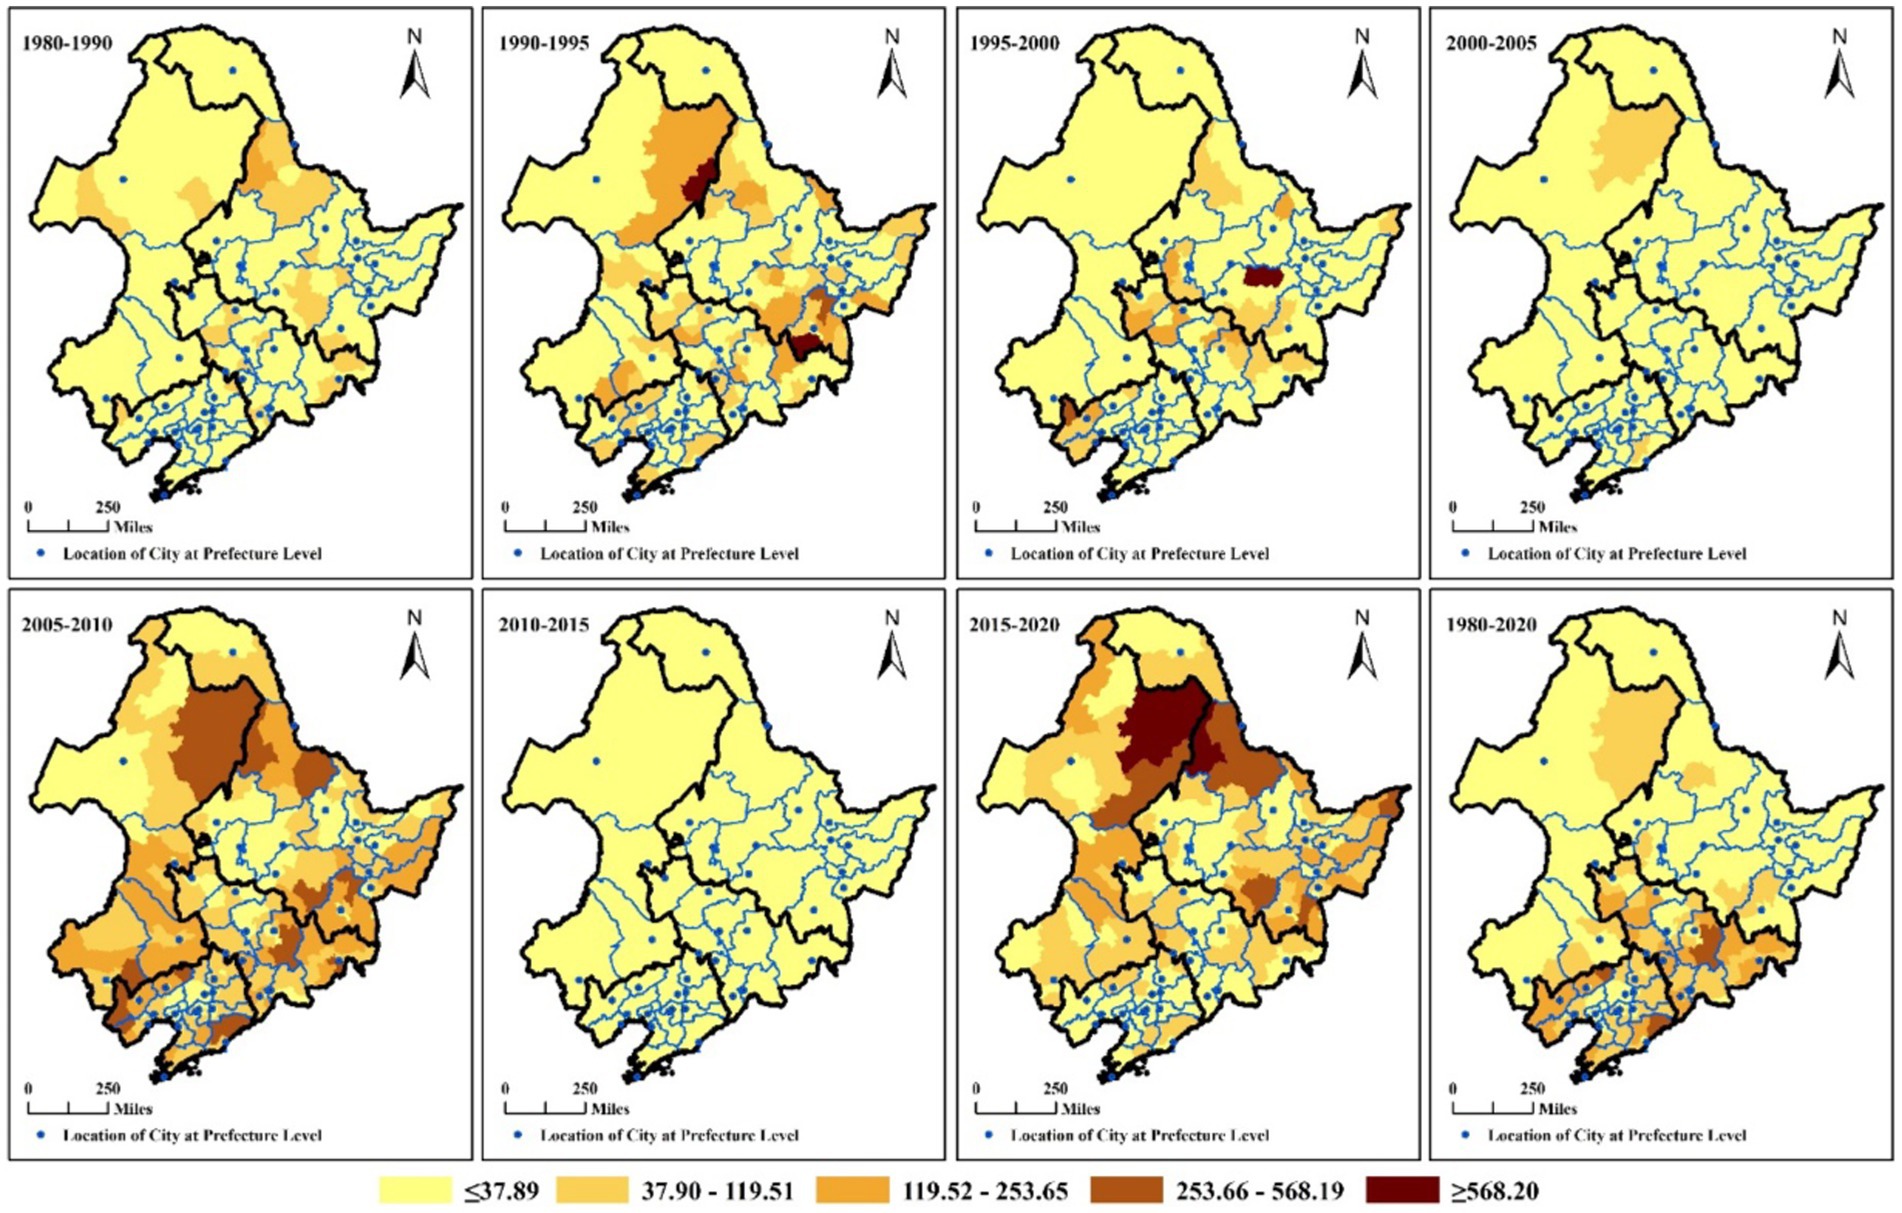
Figure 5. Spatial distribution of the areas of cropland converted into woodland (Unit: km2). The areas of cropland converted into woodland of all periods were unified into five categories using the natural breakpoint method (The same as below).
For the years 1990–1995, Figure 5 (1990–1995) depicts regions (≥37.90 km2) of cropland converted into woodland mainly located in Harbin, Mudanjiang, Heihe in Heilongjiang Province, Baicheng, Songyuan, Jilin, Liaoyuan, Tonghua in Jilin Province, and Fuxin, Jinzhou, Huludao, Dalian, Dandong in Liaoning Province, along with eastern Hulunbeier, central Xing’an League, southwestern Tongliao, and southeastern Chifeng in Inner Mongolia. Lastly, during 1995–2000, Figure 5 (1995–2000) shows regions (≥37.90 km2) of cropland converted into woodland mainly located in Daqing, Harbin, Heihe in Heilongjiang Province, and Chaoyang, Huludao in Liaoning Province, and Baicheng, Songyuan, Jilin in Jilin Province.
3.2.2 Spatiotemporal characteristics of cropland converted into grassland
From 1980 to 2020, Figure 6 (1980–2020) shows that the regions (≥49.94 km2) of cropland converted into grassland were mainly located in Chifeng, Tongliao, Xing’an League, western Hulunbuir, Inner Mongolia, Chaoyang, Fuxin, and Liaoning Province. Additionally, the regions (≥178.68 km2) of cropland converted into grassland were primarily located in western Hulunbuir, Inner Mongolia. Figure 6 also reveals that in the time periods 2015–2020, 2005–2010, 1990–1995, and 1980–1990, the regions (≥49.93 km2) of cropland converted into grassland were predominantly situated in Inner Mongolia’s East Four League. Furthermore, for the years 2015–2020 and 2005–2010, the regions (≥178.68 km2) of cropland converted into grassland were concentrated in Inner Mongolia’s East Four League. In the 2015–2020 period, the regions (≥398.62 km2) of cropland converted into grassland were mainly located in Inner Mongolia’s East Four League. Also, in 2005–2010, regions (≥49.93 km2) of cropland converted into grassland were observed in various parts of Heilongjiang Province.
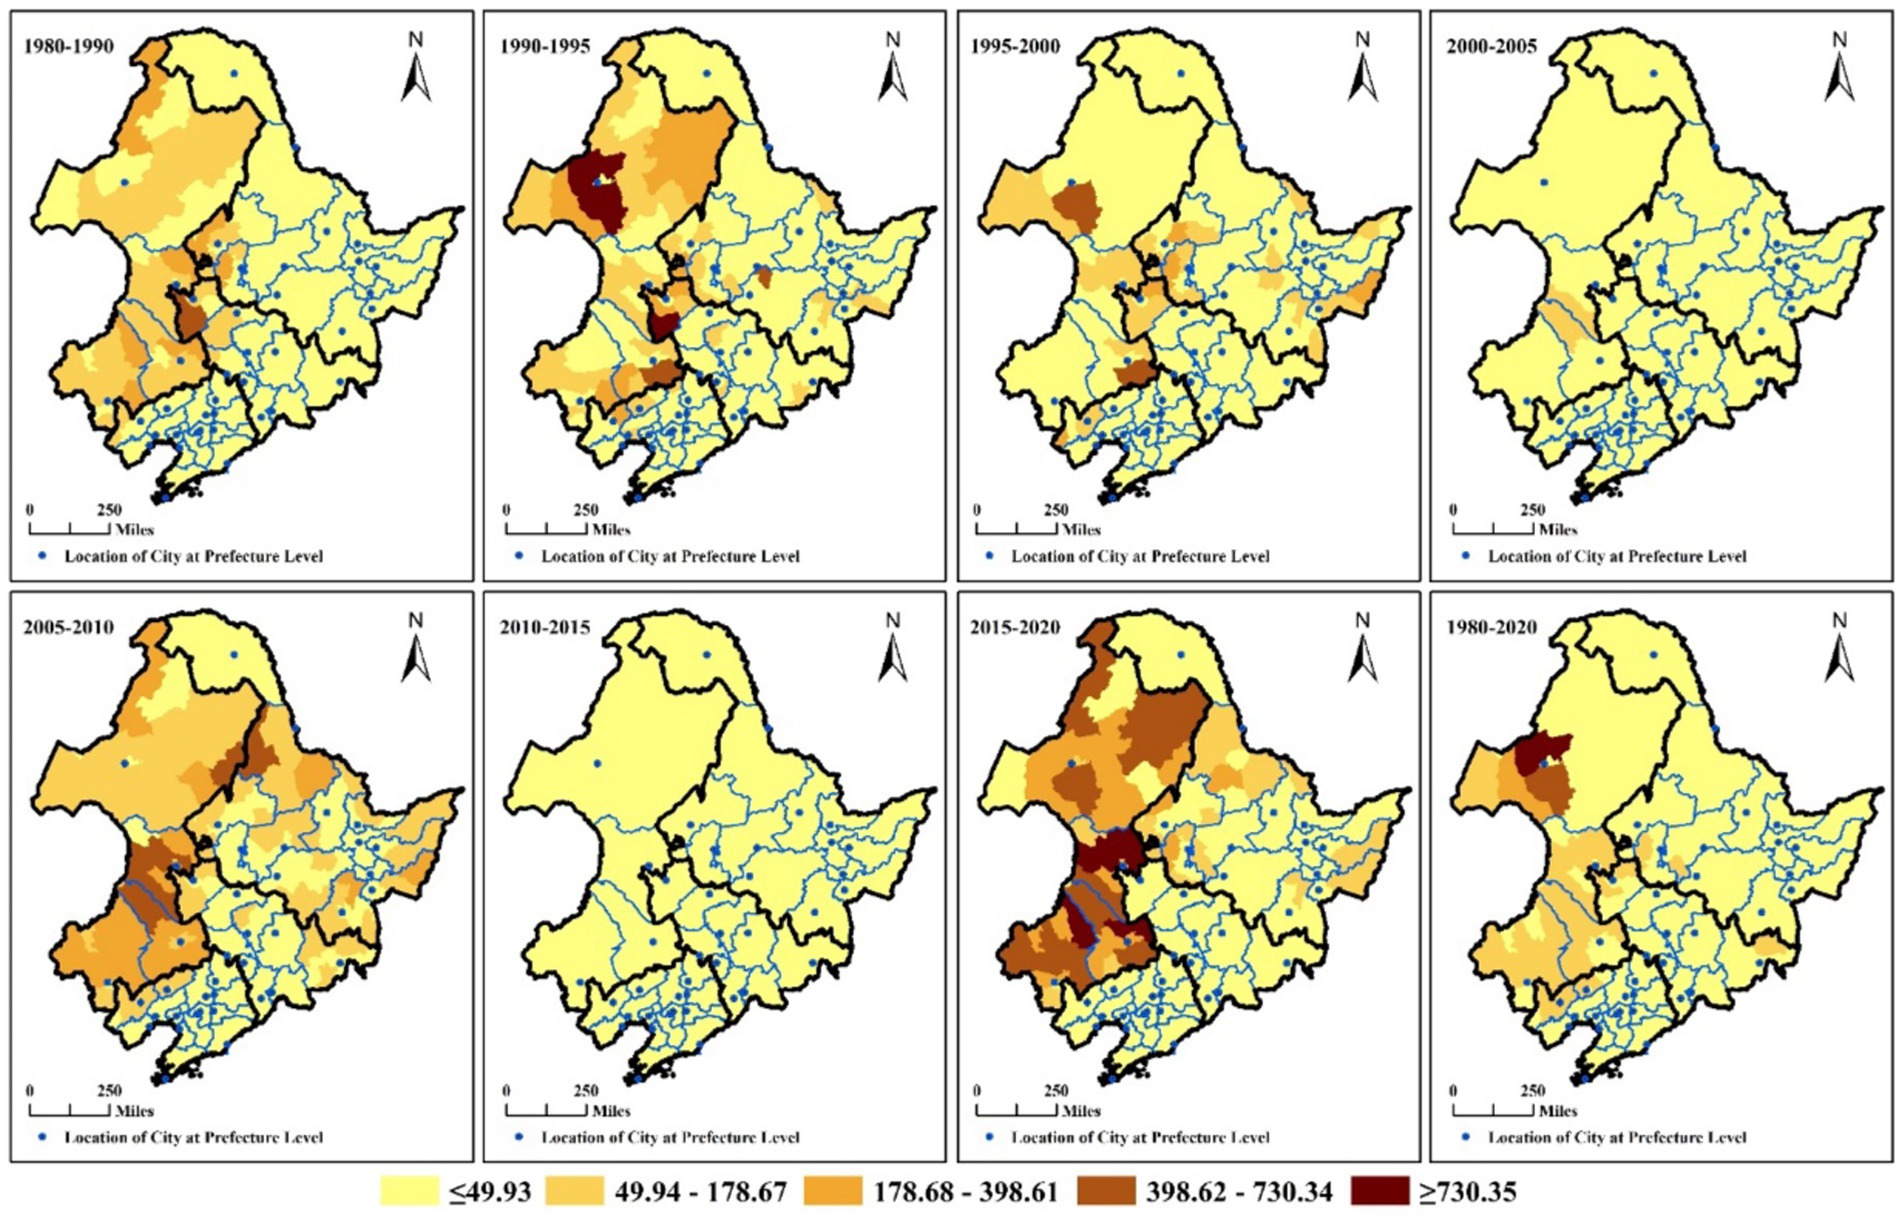
Figure 6. Spatial distribution of the areas of cropland converted into grassland (Unit: km2).
3.2.3 Spatiotemporal characteristics of cropland converted into built-up land
During 1980–2020, Figure 7 (1980–2020) shows that the regions (≥65.73 km2) of cropland converted into built-up land were primarily located in Songyuan, Changchun, and Jilin in Jilin Province, as well as in Dalian, Fuxin, Shenyang, Chaoyang, Yingkou, and Dandong in Liaoning Province. Additionally, the regions (≥115.56 km2) of cropland converted into built-up land were mainly situated in Jilin Province and Liaoning Province.
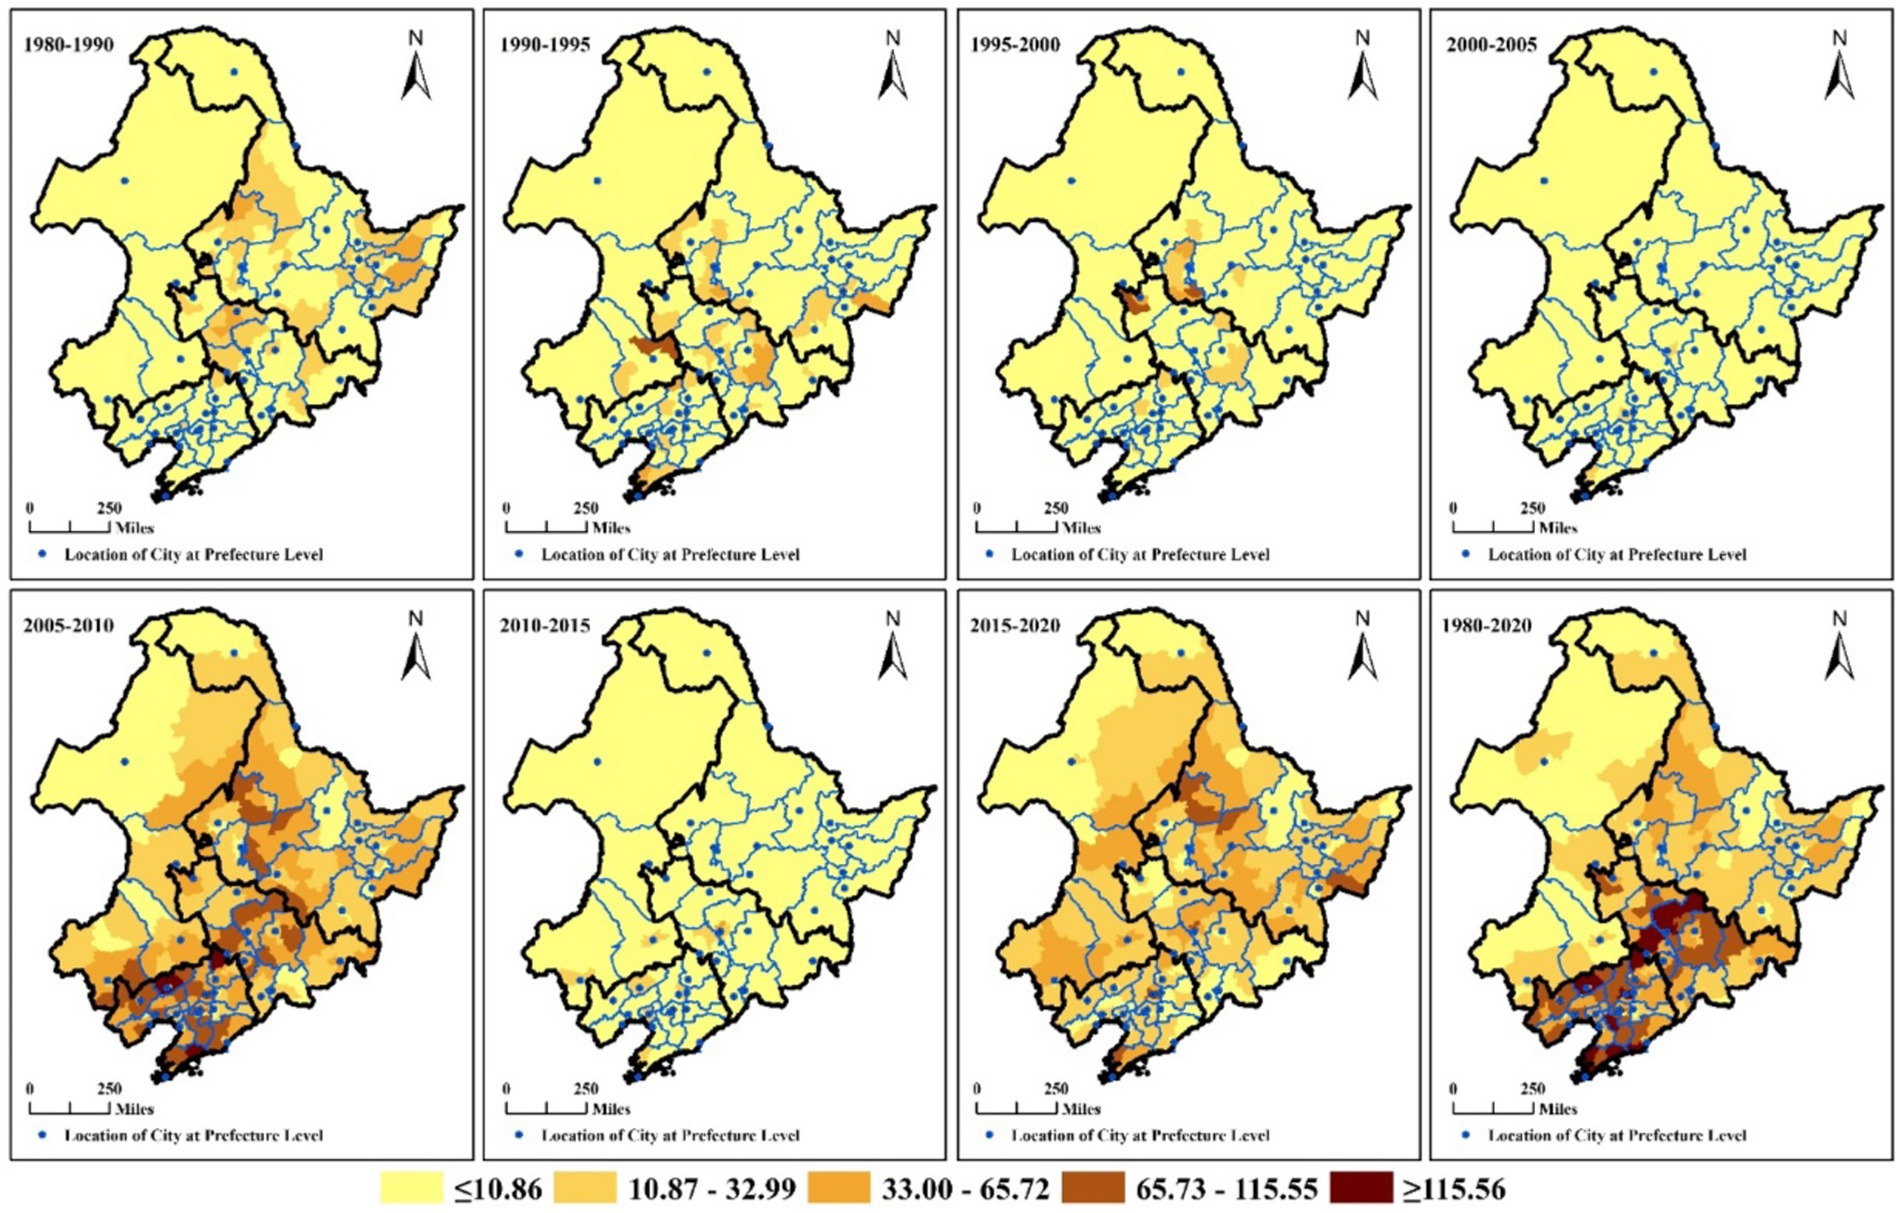
Figure 7. Spatial distribution of the areas of cropland converted into built-up land (Unit: km2).
During 2005–2010, Figure 7 (2005–2010) reveals that the regions (≤10.86 km2) of cropland converted into built-up land were primarily concentrated in the western parts of Hulunbeier, the northwestern parts of Tongliao in Inner Mongolia, and Yichun in Heilongjiang Province. In contrast, the regions (≥65.73 km2) of cropland converted into built-up land were mainly found in Chaoyang, Fuxin, Shenyang, Anshan, Dalian, Dandong in Liaoning Province, as well as in Changchun, Siping, Jilin in Jilin Province, and Qiqihar, Suihua, Harbin in Heilongjiang Province.
During 2015–2020, Figure 7 (2015–2020) illustrates that the regions (≤10.86 km2) of cropland converted into built-up land were predominantly situated in the west of central Hulunbeier in Inner Mongolia, and Tieling, Fushun, Benxi, Dandong, Huludao, Jinzhou in Liaoning Province. Also, these changes were notable in Baicheng, Songyuan, Tonghua, Baisan, and Yanbian Korean Autonomous Prefecture in Jilin Province, Yichun, Daxinganling in Heilongjiang Province. In contrast, the regions (≥10.87 km2) of cropland converted into built-up land exhibited the opposite trend.
Additionally, Figure 7 shows that the regions (≥10.86 km2) of cropland converted into built-up land during 1990–1995 were mainly concentrated in Qiqihar, Daqing, Mudanjiang in Heilongjiang Province, and Baicheng, Shenyang, Siping in Jilin Province, and Tongliao in Inner Mongolia, and Shenyang, Tieling, Anshan in Liaoning Province. The regions (≥10.86 km2) of cropland converted into built-up land during 1980–1990 were mainly located in the Sanjian Plain, Heihe, Qiqihar, Harbin in Heilongjiang Province, and Songyuan, Changchun, Siping in Jilin Province.
3.2.4 Spatiotemporal characteristics of woodland converted into cropland
From 1980 to 2020, Figure 8 (1980–2020) reveals that the regions (≤60.77km2) of woodland converted into cropland were primarily concentrated in prefecture-level city locations and their surrounding areas. Notably, this transformation occurred in Qiqihar, Daqing, Suihua, Harbin, Yichun, Daxinganling in Heilongjiang Province, as well as in northwestern Hulunbeier, parts of Xing’an League, most of Chifeng, southeastern Tongliao in Inner Mongolia, and in Baicheng, Changchun, Songyuan in Jilin Province, Shenyang, Liaoyang, Panjin, Yingkou in Liaoning Province. The regions (≥196.29km2) of woodland converted into cropland were mainly concentrated in Heihe, Harbin, Mudanjiang, Shuangyashan, Qitaihe, Jixi, Jiamusi in Heilongjiang Province, Baicheng, Jilin, Tonghua, Baisan, Yanbian Korean Autonomous Prefecture in Jilin Province, Fuxin, Dalian, Dandong in Liaoning Province, and Eastern Hulunbeier in Inner Mongolia.
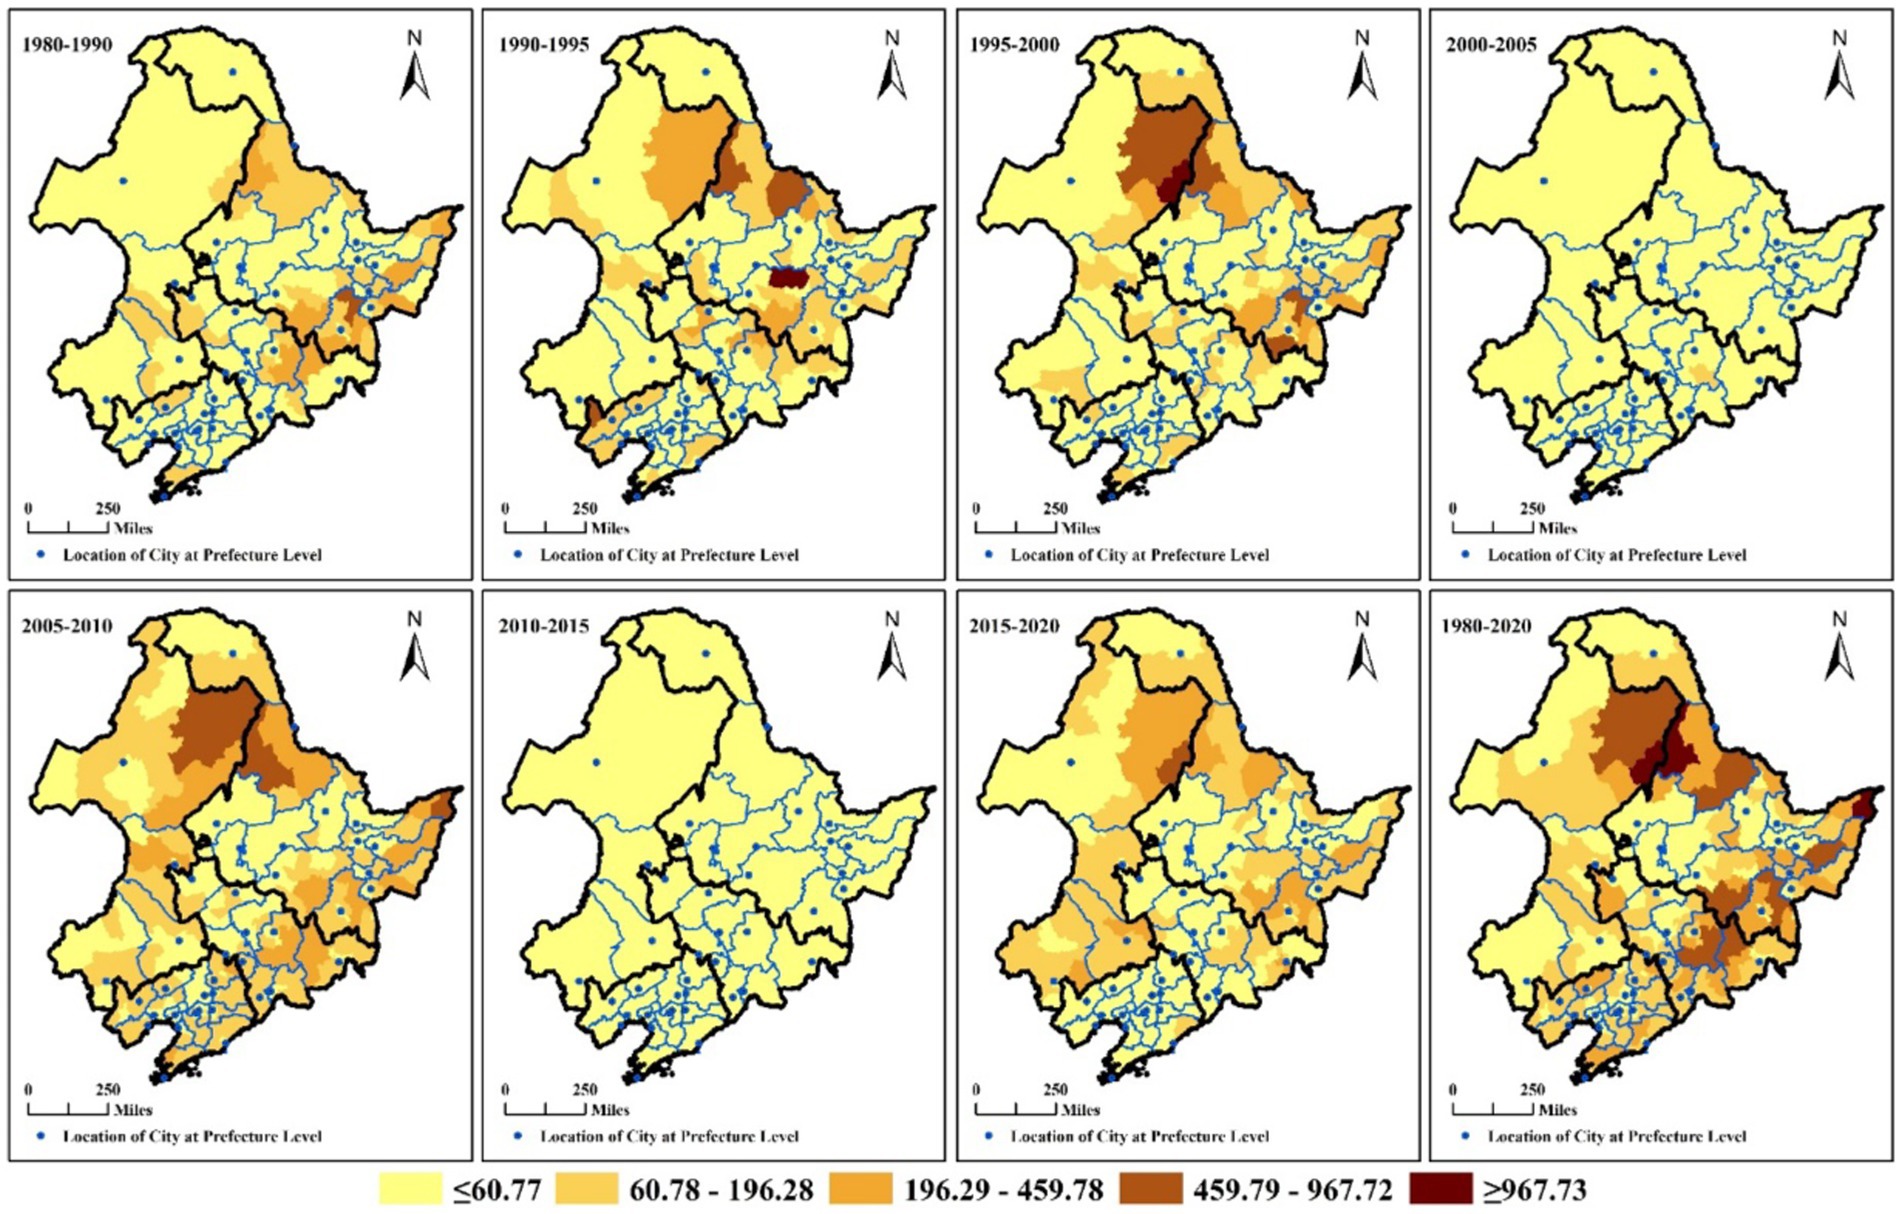
Figure 8. Spatial distribution of the areas of woodland converted into cropland (Unit: km2).
During 2005–2010, as shown in Figure 8 (2005–2010), regions with woodlands (≤60.77km2) that were converted into cropland were primarily distributed in prefecture-level city locations and their surrounding areas. This included Qiqihar, Daqing, Suihua, Yichun, Harbin, Daxinganling in Heilongjiang Province, and Baicheng, Songyuan, Changchun, Siping in Jilin Province, as well as Shenyang, Jinzhou, Fuxin in Liaoning Province, along with most of Chifeng, the southeast of Tongliao, and parts of Hulunbeier in Inner Mongolia. The regions with woodlands (≥196.29km2) converted into cropland were mainly concentrated in Heihe, Mudanjiang, Harbin, Jiamusi, Shuangyashan, and Jixi in Heilongjiang Province, as well as Jilin, Yanbian Korean Autonomous Prefecture in Jilin Province, and the eastern parts of Hulunbeier and portions of Xing’an League in Inner Mongolia.
Figure 8 shows that in the years 1990–1995, regions with woodlands (≥60.78km2) converted into cropland were primarily distributed in Heihe, Mudanjiang, Harbin, Shuangyashan, Jixi, and Yichun in Heilongjiang Province. They were also prominent in Songyuan, Changchun, and Jilin in Jilin Province, as well as Huludao, Chaoyang, Fuxin, and Dandong in Liaoning Province, and central Xin’an League, eastern Hulunbeier, and western Hulunbeier in Inner Mongolia.
In the period 1995–2000, the regions with woodlands (≥60.78km2) converted into cropland were mainly concentrated in Heihe, Daxinganling, Harbin, Mudanjiang, Qitaihe, Shuangyashan, Jiamusi, and other areas in Heilongjiang Province. They also extended to Baicheng, Songyuan, Jilin, and Yanbian Korean Autonomous Prefecture in Jilin Province, as well as Dandong, Dalian, Chaoyang in Liaoning Province, and eastern Hulunbeier, central Xing’an League, and southeastern Chifeng in Inner Mongolia.
Furthermore, from 2015 to 2020, regions with woodlands (≥60.78km2) converted into cropland were primarily seen in Daxinganling, Hehe, Harbin, Mudanjiang, Jixi, Shuangyashan, Qitaihe, Jiamusi, and Hegang in Heilongjiang Province. They were also notable in Songyuan, Siping, Jilin, Yanbian Korean Autonomous Prefecture in Jilin Province, as well as Dandong in Liaoning, and the eastern and northern areas of Hulunbeier, Xing’an League, Tongliao, Chifeng, and other parts of Inner Mongolia.
3.2.5 Spatiotemporal characteristics of grassland converted into cropland
Between 1980 and 2020, as depicted in Figure 9 (1980–2020), the regions with grasslands (≥82.87km2) converted into cropland were primarily concentrated in Hulunbeier, Xing’an League, Tongliao City, and parts of Chifeng in Inner Mongolia. Additionally, they were prominent in Baicheng and Songyuan in Jilin Province, and in Heihe, Qiqihar, Daqing, Hegang, Jiamusi, Shuangyashan, and Jixi in Heilongjiang Province. For regions with more significant conversions (≥517.32km2) of grassland into cropland, the main areas included Hulunbeier, Xing’an League, Tongliao, Chifeng in Inner Mongolia, as well as Heihe, Jixi, Shuangyashan, and Jiamusi in Heilongjiang Province.
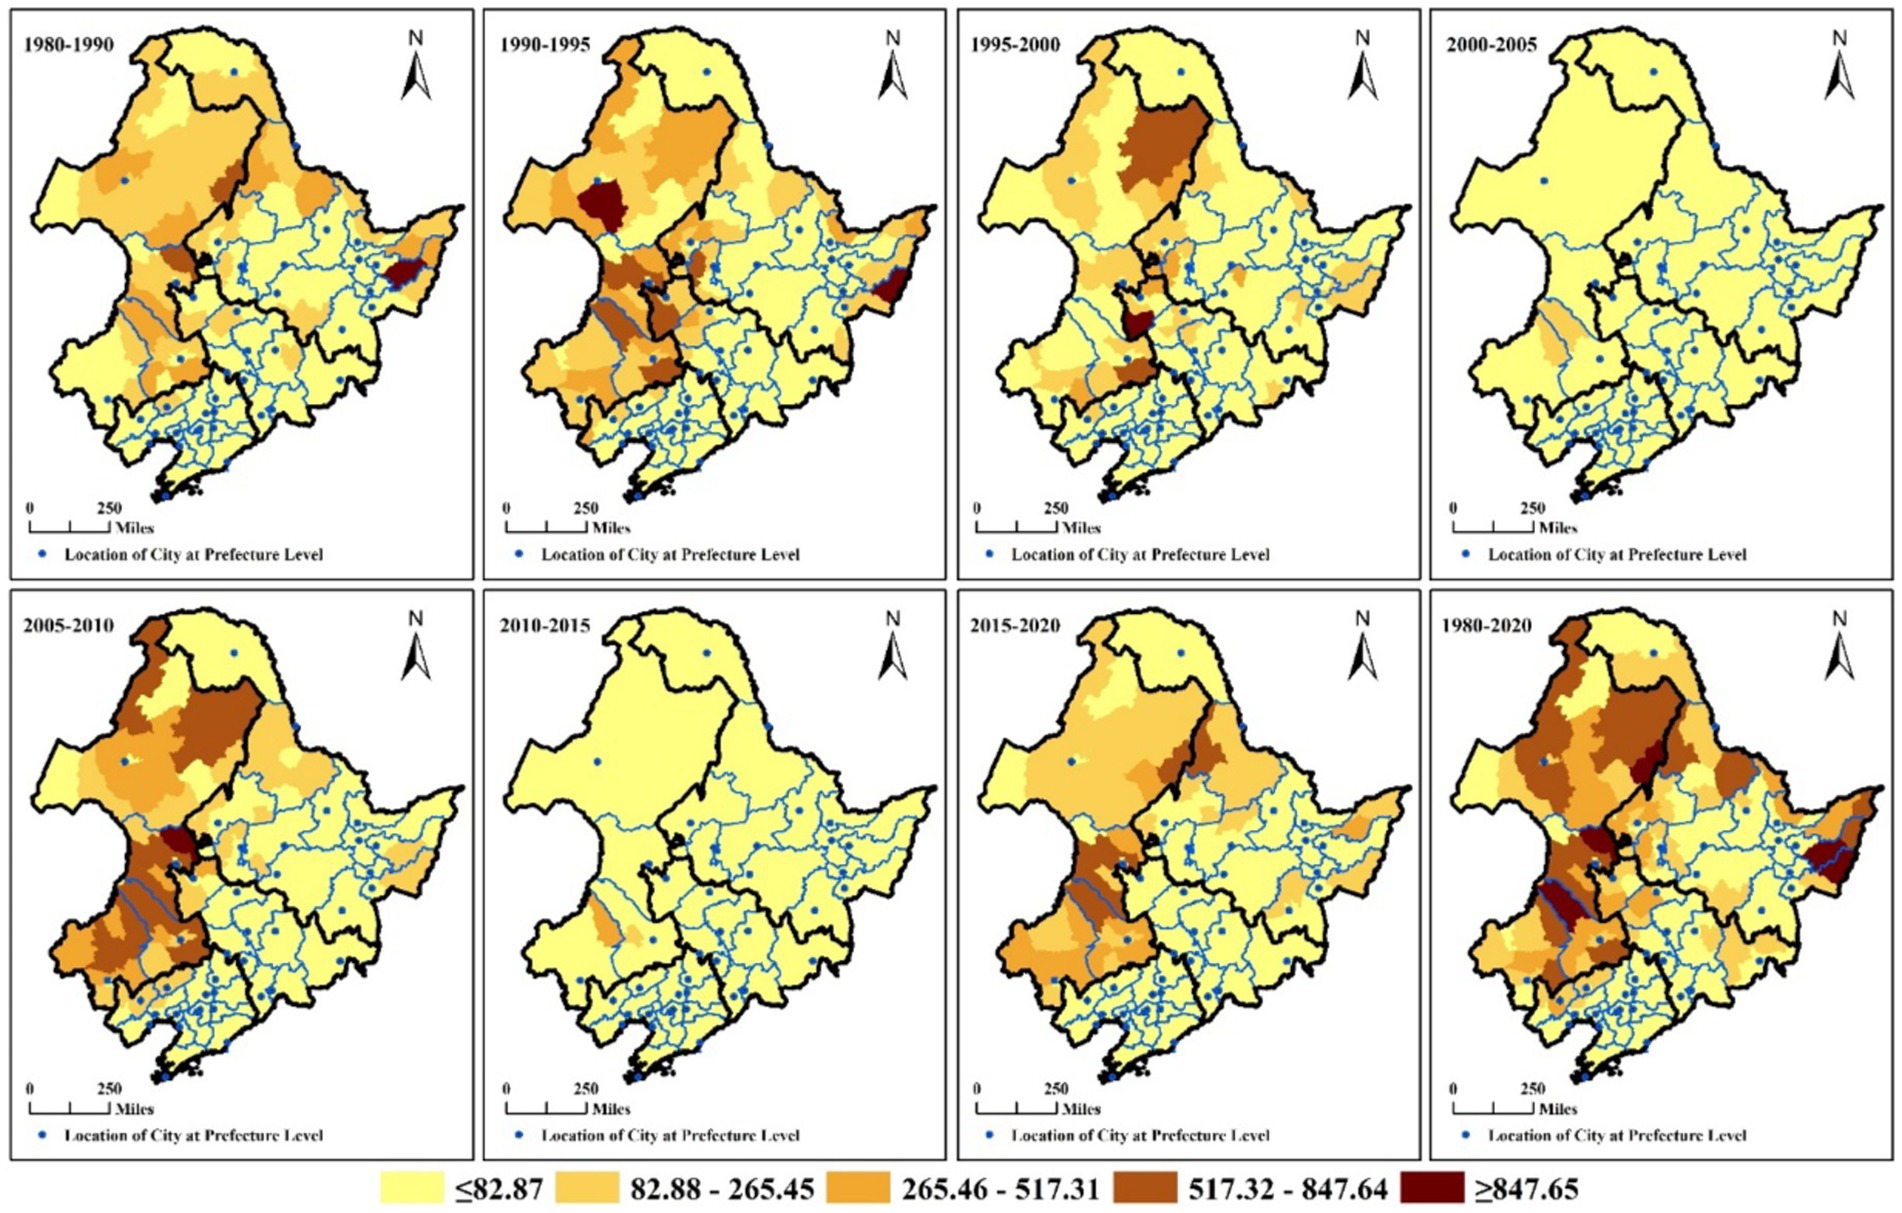
Figure 9. Spatial distribution of the areas of grassland converted into cropland (Unit: km2).
Figure 9 further highlights that regions with extensive conversions (≥82.87km2) of grassland into cropland were primarily situated in the four eastern leagues of Inner Mongolia during various timeframes (1990–1995, 2005–2010, 2015–2020, 1980–1990, 1995–2000). These regions also encompass Heihe (1990–1995, 2005–2010, 2015–2020, 1980–1990), Jiamusi (1990–1995, 2015–2020, 1980–1990), Jixi (1990–1995, 2005–2010, 2015–2020, 1980–1990, 1995–2000), Shuangyashan (1990–1995, 2005–2010, 1980–1990, 1995–2000), Daxinganling (1980–1990) in Heilongjiang Province, as well as Baicheng (1990–1995, 2005–2010, 1980–1990) and Songyuan (1990–1995, 1980–1990) in Jilin Province.
3.3 Spatiotemporal characteristics of altitude and slope changes in cropland
Figure 10 shows the spatial distribution of average altitude and average slope in cropland. From the geographical distribution, Figure 10A shows the spatial distribution of average altitude in cropland was high in the west, north, and east, and low in the middle, and the regions of low average altitude in cropland were located in Sanjiang Plain, Songnen Plain, and Liaohe Plain. From the administrative distribution, Figure 10A shows the regions (2.09–95.76, 95.77–195.44) of average altitude in cropland were located in Hegang, Jiamusi, Shuangyashan, Jixi, Harbin, Suihua, Daqing, Qiqihaer, Heilongjiang Province, and Baicheng, Songyuan, Siping, Changchun, Jilin Province, Huludao, Jinzhou, Panjin, Shenyang, Anshan, Yingkou, Liaoyang, Tieling, Dandong, Liaoning Province, and southeast of Tongliao, Inner Mongolia, etc., and the regions (305.76–537.84, 537.85–1253.84) of average altitude in cropland were located in parts of Inner Mongolia East Four League, and Mudanjiang, Heihe, Daxinganling, Heilongjiang Province, and Jilin, Liaoyuan, Tonghua, Baishan, Yanbian Korean Autonomous Prefecture, Jilin Province, and Chaoyang, Benxi, Fushun, Liaoning Province, etc. from The administrative distribution, Figure 10B shows the regions (5.12–8.10, 8.11–12.30) of average slope in cropland were located in the areas around the Changbai Mountain Range from the geographical distribution, and in Mudanjiang, Heilongjiang Province, and Jilin, Baisan, Yanbian Korean Autonomous Prefecture, Jilin Province, and Fushun, Benxi, Dandong and Anshan, Liaoning Province, etc.
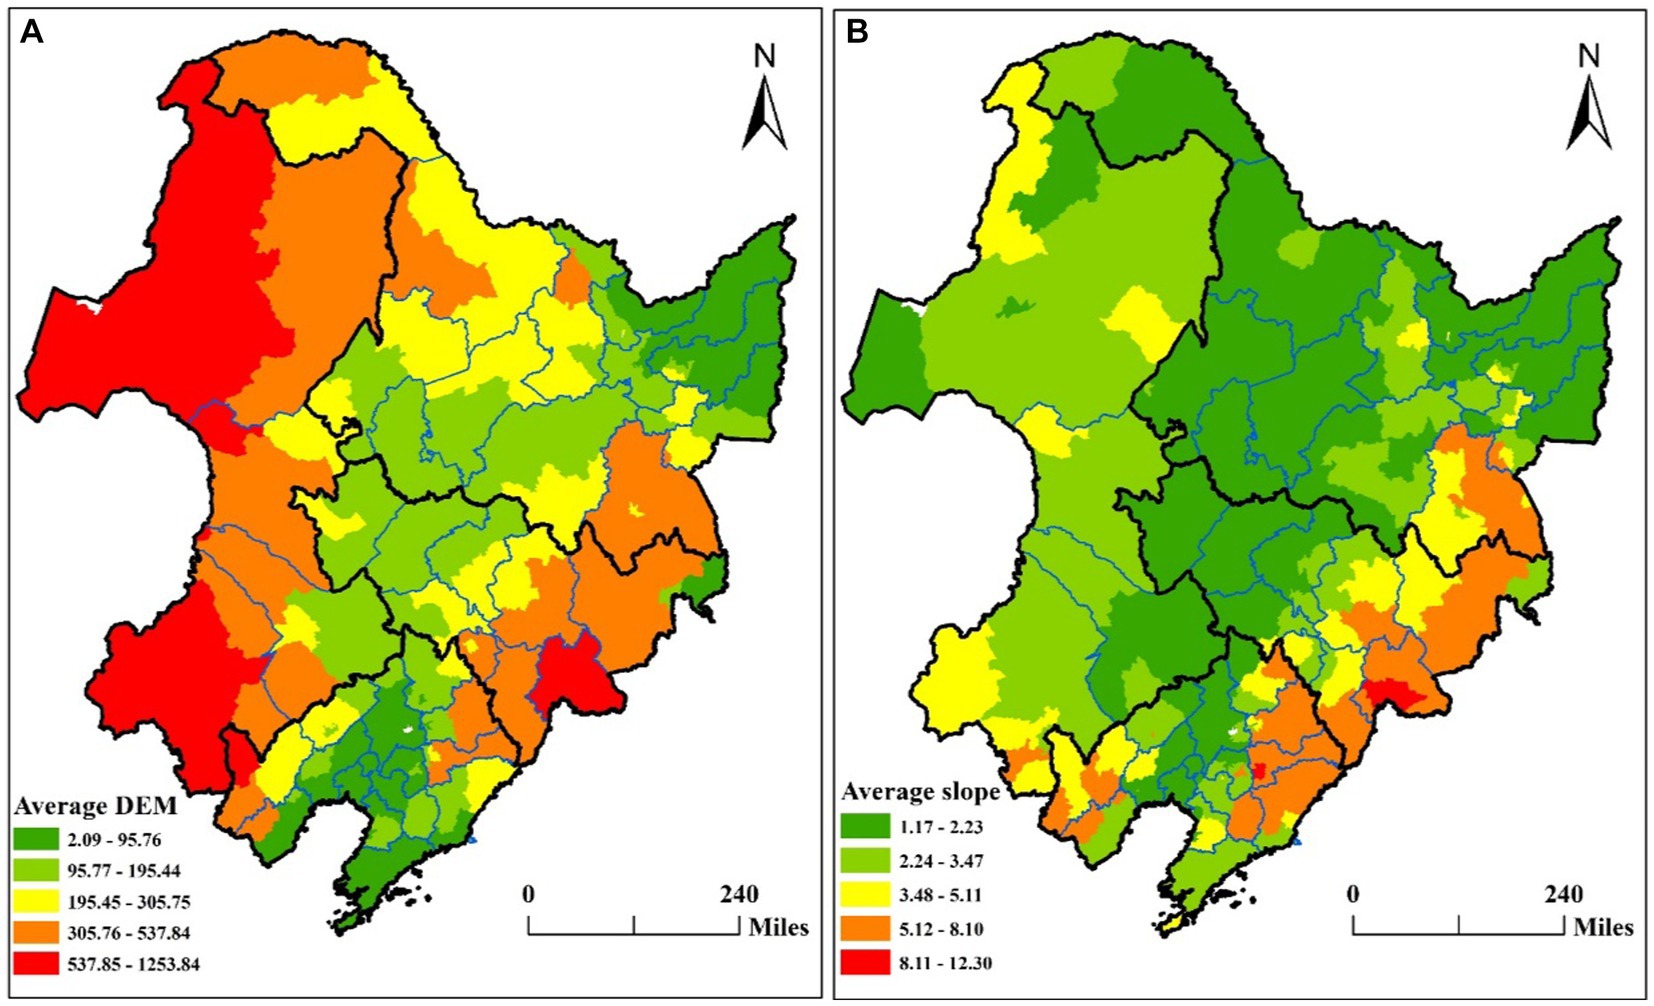
Figure 10. Spatial distribution of average altitude and average slope in cropland (Unit: m, degree). (A) shows the spatial distribution of mean elevation. (B) shows the spatial distribution of mean slope.
3.3.1 Spatiotemporal characteristics of altitude changes in cropland
Table 4 shows the average altitude change in cropland during 1980–2020. The average altitude of cropland in the black soil region of northeast China increased by 2.06 m, from 237.7656 m to 239.8277 m during 1980–2020. During the study period of 2015–2020, 1980–1990, and 2000–2005, the average altitude in cropland decreased, while in 1990–1995, 2005–2010, 1995–2000, and 2010–2015, the average altitude in cropland increased. The order of the change value of average altitude in cropland is as follows: 1990–1995 (3.21, 13.63‰), 2005–2010 (2.66, 11.10‰), 2015–2020 (−2.37, −9.80‰), 1980–1990 (−2.04, −8.60‰), 1995–2000 (0.67, 2.81‰), 2000–2005 (−0.09, −0.38‰), and 2010–2015 (0.03, 0.13‰).
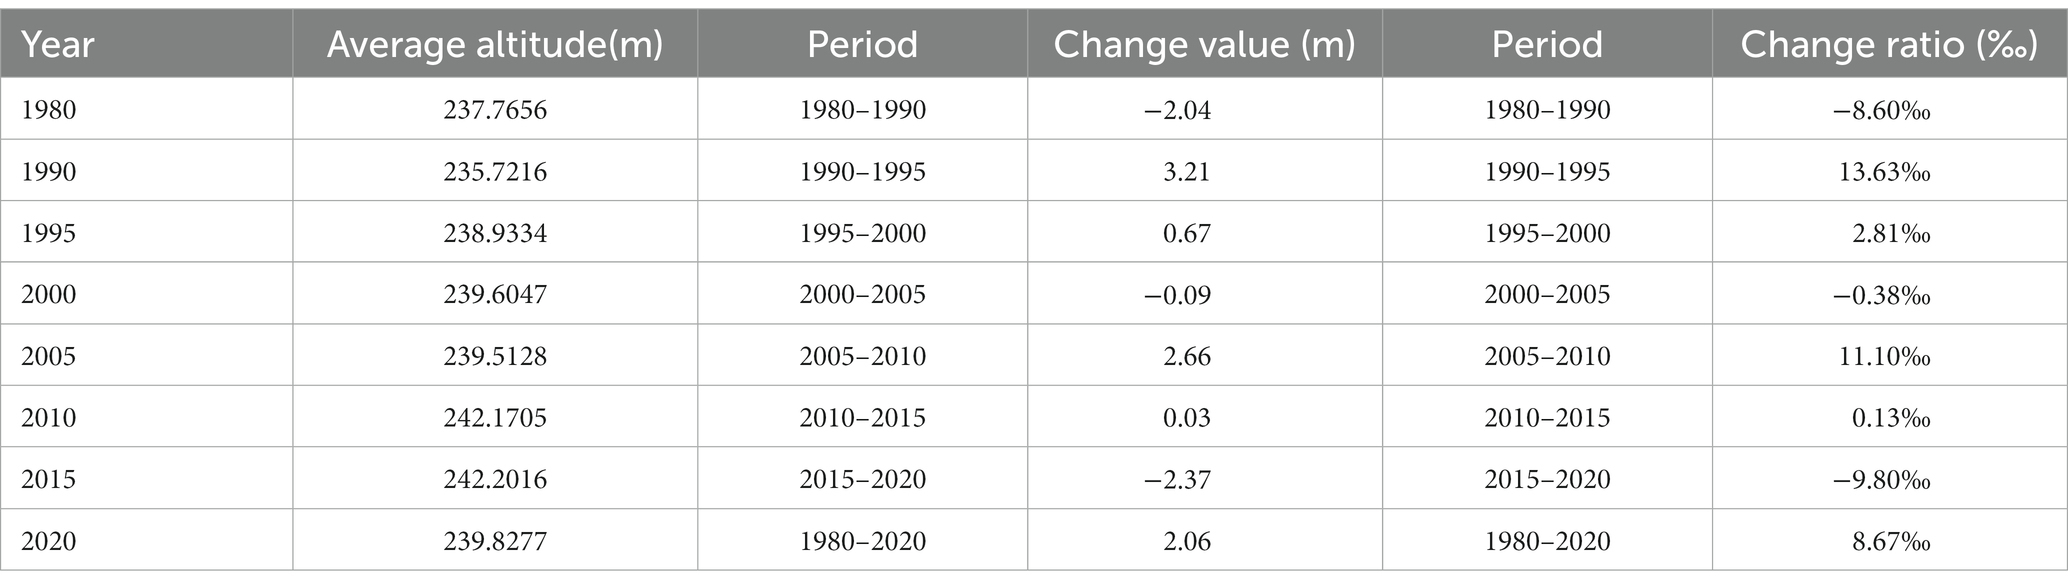
Table 4. The average altitude change in cropland during 1980–2020.
Figure 11 displays the spatial distribution of average altitude changes in cropland, featuring three types of information: increase (red), decrease (green), and change value. The processing steps align with those used in Figure 4. During 1989–2020, as shown in Figure 11 (1980–2020), prefecture-level city locations and their surrounding areas exhibit a rising trend in the average altitude in cropland. Conversely, regions with a declining trend in the average altitude of cropland are predominantly found in Qiqihar, Suihua, and Jiamusi in Heilongjiang Province, as well as in Baisheng, Songyuan, Changchun, and the Yanbian Korean Autonomous Prefecture in Jilin Province. Additionally, some areas in Dandong, Liaoning Province, and eastern-central Chifeng, southwestern Tongliao, southwestern Xing’an League, and eastern and western Hulunbuir in Inner Mongolia demonstrate a decreasing trend. Furthermore, regions with an increasing trend (≥21.11) in the average altitude of cropland are located in parts of Heihe, Daxinganling, Yichun, and Mudanjiang in Heilongjiang Province, as well as portions of Baisan and the Yanbian Korean Autonomous Prefecture in Jilin Province. Additionally, central and western Hulunbeier, parts of Xing’an League in Inner Mongolia, and more areas show a rising trend. Conversely, areas with a decreasing trend (≥20.82) in the average altitude of cropland can be identified in parts of Chifeng and western Hulunbuir in Inner Mongolia, as well as parts of the Yanbian Korean Autonomous Prefecture in Jilin Province.
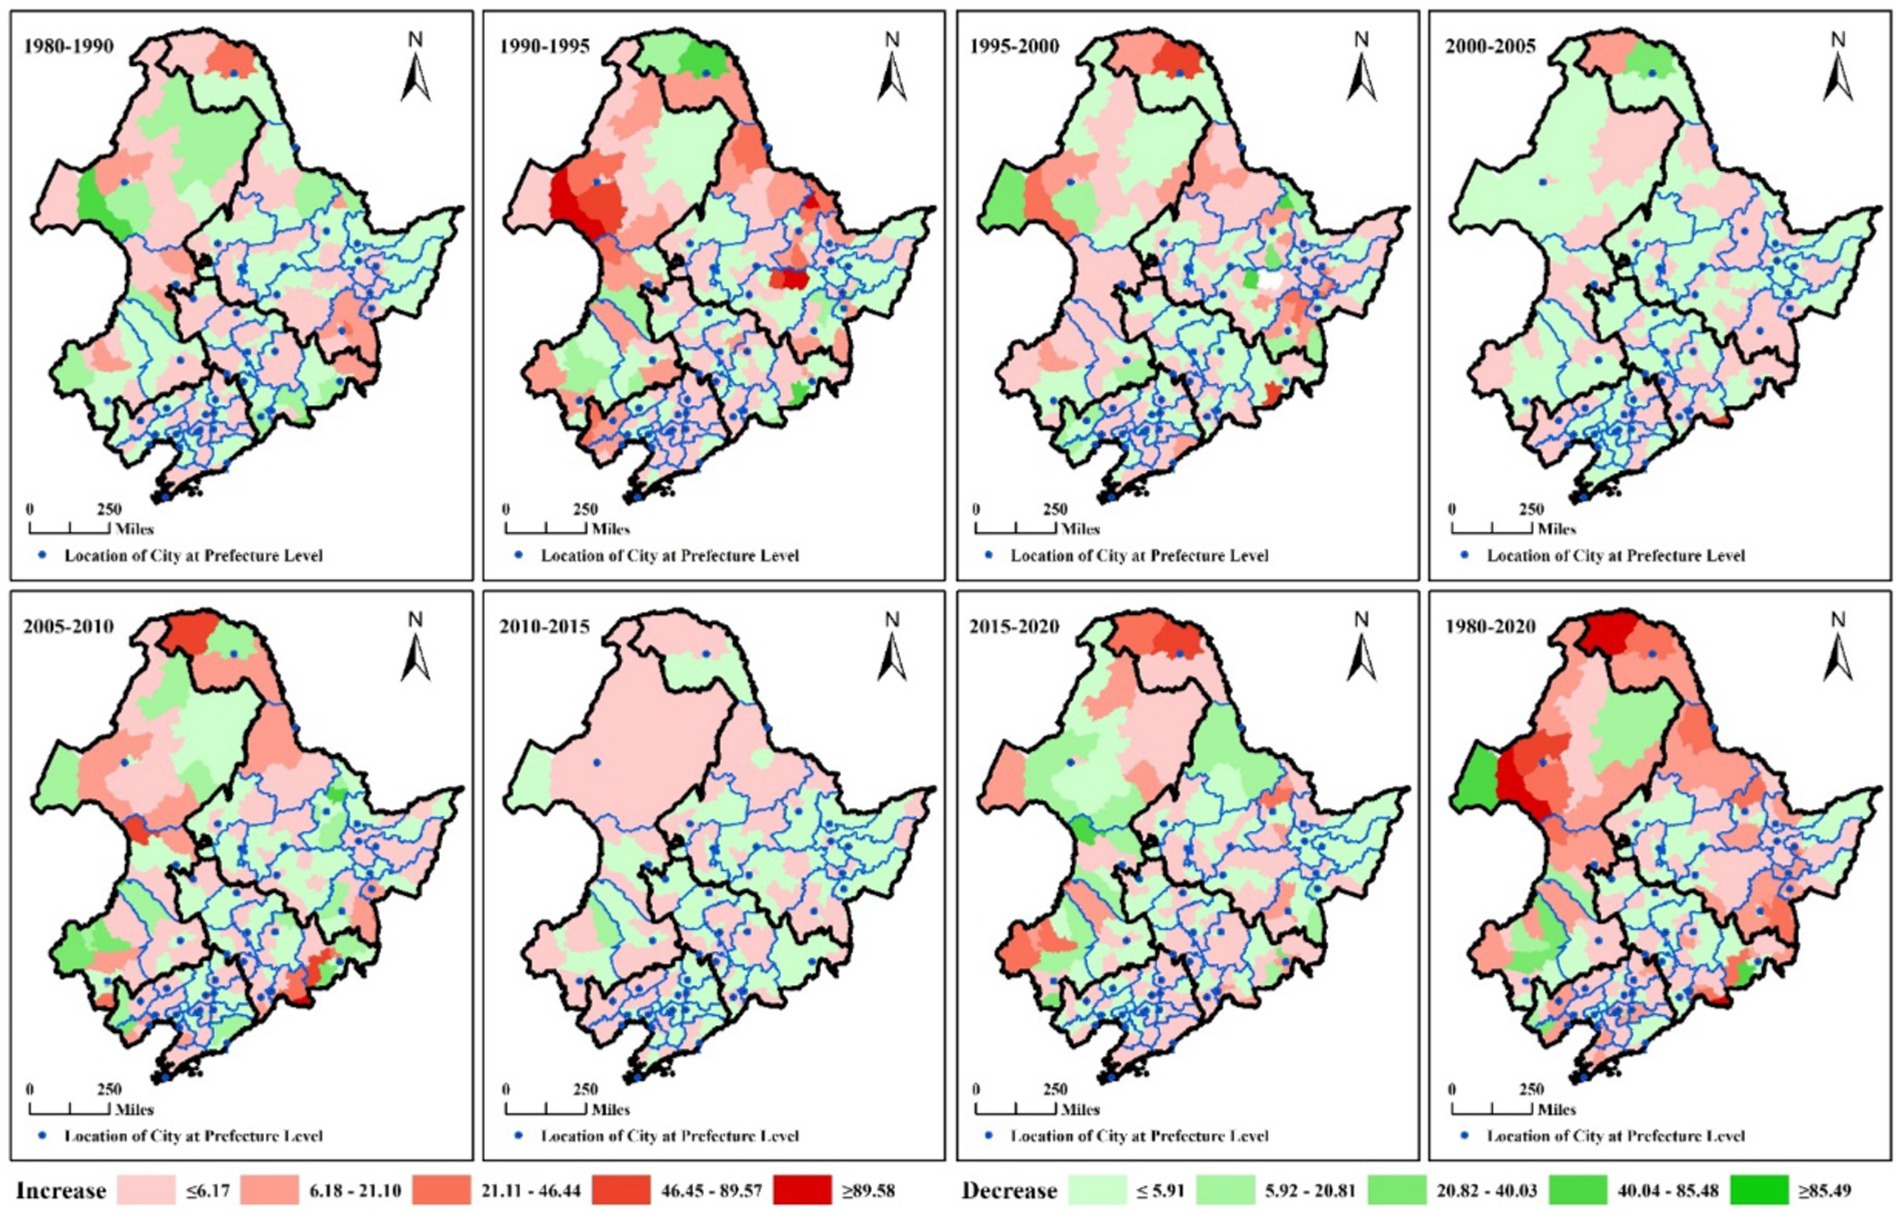
Figure 11. Spatial distribution of the average altitude changes in cropland (Unit: m). Red indicates an increase in the average altitude changes in cropland, and red indicates a decrease in the average altitude changes in cropland.
Figure 11 illustrates the numbers of regions with an increasing trend in the average altitude of cropland in Liaoning Province. These numbers exhibited a pattern of increase, followed by a decrease, then another increase. The spatial distribution demonstrated a trend of clustering with Shenyang at its center (1980–1990), expanding outward (1990–1995), followed by contraction (1990–2000 and 2000–2005), and later spreading to the southwest (2005–2010 and 2010–2015) and southeast (2015–2020).
In Jilin Province, Figure 11 reveals a similar pattern, with the numbers of regions showing an increasing trend in the average altitude of cropland following a sequence of increase, decrease, and another increase. These regions were predominantly located in most parts of Baicheng, Songyuan, Changchun, Siping, and Jilin (1980–1990), parts of each prefecture-level city (1990–2000), southwest parts of Jilin Province (1995–2000), parts of Southeast Jilin Province (2000–2005), parts of Baicheng, Siping, Liaoyang, Tonghua, Baishan, the Yanbian Korean Autonomous Prefecture, and other regions (2005–2010), central Liaoning Province (2010–2015), and most of Jilin, Siping, and Liaoyuan (2015–2020).
In Heilongjiang Province, Figure 11 also displays a trend of increasing and decreasing in the numbers of regions with an increasing trend in the average altitude of cropland. These regions were primarily located in parts of southeastern Heilongjiang, Daxinganling, and Heihe (1980–1990), northwestern Heilongjiang, and parts of Daxinganling (1990–1995), parts of northwestern and eastern parts of Heilongjiang (1995–2000), parts of Heihe, Mudanjiang, Yichun, and Shuangyashan (2000–2005), Heihe and its surrounding regions, parts of Shuangyashan, Mudanjiang, and Jixi (2005–2010), Heihe and its surrounding areas, parts of Mudanjiang and Daxinganling (2010–2015), and parts of Daxinganling, Harbin, Mudanjiang, Yichun, and Hegang (2015–2020). In Inner Mongolia East Four Leagues, Figure 11 depicts a fluctuating pattern in the numbers of regions with an increasing trend in the average altitude of cropland, alternating between increase and decrease. These regions were primarily located in most of Hulunbeier (1990–1995, 2005–2010, 2010–2015), most of Xing’an League (1980–1990, 1995–2000, 2000–2005, 2005–2010), most of Tongliao (1995–2000, 2005–2010, 2010–2015), and most parts of Chifeng (1995–2000, 2010–2015, 2015–2020).
In each study period (Figure 11), the regions (≥21.11) exhibiting an increasing trend in the average altitude of cropland were located in various areas: parts of Heihe, Heilongjiang Province (1980–1990); parts of Daxinganling, Heihe, and Yichun, Heilongjiang Province, as well as parts of Hulunbeier and Chifeng, Inner Mongolia (1990–1995); parts of Hulunbeier, Inner Mongolia, parts of Daxinganling, Mudanjiang, Harbin, Heilongjiang Province (1995–2000); parts of Daxinganling, Heilongjiang Province, parts of Baishan, and the Yanbian Korean Autonomous Prefecture, Jilin Province, parts of Xing’an League and Chifeng, Inner Mongolia (2005–2010); and parts of Daxinganling and Yichun, Heilongjiang Province, parts of Chifeng, Inner Mongolia (2015–2020).
Additionally, the regions (≥20.81) displaying a decreasing trend in the average altitude of cropland were situated in the following areas: parts of Hulunbeier, Inner Mongolia (1980–1990); parts of Daxinganling, Heilongjiang Province, and parts of the Yanbian Korean Autonomous Prefecture, Jilin Province (1990–1995); parts of Hulunbeier, Inner Mongolia, parts of Yichun, and Harbin, Heilongjiang Province (1995–2000); parts of Daxinganling, Heilongjiang Province (2000–2005); part of Yichun, Heilongjiang Province, parts of Chifeng, Inner Mongolia, and parts of Huludao, Liaoning Province (2005–2010); and parts of Xing’an League and Chifeng, Inner Mongolia (2015–2020).
3.3.2 Spatiotemporal characteristics of slope changes in cropland
Table 5 shows the average slope change in cropland during 1980–2020. Over this period, the average slope of cropland in the black soil region of northeast China increased by 0.0369 degrees, from 2.4455 degrees to 2.4824 degrees. When categorized by study period, the average slope in cropland decreased during 1990–1995, 2015–2020, and 1980–1990, while it increased during 2005–2010, 1995–2000, 2000–2005, and 2010–2015. The order of the change value in the average slope in cropland is as follows: 1990–1995 (0.1142, 46.53‰), 2005–2010 (0.0509, −20.26‰), 1995–2000 (0.0501, −19.52‰), 2015–2020 (0.0262, 10.67‰), 1980–1990 (0.0077, 3.15‰), 2000–2005 (0.0061, −2.43‰), and 2010–2015 (0.0041, −1.65‰).
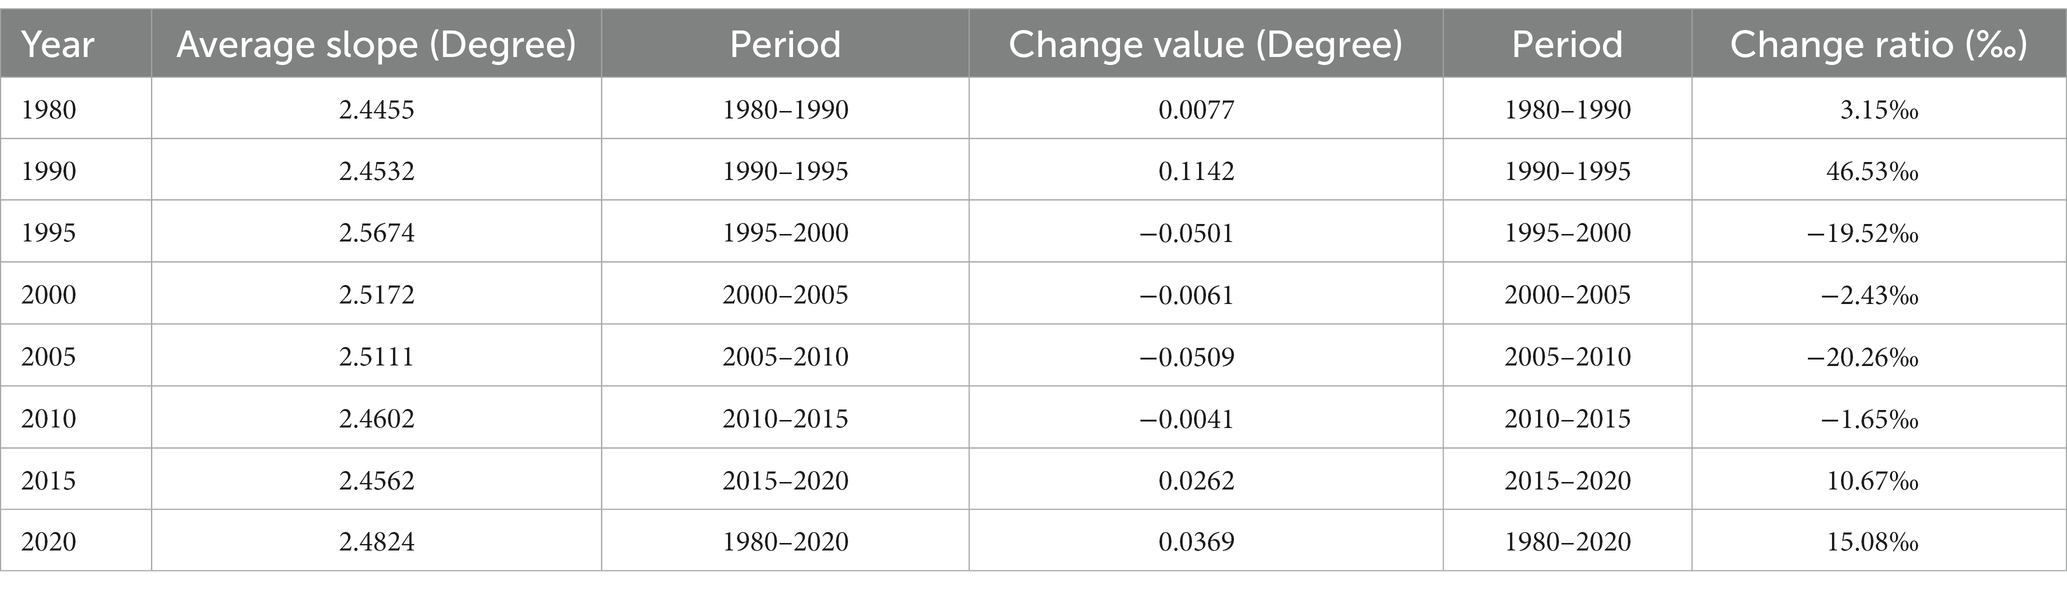
Table 5. The average slope change in cropland during 1980–2020.
Figure 12 illustrates the spatial distribution of average slope changes in cropland, incorporating three types of information: increase (in red), decrease (in green), and change value. The processing steps were consistent with those in Figure 4. During 1989–2020, as shown in Figure 12 (1980–2020), it highlights the locations of most prefecture-level city locations and their surrounding areas where the average slope in cropland exhibited an increasing trend. Conversely, regions with a decreasing trend in the average slope of cropland were identified in parts of Qiqihar, Daqing, Suihua, and Jiamusi in Heilongjiang Province, parts of Baishan, Songyuan, Changchun, Jilin, Baisan, and the Yanbian Korean Autonomous Prefecture in Jilin Province, parts of Chaoyang, Shenyang, Dandong, and Fushun in Liaoning Province, parts of Chifeng, Tongliao, Xing’an Meng, and Hulunbuir in Inner Mongolia. In addition, regions with an increasing trend (≥0.64) in the average slope of cropland were observed in parts of Yichun, Qitaihe, and Mudanjiang in Heilongjiang Province, parts of Hulunbeier in Inner Mongolia, and parts of Yingkou in Liaoning Province. Conversely, areas with a decreasing trend (≥0.53) in the average slope of cropland were situated in parts of Yanbian Korean Autonomous Prefecture, Baishan, and Tonghua in Jilin Province, parts of Chaoyang, Huludao, and Dandong in Liaoning Province, part of Yichun in Heilongjiang Province.
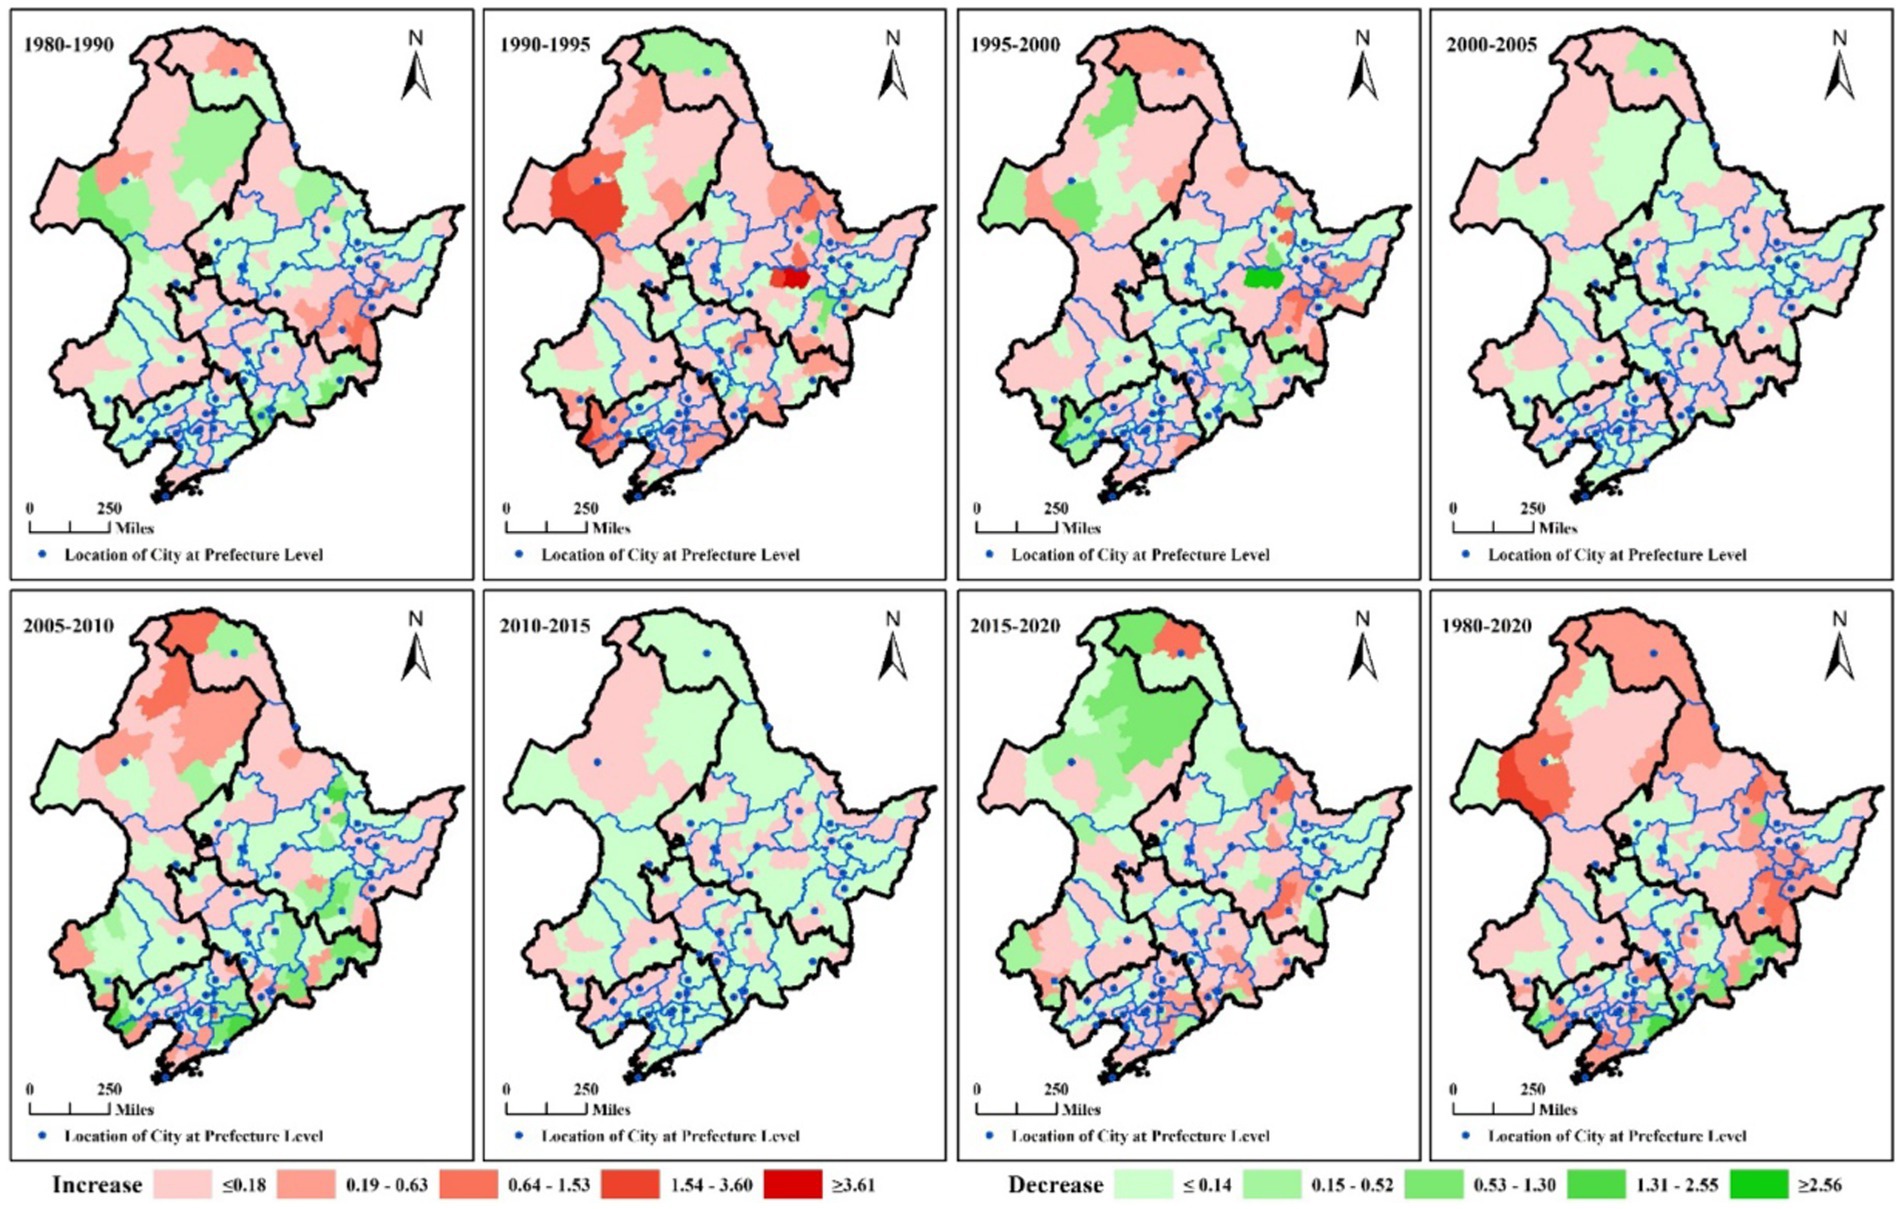
Figure 12. Spatial distribution of the average slope changes in cropland (Unit: degree). Red indicates an increase in the average slope changes in cropland, and red indicates a decrease in the average slope changes in cropland.
Figure 12 displays the numbers of regions with an increasing trend in the average slope of cropland in Liaoning Province. These numbers showed a pattern of increase, followed by a decrease, and then another increase. The regions were primarily located in most of Liaoning Province (1990–1995 and 2010–2015), the southeastern parts of central Liaoning Province (1995–2000), the central to northern and northwestern parts of Liaoning Province (2000–2005), Shenyang and its surrounding regions (1980–1990), Dalian (2005–2010), and the southwest of Liaoning Province (2010–2015).
In Jilin Province, Figure 12 reveals the numbers of regions with a decreasing trend in the average slope of cropland. These numbers followed a pattern of increase, then decrease, followed by another increase, and finally a decrease. These regions were predominantly located in most parts of Baishan, Tonghua, and the Yanbian Korean Autonomous Prefecture (1980–1990), parts of Baicheng, Songyuan, and Liaoyuan (1990–1995), most parts of Baicheng, Songyuan, Changchun, Jilin, Baishan, and Tonghua (1995–2000), most parts of Baicheng, and Siping (2000–2005), most parts of Siping, Changchun, Jilin, and the Yanbian Korean Autonomous Prefecture (2005–2010), most parts of Songyuan, Siping, Tonghua, Baisan, Jilin, and the Yanbian Korean Autonomous Prefecture (2010–2015), and parts of Changchun, Songyuan, and the Yanbian Korean Autonomous Prefecture (2015–2020).
In Heilongjiang Province Figure 12 depicts the numbers of regions with a decreasing trend in the average slope of cropland. This trend showed a pattern of decreasing, followed by an increase, and then another decrease. The regions were primarily located in parts of Qiqihar, Suihua, Daqing, Heyi, Yichun, Hegang, Daxinganling, and Jiamusi (1980–1990), parts of Daxinganling, Jiamusi, Shuangyashan, and Jixi, among others (1990–1995), parts of Qiqihar, Daqing, Suihua, Jiamusi, Yichun, and Jixi (1995–2000), most parts of Harbin, Jiamusi, Qiqihar, and Suihua (2000–2005), Harbin and most of its surrounding regions (2005–2010), and most parts of Daxinganling, Heihe, Harbin, Mudanjiang, Jixi, and Shuangyashan (2010–2015), and most parts of Daxinganling, Heihe, Jixi, Shuangyashan, and Jiamusi (2015–2020).
In Figure 12, the numbers of regions with an increasing trend in the average slope of cropland in Inner Mongolia East Four Leagues are presented. This trend displayed a pattern of both increasing and decreasing. The regions were primarily located in most parts of Hulunbuir (1990–1995 and 2005–2010), parts of Xing’an League (1990–1995, 1995–2000, and 2015–2020), parts of Tongliao (1990–1995 and 2015–2020), and parts of Chifeng (1995–2000, 2000–2005, and 2015–2020).
In each study period (Figure 12), the regions (≥0.64) with an increasing trend in the average slope of cropland were situated in various areas: parts of Mudanjiang in Heilongjiang Province (1980–1990), parts of Harbin and Yichun in Heilongjiang Province, parts of Hulunbeier in Inner Mongolia, parts of Chaoyang and Huludao in Liaoning Province (1990–1995), parts of Yichun and Mudanjiang in Heilongjiang Province (1995–2000), parts of Daxinganling in Heilongjiang Province, parts of Hulunbuir in Inner Mongolia (2005–2010), and parts of Daxinganling, Yichun, and Mudanjiang in Heilongjiang Province (2015–2020). Additionally, the regions (≥0.64) with a decreasing trend in the average slope of cropland were found in various areas: parts of Hulunbeier in Inner Mongolia (1980–1990), parts of Yichun and Mudanjiang in Heilongjiang Province (1990–1995), parts of Hulunbeier in Inner Mongolia, parts of Yichun and Harbin in Heilongjiang Province (1995–2000), parts of Yichun and Mudanjiang in Heilongjiang Province, parts of Baisan and the Yanbian Korean Autonomous Prefecture in Jilin Province, parts of Dandong, Chaoyang, and Huludao in Liaoning Province (2005–2010), and parts of Daxinganling in Heilongjiang Province, parts of Hulunbuir in Inner Mongolia (2015–2020).
3.4 Spatiotemporal characteristics of landscape changes in cropland
Table 6 shows the results of the calculation of PLAND, LSI, LPI, DIVISION, and CLUMPY index, and Table 7 shows their change value. During 1980–2020, Tables 6, 7 show the PLAND, LSI, LPI, and CLUMPY index increased, the PLAND index from 25.70 to 29.87%, increased 4.17%, LSI index from 510.52 to 518.91, increased 8.39, LPI index from 5.84 to 6.78%, increased 0.94%, and CLUMPY index from 0.8908 to 0.8909, increased by 0.0001. The changes in the above four indexes indicated the cropland proportion, predominance, and aggregation increased, and the cropland shape became more irregular. The DIVISION index decreased (Tables 6, 7), from 0.9957 to 0.9938, and decreased by 0.0019, indicating the cropland subdivision decreased during 1980–2020.
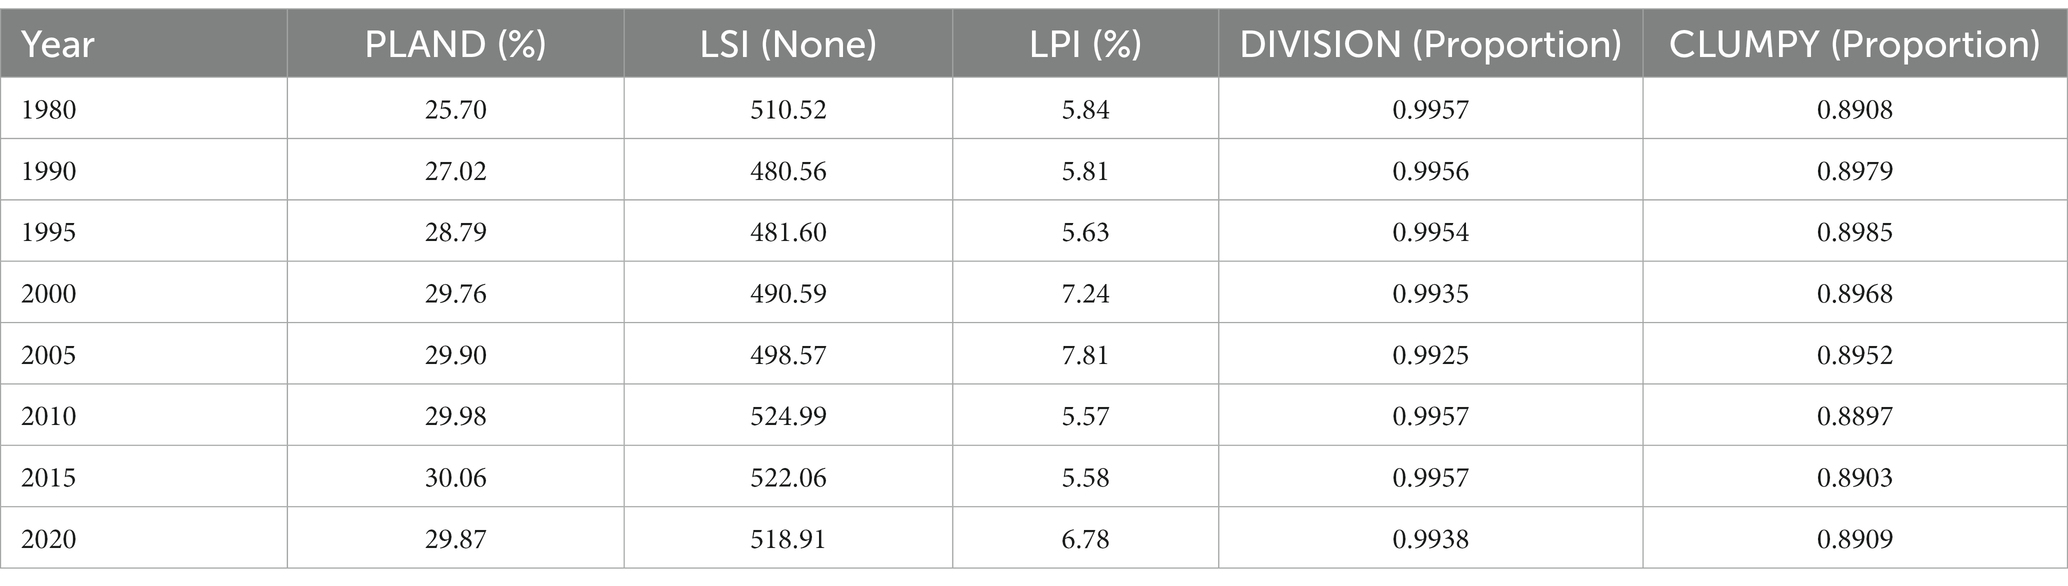
Table 6. The results of the calculation of landscape metrics in cropland during 1980–2020.
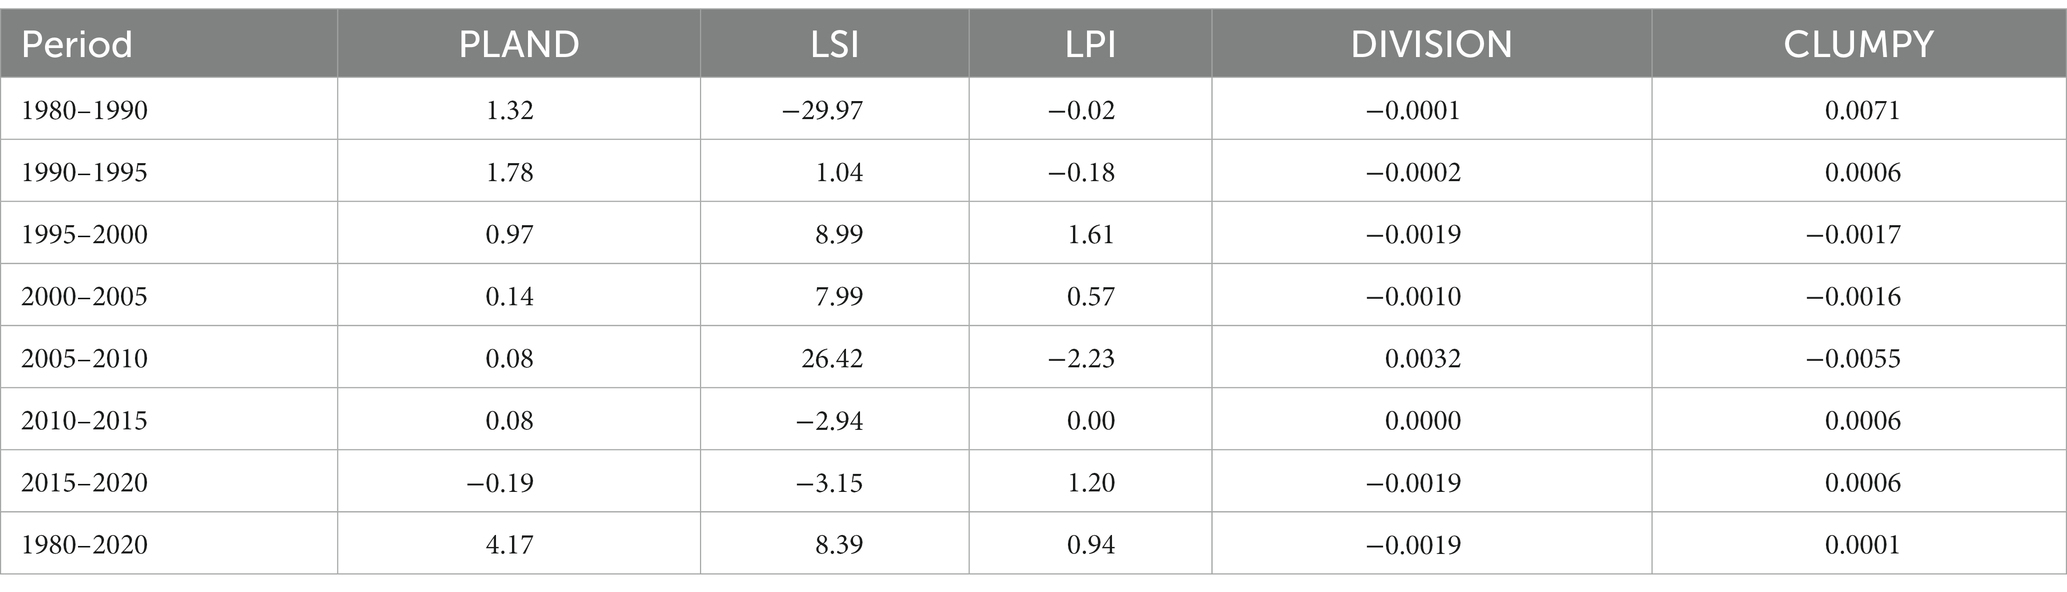
Table 7. The change value of the landscape metrics in cropland during 1980–2020.
As shown in Tables 6, 7. The cropland proportion in 2015 was the largest, with a proportion of 30.06, and changed significantly during 1990–1995, 1980–1990, and 1995–2000. The cropland shape in 2010 was the most irregular, with several 524.99, and became more irregular significantly during 2005–2010, and in 1990 was more regular than other years, with several 480.56, and became more irregular significantly during 1980–1990. The cropland predominance in 2005 was the largest, with a percentage of 7.81, and increased significantly during 1995–2000, and 2015–2020, and 1995 was the smallest, with a percentage of 5.63, and decreased significantly during 2005–2010. The DIVISION index was close to 1 each year, indicating the cropland subdivision was obvious. The CLUMPY index was close to 1 each year, indicating the distribution of cropland was aggregated.
Figure 13 shows Spatial distribution of average PLAND, LSI, LPI, DIVISION, and CLUMPY index in cropland. As shown in Figure 13A, the regions (≥29.00) with a high proportion of cropland were located in Sanjiang Plain, Songnen Plain, and Liaohe Plain. Figure 13B shows the regions (≥31.15) with more irregular of cropland shape were located in Liaoning Province except for the central region, most parts of Jilin Province, most parts of the four eastern leagues of Inner Mongolia, and most parts of Daxinganling, Heihe, Harbin, Mudanjiang, Jixi, Shuangyashan, Jiamusi, Heilongjiang Province, etc. Figure 13C shows the regions (≥25.69) with a high predominance of cropland were located in parts of Qiqihar, Suihua, Harbin, Jiamusi, and Hegang, Heilongjiang Province, and parts of Songyuan, Changchun, and Siping, Jilin Province, and parts of Tieling, Fuxin, Shenyang, Jinzhou, and Liaoyang, Liaoning Province, etc. Figure 13D shows the regions (≤0.69) with a low subdivision of cropland were located in Suihua and its surrounding regions, Heilongjiang Province, and Changchun, Siping, Jilin Province, and parts of Tieling, Shenyang, and Jinzhou, Liaoning Province, etc. Figure 13E shows the regions (≤0.91) with a low subdivision of cropland were located in most parts of Siping and Liaoyuan, Jilin Province, and parts of Tieling, Fushun, Liaoning Province, etc.
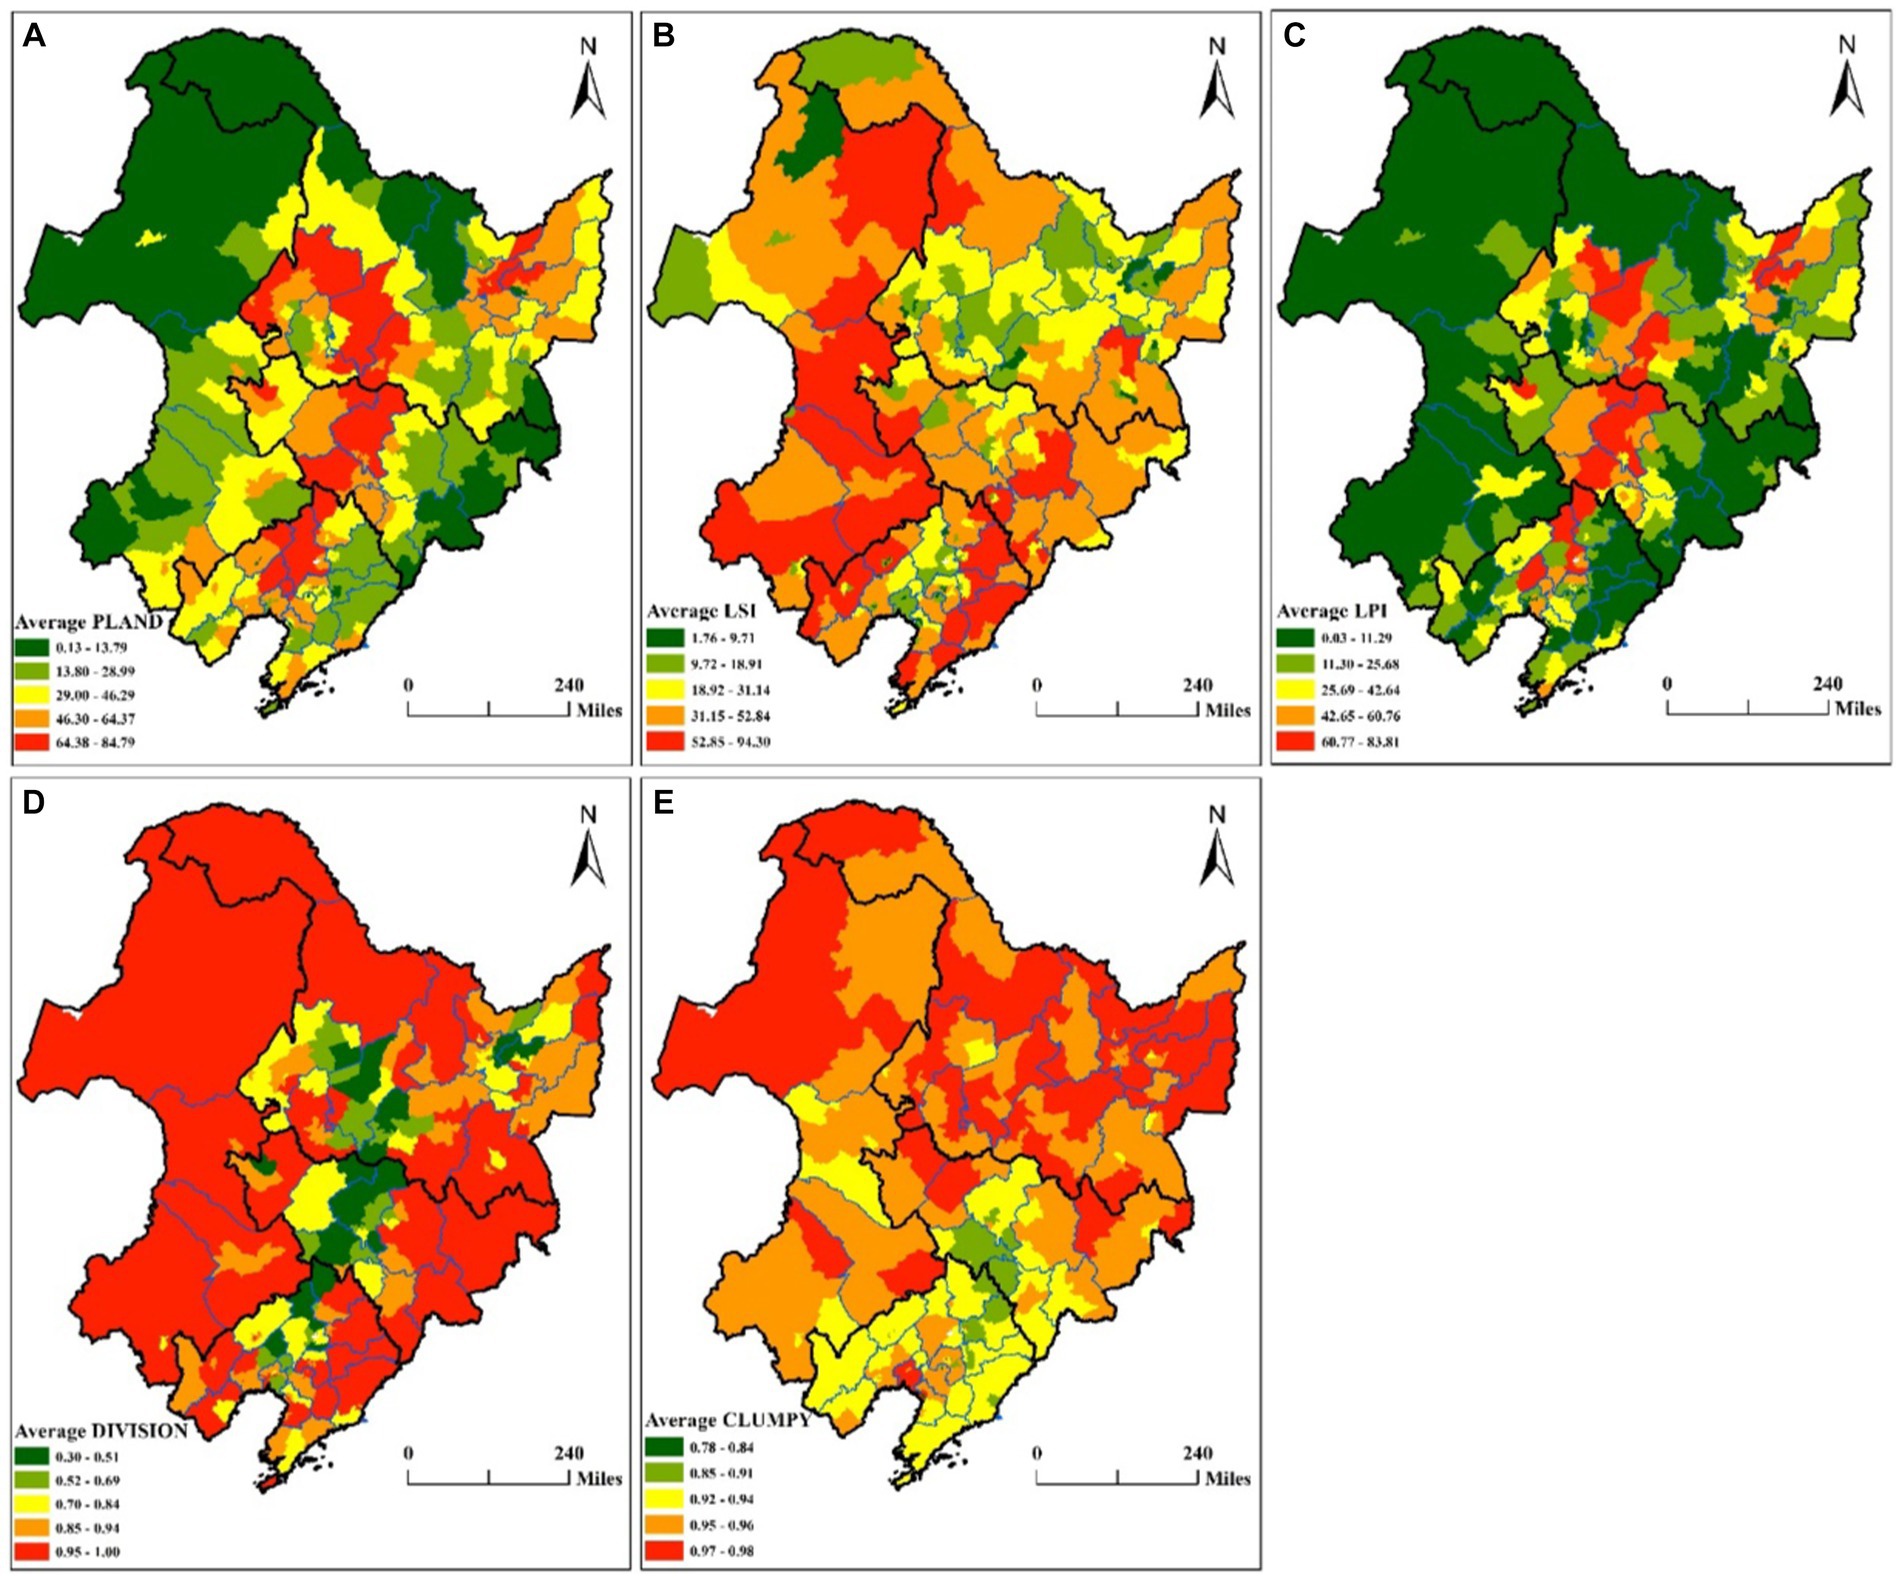
Figure 13. Spatial distribution of (A–E) denote average PLAND, LSI, LPI, DIVISION, and CLUMPY index (Unit: %, None, %, Proportion, Proportion).
3.4.1 Spatiotemporal characteristics of changes in PLAND, LSI, LPI, DIVISION, and CLUMPY index
During 1980–2020. As illustrated in Figure 14 (PLAND), spatial clusters representing an increased proportion (hot spots) of cropland were primarily located in the Sanjiang Plain, as well as in parts of Hulunbeier, Heihe, Qiqihar, and Baicheng. Conversely, spatial clusters indicating a decreased proportion (cold spots) of cropland were mainly found in Liaoning Province, and in parts of Siping, Liaoyuan, Changchun, and Songyuan in Jilin Province. As indicated in Figure 14 (LSI), spatial clusters of regions with irregular cropland shapes (hot spots) were identified in parts of Yichun, Daqing, and Harbin in Heilongjiang Province, as well as in parts of Songyuan in Jilin Province and most areas of Fuxin in Liaoning Province. Conversely, spatial clusters of regions with regular cropland shapes (cold spots) were found in parts of Harbin and Mudanjiang in Heilongjiang Province, as well as in parts of Jilin in Jilin Province. As illustrated in Figure 14 (LPI), the spatial clusters indicating the predominance (hot spots) of cropland increased and were primarily located in the Sanjiang Plain. Concurrently, spatial clusters indicating the predominance (cold spots) of cropland decreased and were found in Liaoning Province, along with parts of Siping in Jilin Province. As depicted in Figure 14 (DIVISION), the spatial clusters of increased cropland subdivision (hot spots) were primarily situated in most parts of Liaoning Province, along with parts of Songyuan and Siping in Jilin Province. Simultaneously, the spatial clusters indicating a decreased cropland subdivision (cold spots) were primarily located in the Sanjiang Plain. As shown in Figure 14 (CLUMPY), the spatial clusters of increased cropland aggregation (hot spots) were mainly located in parts of Changchun, Jilin, Jilin Province. Simultaneously, the spatial clusters indicating decreased cropland aggregation (cold spots) were primarily situated in most parts of Liaoning Province.
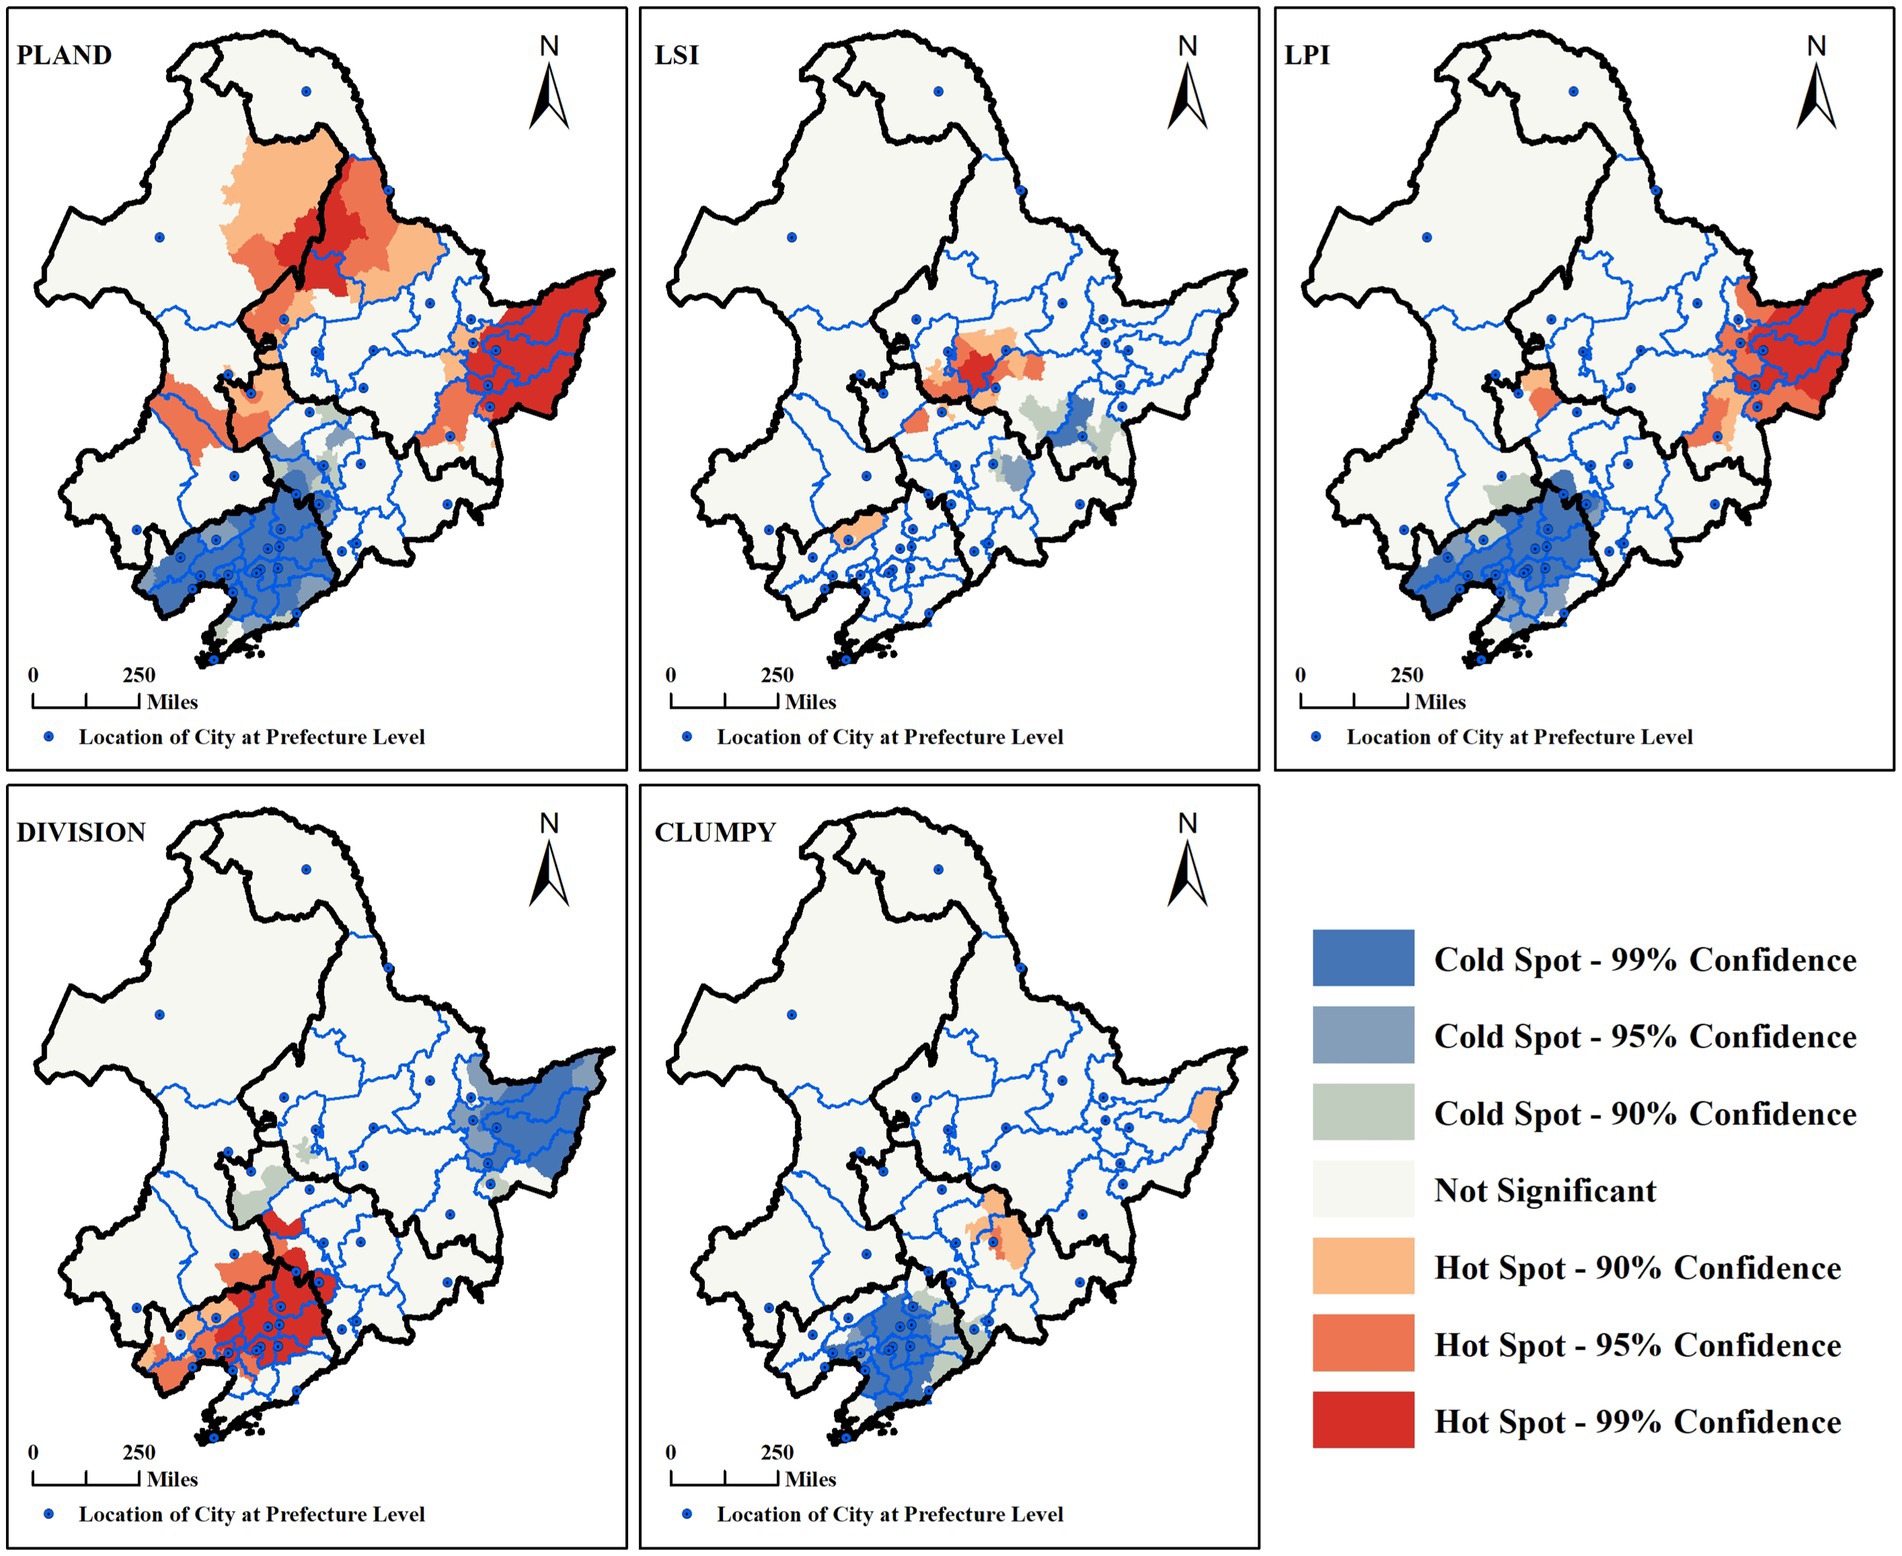
Figure 14. Hot spot analysis of changes in PLAND, LSI, LPI, DIVISION, and CLUMPY index during 1980–2020 (Unit: %, None, %, Proportion, Proportion).
4 Discussion
4.1 Driving mechanisms
The black soil area of northeast China is the most fertile in China and important for China’s food security. The Chinese government has enacted the Black Soil Protection Law of the People’s Republic of China to protect the black soil in the black soil area of northeastern China. This paper uses remote sensing data to analyze the characteristics of cropland changes in the black soil area of northeast China more systematically and comprehensively.
Figure 3 and Table 2 present the cropland area in the black soil area of northeastern China, which increased from 319,480.75 km2 in 1980 to 371,457.51 km2 in 2020, marking a growth of 51,976.76 km2. The regions that experienced cropland expansion were primarily the Sanjiang Plain in Heilongjiang Province and the Hulunbuir region in Inner Mongolia, bordering Heilongjiang Province. This cropland expansion occurred mainly during the periods of 1980–1990, 1990–1995, and 1995–2000. One of the significant factors driving this expansion was the increased demand for cropland resulting from population growth (Liu et al., 2017; You et al., 2021). According to population data from the statistical yearbook, the total population of Heilongjiang increased from 32.038 million in 1980 to 38.33 million in 2010, and then decreased to 31.71 million in 2020. The total population of Jilin increased from 22.107 million in 1980 to 27.238 million in 2010, and then decreased to 25.771 million in 2020. The total population of Liaoning increased from 34.869 million in 1980 to 42.517 million in 2010 and then decreased to 41.659 million in 2020. With the advancement of industrialization and urbanization, the Northeast no longer serves as the center of gravity for national economic development (Xiong, 2016; Tan et al., 2017). In response, the role of ensuring food security has become increasingly important, with policy factors playing a significant role, particularly after 2000. In September 2023, Chinese President Xi Jinping, during a speech in Harbin, put forth that ensuring stable grain production and supply is the primary task for the Northeast region.
This shift is exemplified by the Northeast Revitalization Plan, which, in 2007, designated Northeast China as a national important commodity grain and agricultural and livestock production base. Furthermore, the 14th Five-Year Plan for the Comprehensive Revitalization of Northeast China has underscored the importance of food security as one of the region’s key goals. Figure 4 (1980–2020) illustrates a decrease in cropland in and around prefecture-level city locations, accompanied by an increase in areas far from prefecture-level city locations. This phenomenon arises from the inherent conflict between cropland protection and local interests. Land conversion from agriculture to construction is a key strategy employed by local governments to attract investment and boost fiscal revenue (Shen et al., 2017). Figure 7 highlights a significant conflict between cropland protection and local interests, particularly in Liaoning and Jilin Province after 2005. One contributing factor to this conflict is the advantage offered by economic development opportunities (Chen et al., 2018).
During the period from 1980 to 2020, as shown in Table 3, cropland primarily resulted from the conversion of woodland and grassland, although there were instances of cropland being converted back to woodland and grassland. Regions where woodland was converted into cropland were mainly concentrated near the Changbai Mountain Range, the Sanjiang Plain, and areas bordering Heihe, Hulunbuir, and Qiqihar (see Figure 8). The conversion of grassland into cropland was primarily observed in Hulunbeier, Xing’an League, Tongliao City, parts of Chifeng in Inner Mongolia, and the Sanjiang Plain in Heilongjiang Province (see Figure 9). The substantial increase in cropland in Heilongjiang province contributes significantly to its status as the highest grain-producing province in China in recent years. After 2000, the implementation of policies promoting the return of cropland to grassland and woodland resulted in regions where cropland was converted into woodland (as shown in Figure 5) (Shen et al., 2021; Ma et al., 2022). Additionally, areas where cropland was converted into grassland were primarily situated in the East Four Leagues of Inner Mongolia (as depicted in Figure 6). The conversion of a significant amount of woodland and grassland to cropland has multifaceted implications for the environment, biodiversity, and sustainable land use. While expanding cropland can contribute to increased food production, it often comes at the expense of natural ecosystems. The loss of woodland and grassland can lead to habitat destruction, affecting various plant and animal species. Additionally, the conversion process may contribute to soil erosion, reduced water quality, and increased greenhouse gas emissions, further impacting the overall ecological balance. Moreover, the conversion of diverse ecosystems into monoculture cropland might result in decreased resilience to pests and diseases, potentially necessitating increased reliance on pesticides and fertilizers. Striking a harmonious balance between agricultural development and environmental preservation is essential for achieving long-term sustainability and securing food resources for growing populations.
As shown in Tables 4, 5, during the period from 1980 to 2020 in the black soil region of northeast China, the average altitude and slope of cropland increased by 2.06 m, from 237.7656 to 239.8277 m, and the average slope of cropland increased by 0.0369 degrees, from 2.4455 degrees to 2.4824 degrees. Notably, this trend was observed in provincial capitals and prefecture-level municipalities responsible for economic development. Urbanization in China has led to the relocation of farmland to higher elevations due to the constraints imposed by the requisition–compensation balance (Chen et al., 2022). In the implementation process, the dynamic balance system has replaced the basic farmland protection system. This shift has resulted in an increased conversion of high-quality cropland into industrial and residential uses, supplemented by low-quality cropland, consequently diminishing the quality of protected land Furthermore, under the policy of ‘linking the increase in urban construction land with a decrease in rural construction land,’ much of the compensatory farmland provided after land exploitation has been deemed inefficient, unreasonable, and unstable (Liu et al., 2019). The elevation and slope of cropland are pivotal factors shaping the agricultural landscape, and any increase in these elements inevitably has a substantial impact on cropland productivity. As cropland ascends to higher elevations or becomes steeper in slope, a myriad of challenges emerges, affecting agricultural practices and food production. Managing irrigation becomes more complex, soil erosion risk rises, and susceptibility to extreme weather events increases.
The evolving landscape patterns of cropland carry significant implications for the modernization and mechanization of agriculture. The shift toward mechanized and modernized agricultural production is a prominent trend, especially in the context of ongoing urbanization, industrialization, and the reduction of the agricultural population. Understanding these alterations in the cropland landscape is vital to facilitate a smooth transition toward efficient and sustainable agricultural practices. The PLAND, LSI, LPI, DIVISION, and CLUMPY landscape metrics were employed to analyze changes in landscape proportion, shape, predominance, subdivision, and aggregation in cropland. With the increasing influence of human activities in the black soil area of northeast China from 1980 to 2020, the landscape pattern of cultivated land underwent significant transformations. Cropland proportion, predominance, and aggregation increased, while the shape of cropland became more irregular. However, the subdivision of cropland decreased insignificantly (see Table 6). Given the changes in the landscape use of cropland discussed above, we observe a gradual strengthening of the food production function in the northeastern black soil area, signifying a critical contribution to China’s food security. The cultivated land in this region is concentrated and continuous, facilitating mechanized operations. This concentration also accelerates the pace of modernization in agricultural production mechanization.
From 1980 to 2020, as depicted in Figure 14, it becomes evident that the changes in cropland proportion, predominance, subdivision, and aggregation were primarily concentrated in the Sanjiang Plain and Liaoning Province. These observations highlight the significant impact of human activities in these regions. Liaoning Province was the main region where cropland converted into built-up land, including urban development and industrial use. In contrast, the Sanjiang Plain experienced substantial growth in cropland. Cropland in Liaoning Province was repurposed for higher-yield uses, such as urban construction and industrial zones. Due to various factors, the Sanjiang Plain’s economic development potential for higher yields is limited, and it primarily maintains a focus on agricultural development, establishing itself as a vital grain-producing region for the country.
In summary, the changes in China’s cropland are primarily influenced by natural resource endowment, population growth, and food security policies. Firstly, the Northeast Black Soil Region is endowed with abundant land resources, fertile soil, ample water resources, and relatively flat terrain. The early growth of cropland in this region was driven by its strong land resource endowment and population growth. Due to the relatively low returns from agricultural production, particularly with the negative impact of urbanization and industrial development on agriculture, a majority of people are reluctant to engage in agricultural activities. The outflow of rural population and the conversion of substantial high-quality cropland into construction land have prompted the Chinese government to place greater emphasis on ensuring food security, leading to the successive implementation of cropland protection policies such as the Basic Farmland System and the balance of cropland occupation and compensation.
4.2 Recommendations
Based on these findings, the following are policy recommendations for the protection of cropland in the black soil region of northeast China. Scientific zoning of cropland for grain production. In particular, cropland is located in Sanjiang Plain, Songnen Plain, and Liaohe Plain, as it is flat and fertile and easy to realize mechanized farming, especially in the context of modern agricultural production. Naturally, cropland designated for food production should be located at appropriate altitudes and slopes, and any tendency to shift cropland to higher altitudes and steeper slopes should be controlled. In this paper, it was observed that the configuration of cropland is becoming increasingly complex, which hinders mechanization. Therefore, there is a need for careful consideration of land shape when delineating areas for grain production to facilitate mechanization. This is especially crucial given the growing scarcity of human resources in agriculture. The study also discovered that cultivated land is becoming fragmented, which somewhat hinders mechanized operations. Therefore, it is necessary to implement measures to prevent the fragmentation of cultivated land. The real-time monitoring of cropland changes (The violation of cropland protection) using remote sensing in cropland for grain production. With the advancement of remote sensing technology, high-resolution image capture becomes easy and provides an objective check of cropland changes. Changes in the regions of cropland for grain production need to be monitored in a focused manner.
5 Limitations and future work
We conducted an in-depth analysis of the spatiotemporal evolution characteristics of cropland in the Northeast Black Soil Region at the county level from 1980 to 2020. This analysis included the spatiotemporal evolution features of cropland’s altitude and slope, as well as the spatiotemporal evolution features of the landscape pattern of cropland. This study provides a comprehensive understanding of the changes in cropland in the Northeast Black Soil Region under the influence of human activities, offering scientific references for land management and cropland protection in this region. However, this research has some limitations. Firstly, it is constrained by the accuracy of remote sensing data. Secondly, the methods employed may not fully capture the changing situation of cropland. Thirdly, there is a lack of quantitative analysis of driving mechanisms. Our future work will focus on constructing a theoretical framework for the changes in cropland in this region and quantitatively analyzing the driving mechanisms.
6 Conclusion
In this paper, we focus on Northeast China, which represents the world’s third-largest black soil region. At the county scale, we analyzed nearly 40 years of land use/cover maps from 1980, 1990, 1995, 2000, 2005, 2010, 2015, and 2020, with a cell size of 30 m × 30 m. Our analysis employed mathematical statistics, GIS spatial analysis, land use transition matrix, landscape pattern analysis, and hot spot analysis methods to examine the spatiotemporal evolutionary characteristics of cropland quantity, spatial distribution, conversion patterns, altitude, slope, and landscape pattern within the Northeast China black soil region. The primary findings of this study are as follows:
1. During 1980–2020. The cropland area increased from 319,480.75 km2 to 371,457.51 km2, an increase by 51,976.76km2. Within the prefecture-level city, the trend of decreasing the amount of cropland in and around the prefecture-level city locations, and the trend of increasing the amount of cropland was in regions far from the prefecture-level city locations.
2. During 1980–2020. Cropland was mainly derived from woodland, grassland, and unused land, with areas of 32230.00 km2, 31945.30 km2, and 15421.20 km2, and cropland mainly converted into woodland, built-up land, and grassland, with areas of 11906.62 km2, 10809.33 km2, and 6406.81 km2.
3. During 1980–2020. The average altitude of cropland in the black soil region of northeast China increased by 2.06 m, from 237.7656 m to 239.8277 m. The average slope of cropland in the black soil region of northeast China increased by 0.0369 degree, from 2.4455 degree to 2.4824 degree. The prefecture-level city locations and their surrounding areas where the average altitude and slope in cropland was an increasing trend.
4. During 1980–2020. Cropland in the black soil region of northeast China proportion, predominance, and aggregation increased, and the cropland shape became more irregular, and the cropland subdivision decreased.
Data availability statement
The original contributions presented in the study are included in the article/supplementary material, further inquiries can be directed to the corresponding author.
Author contributions
JH: Data curation, Formal analysis, Funding acquisition, Project administration, Supervision, Writing – review & editing. DR: Data curation, Methodology, Software, Visualization, Writing – original draft, Writing – review & editing. DT: Data curation, Writing – review & editing. XL: Data curation, Writing – review & editing.
Funding
The author(s) declare financial support was received for the research, authorship, and/or publication of this article. This paper is supported by the Research Fund of Renmin University of China (Fundamental Research Funds of Central Universities) under the project “Research on the Construction of Urban–Rural Unified Construction Land Market and Benefit Distribution Relationship Based on Land Development Right” (Grant no. 20XNL005).
Conflict of interest
The authors declare that the research was conducted in the absence of any commercial or financial relationships that could be construed as a potential conflict of interest.
Publisher’s note
All claims expressed in this article are solely those of the authors and do not necessarily represent those of their affiliated organizations, or those of the publisher, the editors and the reviewers. Any product that may be evaluated in this article, or claim that may be made by its manufacturer, is not guaranteed or endorsed by the publisher.
Footnotes
References
Abera, T. A., Heiskanen, J., Pellikka, P. K. E., Adhikari, H., and Maeda, E. E. (2020). Climatic impacts of bushland to cropland conversion in eastern Africa. Sci. Total Environ. 717:137255. doi: 10.1016/j.scitotenv.2020.137255
Andrade de Sá, S., Palmer, C., and di Falco, S. (2013). Dynamics of indirect land-use change: empirical evidence from Brazil. J. Environ. Econ. Manag. 65, 377–393. doi: 10.1016/j.jeem.2013.01.001
Cai, T., Zhang, X., Xia, F., Zhang, Z., Yin, J., and Wu, S. (2021). The process-mode-driving force of cropland expansion in arid regions of China based on the land use remote sensing monitoring data. Remote Sens. 13:2949. doi: 10.3390/rs13152949
Chen, J., Cheng, S., and Song, M. (2017). Estimating policy pressure for China's cultivated land use protection based on an extended index. Phys. Chem. Earth 101, 21–34. doi: 10.1016/j.pce.2017.05.002
Chen, G., Hu, Y., Zhang, R., Yin, Z., Zhang, Y., and Ma, K. (2021). Evolution of south-north transport and urbanization effects on PM2.5 distribution with increased pollution levels in Beijing. Sustain. Cities Soc. 72:103060. doi: 10.1016/j.scs.2021.103060
Chen, H., Meng, F., Yu, Z., and Tan, Y. (2022). Spatial–temporal characteristics and influencing factors of farmland expansion in different agricultural regions of Heilongjiang Province China. Land Use Policy 115:106007. doi: 10.1016/j.landusepol.2022.106007
Chen, L., Ren, C., Zhang, B., Wang, Z., and Liu, M. (2018). Quantifying urban land sprawl and its driving forces in Northeast China from 1990 to 2015. Sustainability 10:188. doi: 10.3390/su10010188
Chen, H., Tan, Y., Xiao, W., Li, G., Meng, F., He, T., et al. (2022). Urbanization in China drives farmland uphill under the constraint of the requisition–compensation balance. Sci. Total Environ. 831:154895. doi: 10.1016/j.scitotenv.2022.154895
Chen, Y., Wang, S., and Wang, Y. (2022). Spatiotemporal evolution of cultivated land non-Agriculturalization and its drivers in typical areas of Southwest China from 2000 to 2020. Remote Sens. 14:3211. doi: 10.3390/rs14133211
Chen, W., Zeng, J., and Li, N. (2021). Change in land-use structure due to urbanisation in China. J. Clean. Prod. 321:128986. doi: 10.1016/j.jclepro.2021.128986
Dadashpoor, H., Azizi, P., and Moghadasi, M. (2019). Land use change, urbanization, and change in landscape pattern in a metropolitan area. Sci. Total Environ. 655, 707–719. doi: 10.1016/j.scitotenv.2018.11.267
Deng, J. S., Qiu, L. F., Wang, K., Yang, H., and Shi, Y. Y. (2011). An integrated analysis of urbanization-triggered cropland loss trajectory and implications for sustainable land management. Cities 28, 127–137. doi: 10.1016/j.cities.2010.09.005
Fitton, N., Alexander, P., Arnell, N., Bajzelj, B., Calvin, K., Doelman, J., et al. (2019). The vulnerabilities of agricultural land and food production to future water scarcity. Glob. Environ. Chang. 58:101944. doi: 10.1016/j.gloenvcha.2019.101944
Guo, Y., Xia, H., Pan, L., Zhao, X., and Li, R. (2022). Mapping the northern limit of double cropping using a phenology-based algorithm and Google earth engine. Remote Sens. 14:1004. doi: 10.3390/rs14041004
Guo, Y., Xia, H., Zhao, X., Qiao, L., du, Q., and Qin, Y. (2023). Early-season mapping of winter wheat and garlic in Huaihe Basin using Sentinel-1/2 and Landsat-7/8 imagery. IEEE J. Select. Top. Appl. Earth Observ. Remote Sens. 16, 8809–8817. doi: 10.1109/JSTARS.2022.3215589
Hu, Q., Xiang, M., Chen, D., Zhou, J., Wu, W., and Song, Q. (2020). Global cropland intensification surpassed expansion between 2000 and 2010: a spatiotemporal analysis based on GlobeLand30. Sci. Total Environ. 746:141035. doi: 10.1016/j.scitotenv.2020.141035
Hu, Q., Yang, Y., Han, S., and Wang, J. (2019). Degradation of agricultural drainage water quantity and quality due to farmland expansion and water-saving operations in arid basins. Agric. Water Manag. 213, 185–192. doi: 10.1016/j.agwat.2018.10.019
Huang, C., Zhang, C., and Li, H. (2022). Assessment of the impact of rubber plantation expansion on regional carbon storage based on time series remote sensing and the InVEST model. Remote Sens. 14:6234. doi: 10.3390/rs14246234
Jiang, G., Wang, M., Qu, Y., Zhou, D., and Ma, W. (2020). Towards cultivated land multifunction assessment in China: applying the “influencing factors-functions-products-demands” integrated framework. Land Use Policy 99:104982. doi: 10.1016/j.landusepol.2020.104982
Li, X., He, H. S., Bu, R., Wen, Q., Chang, Y., Hu, Y., et al. (2005). The adequacy of different landscape metrics for various landscape patterns. Pattern Recogn. 38, 2626–2638. doi: 10.1016/j.patcog.2005.05.009
Li, S., Shao, Y., Hong, M., Zhu, C., Dong, B., Li, Y., et al. (2023). Impact mechanisms of urbanization processes on supply-demand matches of cultivated land multifunction in rapid urbanization areas. Habitat Int. 131:102726. doi: 10.1016/j.habitatint.2022.102726
Lichtenberg, E., and Ding, C. (2008). Assessing farmland protection policy in China. Land Use Policy 25, 59–68. doi: 10.1016/j.landusepol.2006.01.005
Liu, L., Liu, Z., Gong, J., Wang, L., and Hu, Y. (2019). Quantifying the amount, heterogeneity, and pattern of farmland: implications for China’s requisition-compensation balance of farmland policy. Land Use Policy 81, 256–266. doi: 10.1016/j.landusepol.2018.10.008
Liu, J., Liu, M., Zhuang, D., Zhang, Z., and Deng, X. (2003). Study on spatial pattern of land-use change in China during 1995–2000. Sci. China Ser. D Earth Sci. 46, 373–384. doi: 10.1360/03yd9033
Liu, Z., Xiu, C., Wei, Y., et al. (2017). Spatial pattern of population change and its influencing factors in Northeast China from 1990 to 2010. Northwest Popul. 38, 19–26. doi: 10.15884/j.cnki.issn.1007-0672.2017.05.003
Liu, F., Zhang, Z., Zhao, X., Wang, X., Zuo, L., Wen, Q., et al. (2019). Chinese cropland losses due to urban expansion in the past four decades. Sci. Total Environ. 650, 847–857. doi: 10.1016/j.scitotenv.2018.09.091
Lu, X., Shi, Y., Chen, C., and Yu, M. (2017). Monitoring cropland transition and its impact on ecosystem services value in developed regions of China: a case study of Jiangsu Province. Land Use Policy 69, 25–40. doi: 10.1016/j.landusepol.2017.08.035
Ma, R., Xia, C., Liu, Y., Wang, Y., Zhang, J., Shen, X., et al. (2022). Spatiotemporal change of net primary productivity and its response to climate change in temperate grasslands of China. Front. Plant Sci. 13:800. doi: 10.3389/fpls.2022.899800
Ma, L., Yang, S., Gu, Q., Li, J., Yang, X., Wang, J., et al. (2019). Spatial and temporal mapping of cropland expansion in northwestern China with multisource remotely sensed data. Catena 183:104192. doi: 10.1016/j.catena.2019.104192
Mancino, G., Nolè, A., Salvati, L., and Ferrara, A. (2016). In-between forest expansion and cropland decline: a revised USLE model for soil erosion risk under land-use change in a Mediterranean region. Ecol. Indic. 71, 544–550. doi: 10.1016/j.ecolind.2016.07.040
McGarigal, K., and Marks, B. J. (1995). FRAGSTATS: Spatial pattern analysis program for quantifying landscape structure. doi: 10.2737/pnw-gtr-351,
Meng, B., Wang, X., Zhang, Z., and Huang, P. (2022). Spatiotemporal pattern and driving force evolution of cultivated land occupied by urban expansion in the Chengdu metropolitan area. Land 11:1458. doi: 10.3390/land11091458
Moraes, M. C. P. D., Mello, K. D., and Toppa, R. H. (2017). Protected areas and agricultural expansion: biodiversity conservation versus economic growth in the southeast of Brazil. J. Environ. Manag. 188, 73–84. doi: 10.1016/j.jenvman.2016.11.075
Ngoma, H., Pelletier, J., Mulenga, B. P., and Subakanya, M. (2021). Climate-smart agriculture, cropland expansion and deforestation in Zambia: linkages, processes and drivers. Land Use Policy 107:105482. doi: 10.1016/j.landusepol.2021.105482
Ning, J., Liu, J., Kuang, W., Xu, X., Zhang, S., Yan, C., et al. (2018). Spatiotemporal patterns and characteristics of land-use change in China during 2010–2015. J. Geogr. Sci. 28, 547–562. doi: 10.1007/s11442-018-1490-0
Pendrill, F., and Persson, U. M. (2017). Combining global land cover datasets to quantify agricultural expansion into forests in Latin America: limitations and challenges. PLoS One 12:e0181202. doi: 10.1371/journal.pone.0181202
Pool, D. B., Panjabi, A. O., Macias-Duarte, A., and Solhjem, D. M. (2014). Rapid expansion of croplands in Chihuahua, Mexico threatens declining north American grassland bird species. Biol. Conserv. 170, 274–281. doi: 10.1016/j.biocon.2013.12.019
Qiu, M., Li, T., Gao, X., Yin, G., and Zhou, J. (2020). Effects of urbanization on cd accumulation in agricultural soils: from the perspective of accessibility gradient. Sci. Total Environ. 701:134799. doi: 10.1016/j.scitotenv.2019.134799
Qiu, B., Li, H., Tang, Z., Chen, C., and Berry, J. (2020). How cropland losses shaped by unbalanced urbanization process? Land Use Policy 96:104715. doi: 10.1016/j.landusepol.2020.104715
Radwan, T. M., Blackburn, G. A., Whyatt, J. D., and Atkinson, P. M. (2019). Dramatic loss of agricultural land due to urban expansion threatens food security in the Nile Delta, Egypt. Remote Sens. 11:332. doi: 10.3390/rs11030332
Ran, D., Zhang, Z., and Jing, Y. (2022). A study on the spatial–temporal evolution and driving factors of non-grain production in China major grain-producing provinces. Int. J. Environ. Res. Public Health 19:16630. doi: 10.3390/ijerph192416630
Shen, X., Jiang, M., Lu, X., Liu, X., Liu, B., Zhang, J., et al. (2021). Aboveground biomass and its spatial distribution pattern of herbaceous marsh vegetation in China. Sci. China Earth Sci. 64, 1115–1125. doi: 10.1007/s11430-020-9778-7
Shen, X., Wang, L., Wu, C., et al. (2017). Local interests or centralized targets? How China’s local government implements the farmland policy of requisition–compensation balance. Land Use Policy 67, 716–724. doi: 10.1016/j.landusepol.2017.06.012
Shi, Y., Duan, W., Fleskens, L., Li, M., and Hao, J. (2020). Study on evaluation of regional cultivated land quality based on resource-asset-capital attributes and its spatial mechanism. Appl. Geogr. 125:102284. doi: 10.1016/j.apgeog.2020.102284
Shi, G., Jiang, N., and Yao, L. (2018). Land use and cover change during the rapid economic growth period from 1990 to 2010: a case study of Shanghai. Sustainability 10:426. doi: 10.3390/su10020426
Singh, P. P., Sabnani, C. S., and Kapse, V. S. (2021). Hotspot analysis of structure fires in urban agglomeration: a case of Nagpur City, India. Fire 4:38. doi: 10.3390/fire4030038
Song, W., and Pijanowski, B. C. (2014). The effects of China's cultivated land balance program on potential land productivity at a national scale. Appl. Geogr. 46, 158–170. doi: 10.1016/j.apgeog.2013.11.009
Song, W., Zhang, H., Zhao, R., Wu, K., Li, X., Niu, B., et al. (2022). Study on cultivated land quality evaluation from the perspective of farmland ecosystems. Ecol. Indic. 139:108959. doi: 10.1016/j.ecolind.2022.108959
Tan, J., Lo, K., Qiu, F., Liu, W., Li, J., and Zhang, P. (2017). Regional economic resilience: resistance and recoverability of resource-based cities during economic crises in Northeast China. Sustainability 9:2136. doi: 10.3390/su9122136
Tang, L., Ke, X., Zhou, T., Zheng, W., and Wang, L. (2020). Impacts of cropland expansion on carbon storage: a case study in Hubei, China. J. Environ. Manag. 265:110515. doi: 10.1016/j.jenvman.2020.110515
Tran, D. X., Pla, F., Latorre-Carmona, P., Myint, S. W., Caetano, M., and Kieu, H. V. (2017). Characterizing the relationship between land use land cover change and land surface temperature. ISPRS J. Photogramm. Remote Sens. 124, 119–132. doi: 10.1016/j.isprsjprs.2017.01.001
Turner, B. L., Skole, D., Sanderson, S., Fischer, G., Fresco, L., Leemans, R., et al. Land-use and land-cover change. Science/research plan. Global change report (Sweden), (1995).
Wang, J., Lin, Y., Glendinning, A., and Xu, Y. (2018). Land-use changes and land policies evolution in China’s urbanization processes. Land Use Policy 75, 375–387. doi: 10.1016/j.landusepol.2018.04.011
Wang, Z., Wang, L., Xu, R., Huang, H., and Wu, F. (2012). GIS and RS based assessment of cultivated land quality of Shandong Province. Procedia Environ. Sci. 12, 823–830. doi: 10.1016/j.proenv.2012.01.354
Wang, J., Wang, S., and Zhou, C. (2021). Quantifying embodied cultivated land-use change and its socioeconomic driving forces in China. Appl. Geogr. 137:102601. doi: 10.1016/j.apgeog.2021.102601
Wang, M., Xu, Q., Fan, Z., and Sun, X. (2021). The imprint of built-up land expansion on cropland distribution and productivity in Shandong Province. Land 10:639. doi: 10.3390/land10060639
Wang, Y., Yao, L., Xu, Y., Sun, S., and Li, T. (2021). Potential heterogeneity in the relationship between urbanization and air pollution, from the perspective of urban agglomeration. J. Clean. Prod. 298:126822. doi: 10.1016/j.jclepro.2021.126822
Wang, L., Zhang, S., Xiong, Q., Liu, Y., Liu, Y., and Liu, Y. (2022). Spatiotemporal dynamics of cropland expansion and its driving factors in the Yangtze River Economic Belt: a nuanced analysis at the county scale. Land Use Policy 119:106168. doi: 10.1016/j.landusepol.2022.106168
Wimberly, M. C., Janssen, L. L., Hennessy, D. A., Luri, M., Chowdhury, N. M., and Feng, H. (2017). Cropland expansion and grassland loss in the eastern Dakotas: new insights from a farm-level survey. Land Use Policy 63, 160–173. doi: 10.1016/j.landusepol.2017.01.026
Wu, Y., Shan, L., Guo, Z., and Peng, Y. (2017). Cultivated land protection policies in China facing 2030: dynamic balance system versus basic farmland zoning. Habitat Int. 69, 126–138. doi: 10.1016/j.habitatint.2017.09.002
Xi, F., He, H. S., Clarke, K. C., Hu, Y., Wu, X., Liu, M., et al. (2012). The potential impacts of sprawl on farmland in Northeast China—evaluating a new strategy for rural development. Landsc. Urban Plan. 104, 34–46. doi: 10.1016/j.landurbplan.2011.09.003
Xiong, Z. (2015). Simulated effects of cropland expansion on seasonal temperatures over China. Phys. Chem. Earth 87–88, 108–118. doi: 10.1016/j.pce.2015.08.012
Xiong, F. (2016). Analysis on the causes and countermeasures of the economic predicament in the Northeast China. Mod. Econ. 7, 1014–1019. doi: 10.4236/me.2016.79103
Xiong, N., Yu, R., Yan, F., Wang, J., and Feng, Z. (2022). Land use and land cover changes and prediction based on multi-scenario simulation: a case study of Qishan County, China. Remote Sens. 14:4011. doi: 10.3390/rs14164041
Yin, H., Hu, Y., Liu, M., Li, C., and Chang, Y. (2022). Evolutions of 30-year spatiotemporal distribution and influencing factors of Suaeda salsa in Bohai Bay, China. Remote Sens. 14:138. doi: 10.3390/rs14010138
You, H., Hu, X., and Wu, Y. (2018). Farmland use intensity changes in response to rural transition in Zhejiang province, China. Land Use Policy 79, 350–361. doi: 10.1016/j.landusepol.2018.08.029
You, H., Yang, J., Xue, B., Xiao, X., Xia, J., Jin, C., et al. (2021). Spatial evolution of population change in Northeast China during 1992–2018. Sci. Total Environ. 776:146023. doi: 10.1016/j.scitotenv.2021.146023
Yu, Q., Hu, Q., van Vliet, J., Verburg, P. H., and Wu, W. (2018). GlobeLand30 shows little cropland area loss but greater fragmentation in China. Int. J. Appl. Earth Obs. Geoinf. 66, 37–45. doi: 10.1016/j.jag.2017.11.002
Zhang, Z., Li, N., Wang, X., Liu, F., and Yang, L. (2016). A comparative study of urban expansion in Beijing, Tianjin and Tangshan from the 1970s to 2013. Remote Sens. 8:496. doi: 10.3390/rs8060496
Zhang, G., Xiao, X., Biradar, C. M., Dong, J., Qin, Y., Menarguez, M. A., et al. (2017). Spatiotemporal patterns of paddy rice croplands in China and India from 2000 to 2015. Sci. Total Environ. 579, 82–92. doi: 10.1016/j.scitotenv.2016.10.223
Zhang, J., Qin, Y., Zhang, Y., Lu, X., and Cao, J. (2023). Comparative Assessment of the Spatiotemporal Dynamics and Driving Forces of Natural and Constructed Wetlands in Arid and Semiarid Areas of Northern China. Land 12:1980. doi: 10.3390/land12111980
Zhao, Z.-H., Ouyang, F., and Ge, F. (2015). Cropland expansion facilitated the outbreak of cereal aphids during 1951–2010 in China. Sci. Bull. 60, 1036–1037. doi: 10.1007/s11434-015-0795-y
Zhou, Y., Li, X., and Liu, Y. (2021). Cultivated land protection and rational use in China. Land Use Policy 106:105454. doi: 10.1016/j.landusepol.2021.105454
Zhou, M., Sun, H., and Ke, N. (2023). The spatial and temporal evolution of coordination degree concerning China cultivated land green utilization efficiency and high-quality agricultural development. Land 12:127. doi: 10.3390/land12010127
Zhou, X., Wu, D., Li, J., Liang, J., Zhang, D., and Chen, W. (2022). Cultivated land use efficiency and its driving factors in the Yellow River Basin China. Ecol. Indic. 144:109411. doi: 10.1016/j.ecolind.2022.109411
Keywords: cropland, remote sensing, land use transition matrix, landscape pattern, hot spot analysis, Northeast China
Citation: He J, Ran D, Tan D and Liao X (2024) Spatiotemporal evolution of cropland in Northeast China’s black soil region over the past 40 years at the county scale. Front. Sustain. Food Syst. 7:1332595. doi: 10.3389/fsufs.2023.1332595
Edited by:
Tibebu Kassawmar, Addis Ababa University, EthiopiaReviewed by:
Haoming Xia, Henan University, ChinaXiangjin Shen, Chinese Academy of Sciences (CAS), China
Copyright © 2024 He, Ran, Tan and Liao. This is an open-access article distributed under the terms of the Creative Commons Attribution License (CC BY). The use, distribution or reproduction in other forums is permitted, provided the original author(s) and the copyright owner(s) are credited and that the original publication in this journal is cited, in accordance with accepted academic practice. No use, distribution or reproduction is permitted which does not comply with these terms.
*Correspondence: Duan Ran, cmFuZHVhbkBydWMuZWR1LmNu