 Wasiu Awoyale
 Busie Maziya-Dixon1*
 Hakeem Oyedele
 Michael Adesokan
95% of researchers rate our articles as excellent or good
Learn more about the work of our research integrity team to safeguard the quality of each article we publish.
Find out more
ORIGINAL RESEARCH article
Front. Sustain. Food Syst. , 27 November 2023
Sec. Sustainable Food Processing
Volume 7 - 2023 | https://doi.org/10.3389/fsufs.2023.1272724
The use of the biophysical and textural qualities of fufu to choose the possible substitution of an adopted cassava variety (TMEB419-V1) with improved genotypes from the breeding program was assessed in this study. Standard methods were used for the biophysical and textural attributes of the fufu produced from different cassava roots. The outcomes portray that the means of the biophysical attributes of the fufu flour from different cassava genotypes are swelling power (SWP) of 13.59%, solubility index (SI) of 3.41%, dispersibility of 26.77%, bulk density (BD) of 54.46%, water absorption capacity (WAC) of 149.44%, peak viscosity of 693.97 RVU, trough viscosity of 319.76 RVU, breakdown viscosity of 374.21 RVU, final viscosity of 433.84 RVU, setback viscosity of 114.08 RVU, peak time of 4.49 min, and pasting temperature of 78.52°C, as well as moisture content of 4.92%, ash content of 0.52%, sugar content of 2.85%, starch content of 76.24%, amylose content of 31.68%, and cyanogenic potential content (CNP) of 3.03 mg HCN/kg. The sensory texture attributes depict that the cooked fufu dough was stretchable, slightly hard, sticky, and mouldable. The instrumental texture attribute of the cooked fufu dough is hardness 27.18 N/m2, adhesiveness −62.04 N/m2, moldability 0.93, stretchability 0.89, and gumminess 25.26 N/m2. Similar functional (BD) and pasting (peak and breakdown viscosities) properties and chemical composition (amylose content) to that of the control sample (V1 variety) were produced from the V6 genotype. However, the cooked fufu dough prepared from the V7 and V8 genotypes was comparable to that of the V1 variety in terms of the sensory (stretchability) and instrumental (moldability) texture attributes; therefore, most of the genotypes may be suitable for producing fufu flour like the control sample (V1 variety) based on attributes preferred by the consumers.
Traditional fermented foods like fufu are consumed in the southern, western, and eastern regions of Nigeria and certain West African nations (Rosales-soto et al., 2016). In the southern region of Nigeria, it is considered to be the second-best indigenous fermented cuisine after gari (Egwim et al., 2013). West Africa’s preference for fufu as a staple cuisine is progressively growing (Johnson et al., 2006). The majority of fufu is prepared by rural households and processors, whose methods and cassava varieties can vary by culture and location, thus influencing the quality and sensory attributes of the flour and the cooked dough (Chijioke et al., 2021).
Varietal dissimilarities play imperative parts in the development of different food products, such as gari, lafun, and fufu among others, and have definitively affected the product’s quality attributes. Thus, income, food security, culinary, and agronomic requirements are by all accounts not the only factors considered for the determination of cassava varieties by the producers but also the protection of their cultural uniqueness while adopting both the improved genotypes presented by breeders and the high-yielding landraces suitable for various value-added products (Awoyale et al., 2022). The data on the appropriateness of cassava varieties for a vastly accepted product like fufu will provide solutions on how to balance the needs of farmers with those of the end-users in terms of their chosen qualities in the breeding programs (Abass et al., 2022). This was validated by Thiele et al. (2021) and Abass et al. (2022). These researchers confirmed that inadequate precedence given to consumer-preferred traits by breeding programs backs the partial uptake of improved genotypes and their low varietal turnover for cassava value-added products like fufu.
Also, Awoyale et al. (2020) opined that differences in varieties have been reported to play essential roles in the production of diversified food products and have significantly affected the physicochemical, functional, and other quality characteristics of fufu. Awoyale et al. (2020) also concluded in their study on the suitability of different cassava varieties for Gari and fufu flour production in Liberia that all the varieties could be suitable for gari and fufu flour production, but the choice depends on the quality preferred by the consumers although the difficulties of balancing the needs of farmers with those of processors and end-users in terms of desired attributes will be lessened by a knowledge of the compatibility of various types of highly sought-after products like fufu. For instance, TME 419, also known as TMEB419 employed in this study, has already been extensively used to produce fufu out of all the adopted cassava varieties due to its high product output, acceptance, and strong biophysical properties (Udensi et al., 2011; Teeken et al., 2018; Abass et al., 2022). Consequently, it will be crucial to evaluate the biophysical and textural characteristics of fufu/cooked fufu dough to assess if an adopted cassava variety (TMEB419) may be replaced with the improved genotypes from the breeding program. Hence, this study is aimed at evaluating the biophysical attributes of the fufu flour and the textural characteristics of the cooked dough to be used as the selection criteria for the replacement of a known and adopted cassava variety with improved genotypes.
Twenty-seven (27) different genotypes of cassava were gathered from the IITA demonstration farm in Ibadan, Oyo State, Nigeria, together with a control variety (TME419) (Table 1). Approximately 20 kg of each of the cassava roots was used to produce fufu flour.

Table 1. Cassava genotypes and the control variety used to produce fufu.
The method described by Chijioke et al. (2021) was used to produce fufu in this study, with modification. Twenty kilograms of cassava roots were peeled with a stainless-steel knife, cleaned with clean water, and allowed to ferment spontaneously inside water for 48 h at room temperature (30 ± 2°C) before being pulverized and sieved through a 2 mm sieve. The excess water was typically and quickly drained by pouring the wet paste into a sack and dewatered using a spinning machine (1,000 rpm) for 10 min. To prevent gelatinization, the cake was granulated and put inside a cabinet dryer at 60°C for 24 h. It was then cooled, ground into flour using a hammer mill, and packaged in polyethylene bags for further analysis.
The standard technique outlined by Awoyale et al. (2022) was used to determine the bulk density. To achieve a constant height, the sample of fufu flour (10 g) was weighed into a graduated measuring cylinder (50 mL) and lightly tapped on the workbench 10 times. Following that, the bulk density was measured and expressed as g/mL.
Aqueous fufu flour dispersions of 2.5% were placed in centrifuge tubes, sealed to prevent spills, and heated in a water bath with a shaker (Precision Scientific, Model 25: Chicago, United States) at 85°C for 30 min to determine the swelling power and solubility index (Awoyale et al., 2020). The tubes were centrifuged for 15 min at 3,000 x g using a centrifuge (Thelco GLC-1, 60,647, in Chicago, United States) after being cooled to room temperature. The weight of the precipitated paste was measured (Wp), the supernatant was evaporated at 105°C using a hot air oven (Memmert GmbH+Co.KG: D-91126, Germany), and the residue was weighed. Next, the swelling power (SP) and solubility index (SI) were determined using Equations 1 and 2, respectively.
Wp = Weight of precipitated paste.
Wr = Weight of residue in supernatant.
Wo = Weight of sample.
Where Wo is the weight of the sample.
Fufu flour’s water absorption capacity (WAC) was established using a modified version of Awoyale et al.’s (2020) methodology. A 1 g sample of fufu flour was weighed into a clean, pre-weighed, dried centrifuge tube. A measurement of 10 mL of distilled water was then added, and the mixture was thoroughly mixed by vortexing. The suspension was then allowed to stand for 30 min before being centrifuged (Thelco GLC-1, 60,647: Chicago, United States) at 3,500 rpm for 30 min. Following centrifugation, the supernatant was decanted, and the sediment and tube were weighed. The sample’s retained water weight (g) was recorded as WAC.
To ascertain the dispersibility, the method described by Awoyale et al. (2020) was employed. The sample, weighing around 10 g, was diluted in 100 mL of distilled water, which was then added up to the 50 mL mark. The mixture was briskly agitated before being let to settle for 3 h. The amount of settling particles was measured, and the percentage dispersibility was determined using Equation 3.
(3)
The pasting qualities of the fufu flour samples were assessed using a Rapid Visco Analyser (Model RVA 4500, Perten Instrument, Australia) equipped with a 1,000 cmg sensitivity cartridge. Approximately 3.5 g of fufu flour and 25 mL of distilled water were added to a dry, empty canister. The liquid was thoroughly stirred before the canister was put into the RVA according to the instructions. The slurry was heated from 50 to 95°C at a rate of 1.5°C/min for 15 min and then cooled to 50°C. Thermocline for Windows Software linked to a computer was used to capture the viscosity profile indices from the pasting profile, including the peak, trough, breakdown, final, and setback viscosities as well as the peak time and pasting temperature (Awoyale et al., 2022).
The samples’ moisture content (MC) was determined using the AOAC (2000) method. Approximately 3 g of samples were placed in a clean, dry, pre-weighed moisture can, and the can was then placed in a well-ventilated oven (Memmert GmbH+co.Kg, Oven model D-91126 Schwabach FRG, Germany) that was maintained at 105 ± 2°C for 16 h. Moisture content was noted as the loss of weight (Equation 4).
The AOAC method (2000) was used to determine the ash content of the samples. It required burning out moisture and all organic components for 6 h at 600°C in a furnace (Ney Vulvan TM furnace type 3–1750, United States). Following the material’s burning, the residual material’s weight was used to calculate the ash content (Equation 5).
Starch and sugar contents were assessed using the method described by Awoyale et al. (2022). In order to do this, 0.02 g of the sample was added to a centrifuge tube along with 1 mL of ethanol, 2 mL of distilled water, and 10 mL of hot ethanol. The mixture was spun in a vortex for 10 min at 2000 rpm. While the supernatant was decanted and used to calculate the sugar concentration, the precipitate was hydrolyzed with perchloric acid to estimate the starch content. Sugar content was estimated using glucose standards, and color development was done using phenol and sulfuric acid reagents. The absorbance was measured using a spectrophotometer (Genesys 10S UV–VIS, China) operating at 490 nm. The sugar and starch contents were calculated using Equations 6 and 7, respectively.
Where A = Absorbance of sample.
I = Intercept of sample.
D.F = Dilution factor (depends on aliquot taken for assay).
V = volume.
B = Slope of the standard curve.
W = Weight of the sample.
The cyanogenic potential was determined as reported by Awoyale et al. (2020). A total of 250 mL of 0.1 M orthophosphoric acid was applied to 30 grams of milled fufu flour samples to test the samples’ cyanogenic potential. The homogenate was spun into a separate liquid. After the supernatant was taken as the extract, the enzyme was added to 0.6 mL of the extract. A measurement of 3.4 mL of the acetate buffer (pH 4.5) was added and combined. The mixture was then combined with 0.6 mL of colorant and 0.2 mL of 0.5% chloramines-T, and the combination was allowed to stand for 15 min to allow the color to develop. At 605 nm, the absorbance value was measured in contrast to a blank that had been produced similarly but had potassium cyanide replaced with 0.1 mL of phosphate buffer.
Calculation: By graphing absorbance levels (Y-axis) against standard concentrations (X-axis), the standard data were utilized to create a standard curve and its slope (b). The residual cyanide was determined using the formula with the unknown mean absorbance (A) and sample weight (w):
Residual cyanide = A × 250 × 0.4151b × w and the unit in mg HCN equivalent kg−1 sample.
The cooked fufu dough was made from several cassava varieties using the method described by Awoyale et al. (2022). Approximately 50 g of fufu flour was added to a stainless-steel cooking pot with 150 mL of hot water, and the mixture was continuously stirred for 5 min with a wooden stirrer to create a thick, smooth dough. Prior to testing, the cooked dough was properly wrapped in a plastic bag and placed in a warmer.
Fifteen (15) trained panelists from the IITA staff members and graduate students in Ibadan, Oyo State, Nigeria, who frequently consumed cooked fufu dough were used to evaluate its sensory qualities. The tests were based on characteristics including hardness, stickiness, moldability, and stretchability. The phrase “I am aware that my replies are confidential and I accept to participate in this study” was used by participants to indicate their informed consent for the sensory texture characteristics of the cooked fufu dough. Participants in the research were able to leave at any moment without giving a reason. The cooked form of the dough, which was tested, was suitable for human consumption because fufu dough is often consumed in the research location. The sensory texture profiling was conducted in accordance with the 1964 Helsinki Declaration’s principles (Awoyale et al., 2022).
The instrumental texture profile study of the cooked fufu was done using a texture analyzer (TA-XTPlus-Stable Microsystems) equipped with a 50 kg load cell. The cooked fufu samples were placed into a container that was firmly sealed in order to preserve the temperature (28–30°C). The parameters derived from the used texture analyzers include the cooked dough’s hardness, adhesiveness, cohesiveness, springiness/stretchability, and gumminess (Awoyale et al., 2022).
The data gathered were separated by means and Pearson correlation using the Statistical Package for Social Sciences (SPSS) version 21 software, and the same data were subjected to principal component analysis (PCA) using the XLSTAT (Trial Version 2021) program.
Food’s functional properties influence how food behaves both while it is being prepared for consumption and when it is being used (Awoyale et al., 2022). The mean value of the functional properties of fufu flour made using different cassava roots is 13.59% for swelling power (SWP), 3.41% for solubility index (SI), 26.77% for dispersibility, 54.46% for bulk density (BD), and 149.44% for water absorption capacity (WAC). All of the functional characteristics of the fufu samples displayed significant changes (p < 0.05), with the exception of the BD, which was not significantly different (p > 0.05) (Table 2).
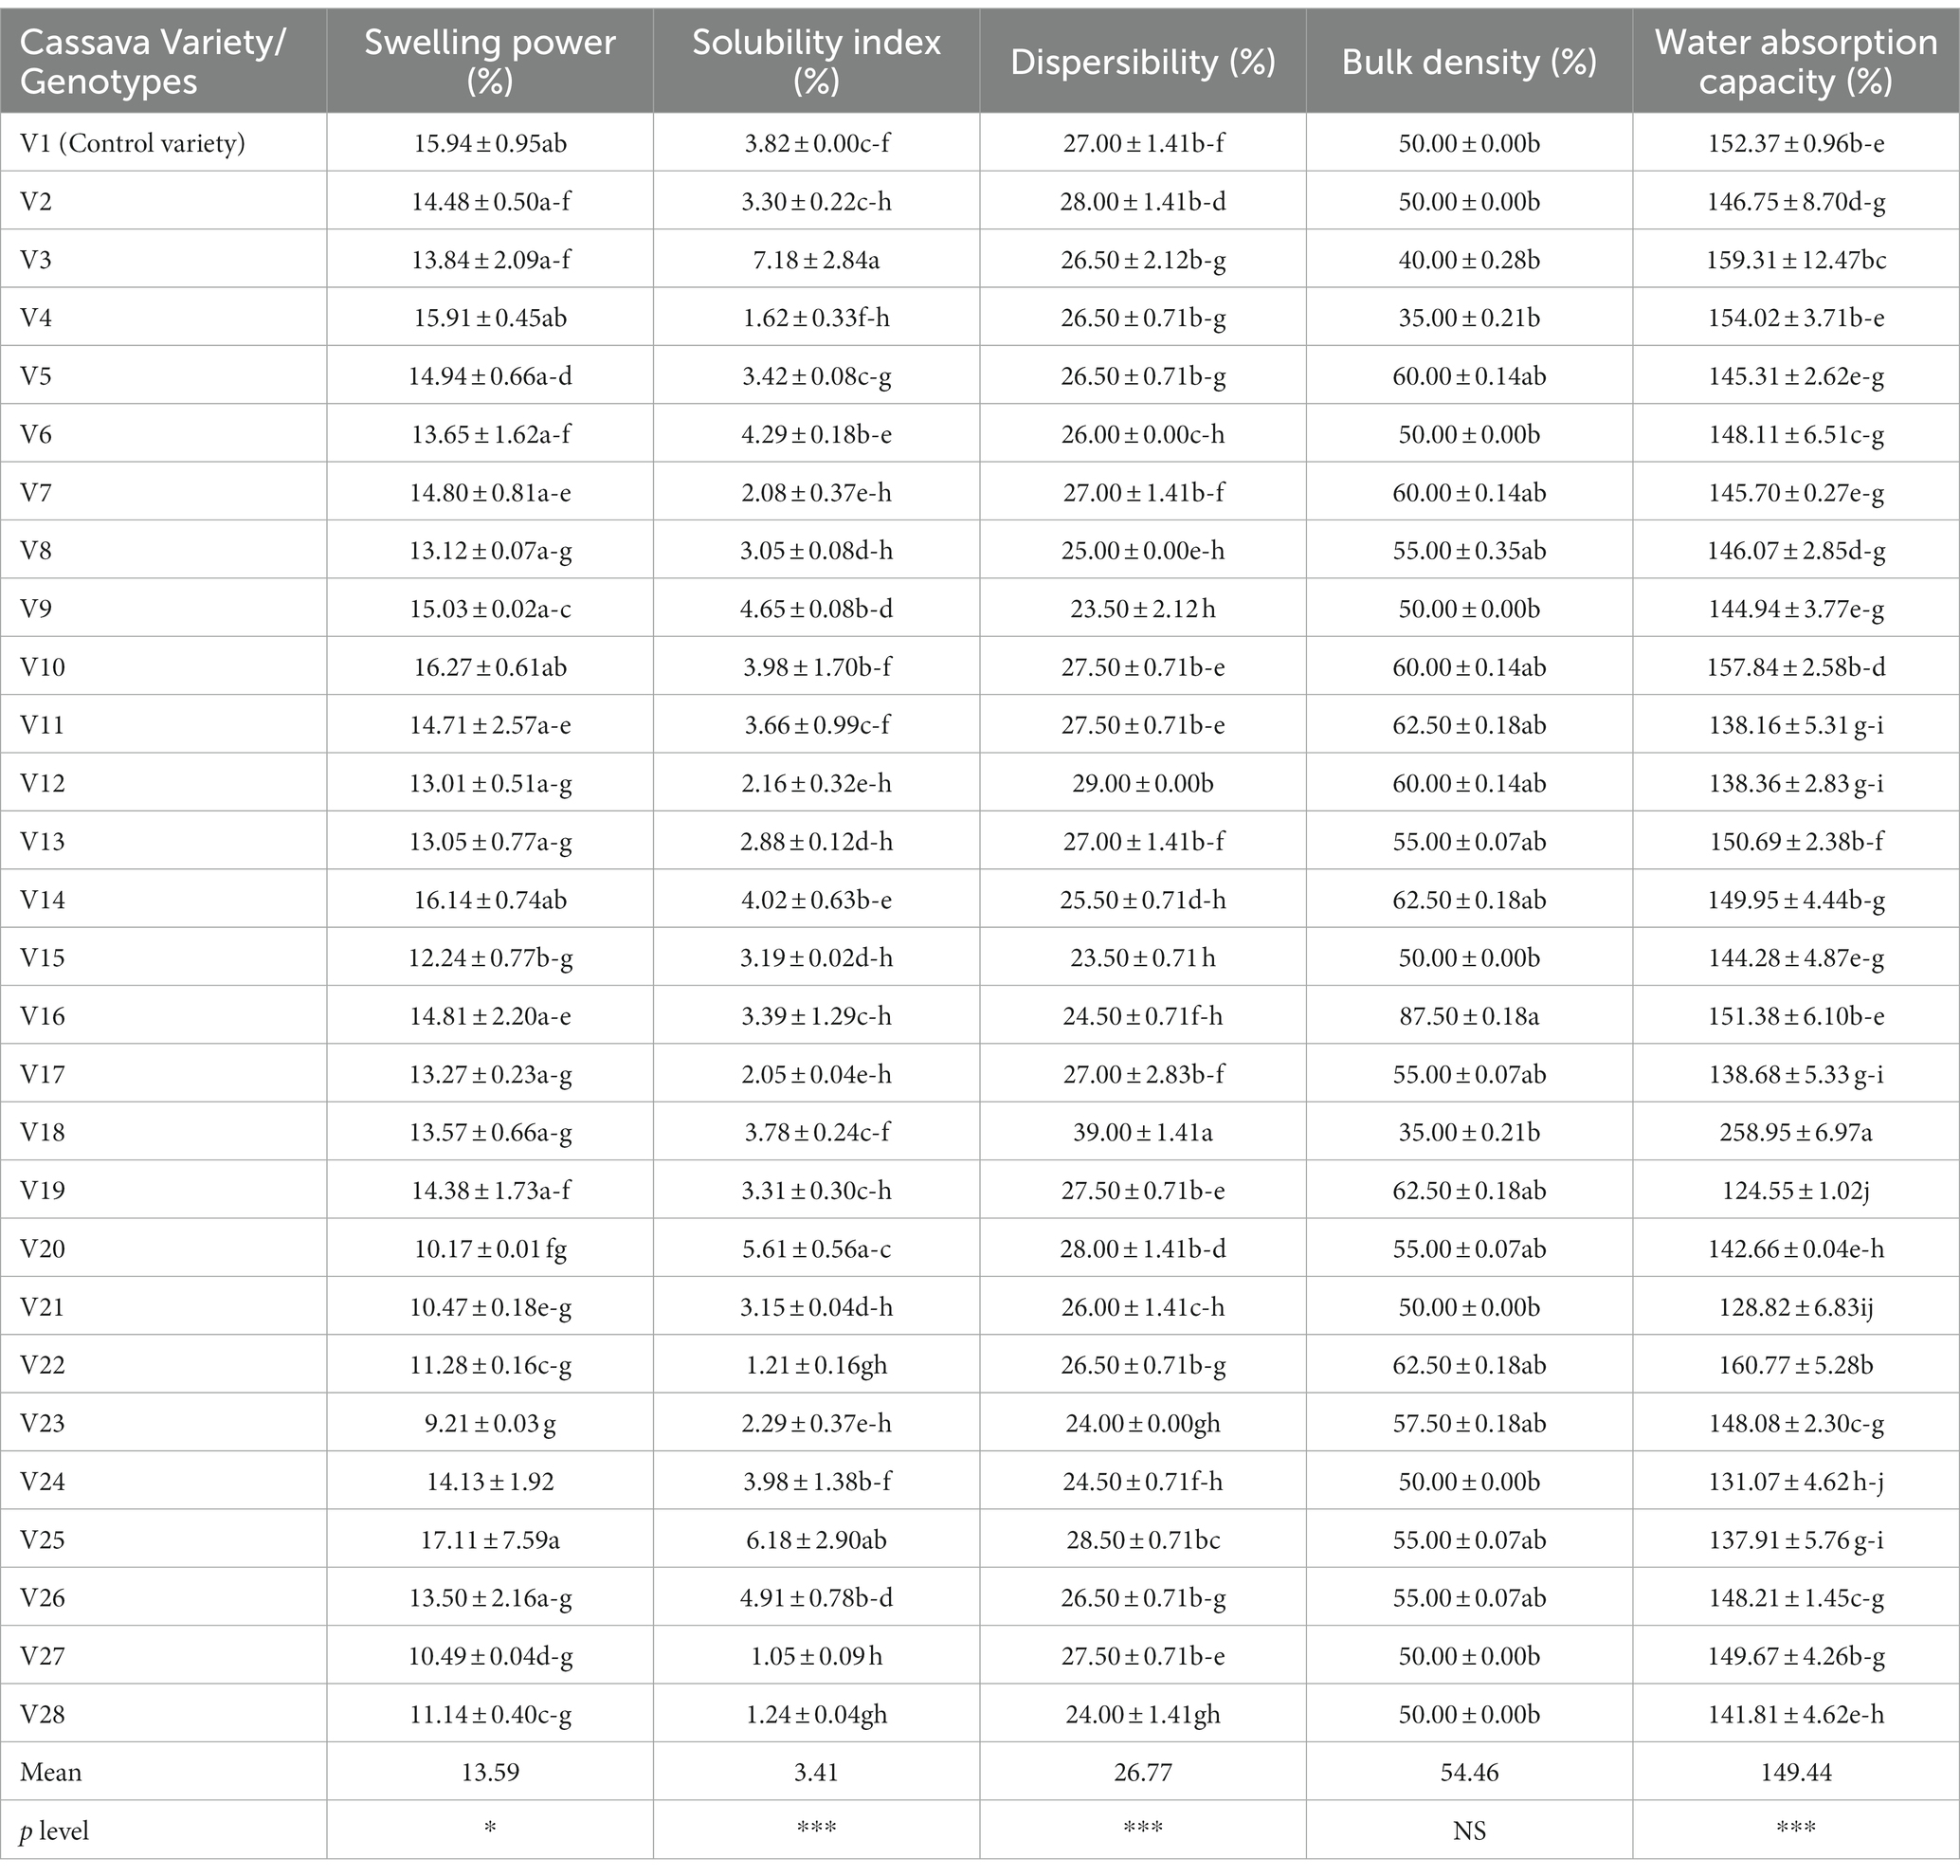
Table 2. Functional properties of fufu flour produced from different cassava genotypes and the control variety.
The SWP and SI show the extent of starch chain interaction in the amorphous and crystalline domains. According to Awoyale et al. (2020), higher SWP and SI are associated with lower associative forces. The SWP varied from 9.21 to 17.11%, with the V23 genotype having the lowest and the V25 genotype having the highest in fufu flour. As a result, the lower SWP of the fufu sample from the V23 genotype reveals that its granules are more structured than those of the V25 genotype’s higher SWP fufu sample (Awoyale et al., 2020). The V25 fufu sample’s SWP was statistically comparable to that of the control variety (V1 variety). The SWP of the fufu samples, however, reported by Awoyale et al. (2022) ranges between 10.48 and 12.33% and corresponds to distinct kinds. As opposed to this study, the TMS01/1235 fufu flour from Liberia has a lower SWP (8.31%) (Awoyale et al., 2020). The V27 genotype had a lower SI of the fufu flour (1.05%) and a greater SI of the V3 genotype (7.18%). Due to its reduced SI compared to fufu flour produced from the V3 genotype, this implies that fufu flour produced from the V27 genotype may be made up of poorly associated starch granules with an extensive and firmly bonded micellar structure (Awoyale et al., 2022). According to Awoyale et al. (2020), the SI of the fufu flour samples used in this investigation is within the range of values (2.28–9.03%) observed for fufu samples made from several cassava types in Liberia. The Principal Component Analysis (PCA) result showed that out of the 67.80% total variation, the SWP and SI of the fufu flour samples had a significant positive contribution to the 26.78% variations in the Principal Component (PC) 2. This is because the PC2 had a positive and significant (p < 0.05) correlation with the SWP (r = 0.82) and the SI (r = 0.77) of the fufu flour samples (Supplementary Table S1). Also, fufu flour of similar SWP and SI may be produced from V26, V25, V23, V18, V10, V4, and V2 genotypes. This is because the SWP and SI of the fufu flour were in the same quadrant with the V26, V25, V23, V18, V10, V4, and V2 genotypes (Figure 1).
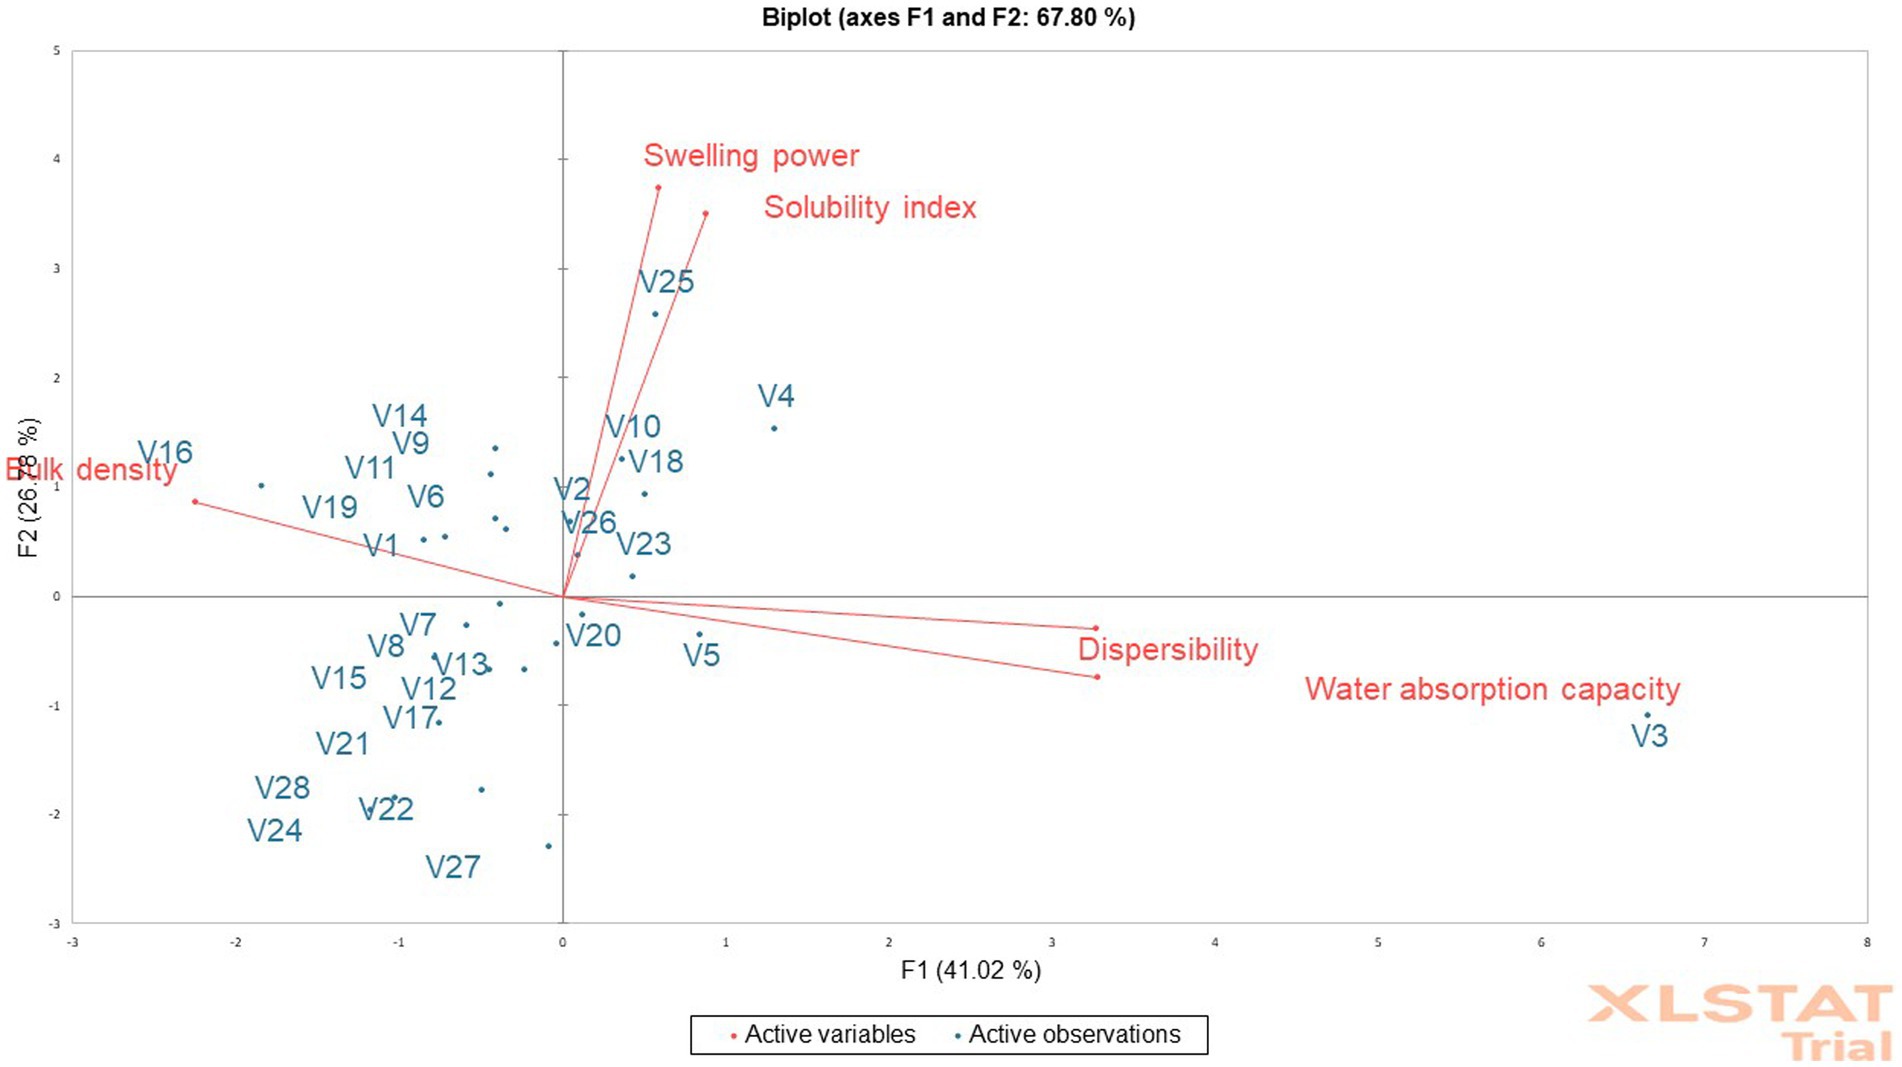
Figure 1. Principal component analysis biplot of the functional properties of fufu flour from different cassava genotypes.
How quickly a starchy product disperses in water influences how well it can reconstitute. The higher the starchy food’s dispersibility, the more it reconstitutes in water (Kulkarni and Ingle, 1991). The V9 genotype had the lowest dispersibility of the fufu flour (23.50%) and the maximum dispersibility of the V18 genotype (39.00%). The dispersibility of the fufu flour from the control variety and these genotypes (V9 and V18) were substantially different (p < 0.05). As a result of its higher dispersibility as compared to V9 fufu flour, fufu flour from the V18 genotype may reconstitute in hot water without lumps during the production of cooked fufu. In contrast to this study, the dispersibility of the fufu flour samples made from several Liberia cassava varieties ranging from 26.50–75.50% (Awoyale et al., 2020) and 56–61% (Sanni et al., 2006) was greater. This may be attributed to differences in the varieties of cassava used and the way the flour samples were reconstituted in boiled water before consumption (Awoyale et al., 2020). The dispersibility of the fufu flour contributed positively to the 41.02% variations in the PC1. This is because the correlation between the PC1 and the dispersibility of the fufu flour sample was positive and significant (p < 0.05, r = 0.89) (Supplementary Table S1). Fufu flour of similar dispersibility could be produced from V20, V5, and V3 genotypes since they all fall within the same quadrant as the dispersibility of the fufu flour (Figure 1).
Understanding a product’s BD is crucial for selecting the right packaging materials, according to Ikujenlola (2008). As the BD value decreases, more products can be packaged in each container volume, freeing up space and lowering the cost of shipping and packaging. The V16 genotype has the highest BD (88%) whereas the fufu flour made from the V18 and V4 genotypes has the lowest (35%) BD. Compared to the control variety, the BD of the samples of fufu flour from the V18 and V4 genotypes was not significantly different (p > 0.05). Genotypes with the lowest BD may spend less on packaging materials and shipping as they have a lower BD. The BD of the samples of fufu flour made from different kinds of cassava root in Liberia (ranging from 43 to 72%) was within the range of values reported in the present study. Additionally, similar results (39.60–80.02%) for the BD of fufu flour from various cassava varieties were presented by Awoyale et al. (2022). The BD of the fufu flour had significant and negative contributions to the 41.02% variations in the PC1 (p < 0.05, r = −0.61) (Supplementary Table S1). Fufu flour from the V14, V16, V19, V11, V9, and V6 genotypes may have the same BD as the control sample (V1 variety). This is because the BD of the fufu flour was in the same quadrant as the genotypes and the control sample (Figure 1).
In order to reconstitute a sample into the cooked dough in hot water, it must have the ability to absorb water; this ability is a result of smaller granule sizes and increased solubility (Awoyale et al., 2020). The WAC was higher (258.05%) in the fufu flour made from the V18 genotype and lower (124.55%) in the fufu flour made from the V19 genotype (Table 2). In comparison to the samples of fufu flour from various types, the WAC of the fufu flour from the control variety was significantly different (p < 0.05). This showed that V19 fufu flour (115.28%) with a lower WAC will absorb less water during the preparation of the dough than fufu flour from the V18 genotype. However, fufu flour from TMS95/0166 (133.89%) that is available in Liberia, as well as rotary-dried and flash-dried fufu flour (49–96%) (Sanni et al., 2008), showed a lower value of WAC. This might be explained by variations in drying methods and cassava varieties. Similar to the dispersibility of the fufu flour, the WAC of the fufu flour had positive and significant contributions to the 41.02% variations in the PC1 (p < 0.05, r = 0.89) (Supplementary Table S1). Also, fufu flour of the same WAC may be produced from V20, V5, and V3 genotypes since they all fall within the same quadrant as the WAC of the fufu flour (Figure 1).
Understanding the pasting properties is essential to foresee how starchy foods will behave before and after cooking since the fufu flour samples will be reconstituted in hot water to make the cooked dough before eating with the preferred soup (Adebowale et al., 2007). The average peak viscosity, trough viscosity, breakdown viscosity, final viscosity, setback viscosity, peak time, and pasting temperature for fufu flour made from various cassava genotypes are 693.97 RVU, 319.76 RVU, 374.21 RVU, 433.84 RVU, 114.08 RVU, 4.49 min, and 78.52°C, respectively (Table 3).
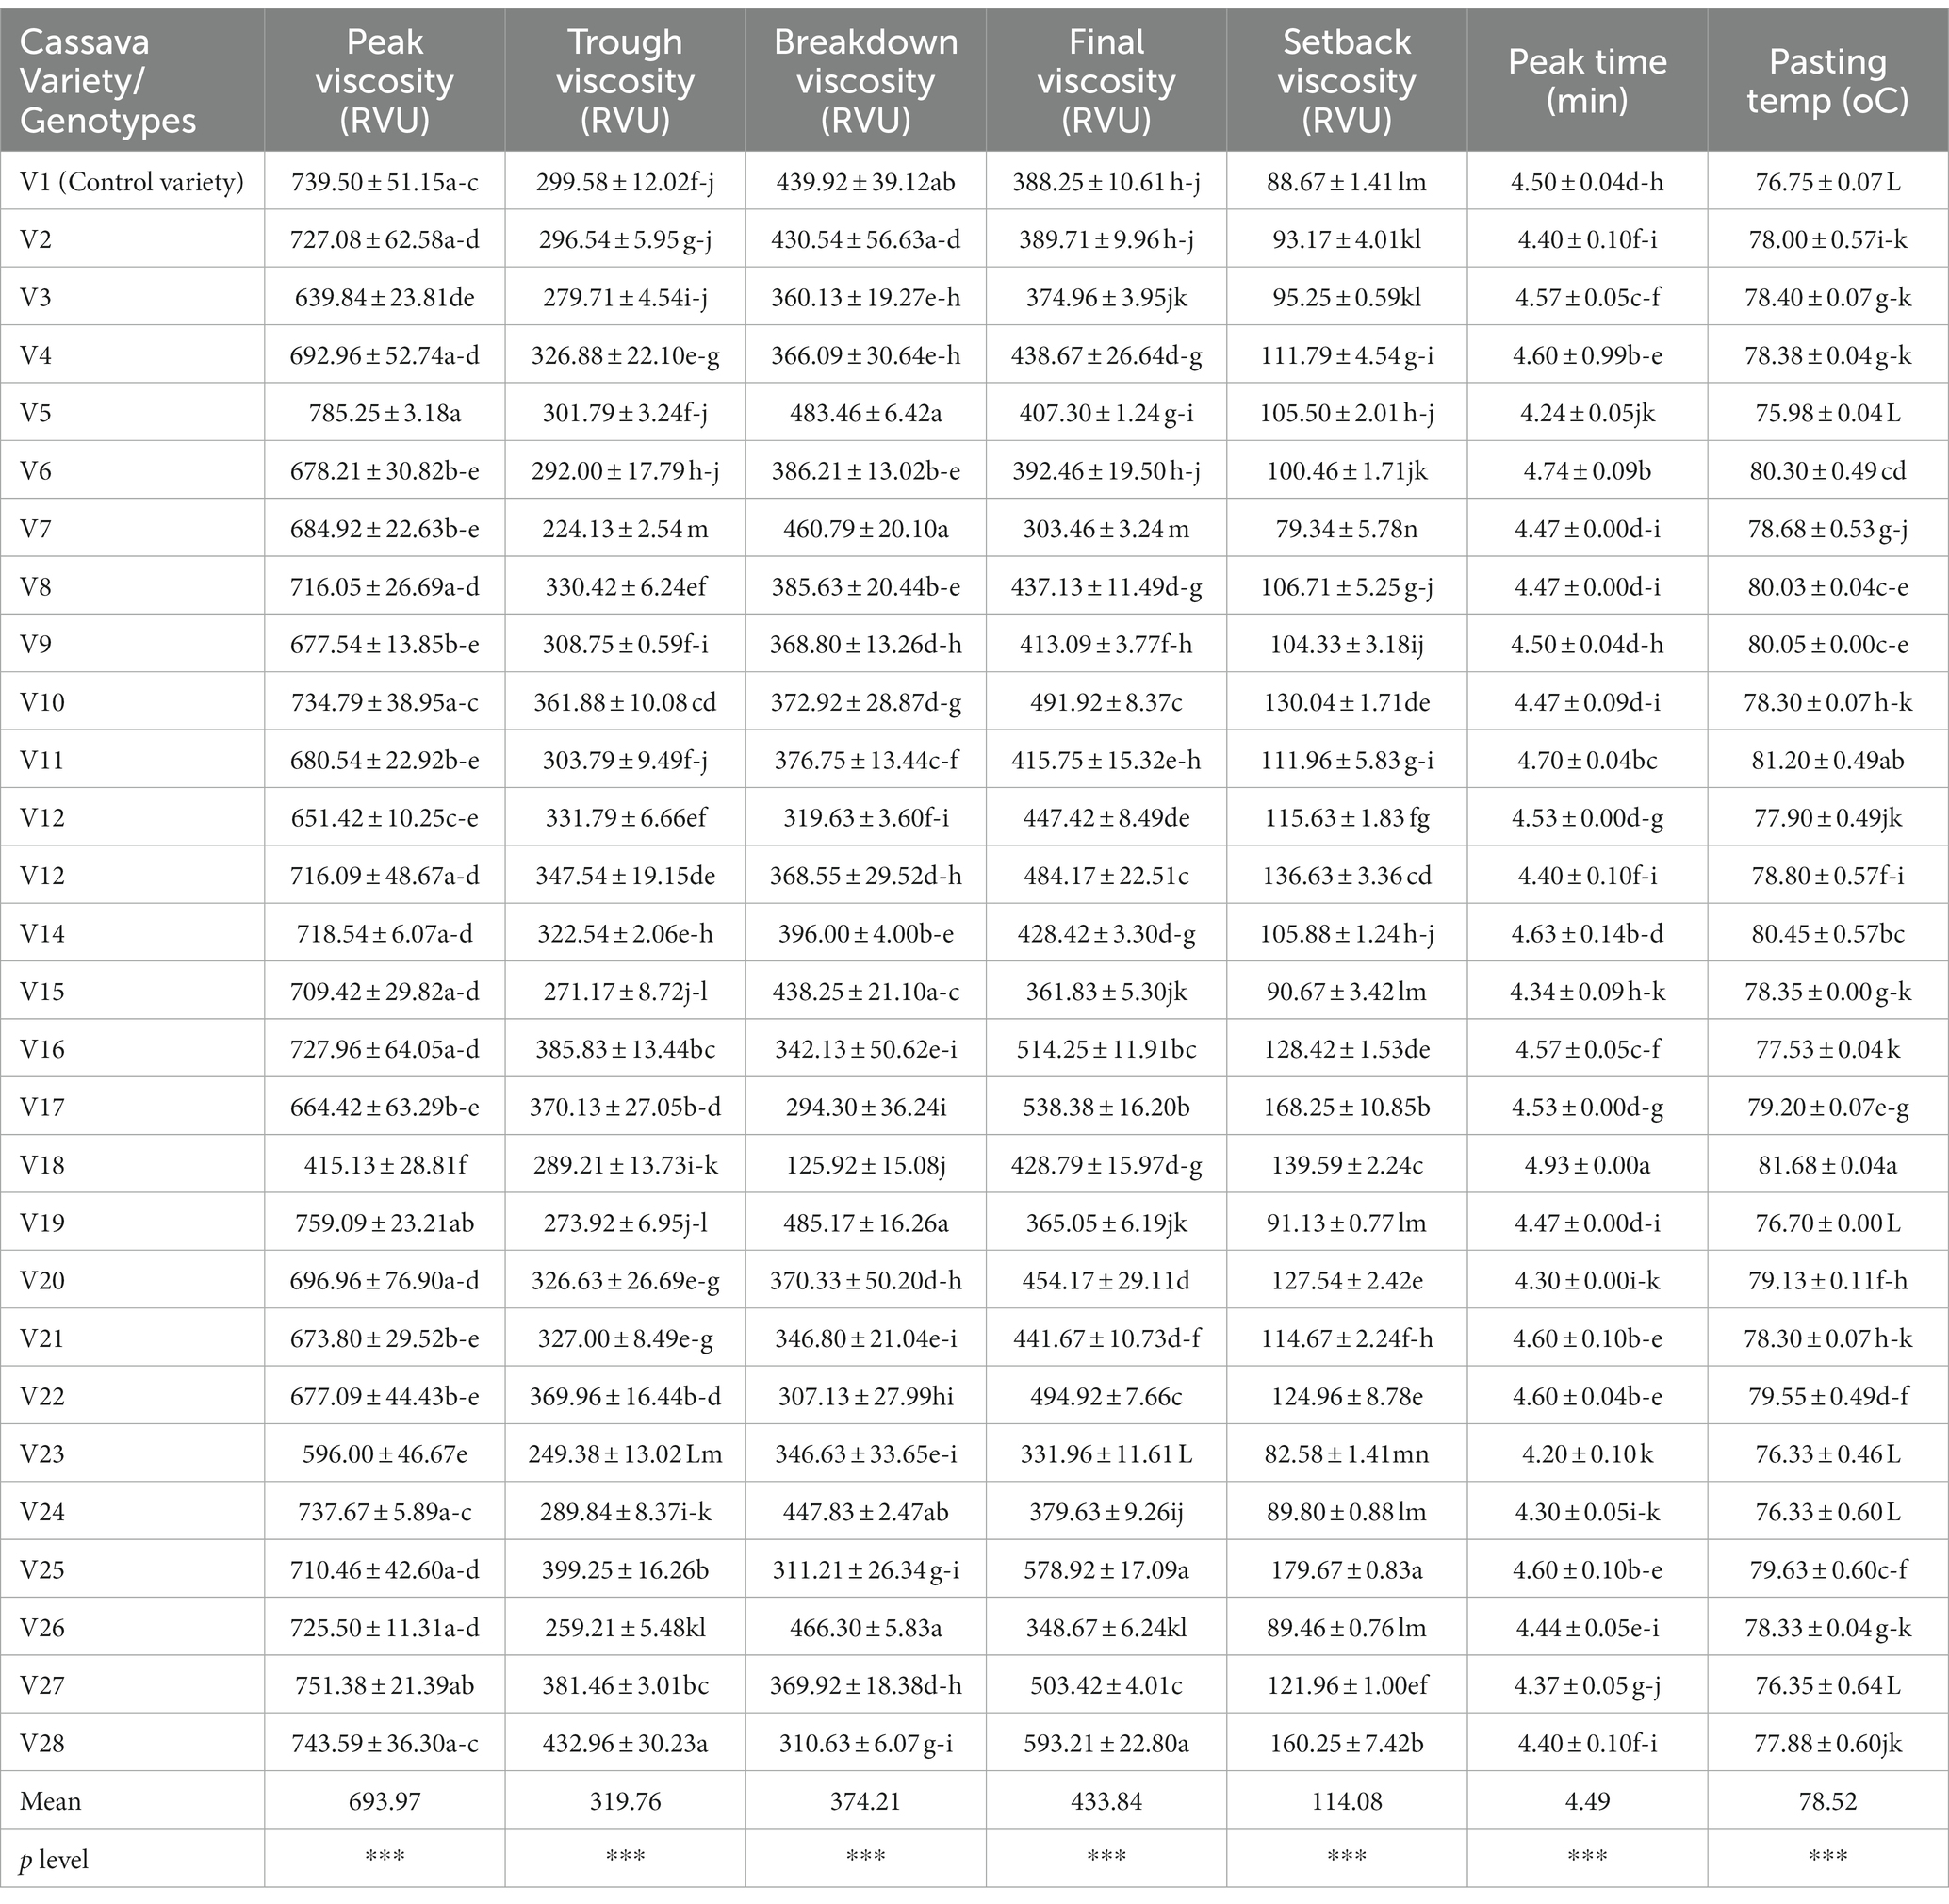
Table 3. Pasting properties of fufu flour produced from cassava genotypes and the control variety.
The viscosity that supports the attractive texture of cooked fufu dough is known as the peak viscosity. As a result, the firmer the texture of the cooked fufu dough the greater the peak viscosity (Ikegwu et al., 2009). This means that consumers who prefer the firm-textured cooked fufu dough may reconstitute the fufu flour produced from the V5 genotype (785.25 RVU) in boiled water because of its high peak viscosity. Also, those who prefer the soft textured cooked fufu dough may reconstitute fufu flour from the V18 genotype (415.13 RVU) in boiled water due to its low peak viscosity. The peak viscosity of the V1 fufu flour (control sample) was statistically similar to that of the V5 genotype. However, it is significant to note that the texture of the cooked fufu dough may be influenced by the volume of water used during reconstitution as well as the temperature and duration of the gelatinization process (Awoyale et al., 2020). As reported for the peak viscosity of the fufu flour in this study, the range of values (296.88–709.71 RVU) found for the peak viscosity of flour made from various cassava varieties was within this range (Awoyale et al., 2020). Conversely, a lower peak viscosity value (340.16–507.51 RVU) for rotary- and flash-dried fufu flour was observed (Sanni et al., 2006). As shown in the PCA result, of the total 84.89% variations, the peak viscosity had a positive and significant contribution to the 32.80% variation in the PC2 (p < 0.05, r = 0.79) (Supplementary Table S2). Fufu flour of similar peak viscosity to that of the control (V1 variety) may be produced from V6, V19, V23, and V18 genotypes. This is because these genotypes and the peak viscosity of the fufu flour were in the same quadrant as the control sample (Figure 2).
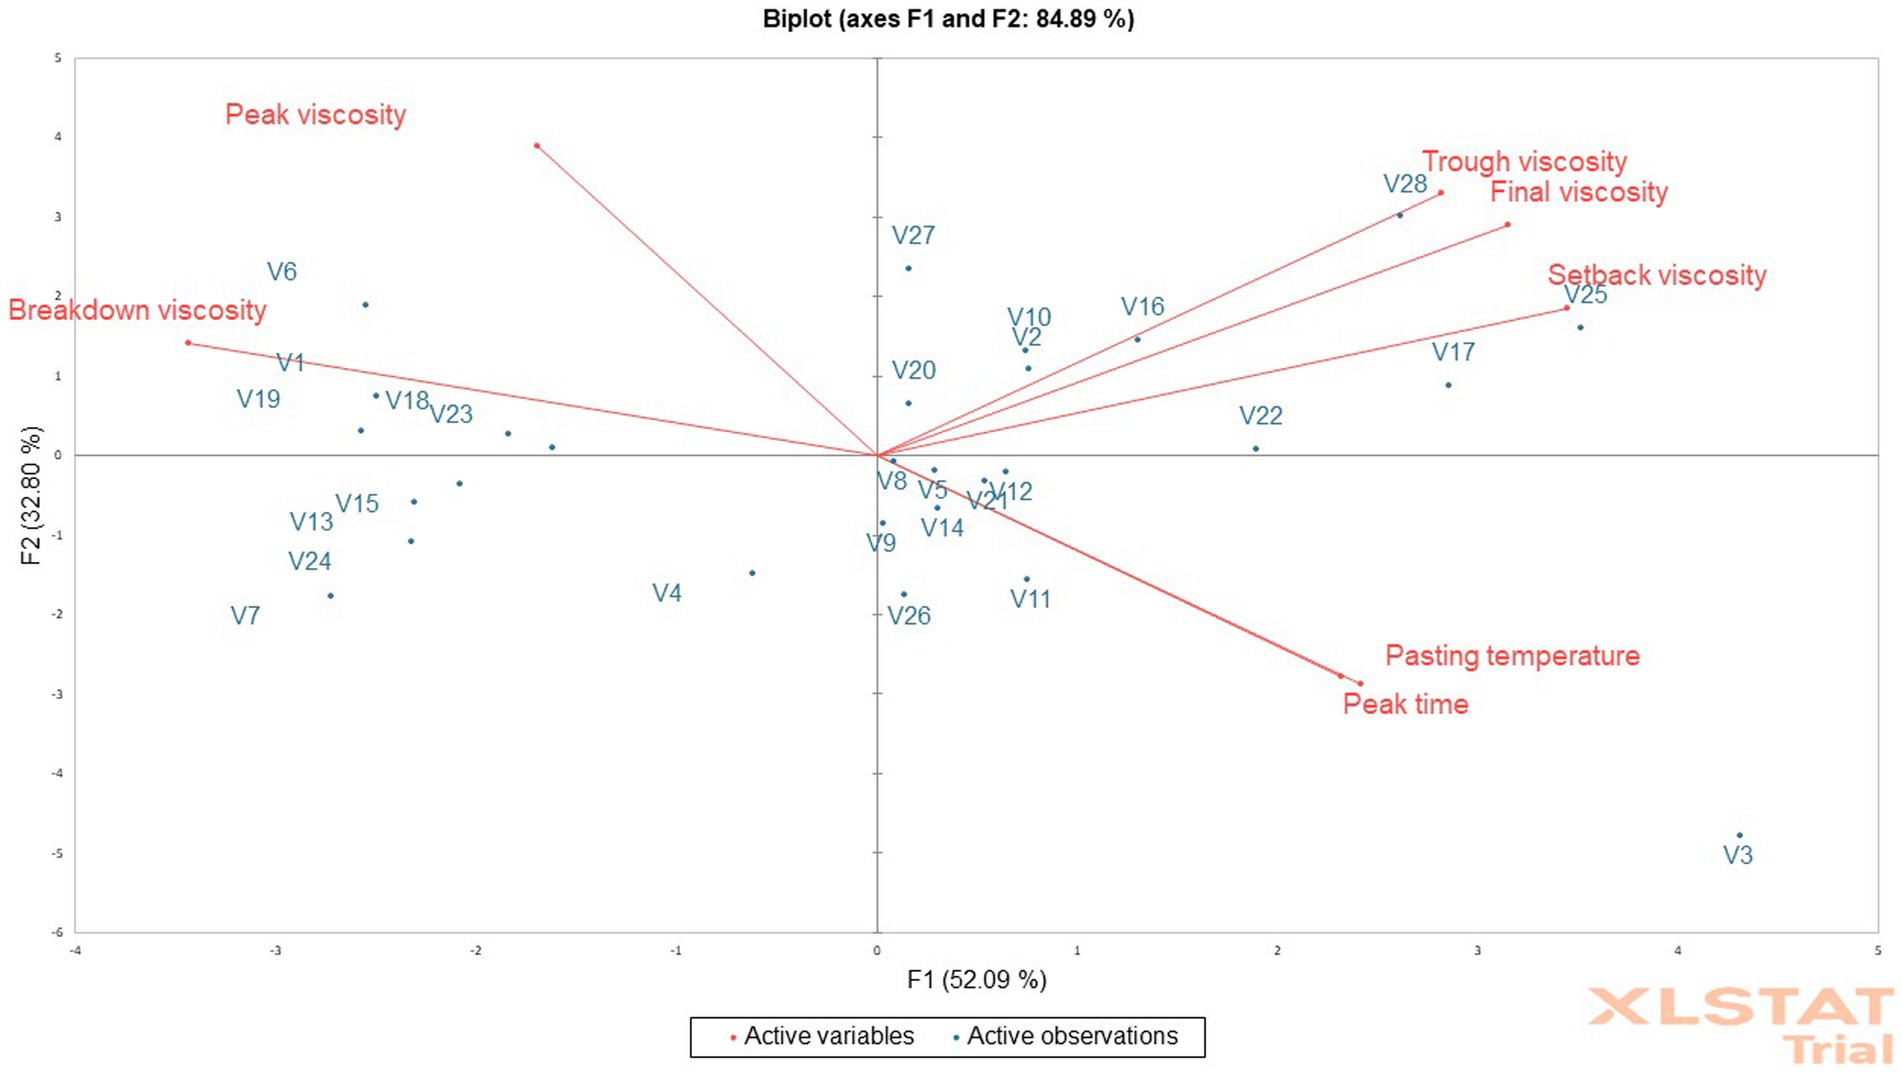
Figure 2. Principal component analysis biplot of the pasting properties of fufu flour from different cassava genotypes.
Trough viscosity is the ability of starch granules to withstand unaltered conditions of continuous high temperature and mechanical shear stress (Olatunde et al., 2017). The V7 genotype had a lower trough viscosity of fufu flour (224.13 RVU), but the V28 genotype had a higher trough viscosity (432.96 RVU). This indicates why cooked fufu dough produced with V28 fufu flour might not withstand mechanical shear stress and the starch granules might be disrupted due to their high trough viscosity, whereas the starch granules of cooked fufu dough produced with V7 fufu flour might not be disrupted because of its low trough viscosity (Olatunde et al., 2017). The trough viscosity of fufu flour produced from different cassava varieties (272.29–374.29 RVU) was within the values observed in this study (Awoyale et al., 2022). Supplementary Table S2 depicts that the trough viscosity of the fufu flour contributed positively to both the 52.09% of PC1 (p < 0.05, r = 0.72) and 32.80% of PC2 (p < 0.05, r = 0.67) variations of the total variations of 84.89%. Fufu flour of the same trough viscosity may be produced from V27, V28, V25, V27, V10, V2, V20, V17, and V22 genotypes because they all fall within the same quadrant with the trough viscosity of the fufu flour (Figure 2).
The ability of the fufu flour to withstand heating and shear stress during its reconstitution to cooked dough decreases with increasing breakdown viscosity (Adebowale et al., 2008; Awoyale et al., 2020). The V19 genotype had the highest value and the V18 genotype had the lowest breakdown viscosity, which varied from 125.92 RVU to 485.17 RVU. This means that cooked fufu dough with undisrupted starch granules may be produced from the V18 fufu flour due to its low breakdown viscosity compared to that of the V19 genotype with high breakdown viscosity. However, the breakdown viscosity of the control sample was statistically similar to the fufu flour produced from the V19 genotype. The present study’s findings were supported by the breakdown viscosity (103.52–447 RVU) of fufu flour produced from different cassava varieties (Awoyale et al., 2020). Differences in varieties and methods of drying may account for the lower breakdown values (156.94–174 RVU) recorded for rotary-dried and flash-dried fufu flour compared to that of this study (Sanni et al., 2006). Comparable to the peak viscosity, fufu flour of the same breakdown viscosity as that of the control (V1 variety) may be produced from V6, V19, V23, and V18 genotypes because all the genotypes and the breakdown viscosity of the fufu flour fall within the same quadrant as the control sample (Figure 2). However, the breakdown viscosity of the fufu flour significantly contributed to the 52.09% variation in the PC1 out of the total 84.89% variation (p < 0.05, r = −0.88) (Supplementary Table S2).
After cooking, the starchy material’s ability to gel is indicated by its final viscosity (Awoyale et al., 2020). Thus, the faster the gelatinization process when the fufu flour is cooked in hot water into cooked dough, the higher the final viscosity of the fufu flour. The V7 fufu flour had the lowest final viscosity (303.46 RVU), whereas the V28 fufu flour had the highest (593.21 RVU). Due to its high final viscosity, fufu flour from the V28 genotype may gelatinize more quickly when reconstituted in hot water to the cooked dough, whereas that from the V7 genotype may gelatinize gradually (Sanni et al., 2006). However, the final viscosity (76.00–295.00 RVU) of the fufu flours processed from 43 cassava mosaic disease (CMD)-resistant varieties was low compared to that of the present study (Etudaiye et al., 2009). The final viscosity of the fufu flour in this investigation is supported by Awoyale et al. (2022), who indicated that fufu flour made from different cassava varieties has a final viscosity ranging from 385.96 RVU to 503.80 RVU. The final viscosity of the fufu flour contributed positively to both the 52.09% of PC1 (p < 0.05, r = 0.81) and 32.80% of PC2 (p < 0.05, r = 0.59) variations (Supplementary Table S2). Fufu flour of the same final viscosity may be produced from V27, V28, V25, V27, V10, V2, V20, V17, and V22 genotypes because they all fall within the same quadrant with the final viscosity of the fufu flour (Figure 2).
Setback viscosity indicates increased resistance to syneresis/weeping of the starchy food when a low value is obtained during the cooling of the paste (Awoyale et al., 2020). Accordingly, cooked dough prepared from V7 fufu flour (79.34 RVU) may not weep as easily as the dough prepared from V25 fufu flour (179.67 RVU), which may weep as easily as possible because of its high setback viscosity. The range of values (28.17–70.42 RVU) reported by Etudaiye et al. (2009) for the setback viscosity of fufu flour produced from 43 CMD-resistant varieties was not in agreement with that of this study. However, the setback viscosity of the fufu flour produced in this study was within the range of values (74.96–187.27 RVU) for the setback viscosities of fufu flour made from different cassava varieties (Awoyale et al., 2020). The V27, V28, V25, V27, V10, V2, V20, V17, and V22 genotypes may produce fufu flour of similar setback viscosity because they all fall within the same quadrant as the setback viscosity of the fufu flour (Figure 2) although the setback viscosity of the fufu flour contributed significantly to the 52.09% variation in PC1 of the 84.89% total variations (p < 0.05, r = 0.88) (Supplementary Table S2).
The V23 genotype fufu flour (4.20 min) had the lowest peak time while the V18 genotype fufu (4.93 min) had the highest peak time. The highest pasting temperature for fufu flour was from the V18 genotype (81.68°C), and the lowest was from the V5 genotype (75.98°C) (Table 4). According to this, all of the fufu flour samples may be reconstituted in hot water to create cooked dough in less than 5 min and below the boiling point of water, saving energy (Adebowale et al., 2008). A similar result to that of this study was reported by Etudaiye et al. (2009) for the peak time (4.00 to 5.33 min) and pasting temperature (77.55 to 81.60°C) of the fufu paste obtained from CMD-resistant cassava varieties. Comparable results of peak time (4.13–5.40 min.) and pasting temperature (72.73–84.58°C) for fufu flour were also reported by Awoyale et al. (2020). The peak time and pasting temperature contributed significantly (p < 0.05) to the 52.09% variation of PC1 (r = 0.62 and r = 0.59, respectively), as well as the 32.80% of PC2 (r = −0.58 and r = −0.57, respectively) of the total 84.89% variations (Supplementary Table S2). Figure 2 depicts that fufu flour of similar peak time and pasting temperature could be produced from V8, V9, V5, V21, V12, V14, V26, V11, and V3 genotypes because they all fall within the same quadrant with these attributes.
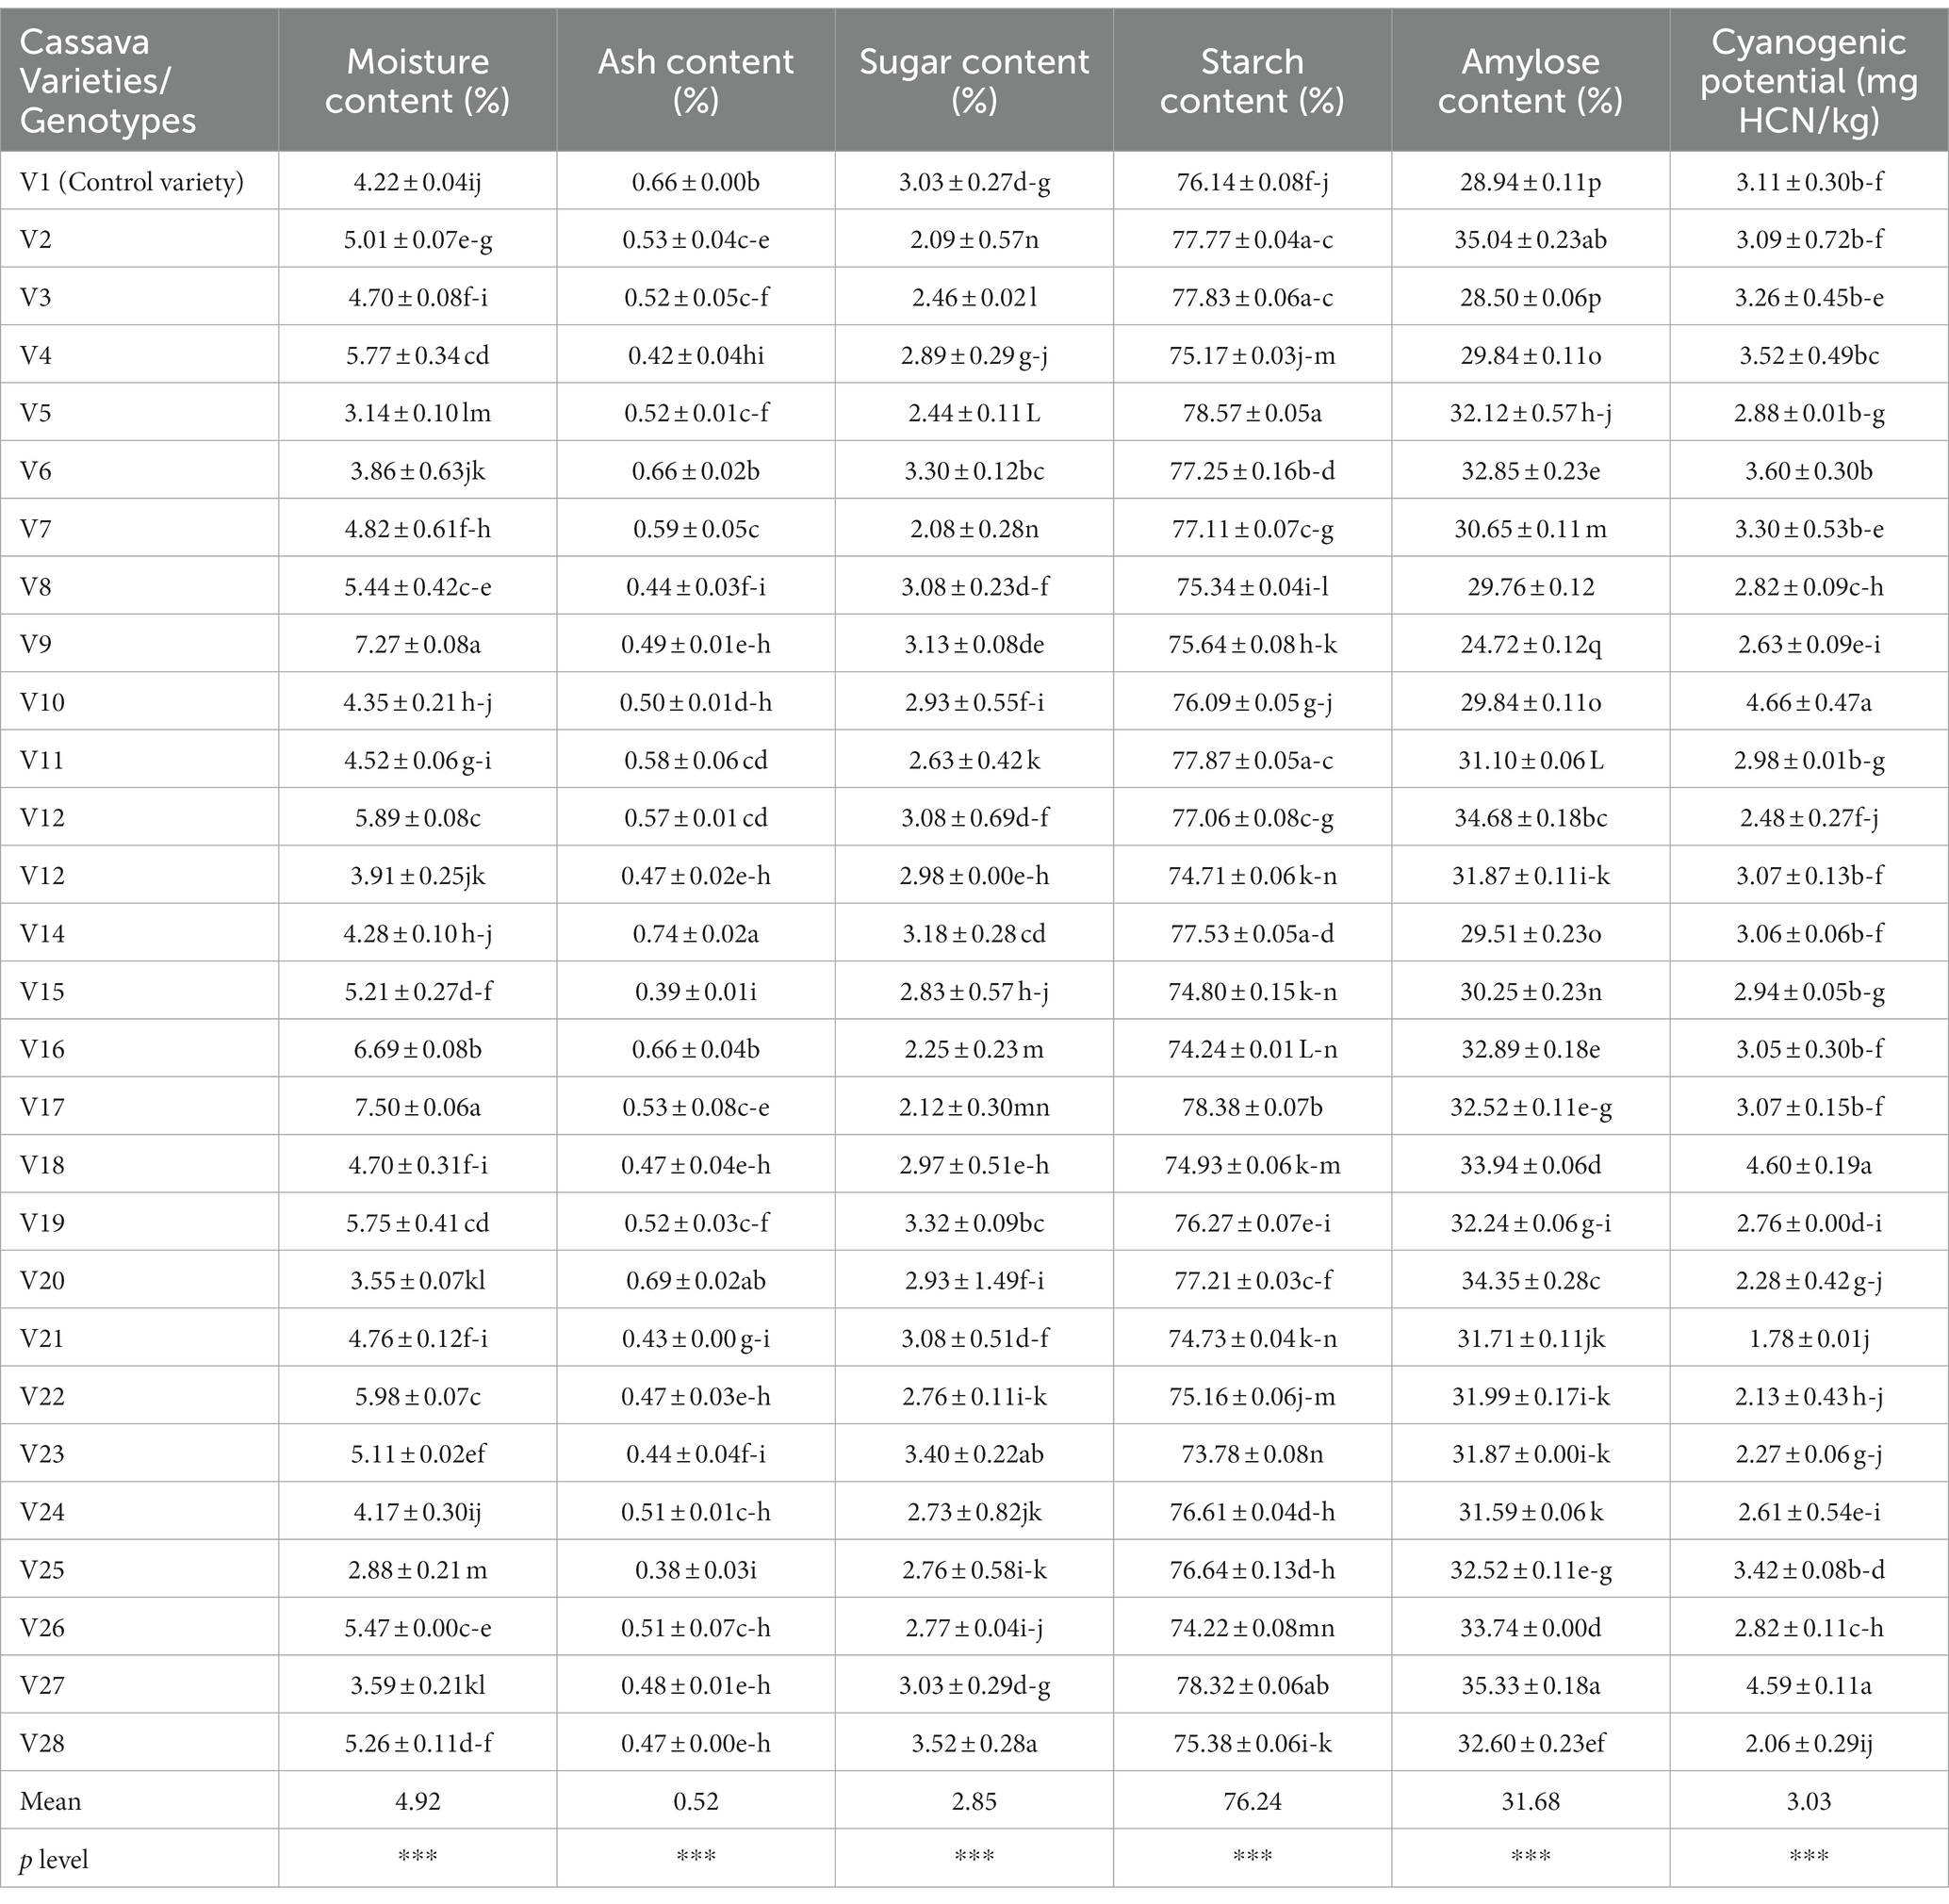
Table 4. The chemical composition of fufu flour produced from different cassava genotypes and the control variety.
Table 4 shows the chemical composition of fufu flour produced from different cassava varieties. The means of chemical composition of the fufu flour is a moisture content of 4.92%, ash content of 0.52%, sugar content of 2.85%, starch content of 76.24%, amylose content of 31.68%, and cyanogenic potential (CNP) of 3.03 mg HCN/kg.
According to Sanni et al. (2006), a product’s initial moisture level determines its stability throughout storage. The lower the original moisture content of the fufu flour samples, the better. The moisture content of the fufu flour ranged from 2.88% in the V25 genotype to 7.50% in the V17 genotype. As a result of their lower moisture levels than the 10% required by the Codex Alimentarius Commission, fufu flour from all the genotypes and the control variety (V1) may last longer (Codex Alimentarius Commission, 1989). To prevent moisture absorption, it is important to properly package and preserve the fufu flour samples throughout marketing. Ogungbemi et al. (2021) reported similar moisture content in white-fleshed (4.34%) and yellow-fleshed (7.21%) fufu flour. The moisture content of the fufu flour contributed significantly to both 31.12% of PC1 (r = −0.54) and 20.15% of PC2 (r = 0.68) of the total 51.27% variations (Supplementary Table S3). Fufu flour of similar moisture content may be produced from V9, V16, and V22 genotypes because the genotypes are in the same quadrant with the moisture content of the fufu flour (Figure 3).
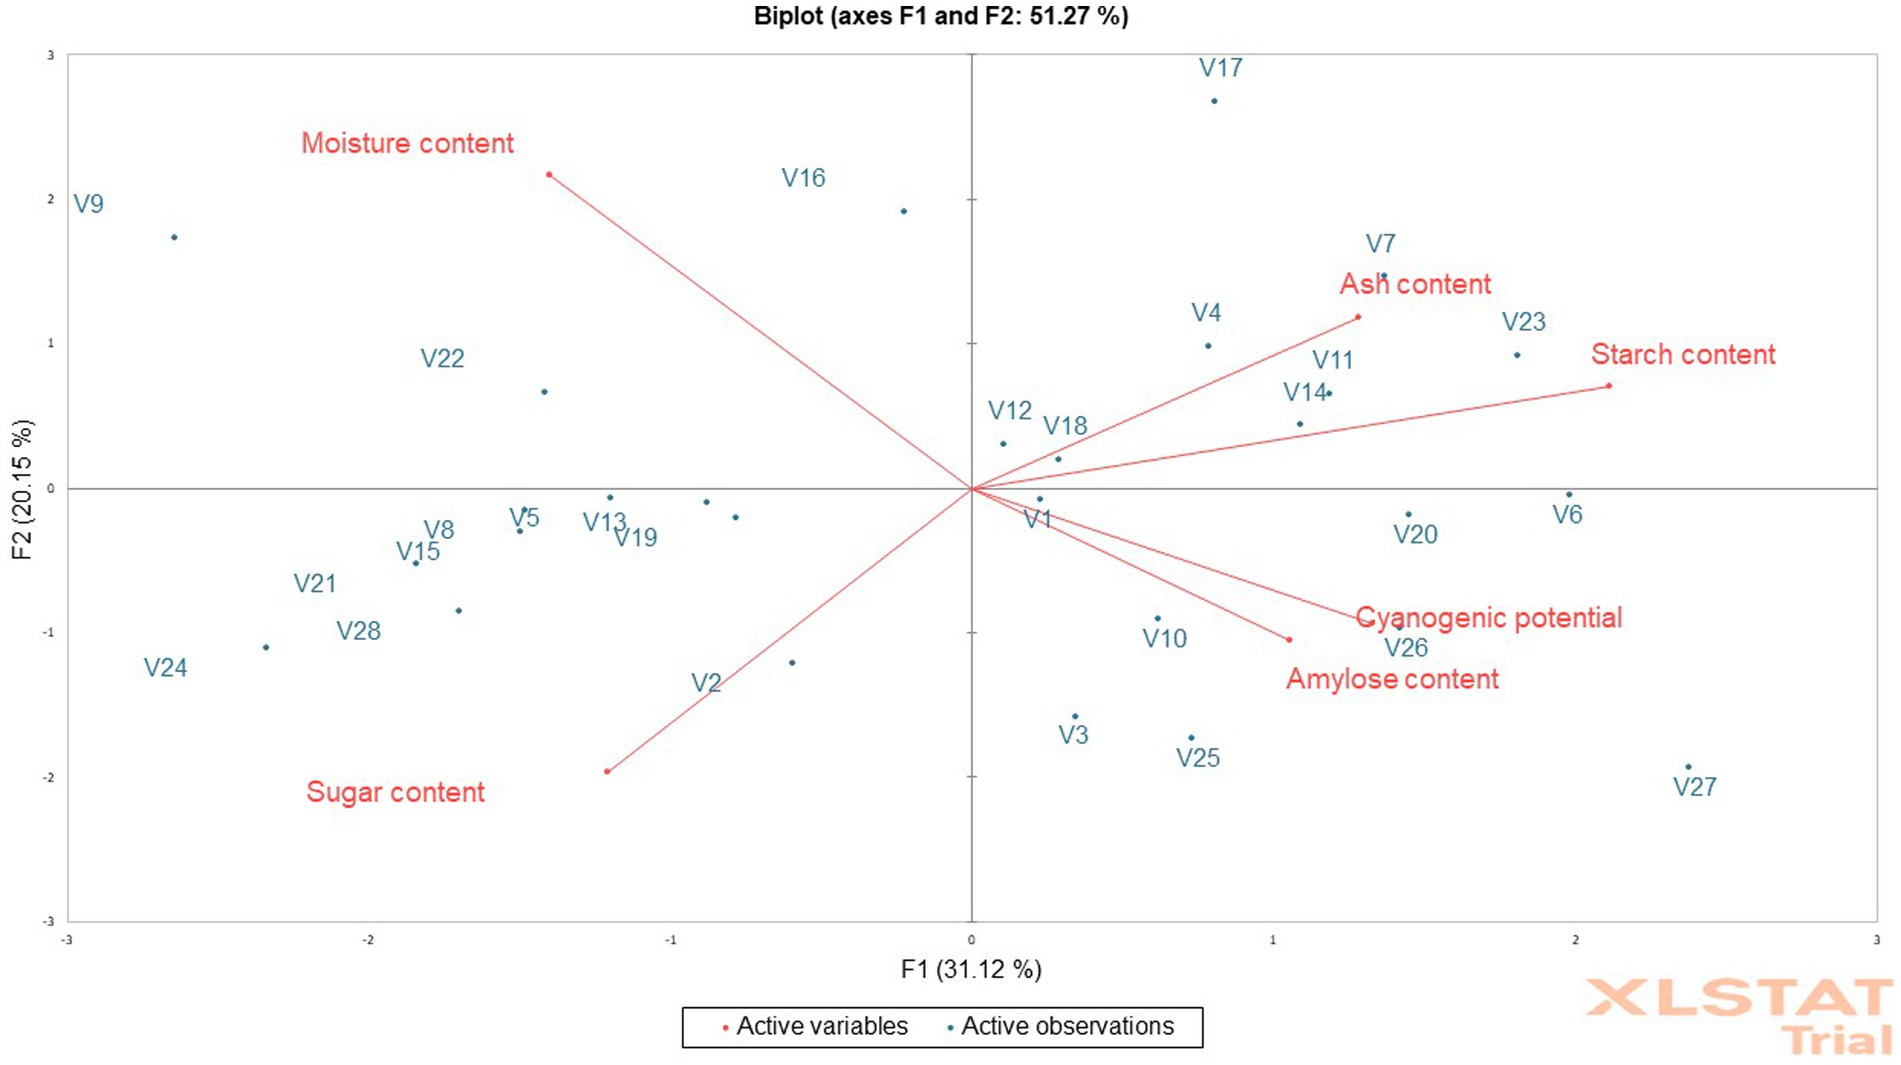
Figure 3. Principal component analysis biplot of the chemical composition of fufu flour from different cassava genotypes.
The ash content of the fufu flour was higher in the V14 genotype (0.74%) and lower in that of the V25 genotype (0.38%). Though processing contamination might indicate a high concentration in a sample, ash content reflects the mineral status (Baah et al., 2009). The ash content of a floury sample must meet the Codex Alimentarius Commission’s standards of 1.50% (Codex Alimentarius Commission, 1989). Consequently, all the fufu flour samples produced from different cassava varieties had ash contents that were less than the regulatory value stipulated by the Codex Alimentarius Commission (1989) and within the range of values reported by Etudaiye et al. (2009) (0.05–2.80%) and Awoyale et al. (2020) (0.25–1.51%) for fufu flour made from different cassava varieties. Fufu flour of similar ash content may be produced from V4, V17, V14, V7, V12, V23, V18, and V11 genotypes. This is because these genotypes and the control sample fall within the same quadrant as the ash content of the fufu flour (Figure 3) although the ash content of the fufu flour contributed significantly to the 31.12% variation of PC1 (r = 0.50) (Supplementary Table S3).
One of the important indicators of the quality of fufu flour is its starch content, which influences the texture of the cooked dough (Akingbala et al., 2005). Fufu flour’s starch content was higher in the V5 genotype (78.57%) and lower in the V23 genotype (73.78%). In the production of fufu flour (fermentation), the breakdown of starch into sugar was higher in the V28 genotype (3.52%) and lower in the V7 genotype (2.08%) (Akingbala et al., 2005). The starch content of the fufu flour samples was lower compared to the range of values (84.75–90.59%) reported by Awoyale et al. (2020), but a comparable sugar content (2.78–4.29%) to that of this study was reported for fufu flour by the researchers. Fufu flour of the same starch content may be produced from V4, V17, V14, V7, V12, V23, V18, and V11 genotypes. This is because these genotypes fall within the same quadrant as the starch content of the fufu flour (Figure 3). Similarly, fufu flour of the same sugar content may be produced from V2, V8, V5, V13, V15, V19, V21, V24, and V28 genotypes because these genotypes fall within the same quadrant as the sugar content of the fufu flour (Figure 3). The starch content of the fufu flour contributed significantly to the 31.12% variation of PC1 (r = 0.82) and the sugar content contributed to 20.15% of PC2 of the total variations of 51.27% (Supplementary Table S3).
The amylose content of the fufu flour ranged from 24.72–35.33%, with the V27 genotype having the highest and the V9 genotype having the least. The stability of the viscous solution produced when starch is heated depends on the amylose content of the starchy food (Awoyale et al., 2020). As a result, the amount of retrogradation of the starch molecules after heating increases with the amount of amylose in the flour. Thus, cooked dough prepared from V27 fufu flour may retrograde easily due to its high amylose content compared to that of the V9 genotype with low amylose content. Fufu flour of similar amylose content as the control sample (V1 variety) may be produced from V3, V6, V10, V20, V25, V26, and V27 genotypes because they all fall within the same quadrant (Figure 3). However, the negative contribution of the amylose content of the fufu flour to 31.12% of the variation to PC1 was not significant (p > 0.05, r = −0.41). This is because the correlation coefficient is less than 0.50%.
Hydrolysis of cyanogenic glucosides, a class of nitrile-containing chemicals that produce hydrogen cyanide following an enzymatic breakdown, results in the presence of hydrogen cyanide in cassava products. If the roots are not sufficiently processed before ingestion, the cyanogenic glycoside is poisonous to humans (Uyo et al., 2007). The fufu flour produced from the V21 genotype (1.78 mg HCN/kg) has the lowest CNP content and that of the V10 genotype (4.66 mg HCN/kg) has the highest (Table 4). However, all the fufu flour samples had very low levels of CNP relative to the criterion set by the Codex Alimentarius Commission (10 mg HCN/kg), suggesting that they may be cyanide-free and suitable for human consumption (Codex Alimentarius Commission, 1989). The cyanogenic potential of the fufu flour contributed significantly (p < 0.05) to the 31.12% variation of the PC1 (r = 0.52) (Supplementary Table S3). Also, fufu flour of similar cyanogenic potential content may be produced from V3, V6, V10, V20, V25, V26, and V27 genotypes compared to the control sample (V1 variety) (Figure 3).
The instrumental texture attributes of cooked fufu dough from different cassava varieties are shown in Table 5. The mean of the hardness is 27.18 N/m2, adhesiveness is −62.04 N/m2, moldability is 0.93, stretchability is 0.89, and gumminess is 25.26 N/m2.
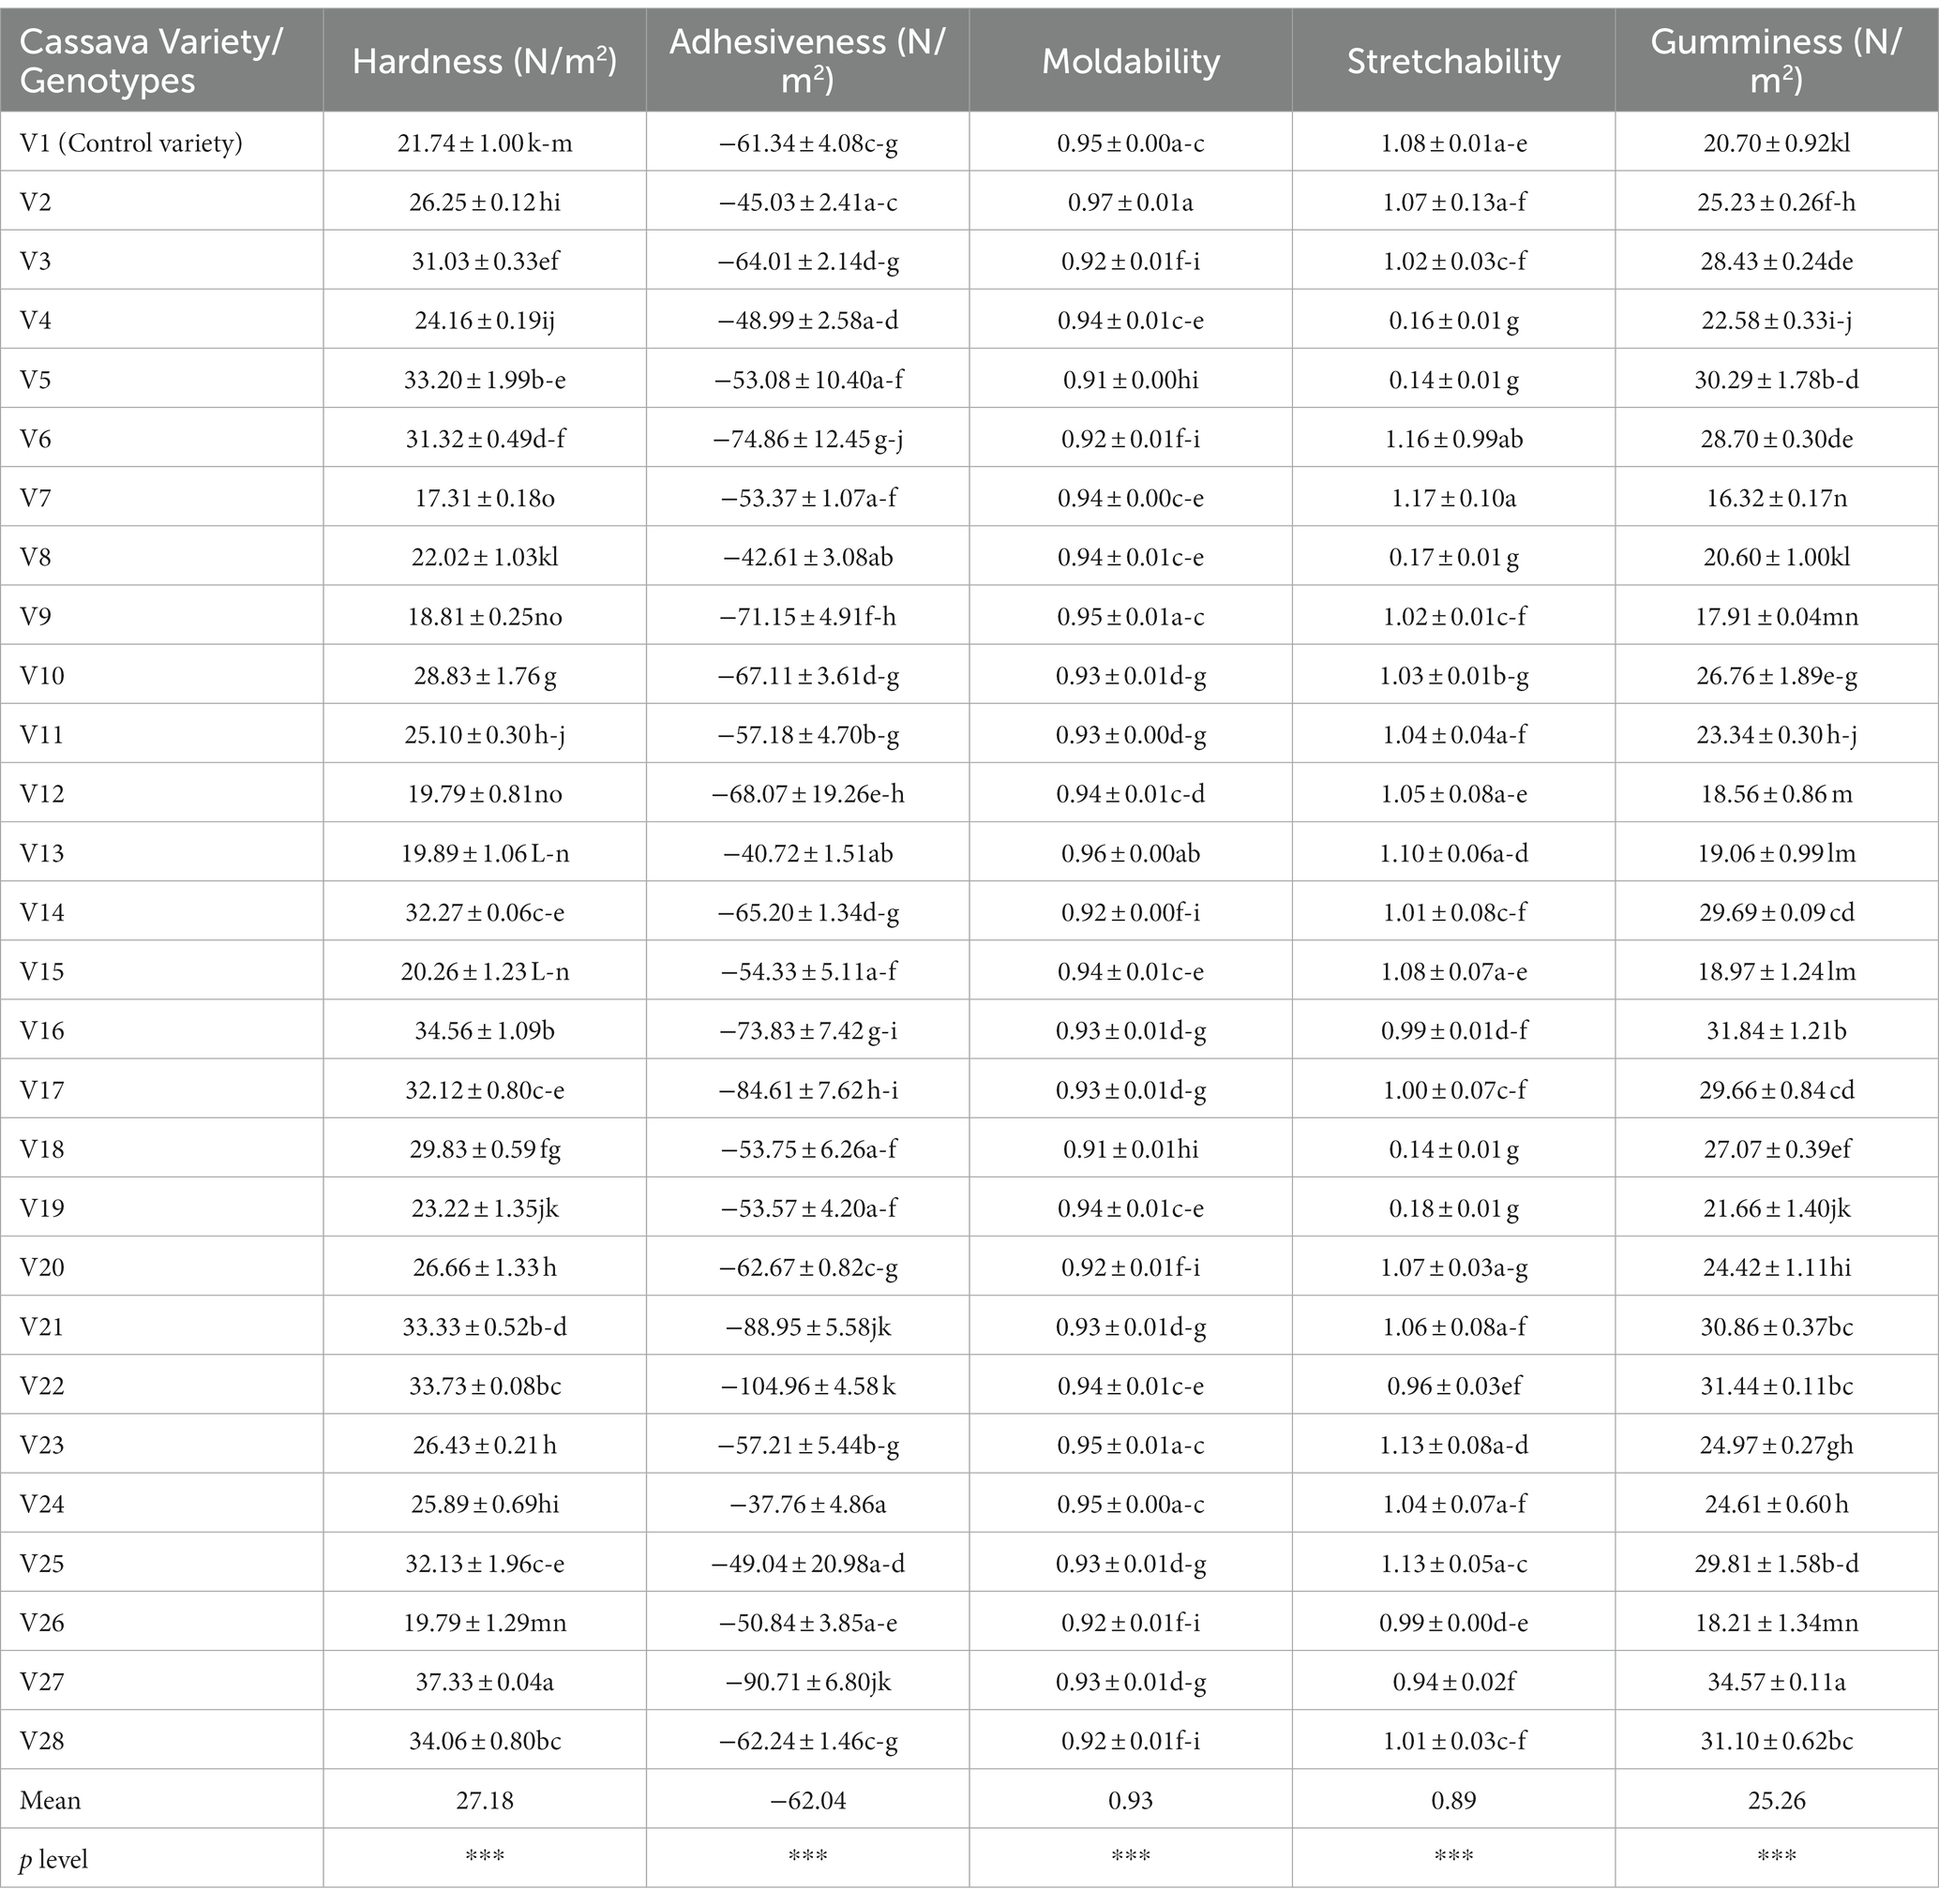
Table 5. Instrumental texture attributes of cooked fufu dough produced from different cassava genotypes and control variety.
The measure of force needed to crush cooked dough is known as hardness (Awoyale et al., 2022). However, cooked fufu dough is swallowed during consumption. In the texture profile study, cohesiveness, chewiness, and gumminess are all directly impacted by hardness (Awoyale et al., 2022). The hardness of the cooked fufu dough was higher in V27 fufu flour (37.33 N/m2) and lower in V7 fufu flour (17.31 N/m2). The low pectin content in the V27 genotype may be responsible for the hardness of the cooked fufu dough (Awoyale et al., 2023). However, any of the cooked fufu dough from the genotypes may be accepted by the consumers based on their geographical locations (Chijioke et al., 2021). The PCA result showed that the hardness of the cooked fufu dough contributed positively to the 55.78% positive variations in PC1. This is because the correlation between the PC1 and the hardness of the cooked fufu dough was positive and significant (p < 0.05, r = 0.96) (Supplementary Table S4). Cooked fufu dough of similar hardness may be prepared from V3, V5, V18, and V28 fufu flour since they all fall within the same quadrant as hardness (Figure 4).
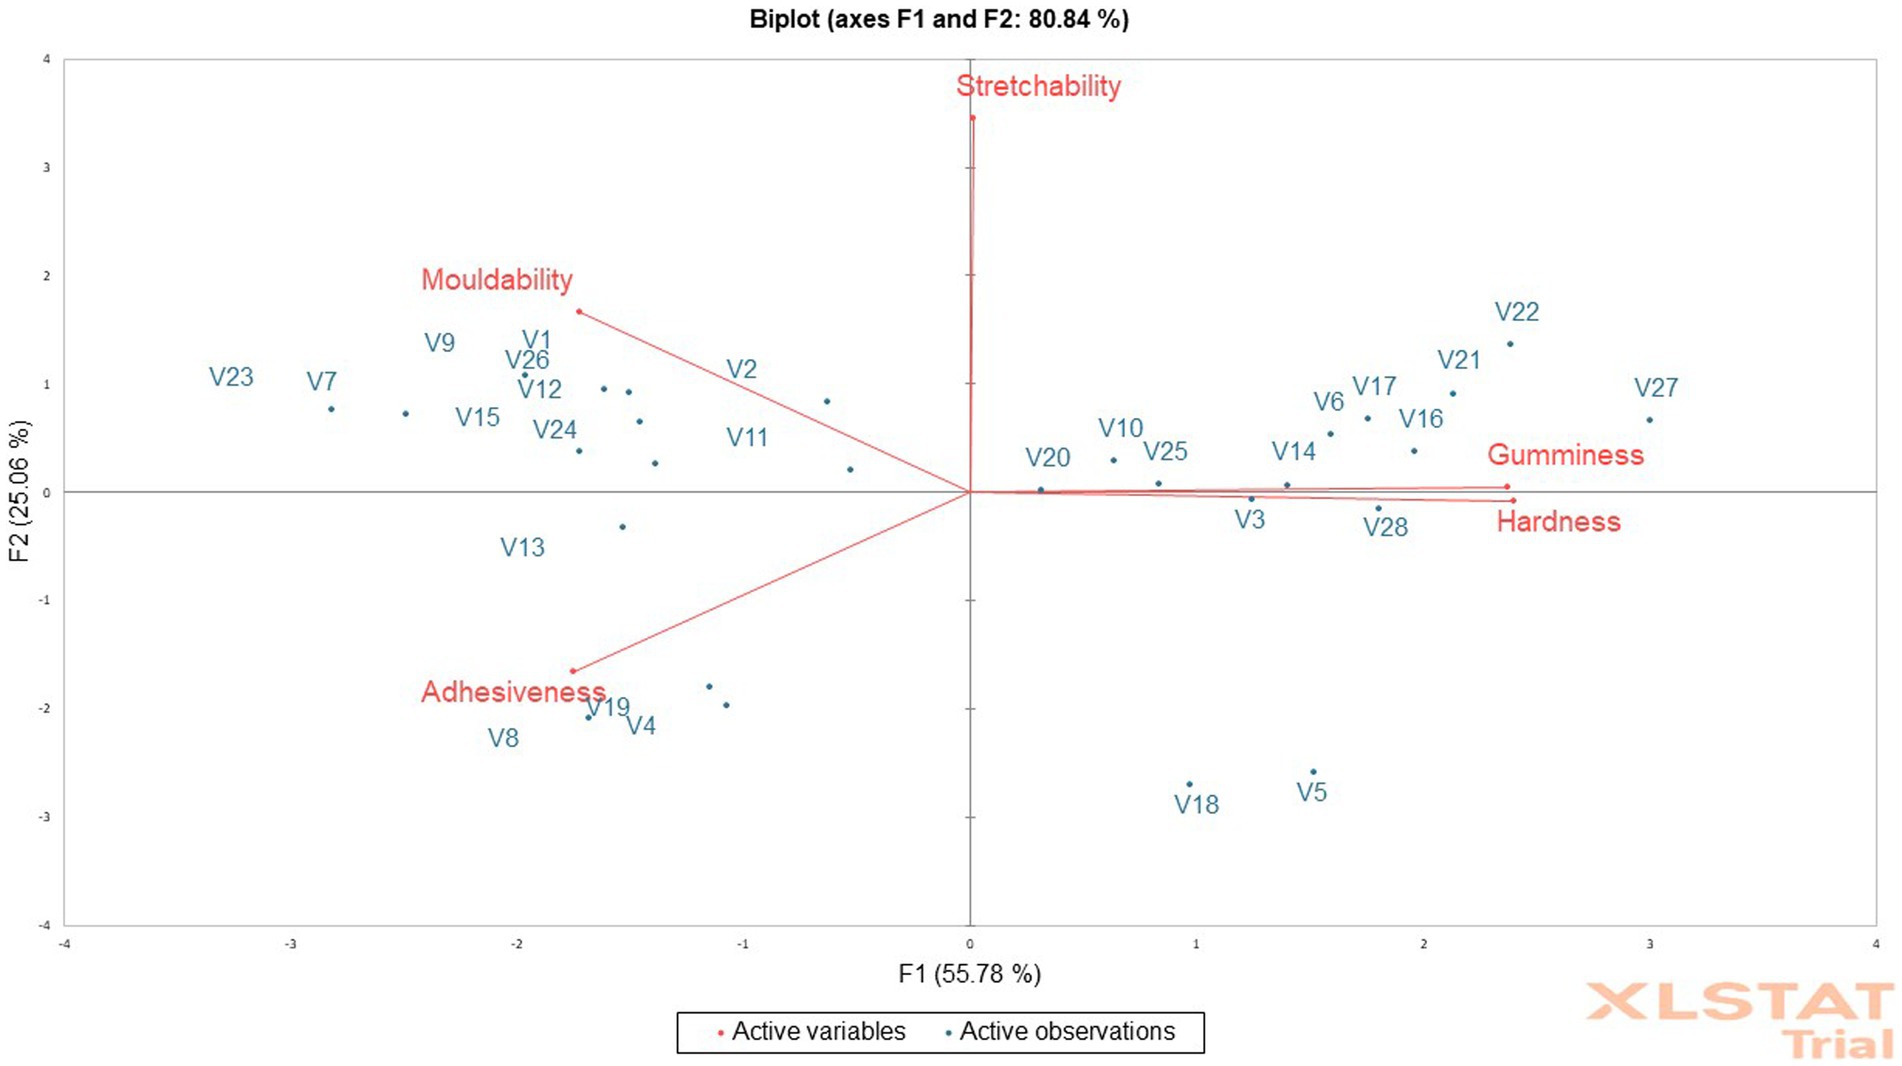
Figure 4. Principal component analysis biplot of the instrumental texture attributes of cooked fufu from different cassava genotypes.
The cooked dough’s adhesiveness determines how it sticks to the hand, mouth, or teeth (Awoyale et al., 2022). The adhesiveness of the cooked fufu dough ranged from −104.96 to −37.76 N/m2, with V24 fufu flour having the highest and V22 fufu flour being the lowest. Since the adhesiveness of cooked dough is not a desirable textural attribute (Chijioke et al., 2021), the V22 cooked fufu dough may be acceptable to consumers compared to that of the V24 genotype because of its low adhesiveness. Cooked fufu dough of similar adhesiveness may be prepared from V4, V8, V13, and V19 fufu flours because they all fall within the same quadrant as the adhesiveness (Figure 4) although the cooked fufu dough adhesiveness contributed significantly to the 55.78% negative variation in PC1 (p < 0.05, r = −0.70) (Supplementary Table S4).
Calculated as the work area during the second compression divided by the work area during the first, moldability describes how well the product withstands a second deformation in comparison to its first resistance (Awoyale et al., 2023). The cooked fufu dough is typically manually squeezed while being evaluated for its mechanical and geometrical properties, then formed into balls with the hand, dipped into the soup, and consumed; thus, moldability is a desirable textural attribute of cooked fufu dough (Chijioke et al., 2021; Awoyale et al., 2022). Consequently, the cooked fufu dough from V2 fufu flour (0.97) may be more acceptable by consumers due to its high moldability, compared to fufu dough from V18 and V5 (0.91) genotypes. The contribution of the moldability of the cooked fufu dough to the 55.78% variation in the PC1 was significant and negative (p < 0.05, r = −0.69) (Supplementary Table S4). Cooked fufu dough of the same moldability as that of the control sample (V1 variety) may be prepared from the V2, V7, V8, V11, V12, V15, V23, V24, and V26 fufu flour. This is because all the genotypes fall within the same quadrant as the control sample and the moldability (Figure 4).
The degree of stretchability refers to how quickly cooked dough regains its original shape after being compressed between the teeth (Awoyale et al., 2023). Since cooked fufu dough is usually swallowed during consumption, stretchability may not be an important textural attribute (Chijioke et al., 2021). The stretchability was higher in the cooked fufu flour prepared from the V7 fufu flour (1.17) and lower in the cooked fufu dough prepared from V18 and V5 fufu flour (0.14). Cooked fufu dough from the V20, V10, V25, V14, V6, V17, V16, V21, V22, and V27 may have similar stretchability because they all fall within the same quadrant with the stretchability of the cooked fufu dough (Figure 4). However, the cooked fufu dough stretchability has a positive and significant contribution to the 25.06% variation of PC2 (p < 0.05, r = 0.93) (Supplementary Table S4).
Gumminess is the amount of energy needed to break down a semi-solid food so that it may be ingested. Cohesiveness is multiplied by hardness to calculate it (Awoyale et al., 2023). Gumminess is an undesirable textural attribute of cooked fufu dough just like adhesiveness (Chijioke et al., 2021), thus cooked fufu dough prepared from V7 fufu flour may be accepted by consumers due to its low gumminess (16.32 N/m2) compared to the cooked fufu dough from V27 fufu flour with high gumminess (34.57 N/m2) (Table 5). The lack of hydrophobic interaction may have caused inhomogeneity and instability in the network structure of the cooked fufu dough made from V7 fufu flour, resulting in a reduction in the texture characteristic (gumminess). The gumminess of the cooked fufu dough had a significant and positive contribution to the 55.78% variation in the PC1 (Supplementary Table S4). In addition, just like the stretchability, the gumminess of the cooked fufu dough from the V20, V10, V25, V14, V6, V17, V16, V21, V22, and V27 may be similar because they all fall within the same quadrant as the gumminess of the cooked fufu dough (Figure 4).
The mean of the sensory texture attributes depicts that the cooked fufu dough was stretchable, soft, sticky, and mouldable (Table 6). Although all the cooked fufu dough was stretchable, the PCA biplot was able to separate genotypes whose cooked fufu dough’s stretchability may be similar to that of the control sample (V1 variety), and these are the V4, V7, V8, V6, V9, and V19 genotypes (Figure 5). The cooked fufu dough stretchability contributed negatively (p < 0.05, r = −0.56) to the 55.78% variation in PC1 and positively (p < 0.05, r = 0.83) to the 19.47% variation in PC2 (Supplementary Table S5).
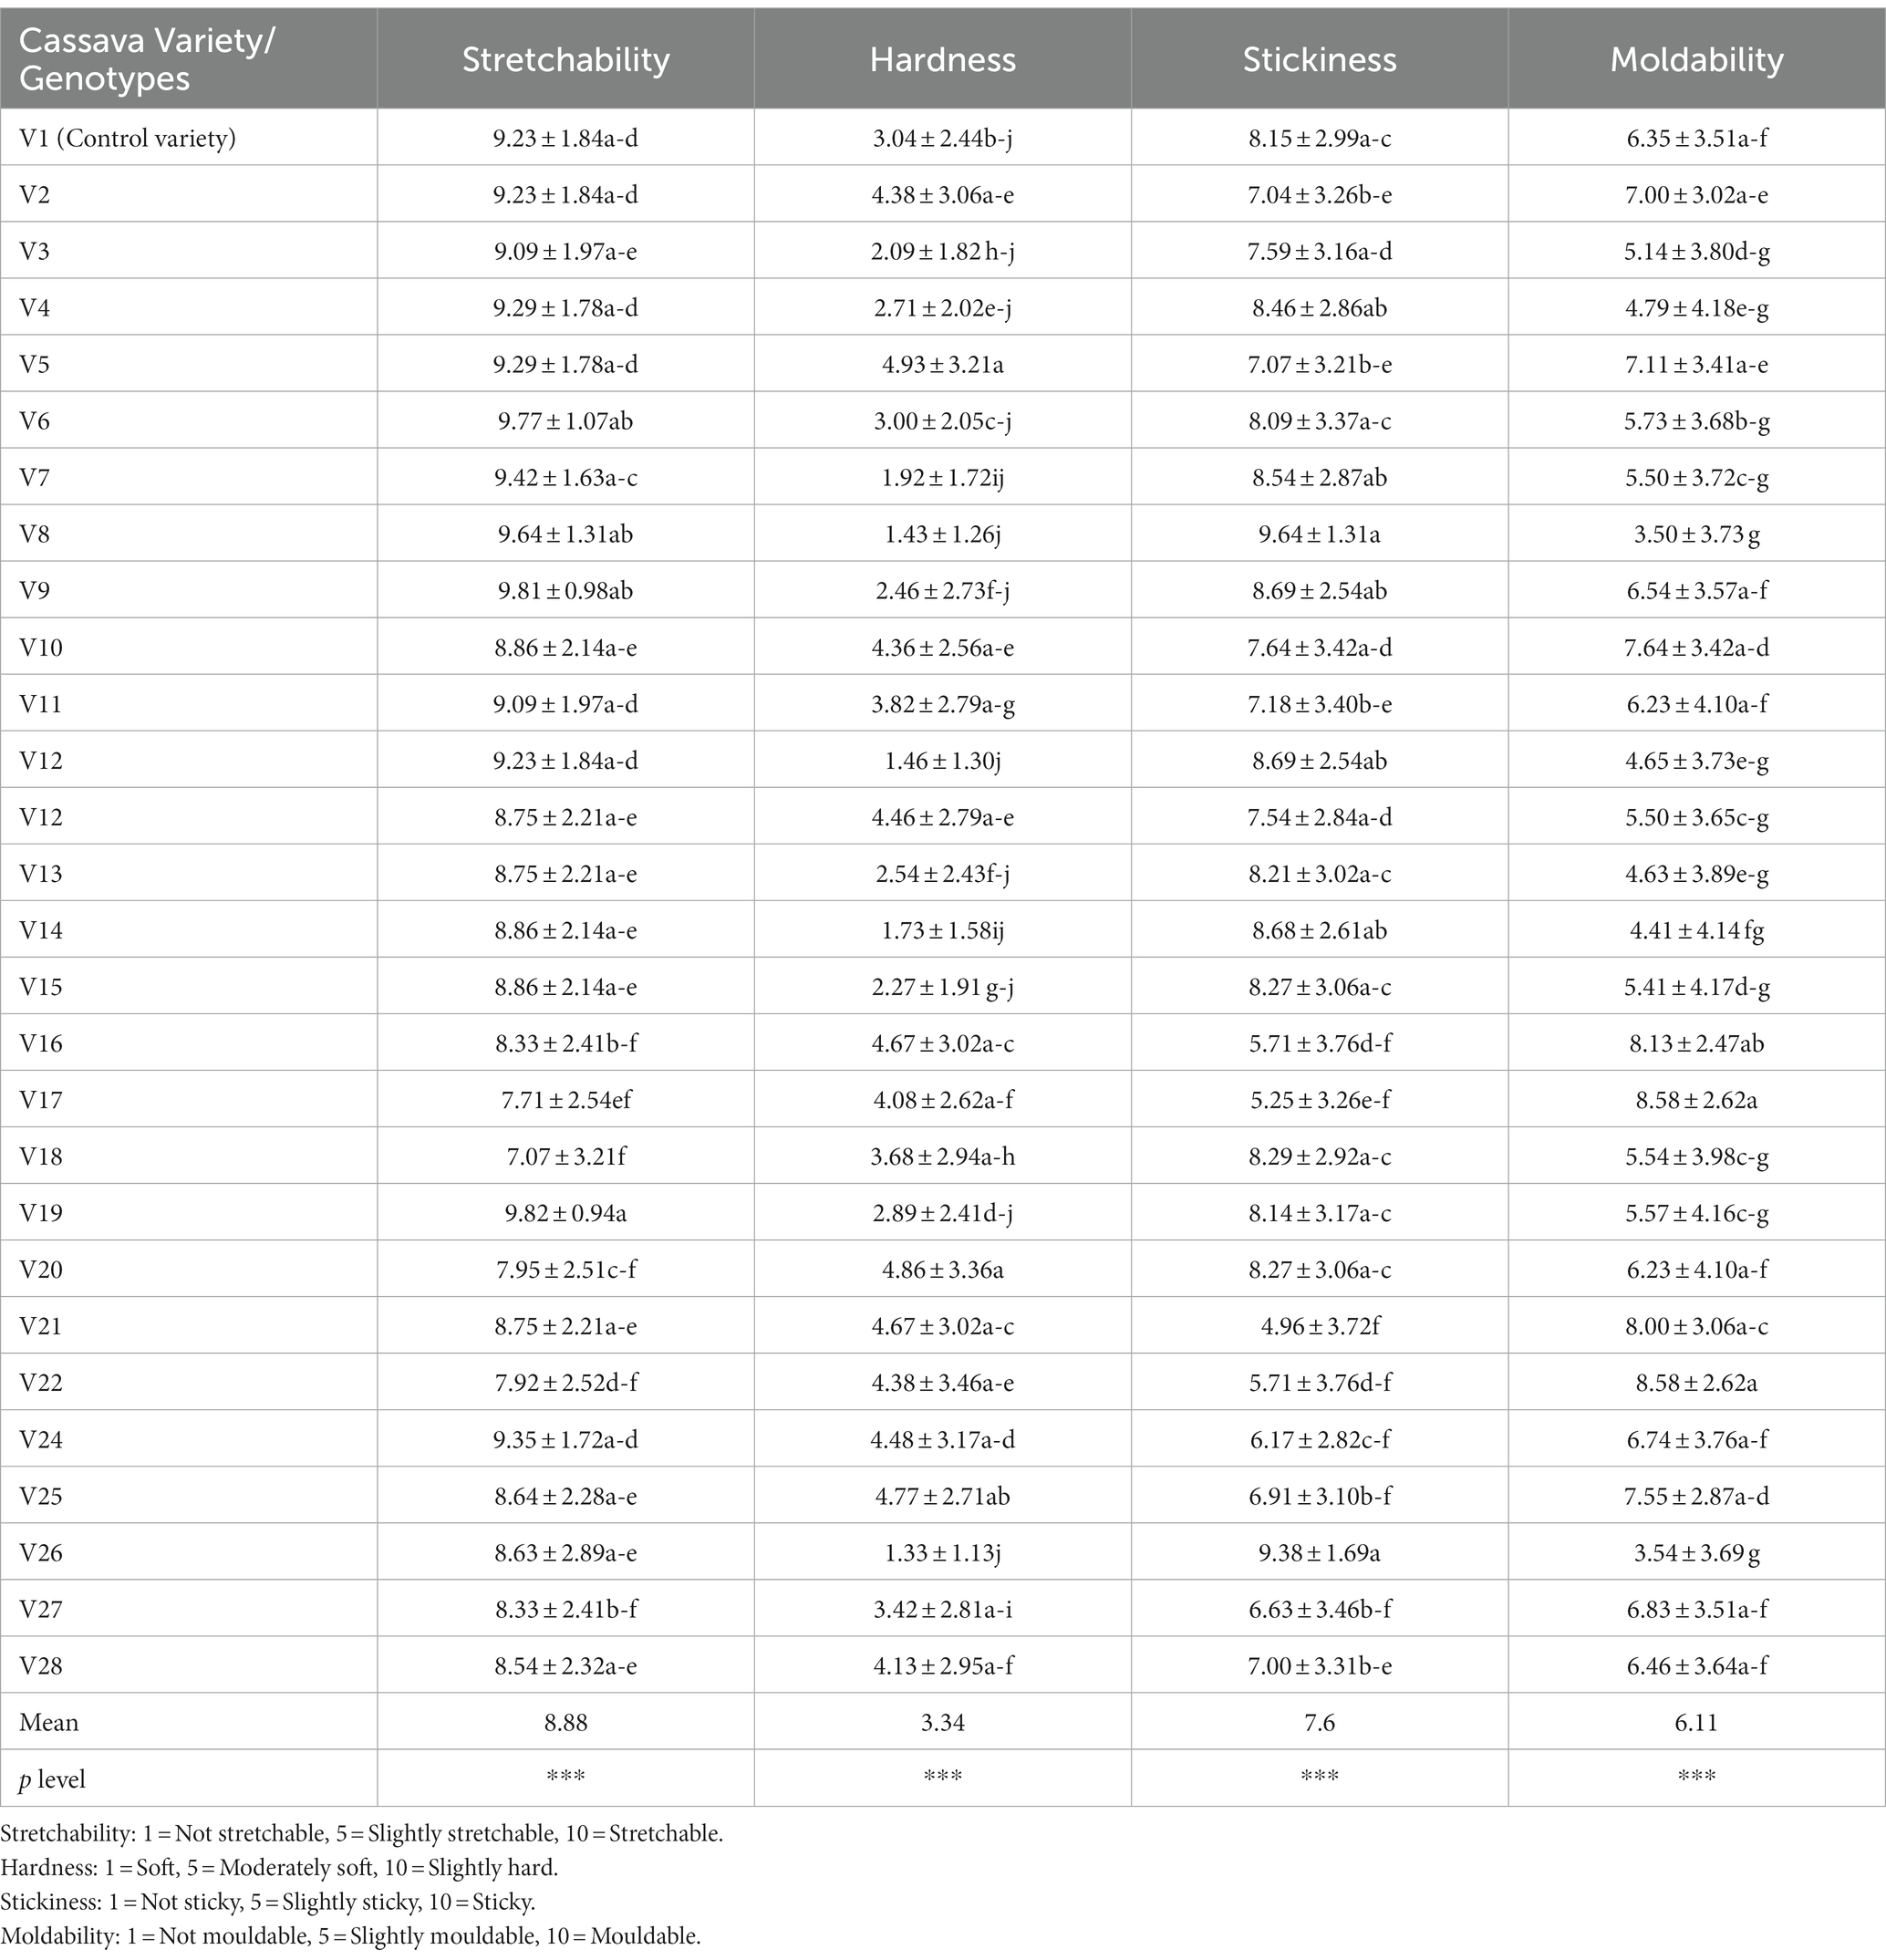
Table 6. Sensory texture attributes of cooked fufu dough produced from different cassava genotypes and control variety.
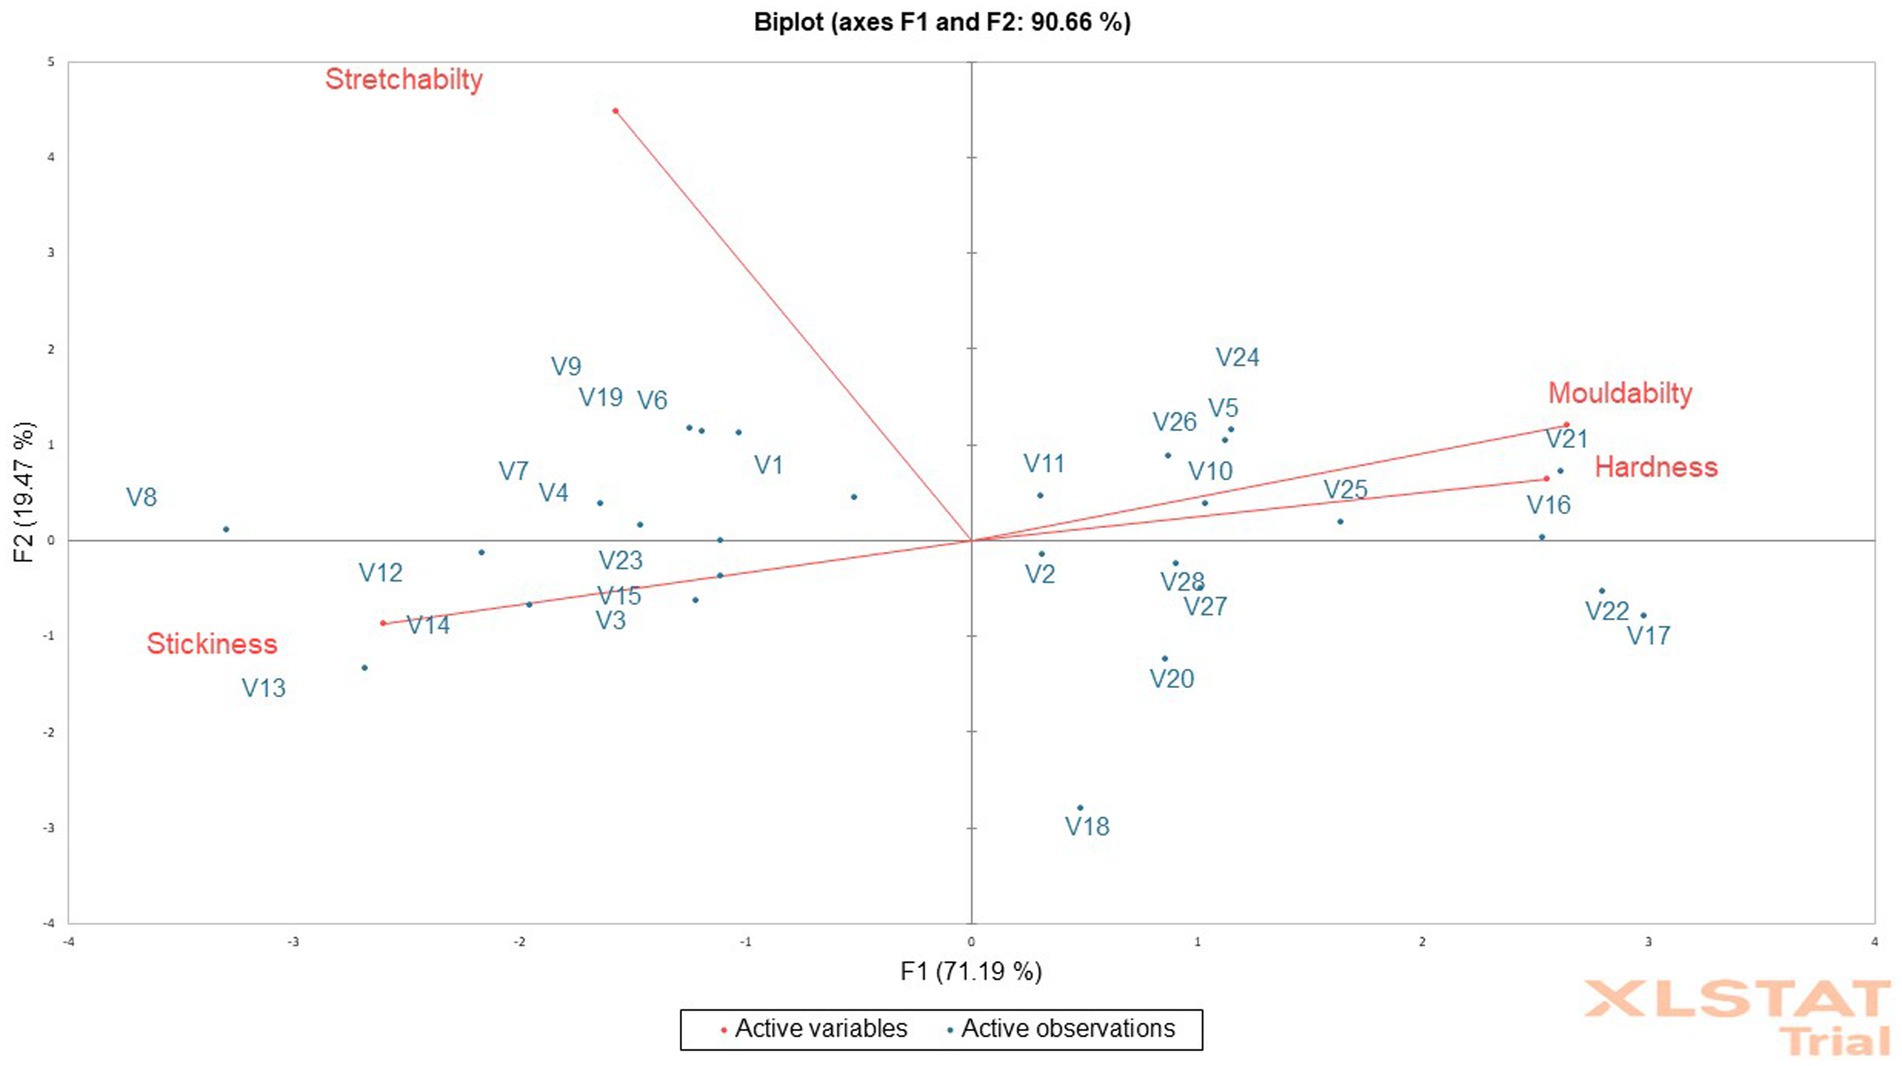
Figure 5. Principal component analysis biplot of the sensory texture attributes of cooked fufu from different cassava genotypes.
The cooked fufu dough prepared from V13, V8, and V12 fufu flour was soft, but that of the V16, V21, V25, V20, and V5 fufu flour was moderately soft. Awoyale et al. (2023) reported that high pectin content in cooked fufu dough prepared from the V5 flour might have contributed to the softer texture during cooking and cooling. These authors also added that the high-water binding capacity of pectin may keep the cooked fufu dough matrix moist, thus maintaining starch in a gelatinized state, hence making the fufu dough relatively soft in the cooled form. This implies that the V13, V8, and V12 genotypes may contain high pectin content, thus the softness of the cooked fufu dough. Cooked fufu dough of similar softness/hardness may be produced from the V10, V11, V5, V24, V25, V26, V16, and V21 fufu flours (Figure 5). However, softness/hardness contributes significantly (p < 0.05) to the 55.78% variation in the PC1 (r = 0.90) (Supplementary Table S5).
The cooked fufu dough prepared from the V21 and V17 fufu flour was slightly sticky compared to the cooked fufu dough prepared from the V8 genotype, which was stickier. The stickiness of the cooked fufu from the V8 genotype may be attributed to the lower hydrophobic interaction that may have led to inhomogeneity and instability in the network structure of the fufu dough, thus reducing the textural characteristics. However, stickiness is not a preferred textural attribute of cooked fufu dough, thus the cooked dough from the V8 genotype may not be accepted by consumers (Chijioke et al., 2021; Awoyale et al., 2022). Cooked fufu dough of similar stickiness may be prepared from the V12, V13, V14, V3, V15, and V23 fufu flour because they all fall within the same quadrant as the stickiness of the cooked fufu dough (Figure 5). Also, the stickiness of the cooked fufu dough had a negative and significant contribution to the 55.78% variation in the PC1 (p < 0.05, r = −0.92) (Supplementary Table S5).
Conversely, moldability is one of the acceptable textural attributes of cooked fufu dough (Chijioke et al., 2021). Therefore, the cooked fufu dough from the V17 and V22 fufu flour may be accepted by the consumers because of their moldability, compared to the cooked fufu dough prepared from the V8, V13, and V14 fufu flour which was not mouldable (Table 5). The possible interaction between the starch molecules and pectin during the gelatinization process may have increased the final viscosity of the V17 and V22 cooked dough and then is responsible for their high moldability (Awoyale et al., 2023). Cooked fufu dough of the same moldability may be prepared from V10, V11, V5, V24, V25, V26, V16, and V21 fufu flours (Figure 5). However, moldability contributes significantly (p < 0.05) to the 55.78% positive variation in the PC1 (r = 0.93) (Supplementary Table S5).
The relationship between the fufu flour quality attributes from different cassava genotypes compared to that of the control sample (V1 variety) using the PCA revealed that fufu flour of similar functional (BD) and pasting (peak and breakdown viscosities) properties, and chemical composition (amylose content) to that of the control sample (V1 variety) was produced from the V6 genotype. However, the cooked fufu dough prepared from the V7 and V8 genotypes are comparable to that of the V1 variety in terms of the sensory (stretchability) and instrumental (moldability) texture attributes; therefore, most of the genotypes may be suitable for producing fufu flour like the control sample (V1 variety) based on attributes preferred by the consumers.
The original contributions presented in the study are included in the article/Supplementary material, further inquiries can be directed to the corresponding authors.
The studies involving humans were approved by International Institute of Tropical Agriculture, Ibadan, Nigeria. The studies were conducted in accordance with the local legislation and institutional requirements. The ethics committee/institutional review board waived the requirement of written informed consent for participation from the participants or the participants' legal guardians/next of kin because the product is a product commonly consumed by the respondents.
WA: Conceptualization, Data curation, Formal analysis, Investigation, Methodology, Software, Validation, Visualization, Writing – original draft, Writing – review & editing. BM-D: Conceptualization, Data curation, Funding acquisition, Project administration, Resources, Supervision, Visualization, Writing – review & editing. HO: Data curation, Formal analysis, Investigation, Methodology, Validation, Writing – original draft, Writing – review & editing. MA: Investigation, Methodology, Software, Validation, Writing – review & editing. EA: Data curation, Investigation, Methodology, Supervision, Validation, Writing – review & editing.
The author(s) declare financial support was received for the research, authorship, and/or publication of this article. The Next Generation (NEXTGEN) Cassava Project, with funding from the Bill & Melinda Gates Foundation and the Department for International Development of the United Kingdom, supported this study.
We acknowledge the CGIAR Research Program’s support of Roots, Tubers, and Bananas (RTB), the staff of the Food and Nutrition Sciences Laboratory, and the Cassava Breeding Units, especially Ismail Rabbi, of IITA, Ibadan, Nigeria.
The authors declare that the research was conducted in the absence of any commercial or financial relationships that could be construed as a potential conflict of interest.
The author(s) declared that they were an editorial board member of Frontiers, at the time of submission. This had no impact on the peer review process and the final decision.
All claims expressed in this article are solely those of the authors and do not necessarily represent those of their affiliated organizations, or those of the publisher, the editors and the reviewers. Any product that may be evaluated in this article, or claim that may be made by its manufacturer, is not guaranteed or endorsed by the publisher.
The Supplementary material for this article can be found online at: https://www.frontiersin.org/articles/10.3389/fsufs.2023.1272724/full#supplementary-material
Abass, A. B., Awoyale, W., Ogundapo, A., Oluwasoga, O., Nwaoliwe, G., Oyelekan, J., et al. (2022). Adoption of improved cassava varieties by processors is linked to processing characteristics and products’ biophysical attributes. J. Food Process. Preserv. 46:16350. doi: 10.1111/JFPP.16350
Adebowale, A. A., Sanni, L., Awonorin, S., Daniel, I., and Kuye, A. (2007). Effect of cassava varieties on the sorption isotherm of tapioca grits. Int. J. Food Sci. Technol. 42, 448–452. doi: 10.1111/j.1365-2621.2007.01261.x
Adebowale, A. A., Sanni, L. O., and Onitilo, M. O. (2008). Chemical composition and pasting properties of tapioca grits from different varieties and roasting methods. Afr. J. Food Sci. 2, 77–82.
Akingbala, J. O., Oyewole, O. B., Uzo-Peters, P. I., Karim, R. O., and Bacuss-Taylor, G. S. H. (2005). Evaluating stored cassava quality in gari production. Journal of Food, Agriculture and Environment 3, 75–80. doi: 10.1234/4.2005.522
AOAC. (2000). Association of Official Analytical Chemists. Official methods of analysis of the Association of Official Analytical Chemists, 17th. Washington, D.C. USA: Association of Official Analytical Chemists.
Awoyale, W., Asiedu, R., Kawalawu, W. K. C., Abass, A., Maziya-Dixon, B., Kromah, A., et al. (2020). Assessment of the suitability of different cassava varieties for gari and fufu flour production in Liberia. Asian Food Sci J 14, 36–52. doi: 10.9734/afsj/2020/v14i230128
Awoyale, W., Olatoye, K. K., and Maziya-Dixon, B. (2023). “Cassava pectin and textural attributes of cooked gari (eba) and fufu” in Pectin-extraction, processing, and uses in the food and pharmaceutical industries. ed. M. Ahmed (England: IntechOpen publishers)
Awoyale, W., Oyedele, H., Adenitan, A. A., Adesokan, M., Alamu, E. O., and Maziya-Dixon, B. (2022). Correlation of the quality attributes of fufu flour and the sensory and instrumental texture profiles of the cooked dough produced from different cassava varieties. Int. J. Food Prop. 25, 326–343. doi: 10.1080/10942912.2022.2026955
Baah, F. D., Maziya-Dixon, B., Asiedu, R., Oduro, I., and Ellis, W. O. (2009). The nutritional and biochemical composition of D. alata (Dioscorea spp.) tubers. J Food, Agriculture, and Environ 7:373378
Chijioke, U., Madu, T., Okoye, B., Ogunka, A. P., Ejechi, M., Ofoeze, M., et al. (2021). Quality attributes of fufu in south-East Nigeria: a guide for cassava breeders. Int. J. Food Sci. Technol. 56, 1247–1257. doi: 10.1111/ijfs.14875
Codex Alimentarius Commission (1989). Joint FAO/WHO food standard Programme. Codex standard for miscellaneous products. Report of the Eighteenth Session, Geneva, 3-12 July Rome: World Health Organization, p. 136.
Egwim, E., Amanabo, M., Yahaya, A., and Bello, M. (2013). Nigerian indigenous fermented foods: processes and prospects. IntechOpen Science/open mind. 153–180. doi: 10.5772/52877
Etudaiye, H. A., Nwabueze, T. U., and Sanni, L. O. (2009). Quality of fufu processed from cassava mosaic disease (CMD) resistant varieties. Afr. J. Food Sci. 3, 61–67.
Ikegwu, O. J., Nwobasi, V. N., Odoli, M. O., and Oledinma, N. U. (2009). Evaluation of the pasting and some functional properties of starch isolated from some improved cassava varieties in Nigeria. Africa J Biotechnol 8, 2310–2315.
Ikujenlola, A. V. (2008). Chemical and functional properties of complementary food from malted and unmalted acha (Digitaria exilis), soybean (Glycine max), and defatted sesame seeds (Sesamum indicum.). J. Eng. Appl. Sci. 3, 471–475. doi: 10.5897/AJFS2014.1173
Johnson, P. N. T., Gallat, S., Oduro-Yeboah, C., Osei-Yaw, A., and Westby, A. (2006). Sensory properties on instant fufu flour from four high-yielding Ghanaian varieties of cassava. Trop. Sci. 46, 134–138. doi: 10.1002/ts.59
Kulkarni, D. N., and Ingle, U. M. (1991). Sorghum malt-based weaning food formulations: preparation, functional properties, and nutritive value. J Food and Nutrition 13, 322–323.
Ogungbemi, K., Ajisafe, S. S., Balogun, B., Balogun, D. A., Ilesanmi, F. F., and Ilori, A. O. (2021). Quality assurance, safety and acceptability of Odourless Fufu flour produced from white and yellow-flesh cassava using NSPRI-technology. Alexandria Sci Exchange J 42, 467–474. doi: 10.21608/asejaiqjsae.2021.176110
Olatunde, G. O., Arogundade, L. K., and Orija, O. I. (2017). (2017) chemical, functional and pasting properties of banana and plantain starches modified by pre-gelatinization, oxidation and acetylation. Cogent Food & Agriculture 3:1283079. doi: 10.1080/23311932.2017.1283079
Rosales-soto, M. U., Ross, C. F., Younce, F., Fellman, J. K., Mattinson, D. S., Huber, K., et al. (2016). Physicochemical and sensory evaluation of cooked, fermented protein-fortified cassava (Manihot esculenta Crantz) flour. Advances in Food Technol Nutritional Sci Open J 2, 9–18. doi: 10.17140/AFTNSOJ-2-126
Sanni, L., Adebowale, A., Awoyale, W., and Fetuga, G. (2008). Quality of gari (roasted cassava mash) in Lagos state, Nigeria. Nigerian Food Journal 26, 125–134. doi: 10.4314/nifoj.v26i2.47446
Sanni, L. O., Adebowale, A. A., Filani, T. A., Oyewole, O. B., and Westby, A. (2006). Quality of flash and rotary dried fufu flour. Journal of Food, Agriculture and Environment 4, 74–78.
Teeken, B., Olaosebikan, O., Haleegoah, J., Oladejo, E., Madu, T., Bello, A., et al. (2018). Cassava trait preferences of men and women farmers in Nigeria: implications for breeding. Econ. Bot. 72, 263–277. doi: 10.1007/s12231-018-9421-7
Thiele, G., Dufour, D., Vernier, P., Mwanga, R. O. M., Parker, M. L., Geldermann, E. S., et al. (2021). A review of varietal change in roots, tubers and bananas: consumer preferences and other drivers of adoption and implications for breeding. Int. J. Food Sci. Technol. 56, 1076–1092. doi: 10.1111/ijfs.14684
Udensi, U. E., Tarawali, G., Favour, E. U., Asumugha, G., Ezedinma, C., Okoye, B. C., et al. (2011). Adoption of selected improved cassava varieties among smallholder farmers in south-eastern Nigeria. Journal of Food, Agriculture and Environment 9, 329–335.
Keywords: improved cassava genotype, fufu , biophysical attributes, textural attributes, varietal replacement
Citation: Awoyale W, Maziya-Dixon B, Oyedele H, Adesokan M and Alamu EO (2023) Biophysical and textural attributes as selection indices for replacing the adopted cassava variety with the improved genotype to produce fufu. Front. Sustain. Food Syst. 7:1272724. doi: 10.3389/fsufs.2023.1272724
Edited by:
Monica Trif, Centre for Innovative Process Engineering, GermanyReviewed by:
Arashdeep Singh, Punjab Agricultural University, IndiaCopyright © 2023 Awoyale, Maziya-Dixon, Oyedele, Adesokan and Alamu. This is an open-access article distributed under the terms of the Creative Commons Attribution License (CC BY). The use, distribution or reproduction in other forums is permitted, provided the original author(s) and the copyright owner(s) are credited and that the original publication in this journal is cited, in accordance with accepted academic practice. No use, distribution or reproduction is permitted which does not comply with these terms.
*Correspondence: Busie Maziya-Dixon, Yi5tYXppeWEtZGl4b25AY2dpYXIub3Jn
Disclaimer: All claims expressed in this article are solely those of the authors and do not necessarily represent those of their affiliated organizations, or those of the publisher, the editors and the reviewers. Any product that may be evaluated in this article or claim that may be made by its manufacturer is not guaranteed or endorsed by the publisher.
Research integrity at Frontiers
Learn more about the work of our research integrity team to safeguard the quality of each article we publish.