 Achara Boonkong
 Baichen Jiang1*
 Fallah Samuel Kassoh
- 1College of Economics and Management, South China Agricultural University, Guangzhou, China
- 2Sierra Leone Agricultural Research Institute P.M.B 1313, Tower Hill, Freetown, Sierra Leone
Food safety scandals have heightened the general public concern about food quality, safety, and environmental friendliness in food markets globally. Several studies have ascertained that consumers are willing to pay a premium price for food products with quality and safety information labels. However, most of these studies are country-specific, while few studies have investigated consumer preferences in a comparative context. In this study, we employed the Discrete Choice Experiment (DCE) to examine 1,900 Chinese and 2,986 Thai consumers’ willingness-to-pay (WTP) for brand, traceability, and green and organic certification labels on rice. A mixed logit model (MXL) was used to compute consumers’ WTP. The results demonstrate that consumers from both countries preferred green and organic certified labels. However, Chinese consumers’ preference for green and organic certified rice outweighs that of Thai consumers. For brand labels and green and organic certifications, Thai consumers are willing to pay more than the Chinese due to awareness and trust. However, Chinese consumers are willing to pay more for information with traceability labels than Thai consumers because of the increase in household income and health consciousness. The MXL also shows that trust, income, and age are factors associated with consumers’ preferences for certified rice in both countries. To boost consumers’ preferences for certified rice, relevant stakeholders need to implement the use of brand labels, traceability, and certification labels in the rice value chain.
1. Introduction
The globalization of food markets and food safety scandals have triggered general public concern about food quality, safety, and environmental friendliness (Molinillo et al., 2020; Wei et al., 2022). As a result of this, Chinese and Thai middle-class and educated consumers have become more concerned about food safety (Nuttavuthisit and Thøgersen, 2017; Niu et al., 2023), which has led to a rapid increase in demand for quality food such as green and organic products (Jiumpanyarach, 2018; Tandon et al., 2020; Wang, 2023). These concerns have resulted in the alteration of consumer preferences as well as purchasing decisions (Lang and Rodrigues, 2022). Furthermore, with a rapid increase in economic growth, income, and health consciousness, China and Thailand are evolving into high consumers of quality food on the world scale (Kantamaturapoj and Marshall, 2020; Niu et al., 2023; Wang et al., 2023). This study focuses on the comparison between Chinese and Thai consumers’ preferences and willingness to pay for quality rice attributes.
Rice is one of the staple cereals consumed by half the world’s population (Fang et al., 2021) and the second-largest food crop produced worldwide. In 2022, global rice consumption surged to 520 million metric tons and is expected to increase by 2030 at a rate of 4.3% per annum (Food Agricultural Organization, 2023). Globally, China is the leading rice producer, importer, and consumer, accounting for 29% of the global production in 2018 (Fang et al., 2021; Liu et al., 2023). Thailand has been the largest rice exporter for the last three decades, with a 30% share of rice trade volumes (Food Agricultural Organization, 2023). Approximately 90% of rice is produced in Asia, with India, Thailand, and Vietnam as the top exporters (Food Agricultural Organization, 2023). Rice production in these countries has significantly contributed to regional and global food security (Chitov, 2020; Fang et al., 2021; Gao et al., 2023). Its production has substantially increased in the past three decades due to the application of synthetic chemicals such as fertilizer and pesticides (Sutton et al., 2013; Kantamaturapoj and Marshall, 2020; Gao et al., 2023). According to Jeephet et al. (2016), Thailand ranked fourth in annual synthetic chemical usage in agriculture in Asia, which in turn exposed 35 million Thai people to pesticide risk in 2017 (Pinichka et al., 2019). However, the excessive use of these synthetic chemicals has raised serious concerns about human health and environmental issues (Chitov, 2020; Gao et al., 2023), which lower consumer trust and reduce rice consumption (Wei et al., 2022).
For instance, the per capita consumption of rice in China plummeted from 257 g/day in 1991 to 177 g/day in 2011 (Fang et al., 2021). As such, the annual per capita consumption of rice continued to drop from 97.5 kg to 87.1 kg between 2011 and 2016 and it is further predicted to dwindle to 56.8 kg in 2025 (Fang et al., 2021; Yan et al., 2022). In Thailand, the average annual per capita rice consumption declined from 145 kg in 2005 to 135.6 kg in 2015 and it is further anticipated to drop to 126.8 kg in 2025 (Abdullah et al., 2006; OECD-FAO, 2014). The decrease in industrially grown rice consumption in China and Thailand is attributed to an increase in demand for quality and health and safety standard concerns and, therefore, promotes interest in organic foods (Yanakittkul and Aungvaravong, 2020; Xu et al., 2021).
With regard to the change in market demand, the food sector has encouraged producers to embark on more green and organic agriculture ventures, which are considered to have fewer negative health and environmental implications (He et al., 2018; Gao et al., 2023). Recently, many nations including China and Thailand have been gradually transitioning from industrial to green and organic food production as a result of an increase in demand for certified food products (Tandon et al., 2020; Wang, 2023). For example, the global sale of organic food has gradually surged from 18 billion dollars in 2000 to 95 billion dollars in 2018 (Tandon et al., 2020). Previously, eco-friendly and healthier food consumption were common in developed nations; however, in the last decade, green and organic food consumption has witnessed significant changes in emerging markets, including China and Thailand (Nafees et al., 2022), where the consumption of such products is increasing faster than in Western markets (Wei et al., 2022).
Food markets are congested with multiples of cue attributes and consumers are highly heterogeneous with respect to their reaction toward these attributes (Hobbs, 2019; Collart and Canales, 2022). A study by Wang et al. (2022) disclosed that food safety risk occurs as a result of market failure caused by information lopsidedness and externalities, where market players conceal the full information of the product, meaning it cannot be observed and verified by the consumers during purchase. Another issue faced in food safety is distrust between consumers and suppliers (Wongprawmas and Canavari, 2017). Thus, in order to minimize these problems, more emphasis should be placed on product origin, certification, and traceability systems (Wu et al., 2017; Liu et al., 2020). Presently, the implementation of these traceability systems in the domestic markets in China and Thailand is still in its infancy (Wu et al., 2017). As such, traceability is deployed as a tool to help ensure food safety and quality as well as to boost consumer confidence (Aung and Chang, 2014; Yu et al., 2022). According to Anastasiadis et al. (2022), the end users of the tomato supply chain recognize the benefits of a traceability system for the product’s nutritional value, safety, and quality. It is, however, fundamental to ascertain whether consumers trust traceability and how much of a premium they are willing to pay for traceable products (Wongprawmas and Canavari, 2017; Hou et al., 2019; Liu et al., 2019). Several empirical studies have determined that consumers are WTP for food products with traceability information, and their findings reveal that consumers were willing to pay a premium price for quality food products (Cicia and Colantuoni, 2010; Jin et al., 2017; Hou et al., 2019; Xu et al., 2019). Certification is an important attribute that builds consumer trust, and prior studies have indicated consumers are willing to pay an additional price for food with a certification label (Praneetvatakul et al., 2022; Liu et al., 2023). Organic certification is another factor that affects Chinese food choice, possibly due to heightened concerns over the frequent use of synthetic chemicals, artificial additives, and growth stimulants in food production (McCarthy et al., 2016). The perceived health benefits of organic food have significantly increased Thai consumers’ WTP for this attribute (Praneetvatakul et al., 2022).
In China, branding is sometimes confused with the store image. For example, supermarkets usually carry selected brands of fresh pork, and brand awareness of pork was found to be positively related to store image (Grunert et al., 2015; Xu et al., 2018; Zheng et al., 2022). A study by Demont and Rutsaert (2017) showed that women from West African countries were willing to pay an average price premium of 5 cents per kilogram for branded rice. Furthermore, Thai consumers were found to be willing to pay more for food products with private brand labels (Wongprawmas and Canavari, 2017).
Despite the significant role of rice in food security and serving as a staple food for most Chinese and Thai consumers, there is a dearth of existing literature on consumers’ valuation of rice quality attributes (traceability, brand, and certification) in the two markets. Several of the reviewed studies showed that no international comparison has been made between these two countries using consumer trust as a food safety attribute. Furthermore, substantial numbers of studies have separately examined the impact of attributes such as method of production, country of origin, price, traceability, and certification on consumer preference and WTP. Thus, this study serves as an entry point to investigate the differences in the valuation of quality rice attributes, such as branding, certificate labels, and traceability information labels, between China and Thailand.
China and Thailand are interesting focus countries for the examination of consumer preferences for quality attributes since they are implementing more stringent food safety regulations in order to meet international standards (Wongprawmas and Canavari, 2017; Wu et al., 2017). Rice is the principal staple food consumed in China and Thailand. While China is the world’s largest importer of rice, Thailand is the third largest exporter of rice in the world. Both countries are located in the continent of Asia and are part of the world’s major rice belt because of the Trans-Pacific Partnership (TPP), which targets free trade among its members (Aoki et al., 2017). Additionally, there is a slight difference between the economies of the two countries; according to the International Monetary Fund 2020 estimates, the GDP per capita based on the purchasing power parity is US$21,361 in Thailand and US$20,924 in China. Furthermore, both countries have shown significant interest in green and organic rice as a result of rapid economic growth. Therefore, establishing a quality rice market in China and Thailand should be based on consumer preference and market demand. Therefore, the objective of this study is to estimate Chinese and Thai consumer preferences and willingness to pay for certifications (organic and green), traceability, and brand labels. Understanding Chinese and Thai consumer preferences and willingness to pay for different quality rice attributes will provide more literature and useful guidance to relevant stakeholders involved in the drafting and implementation of food quality and safety policies and will restore consumers’ trust and confidence. It will also assist the government in consolidating food safety and quality guidelines in both domestic and international markets.
2. Materials and methods
2.1. Data and study area
This survey was conducted in China and Thailand to compare consumer preferences and willingness to pay for selected rice attributes. Five provinces (Gansu, Jilin, Jiangxi, Hubei, and Guangdong) were purposively selected in China based on the production and consumption of rice (Yang et al., 2021). Based on rice consumption cuts across Thailand, all five regions (north, south, west, central, and east) including the capital city Bangkok were sampled for this survey. We applied face-to-face data collection procedures and the targeted sample unit was adult rice consumers of at least 18 years old. A total of 30 trained enumerators for both countries conducted the survey with 4,886 grocery consumers, applying randomized choice sets and attribute-level designs for each participant. The enumerators were sent to both small and large grocery stores, malls, and supermarkets in the five selected regions in China and Thailand using convenience sampling methods.
The survey used a structured questionnaire for data collection between June and August 2022 in the two countries. The questionnaire was developed in South China Agricultural University by staff and students and pre-tested in Guangzhou with a sample size of 30. The questionnaire consists of three sections: respondent demographic information, rice purchase information, and discrete choice experiment. The pre-testing was necessary because it helped us to remove all irrelevant questions and acted as the road map for the main survey. The interviewees were guided on-site to complete the questionnaire, and an honorarium equivalent to 1 USD was given to respondents in order to increase their enthusiasm and participation rate. In the main survey, we administered a total of 4,886 questionnaires to Chinese and Thai respondents, which consisted of 1,900 consumers in China and 2,986 in Thailand. The collected data were subjected to screening, which helped us to remove incomplete questionnaires and improve the quality of the data.
2.2. Theoretical models
To ascertain consumers’ preferences and willingness to pay for quality rice attributes, a discrete choice experiment (DCE) was employed in this study. DCE is a survey-based approach that designs questions to collect information about consumers’ preferences and willingness to pay for various attributes. Here, individuals are faced with several combinations of choice tasks with various characteristics and are required to make a decision between the choice tasks. DCEs are derived from the foundation of utility-maximizing behavior based on the random utility theory (Lancaster, 1966). This theory postulates that individuals are not interested in goods per se but in the function of the features shared by the products that give them utility. Similarly, an individual utility is not only gained from the product itself but on the product attributes.
DCE methods have been widely utilized in several domains including in the food, agriculture, transportation, health, and environmental sectors (Praneetvatakul et al., 2022; Wang et al., 2022; Qu et al., 2023; Zhang et al., 2023), to estimate consumers’ preferences and WTP for the various attributes. DCE is applicable to various choice scenarios where participants are given a variety of choice tasks and are required to select one from a set of options that vary based on their attribute levels. In each choice task, participants choose the option that maximizes their satisfaction or their preferences. DCE focuses on product attributes that allow consumers to choose goods from a choice set that maximize their perceived utility. Thus, this approach explores the way consumers value and make tradeoffs between the chosen attributes in the choice sets. The attributes selected should be accurate and competitive among the available alternatives. Consumers derive product utility from the product attributes instead of the products themselves; thus, the selection of the product is based on the consumer utility perception derived from the product attributes.
According to Wang et al. (2022), the foundation of DCE is the random utility theory (RUT) and the theory of product attribute values. The theory of product attribute value reveals that the satisfaction of individuals is derived from product attributes. RUT proposes that a person’s perception of the utility of goods or services is a function of the attributes of the product, and the selection of a product is based on the consumer’s perceived utility derived from the product attributes, subject to budget constraints (Lancaster, 1966). Hence, individuals rationally select products that maximize their utility. Following this logic, it was hypothesized that consumers would attribute optimal utility to a certain type of rice by making tradeoffs between the attributes of the rice and the rice itself. Based on this, the alternative products are assumed as a linear function of attributes. Following the RUT, person perceiving that alternative rice j yields the highest level of utility from a choice set C and other attributes can be expressed as:
Where is the utility perceived by consumer choosing alternative rice j in choice set C consisting of the deterministic component (observed) and stochastic component (unobserved) attributes by the researcher. is the coefficient vector. represents a normal linear function of the kth observed attributes (price, traceability information, brand, and green and organic certification) of rice j for decision maker n. is an unobserved random factor, which is assumed to be independent and identically distributed (iid) with Gumbel (type I extreme value) distribution and the estimator of scale ( ) is normalized to one (Leong and Hensher, 2015; Wang et al., 2018). Therefore, the indirect utility can be expressed as:
Where ASC is the alternative specific constant, which was set as the status quo, the intrinsic and property-independent preferences are analyzed. The ASC was designed as a dummy set, the constant variable for alternative 1, alternative 2 to 1, and the opt-out to 0 (Wang et al., 2018; Zhang et al., 2022). Xnjk is the k attributes value of the choice j, while Zn is the socioeconomic features of the respondent n.
The probability of decision maker n having a preference for certified rice alternative j can be expressed as:
Where Gn = {g1, g2, … gG} is the choice sets faced by decision maker n. The probability of decision maker n selecting alternative j can be expressed by the multinomial logit model (MNL) as (Wang et al., 2018; Demitiry et al., 2022):
This study adopts a mixed logit model, which is a model used to overcome the limitations of conditional logit models. The conditional logit model assumes that all individuals share the same parameters for all attributes, which indicates that individuals have the same preferences for quality attributes. As we cannot assume that the preferences in both countries (China and Thailand) are homogenous, the mixed logit model relaxes the irrelevant alternatives (IIA) assumptions and assumes heterogeneous preferences for participants. The conditional logit model is also derived based on the independence of IIA assumption, which results from the assumption of independently distributed errors across alternatives. The mixed logit model (ML) allows the parameters of attributes to vary across populations and relaxes the IIA assumption (Leong and Hensher, 2015; Hensher et al., 2018).
Despite the straightforward of interpretation of the MNL (Hobbs, 2019; Demitiry et al., 2022), the assumptions of the MNL model violate the existing preference heterogeneity assumption; therefore, the estimated results would be biased (Hensher et al., 2018). It also opposes the assumptions on choice behaviors. However, this assumption can be relaxed in the mixed logit model (MXL) as decision makers’ preferences are heterogeneous across respondents (Hensher et al., 2018; Wang et al., 2018; Gonçalves et al., 2022). Furthermore, the MXL model does not require the independence of IIA assumption but accounts for unobserved heterogeneity. A mixed logit model was employed based on the heterogeneity of respondents’ preferences. The utility function of an MXL for decision maker n for the j option of certified rice can be expressed as:
Where is the parameter that varies by the random component as a result of preference heterogeneity across consumers. The probability of decision maker n selecting alternative j from choice set option C can be expressed in MXL as:
The study employed an MXL model to compute the main effects and interaction terms. The interaction terms evaluated whether there was any alteration in the preference among the respondents with regard to trust and socioeconomic factors (age and income). The interaction terms are fixed effect variables while the selected attributes are random coefficients. In the discrete choice experiment analysis, the following socioeconomic variables were coded as follows: age coded as 1 if a consumer was younger than 25 years old and 0 otherwise. The household income of a consumer is coded as INCOME, which equals 1 if the respondent’s monthly household income is within the range of 4,001–12,000 Yuan for Chinese consumers and 20,001–50,000 Baht for Thai respondents and 0 otherwise.
When the cost of 1 kg rice is selected as an attribute option, the willingness to pay can be computed by marginal rate of substitution. Therefore, the willingness to pay for certified rice attributes can be computed as follows:
2.3. Choice sets design
Rice was selected as a sample product for this investigation because it is the main staple food consumed by many households in China and Thailand. Lately, the consumption of conventional rice has dwindled, while certified organic and green rice consumption has surged in these two countries (Panpluem et al., 2019; Yang et al., 2021; Gao et al., 2023; Wang, 2023). This study focuses on estimating consumer preferences and willingness to pay for rice with different attributes and comparing the level of trust between the two countries.
In designing a choice experiment survey, the primary factor to be considered is the selection of reasonable attributes. Excess attributes lead to fatigue and cognitive burden for interviewees, while fewer features could lead to attributes that are unrepresentative of the product in question (Wang et al., 2018). Based on the empirical literature, the relevant attributes of certified rice considered in this study include brand, traceability information, and green and organic certification. The price attribute, which is a continuous variable, was incorporated in this study in order to measure the WTP for the aforementioned attributes (Wang et al., 2018; Bo and Yang, 2022; Kabir et al., 2023). Three levels for the price attribute were considered in this study. Since the study considered two sample countries, the prices were measured in their domestic currencies.
Brand label, traceability information, and green and organic certification were difficult to quantify. Traceability refers to the ability to follow the flow of a food product through various levels in the supply chain, including production, processing, and distribution (Hou et al., 2019). Currently, food quality and safety risks exist in all aspects of the entire supply chain (Aoki et al., 2017; Wu et al., 2017; Hou et al., 2019). In this study, traceability information has two levels (Yes and No). The rice certification labels issued by the government or domestic third parties ensure that the product meets the safety requirements.
In recent times, organic and green certification labels on products have been widely implemented in the food market. For instance, rice industries employed organic and green labels in their packaging to differentiate between organic and conventional rice. The organic and green certifications used in this research refer to rice that is free from any chemical substances and is safe. In this study, two levels were identified for both organic and green certifications.
Branding is a unique symbol that distinguishes products from competitors and transmits quality information to consumers. It is a vital component in individual purchasing decisions and extrinsic attributes that signal quality and enhance individual trust (Zheng et al., 2022). Hence, customers are willing to pay a premium price for a preferred food product (Yin et al., 2019; Zheng et al., 2022). The implementation of brand labels in rice marketing can influence rice producers to improve and maximize product quality. Therefore, it is necessary to incorporate and promote branding information in order to increase sales and the consumption of rice. In this article, three brand levels were identified based on empirical literature (Cao et al., 2017; Wang et al., 2022): brand of product (BRPRO), brand of origin (BRORI), and brand distribution company (BRDIS). Brand origin refers to a label that shows information about where the rice is produced, brand of product refers to information about the rice, and brand distributor company is the label that shows information about the company that transports and distributes the rice. All these attributes and their respective levels are presented in Table 1.
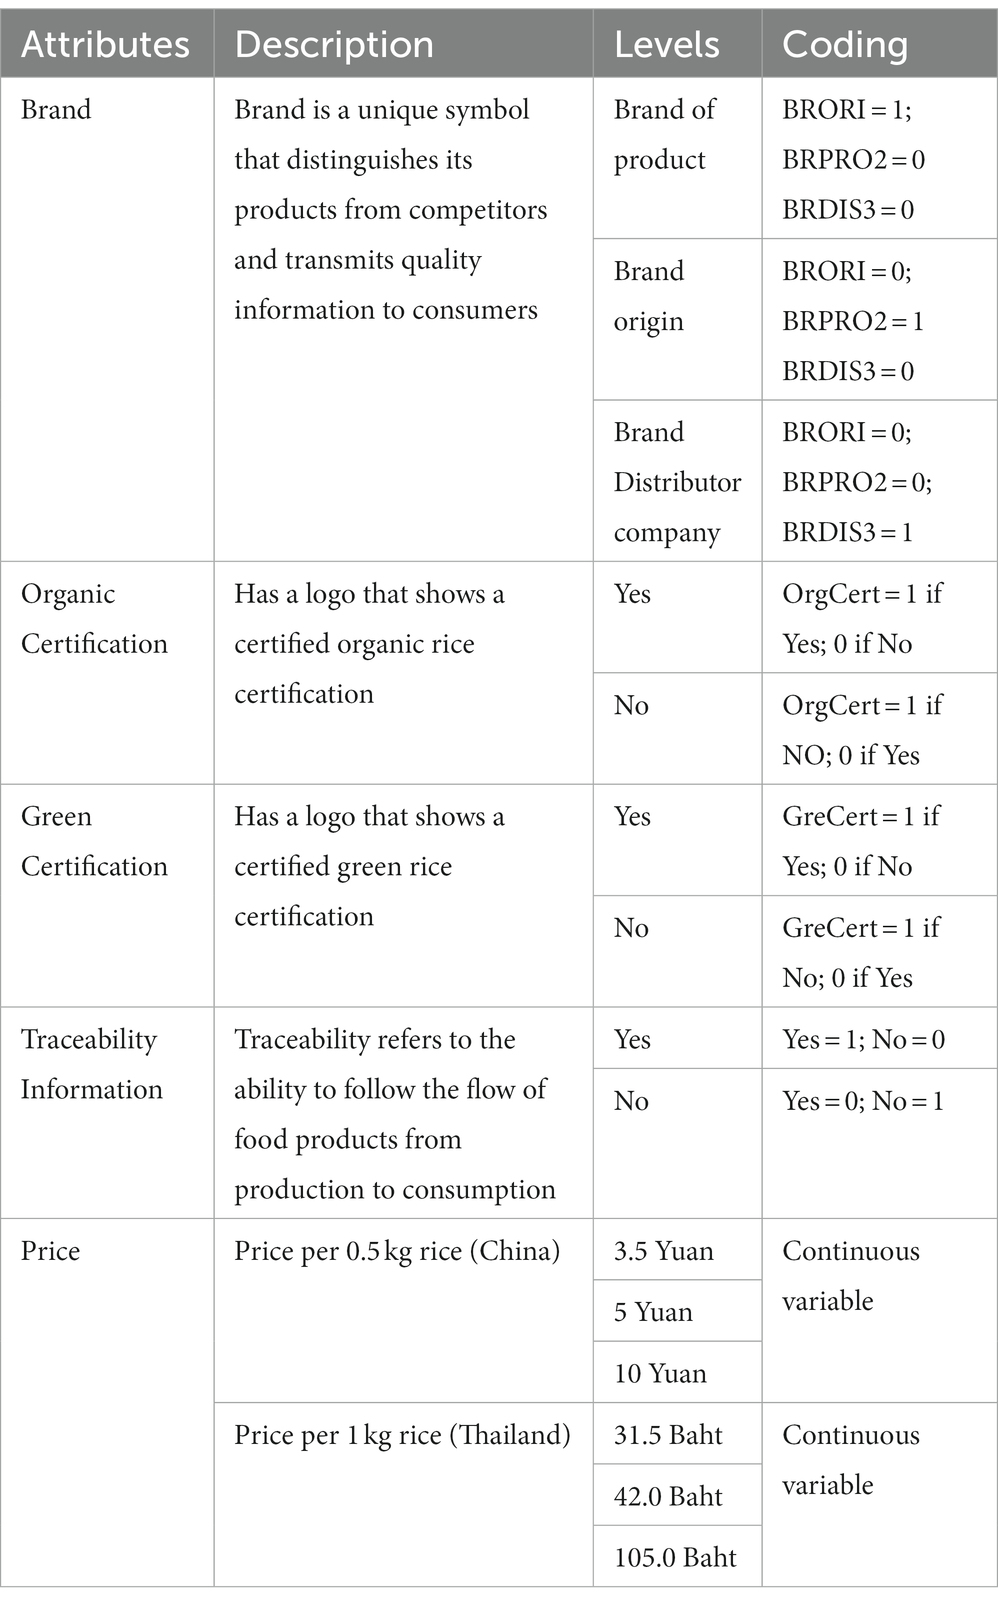
Table 1. Selected attributes and levels.
2.4. Experiment design
After identifying the attributes and their levels, a full factorial design was employed to determine the choice set. In our study, five attributes were identified, three attributes were at two levels, and two attributes were at three levels. Hence, the full factorial design showed that (3 × 3 × 2 × 2 × 2)2 = 5,184 combinations of different choice sets were generated, making it impracticable to administer all the choice sets to one interviewee. This quantum of choice sets would lead to respondent fatigue, reduced respondent efficiency, and huge costs (Zheng et al., 2022). With regard to these lapses, D-efficiency was employed to obtain 24 choice sets using STATA 17. The 24 generated choice sets were subdivided into six versions of the questionnaire. This helps to minimize cost, participant response burden, and fatigue and improve efficiency (Wang et al., 2022). Each choice set consists of three alternatives, Options A, B, and C. Options A and B have some rice attributes with different levels, while option C is an opt-out choice. Table 2 illustrates a choice set.
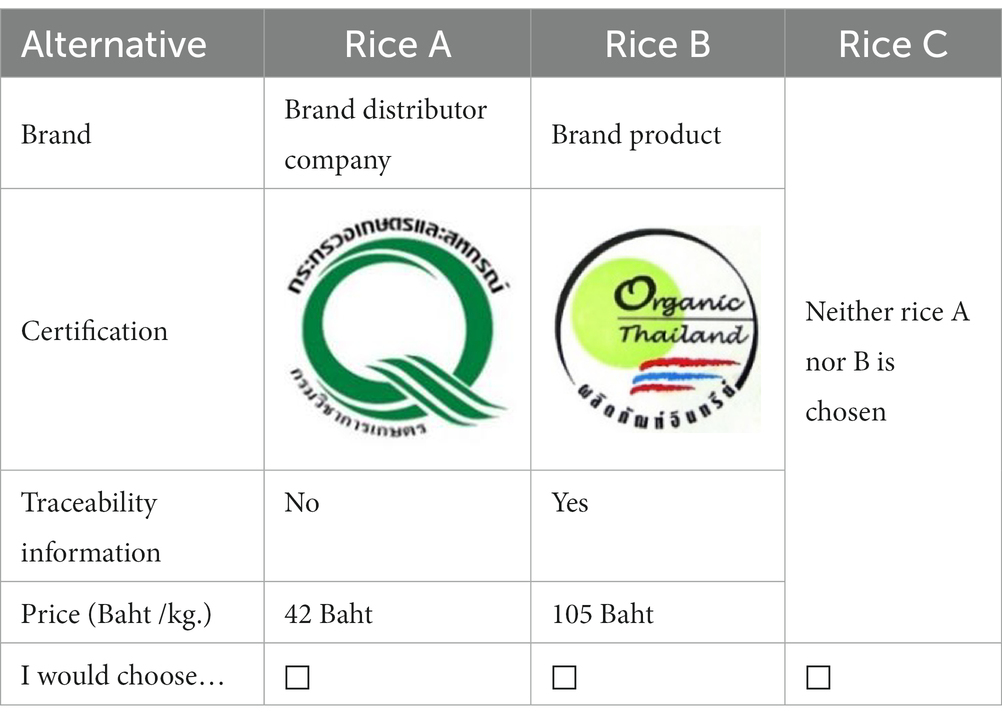
Table 2. Sample of choice set.
2.5. Socioeconomic characteristics of respondents
After the completion of designing the six choice sets, the interviewees were asked to answer the following questions with regard to their age, educational level, gender, monthly household income, and marital status. Table 3 depicts the socioeconomic characteristics of the respondents in the two sampled markets (China and Thailand). Women accounted for 58.7 and 66.9% of the respondents in China and Thailand, respectively. Our finding is in line with Aoki et al. (2017) and Wang et al. (2018), who reported that women are more likely to buy food than their men because food preparation is mostly done by women. In terms of age distribution, the majority of the Chinese interviewees (37.2%) were in the 16–25 years age group, and 29.9% were in the 36–65 years age group. Similarly, 61.8% of the Thai respondents were in the 36–65 years age group, and 24.2% were in the 26–35 years age group. This implies that Chinese consumers who participate in the purchase of certified rice are likely to be younger than their Thai counterparts. With regards to marital status, more than half of the sample population were married, with more married respondents in Thailand than in China. With respect to educational attainment, both countries had similar percentages of interviewees with an undergraduate degree, followed by high school/vocational education; however, there were slight differences in the other categories. Of the Chinese participants, 18.4% had attended junior college and 16.2% had attended High school, while 32.8% of Thai respondents had attended both High school and Junior college. The findings of our study reveal that 29.5% of Chinese respondents had a monthly household income between 4,001 and 8,000 Yuan, followed by 8,001–12,000 yuan, whereas 40.8% of Thai consumers had a monthly household income between 40,001 and 50,000 Baht, and 30.6% had a monthly household income of 20,001–40,000 Baht. The income of both countries were converted to United States dollars and hence the average monthly income in China is about 50% higher than that of Thailand. According to the National Statistics Office (NSO, 2021), the average monthly income per household in Thailand is 27,352 THB (US$877.64) and 9,611.7 Chinese Yuan (US$1,393) in China. Our findings conform with national statistics reports, showing that Chinese respondents are more affluent than Thai respondents based on their rapid economic growth.
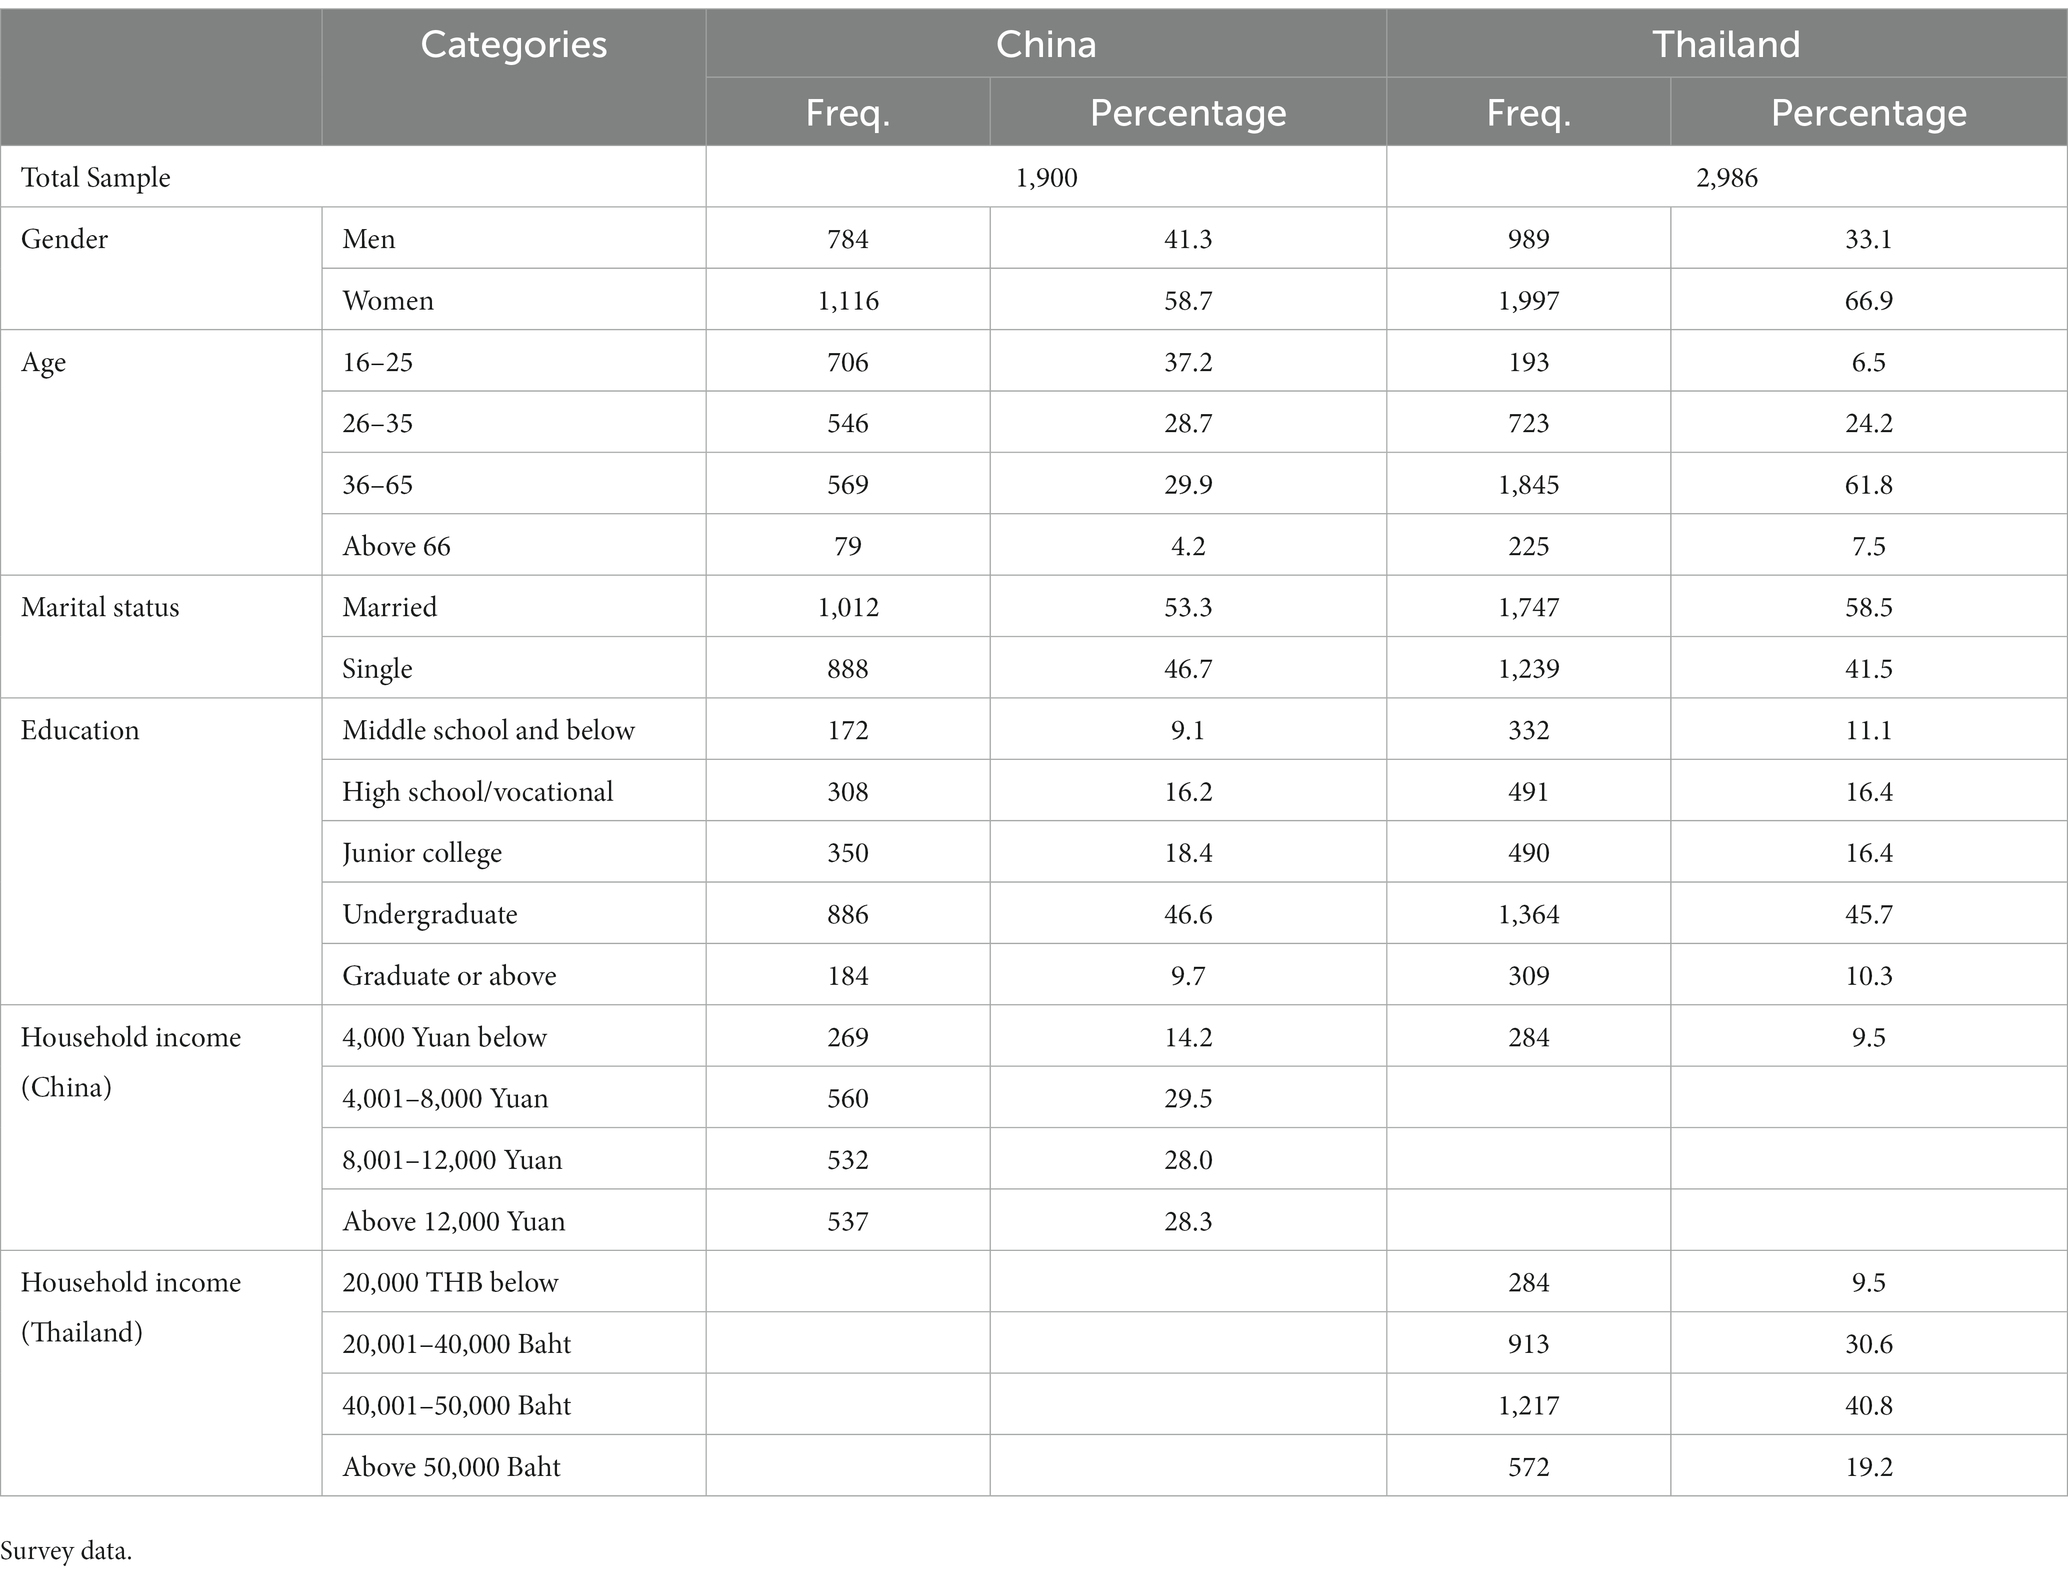
Table 3. Socioeconomic characteristics of respondents.
3. Results
3.1. Respondents cognition
Table 4 illustrates the experiences of Chinese and Thai consumers in purchasing rice. The survey results revealed that 38.2 and 55.6% of Chinese and Thai respondents, respectively, purchased conventional rice once per month. With regards to green rice purchased, approximately 58.8% of Chinese consumers had purchased certified rice with a green logo at least once per month and 23.8% had purchased it six times per month, which was the highest frequency. However, 41.2% had never purchased green rice. Similarly, 47.8% of Thai consumers had purchased certified rice with a green logo, while 52.2% had never purchased green rice. The purchasing channels of rice are the inlets used most by the respondents. In China, approximately 45.1, 33.2, and 18.6% used convenience stores as their main inlet channel for conventional, green, and organic rice purchase, respectively. In the same vein, 34.1, 38.4, and 34.5% of Thai customers used convenience stores as their main inlet channel for conventional, green, and organic rice purchases, respectively.
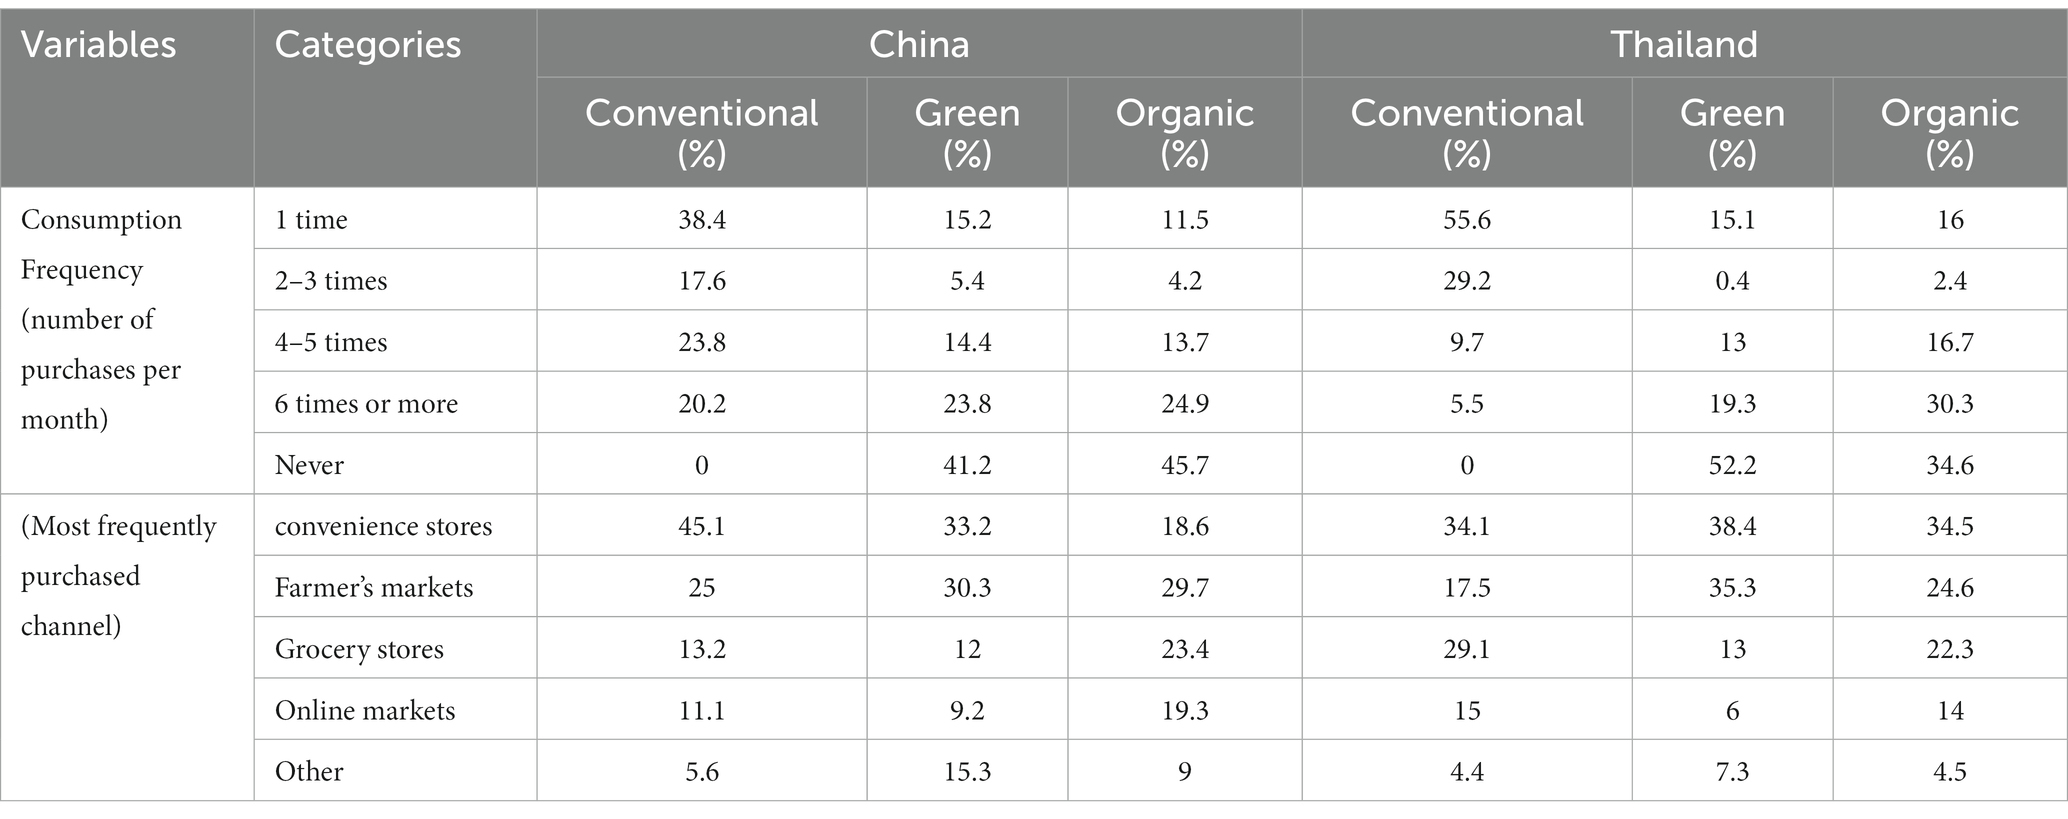
Table 4. Respondents’ experiences in purchasing green and organic rice in China and Thailand.
Trust is one of the key elements that influences consumer preference and has a direct relationship with WTP (Zheng et al., 2022). For instance, customers with low trust are connected to lower ratings of labels, leading to a decrease in purchase intention. In this study, we employed two kinds of labels based on the study of Wu et al. (2017), Zheng et al. (2022). We incorporated trust variables as an interaction term in organic and green certification labels. These variables were measured using a five-point Likert scale, with 1 representing “strongly disagree” and 5 representing “strongly agree.” In this study, seven items were adopted to measure each construct, and the detailed results of the means of various levels are presented in Table 5. From the results, Chinese consumers showed the highest trust in the “quality and safety of certified green rice,” with an average value of 3.50, while Thai consumers aligned most with the statement that “green farmers will follow the corresponding production requirements and standards,” with a value of 3.51. However, regarding the organic certification label, both Chinese and Thai consumers showed the highest trust in the quality and safety of organic certified rice, with an average value of 3.59 and 3.79, respectively.
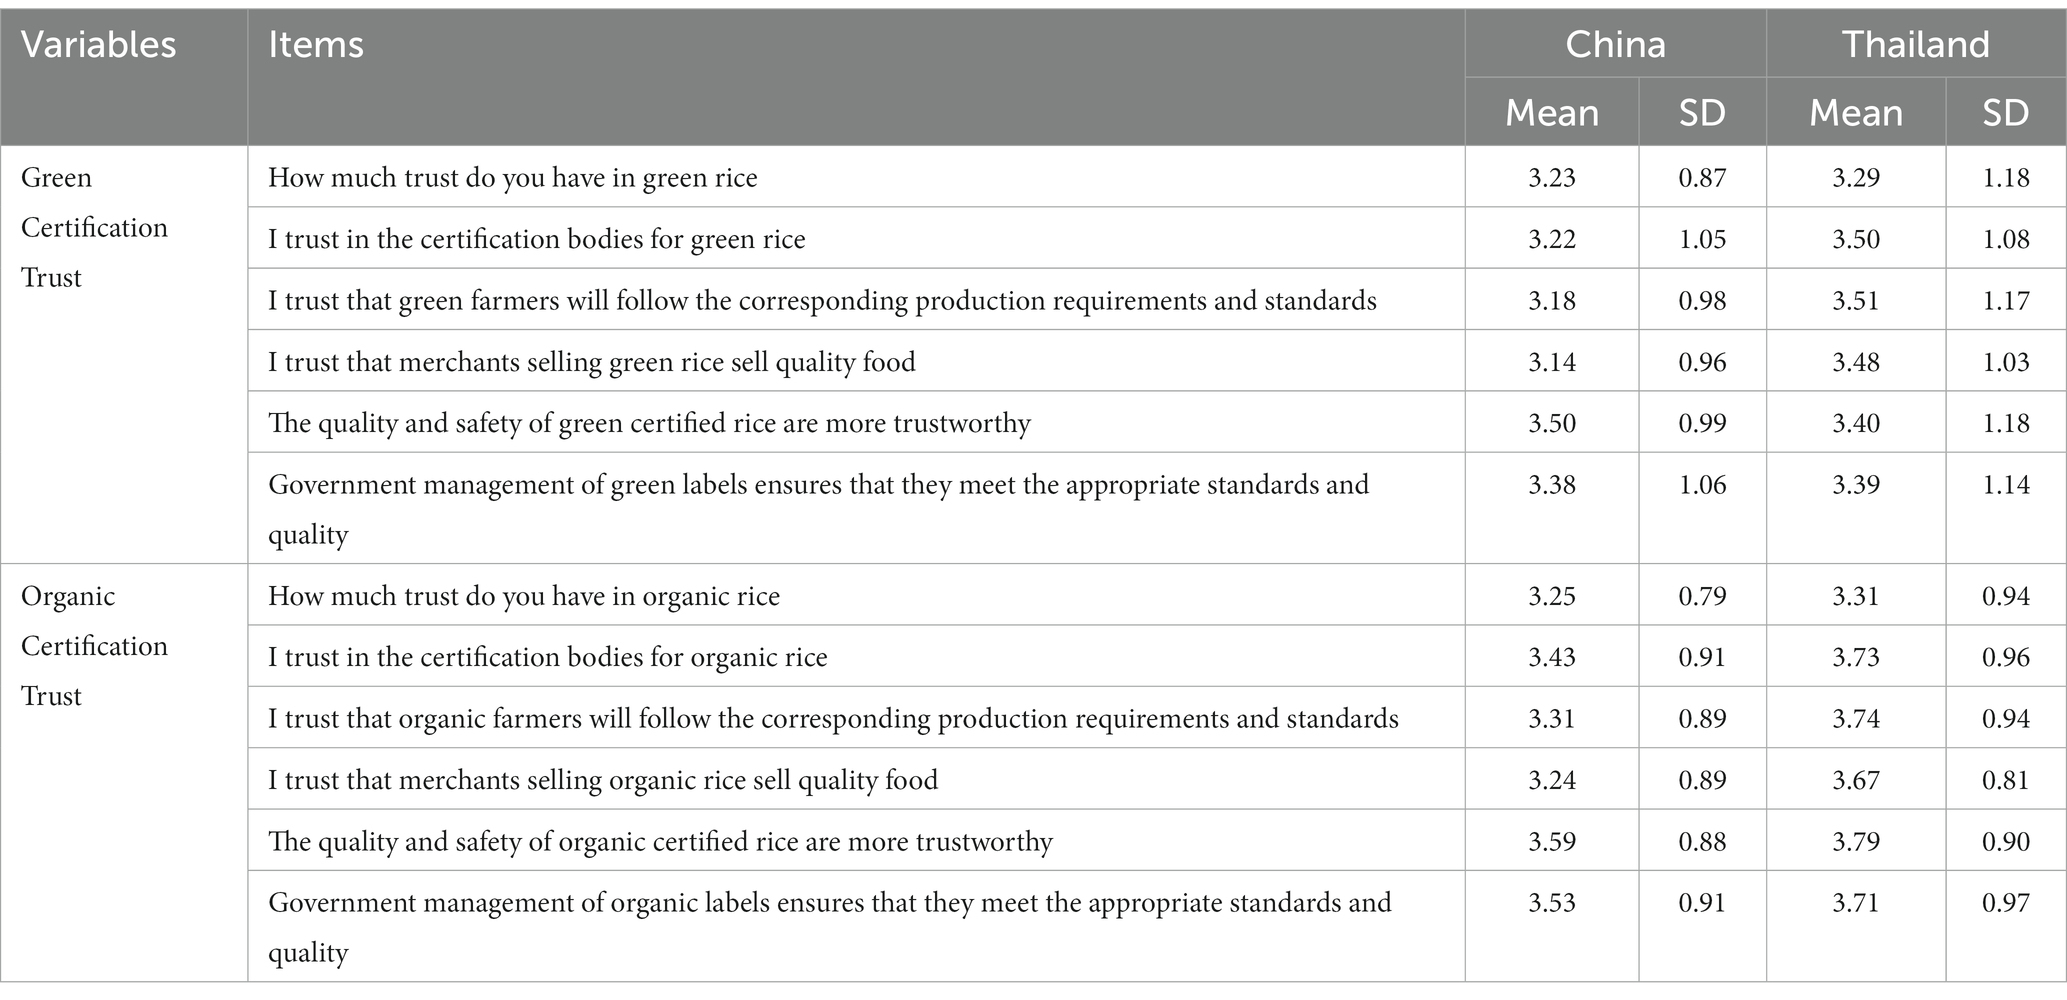
Table 5. Characteristics of Chinese and Thai consumer trust in organic and green certification.
The study also probed into consumer environmental awareness and concerns (CEAC), adopting a scale of environmental consciousness (Aoki and Akai, 2013; Aoki et al., 2017). This scale was used to examine Chinese and Thai consumers’ environmental awareness and concerns in purchasing organic and green rice. The selected consumer CEAC scale consists of 11 items adopted from Aoki and Akai (2013), Aoki et al. (2017). These items were measured using a five-point Likert scale range, with 1 representing strongly disagree and 5 representing strongly agree. The results relating to CEAC green and organic rice purchase in China and Thailand are illustrated in Table 6. It was observed that the Cronbach’s alpha was greater than 0.9 in both sample countries, showing the validity and reliability of the items used. This implies that the CEAC scale has considerable validity for expressing respondents’ environmental awareness and concerns in organic and green food purchase. The mean scores for most of the items in China were less than in Thailand, which indicates that Thai people pay more attention to environmental attributes than Chinese people. Our findings are in line with Aoki et al. (2017), who presented similar results between Thailand and Japan.
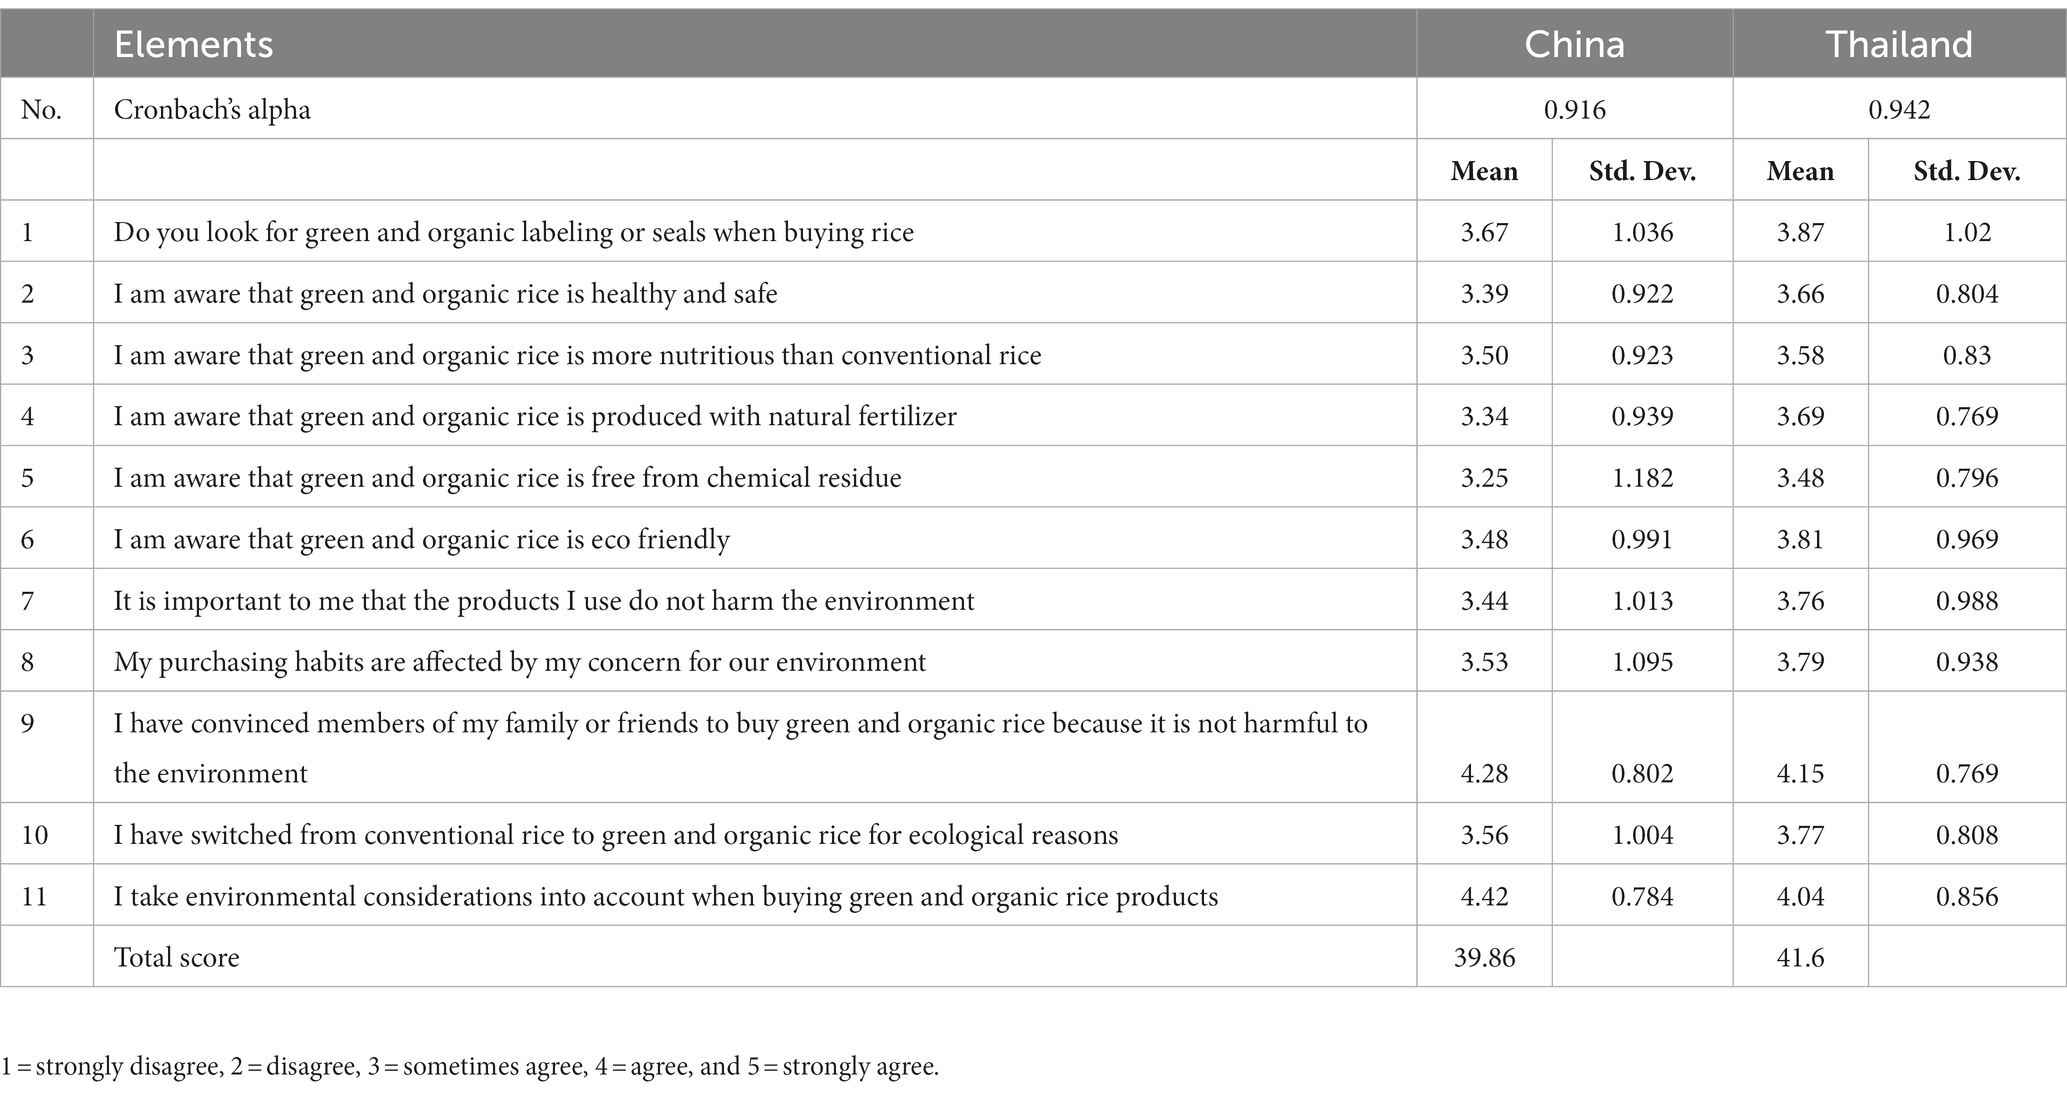
Table 6. Consumers’ environmental awareness and concerns in green and organic rice purchase.
3.2. Results of the main effect using mixed logit
In our study, six different types of outcomes were estimated. Firstly, we computed the main effect model without any interaction terms. In the second stage, we incorporated the interaction terms between the attributes themselves and in estimating the main effect model. The third stage incorporated the trust variable in computing the main effect model alongside the interaction term between the variables and the trust. In the fourth phase, we also computed the main effect with interaction terms between the variables and socioeconomic factors. The final phase was to estimate the total WTP for each of the attributes.
3.2.1. Main effect model without any interaction
Table 7 presents the main effect model without any interaction using a mixed logit model. The outcome of the log-likelihood test rejects the null hypothesis of estimated similarity between the sampled markets at a 1% significance level. Furthermore, the heterogeneity of the samples from the two countries led us to separate the model; therefore, two models were estimated separately for each sampled country. The log-likelihood estimate of the mixed logit model for the main effect was −9,816.15 and −9,473.95 for China and Thailand, respectively. The chi-square statistics were 1134.2 and 2170.96, with their associated p-values being 0.000 and 0.000 for the China and Thailand models, respectively, providing the joint effect of the attributes in the function on the consumers’ perceived utility. This implies that the model specifications are generally a good fit and are significant. The estimation outcomes in the mixed logit models are interpreted as follows: a positive sign indicates that consumers favor the attribute, whereas a negative sign indicates that they do not favor the attribute. Following this logic, to interpret our results, all attributes had significant coefficients in both countries except brand of origin, which was insignificant in the Chinese sample. The alternative specific constant (ASC) variable is the reference variable compared with opt-out. The ASC is positively and negatively significant at the 1% level for Chinese and Thai samples, respectively, indicating that choosing “neither A nor B” has a positive and negative impact on Chinese and Thai respondents’ perceived utility when compared with the combination of certified rice attributes presented in this study. Our findings indicate that the green certification coefficient (1.750) was significantly higher than the organic certification coefficient (1.500) and both were positively significant in the Chinese sample. This implies that Chinese consumers have a similar preference for both green and organic certifications. However, Chinese consumer preferences for green certification were higher than organic certification due to the stringent method of production in China that has led to a high price of organic food products, thereby leading to the prevalence of green food consumption, which is priced lower. Furthermore, consumers recognize that the standards of green food production are less stringent than those of organic food, leading to an increase in green food consumption. Our study is in line with Yin et al. (2010), who revealed that Chinese consumers have less trust in organic food products, which gave way to an increase in preferences for green food in our study.
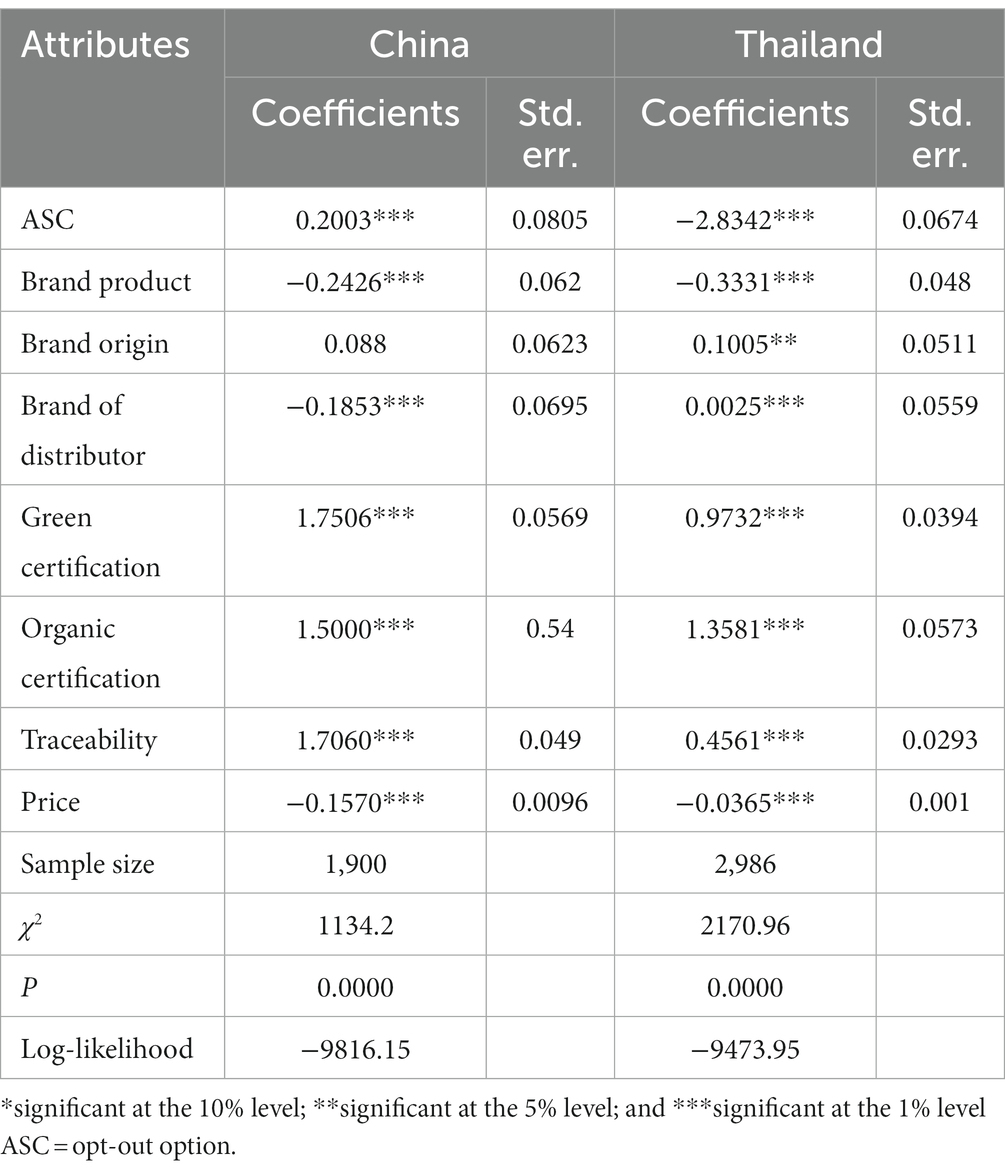
Table 7. Estimate of mixed logit model main effects without any interaction.
In contrast, the organic certification coefficient (1.358) was significantly higher than the green certification coefficient (0.973) in the Thailand model. The two certifications (organic and green) are significantly positive at the 1% level, indicating that consumers hold a positive preference for these two labels. This implies that Thai respondents perceived that organic food is healthier than green food, and Thai consumers are more aware of organic food products than green food products. Furthermore, the amount of synthetic chemicals used in green food production has reduced consumer preference for green food, which has led to a preference for organic food. Our study findings are in line with (Jeephet et al., 2016; Pinichka et al., 2019).
The next attributes are brand of product (−0.243) and brand distribution company (−0.185), which are negatively significant at the 1% level, suggesting that Chinese consumers hold a negative preference for these two labels. Conversely, brand of product (−0.333) is negatively significant at the 1% level, whereas brand origin (0.101) and brand distribution company (0.003) are positively significant at the 5 and 1% levels, respectively. This indicates that Thai consumers have a positive preference for brand origin and brand distribution company and a negative preference for brand of product. Traceability information is positively significant and received a positive preference from respondents in China (1.706) and Thailand (0.456). The negative sign of the price parameter in both countries is significant at the 1% level, indicating that consumers prefer lower-priced products and that their utility decreases as a result of price.
3.2.2. Main effect model with interaction
In this section, we present the results of the interaction term of the attributes, which are shown in Table 8. The log-likelihood values of the mixed logit model for the interaction terms are −9473.95 and −1380.53, and the chi-square statistics are 1597.57 and 2010.63, with their associated p-values being 0.000 and 0.000 for the China and Thailand models, respectively. This indicates that the regression results are generally significant. The interaction model of the main effect among the variables, the variables “GC × TRAC” and “OC × TRAC are significantly positive at the 1% level in the Chinese sample, indicating that there is a substitution effect among the traceability, green certification, and organic certification labels. The variables “GC × BP” and “OC × BP” are significantly positive at the 1 and 10% levels, respectively, while “OC × BDC” is significantly positive at the 5% level in the Chinese model. Similarly, in the Thai model, the interaction variables “GC × BDC,” “GC × TRAC,” “OC × TRAC,” “GC × BDC,” and “OC × BDC” are significantly positive at the 1% level. When the organic or green label is attached to brand and traceability, consumers’ perceived utility of certified rice is enhanced.
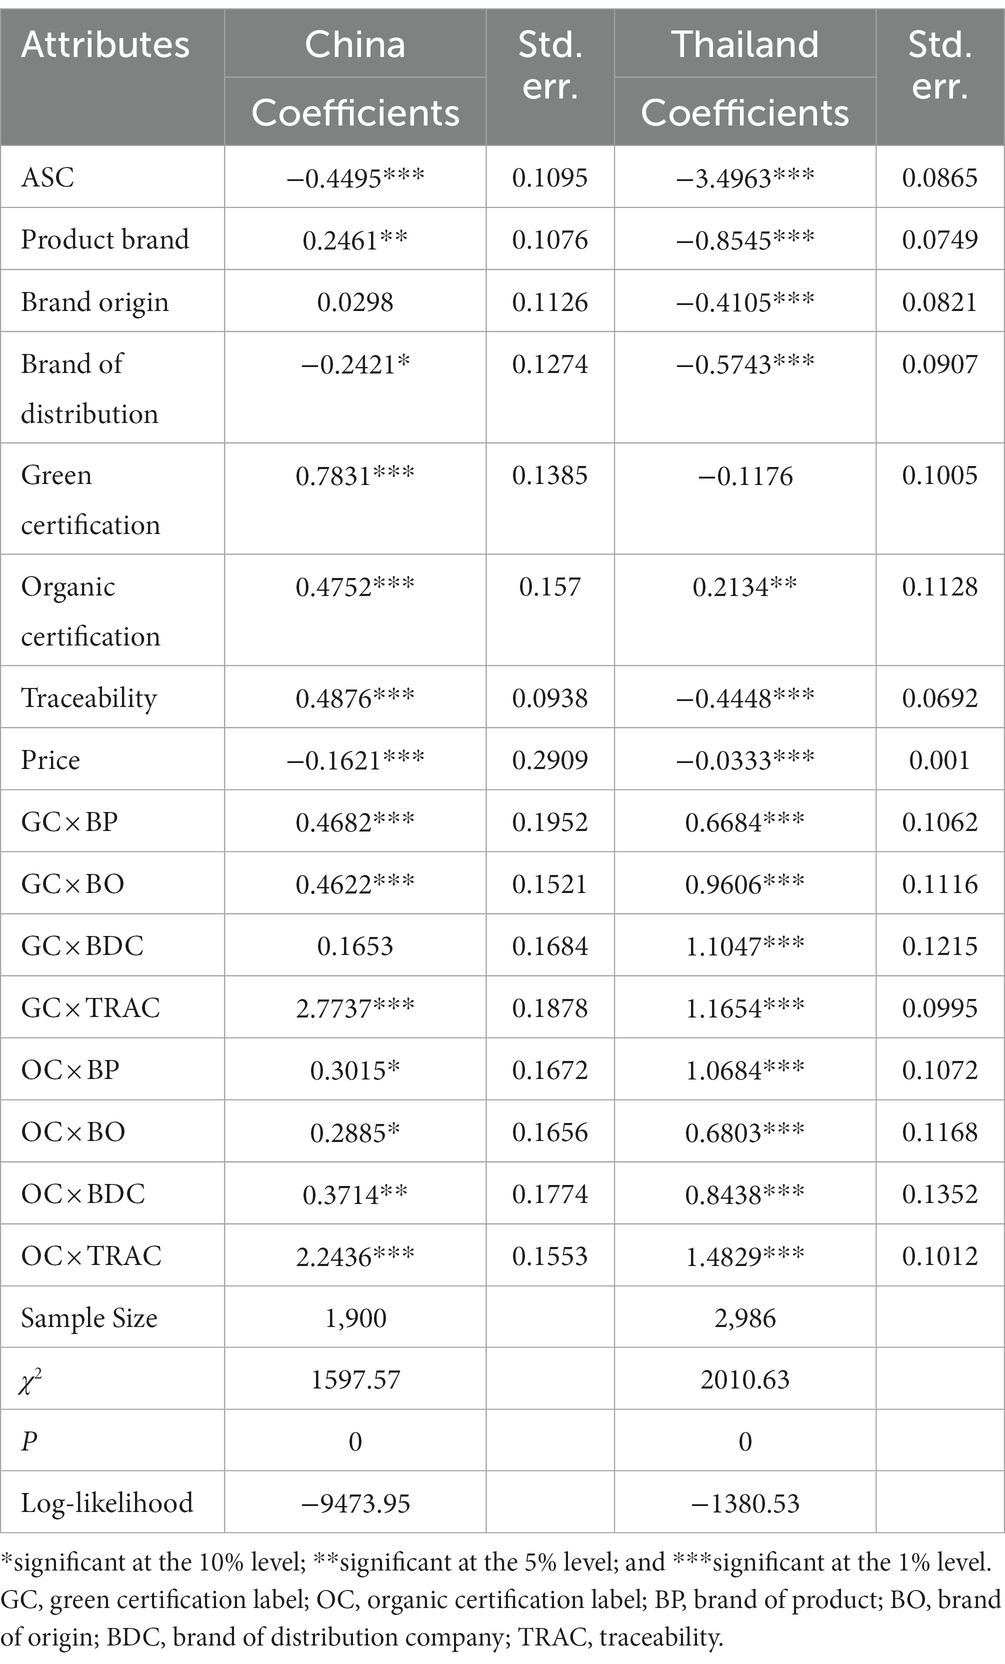
Table 8. Estimate of mixed logit model main effects with interaction between variables.
3.2.3. Main effect model with interaction in trust
Here, we investigate the combined impact of consumer trust in green and organic certification labels with the selected attributes. We computed the average of the items in Table 5 for each construct and used them for conjoint regression. The result of the interaction terms between trust and the selected variables are presented in Table 9. In China, the interaction term between GTRUST × GC is significantly positive at the 10% level. Furthermore, OTRUST × OC is significantly positive at the 1% level for the Chinese model. This implies that most Chinese respondents trust the organic certification body and invariably prefer it. The interaction term between OTRUST × TRAC is significantly positive at the 10% level, suggesting that those who trust organic certification will also prefer traceability. With regards to Thailand’s results, the interaction terms between GTRUST × BP, GTRUST × BO, and GTRUST × BDC were significantly negative, at the 1% level, meaning that more customers show negative trust in brand labels. Additionally, GTRUST × GC and GTRUST × OC are significantly negative and positive at the 1% level, respectively. Contrary to this, the interaction term between organic trust and brand label for Thai consumers is significantly positive at the 1% level for all three levels, meaning that more customers showed positive trust in brand labels. Furthermore, OTRUST × OC for Thai consumers is significantly positive at the 1% level, meaning that more customers showed positive trust in organic certification.
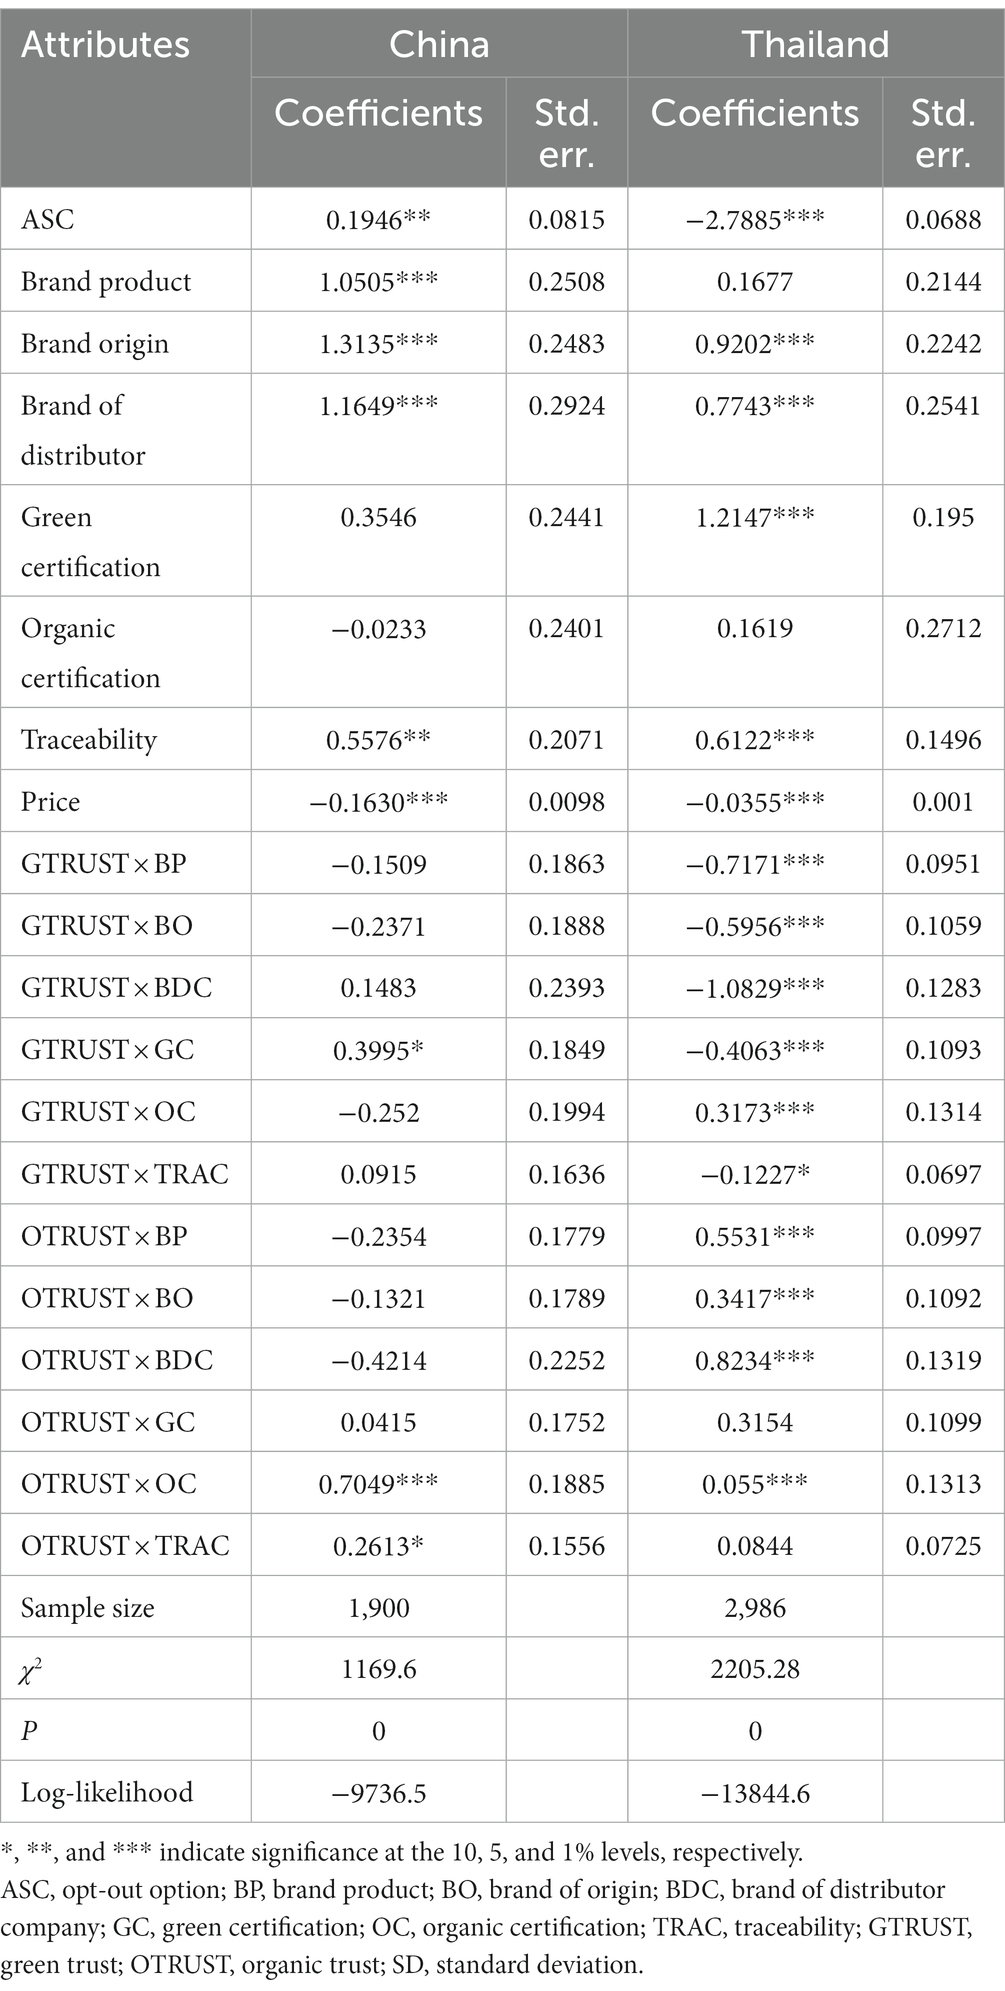
Table 9. Estimate of mixed logit model main effects with interaction in consumer trust.
3.2.4. Main effect interaction with socioeconomic variables
In Table 10, the interaction terms of the studied attributes with age in the Chinese model showed a negative significant coefficient for the BP × AGE (−0.2889) at the 5% level. Also, BDC × AGE with a coefficient of 0.5553 and TRAC × AGE (0.4646) were significantly positive at the 1% levels. This implies that Chinese consumers had stronger preferences for BDC and TRA. Furthermore, both BP × INC (−0.2716) and BO × INC (−0.2045) had negative significant coefficients, suggesting that low-income consumers were more likely to prefer conventional rice due to the additional cost attached to the alternatives. With regards to the Thai model, the interaction term of OC × AGE (−0.0823) is negatively significant at the 5% level. BP × INC (−0.059) and BDC × INC (−0.408) were significantly negative at the 5 and 1% levels. This indicates that low-income Thai respondents were more likely to prefer conventional rice due to the additional cost attached to the alternatives. Again, both OC × INC (0.3065) and TRAC × INC (0.1246) had positive significant coefficients at the 10% level, suggesting that low-income consumers were more likely to prefer conventional rice due to the additional cost attached to the alternatives.
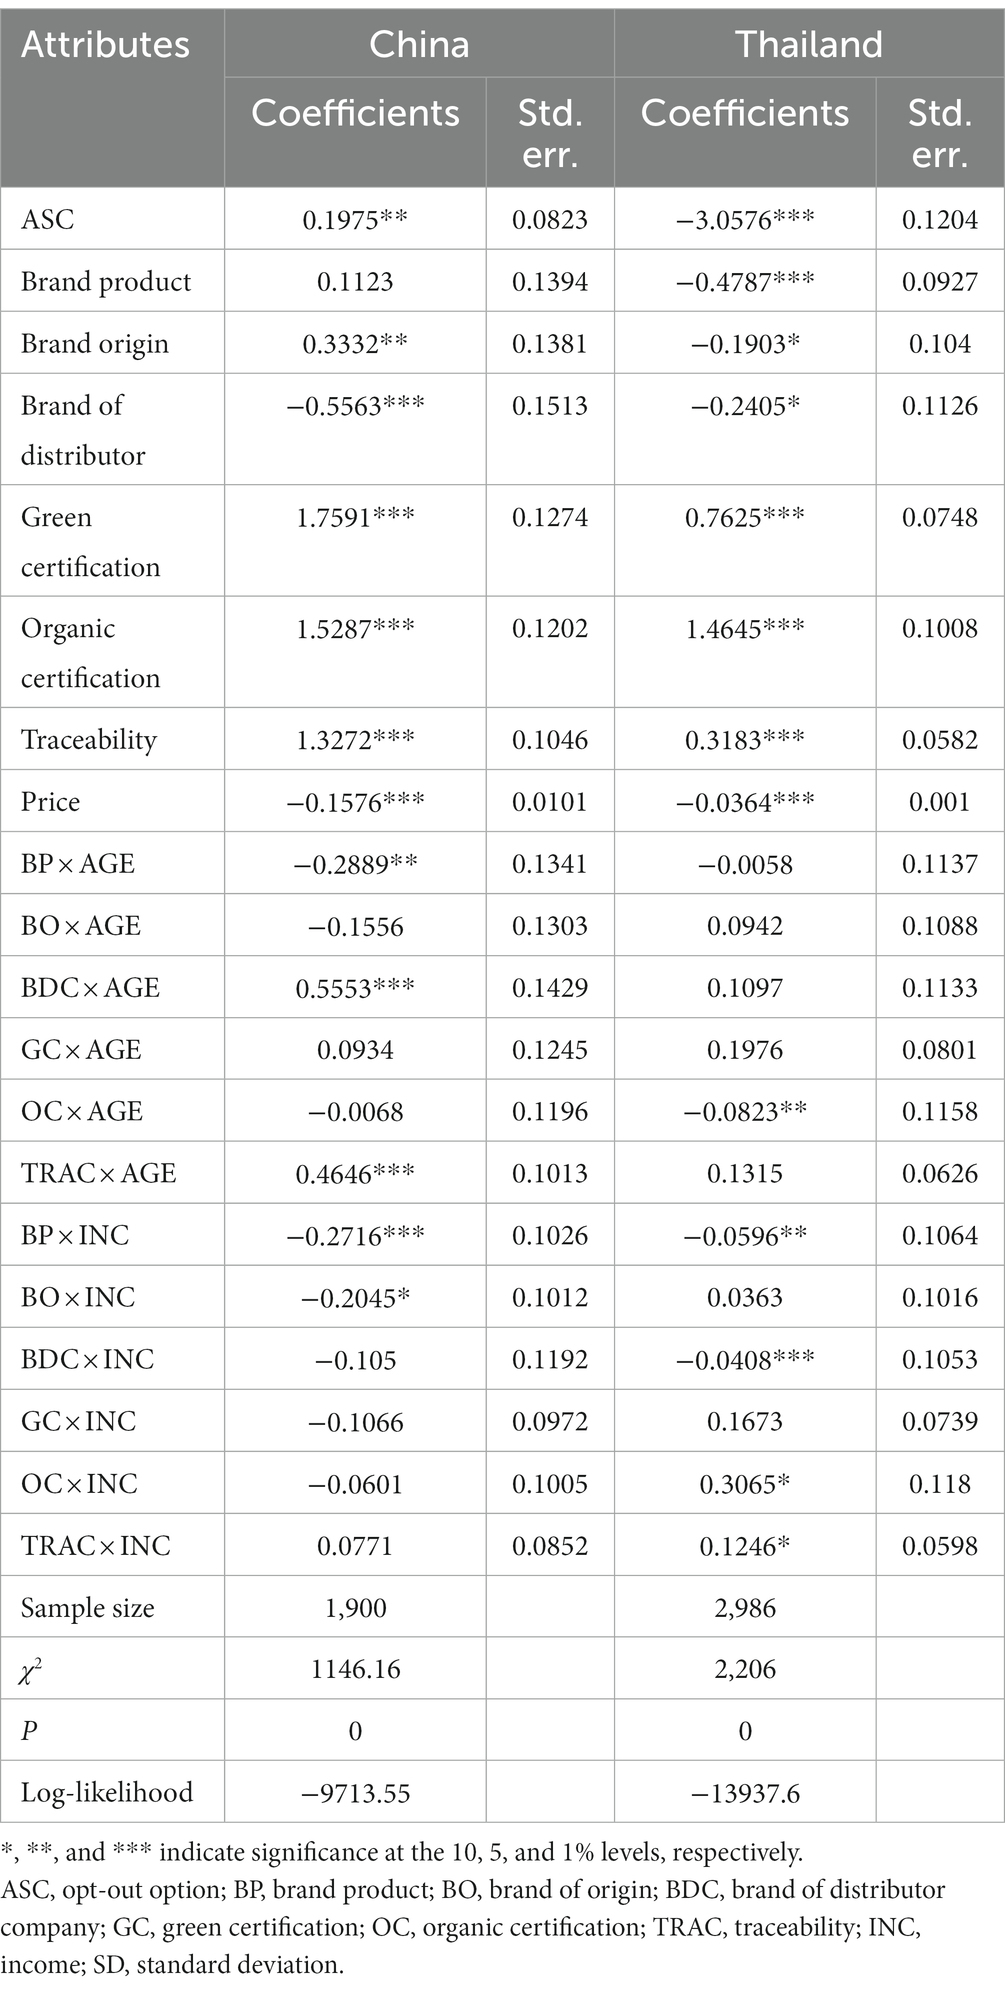
Table 10. Heterogeneity analysis considering socio-demographics.
3.2.5. Willingness to pay
In our study, we employed Hierarchical Bayes (HB) techniques to estimate consumers’ WTP. The estimations were computed using the Bayes mixed logit WTP technique in STATA 17. We adopted this method based on a previous empirical study by Zheng et al. (2022). The estimated WTP values can be described as the highest price an individual is willing to pay to obtain a specified attribute level. Understanding consumers’ WTP can help managers to determine individuals’ ability to pay and set prices at a level that allows them to maximize profits and consumer satisfaction. It can also help to predict market response to price fluctuations and may be useful for demand function modeling. Chinese and Thai WTP for the selected attributes (brand, traceability, and green and organic certification) are presented in Table 11. All results were statistically significant at the 1% level in both countries. The results show that Chinese consumers have a strong positive preference for rice with green and organic certification labels, for which they were willing to pay a premium of 9.47 and 8.45 Yuan, respectively. Chinese respondents also revealed a positive preference for traceability information, with a mean WTP of 9.37 Yuan per kg.
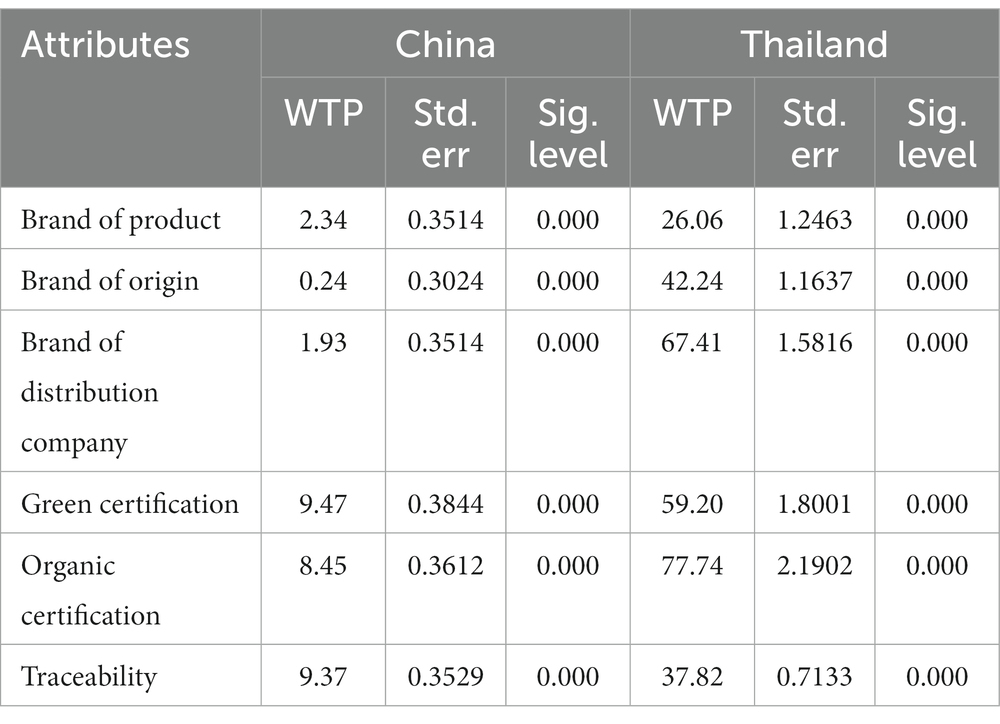
Table 11. Willingness to pay for the certified rice attributes.
Similarly, Thai consumers exhibited a strong positive preference for rice with green and organic certification labels, for which they were willing to pay a premium of 59.20 and 77.74 Baht, respectively. For traceability information, Thai respondents revealed a positive preference with a mean WTP of 37.82 Baht per kg.
4. Discussion and conclusions
Recently, there has been a significant surge in Chinese and Thai consumer preference for higher quality and safer food due to health concerns (Nuttavuthisit and Thøgersen, 2017; Niu et al., 2023). The mixed logit model estimation revealed that consumers from both countries preferred green and organic certified labels. However, Chinese consumers’ preference for green and organic certified rice was found to outweigh that of Thai consumers. With respect to brand labels and green and organic certification, Thai consumers were found to be willing to pay more than Chinese consumers. Conversely, Chinese consumers were willing to pay more for rice with a traceability label than Thai consumers. The reason is that the more information included on the rice packaging, the higher the likelihood of Chinese consumers trusting the safety of the rice. Our study affirms that traceability, brand, and green and organic certification labels boost Chinese and Thai consumers’ perceived utility. The findings agree with those of existing empirical studies (Sriwaranun et al., 2015; Anastasiadis et al., 2022; Zheng et al., 2022), showing that consumers in both countries have positive preferences for green and organic food.
Furthermore, as society changes, consumer environmental and health consciousness toward purchasing green and organic products is increasing. Hou et al. (2019) highlighted that traceability information on food products positively influences consumer preferences and their WTP. Our findings follow a similar trend to those of Hou et al. (2019). As Chinese and Thai consumer income increases, demand for quality- and safety-related food information, particularly credence attributes, becomes necessary to facilitate a clearer understanding of the quality and value of certified green and organic rice. Brand, traceability, and green and organic certification labels have heterogeneous consumers in both countries and, therefore, should be considered in building markets. Additional information about product characteristics is attached by merchants to further enhance its utility and value and maximize profits.
In addition, this study also found a significant positive interaction effect between organic trust and organic certification labels in both countries, which revealed strong complementary effects. The findings demonstrate that brand, certification, and traceability are influential attributes in rice trading. Our study is the first to compare Chinese and Thai consumers’ preferences and WTP for the selected attributes. The findings are significant within the Trans-Pacific Partnership, considering the production and consumption of rice in both nations. Finally, for certified rice consumption in Thailand, income interacting with organic certification and traceability was observed to be influential in Thai consumer preferences; this attribute becomes more vital for the consumption of certified rice, which enhances the Thai economy.
Our study was limited to four attributes; therefore, future investigations should incorporate other relevant attributes (health and culture, etc.) and employ the random parametric logit model (RPL) to compare preferences in other countries.
Data availability statement
The raw data supporting the conclusions of this article will be made available by the authors, without undue reservation.
Ethics statement
Ethical review and approval was not required for the study on human participants in accordance with the local legislation and institutional requirements. Written informed consent from the participants was not required to participate in this study in accordance with the national legislation and the institutional requirements.
Author contributions
AB: Conceptualization, Data curation, Formal analysis, Funding acquisition, Investigation, Methodology, Validation, Writing – original draft, Writing – review & editing. BJ: Conceptualization, Funding acquisition, Methodology, Project administration, Supervision, Writing – review & editing. FK: Conceptualization, Formal analysis, Investigation, Methodology, Validation, Writing – original draft. TS: Data curation, Investigation, Methodology, Validation, Writing – original draft, Writing – review & editing.
Funding
The author(s) declare financial support was received for the research, authorship, and/or publication of this article. Research on the dual driving mechanism of policy and market for agricultural product regional brand building in the process of regional integration, Supported by China’s National Social Science Fund (20BGL296).
Acknowledgments
The authors thank the people whose comments helped to improve this article.
Conflict of interest
The authors declare that the research was conducted in the absence of any commercial or financial relationships that could be construed as a potential conflict of interest.
Publisher’s note
All claims expressed in this article are solely those of the authors and do not necessarily represent those of their affiliated organizations, or those of the publisher, the editors and the reviewers. Any product that may be evaluated in this article, or claim that may be made by its manufacturer, is not guaranteed or endorsed by the publisher.
References
Abdullah, A. B., Ito, S., and Adhana, K. (2006). Estimate of rice consumption in Asian countries and the world towards 2050. Proceedings for Workshop and Conference on Rice in the World at Stake, 2, 28–43.
Anastasiadis, F., Manikas, I., Apostolidou, I., and Wahbeh, S. (2022). The role of traceability in end-to-end circular agri-food supply chains. Ind. Mark. Manag. 104, 196–211. doi: 10.1016/j.indmarman.2022.04.021
Aoki, K., and Akai, K. (2013). Do consumers select food products based on carbon dioxide emissions?, Advances in production management systems. Competitive manufacturing for innovative products and services. Berlin, Heidelberg: Springer. 398, 345–352. doi: 10.1007/978-3-642-40361-3_44
Aoki, K., Akai, K., and Ujiie, K. (2017). A choice experiment to compare preferences for rice in Thailand and Japan: the impact of origin, sustainability, and taste. Food Qual. Prefer. 56, 274–284. doi: 10.1016/j.foodqual.2016.03.001
Aung, M. M., and Chang, Y. S. (2014). Traceability in a food supply chain: safety and quality perspectives. Food Control 39, 172–184. doi: 10.1016/j.foodcont.2013.11.007
Bo, L., and Yang, X. (2022). Is consumers’ willingness to pay premium for agricultural brand labels sustainable?: evidence from Chinese consumers’ random n-price auction experiment. Bri. Food J. 124, 359–374. doi: 10.1108/BFJ-01-2022-0077
Cao, F.-B., Lai, Z.-D., Yang, J.-Z., and Destech Publicat, I (2017). Research on the cultivation of tea high-end brand prototype based on origin marketing. Proceedings of the 3rd international conference on E-commerce and contemporary economic development (ECED), Xi’an, China, 8–9 April, 387–390
Chitov, T. (2020). Understanding production and safety situations of organic food in Thailand. Regulatory Issues in Organic Food Safety in the Asia Pacific, Singapore: Springer. 171–198. doi: 10.1007/978-981-15-3580-2_11
Cicia, G., and Colantuoni, F. (2010). Willingness to pay for traceable meat attributes: a meta-analysis. Int. J. Food Syst. Dyn 1, 252–263. doi: 10.18461/ijfsd.v1i3.138
Collart, A. J., and Canales, E. (2022). How might broad adoption of blockchain-based traceability impact the US fresh produce supply chain? Appl. Econ. Perspect. Policy 44, 219–236. doi: 10.1002/aepp.13134
Demitiry, M., Higgins, C. D., Páez, A., and Miller, E. J. (2022). Accessibility to primary care physicians: comparing floating catchments with a utility-based approach. J. Transp. Geogr. 101:103356. doi: 10.1016/j.jtrangeo.2022.103356
Demont, M., and Rutsaert, P. (2017). Restructuring the Vietnamese rice sector: towards increasing sustainability. Sustainability 9:325. doi: 10.3390/su9020325
Fang, H., Zhang, Q., Zhang, S., Zhang, T., Pan, F., Cui, Y., et al. (2021). Risk-benefit assessment of consumption of rice for adult men in China. Front. Nutr. 8:694370. doi: 10.3389/fnut.2021.694370
Food Agricultural Organization (2023), Available at: https://www.fao.org/3/x6905e/x6905e04.htm (Accessed 10 July 2023).
Gao, P., Wang, H., Sun, G., Xu, Q., Dou, Z., Dong, E., et al. (2023). Integrated energy and economic evaluation of the dominant organic rice production systems in Jiangsu province. China. Front. Plant Sci. 14:1107880. doi: 10.3389/fpls.2023.1107880
Gonçalves, T., Lourenço-Gomes, L., and Pinto, L. M. C. (2022). The role of attribute non-attendance on consumer decision-making: theoretical insights and empirical evidence. Econ. Anal. Policy. 76, 788–805. doi: 10.1016/j.eap.2022.09.017
Grunert, K. G., Loebnitz, N., and Zhou, Y. (2015). Supermarket literacy and use of branding in China: The case of fresh meat Naples, Italy: AgEcon Search.
He, X. Q., Qiao, Y. H., Liang, L., Knudsen, M. T., and Martin, F. (2018). Environmental life cycle assessment of long-term organic rice production in subtropical. China. J. Clean. Prod. 176, 880–888. doi: 10.1016/j.jclepro.2017.12.045
Hensher, D. A., Balbontin, C., and Collins, A. T. (2018). Heterogeneity in decision processes: embedding extremeness aversion, risk attitude and perceptual conditioning in multiple process rules choice making. Transp. Res. A 111, 316–325. doi: 10.1016/j.tra.2018.03.026
Hobbs, J. E. (2019). Heterogeneous consumers and differentiated food markets: implications for quality signaling in food supply chains. Can. J. Agric. Econ. 67, 237–249. doi: 10.1111/cjag.12202
Hou, B., Wu, L., Chen, X., Zhu, D., Ying, R., and Tsai, F. S. (2019). Consumers’ willingness to pay for foods with traceability information: ex-ante quality assurance or ex-post traceability? Sustainability 11:1464. doi: 10.3390/su11051464
Jeephet, K., Kamsa-Ard, S., Bhudhisawasdi, V., Kamsa-Ard, S., Luvira, V., and Luvira, V. (2016). Association between pesticide use and cholangiocarcinoma. Asian Pac. J. Cancer Prev. 17, 3979–3982.
Jin, S., Zhang, Y., and Xu, Y. (2017). Amount of information and the willingness of consumers to pay for food traceability in China. Food Control 77, 163–170. doi: 10.1016/j.foodcont.2017.02.012
Jiumpanyarach, W. (2018). The impact of social trends: teenagers’ attitudes for organic food market in Thailand. Int. J. Soc. Econ. 45, 682–699. doi: 10.1108/IJSE-01-2017-0004
Kabir, A. F., Alam, M. J., Begum, I. A., and McKenzie, A. M. (2023). Consumers’ interest and willingness to pay for traceable vegetables-an empirical evidence from Bangladesh. Future Foods 7:100214. doi: 10.1016/j.fufo.2022.100214
Kantamaturapoj, K., and Marshall, A. (2020). Providing organic food to urban consumers: case studies of supermarkets in Bangkok and metropolitan area. Heliyon 6:e04003. doi: 10.1016/j.heliyon.2020.e04003
Lancaster, K. J. A. (1966). New approach to consumer theory. J. Political Econ. 74, 132–157. doi: 10.1086/259131
Lang, M., and Rodrigues, A. C. (2022). A comparison of organic-certified versus non-certified natural foods: perceptions and motives and their influence on purchase behaviors. Appetite 168:105698. doi: 10.1016/j.appet.2021.105698
Leong, W., and Hensher, D. A. (2015). Contrasts of relative advantage maximisation with random utility maximisation and regret minimisation. J. Transp. Econ. Policy 49, 167–186. Available at: https://www.jstor.org/stable/jtranseconpoli.49.1.0167.
Liu, R., Gao, Z., Nayga, R. M., Snell, H. A., and Ma, H. (2019). Consumers’ valuation for food traceability in China: does trust matter? Food Policy 88:101768. doi: 10.1016/j.foodpol.2019.101768
Liu, R., Gao, Z., Snell, H. A., and Ma, H. (2020). Food safety concerns and consumer preferences for food safety attributes: evidence from China. Food Control 112:107157. doi: 10.1016/j.foodcont.2020.107157
Liu, R., Wang, J., Liang, J., Ma, H., and Liang, F. (2023). Perceived value of information attributes: accounting for consumer heterogeneous preference and valuation for traceable agri-food. Foods 12:711. doi: 10.3390/foods12040711
McCarthy, B., Liu, H. B., and Chen, T. (2016). Innovations in the agro-food system: adoption of certified organic food and green food by Chinese consumers. Br. Food J. 118, 1334–1349. doi: 10.1108/BFJ-10-2015-0375
Molinillo, S., Vidal-Branco, M., and Japutra, A. (2020). Understanding the drivers of organic foods purchasing of millennials: evidence from Brazil and Spain. J. Retail. Consum. Serv. 52:101926. doi: 10.1016/j.jretconser.2019.101926
Nafees, L., Hyatt, E. M., Garber, L. L., Das, N., and Boya, Ü. Ö. (2022). Motivations to buy organic food in emerging markets: an exploratory study of urban Indian millennials. Food Qual. Prefer. 96:104375. doi: 10.1016/j.foodqual.2021.104375
Niu, X. T., Yang, Y. C., and Wang, Y. C. (2023). Does the economic growth improve public health? A cross-regional heterogeneous study in China. Front. Public Health 9:704155. doi: 10.3389/fpubh.2021.704155
Nuttavuthisit, K., and Thøgersen, J. (2017). The importance of consumer trust for the emergence of a market for green products: the case of organic food. J. Bus. Ethics 140, 323–337. doi: 10.1007/s10551-015-2690-5
OECD/Food and Agriculture Organization of the United Nations (2014). OECD-FAO Agricultural Outlook 2014, OECD Publishing. doi: 10.1787/agr_outlook-2014-en
Panpluem, N., Mustafa, A., Huang, X., Wang, S., and Yin, C. (2019). Measuring the technical efficiency of certified organic rice producing farms in Yasothon province: Northeast Thailand. Sustainability 11:6974. doi: 10.3390/su11246974
Pinichka, C., Issarapan, P., Siriwong, W., Kongtip, P., Chotpantarat, S., and Bundhamcharoen, K. (2019). Application of geographic information systems and remote sensing for pesticide exposure and health risk assessment in Thailand. OSIR J. 12, 75–83. doi: 10.59096/osir.v12i3.262934
Praneetvatakul, S., Vijitsrikamol, K., and Schreinemachers, P. (2022). Ecolabeling to improve product quality and reduce environmental impact: a choice experiment with vegetable farmers in Thailand. Front. Sustain. Food Syst. 5:704233. doi: 10.3389/fsufs.2021.704233
Qu, R., Chen, J., Li, W., Jin, S., Jones, G. D., and Frewer, L. J. (2023). Consumers’ preferences for apple production attributes: results of a choice experiment. Foods 12:1917. doi: 10.3390/foods12091917
Sriwaranun, Y., Gan, C., Lee, M., and Cohen, D. A. (2015). Consumers’ willingness to pay for organic products in Thailand. Int. J. Soc. Econ. 42, 480–510. doi: 10.1108/IJSE-09-2013-0204
Sutton, M. A., Bleeker, A., Howard, C. M., Erisman, J. W., Abrol, Y. P., Bekunda, M., et al. (2013). Our nutrient world. The challenge to produce more food & energy with less pollution Centre for Ecology & Hydrology.
Tandon, A., Dhir, A., Kaur, P., Kushwah, S., and Salo, J. (2020). Why do people buy organic food? The moderating role of environmental concerns and trust. J. Retail. Consum. Serv. 57:102247. doi: 10.1016/j.jretconser.2020.102247
Wang, E. (2023). Revitalize traditional agriculture: Chinese consumer perception and preference of “modern” organic and sustainable traditional rice products. Sustainability 15:9206. doi: 10.3390/su15129206
Wang, J., Ge, J., and Ma, Y. (2018). Urban Chinese consumers’ willingness to pay for pork with certified labels: a discrete choice experiment. Sustainability 10:603. doi: 10.3390/su10030603
Wang, J., Xue, Y., and Liu, T. (2023). Consumer motivation for organic food consumption: health consciousness or herd mentality. Front. Public Health 10:1042535. doi: 10.3389/fpubh.2022.1042535
Wang, J., Zhou, L., Ni, Z., Wu, W., Liu, G., Fu, W., et al. (2022). Consumer preference and willingness to pay for low-residue vegetables: evidence from discrete choice experiments in China. Front. Sustain. Food Syst. 6:639. doi: 10.3389/fsufs.2022.1019372
Wei, S., Liu, F., She, S., and Wu, R. (2022). Values, motives, and organic food consumption in China: a moderating role of perceived uncertainty. Front. Psychol. 13:736168. doi: 10.3389/fpsyg.2022.736168
Wongprawmas, R., and Canavari, M. (2017). Consumers’ willingness-to-pay for food safety labels in an emerging market: the case of fresh produce in Thailand. Food Policy 69, 25–34. doi: 10.1016/j.foodpol.2017.03.004
Wu, L., Gong, X., Qin, S., Chen, X., Zhu, D., Hu, W., et al. (2017). Consumer preferences for pork attributes related to traceability, information certification, and origin labeling: based on China's Jiangsu province. Agribusiness 33, 424–442. doi: 10.1002/agr.21509
Xu, P., Su, H., and Lone, T. (2018). Chinese consumers’ willingness to pay for rice. J. Agribusiness Dev. Emerg. Econ. 8, 256–269. doi: 10.1108/JADEE-11-2016-0077
Xu, L., Yang, X., Wu, L., Chen, X., Chen, L., and Tsai, F. S. (2019). Consumers’ willingness to pay for food with information on animal welfare, lean meat essence detection, and traceability. Int. J. Environ. Res. Public Health 16:3616. doi: 10.3390/ijerph16193616
Xu, J., Zhong, J., Zhang, B., and Li, X. (2021). Green labelled rice shows a higher nutritional and physiochemical quality than conventional rice in China. Foods 10:915. doi: 10.3390/foods10050915
Yan, D., Wu, S., Tang, Y., Zhu, J., Zhou, S., and Xu, Z. (2022). Arable land and water footprints for food consumption in China: from the perspective of urban and rural dietary change. Sci. Total Environ. 838:155749. doi: 10.1016/j.scitotenv.2022.155749
Yanakittkul, P., and Aungvaravong, C. (2020). A model of farmers intentions towards organic farming: a case study on rice farming in Thailand. Heliyon 6:e03039. doi: 10.1016/j.heliyon.2019.e03039
Yang, J., Wang, J., Xu, C., Liu, Y., Yin, Q., Wang, X., et al. (2021). Rice supply flows and their determinants in China. Resour. Conserv. Recycl. 174:105812. doi: 10.1016/j.resconrec.2021.105812
Yin, S., Han, F., Wang, Y., Hu, W., and Lv, S. (2019). Ethnocentrism, trust, and the willingness to pay of Chinese consumers for organic labels from different countries and certifiers. Food Qual. 2019, 1–13. doi: 10.1155/2019/8173808
Yin, S., Wu, L., Du, L., and Chen, M. (2010). Consumers’ purchase intension of organic food in China. J. Sci. Food Agric. 90, 1361–1367. doi: 10.1002/jsfa.3936
Yu, Z., Jung, D., Park, S., Hu, Y., Huang, K., Rasco, B. A., et al. (2022). Smart traceability for food safety. Crit. Rev. Food Sci. Nutr. 62, 905–916. doi: 10.1080/10408398.2020.1830262
Zhang, T., Hu, W., Zhu, Z., and Penn, J. (2023). Consumer preference for food products addressing multiple dimensions of poverty: evidence from China. Food Policy 115:102419. doi: 10.1016/j.foodpol.2023.102419
Zhang, J., Waldron, S., and Dong, X. (2022). Evidence from a choice experiment in consumer preference towards infant milk formula (IMF) in the context of dairy revitalization and COVID-19 pandemic. Foods 11:2689. doi: 10.3390/foods11172689
Keywords: preference, willingness to pay, certified rice, choice experiment, traceability
Citation: Boonkong A, Jiang B, Kassoh FS and Srisukwatanachai T (2023) Chinese and Thai consumers’ willingness to pay for quality rice attributes: a discrete choice experiment method. Front. Sustain. Food Syst. 7:1270331. doi: 10.3389/fsufs.2023.1270331
Edited by:
Amarnath Tripathi, Jaipuria Institute of Management, IndiaReviewed by:
Dipankar Das, Goa Institute of Management, IndiaBarun Kumar Thakur, Flame University, India
Copyright © 2023 Boonkong, Jiang, Kassoh and Srisukwatanachai. This is an open-access article distributed under the terms of the Creative Commons Attribution License (CC BY). The use, distribution or reproduction in other forums is permitted, provided the original author(s) and the copyright owner(s) are credited and that the original publication in this journal is cited, in accordance with accepted academic practice. No use, distribution or reproduction is permitted which does not comply with these terms.
*Correspondence: Baichen Jiang, YmFpY2hlbl9qaWFuZ0AxMjYuY29t