 Ren Hu
 Dakang Xiao1
 Xuexia Wang
95% of researchers rate our articles as excellent or good
Learn more about the work of our research integrity team to safeguard the quality of each article we publish.
Find out more
ORIGINAL RESEARCH article
Front. Sustain. Food Syst. , 25 August 2023
Sec. Crop Biology and Sustainability
Volume 7 - 2023 | https://doi.org/10.3389/fsufs.2023.1252324
This article is part of the Research Topic Innovative Solutions For Next-Generation Fertilizers View all 13 articles
Introduction: This study aimed to provide the theoretical basis for formulating scientific and reasonable on-farm nitrogen (N) management measures and efficient strategic fertilization to understand the effects of localized N supply (LNS) and N fertilizer variety coupling on N transport and soil N balance in rice fields.
Methods: A 2-year field experiment (2020 and 2021) was conducted in Jingzhou, Hubei Province, which included the following six treatments: no N application (CK), farmers' fertilizer practice (FFP), and four LNS treatments, including two N application methods including mechanical side-deep fertilization (M) and root-zone fertilization (R), two N fertilizer types with urea (U), and controlled-release urea (CRU).
Results: Compared with FFP, LNS increased the N apparent translocation level from stems, sheathes, and leaves (TNT) and N uptake by 10.70–50.59% and 11.28–29.71%, respectively. In LNS, the levels of nitrite reductase (NR), glutamine synthetase (GS), and glutamate synthase (GOGAT) under R increased by 13.81, 9.56, and 15.59%, respectively, compared with those under M, resulting in a significant increase in TNT by 8.58% and N uptake by 1.87%. Regarding the N fertilizer type, CRU significantly increased chlorophyll content by 7.27%, superoxide dismutase (SOD) and catalase (CAT) by 14.78 and 29.95% (p < 0.05), and NR, GS, and GOGAT by 44.41, 16.12, and 28.41% (p < 0.05), respectively, compared with that in U, which contributed to N absorption and transport. Moreover, CRUR significantly decreased N apparent loss by 50.04% compared with CRUM (p < 0.05).
Discussion: Considering the risk of soil N leaching and environmental protection, R should be selected as the recommended fertilization method. The combination of CRU and R is the most effective fertilization approach.
Rice is the number one food crop in China, with production reaching 146.10 million tons in 2022 and making China the top rice producer worldwide (Food Agriculture Organization of the United Nations, 2022). This record rice production in China is because of the massive application of nitrogen (N) fertilizers (Grafton et al., 2015). Relevant studies showed that unreasonable N application methods and N fertilizer varieties reduced the efficiency of N fertilizers. Hence, a large amount of N fertilizers that were not absorbed by rice plants flowed into groundwater, significantly impacting the environment (Guo et al., 2017; Jiang et al., 2022). Therefore, improving N uptake and reducing N loss have become important in N fertilizer management.
Localized N supply (LNS) has been the most popular method of N application in recent years compared with the conventional broadcasting method. LNS effectively increases nutrient concentration in the rhizosphere, thereby promoting N absorption by the root system and reducing nutrient loss (Wu et al., 2022). LNS is mainly categorized into mechanical side deep fertilization (M) and root-zone fertilization (R). Zhu et al. (2019) reported that M promoted N uptake in rice by increasing soil ammonium–N concentration and further reducing N loss. Jiang et al. (2017) showed through a field micro-plot experiment that the vertical migration distance of fertilizer-released N under the M was 3–18 cm, while the vertical migration distance under R was 6–15 cm in the soil layer, and the ammonium N content under R was 8.3 times higher than that under M. This indicates that R had a tendency to increase the inorganic N content of the soil and reduce the inorganic N loss. In addition, the higher nutrient concentration could provide sufficient N to seedlings after regreening, promote tillering, reduce ammonia volatilization by 26–93% (Liu et al., 2015; Wu M. et al., 2017), and also reduce N oxide emissions (Yao et al., 2017; Gaihre et al., 2018). Moreover, both M and R can provide a stable supply of available soil N, which may regulate the N-assimilation ability of plants by affecting the activity of N metabolism enzymes (Hu et al., 2023). Therefore, which of these two types of N application is more beneficial to improve N-assimilation enzymes and soil N balance also needs to be further explored.
Urea (U) and controlled-release urea (CRU) are two of the most studied N fertilizers in China that play a vital role in improving rice production (Ye et al., 2013). U, the instant fertilizer used globally, releases all the N rapidly within 20 days of application into the soil (Campos et al., 2018), resulting in insufficient N supply at a later stage and seriously affecting rice growth (i.e., dry matter accumulation and N transfer) (Li et al., 2018). CRU is a new type of highly efficient and environmentally friendly fertilizer. It slows down the release rate of fertilizer nutrients in the soil to achieve the synchronization of fertilizer nutrient release time and intensity with crop nutrient demand (Zhang et al., 2018), thus reducing the volatilization, leaching, and denitrification losses of fertilizer nutrients in the soil and achieving high rice yield and efficiency (Tian et al., 2021; Jiang et al., 2022). Moreover, rice scavenges excess reactive oxygen species by increasing the activity of antioxidant enzymes such as superoxide dismutase (SOD) and catalase (CAT), while malondialdehyde (MDA) is a product of lipid peroxidation of cell membranes that directly affects rice growth (Liao et al., 2019). However, research on N fertilizer varieties has mostly focused on rice yield and N utilization. The effects of antioxidant enzymes and MDA content on N uptake and N transfer in rice need further clarification.
In this study, 2 years of field experiments were conducted to investigate the effects of the combined application of LNS with different N fertilizer varieties (U and CRU) on N uptake and transport by different organs and N balance in paddy soil. The aims were as follows: (1) to study the mechanism of promoting N uptake and transport of rice by comparing the enzymatic characteristics and photosynthetic properties under different N application treatments; (2) to find out the most suitable N fertilizer treatment for the environment through comparing the N balance in paddy soil; and (3) to provide a theoretical basis for the realization of light and simplified fertilization of rice in China in the future.
A 2-year field experiment was conducted in the Meteorological Bureau of Jingzhou City, Hubei Province, China, in 2020 and 2021. The study site was located in the Jianghan Plain (N 29° 26′-31° 37′, E 111° 14′-114° 36′), which is a humid subtropical monsoon climate zone suitable for rice cultivation (Zhou et al., 2022). The weather data were provided by the Jingzhou Weather Bureau in Hubei. In 2020/2021, the average temperature and total precipitation during the rice production season were 23.2/23.8°C and 2,130/1,385 mm, respectively (Figure 1). The region has been known for planting rice for years, and the soil is a silty medium loam developed from the deposition of inland and lacustrine sediments. The initial soil test results were as follows: pH, 7.9; soil bulk density, 1.4 g cm−3 in the 0–20 cm soil layer; organic carbon, 26.88 g kg−1; total N, 1.09 g kg−1; Olsen-P, 9.4 mg kg−1; and available K, 56.3 mg kg−1.
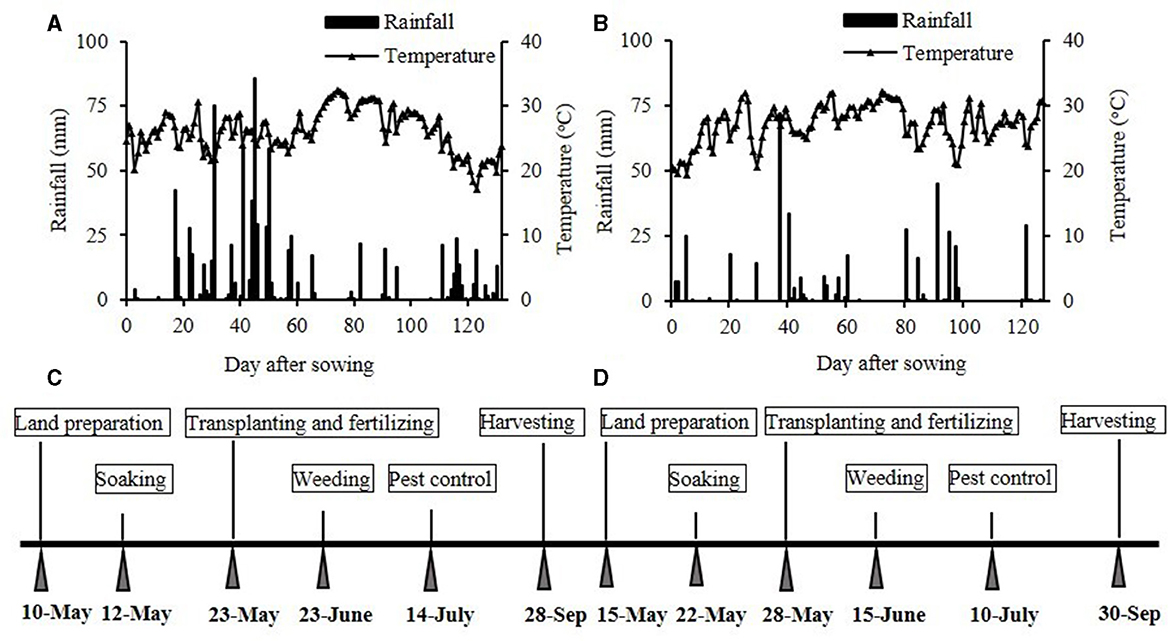
Figure 1. The rainfall and average temperatures in 2020 (A) and 2021 (B) and the rice management details in 2020 (C) and 2021 (D).
Yang LiangYou No. 6 was used as the test object in this study; the parental source of Yang LiangYou No. 6 is Guangzhan 63-4S (female) and Yangdao No. 6 (male), and the variety type is indica two-series hybrid rice. It is widely grown by local farmers in Jingzhou, Hubei Province. In this study, Yang LiangYou No. 6 was transplanted in late May and harvested in late September in 2020 and 2021. Two types of N fertilizers that were used included U (46% N) and CRU (43% N); CRU is polyolefin-coated urea, which has a static water 25°C parabolic curve release and a release period of 120 days (National Engineering Technology Research Center of Slow and Controlled Release Fertilizer, Linyi, China) (Figure 2).
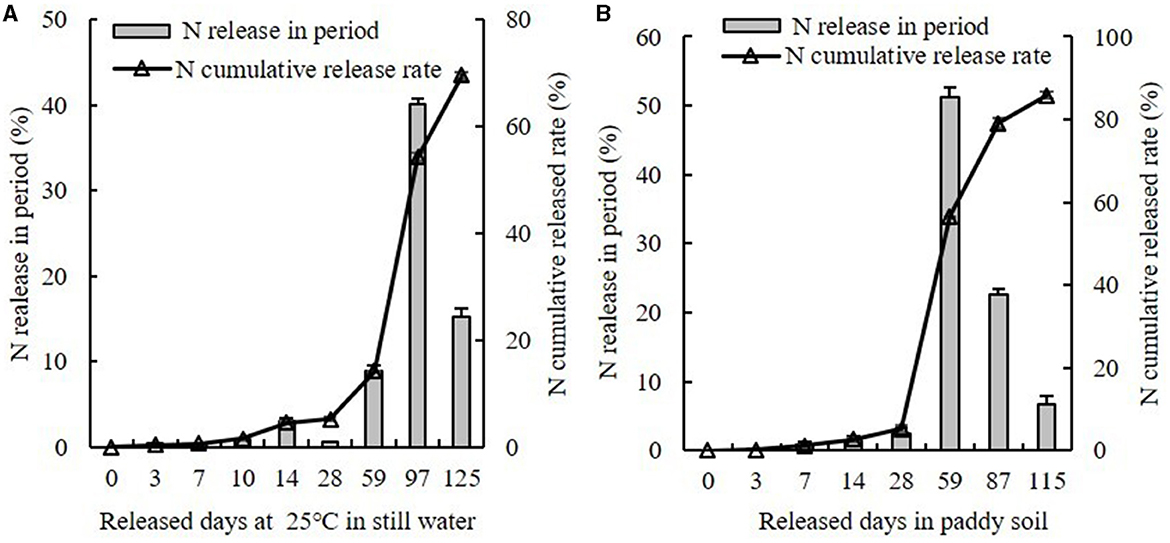
Figure 2. The N release in period and N accumulative release rate of CRU in still water (A) and paddy soil (B).
The field plot experiment was conducted with six treatments: (i) CK: a control treatment without N fertilizer application; (ii) FFP: farmers' fertilizer practice, U was broadcasted manually three times, 50% as basal fertilizer, 30% as tillering fertilizer, and 20% as booting fertilizer; (iii) UM: U was mechanically applied to a band 5 cm away from the rice root system and 10 cm deep; (iv) UR: U was manually applied into a hole 5 cm away from the rice root system and 10 cm deep; (v) CRUM: CRU was mechanically applied to a band 5 cm away from the rice root system and 10 cm deep; and (vi) CRUR: CRU was manually applied into a hole 5 cm away from the rice root system and 10 cm deep. For LNS (UM, UR, CRUM, and CRUR) treatments, the U and CRU were point-deep-placed once as basal fertilizer after the rice had been transplanted (1.76 g U hill−1 for UM and UR and 1.88 g CRU hill−1 for CRUM and CRUR). A map of mechanical side deep fertilization (M) and root-zone fertilization (R) is shown in Figure 3. The field experiment was completely randomized with three replicates. The plot dimensions were 5 × 5 m, and each plot was separated by a 30-cm-wide earth bank covered with plastic film to prevent the lateral flow of water and nutrients.

Figure 3. The sketch map of mechanical side deep fertilization (M) and root-zone fertilization (R).
Except for CK (no N fertilizer), all the treatments were administered at the following rates: 180 kg N ha−1, 90 kg P2O5 ha−1, and 120 kg K2O ha−1. The phosphate (12% P2O5; Hubei Sanning Chemical Co., Ltd., Hubei, China) and potassium fertilizers (60% K2O; Sinofert Holdings Limited, Beijing, China) were applied once, following which a small amount of water was added to mix the field soil and fertilizer before transplanting. The transplanting density was 25 × 18 cm for each plot, with three to five seedlings in each hole. All plots were irrigated approximately 1 week prior to transplanting, and the water layer was always maintained at a depth of 3–5 cm (except during the tillering stage and 1 week prior to harvest). The irrigation was coordinated with local precipitation events, and the same irrigation pattern was used in both 2020 and 2021. Herbicide weed control (glufosinate-ammonium) was applied before rice transplanting and at the tillering stage, and insecticide (emamectin benzoate) was sprayed at the booting stage. Glufosinate-ammonium and emamectin benzoate were both purchased at the local pesticide store and applied at the same time in both years.
The value of soil plant analysis development (SPAD) was measured using a SPAD chlorophyll meter (SPAD 502, Minolta Camera Co., Osaka, Japan) from the six uppermost fully expanded leaves on each plot in the tillering, booting, and heading stages in 2020 and 2021. The chlorophyll content was calculated from the SPAD values using the method of Cao et al. (2001).
Three hills of rice were randomly selected in each plot, and five fully expanded flag leaves were selected on the main stem to measure the photosynthetic traits in the tillering and booting stages in 2021. The photosynthetic traits, including net photosynthesis rate (Pn), stomatal conductance (Gs), intercellular CO2 concentration (Ci), and transpiration rate (Tr), were calculated using the portable Li-COR 6400 Photosynthesis System (LI-COR Inc., USA). The calculation time was from 10.00 a.m. to 12.30 p.m. under sunlit conditions (photosynthetically active radiation, 1,000 μmol m−2 s−1; leaf chamber temperature, 30°C; and ambient CO2 levels, 380 ppm).
Five rice plants were selected from each treatment in the tillering and booting stages, and the uppermost fully expanded leaves were preserved in liquid N for measuring SOD, CAT, and MDA content (Wu and Yang, 2016).
For measuring the SOD activity, fresh rice leaves (1 g), phosphate-buffered saline (PBS) (3 ml, 0.05 mol/L, pH = 7.8), and a small amount of quartz sand were ground into homogenate in an ice bath. The resulting homogenate was then transferred into a 5-ml centrifuge tube, fixed, and centrifuged at 10,000 rpm at 4°C for 15 min. The extracted supernatant was used as the enzyme solution. The enzyme solution was taken in a 10 ml centrifuge tube and immediately illuminated using a fluorescent tube at 4,000 Lx. The reaction was terminated by stopping the light and shading the light after 15 min. The control tube contained PBS and SOD solutions. The colorimetric wavelength was 560 nm.
For measuring the CAT activity, the rice leaves (0.2 g) and PBS (1 ml) were ground at low temperatures. Then, 5 ml of PBS was added, and the mixture was centrifuged at 10,000 rpm at 40°C for 15 min. The supernatant was the enzyme solution. To calculate the enzyme activity, 0.2 ml of the enzyme solution, 1.5 ml of PBS, and 1.5 ml of H2O2 were mixed, and colorimetric readings were taken immediately at 240 nm every 30 s for a total of 2 min.
For calculating the MDA content, 0.2 g of rice leaves were ground into a homogenate and transferred to a 10-ml centrifuge tube, and then the mortar was rinsed using 1 ml of 10% TCA solution. The mortar was then centrifuged at 4,000 rpm for 10 min, and the supernatant enzyme solution was obtained (Shahid et al., 2019).
The topmost leaves of rice plants were taken at the tillering and booting stages, stored in an ice box, transported, and frozen at −80°C to measure the activities of the N-metabolizing enzymes nitrate reductase (NR), glutamine synthetase (GS), and glutamate synthase (GOGAT).
To measure NR activity, 0.5 g of rice leaves were added to the test tube with 9 ml of KNO3, isopropanol, and PBS, and 1.0 ml of trichloroacetic acid was added to the control tube to mix evenly as a control. After draining the air in the tube, the straight leaves settled at the bottom, and the tube was placed in the dark at 3°C for 30 min. Then, 1.0 mmo1/L trichloroacetic acid was added and shaken. After allowing it to stand, 2 ml of the supernatant was extracted, and the control tube was used to determine the chromogenicity for enzyme activity (Wu S. W. et al., 2017).
The GS activity was measured using the method of Zhong et al. (2018). In this experiment, 5 g of rice leaves and 5 ml of the crude enzyme extract were taken and put in the ice bath to make a homogenate. The homogenate was centrifuged at 13,000 rpm at 4°C. The supernatant was the crude enzyme extract. Furthermore, 1 ml of the reaction solution, 0.5 ml of crude enzyme extract, and 0.5 ml of ATP solution were taken in the test tube, mixed well, and kept at 37°C for 30 min. Furthermore, 1 ml of the color developer was added to terminate the reaction, and the mixture was shaken well continuously and centrifuged at 4,000 rpm for 15 min. The supernatant was used to measure the absorbance value at 540 m, and the control solution with 1.0 was used as the control.
The GOGAT activity was determined based on the methods of Shahid et al. (2019). The crude enzyme extract was used for GS. The blank control (a mixture of glutamine, α-ketoglutarate, KCl, and Tris-HCl buffer) and the treatment tube (a mixture of α-ketoglutarate, KCl, and Tris-HCl buffer) were preheated in a constant-temperature water bath at 30°C for some time. Then, 0.2 ml of nicotinamide adenine dinucleotide (NADH), 0.3 ml of crude enzyme solution, and 0.4 ml of glutamine were added sequentially. The mixed GOGAT enzyme activity was defined as one unit of enzyme activity per minute of reaction solution reduction using l μmol NADH at 30°C.
The roots were excavated whole from the plot soil using the holistic method during different growth periods (60 and 90 days after transplanting in 2020 and 30 and 60 days after transplanting in 2021) and rinsed well with tap water immediately after excavation. Then, the enzyme was deactivated at 105°C for 30 min, dried to a constant weight at 75°C, and weighed (Sun et al., 2014). The weighed samples were ground and sieved to calculate their total N content using the Kjeldahl method (Li et al., 2011).
Fresh soil samples were collected in different plots from three soil layers (0–20, 20–40, and 40–60 cm) using a steel soil auger before transplanting and after harvest (Zheng et al., 2020). The inorganic N was extracted from the soil using a 2 mol/L KCl solution, which was shaken at 200 rpm for 1 h in an oscillating incubator and filtered using filter paper (Yao et al., 2017). The AUV spectrophotometer was used to measure the concentration of ammonium nitrogen (-N) and nitrate nitrogen (-N) (UV-5300PC; Shanghai Mattel Instrument Co., Ltd., Shanghai, China).
Three hills of rice were collected from each plot to calculate the biomass in the tillering, booting, and maturity stages. First, the stems, leaves, and panicles were separated, and the fresh samples were dried to deactivate the enzymes at 105°C for 30 min. Then, the samples were further dried to a constant weight at 75°C, which was considered the dry matter accumulation. Subsequently, the weighed samples were milled and sieved to calculate their total N content using the Kjeldahl method (Li et al., 2011).
The biomass transfer amount in different organs (BTA, t/ha), biomass transfer rate (BTR, %), contribution rate of BTA from other organs to grains (GCR, %), total biomass exportation from vegetative organs (BME, t/ha), and transportation rate of biomass from vegetative organs (TRBV, %) were, respectively, calculated using the following equations (Liu et al., 2017; Qi et al., 2020):
where BMH and BMM represent biomass in organs at the heading and maturity stages, respectively, and GHW represents the grain weight.
The N uptake (kg/ha) was calculated using the following equation (Zhu et al., 2019):
where TD represents the total dry matter accumulation of panicles, leaves, and stems with leaf sheaths. NC represents the content of N in the panicles, leaves, and stems with leaf sheaths.
N apparent translocation amount from stems, sheaths, and leaves (TNT, kg/ha); N apparent translocation efficiency of stems, sheaths, and leaves (TNTE, %); contribution rate of transferred N (NCR, %); N apparent translocation amount from stems and sheaths (SNT, kg/ha); N apparent translocation efficiency of stems and sheaths (SNTE, %); N apparent translocation amount from leaves (LNT, kg/ha); and N apparent translocation efficiency of leaves (LNTE, %) were calculated using the following equations (Zhu et al., 2019):
where TNH and TNM represent the total N uptake of aboveground in heading and maturity stages, respectively. TNG represents the total N uptake of grain in the maturity stage. SNH and SNM represent the total N uptake of stems and sheaths in the heading and maturity stages, respectively. LNT and LNM represent the total N uptake of leaves in the heading and maturity stages, respectively.
The N residual (Nres, kg/ha), N initial (Nini, kg/ha), and N mineral (Nmin, kg/ha) were calculated as follows (Zheng et al., 2020):
where C represents the total content of -N and -N (mg/kg). B and H represent bulk density and height in the soil, respectively (Kou et al., 2021).
where C0i and C0h represent the total content of -N and -N (mg/kg) before transplanting and after harvesting of CK, respectively. Not uptake represents the total uptake including shoots and roots in the maturity stage of CK.
The N apparent loss (Napp, kg/ha) and N surplus (Nsur, kg/ha) were calculated as follows (Zheng et al., 2020):
where Nt uptake represents the total N uptake including shoots and roots in the maturity stage.
Microsoft Excel 2010 (WA, USA) was used for data processing. The pairwise means among treatments were compared using the Tukey's test at the 0.05 level of probability (SAS Institute Inc. 2001). SPSS Statistics 26.0 (IBM, Inc.; NY, USA) was used for statistical analyses, including simple path analyses of the indicators affecting rice yields and the interaction of different N application methods and N fertilizer varieties on each indicator. The graphs were drawn using the Origin 8.5 software (Origin Lab, MA, USA) and Microsoft PowerPoint 2010 (WA, USA).
N application can effectively increase chlorophyll content (Figure 4). The chlorophyll contents under CRUM and CRUR treatments were higher than those under FFP (p < 0.05). The chlorophyll content in CRUM significantly increased in LNS by 7.98, 7.90, and 5.70% in 2020 and by 14.42, 13.69, and 11.36% in 2021, respectively (p < 0.05), at the tillering, booting, and heading stages compared with that in UM. The chlorophyll content increased by 7.94, 9.71, and 8.45% (2020) and 12.28, 11.35, and 10.13% (2021) in CRUR compared with UR (p < 0.05) at the tillering, booting, and heading stages, respectively, indicating that the CRU effectively increased the chlorophyll content. The chlorophyll content of R was slightly higher than that of M when the same amount of N fertilizer was applied.
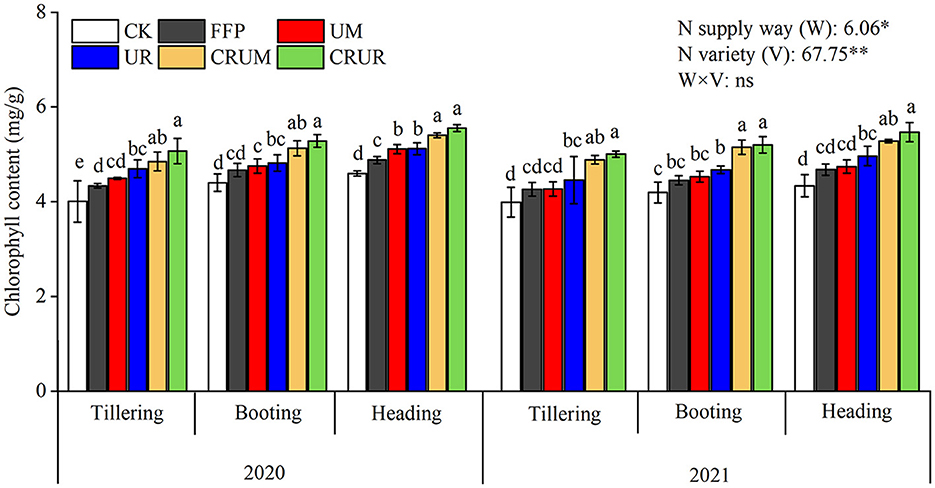
Figure 4. Effects of different N fertilizer treatments on chlorophyll content of rice leaves. Values are the means ± SD of three replicates. Means followed by a common letter are not significantly different by the Tukey's test at the 5% level of significance. * and ** represent statistical significance at p < 0.05 and p < 0.01, respectively. ns indicated statistical significance at p > 0.05 within a column.
The photosynthesis traits are shown in Figure 5. The N application was beneficial to increase Pn, Gs, and Tr and decrease Ci. Differences were observed in the net photosynthetic rate and transpiration rate under different N fertilization treatments at different stages, especially in the booting stage. In CRU in the booting stage, Pn, Gs, and Tr levels significantly increased by 11.53, 19.64, and 15.86%, respectively, under CRUM compared with UM. Pn, Gs, and Tr significantly increased by 15.91, 25.22, and 25.49%, respectively, under CRUR compared with UR. Furthermore, the Ci significantly decreased by 12.87 and 58.55% under CRUM compared with UM in the tillering and booting stages, respectively. The Ci decreased by 13.84 and 80.64% in CRUR compared with UR in the tillering and booting stages (p < 0.05), respectively, which indicated that CRU application could improve the photosynthesis of rice leaves.
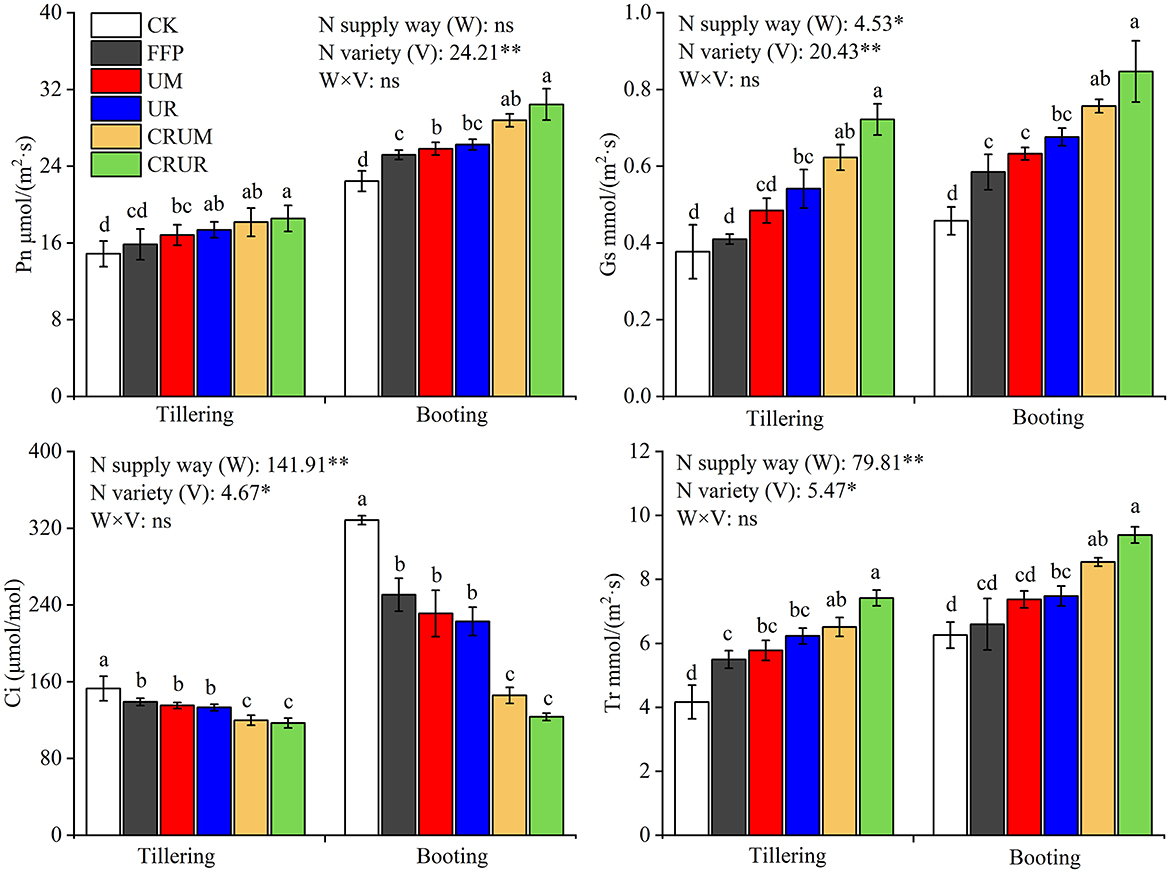
Figure 5. Effects of different N fertilizer treatments on photosynthesis traits (Pn, Gs, Ci, and Tr) in 2021. Pn, Gs, Ci, and Tr indicated net photosynthesis rate, stomatal conductance, intercellular CO2 concentration, and transpiration rate, respectively. Values are the means ± SD of three replicates. Means followed by a common letter are not significantly different by the Tukey's test at the 5% level of significance. *, **, and *** represented the significance levels of p < 0.05, p < 0.01, and p < 0.001, respectively; ns indicated statistical significance at p > 0.05 within a column.
As shown in Figure 6, significant differences were found in antioxidant enzyme and MDA levels under different N fertilization treatments at different stages. Compared with the other N fertilization treatments (FFP, UM, UR, and CRUM) in tillering and booting stages, the SOD and CAT activities under CRUR significantly increased by 14.79–40.36% and 11.76–25.51%, and 14.85–65.44% and 5.44–55.52% (p < 0.05), respectively. Moreover, the N application treatments (FFP, UM, UR, and CRUM) significantly increased the MDA content by 42.45–137.49% in 2020 and 45.52–104.20% in 2021 compared to that under CRUR (p < 0.05), respectively.
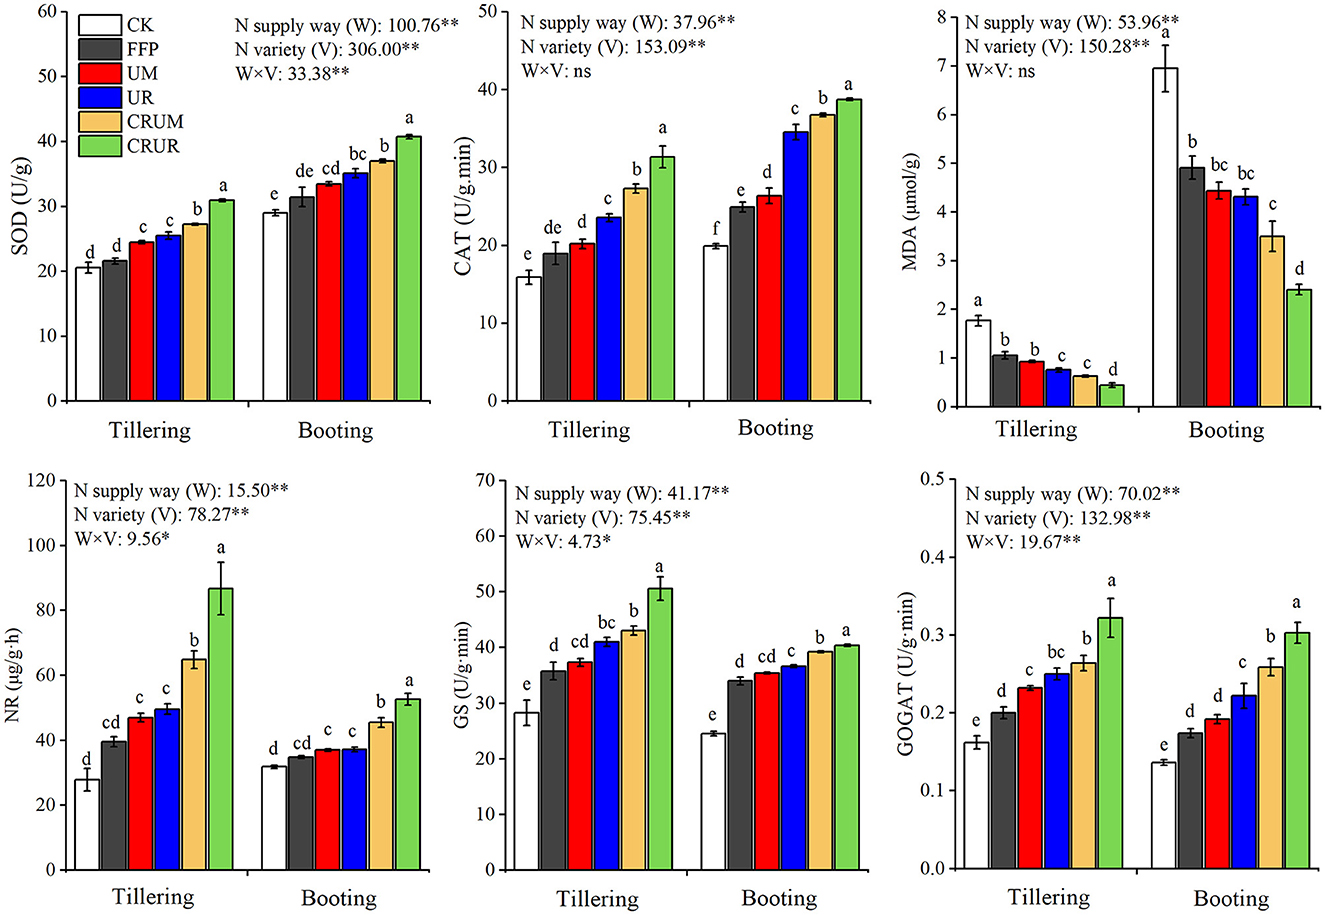
Figure 6. Effects of different N fertilizer treatments on antioxidant enzymes, MDA, and N metabolism enzyme of rice leaves at different growth stages in 2021. SOD, CAT, and MDA indicated superoxide dismutase, catalase, and malondialdehyde, respectively. NR, GS, and GOGAT indicated nitrate reductase, glutamine synthetase, and glutamate synthetase, respectively. Values are the means ± SD of three replicates. Means followed by a common letter are not significantly different by the Tukey's test at the 5% level of significance. *, **, and *** represented the significance levels of p < 0.05, p < 0.01, and p < 0.001, respectively; ns indicated statistical significance at p > 0.05 within a column.
Compared with U, CRU could significantly promote NR, GOGAT, and GS activities when the same N fertilizer was used. Furthermore, the NR, GS, and GOGAT levels in CRUR were higher than those under the other N fertilization treatments (FFP, UM, UR, and CRUM), especially in the tillering stage. Compared with the other N fertilization treatments (FFP, UM, UR, and CRUM) in the tillering stage, the NR, GS, and GOGAT levels in CRUR significantly increased by 33.71–119.38%, 17.56–41.56%, and 21.97–61.00% (p < 0.05), respectively.
As depicted in Table 1, the BTA, BTR, and contribution rate of BTA from GCR under all treatments were the highest in stems, followed by leaves, in 2020 and 2021. However, the BTA, BTR, and GCR levels varied among different N treatments. Compared with the UM of stems and leaves in 2021, the BTA and BTR levels under CRUM significantly increased by 37.04 and 23.36% in 2020 and 33.85 and 23.07% in 2021, respectively. The BTA level of stems and leaves significantly increased by 27.42 and 46.16% in 2020 and 33.62 and 39.71% in 2021, respectively, compared with the UR level (p < 0.05). Furthermore, the DME of CRU was significantly higher than that of U, indicating that CRU effectively promoted dry matter exportation compared with U.
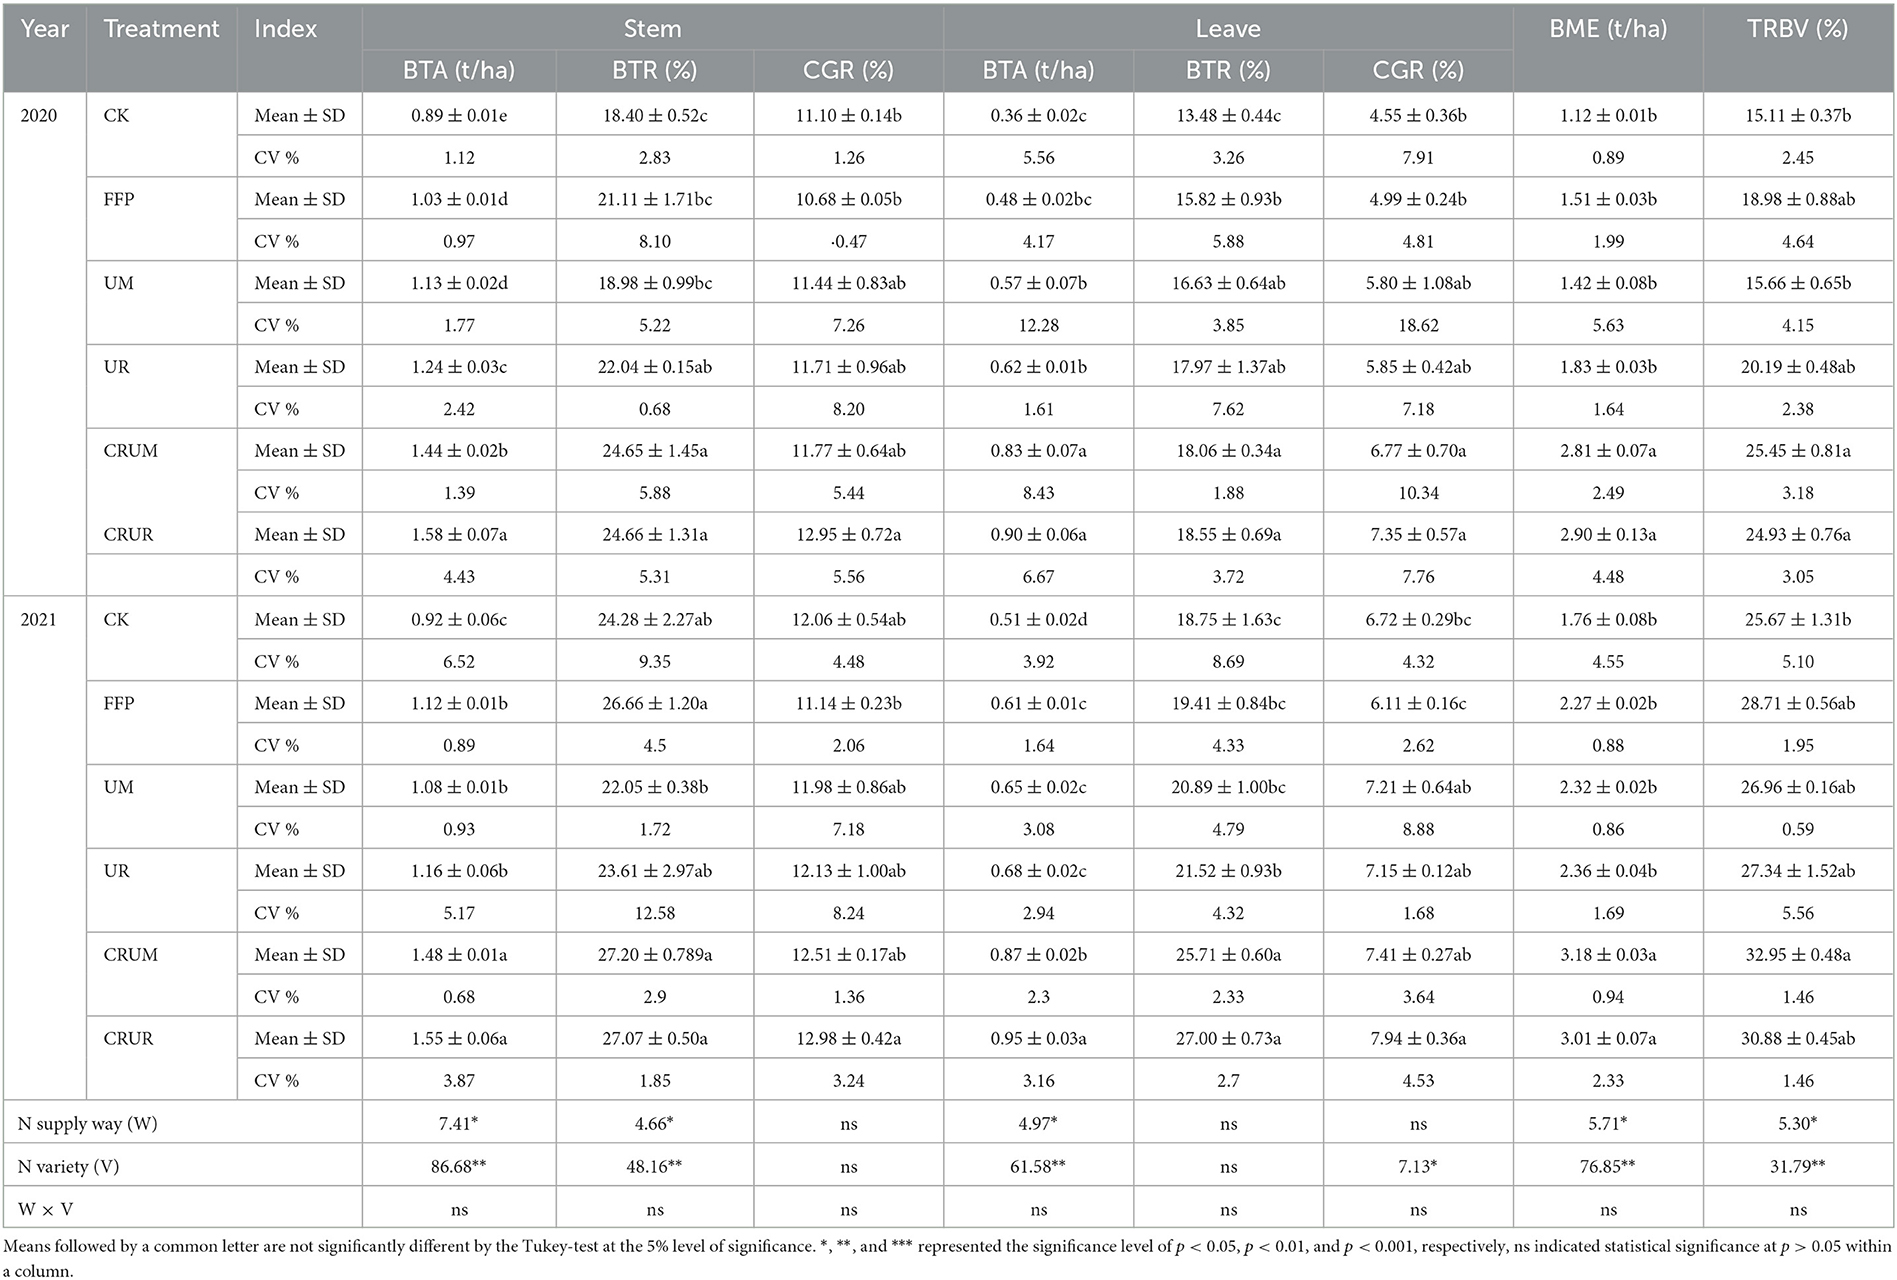
Table 1. Effects of different N fertilization treatments on biomass translocation in each organ and its contribution rate to grain.
The N uptake of stems and leaves increased first and then decreased gradually in the rice-growing stage (Table 2). A significant difference was observed between N application treatments of stems, leaves, and panicles in different stages. For example, the N uptake of stems and leaves was significantly higher under CRU treatments (CRUM and CRUR) than under U treatments (FFP, UM, and UR) in the tillering stage but not in the heading and maturity stages. In panicles in the maturity stage, the N uptake significantly increased by 19.19% (2020) and 34.22% (2021) under CRUM compared to UM (p < 0.05). The N uptake increased significantly by 17.75% under CRUR (2021) compared to UR (p < 0.05).
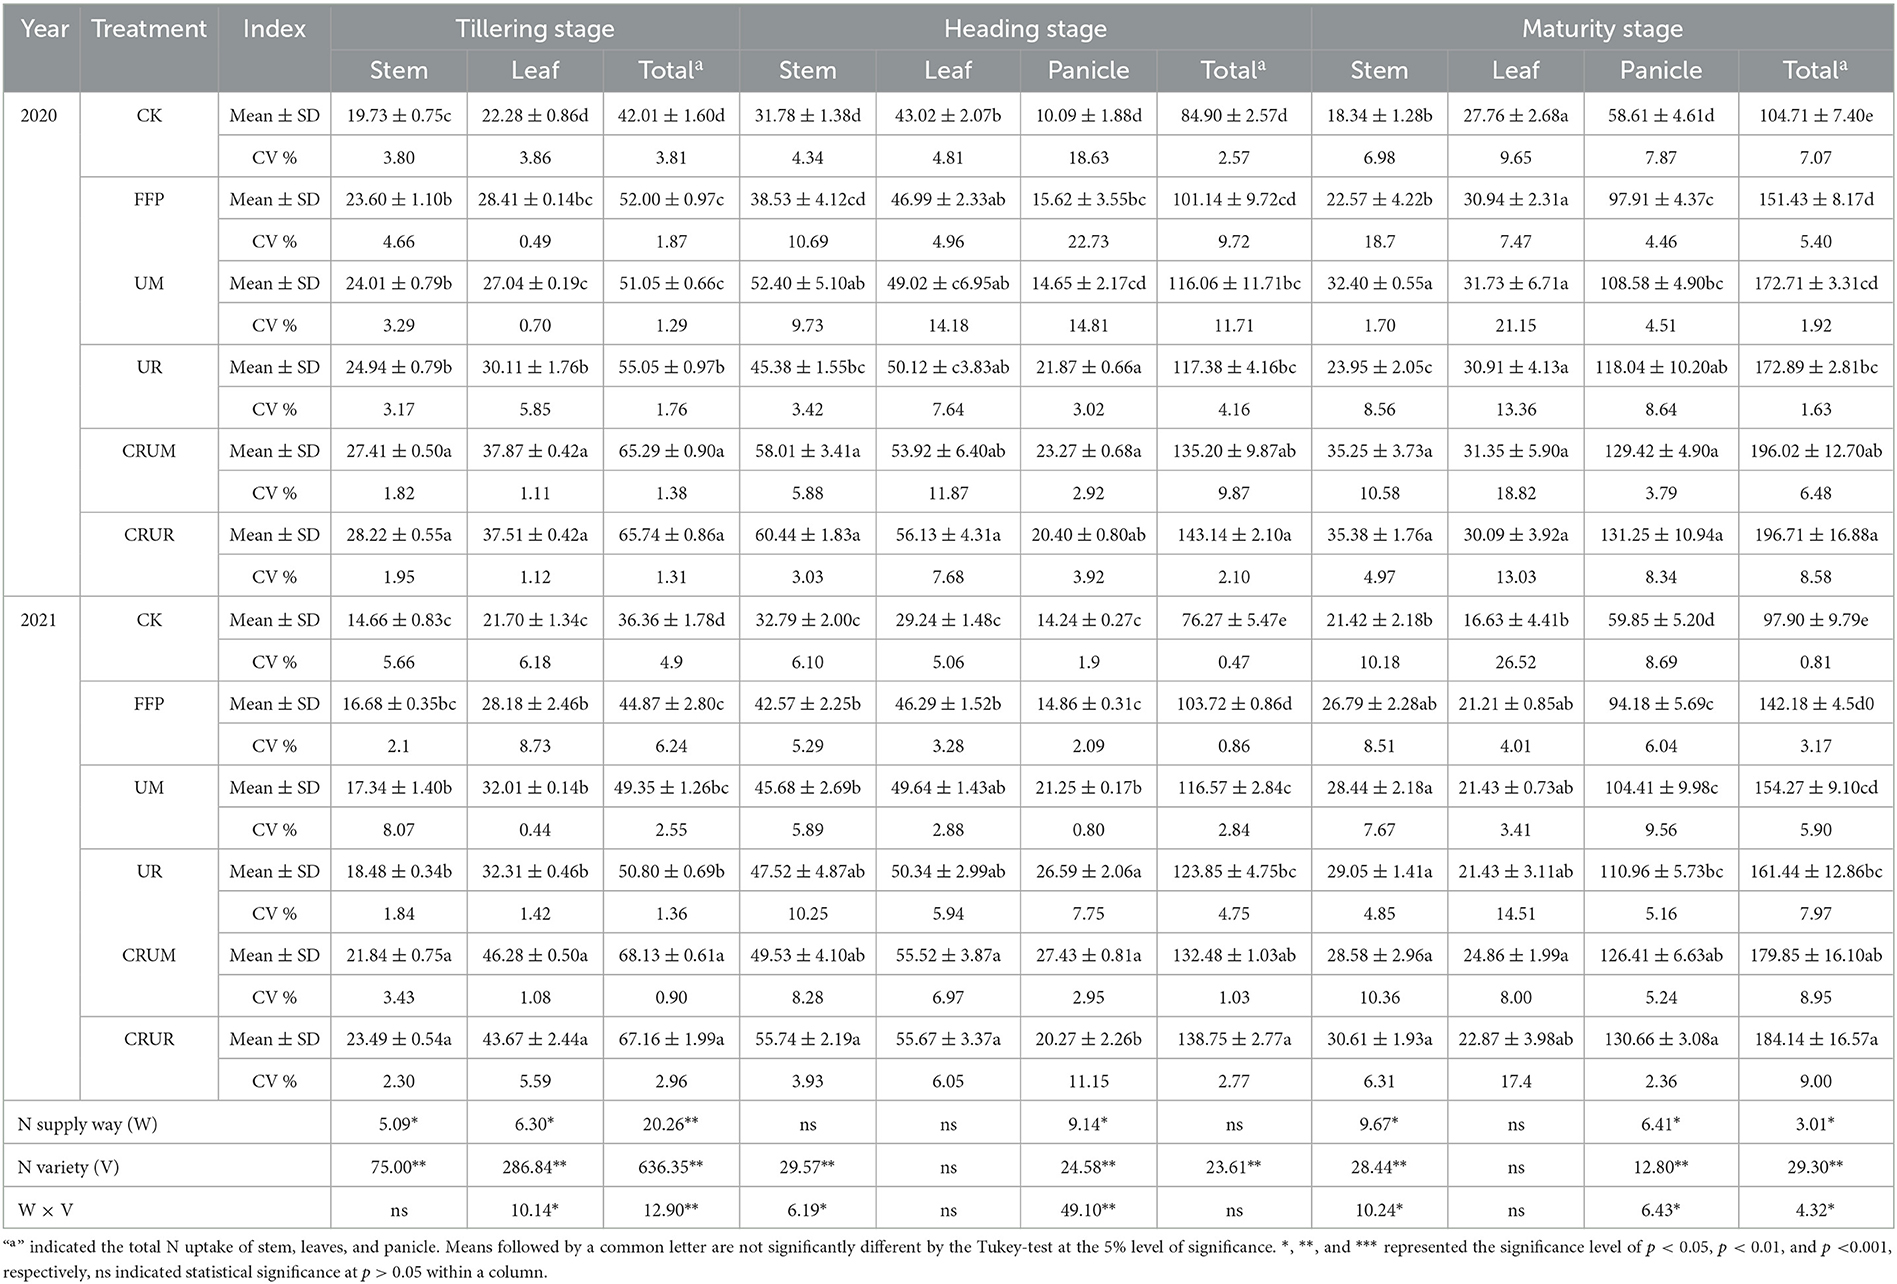
Table 2. Effects of N application treatment on N uptake in different organs of rice at different growth stages (kg/ha).
The TNT, TNTE, and NCR were significantly affected by N applications and varieties (Table 3). In LNS, the CRU treatment could significantly increase the SNT and LNT levels by 28% (p < 0.05) compared with the U treatment, which further improved TNT. For M and R application methods, the TNT significantly increased by 4.35% (p < 0.05) under UR compared with UM in 2021. The TNT significantly increased by 11.78 and 11.92% under CRUR compared with CRUM in 2021 and 2021, respectively (p < 0.05).
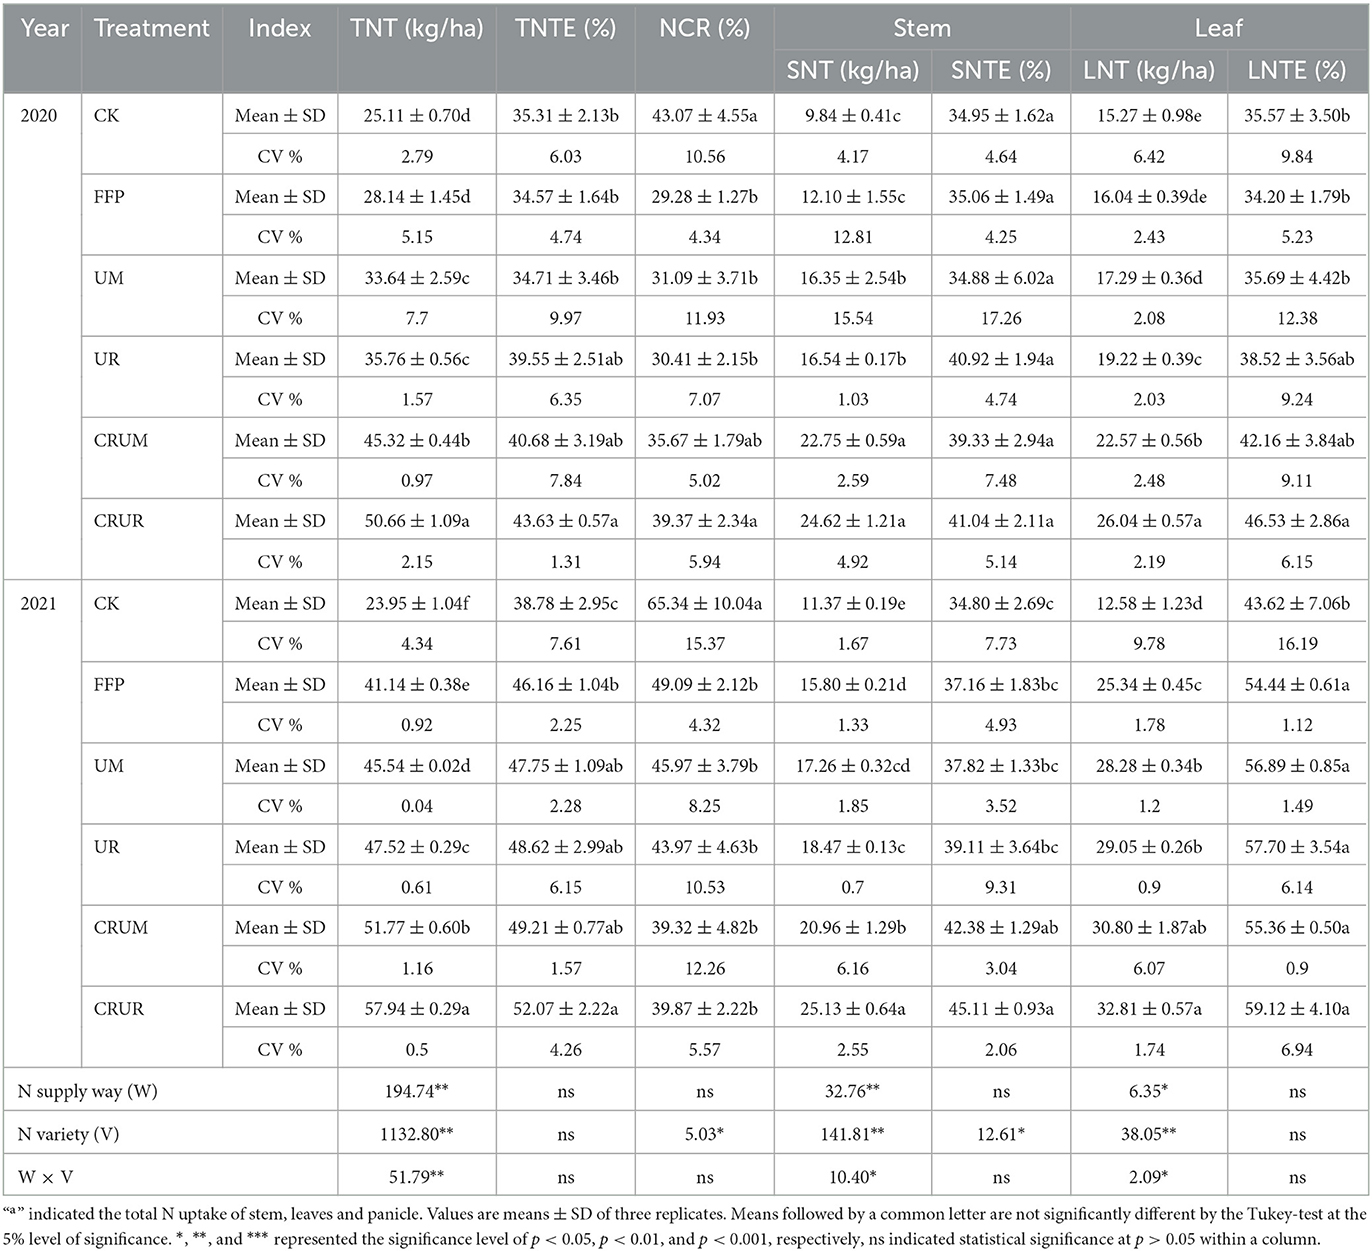
Table 3. Effects of different N fertilizer treatments on N transport of rice.
As shown in Figure 7, the N uptake of roots showed similar trends in LNS after 30 and 60 days (d). The treatments were in the order CRUR > CRUM > UR = UM. N uptake significantly increased by 27.68% (p < 0.05) after 30 and 60 days under CRU treatment compared with under U treatment. Furthermore, CRUR treatment significantly increased the N uptake of roots by 10.80–34.50% after 60 days and by 15.83–22.92% after 90 days in 2020, and by 16.83–50.49% after 30 days and 10.82–32.56% after 60 days in 2021 (p < 0.05), compared with other treatments (UM, UR, and CRUM).
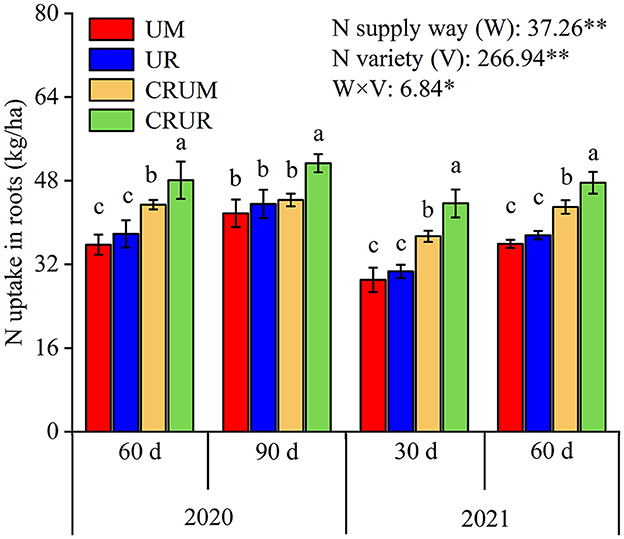
Figure 7. Effects of different N fertilizer treatments on N uptake of roots in 2020 and 2021. Values are means ± SD of three replicates. Means followed by a common letter are not significantly different by the Tukey-test at the 5% level of significance. Means followed by a common letter are not significantly different by the Tukey-test at the 5% level of significance. *, **, and *** represented the significance level of p < 0.05, p < 0.01, and p < 0.001, respectively, ns indicated statistical significance at p > 0.05 within a column.
As shown in Figure 8, the -N concentration decreased gradually with the deepening of the soil layer. In LNS, -N concentration was significantly higher under CRU treatment than under U treatment in the 0–20 and 20–40 cm soil layers when the same N application method was used. Moreover, the -N concentration significantly increased by 52.90–94.02% under CRUR treatment compared with other treatments (UM, UR, and CRUM) at a depth of 0–20 cm, indicating that CRUR was most beneficial in increasing soil -N concentration.
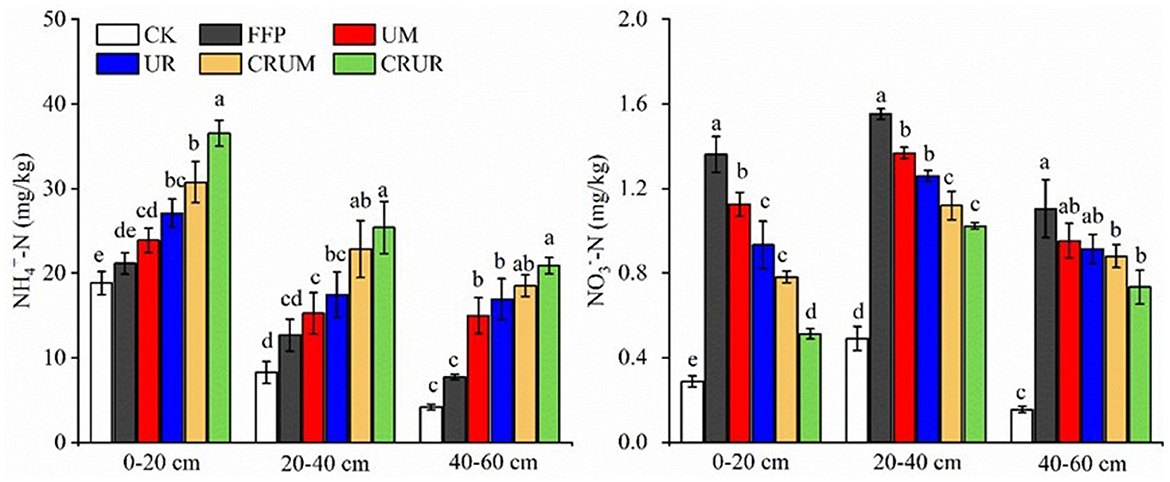
Figure 8. Average contents of -N and -N in different soil layers in 2021.
The -N concentration in different soil layers showed different trends compared with the -N concentration (Figure 8), and it increased first and then decreased with the deepening of the soil layer. The -N concentration in different soil layers was significantly higher under N treatment than under CK treatment, indicating that the N treatment resulted in the continuous accumulation of -N in the soil. The -N concentration in the 0–20 and 20–40 cm soil layers was significantly higher under FFP treatment than under LNS treatment. Furthermore, compared with other treatments (UM, UR, and CRUM) at a depth of 0–20 cm, the -N concentration in the 0–20 cm soil layer under CRUR treatment significantly decreased by 34.31–47.39% (p < 0.05).
The N varieties and methods significantly affected N uptake, N residual, N apparent loss, and N surplus in the soil–crop system (Table 4). In LNS, the total N uptake and N residual increased under CRU treatment compared with U treatment, especially CRUR. The N residual significantly increased by 17.50–48.07% (p < 0.05) under CRUR treatment compared with other LNS treatments (UM, UR, and CRUM). Moreover, the CRU could effectively reduce the N apparent loss and N surplus compared with U, and the CRUR showed the lowest N apparent loss. The N apparent loss significantly decreased by 50.05–75.51% (p < 0.05) under CRUR treatment compared with other LNS treatments (UM, UR, and CRUM).
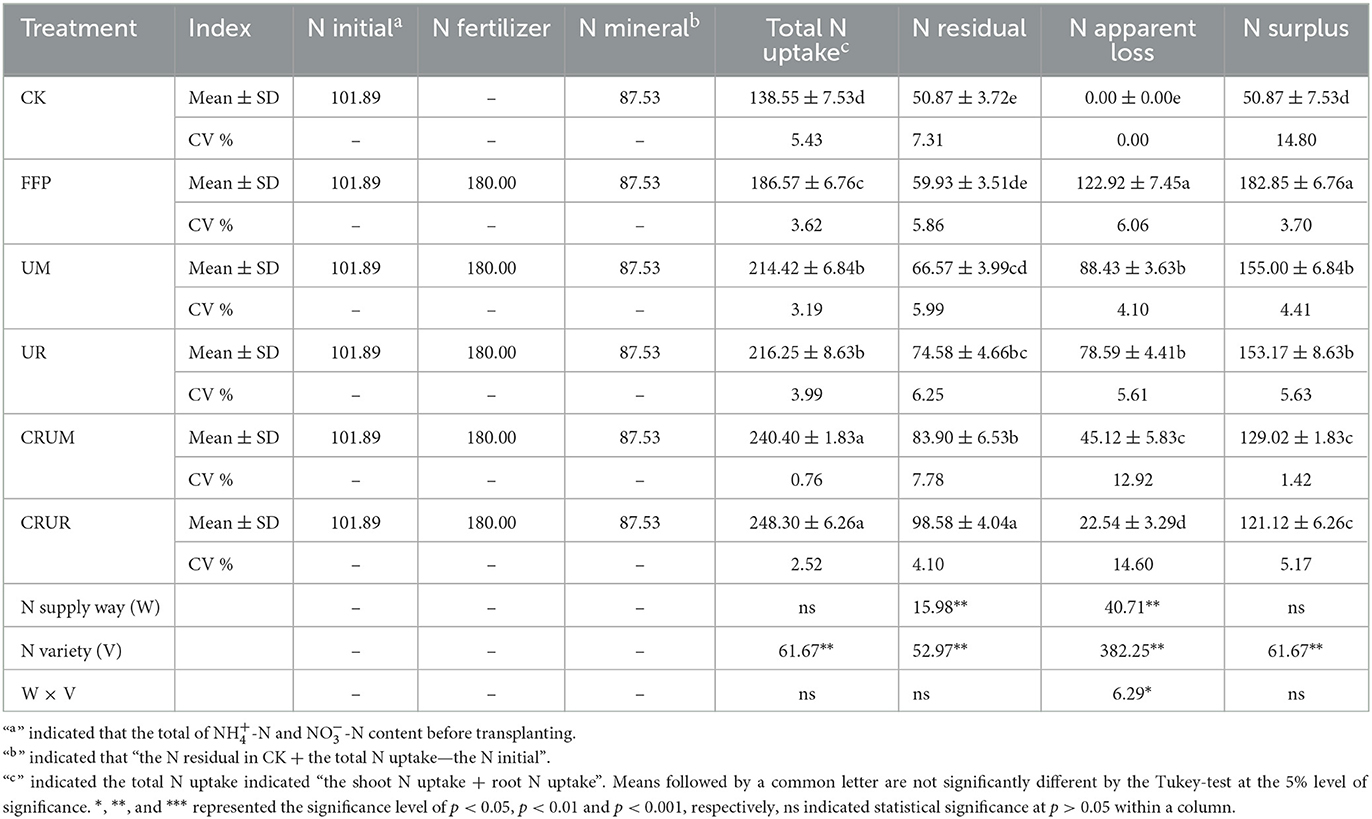
Table 4. Effects of local nitrogen supply on N balance in rice field system in 2020 (kg/ha).
Figure 9 shows the path coefficient structural model that describes the important relationships among selected traits. The N uptake in rice shoots directly and positively affected yield and yield components. Moreover, the N metabolism enzyme activity (GS), N residual in soil, and N uptake in roots also directly and positively affected N uptake in shoots. For underground rice plants, the N residual in the 0–20 cm soil layer directly promoted the increase in the N uptake of roots. Furthermore, the N varieties had positive and significant effects on -N and -N contents in different soil layers, but the N fertilization modes only had a positive and significant effect on -N in the soil layer of 0–20 cm and on -N content in the soil layer of 0–40 cm, respectively.
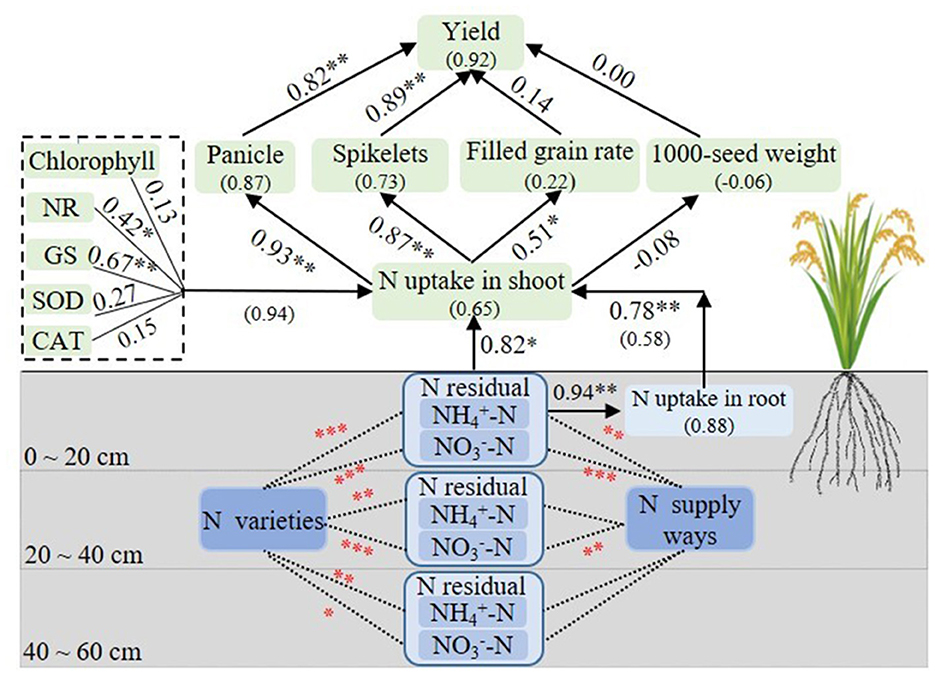
Figure 9. Path coefficient structural model of rice yield and the variables, analysis variance of -N and -N content under N varieties and N fertilization modes. Boxes indicate the variable name, and the numbers in parentheses indicate the variance explained by the model (R2). The numbers adjacent to arrows are standardized path coefficients and indicative of the effect size of the relationship. A line with arrowhead indicates a putative causal link between the cause (base of arrow) and effect (point of error). “0–20, 20–40, 40–60” indicated different soil layers. *, **, and *** in black and red colors represent the significance levels of p < 0.05, p < 0.01, and p < 0.001, respectively.
Conventional broadcasting of N fertilizers is considered an inefficient N management method for rice (Nkebiwe et al., 2016). Previous studies indicated that LNS was a more effective alternative to broadcast fertilization to increase the N uptake by rice in paddy fields (Nkebiwe et al., 2016; Zhu et al., 2022). In this study, LNS increased N uptake in the maturity stage by 11.37–16.48% compared with FFP (Table 3). It is widely believed that LNS provides adequate nutrient concentration near the root zone, facilitating root growth and maintaining root viability (Li et al., 2021), thus improving N uptake (Linquist et al., 2012). The results of this study showed that LNS enhanced the activity of SOD and CAT by 23.13 and 33.33%, respectively, and reduced the MDA content by 66.48%, which was in line with the findings of Pan et al. (2017). A good antioxidant enzyme system can delay plant aging and promote the growth and N uptake of rice (Liao et al., 2019, 2022).
M and R, the two main application methods of LNS, place the fertilizer near the rice root system to ensure N supply while effectively reducing N loss (Zhu et al., 2019; Ding et al., 2022). Previous studies showed that the differences in N availability due to the different ways of placing fertilizers via the two fertilization methods further affected N uptake and transfer (Liu et al., 2017). In this study, R increased the TNT by 8.58% compared with M (Table 3), which was relatively similar to the N metabolism enzyme. R increased the enzyme activities of NR, GS, and GOGAT by 13.81, 9.56, and 15.59%, respectively, compared with M. Generally, -N and -N can be absorbed by rice roots, and -N can be converted into -N by NR. The -N can be converted into glutamine by GS and glutamic acid by GOGAT (Takabayashi et al., 2016). This is a critical step in converting inorganic N into organic N in plants, which facilitates N transport (Wang et al., 2018). Moreover, according to Figure 9, increased NR and GS activities directly stimulated N uptake in the shoot, which resulted in an increased rice yield. In addition, in rice field fertilization, M is mechanized, while R needs to be realized manually, which is comparatively more time-consuming and labor-intensive (Liu et al., 2020; Min et al., 2021). Therefore, researchers should focus on mechanizing R as soon as possible.
N is the main component of chloroplasts, and N supply significantly increases the N uptake, chlorophyll contents, and photosynthesis of rice leaves (Sun et al., 2016). Studies have shown that the CRU application can prolong N availability in the soil, delay leaf senescence, and further increase N accumulation in the plant (Ding et al., 2022). In this study, the total N uptake and TNT under CRU treatment were significantly higher than those under U treatment (Table 2), which was consistent with the results of previous studies (Li et al., 2017, 2020).
N release rate under CRU treatments is influenced by the N application method. This is because the nutrient release of CRU is mainly influenced by the external ambient temperature and accelerates with increasing temperature. Meanwhile, the soil surface layer is more susceptible to the influence of solar radiation and temperature than the deeper layers. Fertilizers placed on the surface are more susceptible to wind and water erosion than those placed below the ground (Ding et al., 2020). Studies showed that the local CRU supply not only improved N uptake by rice but also reduced greenhouse gas emissions by 9.2% compared with the broadcast CRU supply (Li et al., 2023). This indicated that the application of CRU under LNS was more effective. Furthermore, it was found that N uptake in the roots was significantly higher under CRUR treatment than under other treatments (UM, UR, and CRUM) by 25.74% (Figure 7). This was because root N uptake was influenced by the N concentration around the roots (Ruseani et al., 2022), and the uptake rate was higher in roots grown in nutrient-rich patches than in nutrient-poor patches. Moreover, this study also revealed that N uptake in the root system had a direct and positive effect on aboveground N uptake (Figure 9), which was consistent with the findings of Niu et al. (2019). In addition, the yield and gross return under the CRUR treatment were higher than other treatments (UM, UR, and CRUM) by 2.06–22.86% and 1.92–22.51%, respectively (Supplementary Tables S1, S2).
The remaining N fertilizer in the soil has three destinations: it is absorbed by the next crop, enters the groundwater of paddy fields by leaching and runoff, and is converted into N2O and N2 in the atmosphere by denitrification. The unabsorbed residual N can lead to serious environmental issues, such as the greenhouse effect of rice fields, groundwater nitrate pollution, and biodiversity degradation (Chen et al., 2014; Smith et al., 2016). Thus, maintaining soil apparent N balance is significant to crop yield and environmental protection. In this study, CRUR treatment showed the lowest N apparent loss compared with other N treatments (FFP, UM, UR, and CRUM), besides the higher N uptake of CRUR. Most importantly, the N residual under CRUR was significantly higher than that under other treatments. The continuous N supply from CRUR increased the soil microbial enzyme activity around the root system (Zhang et al., 2017), which facilitated the N conversion of the fertilizer and enhanced the N fixation capacity in the soil, thus increasing the residual N in the soil based on the N application method. The contact area between N fertilizer and soil determines the rate of N fertilizer dilution and release, and the larger the contact area, the higher the rate of N fertilizer dilution and release (Zhou et al., 2020). The contact area between N fertilizer and soil can be in the following order: broadcasting > strip application > cavity application. Therefore, it can be hypothesized that the N fertilizer dilution and release rate are the lowest under R, the N occurs due to leaching, and runoff losses are smaller (Jiang et al., 2017). Interestingly, Ju and Zhang (2003) argued that this residual N was not necessarily lost immediately and might also serve to replenish the soil N pool with good management (Ju and Zhang, 2003; Smith and Chalk, 2018). Therefore, considering rice growth and soil N balance, R should be used as the main N fertilizer application method, and the best effect is achieved with the application of CRU.
These results clearly indicated that local N supply significantly improved N transport and reduced N loss in rice compared with farmers' fertilizer practices. In local N supply, CRU significantly increased the activities of antioxidant enzymes and N metabolism enzymes compared with urea, which contributed to N uptake and transport in rice. Root-zone fertilization significantly reduced N loss compared with mechanical side-deep fertilization. Therefore, considering the risk of soil N leaching and environmental protection, root-zone fertilization should be selected as the recommended fertilization method, and the combination of CRU and root-zone fertilization is the most effective. The government should support the development of simple deep fertilizer application machinery to promote root-zone fertilization with CRU.
The original contributions presented in the study are included in the article/Supplementary material, further inquiries can be directed to the corresponding authors.
RH: writing—original draft preparation, data curation, and editing. DX: investigation. ZD: investigation and conceptualization. YC: investigation and conceptualization. JH: methodology and reviewing. XW: reviewing. All authors contributed to the article and approved the submitted version.
This study was supported by Key R&D plan of Hubei Province in 2022 (2022BBA002), Carbon account accounting and carbon reduction and sequestration technology research of Quzhou city of China (2022-31), and Innovation Capacity Construction of Beijing Academy of Agricultural and Forestry Sciences (KJCX20230304, PT2023-47).
We particularly appreciate the guidance of the editor and reviewers on the refinement of the study.
The authors declare that the research was conducted in the absence of any commercial or financial relationships that could be construed as a potential conflict of interest.
All claims expressed in this article are solely those of the authors and do not necessarily represent those of their affiliated organizations, or those of the publisher, the editors and the reviewers. Any product that may be evaluated in this article, or claim that may be made by its manufacturer, is not guaranteed or endorsed by the publisher.
The Supplementary Material for this article can be found online at: https://www.frontiersin.org/articles/10.3389/fsufs.2023.1252324/full#supplementary-material
Campos, O. R., Mattiello, E. M., Cantarutti, R. B., and Vergütz, L. (2018). Nitrogen release from urea with different coatings. J. Sci. Food Agric. 98, 775–780. doi: 10.1002/jsfa.8525
Cao, S. Q., Lu, W., Zhai, H. Q., Sheng, S. L., Gong, H. B., Yang, T. L., et al. (2001). Research on the method to estimating flag leaf photosynthesis function duration at rice seedling stage by relative steady phase of chlorophyll content. Chin. J. Rice Sci. 15, 309–313. doi: 10.3321/j.issn:1001-7216.2001.04.014
Chen, X. P., Cui, Z. L., Fan, M. S., Vitousek, P., Zhao, M., Ma, W. Q., et al. (2014). Producing more grain with lower environmental costs. Nature 514, 486–489. doi: 10.1038/nature13609
Ding, X. P., Hao, L. G., Zhang, J. W., Liu, P., Ren, B. Z., and Zhao, B. (2020). Effects of base application depths of controlled release urea on yield and nitrogen utilization of summer maize. Sci. Agric. Sin. 53, 4342–4354.
Ding, Z. J., Li, J. T., Hu, R., Xiao, D. K., Huang, F., Peng, S. B., et al. (2022). Root-zone fertilization of controlled-release urea reduces nitrous oxide emissions and ammonia volatilization under two irrigation practices in a ratoon rice field. Field Crop. Res. 287, 108673. doi: 10.1016/j.fcr.2022.108673
Food Agriculture Organization of the United Nations. (2022). Food Outlook Biannual Report on Global Food Markets. Available online at: https://www.fao.org/giews/reports/food-outlook/en/ (accessed July 07, 2022).
Gaihre, Y. K., Singh, U., Mofijul Islam, S. M., Huda, A., Islam, M. R., Sanabria, J., et al. (2018). Nitrous oxide and nitric oxide emissions and nitrogen use efficiency as affected by nitrogen placement in lowland rice fields. Nutr. Cycle Agroecosyst. 110, 277–291. doi: 10.1007/s10705-017-9897-z
Grafton, R. Q., Williams, J., and Jiang, Q. (2015). Food and water gaps to 2050: preliminary results from the global food and water system (GFWS) platform. Food Secur. 7, 209–220. doi: 10.1007/s12571-015-0439-8
Guo, J. X., Hu, X. Y., Gao, L. M., Xie, K. L., Ling, N., Shen, Q. R., et al. (2017). The rice production practices of high yield and high nitrogen use efficiency in Jiangsu, China. Sci. Rep. 7, 1–10. doi: 10.1038/s41598-017-02338-3
Hu, K. B., Zhao, P., Wu, K. X., Yang, H. L., Yang, Q. X., Fan, M. Q., et al. (2023). Reduced and deep application of controlled-release urea-maintained yield and improved nitrogen-use efficiency. Field Crop Res. 295, 108876. doi: 10.1016/j.fcr.2023.108876
Jiang, C. Q., Wang, H. Y., Lu, D. J., Zhou, J. M., Li, D. C., and Zu, C. L. (2017). Effects of fertilizer placement and nitrogen forms on soil nitrogen diffusion and migration of red-yellow soil in China. Agric. Sci. 8, 1227–1238. doi: 10.4236/as.2017.811088
Jiang, Z. W., Yang, S. H., Chen, X., Pang, Q. Q., Xu, Y., Qi, S. T., et al. (2022). Controlled release urea improves rice production and reduces environmental pollution: a research based on meta-analysis and machine learning. Environ. Sci. Pollut. Res. 29, 3587–3599. doi: 10.1007/s11356-021-15956-2
Ju, X. T., and Zhang, F. S. (2003). Thinking about nitrogen recovery rate. Ecol. Environ. 2, 192–197.
Kou, C. L., Luo, X. S., and Ju, X. T. (2021). Effects of optimal nitrogen fertilization on N balance and nitrate-N accumulation in greenhouse tomato fields. J. Plant Nutr. Fertiliz. 27, 837–848. doi: 10.11674/zwyf.20456
Li, D., Wang, X., Zheng, H. B., Zhou, K., Yao, X., Tian, Y. C., et al. (2018). Estimation of area-and mass-based leaf nitrogen contents of wheat and rice crops from water-removed spectra using continuous wavelet analysis. Plant Methods 14, 1–20. doi: 10.1186/s13007-018-0344-1
Li, G. H., Zhao, B., Dong, S. T., Zhang, J. W., Liu, P., and Lu, W. P. (2020). Controlled-release urea combining with optimal irrigation improved grain yield, nitrogen uptake, and growth of maize. Agric. Water 227, 105834–105834. doi: 10.1016/j.agwat.2019.105834
Li, G. H., Zhao, B., Dong, S. T., Zhang, J. W., Liu, P., and Vyn, T. J. (2017). Interactive effects of water and controlled release urea on nitrogen metabolism, accumulation, translocation, and yield in summer maize. Sci. Nat. 104, 72. doi: 10.1007/s00114-017-1491-3
Li, G. H., Zhao, L. P., Zhang, S. X., Hosen, Y., and Yagi, K. (2011). Recovery and leaching of 15N labeled coated urea in a lysimeter system in the North China plain. Pedosphere 21, 763–772. doi: 10.1016/S1002-0160(11)60180-X
Li, L., Li, Q. K., Lin, Z. H., Zhang, Z., Tian, H., Ashraf, U., et al. (2021). Effects of nitrogen deep placement coupled with straw incorporation on grain quality and root traits from paddy fields. Crop Sci. 61, 3675–3686. doi: 10.1002/csc2.20578
Li, W. W., Ahmad, S., Liu, D., Gao, S., Wang, Y. H., Tao, W. K., et al. (2023). Subsurface banding of blended controlled-release urea can optimize rice yields while minimizing yield-scaled greenhouse gas emissions. Crop. J. 11, 914–921. doi: 10.1016/j.cj.2022.10.005
Liao, G. X., Yang, Y. H., Xiao, W. M., and Mo, Z. W. (2022). Nitrogen modulates grain yield, nitrogen metabolism, and antioxidant response in different rice genotypes. J. Plant Growth Regul. 42, 2103–2114. doi: 10.1007/s00344-022-10684-4
Liao, L., Dong, T. T., Qiu, X., Rong, Y., Sun, G. C., Wang, Z. H., et al. (2019). Antioxidant enzyme activity and growth responses of huangguogan citrus cultivar to nitrogen supplementation. Biosci. Biotech. Biochem. 83, 1–13. doi: 10.1080/09168451.2019.1634513
Linquist, B. A., Adviento-Borbe, M. A., Pittelkow, C. M., Kessel, C. V., and Groenigen, K. J. (2012). Fertilizer management practices and greenhouse gas emissions from rice systems: a quantitative review and analysis. Field Crop Res. 135, 10–21. doi: 10.1016/j.fcr.2012.06.007
Liu, T. Q., Fan, D. J., Zhang, X. X., Chen, J., Li, C. F., and Cao, C. G. (2015). Deep placement of nitrogen fertilizers reduces ammonia volatilization and increases nitrogen utilization efficiency in no-tillage paddy fields in central China. Field Crop Res 184, 80–90. doi: 10.1016/j.fcr.2015.09.011
Liu, T. Q., Li, S. H., Guo, L. G., Cao, C. G., Li, C. F., Zhai, Z. B., et al. (2020). Advantages of nitrogen fertilizer deep placement in greenhouse gas emissions and net ecosystem economic benefits from no-tillage paddy fields. J. Clean Prod. 263, 121322. doi: 10.1016/j.jclepro.2020.121322
Liu, X., Xu, G. C., Wang, Q. S., and Hang, Y. H. (2017). Effects of insect–proof net cultivation, rice–duck farming, and organic matter return on rice dry matter accumulation and nitrogen utilization. Front. Plant Sci. 8, 47. doi: 10.3389/fpls.2017.00047
Min, J., Sun, H. J., Wang, Y., Pan, Y. F., Kronzucker, H. J., Zhao, D. Q., et al. (2021). Mechanical side-deep fertilization mitigates ammonia volatilization and nitrogen runoff and increases profitability in rice production independent of fertilizer type and split ratio. J. Clean. Prod. 316, 128370. doi: 10.1016/j.jclepro.2021.128370
Niu, X. L., Hu, T. T., Zhang, F. C., Duan, A. W., and Zhang, J. Y. (2019). The root nitrogen uptake response to partial nitrogen stress is related to previous nutritional status. Plant Growth Regul. 87, 55–67. doi: 10.1007/s10725-018-0451-z
Nkebiwe, P. M., Weinmann, M., Bar-Tal, A., and Müller, T. (2016). Fertilizer placement to improve crop nutrient acquisition and yield: a review and meta-analysis. Field Crop Res. 196, 389–401. doi: 10.1016/j.fcr.2016.07.018
Pan, S. G., Wen, X. C., Wang, Z. M., Ashraf, U., Tian, H., Duan, M. Y., et al. (2017). Benefits of mechanized deep placement of nitrogen fertilizer in direct-seeded rice in south China. Field Crop Res. 203, 139–149. doi: 10.1016/j.fcr.2016.12.011
Qi, D. L., Hu, T. T., and Liu, T. T. (2020). Biomass accumulation and distribution, yield formation and water use efficiency responses of maize (Zea mays L.) to nitrogen supply methods under partial root-zone irrigation. Agric. Water Manage. 230, 105981. doi: 10.1016/j.agwat.2019.105981
Ruseani, N. S., Vanhove, W., Susilo, A. W., and Van Damme, P. (2022). Cocoa clones reveal variation in plant biomass, root nitrogen uptake, and apparent nitrogen recovery at the seedling stage. J. Soil Sci. Plant Nutr. 22, 4727–4738. doi: 10.1007/s42729-022-00955-0
Shahid, M. A., Balal, R. M., Khan, N., Zotarelli, L., Liu, G. D., Sarkhosh, A., et al. (2019). Selenium impedes cadmium and arsenic toxicity in potato by modulating carbohydrate and nitrogen metabolism. Ecotox. Environ. Safe 180, 588–599. doi: 10.1016/j.ecoenv.2019.05.037
Smith, C. J., and Chalk, P. M. (2018). The residual value of fertilizer N in crop sequences: an appraisal of 60 years of research using 15N tracer. Field Crop Res. 217, 66–74. doi: 10.1016/j.fcr.2017.12.006
Smith, P., House, J. I., Bustamante, M., Sobock,á, J., Harper, R., Pan, G., et al. (2016). Global change pressures on soils from land use and management. Global Change Biol. 22, 1008–1028. doi: 10.1111/gcb.13068
Sun, H. Y., Li, X. K., Ren, T., Cong, R. T., and Lv, J. T. (2014). Effects of fertilizer in shallow soils on growth and distribution of rice roots at seedling stage. Sci. Agric. Sin. 47, 2476–2484. doi: 10.3864/j.issn.0578-1752.2014.12.020
Sun, J. L., Ye, M., Peng, S. B., and Li, Y. (2016). Nitrogen can improve the rapid response of photosynthesis to changing irradiance in rice (Oryza sativa L.) plants. Sci. Rep. 6, 1–10. doi: 10.1038/srep31305
Takabayashi, A., Niwata, A., and Tanaka, A. (2016). Direct interaction with ACR11 is necessary for post-transcriptional control of GLU1-encoded ferredoxin-dependent glutamate synthase in leaves. Sci. Rep. 6. doi: 10.1038/srep29668
Tian, X. F., Fan, Z., Zhao, Y. X., Sun, S. C., Li, T. Y., Yu, N., et al. (2021). Controlled-release urea improved cotton productivity and nitrogen use efficiency in China: a meta-analysis. Agron. J. 113, 2251–2259. doi: 10.1002/agj2.20702
Wang, Y. Y., Cheng, Y. H., Chen, K. E., and Tsay, Y. F. (2018). Nitrate transport, signaling, and use efficiency. Annu. Rev. Plant Biol. 69, 85–122. doi: 10.1146/annurev-arplant-042817-040056
Wu, M., Liu, M., Liu, J., Li, W. T., Jiang, C. Y., and Li, Z. P. (2017). Optimize nitrogen fertilization location in root-growing zone to increase grain yield and nitrogen use efficiency of transplanted rice in subtropical China. J. Integr. Agric. 16, 2073–2081. doi: 10.1016/S2095-3119(16)61544-7
Wu, S. W., Hu, C. X., Tan, Q. L., Xu, S. J., and Sun, X. (2017). Nitric oxide mediates molybdenum-induced antioxidant defense in wheat under drought stress. Front. Plant Sci. 8, 1085. doi: 10.3389/fpls.2017.01085
Wu, X. B., Li, H. B., Rengel, Z., Whalley, W. R., Li, H. G., Zhang, F. S., et al. (2022). Localized nutrient supply can facilitate root proliferation and increase nitrogen–use efficiency in compacted soil. Soil Till. Res. 215, 105198. doi: 10.1016/j.still.2021.105198
Wu, Y. S., and Yang, C. Y. (2016). Physiological responses and expression profile of NADPH oxidase in rice (Oryza Sativa) seedlings under different levels of submergence. Rice 9, 1–10. doi: 10.1186/s12284-016-0074-9
Yao, Y. L., Zhang, M., Tian, Y. H., Zhao, M., Zhang, B., Zhao, M., et al. (2017). Urea deep placement for minimizing NH3 loss in an intensive rice cropping system. Field Crop Res. 218, 254–266. doi: 10.1016/j.fcr.2017.03.013
Ye, Y. S., Liang, X. Q., Chen, Y. X., Liu, J., Gu, J. T., Guo, R., et al. (2013). Alternate wetting and drying irrigation and controlled–release nitrogen fertilizer in late–season rice. Effects on dry matter accumulation, yield, water and nitrogen use. Field Crop Res. 144, 212–224. doi: 10.1016/j.fcr.2012.12.003
Zhang, J. S., Wang, C. Q., Li, B., Liang, J. Y., He, J., Xiang, H., et al. (2017). Effects of controlled release blend bulk urea on soil nitrogen and soil enzyme activity in wheat and rice fields. Chin. J. Appl. Ecol. 28, 1899–1908.
Zhang, S. G., Shen, T. L., Yang, Y. C., Li, Y. C., Wan, Y. S., Zhang, M., et al. (2018). Controlled-release urea reduced nitrogen leaching and improved nitrogen use efficiency and yield of direct-seeded rice. J. Environ. Manage. 220, 191–197. doi: 10.1016/j.jenvman.2018.05.010
Zheng, Y., Han, X. R., Li, Y. Y., Liu, S. Q., Ji, J. H., and Tong, Y. X. (2020). Effects of mixed controlled release nitrogen fertilizer with rice straw biochar on rice yield and nitrogen balance in northeast China. Sci. Rep. 10, 1–10. doi: 10.1038/s41598-020-66300-6
Zhong, C., Cao, X. C., Bai, Z. G., Zhang, J. H., Zhu, L. F., Huang, J. L., et al. (2018). Nitrogen metabolism correlates with the acclimation of photosynthesis to short-term water stress in rice (Oryza sativa L.). Plant Physiol. Biochem. 125, 52–62. doi: 10.1016/j.plaphy.2018.01.024
Zhou, C. M., Li, Y. C., and Chen, P. P. (2020). Effects of single application of fertilizer on yield and nitrogen utilization of mulching summer maize. Transact. Chin. Soc. Agric. Machin. 51, 9. doi: 10.6041/j.issn.1000-1298.2020.10.037
Zhou, Y., Yan, X. Y., Gong, S. L., Li, C. W., Zhu, R., Zhu, B., et al. (2022). Changes in paddy cropping system enhanced economic profit and ecological sustainability in central China. J. Integr. Agric. 21, 566–577. doi: 10.1016/S2095-3119(21)63841-8
Zhu, C. H., Xiang, J., Zhang, Y. P., Zhang, Y. K., Zhu, D. F., and Chen, H. Z. (2019). Mechanized transplanting with side deep fertilization increases yield and nitrogen use efficiency of rice in Eastern China. Sci. Rep. 9, 5653. doi: 10.1038/s41598-019-42039-7
Keywords: controlled-release urea, mechanical side deep fertilization, rice, root zone fertilization, nitrogen balance
Citation: Hu R, Xiao D, Ding Z, Cao Y, Hou J and Wang X (2023) Effects of local nitrogen supply and nitrogen fertilizer variety coupling on rice nitrogen transport and soil nitrogen balance in paddy fields. Front. Sustain. Food Syst. 7:1252324. doi: 10.3389/fsufs.2023.1252324
Received: 03 July 2023; Accepted: 26 July 2023;
Published: 25 August 2023.
Edited by:
Marouane Baslam, Niigata University, JapanReviewed by:
Jiban Shrestha, Nepal Agricultural Research Council, NepalCopyright © 2023 Hu, Xiao, Ding, Cao, Hou and Wang. This is an open-access article distributed under the terms of the Creative Commons Attribution License (CC BY). The use, distribution or reproduction in other forums is permitted, provided the original author(s) and the copyright owner(s) are credited and that the original publication in this journal is cited, in accordance with accepted academic practice. No use, distribution or reproduction is permitted which does not comply with these terms.
*Correspondence: Jun Hou, aG91anVuZ29vZGx1Y2sxQDE2My5jb20=; Xuexia Wang, d3h4MDQyN0AxNjMuY29t
Disclaimer: All claims expressed in this article are solely those of the authors and do not necessarily represent those of their affiliated organizations, or those of the publisher, the editors and the reviewers. Any product that may be evaluated in this article or claim that may be made by its manufacturer is not guaranteed or endorsed by the publisher.
Research integrity at Frontiers
Learn more about the work of our research integrity team to safeguard the quality of each article we publish.