
94% of researchers rate our articles as excellent or good
Learn more about the work of our research integrity team to safeguard the quality of each article we publish.
Find out more
ORIGINAL RESEARCH article
Front. Sustain. Food Syst., 03 August 2023
Sec. Sustainable Food Processing
Volume 7 - 2023 | https://doi.org/10.3389/fsufs.2023.1243477
This article is part of the Research TopicApplications of Biomacromolecules in Emulsion-based Edible FilmsView all 6 articles
 Ganesh N. Shelke1
 Vikram P. Kad1Govind B. Yenge1Ritu B. Kukde1Sudama R. Kakade1Sati Y. Al-Dalain2
 Moawiya A. Haddad3
 Ahmed Abdeen4
 Samah F. Ibrahim5Adel Abdelkhalek6Florin Imbrea7Liana Fericean8*Heba I. Gharmy9
 Mohamed K. Morsy10*
The current work aimed to enhance the quality, antioxidant activity, and sensory properties of low-fat soft cheese using Jamun Juice (Syzygium cumini L.) powder (JJP). Spray-dried JJP was added to soft cheese at four concentrations (4, 8, 12, and 16% w/v), in parallel to a control sample. The bioactive compounds of spray-dried JJP including total anthocyanin content (TAC), total phenolic content (TPC), ascorbic acid (AsA), and antioxidant ability (AA) were determined. The physicochemical, functional, color, textural, and organoleptic quality of cheese were estimated. Results revealed that JJP had a rich in contents of TAC 10.72 mg/g, TPC 22.08 mg/g, AsA 0.32 mg/g, and antioxidants 62.66%. The low-fat cheese included 16% JJP was high in moisture and ash contents while low in protein and pH compared to other treatments and control. The low-fat cheese included 16% JJP was high in TAC 0.22 mg/g, TPC 0.80 mg/g, AsA 0.056 mg/g, and AA 40.08%, compared to cheese contained JJP 4%–12%. The color attributes L*, a*, and b* of soft cheese-based 12% JJP were enhanced. Spray-dried JJP at 12% and 16% significantly affected textural profile, like firmness, cohesiveness, adhesiveness, springiness, gumminess, and chewiness of soft cheese compared to other samples. The 12% and 16% JJP improved the sensory acceptability of soft cheese treatments. The findings demonstrated that JJP at 12% could be a promising replacing material enriched with antioxidant and anthocyanin contents and help improve the quality and acceptability of low-fat soft cheese.
In recent decades, being overweight, diabetes, high blood cholesterol, and cardiovascular disorders have become significant causes of death around the world (Calligaris et al., 2015). However, evidence suggests that high-fat diets raise the risk of obesity and cardiovascular disease. Nowadays, health awareness has changed consumers’ food choices and eating habits (Chen et al., 2020). However, the modern consumer is more interested in novel foods that are low in fat (Xue et al., 2020), and contain valuable compounds like anthocyanin, phenolic acids, and flavonoids, which can help lower the risk of cardiovascular disease and boost antioxidant activity (Hell et al., 2018). Food fortification with ingredients containing fat replacers and rich in phytochemicals is a potential method for enhancing the nutritional profile of foods. Dairy products like cheese, ice cream, and yogurt are ideal for fortification due to their high consumption.
Cheese is an important milk product well-known widely, produced globally in a broad range of tastes, textures, and forms (Gholamhosseinpour et al., 2018; Aguilar-Raymundo et al., 2022). The wide variability of cheese types exists throughout the globe with unique attributes (Sohany et al., 2022). Soft cream cheese (SCC) is an unripened cheese with a creamy white color, smooth texture, high spreadability, and a delightful sweet acidic flavor because it is fermented by a mesophilic lactic acid starter culture (Jeong et al., 2017; Mehanna et al., 2021). SCC has won the hearts of many consumers worldwide with its tangy taste and mild sweetness (Salehi, 2021). On the other hand, SCC contains various fatty acids that can influence health differently. Some of these fatty acids may positively affect health as they can lower diabetes, inflammation, and cancer. Others may negatively affect health, as they can raise the risk of cardiovascular disease. Excessive fat intake can also result in many health complications, such as heart disease, high cholesterol levels, neurological disorders, and obesity. Therefore, there is a demand for low-fat soft cheese nationally and globally. In 2018, the global market for low-fat cheese was worth $93.9 billion, and 3.8% growth is expected between 2019 and 2025 (Anonymous, 2022). Low-fat cheese has less saturated fat than full-fat cheese. Ordinary cheese has 30%–40% saturated fat, while, low-fat cheese is prepared using skimmed milk, reducing fat by 7%–15% (Anonymous, 2022). According to the Codex general standard in the United States, low-fat cheese generally has a fat content ranging between 10% and 25%, and it can be made with low-fat milk containing 0.5% to 2% fat (Mistry, 2001). Consumers’ curiosity about minimizing fat intake has motivated the development of low-fat soft cheese in the global dairy industry (Rashidi et al., 2015). The presence of fat in cheese is essential because it directly affects the cheese’s physical, textural, and organoleptic attributes; therefore, eliminating or substituting fat in cheese is a difficult task (Koranteng et al., 2021).
Low-fat cheese is generally less acceptable than full-fat cheese due to texture, nutritional, and taste issues (Sharafi et al., 2020). These problems could be solved by using fat substitutes or replacers in the cheese-making process, which would soften the body of low-fat cheeses and enhance their texture (Motevalizadeh et al., 2018). Fat replacers are chemically and functionally classified as fat substitutes or fat mimetics (Chen et al., 2020), fat replacers made from lipids are fat substitutes, while those made from carbohydrates or proteins are fat mimetics. Several scientific papers have been published about low-fat cheese with various fat replacers like modified starch (Mehanna et al., 2021), maltodextrin (Nazari et al., 2020), Arabic gum (Lafta et al., 2019), galactomannan and novagel gum (Sharafi et al., 2019), Xanthan gum, and guar gum (Rashidi et al., 2015). However, all the fat replacer mentioned above improves low-fat soft cheese’s textural and sensory properties but not its functional properties, such as antioxidant activity. Whereas, in today’s market, consumers demand low-fat cheese that should have similar qualities to full-fat cheese as well as functional qualities that can decrease the risk of several diseases (Farrag et al., 2020).
Jamun (Syzygium cumini L) is a tropical fruit pertinence to the Myrtaceae family and is popularly known as Indian blackberry (Madani et al., 2021). It is one of the evergreens and healthy edible fruit that originated from Indonesia and India. It has been widely spread in South Asia under various agro-climate conditions (Ayenampudi et al., 2022). India contributes approximately 15.4% of the global production of Jamun, which amounts to 13.5 million tons annually (Verma et al., 2019). It has a long history of being regarded as a fruit that improves health because it contains a lot of micronutrients and several necessary minerals, including calcium, iron, manganese, sodium, zinc, and potassium (Kumar et al., 2022). Additionally, it is an exceptional source of natural bioactive mixtures (Ayenampudi et al., 2022), involving anthocyanin, tannins, alkaloids, terpenoids, oxalic acids, gallic acid, glucoside jamboline, and ellagic acid (Agarwal et al., 2019). Due to their excellent nutritional benefits, Jamun fruit products must be available throughout the year.
The fat replacers mentioned above used in low-fat cheese, such as maltodextrin, starch, and gum Arabic, are also used as carriers in spray-dried fruit juices (Bhat et al., 2021). However, spray-dried fruit pulp powder contains polyphenolic compounds with potent antioxidant properties (Shelke et al., 2022). In addition, spray-dried fruit powder is a safe and easily soluble substance that can be used in the preparation of a diversity of milk-based products (Kapoor and Ranote, 2016). Consequently, the addition of a small amount of spray-dried fruit juice powder can improve the cheese’s textural and sensory qualities and boost its antioxidant capacity. Therefore, there is a big opportunity for the development of low-fat functional dairy products incorporating spray-dried fruit pulp powder. According to our review report, there are no published studies on the use of spray-dried fruit juice as a fat substitute for low-fat soft cheese. As well as using maltodextrin (MD) and gum arabic (GA) as fat replacers. In this way, the current work sought to assess the impact of Jamun juice powder (carbohydrate-based fat substitute) on the quality parameters, physicochemical, and sensory responses of low-fat soft unripened cheese.
Cow milk was sourced from the Department of Animal Husbandry and Dairy Science, MPKV, Rahuri. The milk was transported to the laboratory through sterilized plastic cans. The hygienic quality of the milk was controlled by measuring the total plate count before transportation to the laboratory. Other ingredients such as maltodextrin and gum Arabic (Made: Loba Chemicals Pvt. Ltd., Mumbai, India) were purchased from the Thermo Fisher Scientific India Pvt. Ltd., Mumbai. Jamun juice (S. cumini L.; 11.84 Brix) was procured from the Post-Harvest Technology Center, Mahatma Phule Agricultural University in Rahuri, India. The juice was stored in bottles at 4 ± 1°C until it was utilized. The analytical-grade chemicals used in this experiment were purchased from M/s. Thermo Fisher Scientific India Pvt. Ltd., Mumbai.
Stored Jamun juice (11.84 °Brix) and two carrier agents (maltodextrin and gum Arabic) were used to prepare the feed solution. Jamun juice and the two carrier agents (MD: GA, 50:50) were blended at 20% (v/w) with the help of a magnetic stirrer (2MLH; Remi Sales and Engineering Ltd., Mumbai, India). Spray-drying was done using (LU-222, Labultima Private Limited, Mumbai, India). The following parameters were run in the spray drying process: feed flow rate of 10 mL min−1, inlet air flow rate of 63 m3 h−1, outlet air temperature of 80°C ± 1°C, and inlet air temperature of 160°C ± 1°C. The powder Jamun (Figure 1) was kept at 20°C ± 1°C in a desiccator until used (Singh et al., 2019).
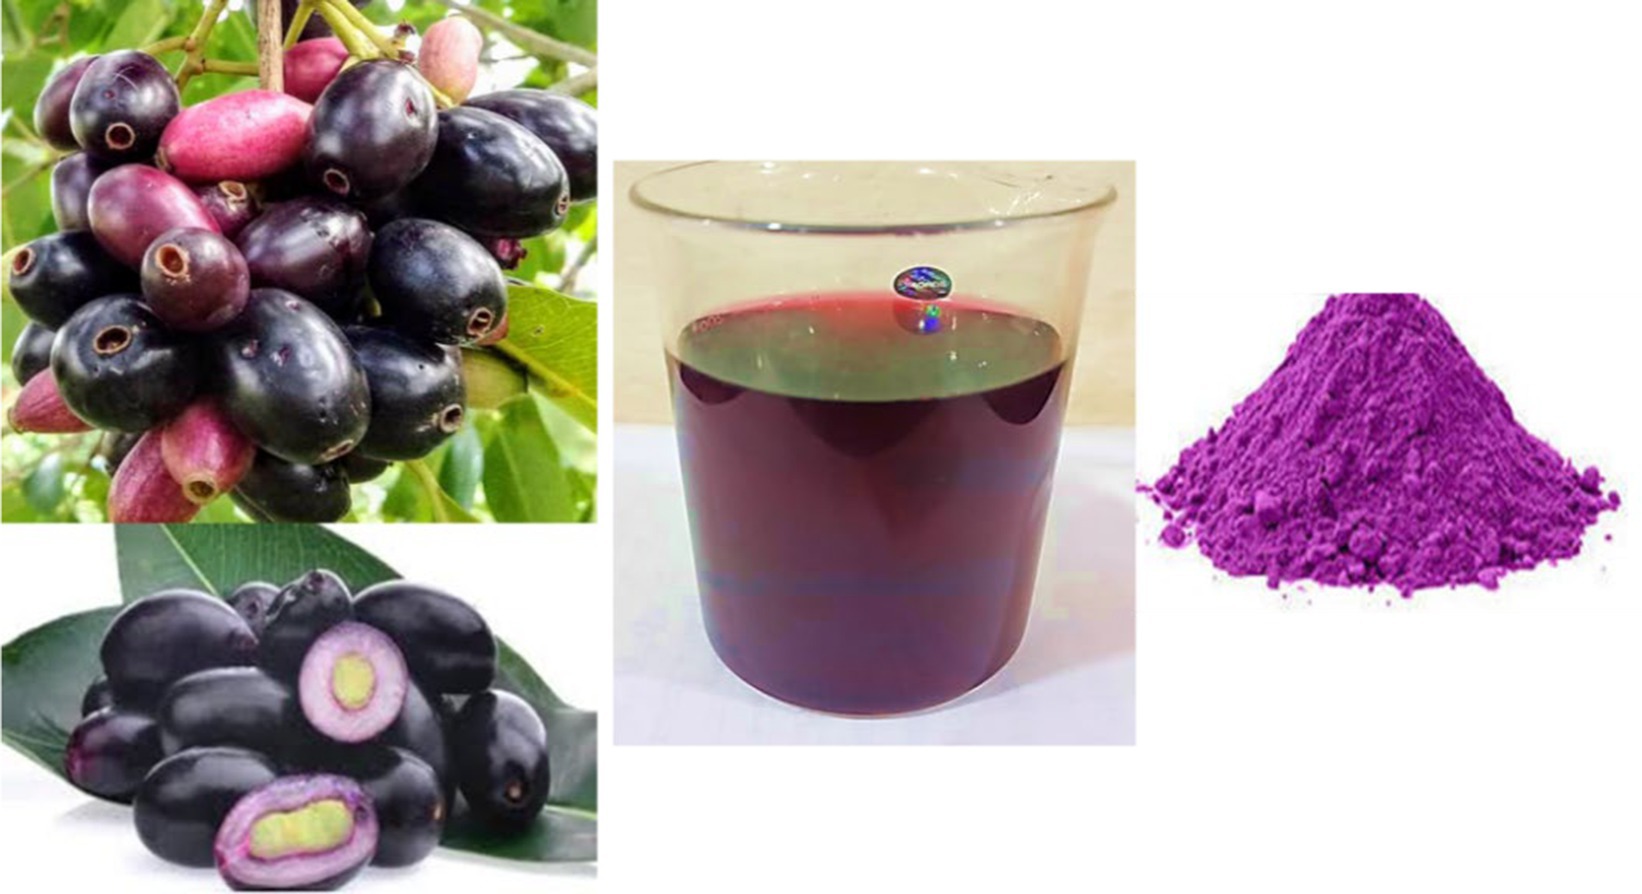
Figure 1. Picture of Jamun fruit, juice, and spray dried.
Soft cheese was made with minor modifications using the method described by Xue et al. (2020). One kilogram of soft cheese was prepared for each treatment. Six different treatments were prepared as follows; full-fat cheese without Jamun juice powder (T1; FF control), low-fat cheese without Jamun juice powder (T2; LF control), low-fat cheese with 4% Jamun juice powder (T3; LF 4% JJP), low-fat cheese with 8% Jamun juice powder (T4; LF 8% JJP), low-fat cheese with 12% Jamun juice powder (T5; LF 12% JJP), and low-fat cheese with 16% Jamun juice powder (T6; LF 16% JJP).
In brief, the fat content of fresh cow milk was standardized to be 3.2% and 1.2% fat. After standardization, milk was pasteurized at 85°C ± 1°C for 15 min, then cooled down to 36°C ± 1°C (Xue et al., 2020). Then, FF control (T1) and LF control (T2) were prepared with milk of 3.2% and 1.2% fat content, respectively. Other low-fat milk treatments (T3, T4, T5, and T6) were formulated with spray-dried JJP (LF-4%, 8%, 12%, and 16% JJP, respectively) and mixed vigorously using a commercial milk stirrer (MilkMan Dairy Equipment Pvt. Ltd., Panjab, India) until the powder was dispersed entirely. After mixing, all the sample were fermented with 1% NCDC-149 starter culture (National Collection of Dairy Culture, NDRI, Karnal, India). Renneting was done by adding 10 mL of calf chymosin (Nakoda Dairy Pvt. Ltd., Bengaluru, India) per 100 L of milk (210 IMCU per mL), stirring for 30 s to disperse the rennet, and incubating at 37°C ± 1°C for 8–10 h. After curd formation, it was cut and stirred, then heated at 65°C ± 1°C for 10 min and cooled at room temperature; then the whey was manually drained. Then, the cheese samples were weighed and labeled. Then, all six cheese samples were stored in plastic containers at 4°C ± 1°C until further investigation. Physicochemical attributes, color, textural and sensory responses of cheese were analyzed after 24 h of storage. Based on previous research data (El-Aziz et al., 2012; Motevalizadeh et al., 2018) and preliminary studies, the concentrations of Jamun juice powder were fixed. Preliminary experiments were conducted to determine the concentrations of Jamun juice powder to be added to the low-fat cheese based on factors such as taste, texture, and appearance.
The moisture content of milk, Jamun juice (JJ), MD, GA, JJP, and cheese was determined using the AOAC 920.124 method, as suggested by Sharafi et al. (2020). Each sample (approximately 5 g) was accurately weighed and placed in an oven at 105°C for 24 h. After drying, the dish was cooled in a desiccator, and the weight loss from moisture evaporation was calculated as a percentage of the initial sample weight. Protein content in milk, JJ, MD, GA, JJP, and cheese was analyzed using the AOAC method recommended by Sharafi et al. (2020). Each sample (2 g) was digested with concentrated sulfuric acid and a catalyst. Following digestion, the mixture was neutralized and diluted. Protein content was quantified by titration with a standardized sodium hydroxide solution. The protein content was reported as a percentage relative to the sample weight. The fat content of milk, JJ, MD, GA, JJP, and cheese was determined using the AOAC method (AOAC, 2005) as suggested by Lucan et al. (2020). Approximately 10 g of each sample was weighed and placed in a Soxhlet extraction apparatus with petroleum ether as the solvent. After a 6-h extraction, the solvent was evaporated, and the remaining fat was weighed. Fat content was expressed as a percentage of the sample weight. The ash content of milk, JJ, MD, GA, JJP, and cheese was determined using the AOAC method as suggested by Sharafi et al. (2020). Each sample (approximately 2 g) was weighed into a pre-weighed crucible and heated in a muffle furnace at around 550°C until all organic matter was burnt off. After cooling, the crucible was reweighed to calculate the ash content as a percentage of the sample weight. The milk, JJ, JJP, and cheese pHs were determined using an electronic digital pH meter (ELICO Ltd., Hyderabad, India). Total phenolic, anthocyanin content, ascorbic acid, and antioxidant activity of JJ and JJP were determined according to the methods proposed by Shelke et al. (2023). The color of JJ and JJP was evaluated by hunter color parameters (L*, a*, and b*) using a premier color scanning machine (Premium Color Scan, Japan).
The cheese extract for the TPC, TAC, and antioxidant activity analyses was prepared using the standard method used by Quoc (2020) and Morsy et al. (2022b). Briefly, a cheese sample (10 g) was taken in a 250 mL conical flask and homogenized with 20 mL of 80% methanol. The samples were then sonicated for 15 min and centrifuged at 5,000 rpm for 10 min. The supernatant was collected in a glass-sealed bottle and used for the analysis of TPC, TAC, and antioxidant activity.
Next, the total anthocyanin content (TAC) of soft cheese was determined using the pH differential method (Shelke et al., 2023), which involved the use of two buffer systems: potassium chloride buffer, pH 1.0 (0.025 M) and sodium acetate buffer, pH 4.5 (0.4 M). In brief, an extract of the cheese sample was mixed with 24 mL of the corresponding buffers and read against water as a blank at 510 and 700 nm using a spectrophotometer. The absorbance (A) was calculated as
The anthocyanin content was then calculated using the following equation:
Where TAC is the total anthocyanin content (mg/g), A is the absorbance, MW is the molecular weight of cyanidin-3-glucoside (449.2 g/mol), DF is the dilution factor (25), ɛ is the molar extinction coefficient (26,900 L/mol.cm), l is the path length (1 cm), and W is the weight of the cheese sample (g). A standard curve was plotted using cyanidin-3-glucoside as the standard compound, and the obtained equation was y = 0.0863x + 0.0122 (R2, 0.98), where y is the absorbance and x is the concentration of the standard.
Then, the total phenolic content (TPC) was determined according to the Folin Ciocalteau method (Quoc, 2020; Morsy et al., 2022b). The TPC was determined by adding 0.5 mL of the extract to 2.5 mL of the 0.2 N Folin Ciocalteau reagents and allowed to react for 5 min. Then, 2 mL of sodium carbonate (7.5% w/v) was added to the reaction mixture and diluted to 25 mL using distilled water. The mixture was incubated at room temperature for 60 min, and the absorbance was measured at 765 nm using a UV–Vis’s double-beam spectrophotometer. The gallic acid was used to produce a standard calibration curve, and the equation obtained was y = 0.0119x + 0.0123 (R2, 0.97), where y is the absorbance and x is the concentration of the standard. The total phenolic content was expressed in mg of gallic acid equivalents (GAE)/g per 100 g of lyophilized and subsequently into mg/g.
The antioxidant ability of soft cheese was assessed using the 1,1-diphenyl-2-picrylhydrazyl (DPPH) assay method (Quoc, 2020). To determine the antioxidant activity, 1 mL of the extract was added to 3 mL of DPPH solution. The mixture was then incubated at room temperature for 30 min, and the absorbance was measured at 517 nm using a spectrophotometer. The percentage of antioxidant activity was calculated using the following equation.
where A control is the absorbance of the control (DPPH solution without sample) and A sample is the absorbance of the sample.
Ascorbic acid was determined using 2,6-dichlorophenol indophenol dye (El-Aziz et al., 2012). Initially, 1 g of cheese samples was weighed and homogenized with 10 mL of 0.4% oxalic acid solution. The samples were then sonicated for 15 min and centrifuged at 5,000 rpm for 10 min. The supernatant was collected and used for the analysis of ascorbic acid. The ascorbic acid content was determined by adding 1 mL of the extract to 2 mL of 2,6-dichlorophenol indophenol dye solution and 1 mL of metaphosphoric acid (5% w/v) solution. The mixture was incubated at 37°C for 30 min, and the absorbance was measured at 515 nm using a spectrophotometer. A standard curve was plotted using ascorbic acid as the standard compound, and the obtained equation was y = 0.0092x + 0.0001 (R2, 0.95), where y is the absorbance and x is the concentration of the standard. The ascorbic acid content was expressed in mg/g.
The color of the cheese was evaluated using a color scan instrument (Premier Colorscan Instruments Pvt. Ltd., located in Mumbai, India). The color was measured in terms of L*, a*, b* values using the CIELAB (International Commission on Illumination) scale. The measurement was taken with a 10° observer and D65 illuminate, which is a standard procedure for color analysis. The light source used in food color measurement CIELAB (International Commission on Illumination) scale is typically D65, which represents a standardized daylight illuminant with a correlated color. The instrument works by focusing light onto the sample and then measuring the energy reflected across the visible spectrum. Prior to measuring the sample, the instrument was calibrated using calibration plates provided with the instrument. To confirm accuracy, a white tile with L*, a*, and b* values were also used (Sohany et al., 2022).
Soft cheese’s texture profile analysis (TPA) was executed using a universal testing machine (Model: AG-X, Shimadzu, Japan). A compression test was used to conduct the experiments, and the results produced a force (N) vs. time (s) plot. A 36-mm-diameter flat plate probe was mounted to a moving crosshead. Six samples (20 × 20 × 20 mm) were prepared from cheese using a metal borer at 4–6°C. Samples were compressed twice to 70% of their original height at a rate of 2 cm/min. The analysis was performed in a room-temperature environment. The texture profile curve was assessed based on six textural characteristics: firmness, adhesiveness, springiness, cohesiveness, chewiness, and gumminess. Hardness was defined as the maximum force required to compress the cheese sample to a given deformation, while cohesiveness was the ratio of the area under the second compression curve to the area under the first compression curve. Springiness was defined as the height the cheese sample returned to after the compression force was removed, while gumminess was the product of hardness and cohesiveness. Chewiness was defined as the product of hardness, cohesiveness, and springiness. Each test was performed three times (Lashkari et al., 2020). Adhesiveness describes a food’s propensity to adhere to surfaces during consumption, such as teeth or the roof of the mouth. It explains how strongly a food substance adheres or sticks together.
The cheese samples were evaluated using a standard method (Shelke et al., 2020). All samples were served in 50 g capacity paper cups and analyzed at 24°C under white lights. Panelists from the Department of Agricultural Process Engineering, MPKV, Rahuri were selected according to their prior experience conducting sensory responses of dairy products, specifically cheeses. Panels of 15 semi-trained judges were used to evaluate the cheese for sensory attributes using a 9-point hedonic scale. A 9-point hedonic scale ranges from extreme dislike (1) to extreme liking (9), with intermediate ratings indicating varying dislike, neutrality, and liking levels. The quality of functional soft cheese was assessed using sensory indicators like color, taste, aroma, texture, and overall acceptability.
SAS 9.1 (SAS Institute Inc., Cary, NC, United States) software was used to analyze statistical data and assess the significance of mean variations. Tukey multiple comparison tests with a 0.05 significance level (p ≤ 0.05) were used to compare all pairs of means and identify significantly different ones. The experiments were conducted in triplicate to ensure the reproducibility and validity of the results. Mean values with standard deviation (SD) were computed by using Microsoft Excel (Shelke et al., 2020).
Table 1 presented the proximate composition of full-fat milk, low-fat milk, whereas Table 2 presented the proximate composition of Jamun juice (JJ), MD, GA, and Jamun juice powder (JJP). The moisture content of low-fat milk (90.12% ± 0.7%) was significantly higher (p ≤ 0.05) than that of full-fat milk (88.40% ± 0.80%), while the fat content was significantly lower (p ≤ 0.05) in low-fat milk (1.20% ± 0.17%) compared to full-fat milk (3.60% ± 0.07%). This is consistent with previous research, which has shown that the removal of fat from milk results in a corresponding increase in moisture content (Lafta et al., 2019; Sharafi et al., 2019). Both full-fat milk and low-fat milk had similar levels of solids-not-fat (SNF) and total protein, which is consistent with previous studies (Lafta et al., 2019; Sharafi et al., 2019). The ash content was significantly lower (p ≤ 0.05) in low-fat milk (0.15% ± 0.19%) compared to full-fat milk (0.60% ± 0.11%). This may be due to the fact that Ash is typically found in the lipid fraction of milk and the removal of fat from low-fat milk may have led to a reduction in ash content (Sharafi et al., 2020). The total solids content of full-fat milk (12.16% ± 0.65%) was significantly higher than that of low-fat milk (10.12% ± 0.17%). The higher total solids content of full-fat milk is due to its higher fat content (Lafta et al., 2019; Sharafi et al., 2019). The pH and acidity of the two types of milk were not significantly different (p > 0.05). JJ had a higher moisture content (89.22% ± 0.69%) than MD, GA, and spray-dried JJP. The spray-drying process decreased the moisture content in spray-dried JJP by removing water from the juice, resulting in a more concentrated product. Previous studies reported a similar effect for Jamun juice powder spray drying (Singh et al., 2019; Shelke et al., 2023). JJ also had a higher fat (0.60% ± 0.07%) and protein (1.4% ± 0.17%) content than MD, GA, and spray-dried JJP. The spray-drying process decreased the fat and protein content in spray-dried JJP by degrading lipids and denaturing proteins. On the other hand, spray-drying increased the ash content in JJP (2.05% ± 0.12%) compared to JJ, MD, and GA by concentrating minerals during water removal. The pH of JJ (3.20 ± 0.04) was significantly lower than that of MD, GA, and spray-dried JJP. The spray-drying process lowered the pH of JJP compared to MD and GA by forming acidic compounds or adding acidifying agents to the juice. JJ also exhibited higher acidity (0.90% ± 0.75%) than MD, GA, and JJP. The spray-drying process reduced the acidity in JJP by losing volatile acids during drying. Jamun Juice had higher levels of TAC (14.8 ± 0.11 mg/g), TPC (33.8 ± 0.17 mg/g), and ascorbic acid (0.68 ± 0.26 mg/g) than GA, MD, and spray dried JJP. The spray-drying process reduced the TAC, TPC, and AsA in JJP by losing or degrading anthocyanin, phenolic, and ascorbic acid compounds during drying. Similarly, antioxidant activity was highest in JJ (75.13 ± 0.04%), followed by GA, MD, and spray-dried JJP. The spray-drying process reduced the antioxidant activity in JJP by losing or degrading bioactive phytochemical compounds during drying. A similar effect was observed for Jamun juice powder spray drying [30,28]. The color parameters L*, a*, and b* showed significant differences among the constituents. JJ had the lowest L* value (2.80 ± 0.06), indicating a dark color, while Maltodextrin and Gum Arabic had higher L* values, showing lighter colors. Spray-dried JJP (44.33 ± 0.08) had an intermediate L* value. The a* and b* values also varied significantly, with JJ having the highest a* value (20.23 ± 0.37) and the lowest b* value (−8.71 ± 0.03). These differences resulted from the processing methods used, such as water removal, denaturation, degradation, and loss of components during spray drying.
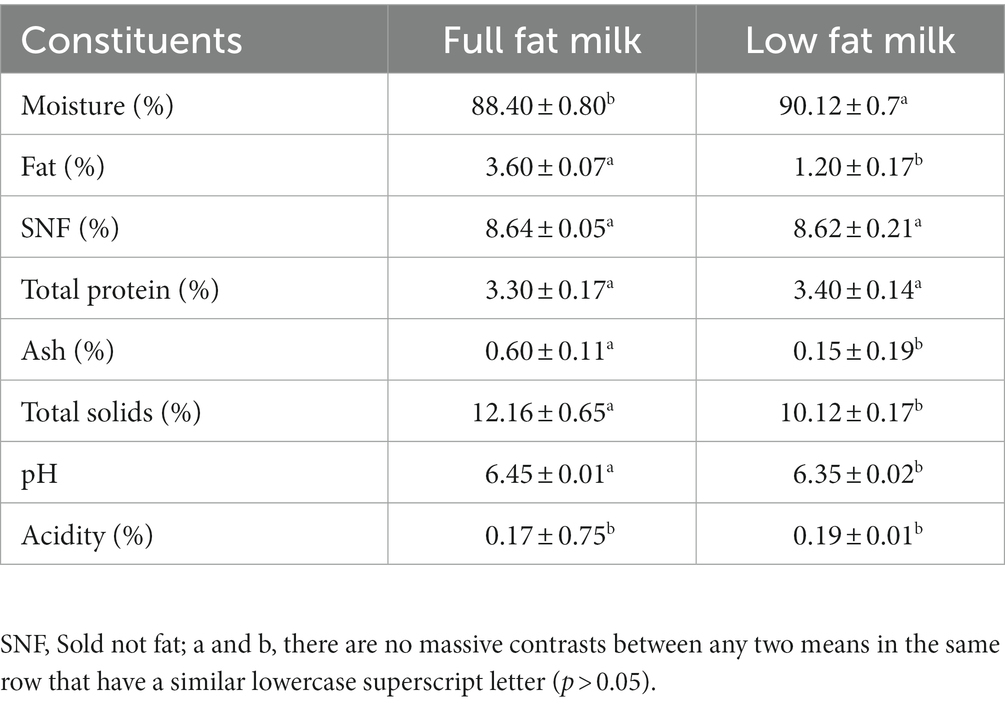
Table 1. Proximate composition of full-fat milk, low-fat milk, and spray-dried Jamun juice powder (mean ± SD, n = 3).
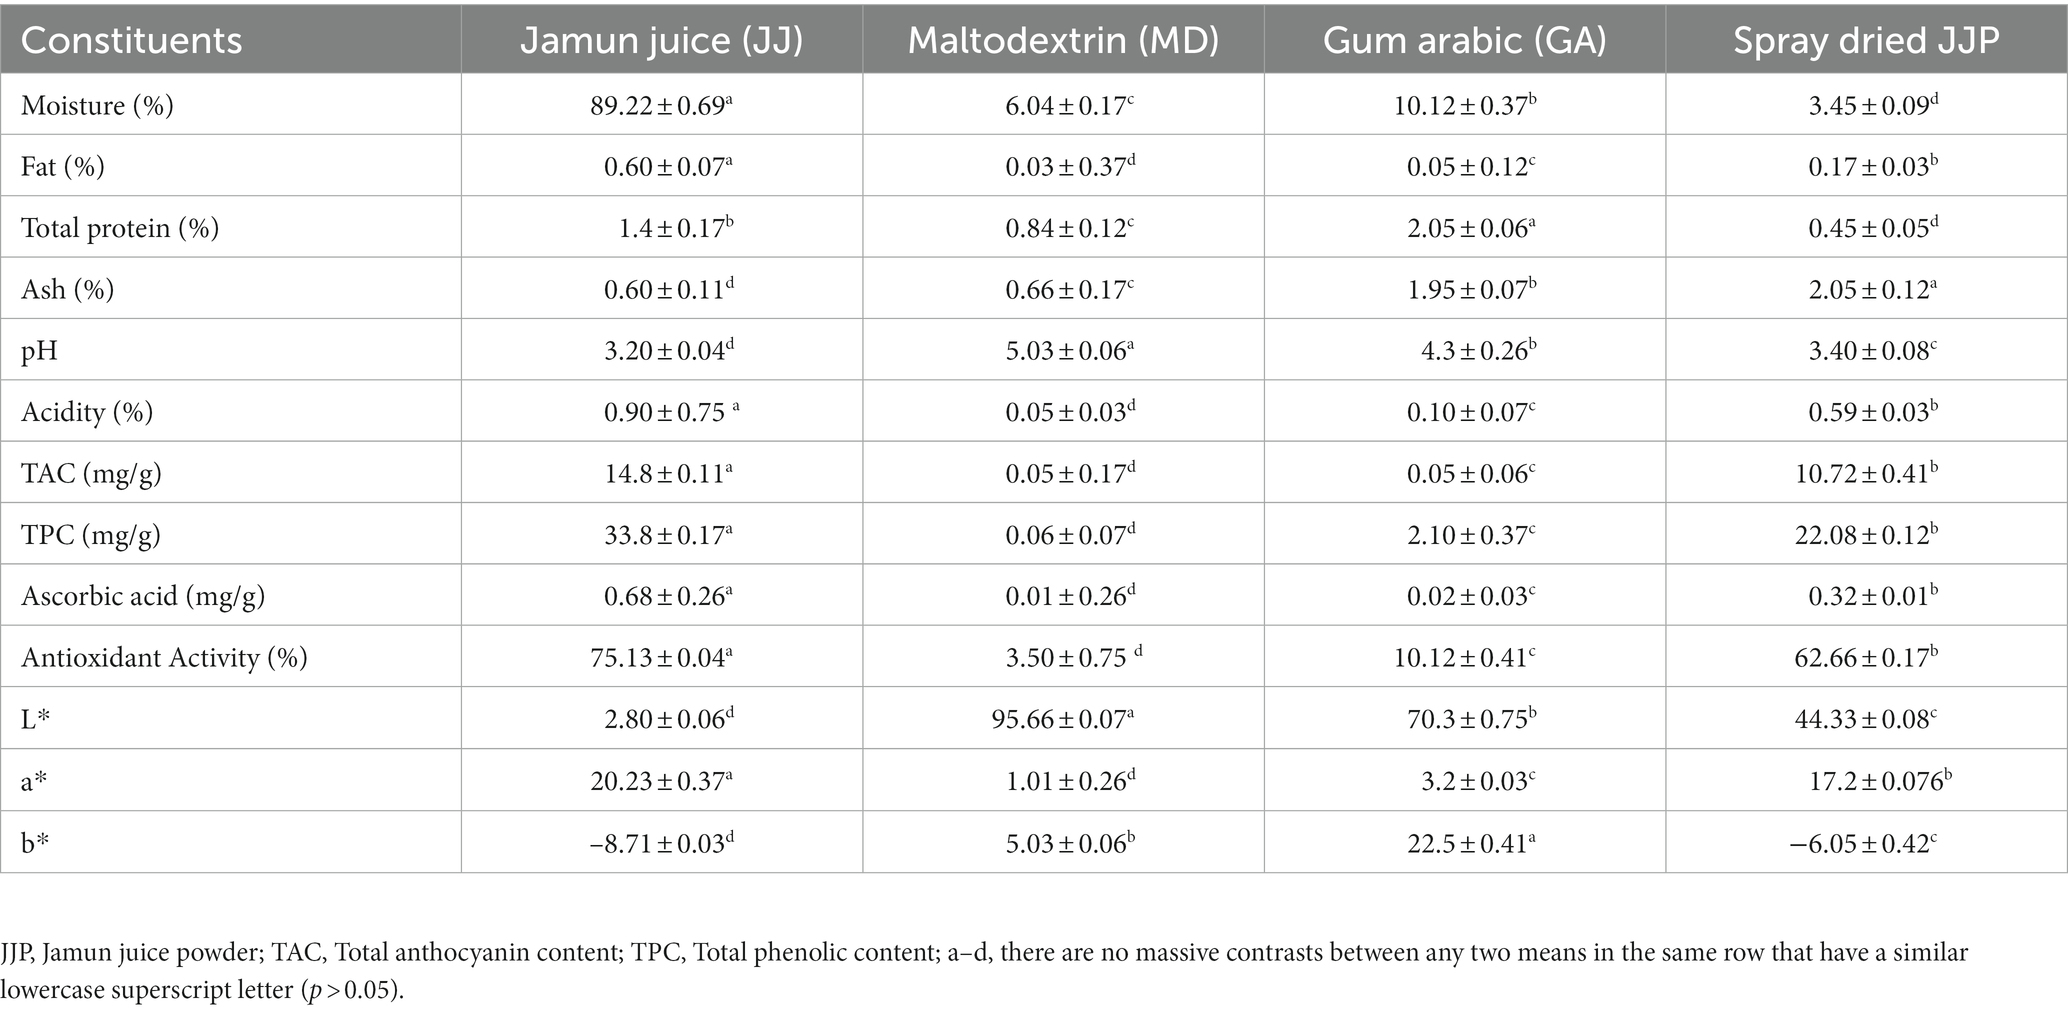
Table 2. Proximate composition of Jamun juice (JJ), maltodex-trin (MD), gum arabic (GA), and spray-dried Jamun juice powder (JJP; mean ± SD, n = 3).
Moisture content influences the textural properties, microbial growth, and degradative reactions of cheese (Togay et al., 2017). Whereas, the fat and protein present in cheese affect sensory attributes, especially flavor development, and mouth feel (Yashini et al., 2021). Figure 2 indicated that the moisture, fat, and protein content of soft cheese ranged from 57.35 to 68.50%, 9.70 to 22.02%, and 18.51% to 21.20%, respectively. The moisture content of the low-fat control soft cheese (T2; LFC) was remarkably higher (p ≤ 0.05) than that of the full-fat cheese (T1; FFC). Similar results were reported for low-fat cheddar cheese (Murtaza et al., 2016). However, moisture content increased remarkably (p ≤ 0.05) with the concentration of spray-dried JJP in the low-fat cheese treatments T3, T4, T5, and T6, respectively (Figure 2). As the JJP concentration increased, the percentage of moisture content increased significantly because of the hydrophilic properties of the maltodextrin and gum (Shelke et al., 2022). This may be attributed to the increased water-holding capacity of JJP at higher concentrations. Similar results were also reported for green chili pepper extract incorporated soft cheese (Ghanimah et al., 2018), low-fat UF feta cheese containing Xanthan gum, and guar gum as fat replacers (Rashidi et al., 2015). Cheese with higher moisture content tends to have a softer texture and milder flavor, while cheese with lower moisture content tends to have a firmer texture and stronger flavor (Nazari et al., 2020).
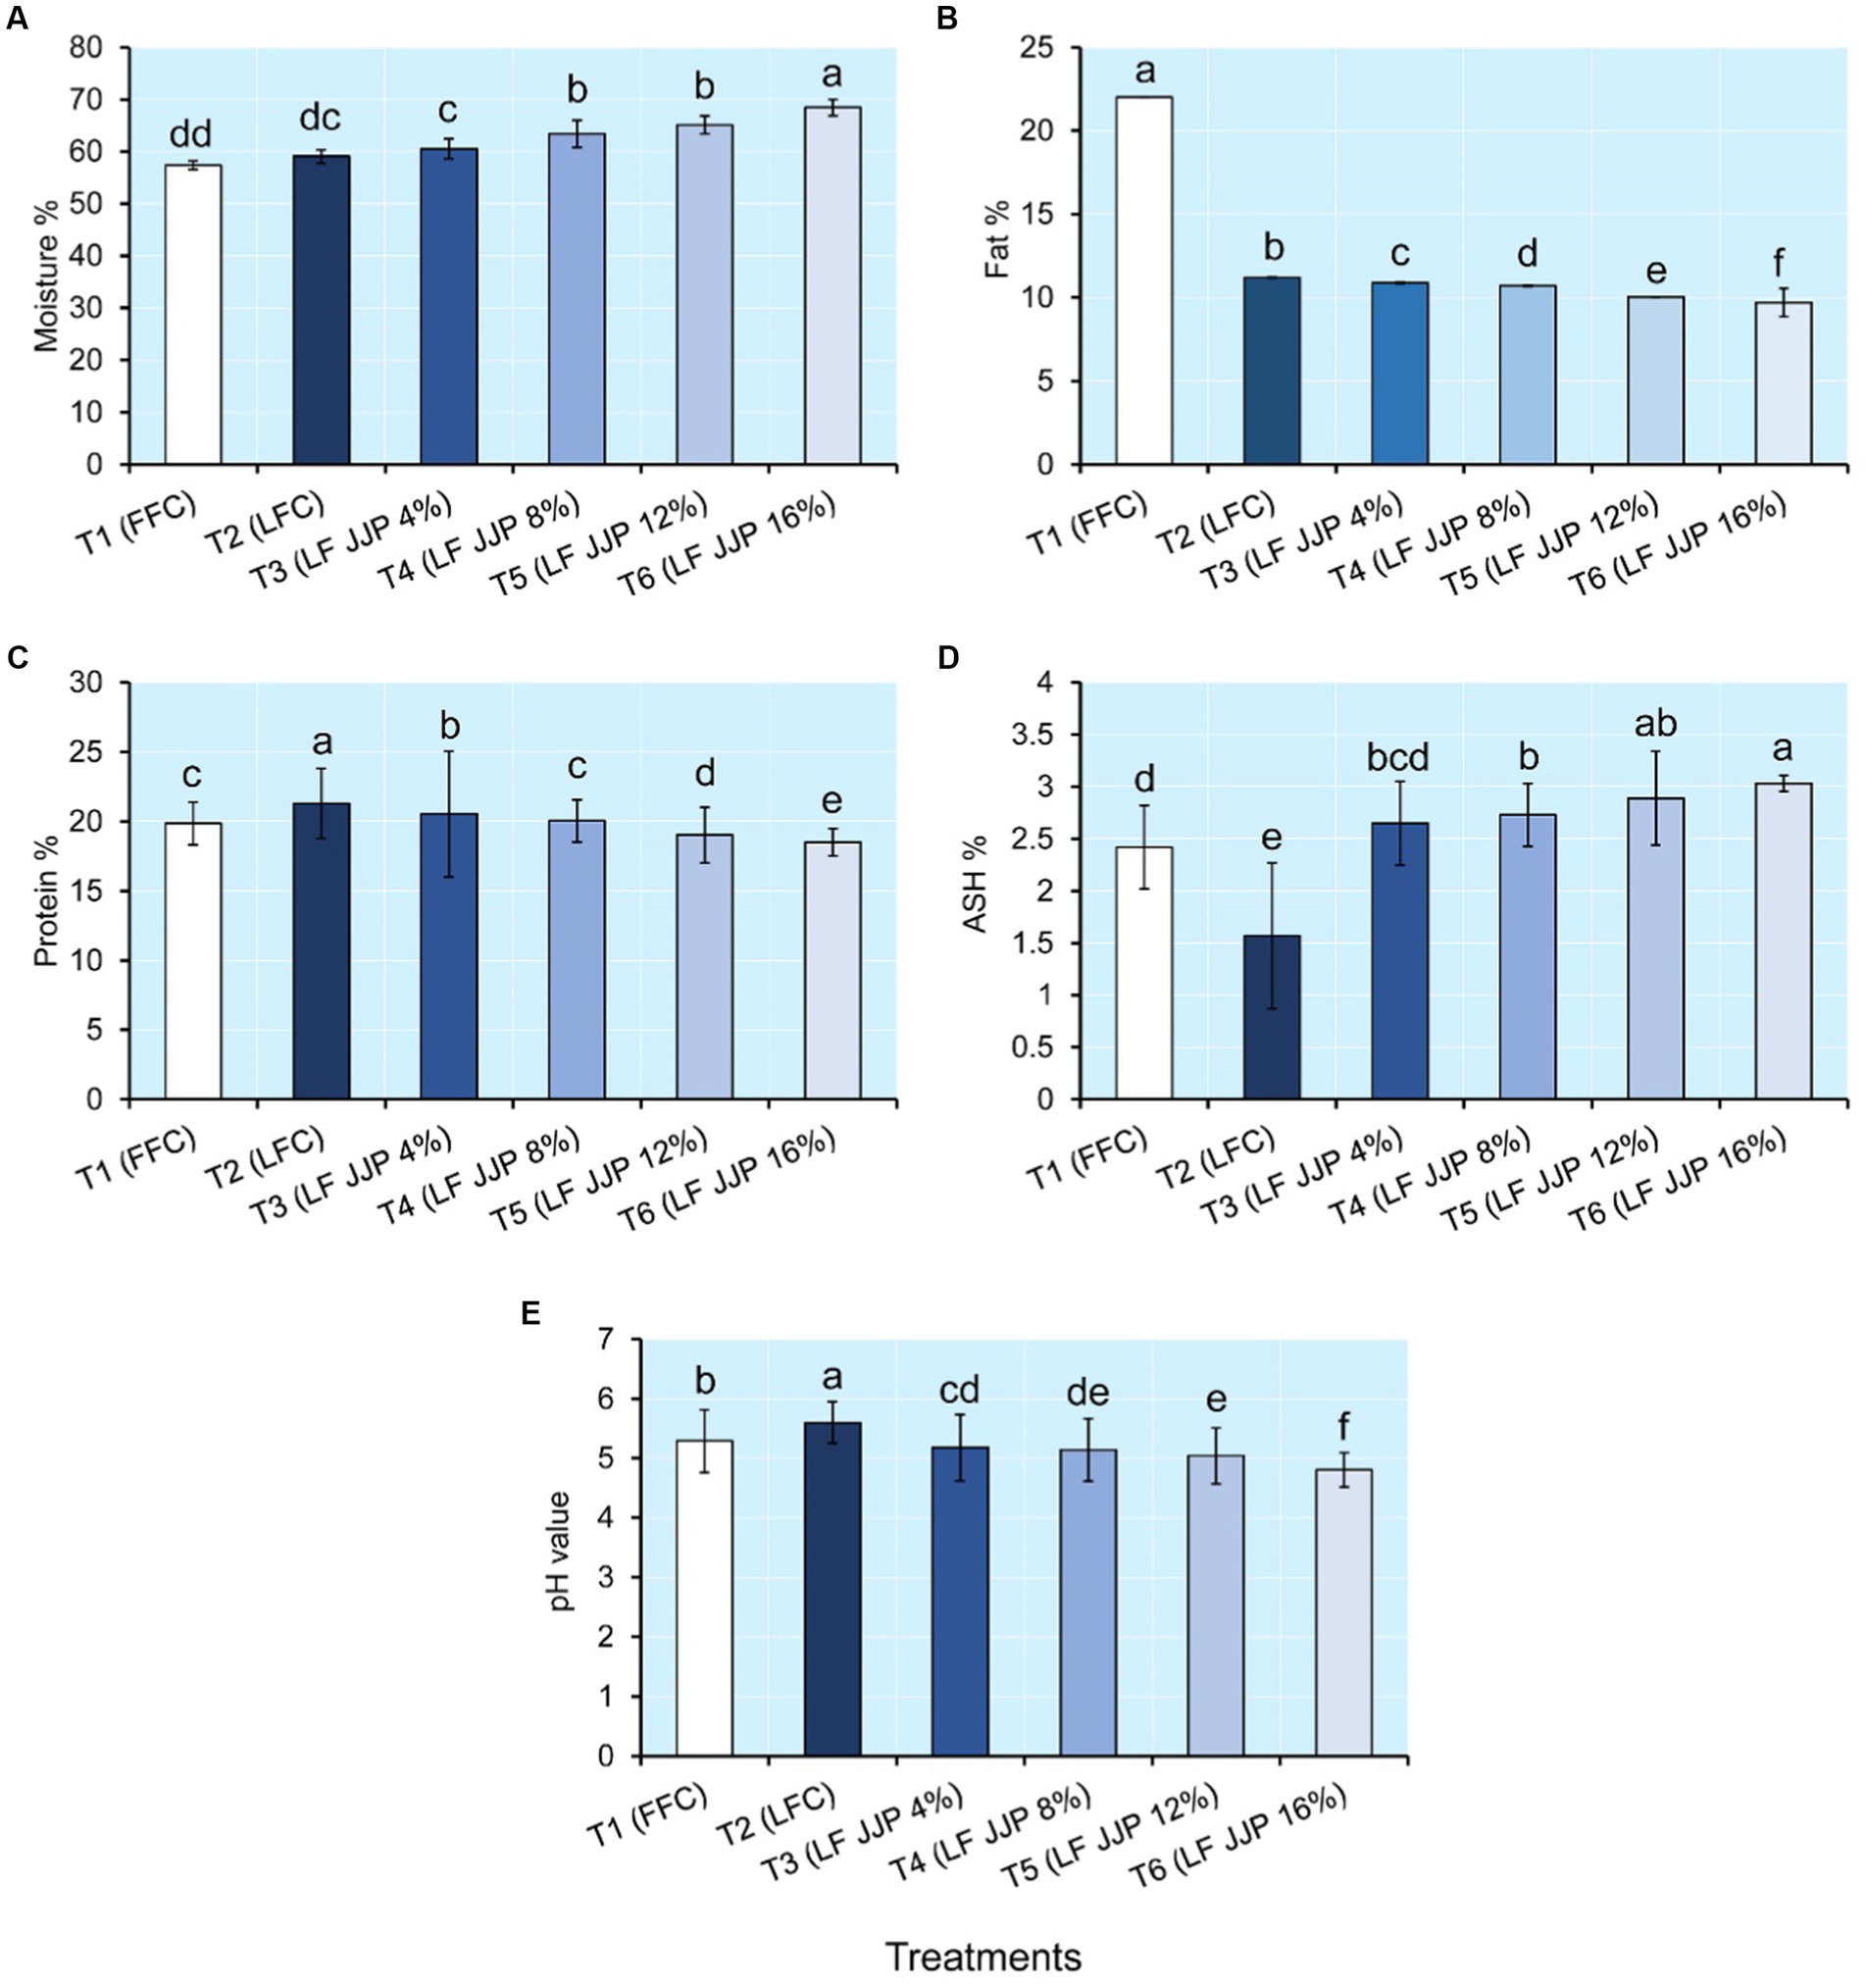
Figure 2. Changes in physicochemical attributes of low-fat cheese integrated with Jamun juice powder. (A) Moisture, (B) Fat, (C) Protein, (D) Ash, (E) pH. Data are presented as means ± SD. Groups with different letters are statistically significant at p≤ 0.05.
The treatment T1 (FFC), soft cheese contained 22.02% fat, and treatment T2 (LFC) had a fat content of 11.20%, which was significantly (p ≤ 0.05) decreased with Jamun juice powder concentrations 4%, 8%, 12%, and 16%, respectively (Figure 2). Similarly, the protein content of full-fat control cheese T1 (FFC) was found to be lower than that of low-fat cheese T2 (LFC). However, it decreased remarkably (p ≤ 0.05) with the concentration of spray-dried JJP in the low-fat cheese treatments T3, T4, T5, and T6, respectively (Figure 2). The fat and protein percentage of low-fat cheese diminished with an expansion in the concentration of Jamun juice powder, which could be attributed to the dilution effect due to increased moisture content. Similar results were also found for low-fat soft cheese incorporating maltodextrin (Nazari et al., 2020) and low-fat cheese incorporating xanthan gum and guar gum (Rashidi et al., 2015). Fat and water respond as fillers in the casein (CN) matrix of cheese texture (Kondyli et al., 2020). When fat is removed from cheese, its moisture and protein amounts increase. The removal of fat from cheese increases the relative proportion of moisture and protein in the final product, as the absence of fat results in a higher concentration of these components (Sharafi et al., 2020). However, as moisture cannot replace fat equally, there is a considerable decline in moisture in the nonfat ingredient in cheese with a decrease in fat content, which is linked with an increase in firmness. One of the best ways to boost the quality of low-fat cheese is to use fat substitutes with more hydrophilic groups (Murtaza et al., 2016). Maltodextrin is a mixture of glucose oligomers and polymers, whereas, gum arabic is a complex mixture of polysaccharides composed of galactose and arabinose units (Gomes et al., 2010). Maltodextrin and gum arabic gel can replace 16.7% to 50% of fat, depending on concentration (Hadnađev et al., 2011).
The ash content of foods represents their mineral content (Shelke et al., 2020). Figure 2 shows that the ash content of soft cheese ranged from 1.57% to 3.03%. The ash content of low-fat control cheese T2 (LFC) was remarkably (p ≤ 0.05) lower than that of full-fat cheese T1 (FFC). However, it increased remarkably (p ≤ 0.05) with the concentration of spray-dried JJP in the remaining low-fat cheese treatments T3, T4, T5, and T6, respectively, which could be attributed to the mineral content of Jamun juice powder. Similar results were observed for the ash improvements of UF soft cheese containing spinach powder (El-Sayed, 2020). Effat et al. (2018) revealed a similar decreasing trend in ash content for soft cheese incorporated with grapefruit extract. pH determines if cheese is soft or hard (Pastorino et al., 2003). Cheese is produced by coagulating milk proteins (mainly casein). Since pH affects the amount of casein hydration and proteolysis during cheesemaking, it significantly impacts cheese texture (Bansal and Veena, 2022). Proteolysis is the breakdown of proteins by enzymes found in cheese. The pH of the cheese influences these enzymes’ activity. Proteolysis may be accelerated at lower pH levels, producing softer textures. Cheese’s pH values primarily depend on the production method and the components present. Every cheese has a unique pH range; a pH between 4.6 and 4.9 is ideal for cream cheese (Lu et al., 2008). Normally, decreasing the pH of cheese results in a cheese with a softer texture. Figure 2 shows that the pH of soft cheese ranged from 4.80 to 5.60. The pH of low-fat control sample T2 (LFC) was remarkably (p ≤ 0.05) higher than that of full-fat cheese T1 (FFC). However, it decreased remarkably (p ≤ 0.05) with the concentration of spray-dried JJP in the remaining low-fat cheese treatments T3, T4, T5, and T6, respectively, which could be attributed to acidic compounds such as ascorbic acid, tannins, gallic acid and ellagic acid in the spray-dried Jamun juice powder. Similar results were also reported for cheese containing garlic paste (Sohany et al., 2022) and low fat-soft cheese with gum arabic (Lafta et al., 2019).
According to Table 3, the total anthocyanin, phenols, ascorbic acid, and antioxidant activity of soft cheese ranged from 0.12 to 0.22 mg/g, 0.44 to 0.80 mg/g, 0.03 to 0.056 mg/g, and 28.14% to 40.08%, respectively. TAC, TPC, ascorbic acid, and antioxidant activity were not detected in full-fat control T1 (FFC) and low-fat control T2 (LFC) soft cheese samples, which could be attributed to a lack of phytochemical substances in full-fat and low-fat milk. On the other hand, TAC, TPC, ascorbic acid, and antioxidant activity were increased remarkably (p ≤ 0.05) with the concentration of spray-dried JJP in the low-fat cheese treatments T3, T4, T5, and T6, respectively, Table 2. The increases in TAC, TPC, ascorbic acid, and antioxidant activity of low-fat cheeses incorporated in spray-dried Jamun juice powder are most likely due to phenolic compounds, anthocyanin, and vitamin C in the spray-dried JJP (Lashkari et al., 2020) found similar results in soft cheese containing pomegranate juice. Similar results were also reported for pizza cheese included with carrot extract (Motevalizadeh et al., 2018) and white soft cheese involved olive phenolic compounds (Farrag et al., 2020).

Table 3. TAC, TPC, Ascorbic acid (mg/g), and antioxidant ability of low-fat soft cheese incorporated with Jamun juice powder (mean ± SD, n = 3).
Color is a critical quality parameter that influences consumer choice (Togay et al., 2017). The color scores of soft cheese including lightness (L*), redness (a*). and yellowness (b*) at ranges of 49.11 to 81.34, 2.32 to 9.15, and −8.34 to 15.25, respectively, as depicted in Table 4. The L* score of LFC (T2) was notably lower (p ≤ 0.05) than that of FFC (T1). Similarly, the a* and b* scores of the FFC were remarkably lowered (p ≤ 0.05) than those seen in the LFC. Compared to low-fat control soft cheese, full-fat control soft cheese had a lighter color and a more translucent surface. The presence of fat, which gives the cheese its opacity, may be the cause of the lightness. Comparative outcomes were likewise noticed for LFC (Sohany et al., 2022), low-fat panela cheese (Amador-Espejo et al., 2021), and low-fat white-brined cheese (Kondyli et al., 2020).
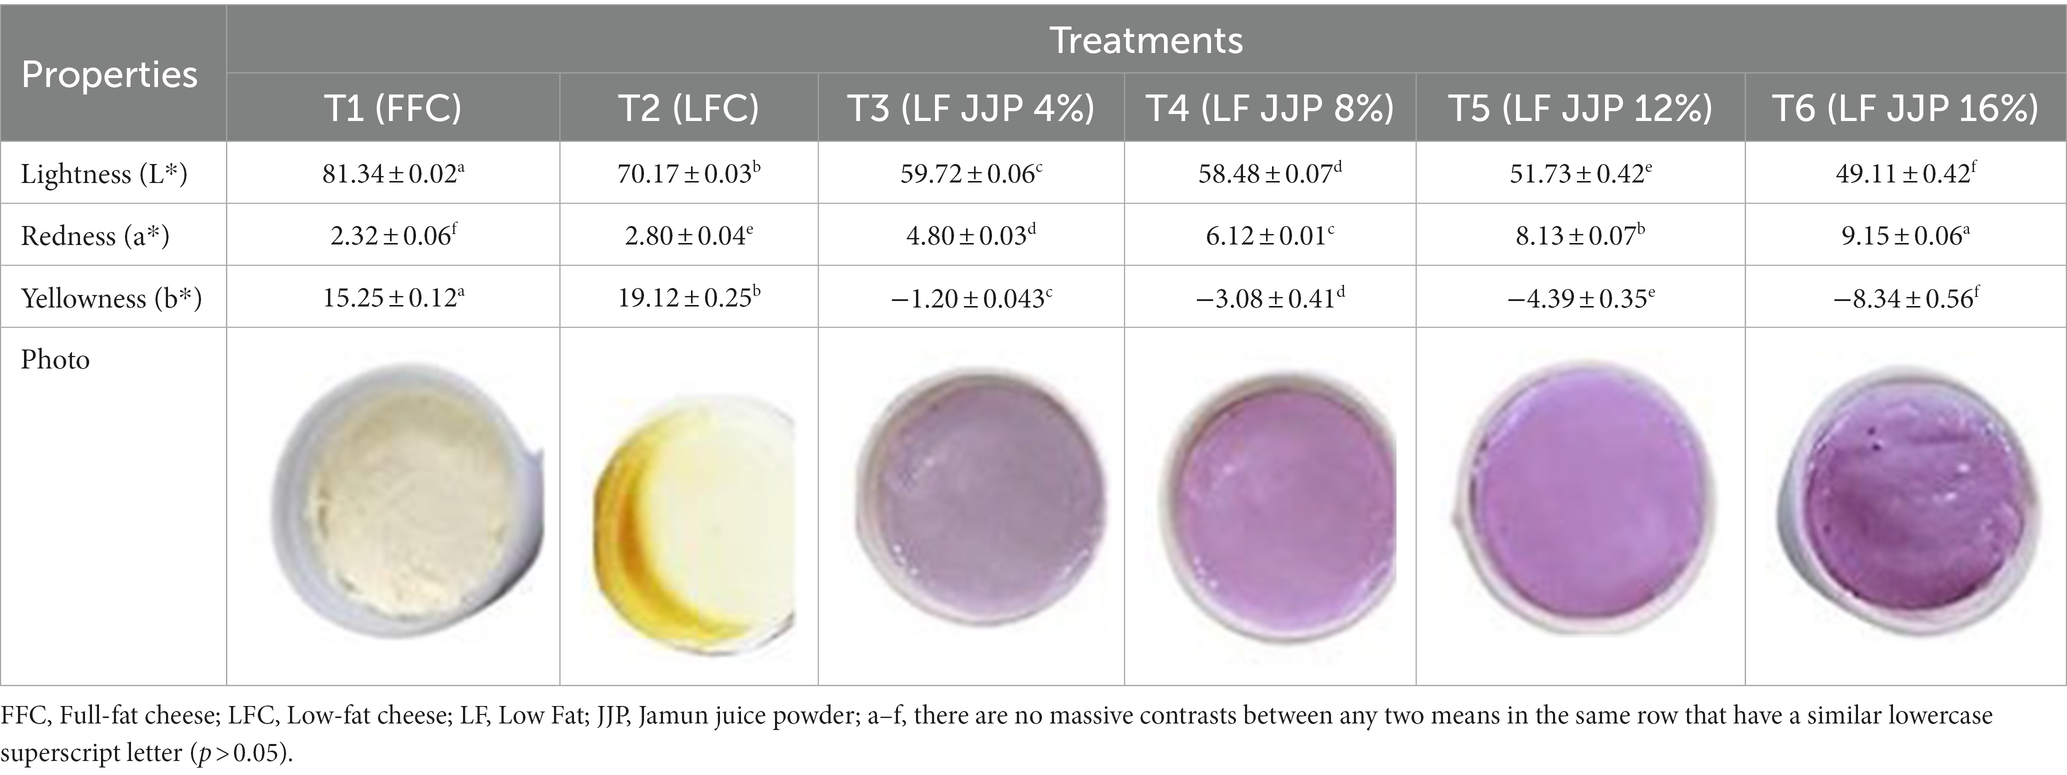
Table 4. Changes in color parameters of low-fat soft cheese incorporated with spray-dried Jamun juice powder (mean ± SD, n = 3).
The L* and b* score of low-fat soft cheese were markedly (p ≤ 0.05) decreased in coincidence with the increase of JJP accompanied by enhancement of the a* score. The anthocyanin compounds in JJP make the cheese less bright and less yellow while making it purple. Lashkari et al. (2020) reported a similar result for soft cheese incorporated with pomegranate juice; increasing the concentration increased the a* value and decreased the L* and b* values. Similar results were also observed for soft white cheese supplemented with encapsulated olive phenolic compounds (Farrag et al., 2020), yogurt with strawberry juice (Rahman et al., 2020), UF-soft cheese containing spinach powder (El-Sayed, 2020), green chili pepper extract incorporated soft cheese (Ghanimah et al., 2018), fruit and vegetable by-products fortify spreadable cheese (Lucera et al., 2018), and cheese supplemented with powdered microcapsules of tomato extracts and bell pepper juices based functional processed cheese (Atwaa et al., 2020; Morsy et al., 2022a).
The texture of the cheese is a significant component in determining its overall quality (Tarakçı and Deveci, 2019) it is a composite of several factors, such as the firmness, cohesion, chewiness, springiness, and gumminess of the product (Lashkari et al., 2020). Table 5. shows firmness, cohesiveness, adhesiveness, springiness, gumminess, and chewiness of soft cheese ranging from 907 to 2,001 g, 0.54 to 0.70, 0.92 to 1.49 mg, 3.23 to 5.13 mm, 516 to 712 g, and 31.51 to 45.33, respectively. The firmness, cohesiveness, springiness, gumminess, and chewiness of the low-fat control soft cheese (T2; LFC) were remarkably higher (p ≤ 0.05) than those of the full-fat cheese (T1; FFC). The maximum firmness, cohesiveness, springiness, gumminess, and chewiness observed for low-fat soft cheese could be credited to a higher protein percentage in low-fat milk. The higher the protein content, the more cohesive and firmer the cheese (Lafta et al., 2019). The decrease in the springiness of the protein matrix causes a decrease in the springiness of cheese (Sharafi et al., 2020). The protein matrix’s elasticity reduction is influenced by fat in the protein structure. However, the adhesiveness of the low-fat control soft cheese (T2; LFC) was remarkably lower (p ≤ 0.05) than that of the full-fat cheese (T1; FFC). Cheese with less protein and a higher fat content melts more quickly, contributing to the cheese’s increased adhesiveness (Lafta et al., 2019). Reducing fat makes the protein matrix thicker and less adhesive. However, firmness, cohesiveness, springiness, gumminess, and chewiness for low-fat cheese samples fortified with spray-dried Jamun juice decreased remarkably (p ≤ 0.05) with JJP levels of 4%, 8%, 12%, and 16%, respectively. The decrease in firmness, cohesiveness, springiness, gumminess, and chewiness of low-fat cheese fortified with spray-dried Jamun juice powder is due to maltodextrin and gum Arabic’s water-binding and water-retention properties. The moisture acts as a lubricant, making cheese easier to break and softer in texture. Sharafi et al. (2020) found that water molecules in a three-dimensional protein network weaken the structure of the protein. On the other hand, the adhesiveness of low-fat soft cheese increased as Jamun juice powder concentration increased (Table 4). As the amount of fat and hydrocolloids in cheese increases, the protein matrix structure becomes more open and weaker, while the cheese becomes more adhesive. Similar results were observed for cream cheese as influenced by modified starch (Mehanna et al., 2021), low-fat cheese containing novel gum (Sharafi et al., 2020), low-fat-soft cheese with Arabic gum (Lafta et al., 2019), and soft unripened cheese supplemented with tapioca maltodextrin (Iakovchenko and Arseneva, 2016).
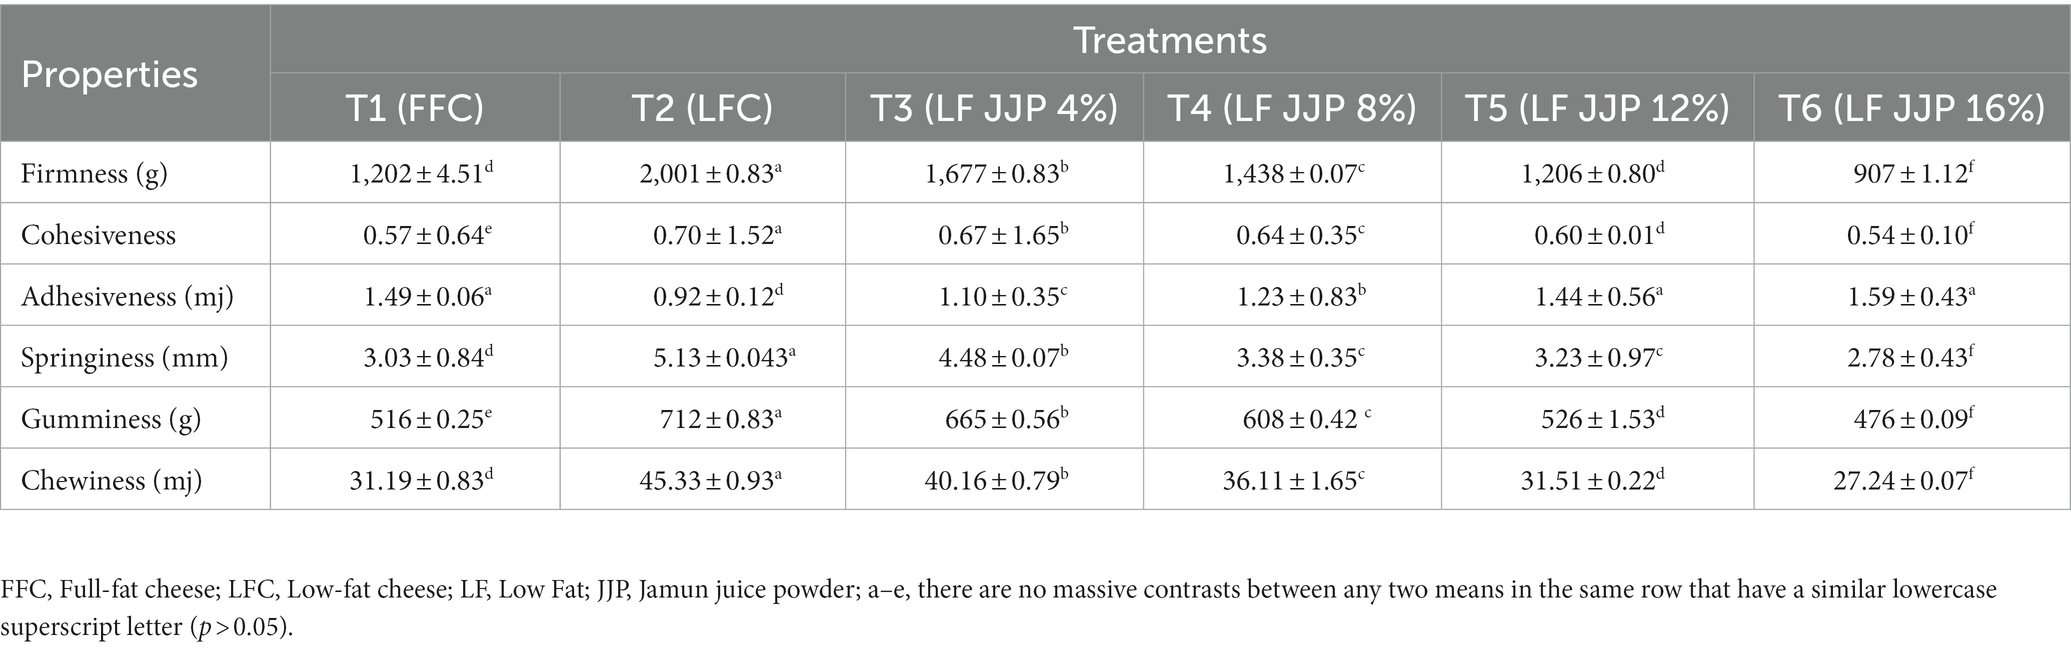
Table 5. Textural profile of low-fat soft cheese incorporated Jamun juice powder (mean ± SD, n = 3).
Sensory assessment is a significant metric for determining the quality of food products based on acceptability (Lafta et al., 2019). The soft cheeses were evaluated in terms of color, flavor, aroma, texture, and overall acceptability. Figure 3 shows the average sensory scores for both full-fat soft cheese and spray-dried JJP-fortified low-fat soft cheese. In this analysis, full-fat control T1 (FFC) obtained significantly (p ≤ 0.05) higher scores on all sensory tests than low-fat control cheese T2 (LFC) because fat enhances color, taste, texture, and overall acceptability. Similar results were also reported for soft cheese (Lashkari et al., 2020), low-fat cheese (Sharafi et al., 2020), and low-fat soft cheese (Lafta et al., 2019). However, the color and aroma score of low-fat soft cheese remarkably (p ≤ 0.05) increased as the concentration of Jamun juice powder increased (4%, 8%, 12%, and 16%, respectively). At the same time, the taste and texture score of low-fat soft cheese significantly (p ≤ 0.05) increased to T5 (LF-12% JJP) and then decreased afterward. Taste score decreases after 12% JJP concentration could be attributed to increased starch flavor and an astringent mouth feel. Reducing the textural score after 12% JJP concentration reduced the viscosity above the acceptable limit. In terms of overall acceptability, the low-fat soft cheese T5 (LF-12% JJP) made with a 12% Jamun juice powder concentration was very close to the full-fat cheese samples T1 (FFC; Figure 3). This indicates that soft cheese made with spray-dried Jamun juice powder could be accepted by consumers.
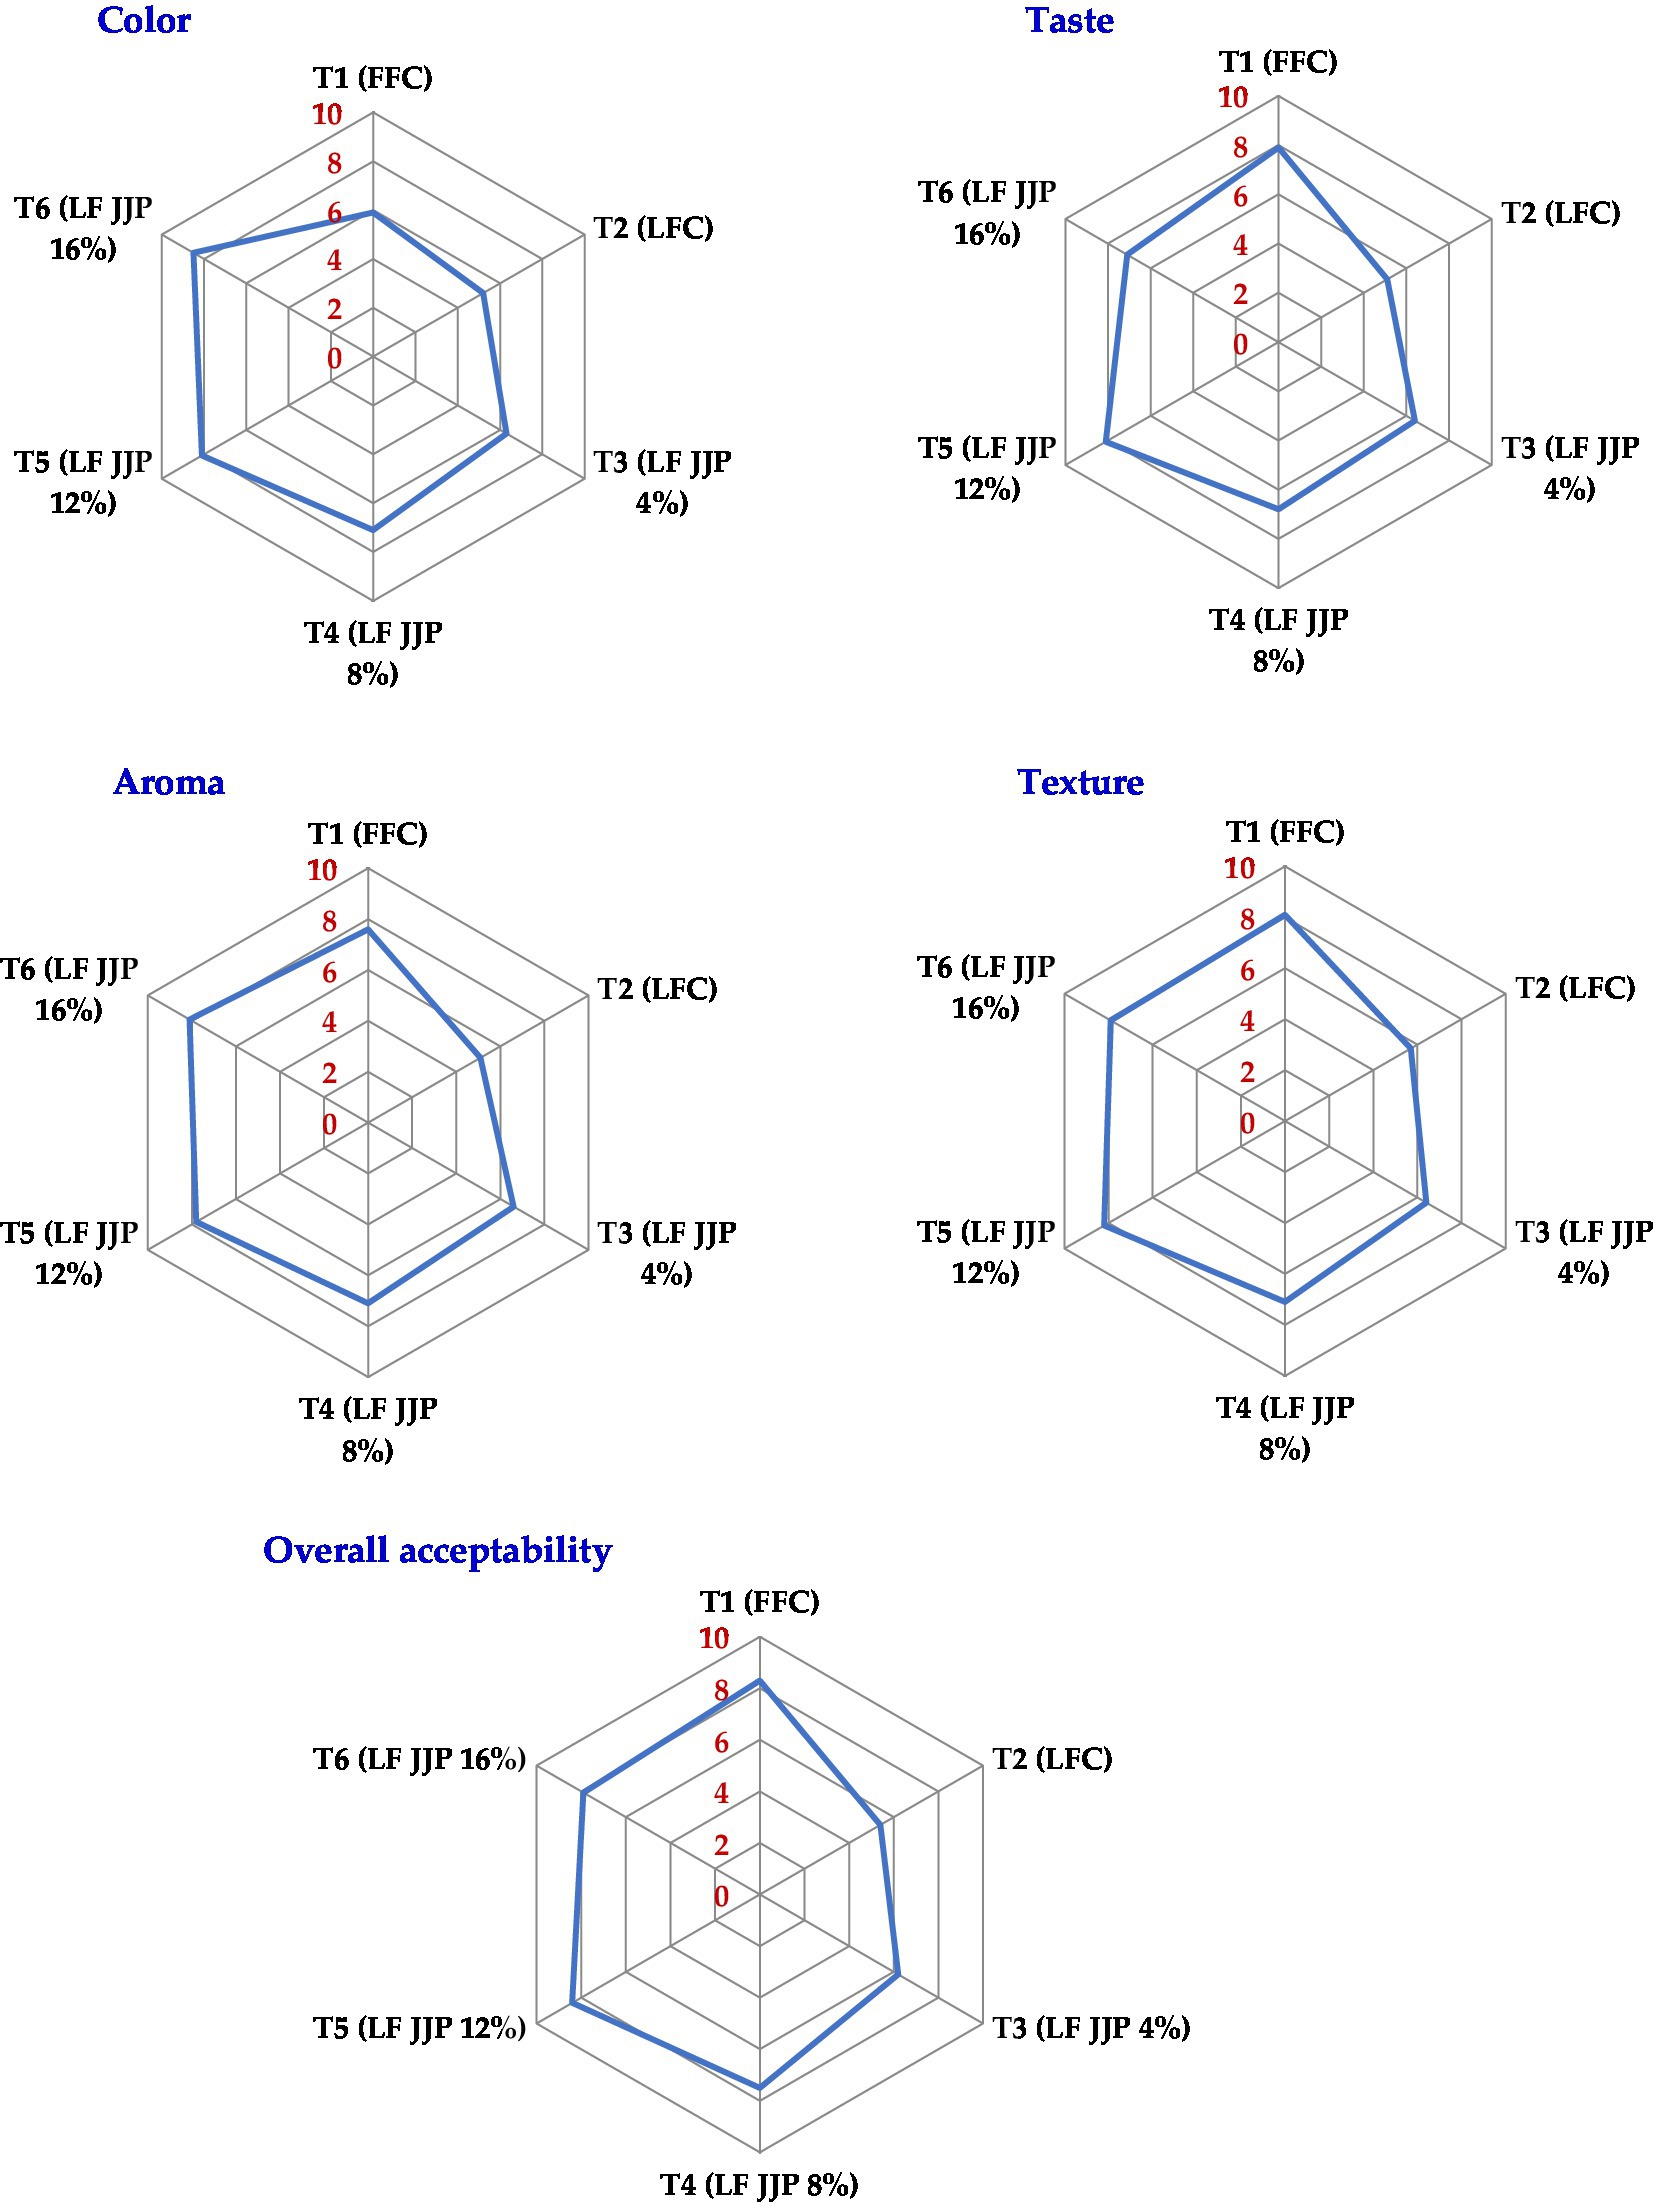
Figure 3. Effect of JJP addition on sensory responses (color, taste, aroma, texture, and overall acceptability) of low-fat soft cheese.
The current study revealed that JJP had a high content of total antioxidant capacity, total phenolic content, ascorbic acid, and antioxidants. The addition of spray-dried JJP at various concentrations showed promising results in enhancing the bioactive compounds, physicochemical attributes, color, texture, and organoleptic quality of soft cheese. Importantly, the sensory acceptability of the soft cheese treatments was significantly improved. Therefore, the use of JJP at 12% could be a promising replacement material for low-fat soft cheese, enriched with antioxidant and anthocyanin contents, and could help to improve the quality and acceptability as well as the health benefits of soft cheese, which can be beneficial to the food industry and consumers alike. Further research is needed to investigate the stability and shelf-life of soft cheese enriched with JJP and to explore its potential applications in other dairy products.
The original contributions presented in the study are included in the article/supplementary material, further inquiries can be directed to the corresponding authors.
GS, VK, GY, RK, and MM: conceptualization. GS, VK, GY, SA-D, and MH: methodology. GS, AhA, SI, FI, GY and LF: software. GS, SI, FI, HG, and LF: validation. GS, AhA, SI, FI, LF, HG, and MH: formal analysis. GS, VK, GY, and SA-D: investigation. VK, AhA, SI, FI, HG, and LF: resources. GS, AdA, LF, HG, VK, and MH: data curation. GS, VK, SI, FI, and LF: writing—original draft preparation. GS, AhA, AdA, LF, HG, VK, and MH: writing—review and editing. GS, AhA, SI, VK, and MH: visualization. GS: supervision. MH and VK: project administration. SI and LF: funding acquisition. All authors contributed to the article and approved the submitted version.
This work was supported by the Deanship of Scientific Research at King Khalid University through large group Research Project under grant number RGP2/435/44 and by the Princess Nourah bint Abdulrahman University Researchers Supporting Project number (PNURSP2023R127), Princess Nourah bint Abdulrahman University, Riyadh, Saudi Arabia. Moreover, this paper is published from the project 6PFE of the University of Life Sciences “King Mihai I” from Timisoara and Research Institute for Biosecurity and Bioengineering from Timisoara.
The authors acknowledge the research facilities provided by Dr. A.S. College of Agricultural Engineering and Technology, Mahatma Phule Krishi Vidyapeeth, Rahuri, and Chhatrapati Shahu Maharaj Research Training and Human Development Institute (SARTHI), Pune, Maharashtra, India, to carry out this research work. The authors also extend their appreciation to the Deanship of Scientific Research at King Khalid University for funding this work through a large group Research Project under grant number RGP2/435/44. Additionally, the appreciation is extended to the Princess Nourah bint Abdulrahman University Researchers Supporting Project number (PNURSP2023R127), Princess Nourah bint Abdulrahman University, Riyadh, Saudi Arabia. Dr. P. G. Patil (Vice-Chancellor, Mahatma Phule Krishi Vidyapeeth, Rahuri) and Shivani Desai (Department of Food Engineering, National Institute of Food Technology Entrepreneurship and Management, India) were also acknowledged for their continual support in implementing this work.
The authors declare that the research was conducted in the absence of any commercial or financial relationships that could be construed as a potential conflict of interest.
All claims expressed in this article are solely those of the authors and do not necessarily represent those of their affiliated organizations, or those of the publisher, the editors and the reviewers. Any product that may be evaluated in this article, or claim that may be made by its manufacturer, is not guaranteed or endorsed by the publisher.
Agarwal, P., Gaur, P., Tyagi, N., Puri, D., Kumar, N., and Kumar, S. (2019). An overview of phytochemical, therapeutic, pharmacological and traditional importance of Syzygium cumini. Asian J Pharmacogn 3, 5–17.
Aguilar-Raymundo, V. G., Ramírez-Murillo, J. I., and Barajas-Ramírez, J. A. (2022). Assessing the yield, physicochemical, sensory characteristics, and acceptance of queso fresco added with whey cheese. Int. J. Food Sci. Technol. 57, 6038–6045. doi: 10.1111/ijfs.15956
Amador-Espejo, G. G., Ruiz-Lopez, I. I., Gibbens-Bandala, P. J., Delgado-Macuil, R. J., and Ruiz-Espinosa, H. (2021). Thermosonicated whey protein concentrate blends on quality attributes of reduced fat panela cheese. Ultrason. Sonochem. 76:105621. doi: 10.1016/j.ultsonch.2021.105621
Anonymous (2022). Low fat cheese market size, share & trends analysis report 2019–2025. Available at: https://www.grandviewresearch.com/industry-analysis/low-fat-cheese-market. (Accessed 25 December 2022).
AOAC (2005). Official methods of analysis of AOAC Inter- national. Vol. II. Methods of analysis (18th ed.). Gaith- ersburg, MD, USA: Association of Official Analytical Chemists
Atwaa, E., Ramadan, M. F., and El-Sattar, A. (2020). Production of functional spreadable processed cheese supplemented with sweet red pepper paste. J Food Dairy Sci 11, 127–132. doi: 10.21608/jfds.2020.102741
Ayenampudi, S. B., Verma, R., and Adeyeye, S. A. O. (2022). The potential health benefits and food applications of jamun (Syzygium cumini L.), an indigenous fruit of India. Nutr Food Sci 53:146. doi: 10.1108/NFS-05-2022-0146
Bansal, V., and Veena, N. (2022). Understanding the role of pH in cheese manufacturing: general aspects of cheese quality and safety. J. Food Sci. Technol., 1–11. doi: 10.1007/s13197-022-05631-w
Bhat, S., Saini, C. S., Kumar, V., and Sharma, H. K. (2021). Spray drying of bottle gourd juice: effect of different carrier agents on physical, antioxidant capacity, reconstitution, and morphological properties. ACS Food Sci Technol 1, 282–291. doi: 10.1021/acsfoodscitech.0c00041
Calligaris, S., Ignat, A., Biasutti, M., Innocente, N., and Nicoli, M. C. (2015). Cheese fortification using saturated monoglyceride self-assembly structures as carrier of omega-3 fatty acids. Int. J. Food Sci. Technol. 50, 2129–2134. doi: 10.1111/ijfs.12877
Chen, Y., She, Y., Zhang, R., Wang, J., Zhang, X., and Gou, X. (2020). Use of starch-based fat replacers in foods as a strategy to reduce dietary intake of fat and risk of metabolic diseases. Food Sci. Nutr. 8, 16–22. doi: 10.1002/fsn3.1303
Effat, B., Hassan, Z. M. R., Mabrouk, A. M. M., Sadek, Z. I. M., Magdoub, M. N. I., and Tawfik, N. F. (2018). Properties of low salt soft cheese supplemented with probiotic cultures. Int J Adv Res Biol Sci 5, 1–10. doi: 10.22192/ijarbs.2018.05.02.001
El-Aziz, M. A., Mohamed, S. H., and Seleet, F. L. (2012). Production and evaluation of soft cheese fortified with ginger extract as a functional dairy food. Polish J Food Nutr Sci 62, 77–83. doi: 10.2478/v10222-011-0046-0
El-Sayed, S. M. (2020). Use of spinach powder as functional ingredient in the manufacture of UF-soft cheese. Heliyon 6:e03278. doi: 10.1016/j.heliyon.2020.e03278
Farrag, A. F., Zahran, H. A., Al-Okbay, M. F., El-Sheikh, M. M., and Soliman, T. N. (2020). Physicochemical properties of white soft cheese supplemented with encapsulated olive phenolic compounds. Egypt. J. Chem. 1, 2921–2931. doi: 10.21608/ejchem.2020.23381.2388
Ghanimah, M., Hanafy, N., Hassanein, A., and Hashim, M. (2018). Utilisation of water extract of green chilli pepper in the manufacture of low-fat fresh cheese. Int. J. Dairy Technol. 71, 693–698. doi: 10.1111/1471-0307.12505
Gholamhosseinpour, A., Mazaheri Tehrani, M., and Razavi, S. M. A. (2018). Optimization of textural characteristics of analogue UF-feta cheese made from dairy and non-dairy ingredients. Iran J Food Sci Technol Res 13, 80–91. doi: 10.22067/ifstrj.v1396i0.59349
Gomes, J. F., Rocha, S., Pereira, D. C., Peres, I., Moreno, S., Toca-Herrera, J., et al. (2010). Lipid/particle assemblies based on maltodextrin–gum arabic core as bio-carriers. Colloids Surf. B Biointerfaces 76, 449–455. doi: 10.1016/j.colsurfb.2009.12.004
Hadnađev, M., Dokić, L., Hadnađev, T. D., Pajin, B., and Krstonošić, V. (2011). The impact of maltodextrin-based fat mimetics on rheological and textural characteristics of edible vegetable fat. J. Texture Stud. 42, 404–411. doi: 10.1111/j.1745-4603.2011.00302.x
Hell, A., Labrie, S., and Beaulieu, L. (2018). Effect of seaweed flakes addition on the development of bioactivities in functional camembert-type cheese. Int. J. Food Sci. Technol. 53, 1054–1064. doi: 10.1111/ijfs.13681
Iakovchenko, N. V., and Arseneva, T. P. (2016). Tapioca maltodextrin in the production of soft unripened cheese. Acta Sci. Pol. Technol. Aliment. 15, 47–56. doi: 10.17306/J.AFS.2016.1.5
Jeong, H., Lee, Y.-K., Ganesan, P., and Kwak, H.-S. (2017). Food science of animal resources ties of Queso Blanco cheese supplemented with powdered microcapsules of tomato extracts. Korean J. Food Sci. Anim. Resour. 37, 342–350. doi: 10.5851/kosfa.2017.37.3.342
Kapoor, S., and Ranote, P. S. (2016). Antioxidant components and physico-chemical characteristics of jamun powder supplemented pear juice. J. Food Sci. Technol. 53, 2307–2316. doi: 10.1007/s13197-016-2196-x
Kondyli, E., Pappa, E. C., Kremmyda, A., Arapoglou, D., Metafa, M., Eliopoulos, C., et al. (2020). Manufacture of reduced fat white-brined cheese with the addition of β-glucans biobased polysaccharides as textural properties improvements. Polymers 12, 1–16. doi: 10.3390/polym12112647
Koranteng, B. A., Omojola, A. B., Awodoyin, O. R., and Adediran, A. O. (2021). Physicochemical and sensory characteristics of soft cheese as affected by different salt levels. Niger. J. Anim. Prod. 48, 124–134. doi: 10.51791/njap.v48i5.3193
Kumar, M., Zhang, B., Nishad, J., Verma, A., Sheri, V., Dhumal, S., et al. (2022). Jamun (Syzygium cumini (L.) Skeels) seed: a review on nutritional profile, functional food properties, health-promoting applications, and safety aspects. Processes 10:2169. doi: 10.3390/pr10112169
Lafta, S. S., Luma Khairy, H., and Hakim, I. M. (2019). Effect of fortified low fat-soft cheese with Arabic gum on physicochemical and rheological properties. Plant Arc 19, 616–621.
Lashkari, H., Varidi, M. J., Eskandari, M. H., and Varidi, M. (2020). Effect of pomegranate juice on the manufacturing process and characterization of feta-type cheese during storage. J. Food Qual. 2020, 1–11. doi: 10.1155/2020/8816762
Lucan, M., Ranilovic, J., Slacanac, V., Cvetkovic, T., Primorac, L., Gajari, D., et al. (2020). Physico-chemical properties, spreadability and consumer acceptance of low-sodium cream cheese. Mljekarstvo, 70, 13–27. doi: 10.15567/mljekarstvo.2020.0101
Lu, Y., Shirashoji, N., and Lucey, J. (2008). Effects of pH on the textural properties and meltability of pasteurized process cheese made with different types of emulsifying salts. J. Food Sci. 73, E363–E369. doi: 10.1111/j.1750-3841.2008.00914.x
Lucera, A., Costa, C., Marinelli, V., Saccotelli, M. A., Del Nobile, M. A., and Conte, A. (2018). Fruit and vegetable by-products to fortify spreadable cheese. Antioxidants 7:61. doi: 10.3390/antiox7050061
Madani, B., Mirshekari, A., Yahia, E. M., Golding, J. B., Hajivand, S., and Dastjerdy, A. M. (2021). Jamun (Syzygium cumini L. Skeels): a promising fruit for the future. Hortic. Rev. 48, 275–306. doi: 10.1002/9781119750802.ch5
Mehanna, N., Mahmoud, A. E.-A., Elshenawy, A., and El-Ahwal, R. (2021). Effect of fat replacement with modified starch on composition and quality of cream cheese. Roman Biotechnol Lett 26, 2793–2799. doi: 10.25083/rbl/26.4/2793-2799
Mistry, V. V. (2001). Low fat cheese technology. Int. Dairy J. 11, 413–422. doi: 10.1016/S0958-6946(01)00077-2
Morsy, M. K., Morsy, O. M., Abdelmonem, M. A., and Elsabagh, R. (2022a). Anthocyanin-colored microencapsulation effects on survival rate of Lactobacillus rhamnosus GG, color stability, and sensory parameters in strawberry nectar model. Food Bioproc. Tech. 15, 352–367. doi: 10.1007/s11947-022-02758-8
Morsy, M. K., Sami, R., Algarni, E., Al-Mushhin, A. A., Benajiba, N., Almasoudi, A. G., et al. (2022b). Phytochemical profile and antioxidant activity of sesame seed (Sesamum indicum) by-products for stability and shelf life improvement of refined olive oil. Antioxidants 11:338. doi: 10.3390/antiox11020338
Motevalizadeh, E., Mortazavi, S. A., Milani, E., and Hooshmand-Dalir, M. A. R. (2018). Optimization of physicochemical and textural properties of pizza cheese fortified with soybean oil and carrot extract. Food Sci. Nutr. 6, 356–372. doi: 10.1002/fsn3.563
Murtaza, M. S., Sameen, A., Huma, N., and Hussain, F. (2016). Influence of hydrocolloid gums on textural, functional and sensory properties of low fat Cheddar cheese from Buffalo Milk. Pak. J. Zool. 49, 27–34. doi: 10.17582/journal.pjz/2017.49.1.27.34
Nazari, S. M., Mortazavi, A., Hesari, J., and Tabatabaei Yazdi, F. (2020). Proteolysis and textural properties of low-fat ultrafiltered feta cheese as influenced by maltodextrin. Int. J. Dairy Technol. 73, 244–254. doi: 10.1111/1471-0307.12642
Pastorino, A. J., Hansen, C. L., and Mcmahon, D. J. (2003). Effect of pH on the chemical composition and structure-function relationships of cheddar cheese. J. Dairy Sci. 86, 2751–2760. doi: 10.3168/jds.S0022-0302(03)73871-5
Quoc, L. P. T. (2020). Effect of different carrier agents on physicochemical properties of spray-dried pineapple (Ananas comosus Merr.) powder. J. Korean Chem. Soc. 64, 259–266. doi: 10.5012/jkcs.2020.64.5.259
Rahman, M. T., Zubair, M. A., Shima, K., and Chakma, M. P. (2020). Development of quality parameters for yogurt with strawberry juice. Food Nutr. Sci. 11, 1070–1077. doi: 10.4236/fns.2020.1112075
Rashidi, H., Mazaheri-Tehrani, M., Razavi, S. M., and Ghods-Rohany, M. (2015). Improving textural and sensory characteristics of low-fat UF feta cheese made with fat replacers. J. Agric. Sci. Technol. 17, 121–132.
Salehi, F. (2021). Quality, physicochemical, and textural properties of dairy products containing fruits and vegetables: A review. Food Sci. Nutr. 9, 4666–4686. doi: 10.1002/fsn3.2430
Sharafi, S., Nateghi, L., Eyvazzade, O., and Ebrahimi, M. T. A. (2020). The physicochemical, texture hardness and sensorial properties of ultrafiltrated low-fat cheese containing galactomannan and novagel gum. Acta Sci. Pol. Technol. Aliment. 19, 83–100. doi: 10.17306/J.AFS.0685
Sharafi, S., Nateghi, L., Eyvazzade, O., and Taj Abadi, M. E. (2019). Optimization and evaluation of textural properties of ultra-filtrated low-fat cheese containing galactomannan and novagel gum. Mljekarstvo 69, 239–250. doi: 10.15567/mljekarstvo.2019.0404
Shelke, G., Kad, V., Pandiselvam, R., Yenge, G., Kakade, S., Desai, S., et al. (2023). Physical and functional stability of spray-dried jamun (Syzygium cumini L) juice powder produced with different carrier agents. J. Texture Stud. doi: 10.1111/jtxs.12749
Shelke, G., Kad, V., Yenge, G., Desai, S., and Kakde, S. (2020). Utilization of jamun pomace as functional ingredients to enhance the physico-chemical and sensory characteristics of ice cream. J Food Process Preserv 44, 1–8. doi: 10.1111/jfpp.14736
Shelke, G. N., Kad, V. P., Yenge, G. B., and Kakade, S. R. (2022). Development of antioxidant rich lce cream using spray dried Jamun juice. J Agricult Res Technol 47, 233–238. doi: 10.56228/JART.2022.47220
Singh, C. S., Paswan, V. K., and Rai, D. C. (2019). Process optimization of spray dried Jamun (Syzygium cumini L.) pulp powder. LWT 109, 1–6. doi: 10.1016/j.lwt.2019.04.011
Sohany, M., Halim, M. A., Akhter, M. J., Yasmin, S., and Noor, F. (2022). Effect of garlic paste on the physicochemical attributes of cheese. Food Nutr. Sci. 13, 6–16. doi: 10.4236/fns.2022.131002
Tarakçı, Z., and Deveci, F. (2019). The effects of different spices on chemical, biochemical, textural and sensory properties of white cheeses during ripening. Mljekarstvo 69, 64–77. doi: 10.15567/mljekarstvo.2019.0106
Togay, S. O., Guneser, O., and Karagul Yuceer, Y. (2017). Evaluation of physicochemical, microbiological, sensory properties and aroma profiles of goat cheeses provided from Canakkale. Int. J. Dairy Technol. 70, 514–525. doi: 10.1111/1471-0307.12374
Verma, R., Lata, R., Ram, R., Prakash, S., Kumar, V., Verma, S., et al. (2019). Evaluation of physico-chemical attributes of different genotypes of jamun (Syzygium cumini L. Skeels.) fruits. J Pharmacogn Phytochem 8, 480–482.
Xue, X., Wang, J., Li, S., Zhang, X., Dong, J., Gui, L., et al. (2020). Effect of micronised oat bran by ultrafine grinding on dietary fibre, texture and rheological characteristic of soft cheese. Int. J. Food Sci. Technol. 55, 578–588. doi: 10.1111/ijfs.14309
Keywords: soft cheese, low-fat, Jamun juice, antioxidant, quality, spray-dried
Citation: Shelke GN, Kad VP, Yenge GB, Kukde RB, Kakade SR, Al-Dalain SY, Haddad MA, Abdeen A, Ibrahim SF, Abdelkhalek A, Imbrea F, Fericean L, Gharmy HI and Morsy MK (2023) Physicochemical attributes, antioxidant activity, and sensory responses of low-fat cheese supplemented with spray-dried Jamun juice (Syzygium cumini L.) powder. Front. Sustain. Food Syst. 7:1243477. doi: 10.3389/fsufs.2023.1243477
Edited by:
Feng Xue, Nanjing University of Chinese Medicine, ChinaReviewed by:
Mingming Zhong, Northeast Agricultural University, ChinaCopyright © 2023 Shelke, Kad, Yenge, Kukde, Kakade, Al-Dalain, Haddad, Abdeen, Ibrahim, Abdelkhalek, Imbrea, Fericean, Gharmy and Morsy. This is an open-access article distributed under the terms of the Creative Commons Attribution License (CC BY). The use, distribution or reproduction in other forums is permitted, provided the original author(s) and the copyright owner(s) are credited and that the original publication in this journal is cited, in accordance with accepted academic practice. No use, distribution or reproduction is permitted which does not comply with these terms.
*Correspondence: Liana Fericean, bWloYWVsYWZlcmljZWFuQHVzYWItdG0ucm8=; Mohamed K. Morsy, bW9oYW1lZC5hYmRlbGhhZmV6QGZhZ3IuYnUuZWR1LmVn
Disclaimer: All claims expressed in this article are solely those of the authors and do not necessarily represent those of their affiliated organizations, or those of the publisher, the editors and the reviewers. Any product that may be evaluated in this article or claim that may be made by its manufacturer is not guaranteed or endorsed by the publisher.
Research integrity at Frontiers
Learn more about the work of our research integrity team to safeguard the quality of each article we publish.