 Safiullah Pathan
 Grato Ndunguru1
- 1Department of Agriculture and Environmental Sciences, Lincoln University of Missouri, Jefferson City, MO, United States
- 2Division of Applied Social Science, University of Missouri, Columbia, MO, United States
This study aimed to select higher-yielding and drought-tolerant quinoa (Chenopodium quinoa Willd.) lines suitable for cultivation in the U.S. Midwest, where water scarcity poses a common challenge for crop production. Quinoa, known as a superfood and climate-smart crop, is rich in nutrients, possesses resilience to abiotic stress, and is ideal for sustainable food production and supporting nutritional security in the face of changing climate conditions. To achieve this goal, 128 quinoa germplasms, collected from the USDA-ARS-GRIN, were evaluated. Among those lines, ten quinoa lines were selected for further assessment and evaluated at four different locations in Missouri, United States. Evaluations were conducted under three environments: irrigated, rainfed, and drought stress, over 2 years (summer of 2021 and 2022). Two of the selected ten lines, Ames13746 and PI614927, produced higher yields across various locations and environments. Remarkably, these lines demonstrated significantly higher grain yields under drought stress compared to irrigated and rainfed conditions. However, there was no significant difference in grain yield between irrigated and rainfed environments. Notably, despite the presence of moisture stress, the concentration of essential amino acids remained unaffected, while there was a slight decrease in the total protein content under drought-stress conditions. These research results and selected genotypes can potentially facilitate quinoa production in the U.S. Midwest regions prone to water stress, contributing to food security and sustainable agricultural practices.
1. Introduction
Quinoa (Chenopodium quinoa Willd.), a native crop of the Andean regions, holds significant historical and cultural importance, dating back to its domestication approximately 7,000 years ago. The Incas revered it as a sacred grain calling it “chisya mama” which means “mother grain” (Bazile et al., 2016; Walters et al., 2016; Jacobsen, 2017). Over the past 50 years, it has resurged in popularity worldwide due to its exceptional nutritional quality and adaptability to adverse climates. In 2013, the Food and Agriculture Organization (FAO) of the United Nations declared it the “International Year of Quinoa.” It is now recognized as a ‘superfood’ and a climate-smart crop, with potential as a crop for food and nutritional security.
Quinoa stands out for its remarkable adaptability to diverse climates by exhibiting resilience to various abiotic stresses, including drought, heat, frost, and salinity (Fuentes and Bhargava, 2011; Rao and Shahid, 2012; Langyan et al., 2023). In particular, it has the potential to thrive, grow and produce seeds, in extremely arid environments such as Chile, northwest Argentina, and the Altiplano region in Bolivia and Peru, where rainfall is a limiting factor to produce quinoa (Hinojosa et al., 2018; Fathi and Kardoni, 2020). One way it achieves this is by employing stress avoidance mechanisms in response to limited water availability (Bandurska, 2022), which involves adeptly managing water loss and uptake. Hinojosa et al. (2018) suggested that quinoa can withstand drought stress by increasing water absorption to promote root growth and raising proline and total soluble sugar content to regulate cell osmotic potential. Moreover, following a severe drought, quinoa rapidly resumes leaf formation and has a low leaf wilting point signifying its capacity to rebound quickly and continue its growth cycle. These unique characteristics make quinoa suitable for growing in arid and semiarid regions with minimum supplementary irrigation (Bhargava et al., 2006).
Apart from its resilience, quinoa is renowned for its exceptional nutritional profile. Quinoa grains are gluten-free pseudocereal and contain high amounts of protein, all essential amino acids, and important minerals and vitamins (Bazile and Baudron, 2015; Gordillo-Bastidas et al., 2016). Compared to cereal grains such as barley, rice, maize, and oats, quinoa stands out with a higher total protein content (Sindhu and Khatkar, 2019). Quinoa grains also contain high levels of bioactive compounds such as flavonoids, phenolic acids, bioactive peptides, phytosterols, and saponins (Olivera et al., 2022). Because of these nutritional properties and health benefits, quinoa is considered a novel and healthy food, contributing to its designation as a “superfood.” The resilience and high nutritional quality ranked quinoa as a potential strategic crop for food and nutritional security (FAO, 2011; Rojas et al., 2015) and is recognized as “one of the grains of the 21st century” (Vilcacundo and Hernández-Ledesma, 2017).
While quinoa is grown in more than 120 countries, the majority of production remains concentrated in the Andean region, specifically Peru and Bolivia. In 2020, production in both countries accounted for approximately 97% of global quinoa production. Peru produced 100,000 t (57%), while Bolivia produced 70,000 t (40%). Overall, global production of quinoa reached 175,280 t with an average yield of 0.93 t ha−1 (Alandia et al., 2020; FAOSTAT, 2022). This limited source of suppliers has encouraged countries like China to initiate a nationwide program in research, production, and development of quinoa varieties in 2015 through the Quinoa Committee of the Crop Science Society of China (QCCSSC). Consequently, outside the quinoa growing belt of South America, China has emerged as the third highest producer with 20,000 t with an average yield of 1.67 t ha−1 (Xiu-Shi et al., 2019), yielding more than the Andean region’s average. Besides Peru and Bolivia, only six other countries produce quinoa in an area ranging from 500 to 5,000 ha (Alandia et al., 2020). The United States, though producing a small quantity of quinoa, remains the world’s largest consumer and importer. In 2021, the U.S. imported about 28.33 m kg of quinoa which cost approximately $69 million (Statista, 2023), emphasizing the need for domestic production to enhance self-sufficiency.
Recognizing the need to address the challenge of limited quinoa cultivation in the United States, Washington State University initiated a program to develop high-yielding biotic and abiotic stress-tolerant quinoa varieties under organic and conventional farming systems. Similarly, Lincoln University of Missouri and the University of Missouri at Columbia recently launched a project to select quinoa cultivars that exhibit high-yielding performance and resilience to biotic and abiotic stress tolerance in the Midwest region, where water-stress and high temperatures exist during the summer months.
By exploring and evaluating a broader range of quinoa germplasm with diverse genetic backgrounds in the U.S. Midwest, researchers aim to identify the best climate-smart accessions suitable for sustainable agriculture. This endeavor holds the potential to expedite quinoa expansion, especially in regions facing climate change challenges.
Researchers and growers are increasingly recognizing quinoa as a climate-smart crop, offering a viable alternative in climate-changing environments where traditional major crops struggle to survive. Additionally, marginalized farmers living in drought-prone regions may also benefit from quinoa production. Cultivation of quinoa requires a small investment and its growth potential could increase the profitability and resilience of farming practices in such areas. The objectives of this study were to evaluate the yield performance of 10 quinoa accessions of different origins under different environments and locations in Missouri, assess the drought tolerance capacity of the lines, and determine the effect of drought stress on seed nutritional composition.
2. Materials and methods
2.1. Plant materials – germplasm evaluation and selection of a subset
One hundred twenty-eight quinoa germplasms were collected from the USDA-ARS Germplasm Resources Information Network (GRIN) North Central Research Plant Introduction Station, Iowa, United States, in 2016. These genotypes were evaluated at Lincoln University Carver Farm and Busby Farm near Jefferson City, MO, and the University of Missouri Bradford Research Farm near Columbia, MO, during the summer of 2017 and 2018 under irrigated conditions. We selected 10 quinoa genotypes for further evaluation based on maturity, seed set, and phenotypic adaptation (early growth and lodging resistance). The plant ID, name, origin, ecotype, and genotypic group are shown in Table 1.
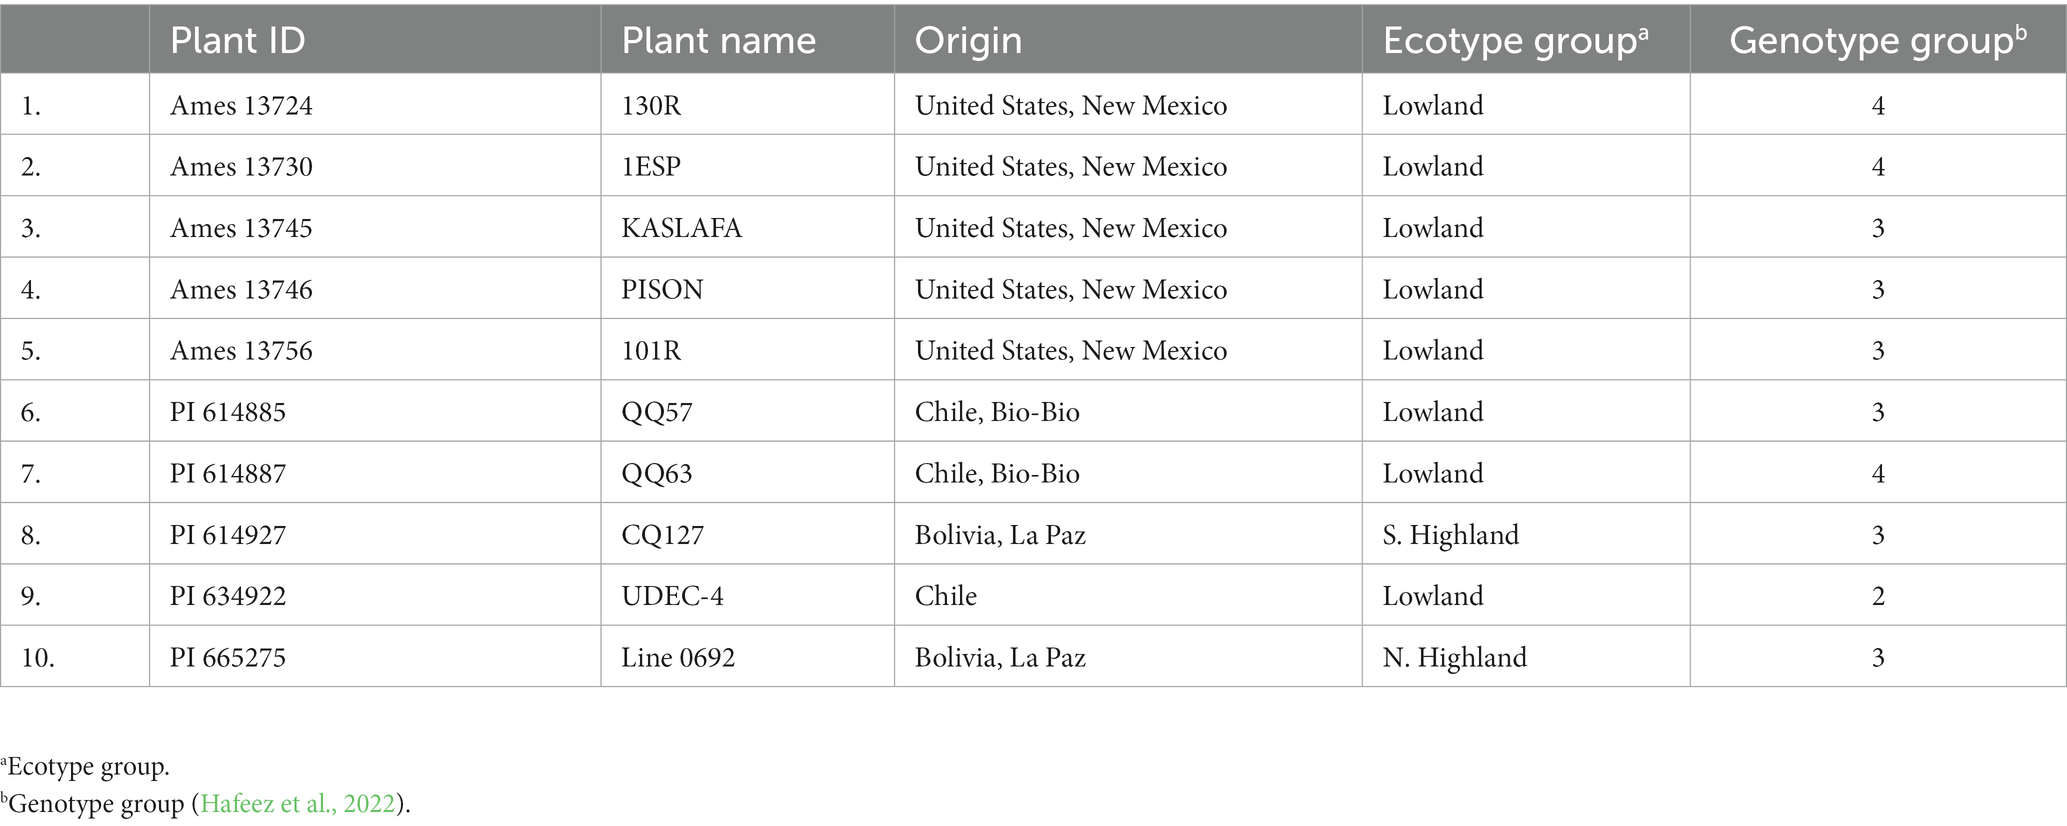
Table 1. List of studied quinoa genotypes with plant ID, name, origin, ecotype, and genotypic group.
2.2. Test locations and environments
The study was conducted in two consecutive growing seasons, the summer of 2021 and 2022, and in four locations in Missouri. The four areas include two research farms (Lincoln University Carver Farm, Jefferson City, MO, and the University of Missouri Bradford Farm, Columbia, MO, United States) and two farmers’ fields (Jamestown, MO and Hermann, MO, USA). Geographical locations and agro-climatic information such as soil texture, soil pH, temperature, and rainfall during the cropping season (June to September) are presented in Table 2. The climate conditions in these four locations were similar in both years except for the amount of rainfall. During the crop growing season, Hermann received the highest amount of rainfall (358 mm), while Jamestown received the lowest (81 mm). In Columbia, we planted twice for both years due to high temperatures during seed germination, followed by heavy rain when seedlings were about a week old. Rainfall was not equally distributed throughout the growing season; the maximum was in June and July. Carver Farm received about 75 mm and 150 mm of precipitation during anthesis to maturity (about 45 days) in 2021 and 2022, respectively. Heavy rain and wind during the maturation facilitated the lodging and breakdown of the plants. In Jefferson City, MO, the hot season lasts 3.6 months, from May 29 to September 17, with an average daily high temperature above 79°F (26°C).1
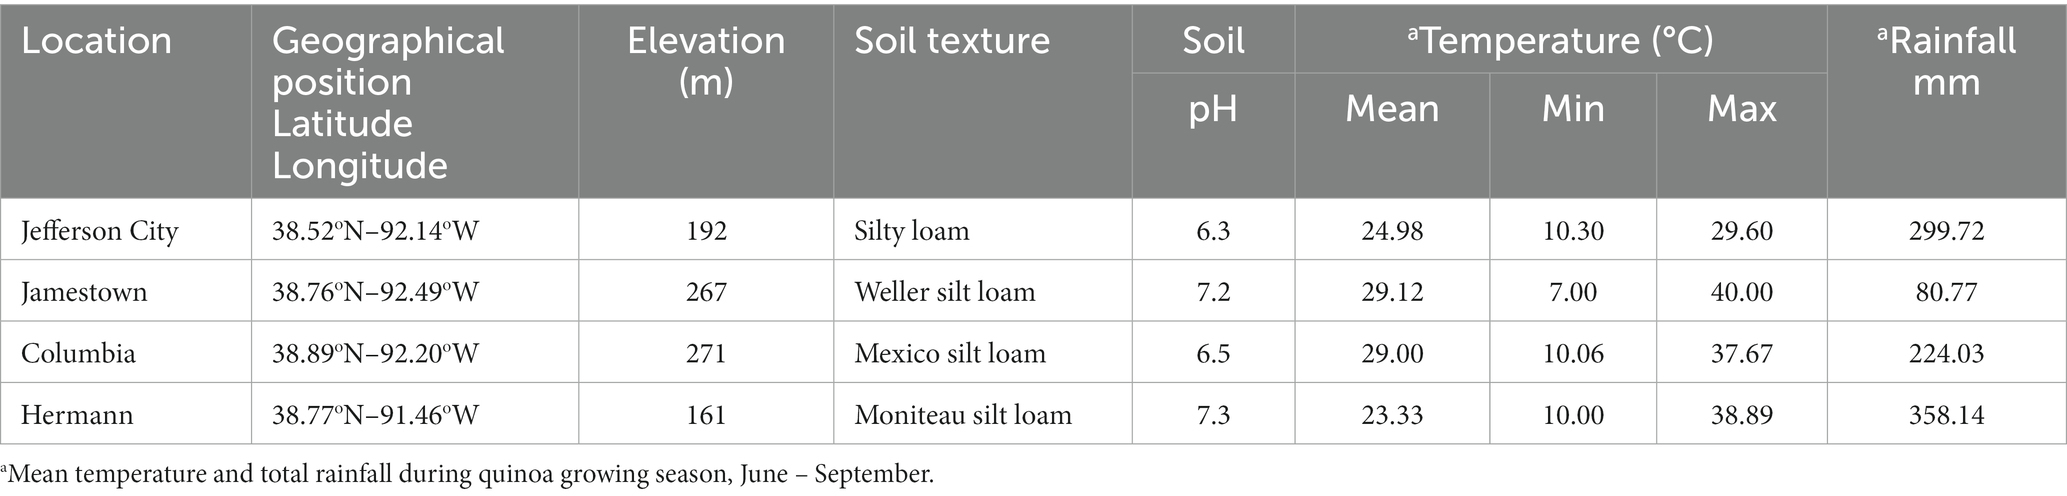
Table 2. Geographical position and agro-climatic description of test locations.
The quinoa genotypes were evaluated in three environments (irrigated, rainfed, and drought), all at Jefferson City. Each of the other three locations simulated just a single type of environment. Full irrigation was applied throughout the growing season in an irrigated environment, and irrigation stopped 10–15 days before harvesting. The irrigated trial was conducted in Jefferson City (Carver Farm field) and Jamestown, MO, in 2021 and 2022. In a rainfed environment, irrigation stopped at the flowering stage (R1 growth stages), and plants were allowed to grow under rainfall without any supplemental irrigation (simulated to farmer’s fields). This trial was conducted in Jefferson City (Carver Farm field) and Columbia (MU Bradford farm), MO, in 2021 and 2022.
The drought trial was performed in Jefferson City (Carver Farm high tunnel) and Hermann, MO, in 2021 and 2022. In a drought environment, irrigation was stopped at the flowering stage (R1 growth stages) to induce drought and continued until crop harvesting. A high tunnel was used to conduct the drought stress experiment. The high tunnel was a single-bay metal-framed tunnel measuring 30 m long, 6 m wide, and 3.7 m tall, covered with a single layer of clear 0.15 mm polyethylene plastic with roll-up sides for ventilation. During the study, the side panels would close automatically when the temperature fell below 20°C. and remained open when temperatures were above this threshold. A temperature and humidity sensor, Hobo Onset-MX2302A (Onset Computer Corporation, Boston, MA, United States), was connected to a data logger to monitor air temperature inside the high tunnel and relative humidity. The high tunnel’s air temperature was 2-3°C higher than the outside temperature.
2.3. Test plots, experimental design, and general management
A conventionally tilted, level, lightly firm, and moist seedbed was used in each location. The soil surface was fine and not too coarse. Quinoa seeds were sown in moist soil at a shallow depth for uniform germination. The study was carried out with 10 quinoa genotypes (Table 1). The test design was a randomized complete block design (RCBD) with three replications that comprised 30 sub-plots. To control weeds, we used a 122 cm wide and 30 m long woven weed barrier plastic mulch in each raised bed, which also allowed rain and water to penetrate. Each raised bed (block) accommodated 10 sub-plots. Circular holes of 9 cm in diameter were made in plastic mulch using a pre-made wooden block with holes and a gas burner to create circular holes in the plastic mulch for planting seeds. The area of each sub-plot was 2 m long, 1 m wide, 1 m between the plots, three-row per plot, row-to-row, and hill-to-hill distance 0.25 m. A “Hill” is a spot (holes) in the mulch where a plant or group of plants are grown by maintaining uniform hill-to-hill distance within the row. Two perforated plastic pipes were placed under the plastic mulch in each block for drip irrigation. About 5–6 seeds were sown manually per hill at around 1 cm depth in the soil. After germination, plants were thinned to only two seedlings per hill. The NPK fertilizer was applied at a 42 kg ha-1 rate during the land preparation. Plots were irrigated every 2 days for an hour using a drip irrigation system. When needed, weeding was done manually throughout the growing season (June to September). No herbicide was applied. Insecticide, sevin, was sprayed to control tarnished plant bugs, lygus bug (Lygus lineolaris). We followed similar plot sizes, experimental designs, and other management practices across the locations and years. Planting and harvesting dates ranged from June 1 to 15 and September 1 to 15, respectively.
2.4. Data collection
2.4.1. Agro-morphological data
The data was collected from the middle row (to avoid border effects) of each sub-plot for the plant height (Pht, cm), the number of days to maturity (Mat, days), panicle length (Pnl, cm), 100-seed weight (Swt, g), and grain yield per plant (Yld, g). Plant height was measured from the ground to the tip of the primary stem inflorescence from three randomly selected plants of each replication. Days to maturity were calculated from the date of seedling emergence to the physiological maturity. Inflorescence length was measured from three randomly selected inflorescences grown at the terminal apex of the main stem. At maturity, three randomly chosen plants from the middle row of each sub-plot were harvested, threshed, cleaned, weighed, and averaged to calculate yield per plant (g plant−1). The 100-seed weight was calculated from a sample of 100 seeds from each replication in triplicate.
2.4.2. Climate data
Air temperature, rainfall, and relative humidity (R.H.) data were collected from the USDA-NRCS National Weather and Climate Center (NWCC)-Soil Climate Analysis Network (SCAN) site #2223 located at Carver Farm in Jefferson City, MO, United States,2 (accessed on March 15, 2023). The Bradford Farm air temperature, rainfall, and R.H. data were collected from the Boone County weather station in Columbia, MO, United States,3 (accessed on March 15, 2023). Weather information for Jamestown, MO, and Hermann, MO was obtained from the weather channel data specific to each city,4 (accessed on March 15, 2023).
2.5. Nutritional analysis of quinoa grains
2.5.1. Sample preparation
Three quinoa genotypes were selected for nutritional composition analysis out of the 10 genotypes studied. These three genotypes included two high-yielding genotypes, Ames 13746 (originating from the United States) and PI 614927 (originating from Bolivia), as well as one low-yielding genotype, PI 614885 (originating from Chile). Seeds of the three varieties of each replication of the irrigated and drought stress plots (total 18 samples) were analyzed. The seeds were thoroughly washed for 5 minutes with distilled water to remove unfilled seeds and dust and then left to dry at room temperature. The seeds were later dried in an air-circulation oven at 40°C for 2 hours before grinding. Each sample was ground into powder using a grinder (Cyclotec Mill Foss 1,093, FOSS A/S, Minnesota, United States) and then ground powder was used for analysis.
2.5.2. Nutritional analysis
The proximate composition (protein, fat, fiber, ash, and moisture), amino acid, and mineral analyzes were performed at the Agricultural Experiment Station Chemical Laboratories (AESCL) of the University of Missouri, Columbia, MO, United States. The AESCL is accredited by the American Association for Laboratory Accreditation (A2LA), an accredited proficiency testing provider, following international standards. The AESCL is approved by the Association of Official Analytical Chemists (AOAC) and a quarterly USDA compliance inspected laboratory. Proximate analysis of quinoa grains was executed following the procedures described by the AOAC (2006). The Kjeldahl method applying the AOAC method 984.13 (A-D) determined the total nitrogen content in the grains. The moisture, fat, and fiber were determined using the AOAC method 934.01, 920.39 (A), and 978.10, respectively. The carbohydrate was calculated using the following equation:
The Amino Acids were determined using the AOAC official method 982.30E (a, b). The minerals were determined using the AOAC official method 985.01 (A, B, D) via Inductively Coupled Plasma-Optical Emission Spectroscopy (ICP-OES).
2.6. Statistical analysis
A mixed model analysis of variance (ANOVA) was performed to evaluate quinoa genotypes for agronomic traits, including plant height, maturity, panicle length, 100-grain weight, yield, and nutritional values. In this analysis, replication and year were considered random, while the genotype and environment were considered fixed effects. Among the four locations (Hermann, Carver Farm, Jamestown, and Bradford Farm) the experimental results from Hermann’s location were excluded from the statistical analysis due to inconsistency in drought stress management. To validate the normality and homoscedasticity of all measured variables, Shapiro–Wilk’s and Brown–Forsythe’s, and Levine’s tests were used. To capture variability among varieties, yield data, all agronomic traits, and nutritional values were analyzed using JMP Pro 13 Software (JMP, 2013) and Statistical Discovery from SAS. Tukey’s honestly significant difference (HSD) test was used at the p ≤ 0.05 significance level to determine differences among genotypes for different traits. The restricted maximum likelihood method was used to evaluate the correlation between the traits of interest.
3. Results
The statistical analysis indicated significant differences among quinoa genotypes grown in different environments for various agronomic parameters, including plant height, panicle/inflorescence length (Pnl), 100-seed weight (Swt), and grain yield (Table 3). However, except for Swt, the genotype by environment interactions did not show significant differences for all the measured traits. This suggests that genotypes performed consistently across environments for the most agronomic traits measured in this study. Although there were substantial differences among the genotypes and environments, genotype x environment was not significant for grain yield. Moreover, the days to maturity did not show significant differences among genotypes, environments, and genotype x environment interaction. However, the genotype x environment interaction did exhibit differences for Swt, indicating that genotypes showed inconsistent seed weight across the environment.
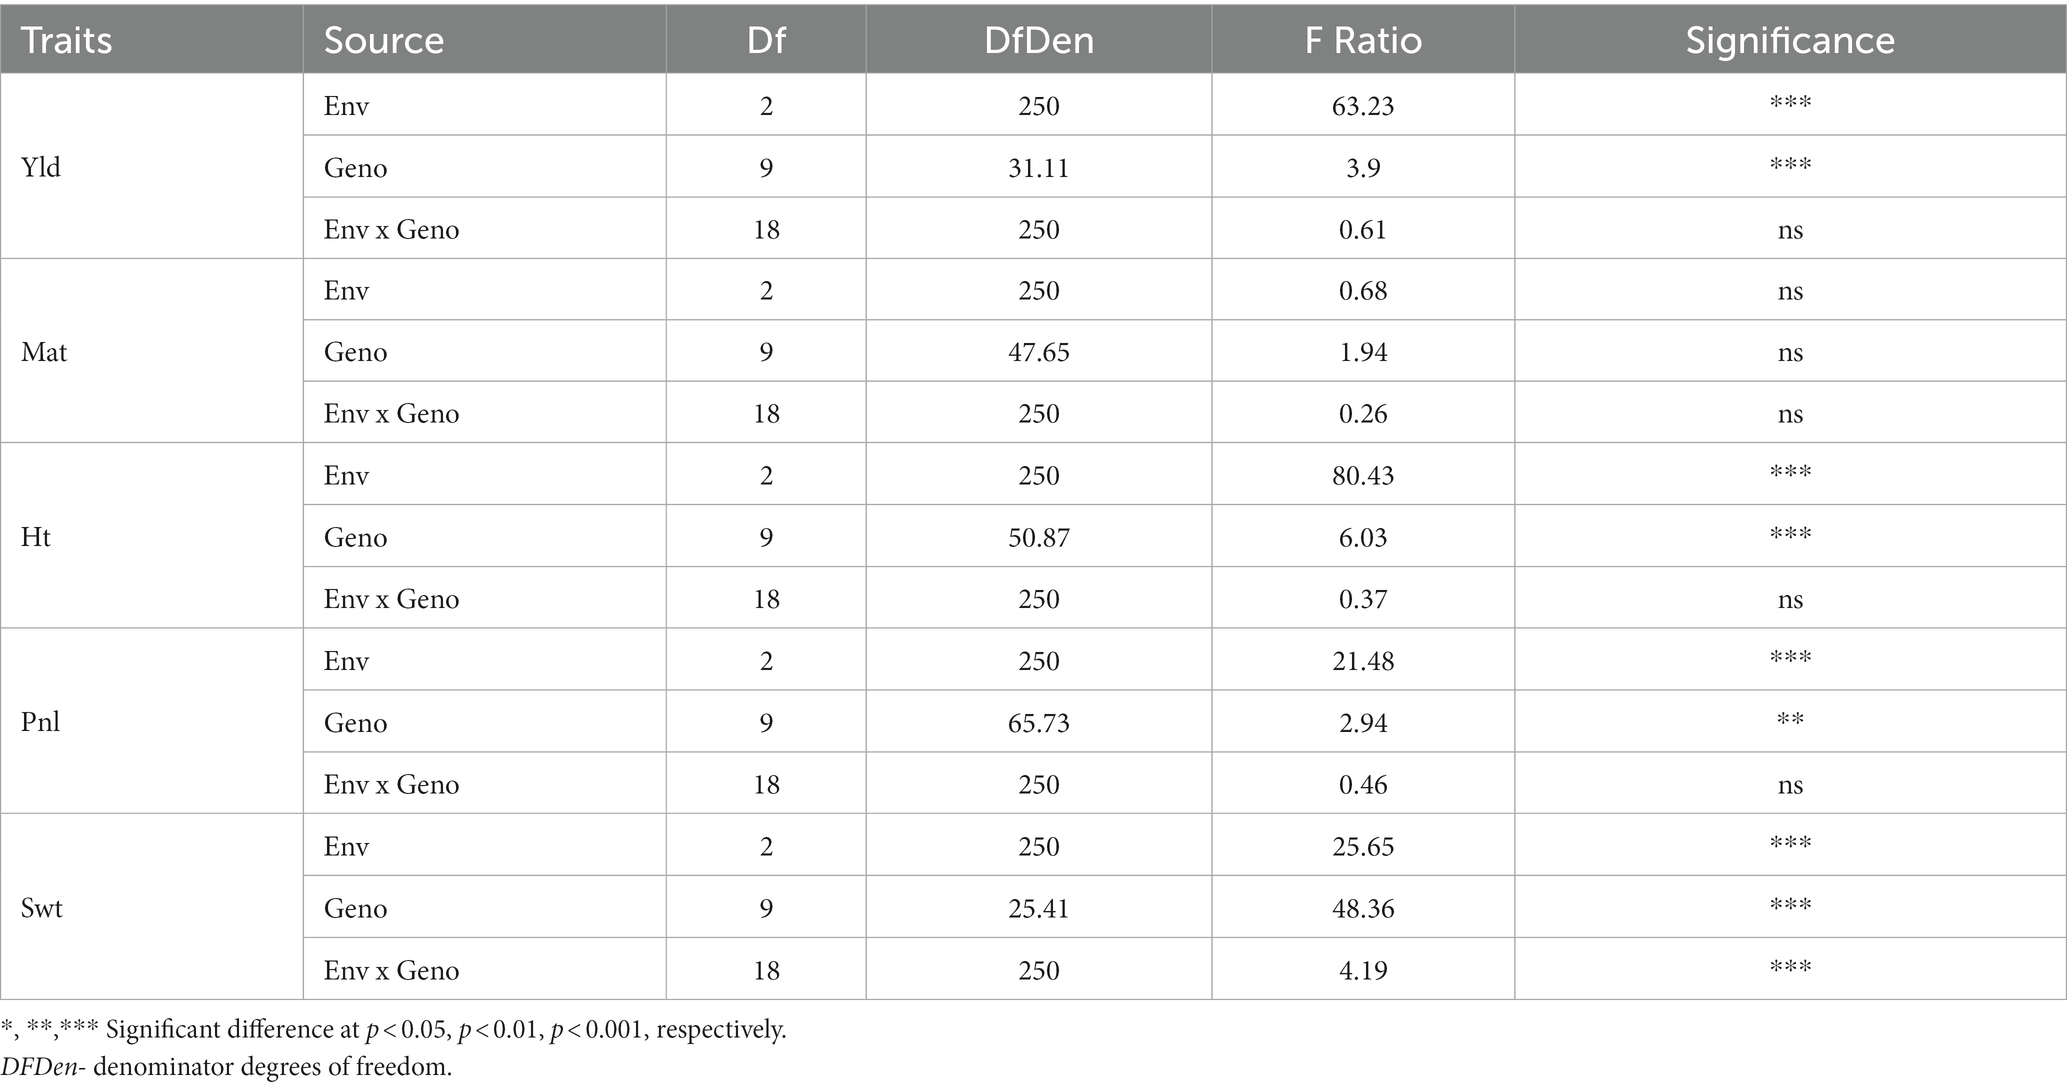
Table 3. The analysis of variance (ANOVA) for grain yield (Yld), days to maturity (Mat), plant height (Pht), panicle/inflorescence length (Pnl), and 100-seed weight (Swt) of 10 quinoa genotypes grown in three locations, three environments in 2021 and 2022.
The average plant height of 10 quinoa genotypes ranged from 60.96 to 208.28 cm (Table 4). Genotype PI 665275 (161.20 cm) was significantly taller than Ames 13746 (140.90 cm) and PI 634922 (154.90 cm). The rest of the genotypes exhibited medium plant heights of approximately 156 cm. Under drought stress conditions, quinoa plants grew significantly taller (183.32 cm) compared to irrigated and rainfed conditions. The lowest plant height was recorded under rainfed (137.63) conditions, followed by irrigated (145.04) fields. We noticed that the plant height was higher under drought-stress environments than in irrigated and rainfed conditions (Table 4).
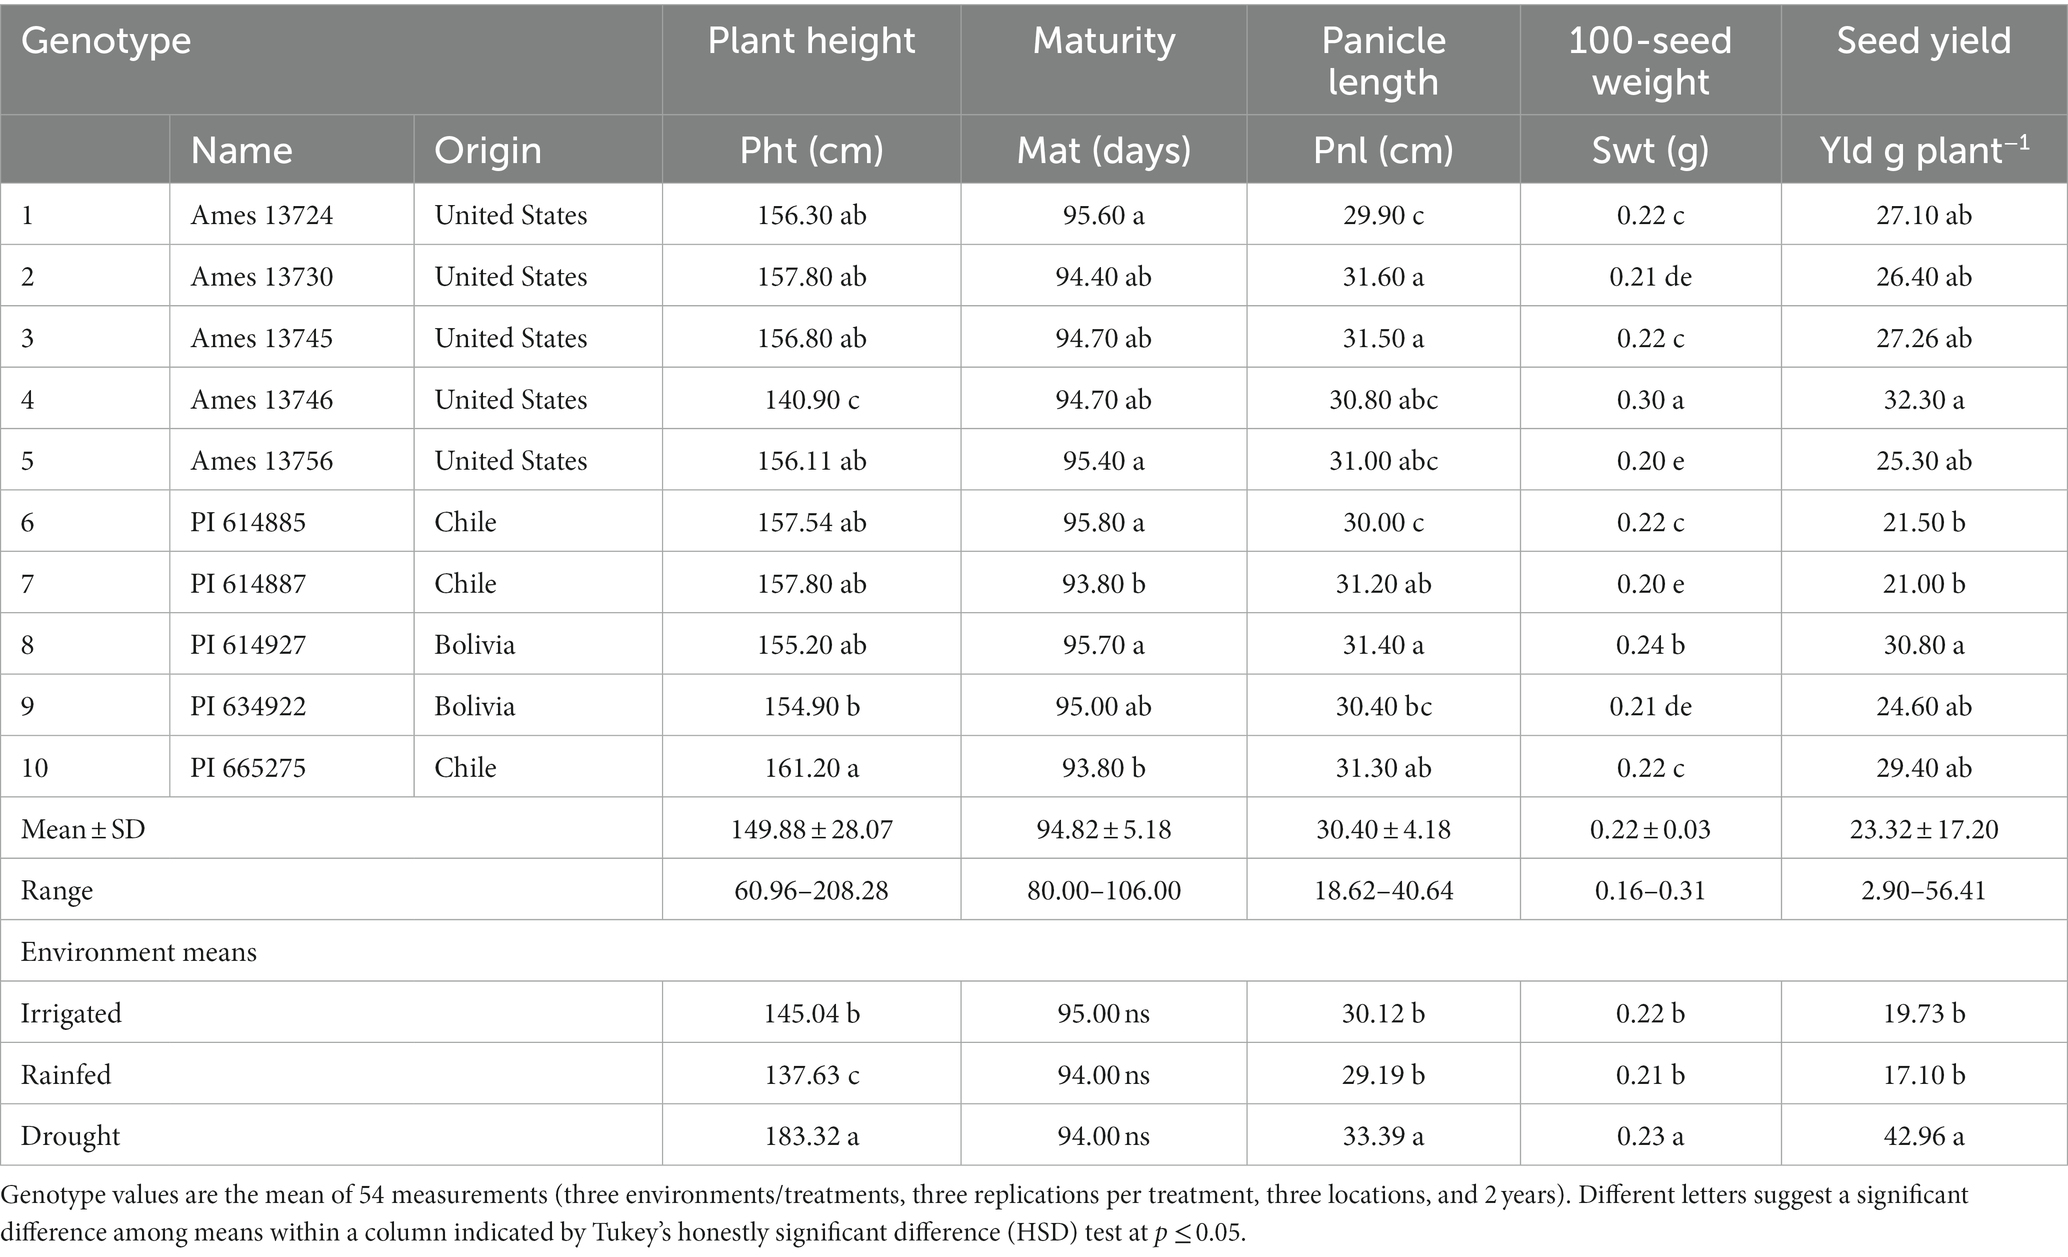
Table 4. The least square means of agro-morphological traits mean 10 quinoa genotypes grown at three environments, three locations, and over 2 years.
The days to maturity ranged from 80 to 106 days, with a mean of 95 days. Most quinoa genotypes in this study exhibited similar maturity dates. Irrigation, rainfed, and drought-stress environmental conditions did not affect days to maturity (Table 4).
Least-square means indicated that quinoa genotypes showed significant variation for panicle length (Pnl). The Pnl ranged from 18.62 to 40.64 cm, averaging 30.40 cm (Table 4). The highest Pnl (31.40–31.60 cm) was observed for Ames 13730, Ames 13745, and PI 614927, while the lowest Pnl (29.90–30.00 cm) was recorded for Ames 13724 and PI 614885. Longer Pnl was observed under drought stress than in irrigated and rainfed environments.
Significantly (p < 0.001) high variability was recorded among quinoa genotypes100-seed weight (Table 4). The Swt ranged from 0.16 g to 0.31 g. The lowest Swt was obtained from PI 614887 (0.20 g), while Ames 13746 exhibited the highest (0.30 g).
Figure 1 illustrates a clear distinction between drought stress (confidence interval represented by green) and irrigated & rainfed conditions (confidence interval defined by blue and red color, respectively). Quinoa produced a higher grain yield under drought stress compared to both rained and irrigated conditions. Surprisingly, among the three environments, the highest grain yield was observed in the drought-stress environment with an average of 42.96 g. The rainfed environment had the lowest yield with an average of 17.09 g plant−1, slightly lower than an irrigated environment with 19.27 g (Figure 1). There were no significant yield differences between irrigated and rainfed environments.
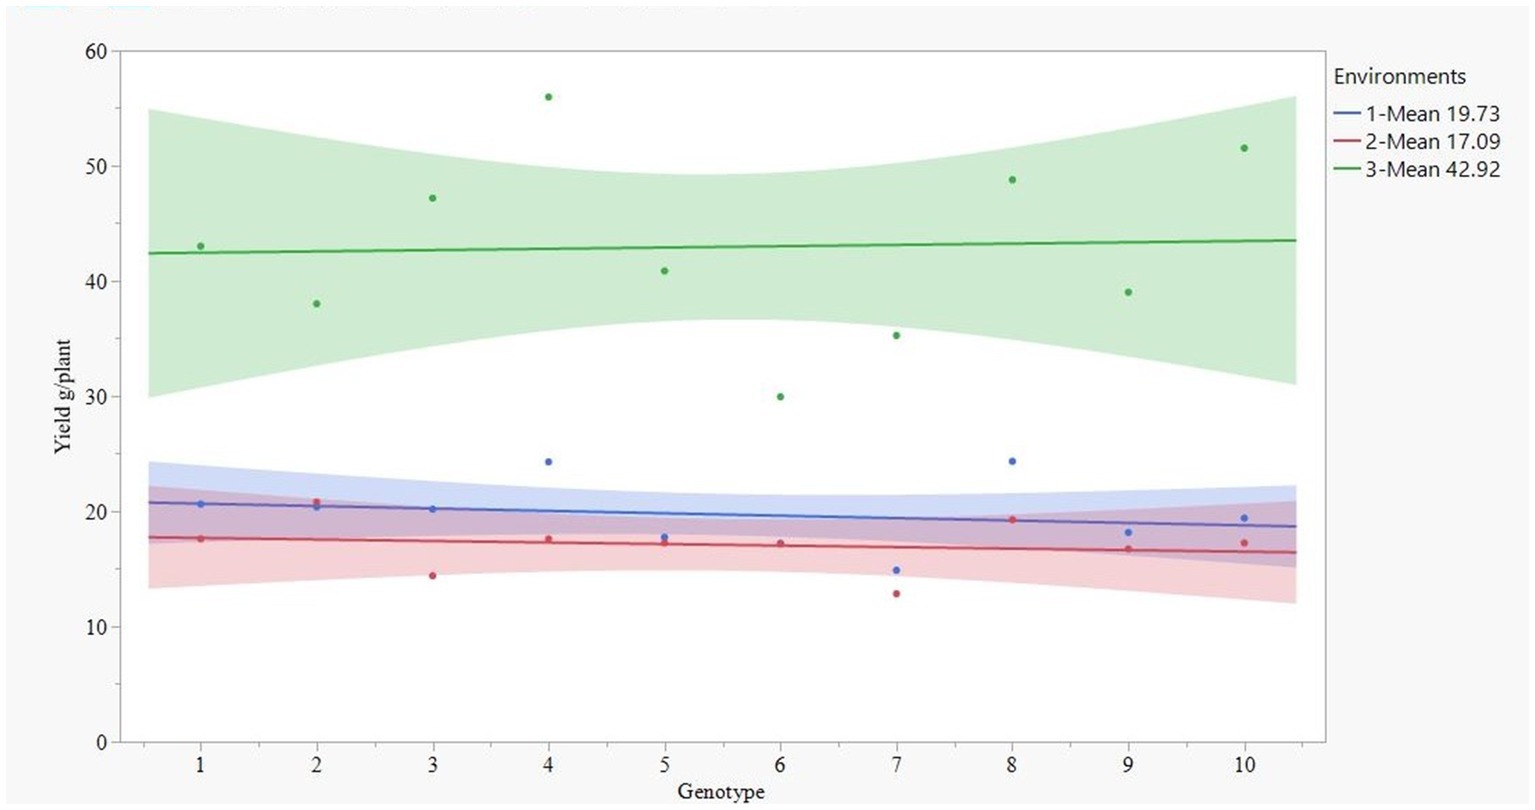
Figure 1. Yield pattern of 10 quinoa genotypes (1-Ames 13724, 2-Ames 13730, 3-Ames 13745, 4-Ames 13746, 5-Ames 13756, 6-PI 614885, 7-PI 614887, 8-PI 614927, 9-PI 634922, and 10-PI 665275) at three environments (1-irrigated-blue, 2-rainfed-red, and 3-drought-green color).
A significant difference (p < 0.001) was observed among genotypes for quinoa grain yield, as shown in Table 3. The least-square means indicated that Ames 13746 genotype had a high grain yield per plant (32 g). However, many genotypes in this study exhibited similar productivity to Ames 13746 genotype (Table 4). The box and whisker in Figure 2 demonstrate the distribution of plant height across locations. Tall and uniform plant growth was recorded under drought-stress conditions at Carver farm. Additionally, a positive and significant correlation was observed between grain yield and plant height (r = 0.72). The taller the quinoa plant, the higher the grain yield per plant (Figure 2).
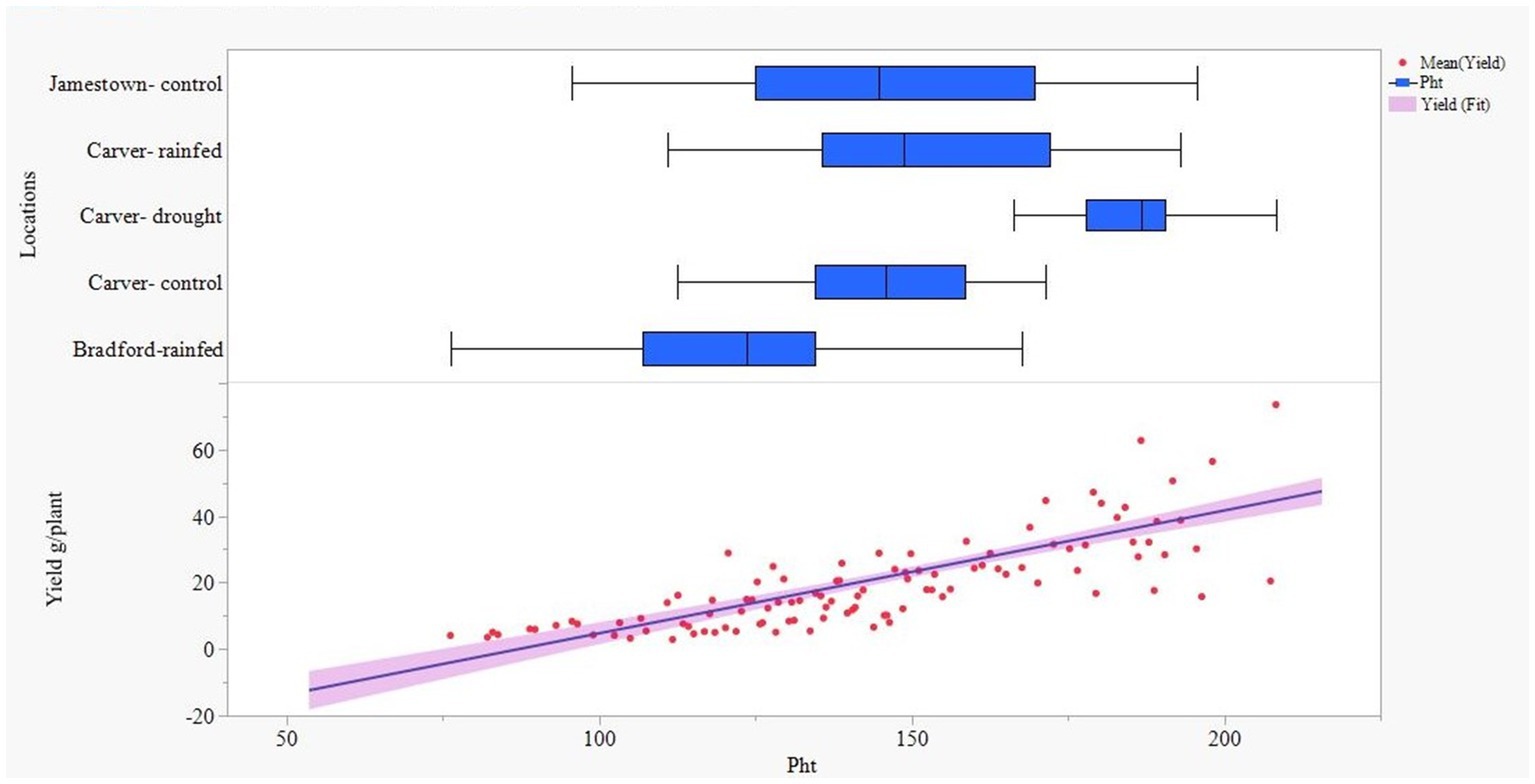
Figure 2. Response of yield (Yld) with respect to plant height (Pht) across the locations.
Figure 3 presents Pearson correlation coefficients and the association between various traits. A significant and positive association was observed between grain yield and days to maturity (r = 0.50), panicle length (r = 0.41), and 100-seed weight (r = 0.23). A positive association was also observed between days to maturity and plant height (r = 0.41) and panicle length (r = 0.36) and between plant height and panicle length (r = 0.61).
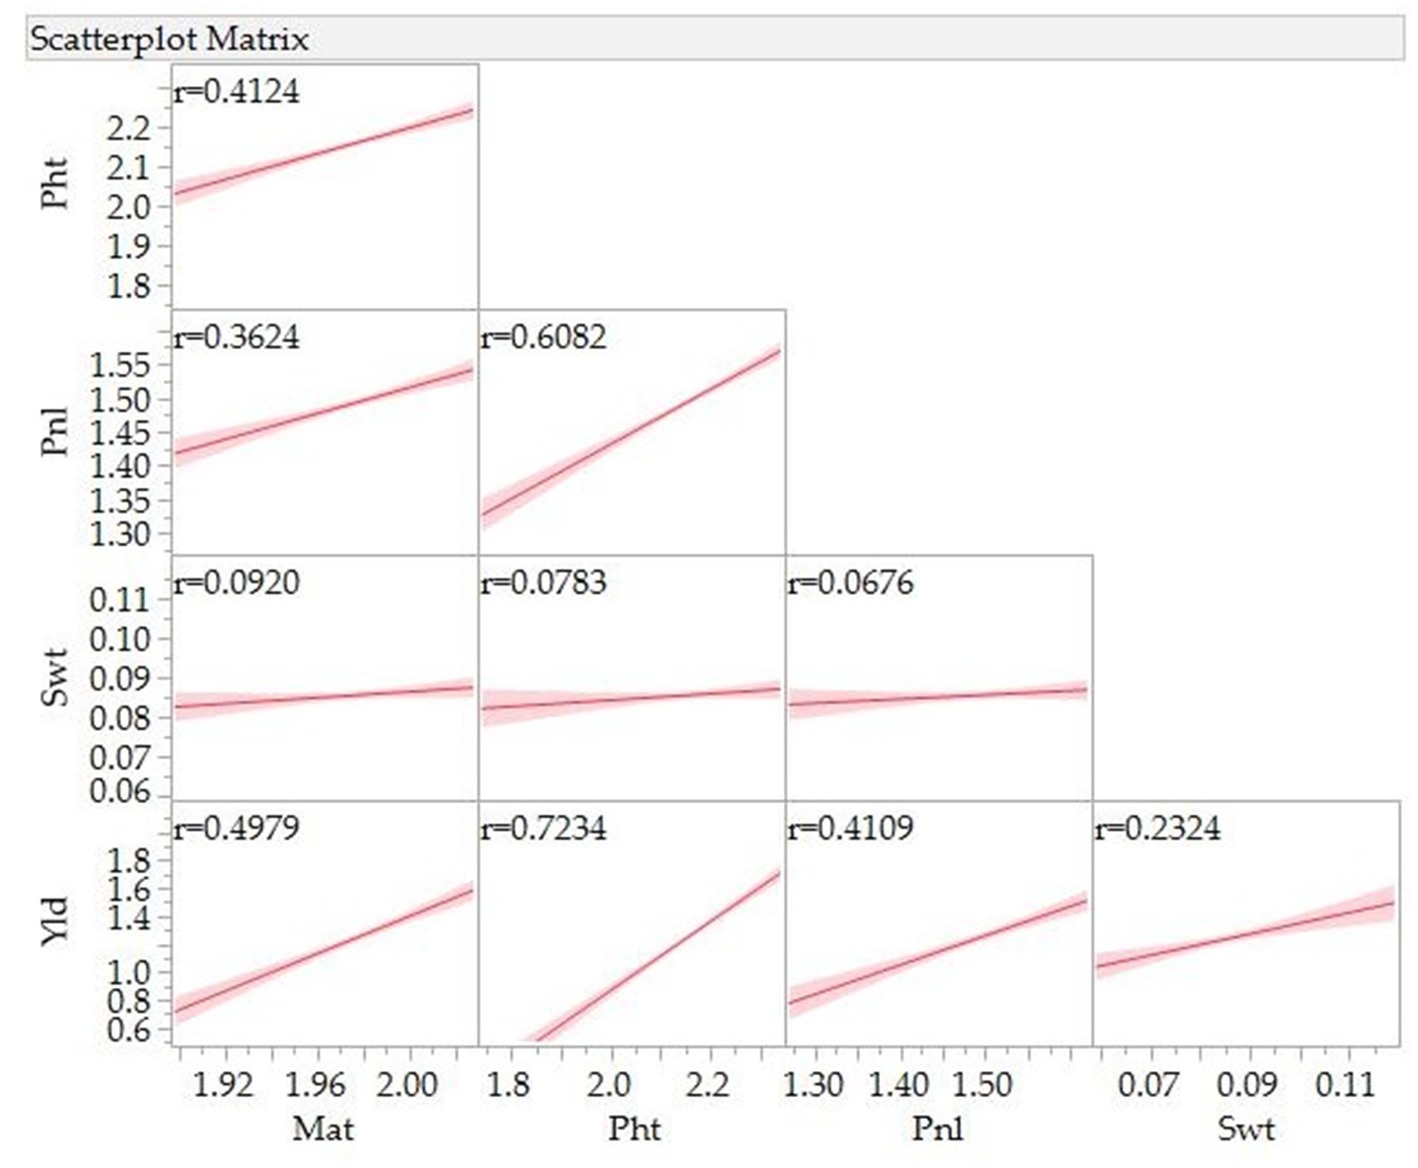
Figure 3. Correlation for grain yield (Yld), days to maturity (Mat), plant height (Pht), panicle/inflorescence length (Pnl), and 100-seed weight (Swt) of 10 quinoa genotypes grown in three locations, three environments in 2021 and 2022.
Figure 4 illustrates the least-square means of proximate analysis. The results indicated a significant variation between irrigated and drought stress conditions for protein content, moisture, and ash of quinoa grown in 2022. However, the amount of fat and fiber in a 100 g−1 sample of quinoa grain did not show significant differences between irrigated and drought-stress environments.
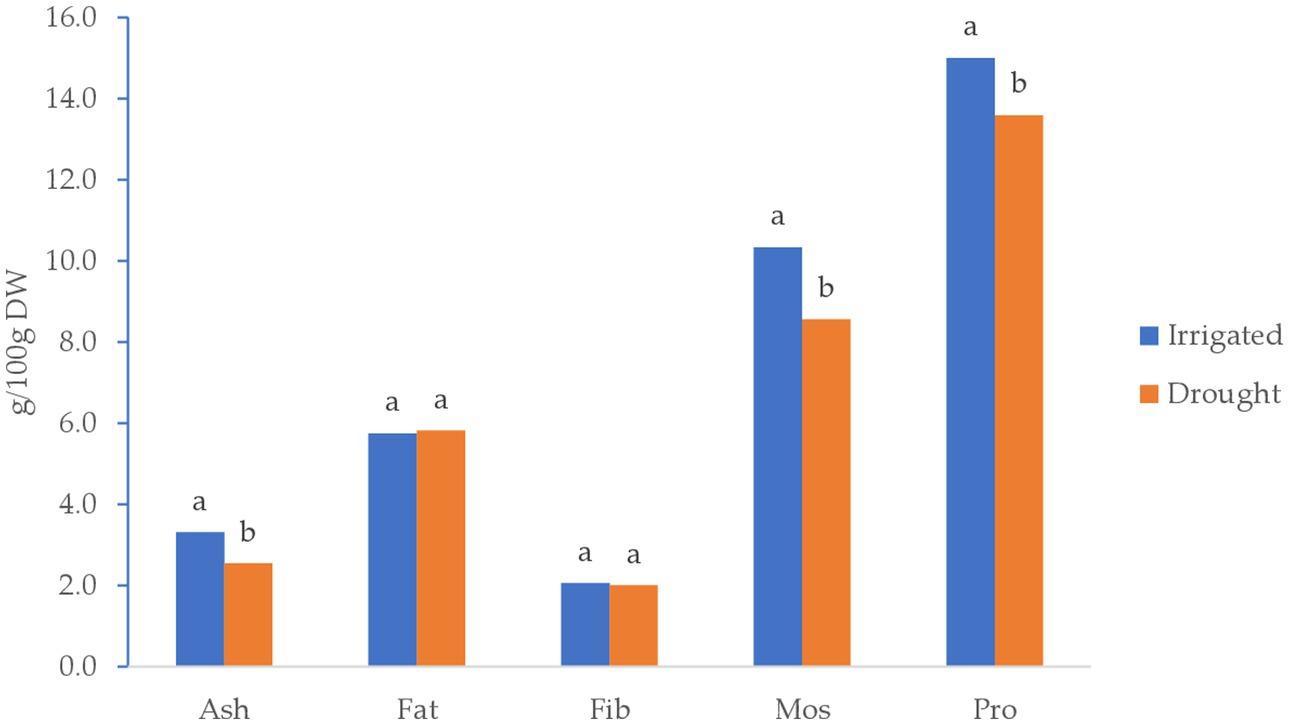
Figure 4. Least square means of proximate analysis of quinoa grains (g/100 g D.W.) grown under Irrigated and drought-stress environments.
There was no significant difference in all essential amino acids except methionine and tryptophan, between the two environments (Table 5). The values (g 100 g−1 protein) between the two environments (the first number represents irrigated and the second one drought) from the highest to the lowest as leucine (5.95 and 5.94), lysine (5.53 and 5.69), valine (4.40 and 4.42), isoleucine (3.84 and 3.87), threonine (3.88 and 3.91), phenylalanine (3.28 and 3.31), histidine (3.01 and 3.06), methionine (1.86 and 1.93), and tryptophan (1.10 and 1.17). Regarding mineral content (mg 100 g−1 sample) in quinoa grains (Table 6), there was a significant difference between the irrigated and drought environments for potassium (995.67 and 706.33), magnesium (249.56 and 211.56), phosphorous (528.67 and 382.00), iron (9.96 and 7.06), and zinc (2.50 and 2.12). However, there was no significant difference in calcium (62.56–59.44) and sodium (14.00 and 14.00 g 100 g−1 sample). Overall, the amount of minerals under irrigated conditions was generally higher than in the drought environments.
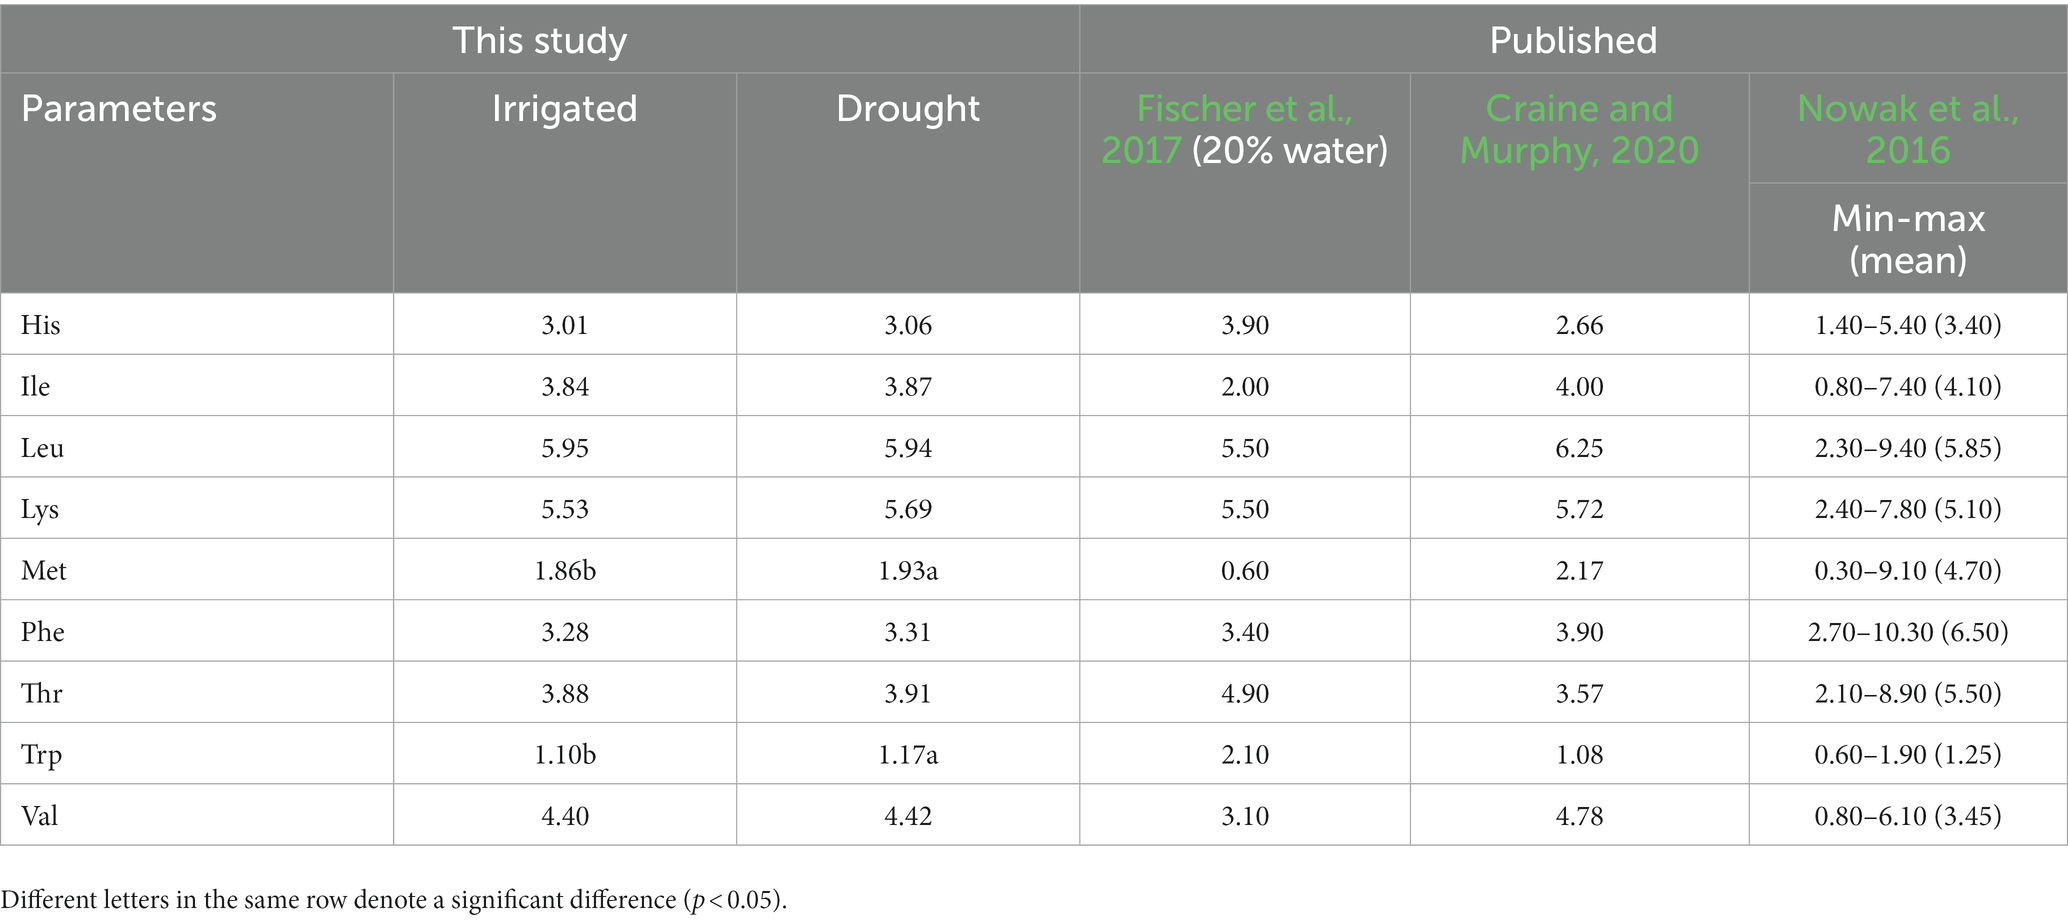
Table 5. Amino Acid profiles of quinoa grains (g 100 g−1 protein) grown under irrigated and drought stress environments shown with published results.
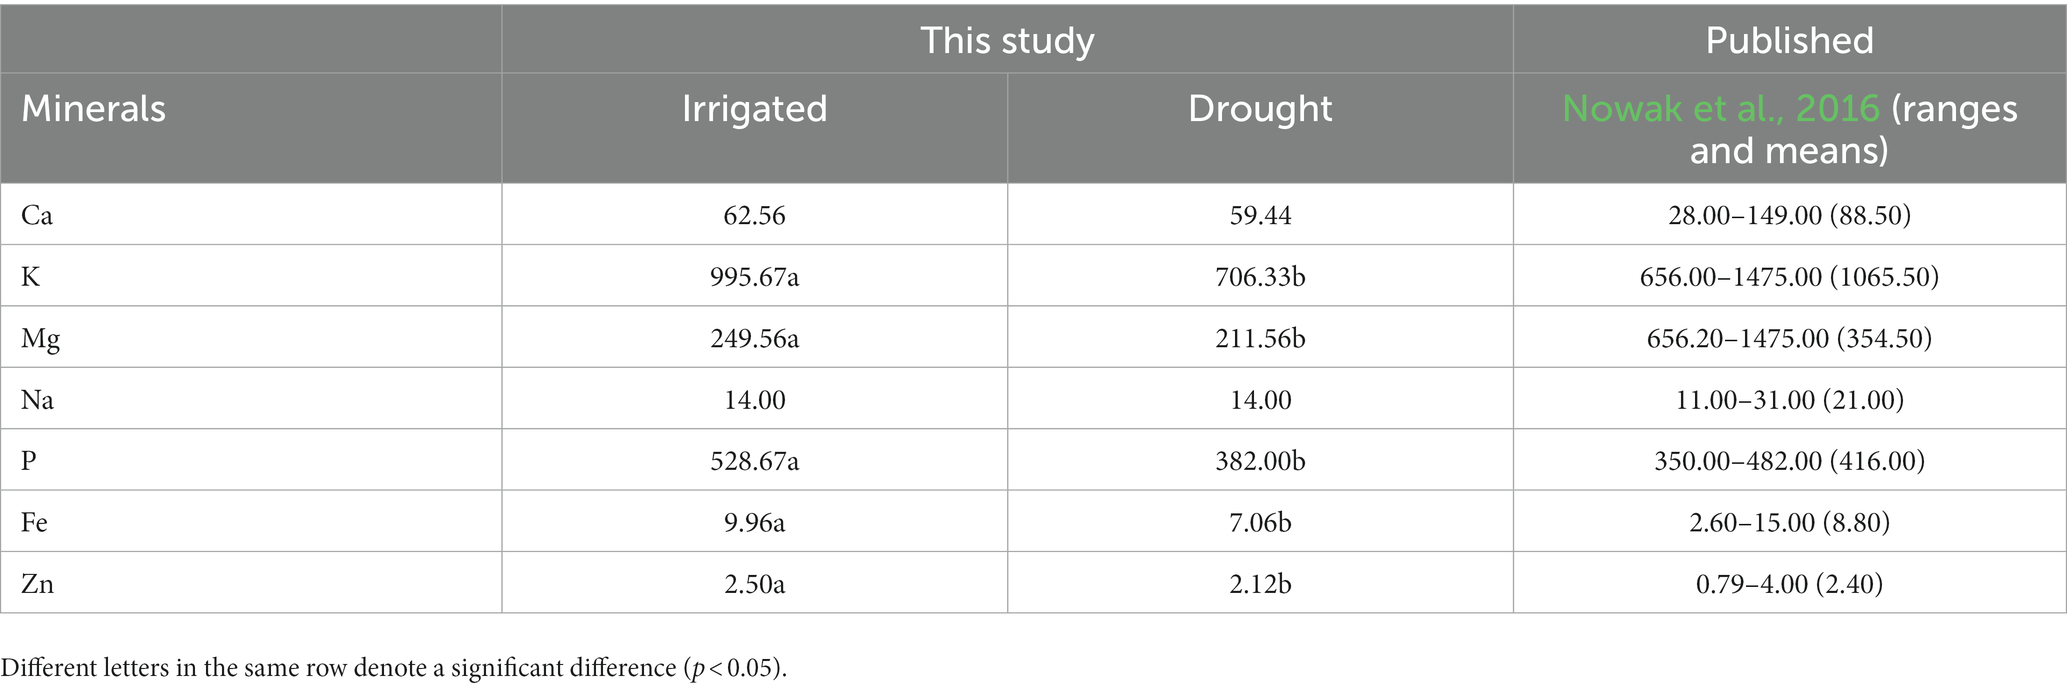
Table 6. Mineral contents of irrigated and drought-stressed quinoa grains (mg 100 g−1 D.W.) presented with published results.
4. Discussion
This study revealed that quinoa can be considered a climate-resilient crop and successfully cultivated under drought stress conditions in Missouri, United States. Genotypes grown under drought environments performed well compared to those grown under rainfed and irrigated conditions. It also revealed high diversity among genotypes for various agronomic parameters such as plant height, days to maturity, panicle length, 100-seed weight, and grain yield. Notably, we obtained better grain yield under drought conditions. Except for days to maturity, no significant genotype by environment interaction was observed among genotypes for all traits, including grain yield. This finding suggests that genotypes performed consistently across different environments which could be valuable for researchers in selecting the best genotypes for the study area and the specific traits of interest.
Plant height exhibited significant differences among the genotypes and across the three environments. The tallest plant height (183.32 cm) was recorded under drought stress, followed by irrigated (145.04) and rainfed (137.63) conditions. Our result, obtained under irrigated conditions, is similar to the average plant height (144 cm) obtained at Washington State University, United States, (Craine et al., 2023). In this study, a positive association was observed between plant height and grain yield, indicating that taller quinoa plants tended to produce better grain yields. The selected 10 genotypes showed differences in grain yield across the different environments. However, no significant differences were observed for genotype x environment interactions suggesting that quinoa genotypes consistently produced grain yields across the selected environments.
There was a significant genotypic difference in panicle length, with distinct variations observed under drought stress compared to the other two environments (irrigated and rainfed), while no difference was found between the latter two. The panicle length in this study was lower than that reported by Craine et al. (2023).
Regarding days to maturity, no significant differences were observed among the environments and genotypes x environment interaction. Our results showed maturity durations closer to those reported by Dubai, UAE, and Washington State University, United States, as found by Oustani et al. (2023), where a wide variation in days to maturity was reported, ranging from 93 days in Dubai, UAE, to 190 days in South America.
Significant genotypic variation was recorded for 100-seed weight, with seed weight being significantly higher under drought conditions than in the other two environments (rainfed and irrigated). This may be because quinoa does not require the application of more water during the reproductive stage, which may be the case in irrigated and rainfed environments of this study. However, no significant variation was found between the irrigated and rainfed environments. Our study revealed a positive correlation between grain yield and seed weight, which agrees with earlier findings (Craine et al., 2023).
Our findings cannot be directly compared to other results due to substantial variations in yield and yield-related traits found in different countries, as well as the use of different genotypes, test locations, soil, temperature, humidity, rainfall, irrigation intensity, and altitude. Furthermore, other research on drought stress may differ due to genotypes, study environments, timing, fertilizations, and drought intensity (20, 30, 50% reduced or available water, and no water application from anthesis to harvest).
Hafeez et al. (2022) conducted a study where they clustered 117 USDA quinoa germplasms into four distinct groups (G1 to G4). They reported that G3 and G4 genotypes, originating from sea level, were the best performers under Mediterranean climates in Pakistan. The genotypes of these groups were characterized as higher yielders with medium plant height, panicle length, and growth duration. It is worth noting that ten genotypes of this study fall under G3 and G4 groups as well.
This study found high variability in grain yield among genotypes across different environments. Grain yield was significantly higher under drought conditions than in irrigated and rainfed environments. The lower grain yield in irrigated and rainfed fields could be attributed to heavy rain during the seedling and vegetative stages, as well as strong winds during anthesis and maturity, which led to stem breaking and lodging. In contrast, the drought study was conducted in a high tunnel, offering protection from rain (with drip irrigation when necessary), excessive wind, and pest infestation, which prevented stem breaking and lodging. This study found that genotypes accounted for significant variation in yield and yield-related components for most traits, but genotype by environment interactions was not significant. These results are consistent with earlier findings (Bhargava et al., 2007; De Santis et al., 2018; Hafeez et al., 2022). Additionally, Gámez et al. (2019) found no significant difference in grain yield between well-watered and water stress (20% available water) in the quinoa genotype Rainbow.
Our results indicated positive correlations between grain yield and other agronomic traits, including plant height, 100-seed weight, and panicle length, suggesting that the higher values of these agronomic traits were associated with higher grain yields. These findings align with earlier findings by Bhargava et al. (2007), Hafeez et al. (2022), and Saddiq et al. (2021), Yang et al. (2016). Other authors also found a positive correlation between grain yield and panicle length (Spehar and Santos, 2005; Saddiq et al., 2021; Hafeez et al., 2022) and plant height (Oustani et al., 2023). Moreover, a positive correlation was observed between days to maturity and plant height and panicle length, indicating that seed maturity may be influenced by these agronomic parameters at harvest.
4.1. Nutritional composition under drought
The impact of drought stress on crop yield is well-documented, but its effect on nutrient content has yet to be studied. In this study, the nutritional analysis revealed a significant difference in the components of proximate, essential amino acids and minerals. However, some elements showed non-significant differences between the two environments (irrigated and drought). Results of the proximate analysis of this study are presented in Figure 4. Previous studies by different authors have reported inconsistent impacts of drought on the chemical composition of quinoa grains. These inconsistencies are likely attributed to differences in genotypes, study environments, timing, fertilizations, and drought intensity.
This study found significant differences in protein, carbohydrate, and ash contents between the irrigated and drought environments, while no differences were observed in fat and fiber contents. This research revealed a higher grain yield under drought stress with significantly lower protein content. Craine et al. (2023) found that protein content was negatively correlated with yield. Our results are more comparable with the findings by Craine and Murphy (2020) and Craine et al. (2023), who conducted their study in the United States.
This study found no significant differences in the concentrations of essential amino acids (AA) between the irrigated and drought environments, except for methionine and tryptophan. The essential AA concentrations obtained under the irrigated environment of this study fall within the range of earlier reports (Nowak et al., 2016; Craine and Murphy, 2020). In another study by Fischer et al. (2017), conducted under 20% available water conditions, they also found no significant differences for most essential AA, except for significantly higher values of histidine and threonine. Most of the AA values of our drought stress environment align with the earlier study conducted at 20% available water level. Moreover, Pulvento et al. (2022) found no significant difference in total protein content under fresh and saline water conditions at 100 and 30% irrigation levels, and they assumed no changes occurred in the AA composition of quinoa grains. Based on the results of this study and available literature, drought stress does not significantly affect the nutritional composition of quinoa grains.
Lastly, this study found a significant variation in mineral contents (mg 100 g−1 DW) of quinoa grains between irrigated and drought environments. Overall, the values of all mineral elements were higher under irrigated conditions compared to drought, with the exception of Ca and Na. The order of mineral content values, from the highest to the lowest, was K, P, Mg, Ca, Na, Fe, and Zn. These findings align with a previous publication by Nowak et al. (2016), who also reported substantial variations in the mineral contents of quinoa grains. Additionally, Vega-Gálvez et al. (2010) suggested that soil type, composition, and fertilizer application play an important role in the variation of mineral contents in quinoa grains.
5. Conclusion
Our field and high tunnel trials conducted in Missouri, United States, in 2021 and 2022 confirmed that quinoa is a drought-tolerant crop. Grain yield was significantly higher under drought stress than in irrigated and rainfed environments. However, no significant differences were found in yield between the irrigated and rainfed conditions. Although total protein content varied between the irrigated and drought-stress environments, there were no differences in essential amino acids. However, our results revealed a significant variation in some essential mineral element contents between the irrigated and drought environments. These findings, along with other related reports suggest that quinoa is well adapted to drought-stress environments, maintains protein quality and higher concentrations of essential amino acids. Therefore, we believe that quinoa is one of the climate-smart crops as the genotypes evaluated in this study perform well under moisture-stress conditions. Further research is warranted to explore the full yield potential of quinoa under drought stress. To achieve this, we have planned a comprehensive study involving scientists from various disciplines, including irrigation engineering, crop physiology, and soil science.
Data availability statement
The original contributions presented in the study are included in the article/supplementary material, further inquiries can be directed to the corresponding author.
Author contributions
SP: funding acquisition and project supervision, data curation, conceptualization, methodology, data analysis, and writing. AA: data analysis, review, and editing. KC: review and editing. SP and GN: fieldwork and data collection. All authors contributed to the article and approved the submitted version.
Funding
The research was funded to the senior author (SP) by the USDA-NIFA Capacity Building Grant (Project# 2020-38821-31090) for “Evaluation of promising quinoa lines in the Midwest for enhanced food security and sustainability.” Additionally, partial support through the USDA-NIFA Evans-Allen project (award #1019846).
Acknowledgments
The senior author (SP) would like to thank Lincoln University of Missouri for supporting the research and USDA-NIFA for funding the senior author. Also, the authors would like to thank the USDA-Germplasm Resources Information Network (GRIN) for providing quinoa germplasm through GRIN-North Central Research Plant Introduction Station, Ames, IA, United States. A special thanks to Frieda Eivazi, Touria Eaton, Babu Valliyodan, and Manzoor Chowdhury for their valuable suggestion during the research work. A special thanks goes to Stephanie Cobian for editing the manuscript. The authors also acknowledge the help of Rashedul Islam and Sadia Jhumur in field planting.
Conflict of interest
The authors declare that the research was conducted in the absence of any commercial or financial relationships that could be construed as a potential conflict of interest.
Publisher’s note
All claims expressed in this article are solely those of the authors and do not necessarily represent those of their affiliated organizations, or those of the publisher, the editors and the reviewers. Any product that may be evaluated in this article, or claim that may be made by its manufacturer, is not guaranteed or endorsed by the publisher.
Footnotes
1. ^https://weatherspark.com/y/10944/Average-Weather-in-Jefferson-City-Missouri-United-States-Year-Round
2. ^https://wcc.sc.egov.usda.gov/nwcc/site?sitenum=2223
3. ^http://agebb.missouri.edu/weather/history/index.asp?station_prefix=bfd
References
Alandia, G., Rodriguez, J., Jacobsen, S.-E., Bazile, D., and Condori, B. (2020). Global expansion of quinoa and challenges for the Andean region. Glob. Food Secur. 26:100429. doi: 10.1016/j.gfs.2020.100429
AOAC. (2006). Association of Official Analytical Chemists. Official methods of analysis (18th). AOAC International. Gaithersburg, MD.
Bandurska, H. (2022). Drought stress responses: coping strategy and resistance. Plan. Theory 11:922. doi: 10.3390/plants11070922
Bazile, D., and Baudron, F. (2015). “The dynamics of the global expansion of quinoa growing in view of its high biodiversity” in State-of-the-art report of quinoa in the world in 2013. eds. D. Bazile, H. D. Bertero, and C. Nieto (Rome: FAO and CIRAD), 42–55. Available at: https://www.fao.org/3/a-i4042e.pdf
Bazile, D., Pulvento, C., Verniau, A., Al-Nusairi, M. S., Ba, D., Breidy, J., et al. (2016). Worldwide evaluations of quinoa: preliminary results from post international year of quinoa FAO projects in nine countries. Front. Plant Sci. 7:850. doi: 10.3389/fpls.2016.00850
Bhargava, A., Shukla, S., and Ohri, D. (2006). Chenopodium quinoa-an Indian perspective. Ind. Crop. Prod. 23, 73–87. doi: 10.1016/j.indcrop.2005.04.002
Bhargava, A., Shukla, S., and Ohri, D. (2007). Genetic variability and interrelationship among various morphological and quality traits in quinoa (Chenopodium quinoa Willd.). Field Crop Res. 101, 104–116. doi: 10.1016/j.fcr.2006.10.001
Craine, E. B., Davies, A., Packer, D., Miller, N. D., Schmöckel, S. M., Spalding, E. P., et al. (2023). A comprehensive characterization of agronomic and endues quality phenotypes across a quinoa world core collection. Front. Plant Sci. 14:1101547. doi: 10.3389/fpls.2023.1101547
Craine, E. B., and Murphy, K. M. (2020). Seed composition and amino acid profiles for quinoa grown in Washington state. Front. Nutr. 7:126. doi: 10.3389/fnut.2020.00126
De Santis, G., Ronga, D., Caradonia, F., Ambrosio, T. D., Troisi, J., Rascio, A., et al. (2018). Evaluation of two groups of quinoa (Chenopodium quinoa Willd.) accessions with different seed colours for adaptation to the Mediterranean environment. Crop Pasture Sci. 69, 1264–1275. doi: 10.1071/CP18143
FAO (2011). “Resolution” in Quinoa: An ancient crop to contribute with world food security, FAO regional Office for Latin America and the Caribbean (Santiago de Chile: Food and Agriculture Organization of the United Nations)
FAOSTAT. (2022). FAOSTAT Database. Available at: https://www.fao.org/faostat/en/#data/QCL
Fathi, A., and Kardoni, F. (2020). The importance of quinoa (quinoa Chenopodium Willd.) cultivation in developing countries: a review. Cercet. Agron. Mold. 53, 337–356. doi: 10.46909/cerce-2020-030
Fischer, S., Wilckens, R., Jara, J., Aranda, M., Valdivia, W., Bustamente, L., et al. (2017). Protein and antioxidant composition of quinoa (Chenopodium quinoa Willd.) sprout from seeds submitted to water stress, salinity, and light conditions. Ind. Crop. Prod. 107, 558–564. doi: 10.1016/j.indcrop.2017.04.035
Fuentes, F., and Bhargava, A. (2011). Morphological analysis of quinoa germplasm grown under lowland desert conditions. J. Agron. Crop Sci. 197, 124–134. doi: 10.1111/j.1439-037X.2010.00445.x
Gámez, A. L., Soba, D., Zamarreño, Á. M., García-Mina, J. M., Aranjuelo, I., and Morales, F. (2019). Effect of water stress during grain filling on yield, quality and physiological traits of illpa and rainbow quinoa (Chenopodium quinoa Willd.) cultivars. Plan. Theory 8:173. doi: 10.3390/plants8060173
Gordillo-Bastidas, E., Diaz-Rizzolo, D. A., Roura, E., Massanes, T., and Gomis, R. (2016). Quinoa (Chenopodium quinoa Willd), from nutritional value to potential health benefits: an integrated review. J. Nutrn. Food Sci. 6:497. Available at: https://hdl.handle.net/2445/109262
Hafeez, M. B., Iqbal, S., Li, Y., Saddiq, M. S., Basra, S. M. A., Zhang, H., et al. (2022). Assessment of phenotypic diversity in the USDA collection of quinoa links genotypic adaptation to germplasm origin. Plan. Theory 11:738. doi: 10.3390/plants11060738
Hinojosa, L., González, J. A., Barrios-Masias, F. H., Fuentes, F., and Murphy, K. M. (2018). Quinoa abiotic stress responses: a review. Plan. Theory 7:106. doi: 10.3390/plants7040106
Jacobsen, S.-E. (2017). The scope for adaptation of quinoa in northern latitudes of Europe. J. Agronomy Crop Sci. 203, 603–613. doi: 10.1111/jac.12228
Langyan, S., Khan, F. N., and Kumar, A. (2023). Advancement in nutritional value, processing methods, and potential applications of Pseudocereals in dietary food: a review. Food Bioprocess Technol. 16, 1–20. doi: 10.1007/s11947-023-03109-x
Nowak, V., Du, J., and Charrondière, R. J. (2016). Assessment of the nutritional composition of quinoa (Chenopodium quinoa Willd.). Food Chem. 193, 47–54. doi: 10.1016/j.foodchem.2015.02.111
Olivera, L., Best, I., Paredes, P., Perez, N., Chong, L., and Marzano, A. (2022). Nutritional value, methods for extraction and bioactive compounds of quinoa. Pseudocereals :107. doi: 10.5772/intechopen.101891
Oustani, M., Mehda, S., Halilat, M. T., and Chenchouni, H. (2023). Yield, growth development and grain characteristics of seven quinoa (Chenopodium quinoa Willd.) genotypes grown in open-field production systems under hot-arid climatic conditions. Sci. Rep. 13:1991. doi: 10.1038/s41598-023-29039-4
Pulvento, C., Sellami, M. H., De Mastro, G., Calandrelli, D., and Lavini, A. (2022). Quinoa Vikinga response to salt and drought stress under field conditions in Italy. Environ. Sci. Proc. 16:5. doi: 10.3390/environsciproc2022016005
Rao, N. K., and Shahid, M. (2012). Quinoa- a promising new crop for the Arabian peninsula. American-Eurasian J. Agric. Environ. Sci. 12, 1350–1355. doi: 10.5829/idosi.aejaes.2012.12.10.1823
Rojas, W., Pinto, M., Alanoca, C., Gómez, P. L., Leon-Lobos, P., Alercia, A., et al. (2015). “Quinoa genetic resources and ex-situ conservation” in State of the art report on quinoa around the world in 2013. ed. D. Bazile (FAO, Rome), 56–82. Available at: http://www.fao.org/quinoa-2013/publications/detail/en/item/278923/icode/?no_mobile=1
Saddiq, M. S., Wang, X., Iqbal, S., Hafeez, M. B., Khan, S., Raza, A., et al. (2021). Effect of water stress on grain yield and physiological characters of quinoa genotypes. Agronomy 11:1934. doi: 10.3390/agronomy11101934
Sindhu, R., and Khatkar, B. (2019). “Pseudocereals: nutritional composition, functional properties, and food applications” in Food bioactives. eds. S. C. Deka, D. Seth, and N. R. S. Hulle (New Jersey: Apple Academic Press), 129–147.
Spehar, C. R., and Santos, R. L. D. (2005). Agronomic performance of quinoa selected in the Brazilian Savannah. Pesq. Agrop. Brasil. 40, 609–612. doi: 10.1590/S0100-204X2005000600012
Statista. (2023). Available at: https://www.statista.com/statistics/486411/us-quinoa-imports/#:~:text=This%20statistic%20features%20quinoa%20imports,kilograms%20in%20the%20previous%20year
Vega-Gálvez, A., Miranda, M., Vergara, J., Uribe, E., Puente, L., and Martínez, E. A. (2010). Nutrition facts and functional potential of quinoa (Chenopodium quinoa Willd.), an ancient Andean grain: a review. J. Sci. Food Agric. 90, 2541–2547. doi: 10.1002/jsfa.4158
Vilcacundo, R., and Hernández-Ledesma, B. (2017). Nutritional, and biological value of quinoa (Chenopodium quinoa Willd.). Current Opinion Food Sci. 14, 1–6. doi: 10.1016/j.cofs.2016.11.007
Walters, H., Carpenter-Boggs, L., Desta, K., Yan, L., Matanguihan, J., and Murphy, K. (2016). Effect of irrigation, intercrop, and cultivar on agronomic and nutritional characteristics of quinoa. Agroeco. Sust. Food Syst. 40, 783–803. doi: 10.1080/21683565.2016.1177805
Xiu-Shi, Y., Pei-You, Q., Hui-Min, G., and Gui-Xing, Y. R. (2019). Quinoa industry development in China. Cien. Inv. Agr. 46, 208–219. doi: 10.7764/rcia.v46i2.2157
Keywords: climate-smart crop, sustainability, abiotic stress, nutrient, food security, pseudocereal
Citation: Pathan S, Ndunguru G, Clark K and Ayele AG (2023) Yield and nutritional responses of quinoa (Chenopodium quinoa Willd.) genotypes to irrigated, rainfed, and drought-stress environments. Front. Sustain. Food Syst. 7:1242187. doi: 10.3389/fsufs.2023.1242187
Edited by:
Mohamed Ait-El-Mokhtar, University of Hassan II Casablanca, MoroccoReviewed by:
Sapna Langyan, Indian Council of Agricultural Research (ICAR), IndiaJosé Delatorre Herrera, Arturo Prat University, Chile
Juan Pablo Rodriguez, Julius Kühn-Institut – Braunschweig, Germany
Copyright © 2023 Pathan, Ndunguru, Clark and Ayele. This is an open-access article distributed under the terms of the Creative Commons Attribution License (CC BY). The use, distribution or reproduction in other forums is permitted, provided the original author(s) and the copyright owner(s) are credited and that the original publication in this journal is cited, in accordance with accepted academic practice. No use, distribution or reproduction is permitted which does not comply with these terms.
*Correspondence: Safiullah Pathan, cGF0aGFuc0BsaW5jb2xudS5lZHU=