
95% of researchers rate our articles as excellent or good
Learn more about the work of our research integrity team to safeguard the quality of each article we publish.
Find out more
ORIGINAL RESEARCH article
Front. Sustain. Food Syst. , 09 October 2023
Sec. Crop Biology and Sustainability
Volume 7 - 2023 | https://doi.org/10.3389/fsufs.2023.1228221
 Bipin Kumar1
 Shaloo1*
 Himani Bisht1*
 M. C. Meena2
 Abir Dey2
 Anchal Dass3
 Venkatesh Paramesh4
 Subhash Babu3
 Pravin Kumar Upadhyay3*Vijay Kumar Prajapati1
 Aniket Chandanshive5Truptimayee Suna1Sunil Kumar Yadav6Ashok Kumar Saini7Neeta Dwivedi1Pothula Srinivasa Brahmanand1Amit Kumar Jha8
Excessive application of nitrogen (N) in wheat cultivation results in substantial decreases in yield and limited economic gains, leading to adverse environmental consequences. In this study, the main objective is to assess and optimize the values of different N-assessing tools at varying levels of N for three wheat cultivars. Three non-destructive sensing devices: Leaf color chart (LCC), soil plant analyzer development (SPAD), and Green Seeker, were optimized at three levels of N (0, 90, 120, and 150 kg N ha−1) in three wheat cultivars, HD 2967, HD 3059, and HD 3086. The results indicated that at 60 days after sowing (DAS), the optimum values for LCC, SPAD, and GreenSeeker were 4.17, 0.62, and 44.2, respectively. These values were observed at the flag leaf stage, where they measured 4.12, 0.60, and 43.8, respectively, and this could be achieved at 120 kg N ha−1 with a grain yield of 4.87 t ha−1. At 120 kg N ha−1, considerably better gross return (Rs. 97,444.4), net income (Rs. 66,681.4), and B:C ratio (2.2) were obtained. The highest agronomic efficiency of N (21.2%) was recorded at 120 kg N ha−1, while the N uptake and recovery (129 kg ha−1 and 59.2 %) were significantly higher, recorded at 150 kg N ha−1. We can conclude that optimized values of these sensors at different doses of N would provide better guidance for precision N management that may reduce the input cost, maximize return, and minimize N losses in wheat.
Wheat is the second most important crop after rice in India, covering an area of 31.61 million hectares and yielding a production of 109.59 million tons (Ministry of Agriculture and Farmer Welfare, 2021–22)1. Although India has a sizable population, wheat offers an average of 500 kcal of nutritional energy per person per day on a national level (Dixon et al., 2009). The biggest challenge for India is producing 30% more wheat by 2050 (McDonald et al., 2022). Nitrogen (N) is one of the most important nutrients for crop growth and productivity. Wheat is sensitive to N deficiency and responds very well to nitrogenous fertilizers. Farmers in many regions of the world likely use excessive amounts of nitrogenous fertilizers to achieve a high yield. However, in a wheat-soil system, excessive N application may reduce grain yield and increase N losses (Wang et al., 2011). Although using N fertilizer has several advantages in wheat production, the indiscriminate application of N fertilizer leads to soil sickness and reduced food grain production (Rao et al., 2020). Nitrogen use efficiency (NUE) is also decreasing (Zhang et al., 2007; Singh, 2022), resulting in an increase in N loss to the environment through air emissions, leaching, and water or soil pollution (Singh and Craswell, 2021). Excessive N fertilizer application results in delayed senescence, plant lodging, insect and disease infestation, and poor grain standards. The main cause of decreasing NUE is inefficient N dose splitting combined with N application more than the crop requirements. Numerous environmental issues are brought on by reactive forms of N, such as nitrate (NO3), ammonia (NH3), and nitrogen oxides (NOx and N2O) (Hakeem et al., 2016). These include intensifying the effects of global warming and degrading both human and environmental health (Yu et al., 2020).
Better N management practices in wheat are some of the best options. To carefully plan N management, early assessment of crop development and N status, rapid N diagnosis, and appropriate fertilizer application are necessary. An integration of field crop morphological evaluation and indoor test analysis is used in traditional N management. This is not only time-consuming but also requires major labor and resources for sampling, measurement, and data processing. Monitoring and diagnosing the nutritional status quickly, non-destructively, and accurately will aid in determining the appropriate management approach and consumption of N in wheat.
The non-destructive plant phenotyping technique has recently gained popularity as a supplement to soil testing in the assessment of crop N demands and the recommendation of N fertilizer. Zhang et al. (2020) conducted a study on leaf N assessment in rice using Dualex and the SPAD meter and found that Dualex was more effective in estimating the chlorophyll content than the SPAD meter.
The association between SPAD values and agricultural productivity in high-yield scenarios was used to establish them (Hawkins et al., 2007), even though these are often appropriate for the same cultivars, development seasons, and growing areas. Debaeke and Justes (2006) developed a relationship between the nitrogen nutrition index (NNI) and the relative SPAD score of the topmost leaf of the wheat plant, rather than using the original SPAD value. SPAD can detect changes in NNI by minimizing the impact of the environment, which necessitates a large number of control groups for treatments, but this approach has certain practical limitations. To evaluate crop development and N nutrition status, image processing of color and digital photos have only been used at the early stages of wheat production (Li et al., 2010; Lee and Lee, 2013).
Yang et al. (2003) compared leaf color charts (LCCs) and a chlorophyll meter (SPAD) to estimate the leaf N status of rice (Oryza sativa L.) and properly time N fertilizer application. The LCC estimated N better across growth stages. LCC scores were closely related to SPAD values. Shukla et al. (2004) observed that in wheat, maintaining an LCC of ≤ 4 at 120 kg N ha−1 resulted in higher grain yield, N uptake, and NUE than that of the recommended N splits. Both LCC and SPAD readings were highly correlated in rice and wheat. Net returns were 19–31% higher in LCC-based N management than in fixed-time N application for rice–wheat cropping. Ali et al. (2020) developed a relationship using GreenSeeker-generated data from experiments involving multi-rate fertilizer N treatments in wheat. GreenSeeker was related to N uptake and wheat yield through an exponential function, explaining the variation in N uptake and grain yield, respectively.
Most studies so far have been conducted to validate these sensors separately in different crops. However, there are very few comparative studies available in the literature on different sensors in different wheat cultivars for better N management. Furthermore, regular validation of these tools with ruling cultivars is necessary. Thus, in this study, we validated and optimized three sensors, SPAD, GreenSeeker, and LCC, for the three most promising wheat cultivars grown in India. Additionally, a link was established between the grain yield and sensor scores, which may help in the precision N management of wheat.
The experiment was carried out for three consecutive years 2015–16, 2016–17, and 2017–18, during the rabi season at the research farm of the Water Technology Center, ICAR-Indian Agricultural Research Institute, New Delhi. The farm is 228.6 m above sea level and situated at a latitude of 28°35′ N and a longitude of 77°12′E (Figure 1).
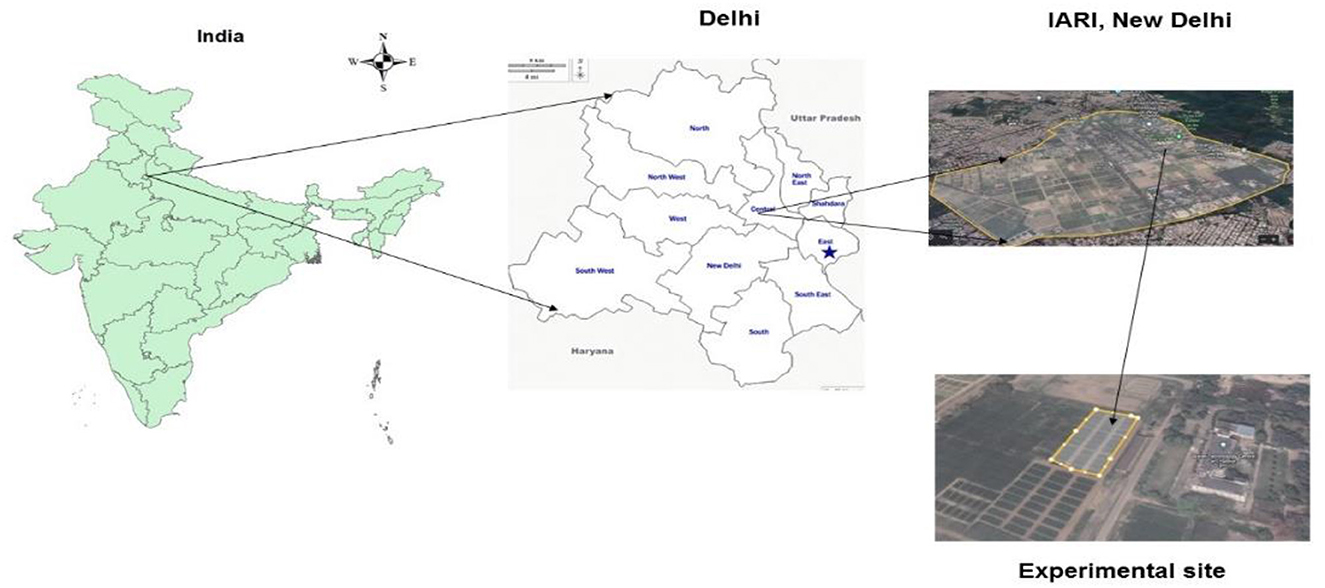
Figure 1. Study area map.
The soils were described as alluvial because of their sandy loam texture, low amount of organic matter (0.48%), low N content (76.31 kg ha−1), medium phosphorus content (22.86 kg ha−1), and high potassium content (160.35 kg ha−1). The total rainfall observed during the years 2015–16, 2016–17, and, 2017–18 were 21.6, 82.0, and 13.4 mm, respectively. The average maximum temperatures were 43.0, 43.2, and 41.5°C, and the average minimum temperatures were 9.3, 9.2, and 8.7°C during the growing season 2015–16, 2016–17, and 2017–18, respectively (Figure 2).
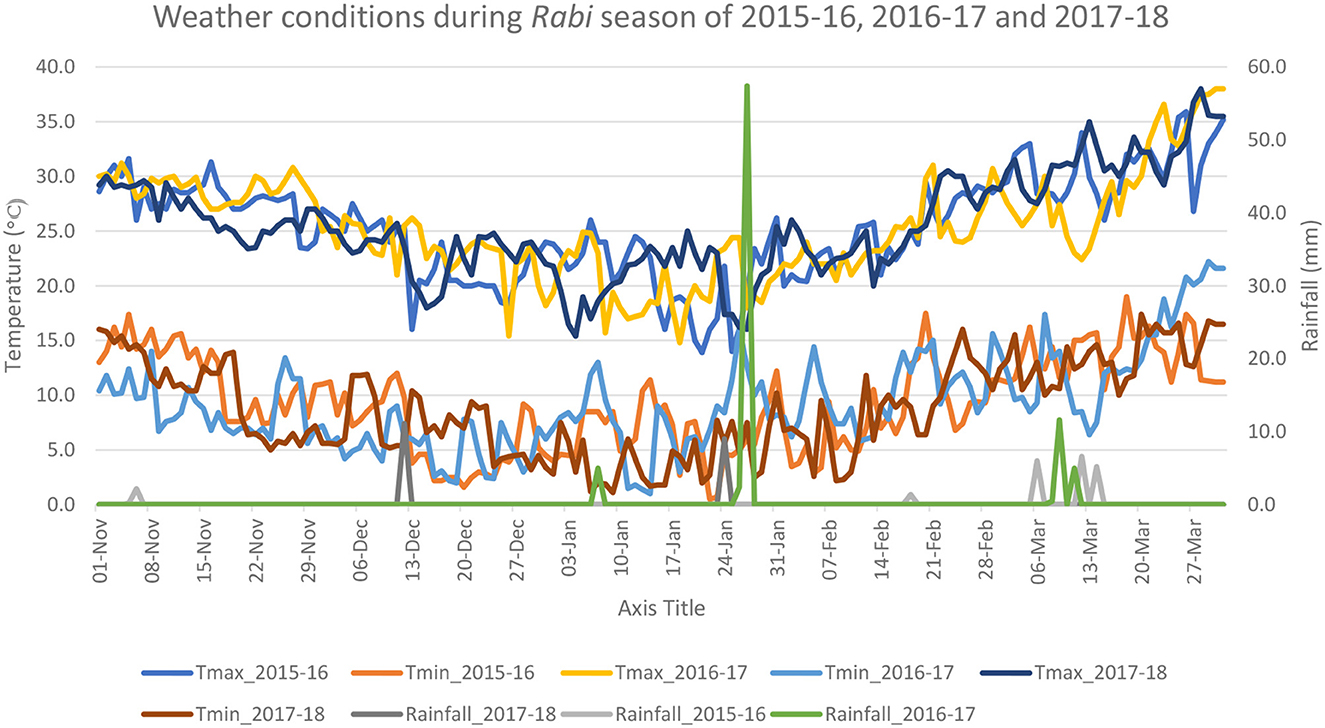
Figure 2. Climatic conditions of Delhi during rabi seasons.
The experiment was conducted in a split-plot design with three replications. Three wheat cultivars, HD 2967, HD 3059, and HD 3086, were assigned to the main plots, and subplots were assigned to four N treatments (0, 90, 120, and 150 kg N ha−1). The size of each plot was kept at 4.2 × 5 m. Urea was used to supply N, DAP was used to supply phosphorus, and muriate of potash (MOP) was used to supply potassium. The half dose of N @ 120 kg ha−1, as well as the total doses of phosphorus @ 60 kg ha−1 and potash @ 50 kg ha−1, was applied at the time of sowing. The remaining doses of N were applied in two split doses, the first at 25 DAS and the second at the flag leaf stage. other management practices were followed as per the recommended agronomy of wheat cultivation (Table 1).
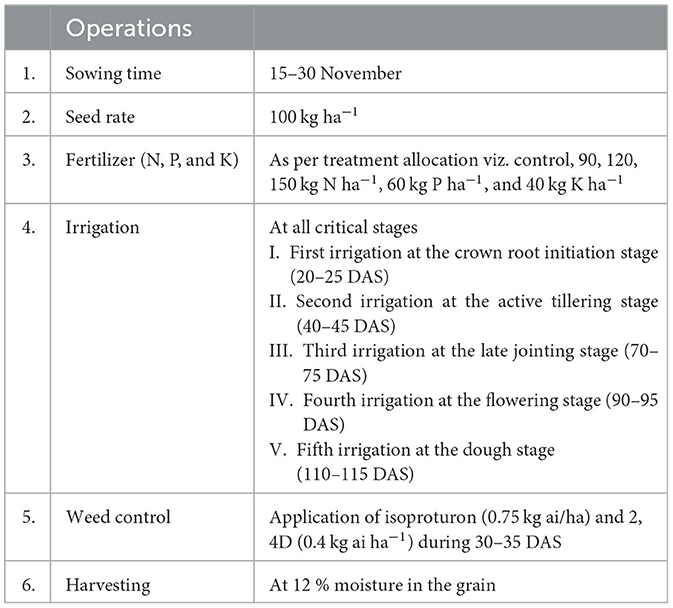
Table 1. Agronomy of wheat cultivation.
Five plants were randomly selected from each plot and marked permanently to record the plant height at 30, 60, and 90 DAS at the harvest stage. The wheat plant's height was recorded from the plant's ground level to the tip of its tallest leaf. In each plot, two distinct locations were counted for the average number of tillers per meter of row length at regular intervals. The leaf area was measured on plant samples that were collected to monitor dry matter production. After being detached from the stem, the leaves were washed with water, dried with tissue paper, and then reattached. Using a leaf area meter, the fresh green leaf area for each treatment was calculated (Model LICOR 3000, USA). At 30, 60, and 90 DAS, the leaf area index (LAI) was calculated using Evans' recommended formula (1972). The ratio of the leaf surface (on one side only) to the ground area that a plant occupies is known as the leaf area index.
Plants of 50 cm row length were harvested at different stages of growth from the sample rows. After recording the leaf area, these plants were sun-dried for 2–3 days and oven-dried at 60 ± 2°C for 24 h until the corrected weight, and the dry weight was recorded in grams m−2.
At harvest, the number of spikes m−2 was computed from the average of the number of spikes m−2 from two locations in each plot. Five randomly selected spikes from the five marked plants were used to measure the spike length (cm). The length was calculated as the average length from the neck to the tip of the spike. The total filled grains were counted from five randomly selected spikes from each plot, and their average was calculated. A seed counter was used to initially count the 1,000 grains that were extracted from tested spikes to determine their test weight.
The samples were harvested and collected from an area of 4 m−2, after leaving the boundary rows in each plot; all plants were manually picked at the ground level with an iron sickle to determine the grain and biological yield. A mechanized thresher was used to thresh plot-wise biomass. Grains that had been recovered, dried in the sun for 4 days (at 14% moisture content), and weighed were used. The straw yield was then calculated by subtracting the grain yield from the total amount of biomass generated (biological yield). The harvest index was calculated as per the formula given below:
The GreenSeeker, SPAD, and LCC data were recorded for the different plots at 30 DAS, 60 DAS, and the flag leaf stage. The GreenSeeker sensor was kept at 60 cm above the plant canopy during the measuring process, generating an oval field of vision with an area of 0.41 m−2. The SPAD values were computed using the average of three different leaf readings collected from the middle to top levels of the plant. They were collected from the center of the leaf, omitting the midrib to ensure that the sensor reading and the foliar N concentration were from the same plant.
For the LCC reading, 10 disease-free wheat plants were randomly selected from a field with a uniform plant population, and the topmost fully expanded leaf was selected from each plant. The reading was taken from the middle part of the leaf, and the leaf color was compared with the color panels of the LCC. The reading was taken under the shade of the body, to avoid the effects of direct sunlight on leaf color readings. Thereafter, the average LCC reading was calculated for the selected leaves.
At the flag leaf stage, two plant leaves were taken to estimate the N content (g kg−1 DM) in the leaves. Representative flag leave samples were collected and digested in concentrated H2SO4 at a temperature between 360 and 410°C in a digestion block for 2 h. A digestion acceleration mixture containing CuSO4 and K2SO4 in the ratio of 20:1 was added to the digestion tubes before placing them in the digestion block. Upon completion of digestion, the tubes were cooled and diluted, and concentrated alkali was added to the digests for distillation. The digests were steam-distilled using a micro-Kjeldahl distillation unit (Gerhardt Vapodest, VAP 30). The released NH3 was absorbed in 20 mL of mixed indicator containing 4% boric acid, and 0.1 N H2SO4 was used to titrate it (Kjeldahl 1883).
Efficiency estimation: The following formulae were used to calculate the agronomic efficiency and recovery efficiency:
The cost of cultivation was calculated based on prevailing market prices of the inputs during the respective crop seasons. Gross returns were calculated based on the grain and straw yields and their prevailing market prices during the respective crop seasons. Net returns were calculated by subtracting the cost of cultivation from gross returns. The cost of cultivation of wheat was computed by adding the cost of cultivation of the wheat crop.
Benefit: The cost (B:C) ratio was calculated by using the following expression:
The SPSS software (Version 10.0) was used to conduct statistical analyses using 3 years of experimental data. Between the different treatments, statistical calculations were performed using the least significant differences at the 0.05 probability levels. The correlation analysis was performed between sensor scores (LCC, SPAD, and GreenSeeker) and leaf N concentrations.
Significant differences in plant height were recorded among different doses of nitrogen at 30 and 60 days after sowing (DAS), as well as at the harvesting stage. Significantly higher plant heights of 30.1, 60.9, and 79.7 cm were observed at 30 DAS, 60 DAS, and the harvest stage, respectively, from the 150 kg N ha−1 applied plot (Table 2). The percentage increase in plant height at the harvest stage was 4.5, 9.4, and 15.2% at 90, 120, and 150 kg N ha−1, respectively, over the control treatment (0 kg N ha−1). Significant differences in the leaf area were recorded at the different doses of N. The highest leaf area (1,467.7 cm2) was recorded at 150 kg N ha−1 (Table 2), which was comparable to the leaf area observed at 120 kg N ha−1. However, the leaf area measured at 120 kg N ha−1 was found to be significantly higher than that measured at 90 kg N ha−1. At 30 DAS, a significant difference in dry weight was observed among all the nitrogen treatments, with the maximum value of 34.0 g mrl−1 at 150 kg N ha−1 and the minimum value of 24.6 g mrl−1 at 0 kg N ha−1. A similar trend was also recorded at 60 DAS. At 90 DAS, the maximum dry weight was observed at 150 kg N ha−1, which was significantly higher than that of the other N treatments, while no significant difference was found between 90 kg N ha−1 and the control (Table 3). Furthermore, no significant difference in plant height, leaf area, and dry weight was observed among the different wheat cultivars at all stages.
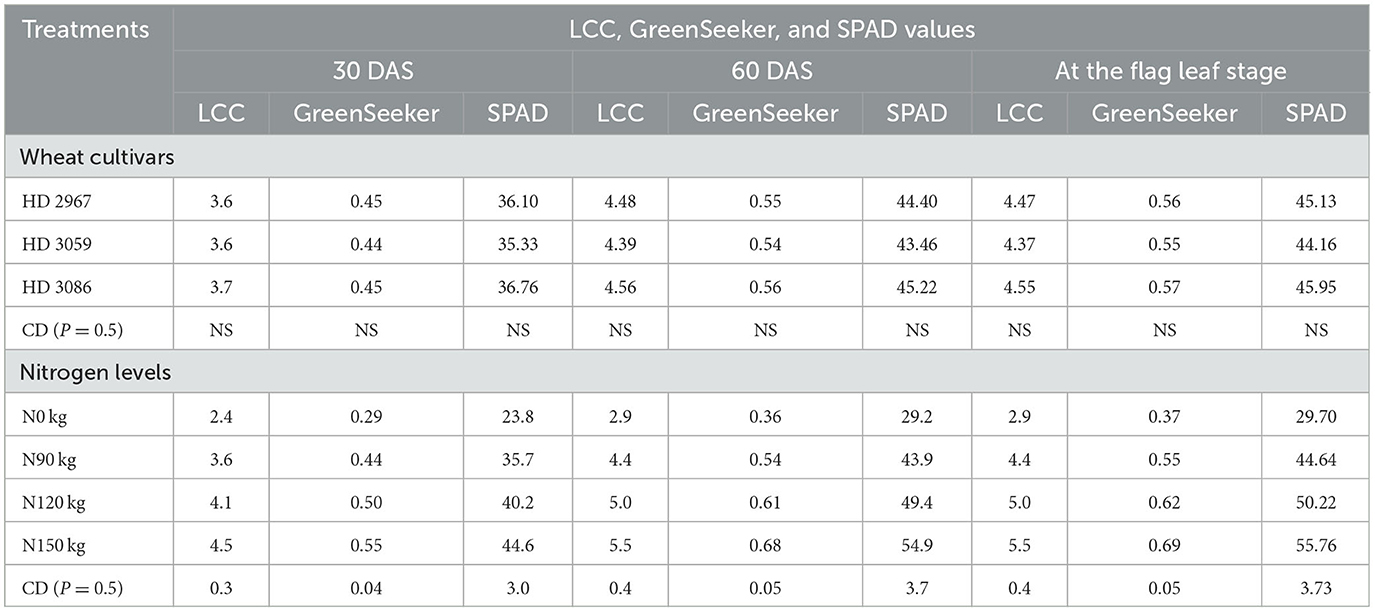
Table 2. LCC, GreenSeeker, and SPAD values at different doses of nitrogen in timely sown wheat cultivars at 30 DAS, 60 DAS, and the flag leaf stage (pooled).
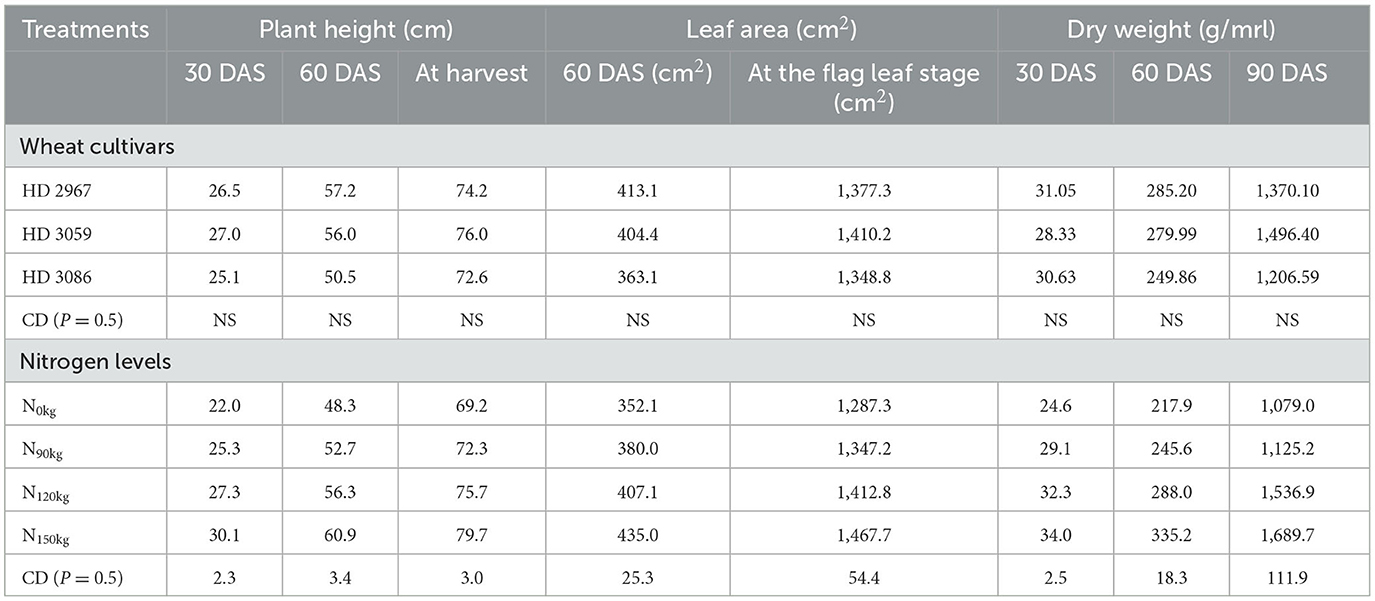
Table 3. Plant height, leaf area, and dry weight at different doses of nitrogen in timely sown wheat cultivars at different growth stages (pooled).
The grain (5.22 t ha−1) and biological yields (11.73 t ha−1) were significantly greater with 150 kg N ha−1 than with 90 and 0 kg N ha−1, which was at par with 120 kg N ha−1. A similar trend was recorded in the yield-attributing characters, such as the ear length (10.3 cm), test weight (52.4 g), the number of grain ear−1 (50.9), and the number of spikelet ear−1 (23.1) (Table 4).
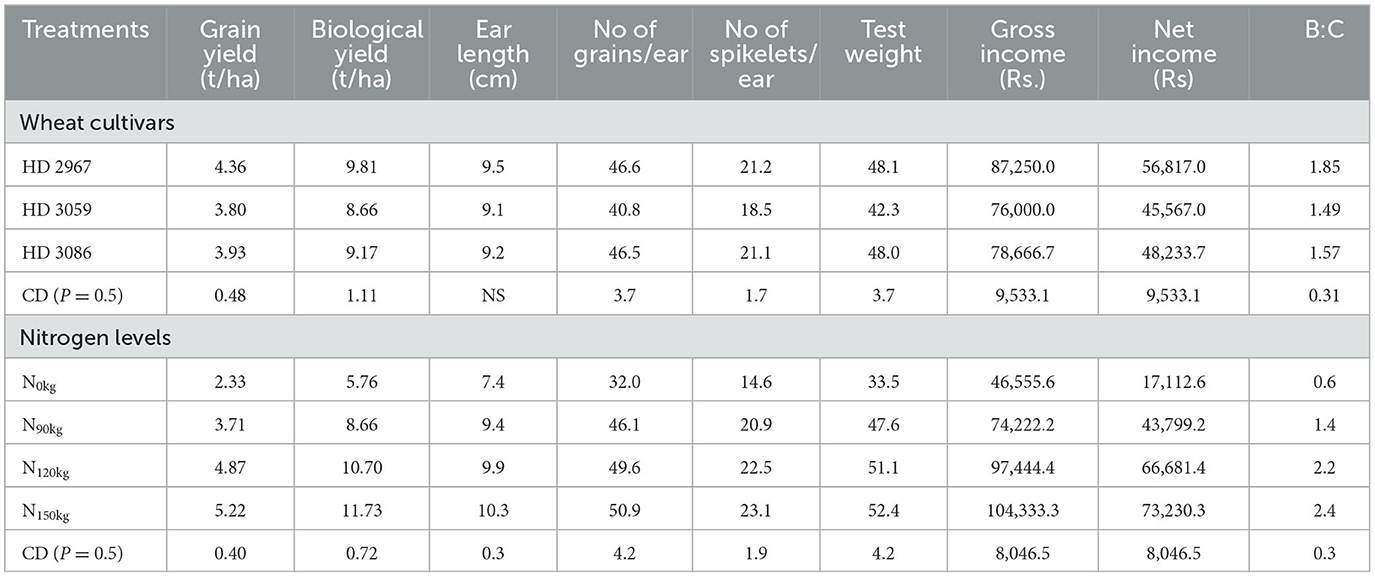
Table 4. Yield, yield-attributing characters, and economics of timely sown wheat cultivars at different doses of nitrogen (pooled).
Among the cultivars, HD 2967 recorded a significantly higher grain yield (4.36 t ha−1) and biological yield (9.81 t ha−1) than HD 3059, which was at par with HD 3086 across the different doses of N. The increase in the grain yield of 103.6% was recorded at 150 over 0 kg N ha−1, and the increases in the grain yield of 2.6, 30.1, and 52.4% were recorded when the fertilizer application was increased from 0 to 90 kg N ha−1, 90 to 120 kg N ha−1, and 120 to 150 kg N ha−1, respectively (Table 4). Compared to other cultivars, HD 2967 yielded a considerably better gross return (Rs. 87,250.0), net income (Rs. 56,817.0), and B:C ratio (1.85). Among the various nitrogen doses, 120 kg N ha−1 yielded a considerably better gross return (Rs. 97,444.4), net income (Rs. 66,681.4), and B:C ratio (2.2), and it was at par with 150 kg N−1 (Table 4).
Significantly higher LCC scores of 4.5, 5.5, and 5.5 were observed at 30 DAS, 60 DAS, and the flag leaf stage, respectively, with the application of 150 kg N ha−1, surpassing the LCC scores of other N treatments. Similarly, significantly higher GreenSeeker scores of 0.55, 0.68, and 0.69, as well as SPAD scores of 44.6, 54.9, and 55.76, were observed at 150 kg N ha−1 compared to other treatments at 30 DAS, 60 DAS, and the flag leaf stage, respectively. These increased scores were accompanied by a maximum grain yield of 5.22 t ha−1 and a biological yield of 11.73 t ha−1 at 150 kg N ha−1 (Table 4).
At 120 kg N ha−1, LCC scores of 4.1, 5.0, and 5.0; GreenSeeker scores of 0.55, 0.68, and 0.69; and SPAD scores of 40.2, 49.4, and 50.22 were observed at 30 DAS, 60 DAS, and the flag leaf stage, respectively. A strong and significant positive correlation was observed between the grain yield and the LCC, GreenSeeker, and SPAD scores (Figure 3). Furthermore, a significant positive correlation was observed between the doses of applied N and the LCC, GreenSeeker, and SPAD scores at the flag leaf stage (Figure 4).
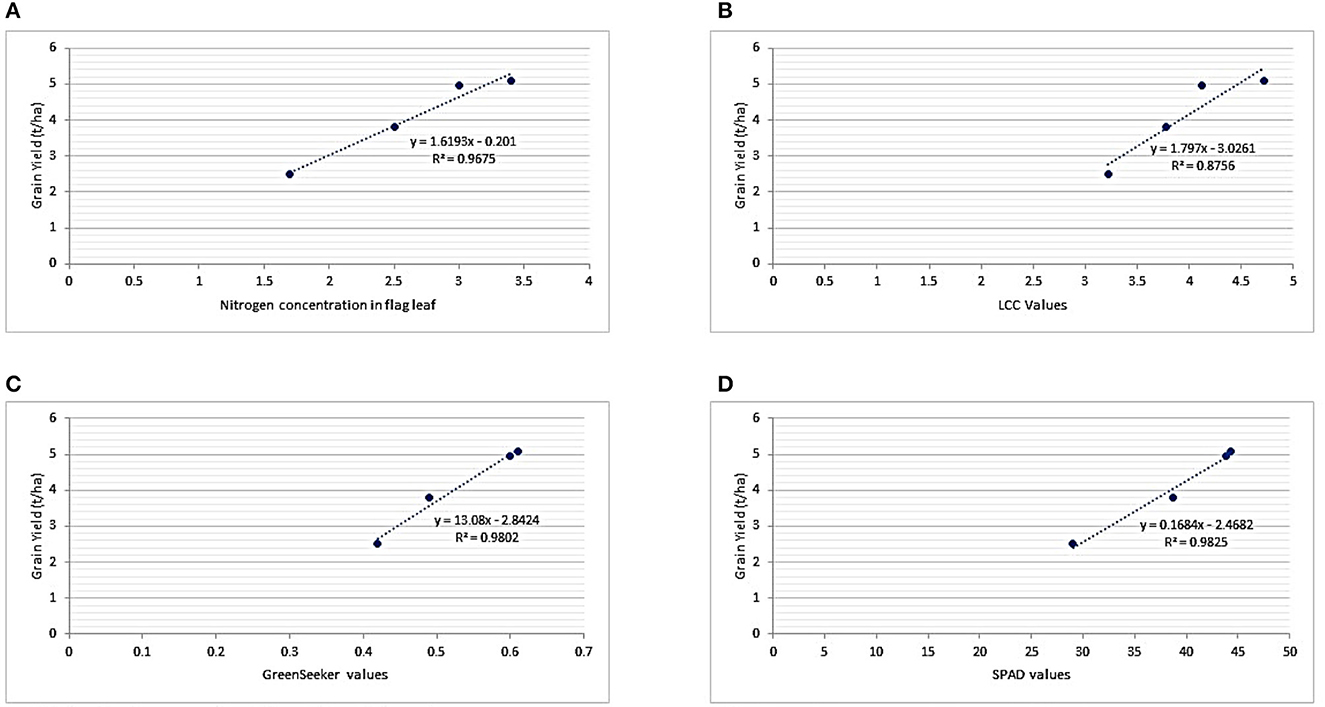
Figure 3. Relationship between wheat grain yield and LCC, GreenSeeker, and SPAD values. (A) Relationship between grain yield and flag leaf N content. (B) Relationship between grain yield and LCC values. (C) Relationship between grain yield and GreenSeeker values. (D) Relationship between grain yield and SPAD values.
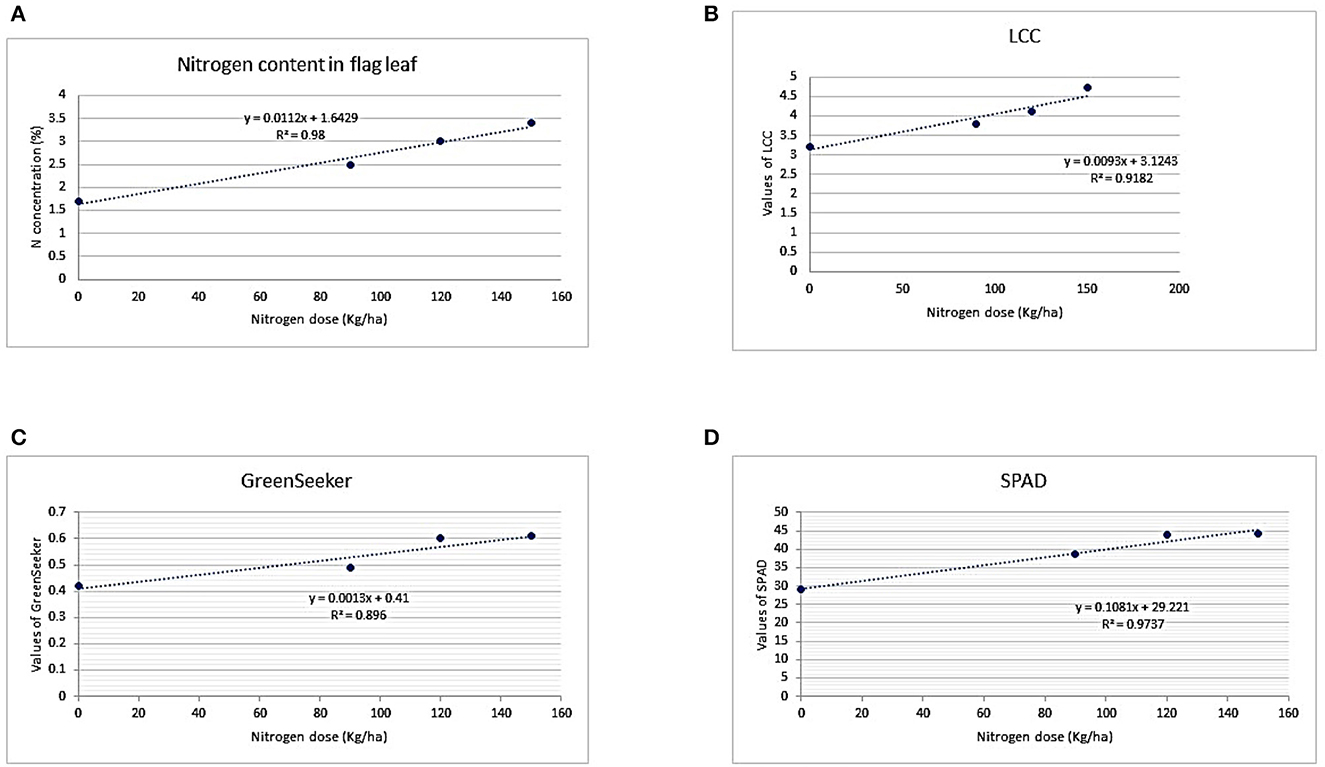
Figure 4. Relationship between doses of nitrogen and LCC, GreenSeeker, and SPAD values. (A) Relationship between flag leaf nitrogen and doses of nitrogen. (B) Relationship between LCC values and doses of nitrogen. (C) Relationship between GreenSeeker values and doses of nitrogen. (D) Relationship between SPAD values and doses of nitrogen.
Significant variations in the nitrogen concentration were observed in the leaf, stem, and root at the different nitrogen doses. Increasing the nitrogen doses from 0 to 150 kg N ha−1 resulted in a linear increase in the nitrogen concentration at the flag leaf stage, which also contributed to the increased LCC, GreenSeeker, and SPAD scores (Figure 3). The highest nitrogen concentration (3.4%) at the flag leaf stage was recorded at 150 kg N ha−1 (Table 5). The percentage increases in the nitrogen concentration at the flag leaf stage at different nitrogen doses were 32.0, 20.0, and 4.4% at 150, 120, and 90 kg N ha−1, respectively, over the control (0 kg N ha−1) (Table 5). Similarly, at harvest, the nitrogen content in the leaf (10.2 g kg−1), stem (5.1 g kg−1), and root (22.8 g kg−1) was significantly higher at 150 kg N ha−1.

Table 5. Nitrogen content in the leaf, stem, and root, as well as nitrogen uptake agronomic efficiency and recovery efficiency, at different doses of nitrogen in timely sown wheat cultivars (pooled).
The highest agronomic efficiency of nitrogen (21.2%) was recorded with 120 kg N ha−1, which was at par with the efficiency observed with 150 kg N ha−1. The highest nitrogen uptake (129.0 kg ha−1) and recovery efficiency (59.2%) were achieved with the application of 150 kg N ha−1 (Table 5).
Wheat is one of the most important rabi season crops in India. It plays a crucial role in the food security of the country. It has a long duration (140–160 days), so nutrient management throughout its growing season is an important practice for achieving optimum yield. N is one of the vital elements for its development, which is an important indicator of the photosynthetic rate, the overall nutritional status and yield, and the quality of wheat. The application of site-specific N throughout the growing season offers the opportunity to increase wheat grain production and quality (Argento et al., 2021). According to Erisman et al. (2008), N fertilizer plays an important role in increasing crop production, supporting more than >48% population. For the safety of the food supply and the sustenance of the people, fertilizers are essential (Dobermann et al., 2022). Although wheat productivity increases when balanced N is applied during the growing season, if applied excessively, its utilization by the plants is significantly reduced, which may become a reason for environmental pollution (Zhang et al., 2023). N is a structural component of amino acids, chlorophyll, nucleic acids, ATP, and phytohormones, necessary for the completion of the biological processes of plants including carbon and nitrogen metabolism, photosynthesis, and protein formation (Francis and Piekielek, 2012; Anas et al., 2020).
The most important challenge for us is maintaining proper soil health and fertilizer doses that can support the food demands of the burgeoning population with minimal environmental impact (Singh, 2018). SPAD, GreenSeeker, and LCC are significant non-invasive methods for determining the N content of plants during the growing period (Baker and Rosenqvist, 2004). Most earlier studies focused mainly on managing N in wheat using only one N-sensing tool and a single variety of wheat. In this study, we used three non-destructive sensing tools, SPAD, GreenSeeker, and LCC, to assess the three most promising varieties of wheat. We validated the results by comparing them with the chemically analyzed N content of the flag leaf, stem, and root. We found that when the N dose was increased up to 150 kg the plant height increased. This was aligned with the finding of Wang et al. (2020), who reported that root biomass, plant height, root length, and root diameter were all improved by N fertilizer. The leaf area recorded increased as the N dose increased from 0 kg N to 150 kg N ha−1. Rahman et al. (2014) reported that higher N fertilization had a considerable impact on the leaf area index and plant height of wheat. Similarly, Xu et al. (2023) reported that the application of N and K significantly increased the leaf area index (LAI). Plant height, branching architecture, and panicles control how efficiently plants use N and distribute it across various organs. A balance between these factors is crucial for optimal growth, development, and reproduction (Chen et al., 2017). The indicators of yield, such as ear length, grain and spikelet counts per ear, test weight, grain yield, and straw yield were higher at 150 kg N ha−1. Ullah et al. (2018) found that the treatment in which N was supplied at a rate of 203 kg ha−1 produced the most tillers, the tallest plants, and the highest biological output. Song et al. (2019) reported that N fertilization boosted oat grain yield and yield components by increasing chlorophyll fluorescence and photosynthetic activity. The qualities that attribute yield are a crucial factor for determining the marketable yield. Its favorable reaction in comparison to greater doses suggests that we must identify the ideal nitrogen dose. N is used to modify basic plant morphological components, including tiller quantity and panicle structure (Yi et al., 2019 and Yang et al., 2019). Among the cultivars, HD 3059 recorded higher grain and straw yields than HD 2967 and HD 3086. This might be due to the genetic potential of the variety to produce more at varying N doses.
The LCC scores of 4.5 and 5.5, Green Seeker scores of 0.55 and 0.68, and SPAD scores of 44.6 and 54.9 at 30 and 60 DAS, respectively, produced the highest grain (5.22 t ha−1) and biological yields (11.73 t ha−1) at 150 kg N ha−1(Table 4). At the flag leaf stage, 150 kg N ha−1 produced significantly greater LCC (5.5), Green Seeker (0.69), and SPAD (55.76) values than 90 kg Nha−1. It was comparable to the sensor score at 120 kg N ha−1. Ghosh et al. (2020) found that the effective control of N fertilizer using a SPAD-based N management method was significantly promising, with optimal SPAD threshold values of 37.5 and 41.8 for rice and wheat, respectively. When the value of LCC was kept at ~5, wheat growth and the yield component were highly significant (Kumar et al., 2013). Shukla et al. (2004) found that 120 kg N ha−1 is required to maintain an LCC score of 4, which resulted in higher grain production, N absorption, and NUE than the recommended N splits. Singh et al. (2020) calibrated an LCC score of 5 as a threshold value and advised fertilizer top dressing at this stage to increase grain yield from 6 to 10 % and improve the recovery and agronomic efficiency.
The N concentration in the flag leaf is a crucial indicator of N availability in plants. The photosynthate contribution of the flag leaf is more for grain development in wheat. That is why, N management based on the flag leaf N concentration is crucial. A significant positive correlation was found between the doses of N and the LCC, GreenSeeker, and SPAD values at the flag leaf stage (REF). The N concentration in the flag leaf and the sensors score were increased linearly with increasing doses of N. Shukla et al. (2004) observed in wheat that LCC and SPAD readings were highly correlated with yield and yield-attributing characters. We found that significant differences in the N concentration were recorded when the N level was changed.
The highest agronomic efficiency of N (21.2%) was recorded at 120 kg N ha−1. Arduini et al. (2006) and Hu et al. (2015) observed that the agronomic efficiency of applied N decreased with increasing levels of N. The N uptake and recovery efficiency of 129 kg N ha−1 and 59.2%, respectively, were found to be significantly higher at 150 kg N ha−1. Arduini et al. (2006) reported that N uptake increased with increasing doses of N, which might be due to the sufficient availability of N that increased N mobilization to the grain at the grain-filling stage. Almeida et al. (2023) found that the application of higher N doses in the soil leads to higher translocation and greater N uptake in Panicum maximum grass.
The current study's findings revealed that the rate of N fertilizer optimization with LCC, GreenSeeker, and SPAD had a substantial impact on dry matter accumulation, LAI, yield, and yield-contributing parameters. The results also showed that yield and yield-attributing characters are critically dependent on the amount of N fertilizer used. There were no significant differences between 150 kg N ha−1 and 120 kg N ha−1 for the economic parts of wheat-like yield and yield-attributing characters. The LCC scores of 4.1, 5.0, and 5.0; Green Seeker scores of 0.50, 0.61, and 0.62; and SPAD scores of 40.2, 49.4, and 50.2, at 30 DAS, 60 DAS, and the flag leaf stage, respectively, can be maintained for optimum yield by applying 120 kg N ha−1, although cultivars showed non-significant differences for sensors scores. The best recommendation from this experiment for achieving a higher grain yield and agronomic efficiency, as well as higher economic returns, is the application of 120 kg N ha−1 in two splits, one after the first irrigation (the crown root initiation stage) and the second at the flag leaf stage. Therefore, balanced N management procedures based on these sensors must be designed and implemented to optimize N use efficiency, which may help lower cultivation costs, produce crops with greater yields, and preserve soil fertility.
The original contributions presented in the study are included in the article/supplementary material, further inquiries can be directed to the corresponding authors.
BK, S, and HB: conceptualization and validation. BK, S, SY, and HB: data curation and formal analysis. BK: investigation, resources, and writing—original draft. BK, MM, ADe, ADa, VP, SB, PU, and VKP: methodology. BK, ADa, and PKU: project administration and supervision. S, HB, and SY: software. AC, TS, SY, AS, ND, PB, and AJ: writing—review and editing. All authors contributed to the article and approved the submitted version.
The authors are highly thankful to the ICAR-Indian Agricultural Research Institute, New Delhi-110012 for providing the necessary facilities for conducting the research.
The authors declare that the research was conducted in the absence of any commercial or financial relationships that could be construed as a potential conflict of interest.
All claims expressed in this article are solely those of the authors and do not necessarily represent those of their affiliated organizations, or those of the publisher, the editors and the reviewers. Any product that may be evaluated in this article, or claim that may be made by its manufacturer, is not guaranteed or endorsed by the publisher.
1. ^Annual Report (2021–22). Department of Agriculture & Farmers Welfare.
Ali, M., Ibrahim, S. M., and Singh, B. (2020). Wheat grain yield and nitrogen uptake prediction using atLeaf and GreenSeeker portable optical sensors at jointing growth stage. Inf. Proces. Agr. 7, 375–383. doi: 10.1016/j.inpa.2019.09.008
Almeida, E. M., Araújo, A. R., Difante, G. S., Macedo, M. C. M., Montagner, D. B., Gurgel, A. L. C., et al. (2023). Do different soil use and management systems change root weight? New. J. Agr. Res.
Anas, M., Liao, F., and Verma, K. K. (2020). Fate of nitrogen in agriculture and environment: agronomic, eco-physiological and molecular approaches to improve nitrogen use efficiency. Bio. Res. 53, 47. doi: 10.1186/s40659-020-00312-4
Arduini, I., Masoni, A., Ercoli, L., and Mariotti, M. (2006). Grain yield, and dry matter and nitrogen accumulation and remobilization in durum wheat as afected by variety and seeding rate. Eur. J. Agron. 25, 309–318. doi: 10.1016/j.eja.2006.06.009
Argento, F., Anken, T., and Abt, F. (2021). Site-specific nitrogen management in winter wheat supported by low-altitude remote sensing and soil data. PreCIS. Agr. 22, 364–386. doi: 10.1007/s11119-020-09733-3
Baker, N. R., and Rosenqvist, E. (2004). Applications of chlorophyll fluorescence can improve crop production strategies: an examination of future possibilities. J. ExP. Bot. 55, 1607–1621. doi: 10.1093/jxb/erh196
Chen, J., Fan, X., Qian, K., Zhang, Y., Song, M., Liu, Y., et al. (2017). pOsNAR2.1:OsNAR2.1 expression enhances nitrogen uptake efficiency and grain yield in transgenic rice plants. Plant Biot. J. 15, 1273–1283. doi: 10.1111/pbi.12714
Debaeke, P., and Justes, E. (2006). Relationship between the Normalized SPAD Index and the Nitrogen Nutrition Index: application to durum wheat. J. Plant Nutr. 29, 75–92. doi: 10.1080/01904160500416471
Dixon, J., Braun, H. J., Kosina, P., and Crouch, J. (2009). Wheat Facts and Futures 2009. Mexico: CIMMYT. Available online at: https://repository.cimmyt.org/handle/10883/1265 (accessed September 2, 2023).
Dobermann, A. (2007). “Nutrient use efficiency–measurement and management,” in Proceedings of the International Fertilizer Industry Association (IFA) Workshop on Fertilizer Best Management Practices, 7–9 March 2007 (Brussels), 1–28.
Dobermann, A., Bruulsema, T., Cakmak, I., Gerard, B., Majumdar, K., McLaughlin, M., et al. (2022). Responsible plant nutrition: a new paradigm to support food system transformation. Global Food Sec. 33, 2211–9124. doi: 10.1016/j.gfs.2022.100636
Erisman, J. W., Sutton, M. A., Galloway, J. N., Klimont, Z., and Winiwarter, W. (2008). How a century of ammonia synthesis changed the world? Nat. Geosci. 1, 636–639. doi: 10.1038/ngeo325
Francis, D. D., and Piekielek, W. P. (2012). Assessing Crop Nitrogen Needs with Chlorophyll Meters. The Site-Specific Management Guidelines series-12. Potash & Phosphate Institute (PPI).
Ghosh, M., Swain, D. K., Jha, M. K., Tewari, V. K., and Bohra, A. (2020). Optimizing chlorophyll meter (SPAD) reading to allow efficient nitrogen use in rice and wheat under rice-wheat cropping system in eastern India. Plant Proc. Sci. 23, 270–285. doi: 10.1080/1343943X.2020.1717970
Hakeem, K. R., Sabir, M., Ozturk, M., Akhtar, M. S., and Ibrahim, F. H. (2016). Nitrate and nitrogen oxides: sources, health effects and their remediation. Rev. Environ. Contam. Toxicol. 242, 183–217. doi: 10.1007/398_2016_11
Hawkins, J. A., Sawyer, J. E., Barker, D. W., and Lundvall, J. P. (2007). Using relative chlorophyll meter values to determine nitrogen application rates for corn. Agron. J. 99, 1034–1040. doi: 10.2134/agronj2006.0309
Hu, B., Wang, W., and Ou, S. (2015). Variation in NRT1.1B contributes to nitrate-use divergence between rice subspecies. Nat. Gene 47, 834–838. doi: 10.1038/ng.3337
Kumar, S. P. D., Patil, B. N., Hiremath, S. M., Koti, R. V., Angadi, V. V., and Basavraj, B. (2013). Nitrogen management through leaf color chart (LCC) on growth, yield and yield attributes of emmer wheat [Triticum dicoccum (Schrank.) Schulb] under irrigated conditions. Kar. J. Agric. Sci. 26, 350–355.
Lee, K. J., and Lee, B. W. (2013). Estimation of rice growth and nitrogen nutrition status using color digital camera image analysis. Eur. J. Agron. 48, 57–65. doi: 10.1016/j.eja.2013.02.011
Li, Y., Chen, D., Walker, C. N., and Angus, J. F. (2010). Estimating the nitrogen status of crops using a digital camera. Field Crops Res. 118, 221–227. doi: 10.1016/j.fcr.2010.05.011
McDonald, A. J., Singh, B., and Keil, A. (2022). Time management governs climate resilience and productivity in the coupled rice–wheat cropping systems of eastern India. Nat. Food 3, 542–551. doi: 10.1038/s43016-022-00549-0
Rahman, M. Z., Islam, M. R., Islam, M. T., and Karim, M. A. (2014). Dry matter accumulation, leaf area index and yield responses of wheat under different levels of nitrogen. Bang. J. Agric. Res. 7, 27–32.
Rao, C. S., Lakshmi, C. S., Kundu, S., Kumar, G. R., Manasa, R., and Rakesh, S. (2020). Integrated nutrient management strategies forrainfed agro-ecosystems of India. Ind. J. Fert. 16, 344–361.
Shukla, A. K., Ladha, J. K., Singh, V. K., Dwivedi, B. S., Balasubramanian, V., Gupta, R. K., et al. (2004). Calibrating the leaf color chart for nitrogen management in different genotypes of rice and wheat in a systems perspective. Agro. J. 96, 1606–1621. doi: 10.2134/agronj2004.1606
Singh, B. (2018). Are nitrogen fertilizers deleterious to soil health? Agriculture 8, 48. doi: 10.3390/agronomy8040048
Singh, B. (2022). Nitrogen use efficiency in crop production in india: trends, issues, and challenges. Agric. Res.
Singh, B., and Craswell, E. (2021). Fertilizers and nitrate pollution of surface and ground water: an increasingly pervasive global problem. SN App. Sci. 3, 518. doi: 10.1007/s42452-021-04521-8
Singh, J., Singh, V., and Kaur, S. (2020). Precision nitrogen management improves grain yield, nitrogen use efficiency and reduces nitrous oxide emission from soil in spring maize. J. Plant Nutr. 43, 2311–2321. doi: 10.1080/01904167.2020.1771588
Song, X., Zhou, G., Luo, M. B., Wu, W., Ahmad, I., Zhu, G., et al. (2019). Nitrogen application improved photosynthetic productivity, chlorophyll fluorescence, yield and yield components of two oat cultivars under saline conditions. Agronomy 9, 115. doi: 10.3390/agronomy9030115
Ullah, I., Ali, N., Durrani, S., Shabaz, M. A., Hafeez, A., Ameer, H., et al. (2018). Effect of different nitrogen levels on growth, yield and yield contributing attributes of wheat. Int. J. Sci. Env. Res. 9, 2229–5518. doi: 10.14299/ijser.2018.09.01
Wang, D., Xu, Z., Zhao, J., Wang, Y., and Yu, Z. (2011). Excessive nitrogen application decreases grain yield and increases nitrogen loss in a wheat-soil system. Acad. Agric. Sci. 61, 681–692. doi: 10.1080/09064710.2010.534108
Wang, L., Yang, L., Xiong, F., Nie, X., Li, C., Xiao, Y., et al. (2020). Nitrogen fertilizer levels affect the growth and quality parameters of Astragalus mongolica. Molecules 25, 381. doi: 10.3390/molecules25020381
Xu, W., Liu, S., and Feng, J. (2023). Rice canopy light resources allocation, leaf net photosynthetic rate, and yield formation characteristics response to combined application of nitrogen and potassium. J. Soil Sci. Plant Nutr. doi: 10.1007/s42729-023-01399-w
Yang, J. T., Schneider, H. M., Brown, K. M., and Lynch, J. P. (2019). Genotypic variation and nitrogen stress effects on root anatomy in maize are node specific. J. Exp. Bot. 70, 5311–5325. doi: 10.1093/jxb/erz293
Yang, W. H., Peng, S., Huang, J., Sanico, A. L., Buresh, R. J., and Witt, C. (2003). Using leaf color charts to estimate leaf nitrogen status of rice. Agron. J. 95, 2012–2017. doi: 10.2134/agronj2003.2120
Yi, J., Gao, J., Zhang, W., Zhao, C., Wang, Y., and Zhen, X. (2019). Differential uptake and utilization of two forms of nitrogen in japonica rice cultivars from north-eastern China. Fron. Plant Sci. 10, 1061. doi: 10.3389/fpls.2019.01061
Yu, G., Wang, J., and Liu, L. (2020). The analysis of groundwater nitrate pollution and health risk assessment in rural areas of Yantai, China. BMC Public Health 20, 437. doi: 10.1186/s12889-020-08583-y
Zhang, F. S., Cui, Z. L., Wang, J. Q., Li, C. J., and Chen, X. P. (2007). Current status of soil and plant nutrient management in china and improvement strategies. Chin. Bull. Bot. 24, 687–694.
Zhang, K., Liu, X., Ma, Y., Zhang, R., Cao, Q., Zhu, Y., et al. (2020). Comparative assessment of measures of leaf nitrogen in rice using two leaf-clip meters. Sensors 20, 175. doi: 10.3390/s20010175
Keywords: efficiency, GreenSeeker, LCC, nitrogen, nutrient, management, SPAD, wheat
Citation: Kumar B, Shaloo, Bisht H, Meena MC, Dey A, Dass A, Paramesh V, Babu S, Upadhyay PK, Prajapati VK, Chandanshive A, Suna T, Yadav SK, Saini AK, Dwivedi N, Brahmanand PS and Jha AK (2023) Nitrogen management sensor optimization, yield, economics, and nitrogen use efficiency of different wheat cultivars under varying nitrogen levels. Front. Sustain. Food Syst. 7:1228221. doi: 10.3389/fsufs.2023.1228221
Received: 24 May 2023; Accepted: 15 September 2023;
Published: 09 October 2023.
Edited by:
Raju Datla, Global Institute for Food Security (GIFS), CanadaReviewed by:
Krishan K. Verma, Guangxi Academy of Agricultural Sciences, ChinaCopyright © 2023 Kumar, Shaloo, Bisht, Meena, Dey, Dass, Paramesh, Babu, Upadhyay, Prajapati, Chandanshive, Suna, Yadav, Saini, Dwivedi, Brahmanand and Jha. This is an open-access article distributed under the terms of the Creative Commons Attribution License (CC BY). The use, distribution or reproduction in other forums is permitted, provided the original author(s) and the copyright owner(s) are credited and that the original publication in this journal is cited, in accordance with accepted academic practice. No use, distribution or reproduction is permitted which does not comply with these terms.
*Correspondence: Shaloo, c2hhbG9vLmxvaGNoYWJAZ21haWwuY29t; Himani Bisht, aGltYW5pYmlzaHQyOUBnbWFpbC5jb20=; Pravin Kumar Upadhyay, cHJhdmluLm5kdUBnbWFpbC5jb20=
Disclaimer: All claims expressed in this article are solely those of the authors and do not necessarily represent those of their affiliated organizations, or those of the publisher, the editors and the reviewers. Any product that may be evaluated in this article or claim that may be made by its manufacturer is not guaranteed or endorsed by the publisher.
Research integrity at Frontiers
Learn more about the work of our research integrity team to safeguard the quality of each article we publish.