 Zhao Wang
 Yao Dai
 Jianhong Liu
 Zongfeng Chen
 Zhengsong Yu
94% of researchers rate our articles as excellent or good
Learn more about the work of our research integrity team to safeguard the quality of each article we publish.
Find out more
ORIGINAL RESEARCH article
Front. Sustain. Food Syst., 01 August 2023
Sec. Climate-Smart Food Systems
Volume 7 - 2023 | https://doi.org/10.3389/fsufs.2023.1219938
Climate-smart agriculture (CSA) is a global development strategy aimed to address the interlinked challenges of food security and climate change. Expanding the implementation of conservation agriculture (CA), a vital component of CSA, is essential for enhancing agricultural and food security resilience while sustainably managing arable land. However, the extensive heterogeneity of biophysical and socioeconomic conditions presents significant complexities in promoting CA adoption. Addressing these challenges, this study carried out a comprehensive theoretical investigation of biophysical and socioeconomic factors influencing CA adoption and performance, integrating stakeholder feedback to create a systematic and robust evaluation index system for assessing CA suitability. By integrating multi-influencing factor techniques and fuzzy logic methods, we spatially identified suitable areas for CA implementation in China, providing valuable insights for land use policy. The reliability of the models was verified through a sensitivity analysis using the map removal sensitivity analysis method and the extended Fourier amplitude sensitivity test. The results indicated that 29.78% of the cultivated land was unsuitable or marginally suitable for CA, while 29.30 and 40.92% were determined to be moderately suitable and suitable zones, respectively. Suitable cultivated land was primarily distributed in the northern arid and semi-arid regions, the Loess Plateau, the Huang-Huai-Hai Plain, and the Northeast China Plain. Conversely, unsuitable, and marginally suitable cultivated land was predominantly located in the Qinghai Tibet Plateau, Middle-lower Yangtze Plain, Sichuan Basin and surrounding areas, the Yunnan-Guizhou Plateau, and Southern China. The topographical index, annual mean precipitation, humidity index, and population density were identified as the most significant factors influencing CA suitability. The CA suitability maps generated in this study will guide the development and extension agents targeting CA to suitable locations with a high potential impact, thereby maximizing the likelihood of adoption and minimizing the risk of failure.
In the coming decades, food security is projected to become a significant global challenge (Bongaarts, 2020). Moreover, climate change’s influence on global agricultural production may be substantial due to climate variability and extreme meteorological events (Ortiz-Bobea et al., 2021). Climate-smart agriculture (CSA) has emerged as a global development strategy to address the intertwined challenges of food security and climate change (Palombi and Sessa, 2013). CSA’s primary goals involve alleviating vulnerability and fostering the resilience of agricultural and food-secure systems to climate change (Campbell et al., 2014). Conservation agriculture (CA), a vital component of CSA in arable systems, combines three interrelated practices (minimal or no tillage, biomass mulch soil cover, and crop rotation) to minimize the risk of yield damage from climate shocks and promote sustainable food production through efficient natural resource use and minimal environmental impact (Kassam et al., 2009; Pittelkow et al., 2015). Implementing biomass mulch soil cover in conjunction with minimal or no tillage helps prevent topsoil displacement and has the potential to rejuvenate soil organic carbon content. This approach can also contribute to enhanced soil moisture content and the water use efficiency. In addition, crop diversity, which includes crop rotation through different seasons and the use of legume crops as cover crops, can provide several benefits, such as improved pests and diseases control and enhanced soil health.
In China, the rising demand for food and the degradation of cultivated land pose considerable challenges to food security. It is estimated that over 19% of farmland is polluted, and approximately 50% of farmland is threatened by degradation (Chen et al., 2014). To secure its food supply, China must increase food output by 30–50% within the next 25–35 years (Li et al., 2016). Given China’s declining food production efficiency and escalating environmental costs, a paradigm shift toward a system-based CA approach represents a vital strategy for ensuring agricultural sustainability and food security (Li et al., 2016; Komarek, 2018; Lal, 2018). No-till, straw mulching, wheat-pea rotation, and corn-soybean intercropping are the most prevalent CA practices in China. CA is essential for the modernization of agriculture. Notably, CA offers two benefits: first, it helps preserve land resources, and second, it reduces production costs while maximizing land utilization efficiency and longevity (Komarek, 2018). The Central No. 1 Documents issued by the Central Committee of the Communist Party of China has repeatedly urged for CA’s advancement. However, despite numerous government policies and strategies to promote CA practices vigorously, adoption has been slow (Komarek, 2018; Kan et al., 2020). According to the China Agricultural Machinery Industry Yearbook, only 6.42% of China’s cultivated land was under CA in 2020, highlighting the need for greater CA promotion across Chinese regions.
The promotion and application of CA involve numerous scientific technologies, including agronomy, soil, plant protection, environment, farm machinery, and economics (Kassam et al., 2009). The knowledge-and technology-intensive nature of CA, combined with the heterogeneity of biophysical and socioeconomic conditions, intensifies the challenges associated with promoting CA (Xiao et al., 2020). Researchers are increasingly recognizing that the effectiveness of CA is site-specific (Prestele and Verburg, 2020; Rodenburg et al., 2021). Previous studies have underscored the importance of spatial targeting when promoting specific agricultural practices or technologies (Brandt et al., 2017; Notenbaert et al., 2017; Thornton et al., 2018; Andrade et al., 2019; Wiśniewski et al., 2021), as appropriate location targeting is crucial for scaling-out particular technologies and increasing adoption rates. Consequently, identifying regions with the potential to successfully implement CA practices is essential when promoting CA. Additionally, CA has been proposed as a beneficial strategy to support climate change mitigation and adaptation objectives due to its potential for large-scale carbon sequestration, greenhouse gas emission reduction, and its capacity to provide and regulate soil water and nutrients (Kassam et al., 2009; Li et al., 2016; Jat et al., 2020; Xiao et al., 2020). Therefore, accurate spatially explicit information on CA distribution can enhance the precision of various ecosystem modeling applications, allowing for a more realistic assessment of CA’s climate mitigation and adaptation potential (Prestele et al., 2018).
Several studies have identified the recommendation domains (RDs) where dual-use maize varieties (Notenbaert et al., 2013) and climate-smart agricultural practices (Notenbaert et al., 2017; Andrieu et al., 2021) are most likely to be implemented. Some studies have also focused on identifying suitable zones for CA (Tesfaye et al., 2015; Prestele et al., 2018). However, these studies have given limited consideration to the biophysical and socioeconomic factors that influence the performance and adoption of CA. Currently, there is a lack of a comprehensive evaluation indicator system for identifying suitable zones for CA. In this study, we addressed this gap by conducting a systematic review of the biophysical and socioeconomic factors that influence the performance and adoption of CA. We also conducted interviews with key stakeholders to gather valuable insights. Based on this information, we developed an evaluation indicator system for identifying suitable zones for CA. The evaluation indicator system incorporates factors utilised in previous studies by Tesfaye et al. (2015) and Prestele et al. (2018). Additionally, we included additional factors such as annual mean temperature, annual average effective accumulated temperature, soil organic matter, and the topographical index. Given the importance of CA in mitigating and adapting to climate change, as well as the significance of promoting services for the adoption of agricultural technologies in developing countries, our evaluation indicator system also considers the effects of climate change and extension services.
Furthermore, the existing studies have classified variables based on predetermined thresholds or expert knowledge, which may not accurately capture the continuous variation of environmental factors and small-scale spatial heterogeneity (Corona et al., 2008). To address this limitation, we employed fuzzy set theory, which allows for a gradual evaluation of parameter membership using a continuous scale of membership called the membership function (Burrough et al., 2015). Weights are crucial in fuzzy-based agricultural suitability evaluation, and fuzzy analytical hierarchy analysis (FAHP) is frequently used to estimate weights in fuzzy evaluations (Akpoti et al., 2019). However, FAHP cannot adequately represent the interaction or independence of variables. Considering the interrelated nature of attributes such as soil, topography, and climate, accounting for the correlation among independent thematic layers is essential in spatial mapping (Thomas and Duraisamy, 2018; Mandal et al., 2021). Muthoni et al. (2019) demonstrated that considering the correlation structure among covariates can improve the risk estimation of extrapolation technologies. The multi-influencing factor (MIF) technique fully incorporates the interaction between variables when determining parameter weights (Taheri et al., 2020). The applicability of this method for assessing agricultural suitability has been successfully examined and published by Nganga et al. (2020); Mandal et al. (2021); Roy et al. (2023). Hence, in this study, we employed the MIF technique to establish weights for various influencing variables or thematic layers, while employing fuzzy set theory to fuzzify the indicators. Subsequently, spatial integration of CA suitability analysis and weighted overlay analysis of spatial data were conducted.
The objectives of this study were (i) to establish a scientific and reasonable index system for assessing CA suitability for evaluating the spatial suitability of CA, (ii) to create a suitability map for CA in China and (iii) to evaluate the reliability and robustness of the resulting map. The initial step involved developing a robust evaluation index system to assess the suitability of CA. In the subsequent phase, fuzzy logic was employed to normalize the indicators, while the FAHP and MIF techniques were simultaneously utilised to determine the weights of the indicators. The CA suitability index was then calculated using the weighted overlay analysis method. Finally, the robustness of the suitability results was validated through both map removal-based sensitivity analysis and global sensitivity analysis techniques. The significant novelties are:
(i) The challenges posed by spatial heterogeneity in biophysical and socio-economic environments on the diffusion of CA have not been effectively addressed. The suitability map developed in this study offers a partial resolution to this predicament, providing decision-makers with a valuable tool to promote the implementation of CA in the most suitable environments. Additionally, the first high-resolution (1,000 × 1,000 m) national dataset of potential CA distribution in China can be utilised in various modeling studies to derive more realistic environmental impact assessments.
(ii) The development of a systematic and comprehensive evaluation index system, providing a theoretical foundation for an accurate evaluation of CA suitability that could be applied to other regions or countries.
(iii) The integration of MIF techniques and fuzzy logic methods to determine the suitability map for CA, with sensitivity analysis demonstrating the robustness and reliability of the results. This offers an efficient method for accurately identifying locations suitable for agricultural management practices.
Empirical evidence and relevant literature emphasize that successful and widespread diffusion and sustained adoption of agricultural innovations require a thorough evaluation of biophysical and socioeconomic factors influencing performance and adoption (Giller et al., 2011; Kassie et al., 2013; Arslan et al., 2014). Consequently, we systematically compiled factors affecting the performance and adoption of CA, drawing on both literature studies and stakeholder opinions. In January 2022, we conducted interviews with two technical experts researching CA, four agricultural extension specialists actively involved in CA extension, and ten producers who have implemented CA. During the interview process, stakeholders were asked to identify key factors they believed would impact the performance and adoption of CA. Subsequently, they were asked to rate the significance of each indicator using a Likert scale. The scores for each indicator were then aggregated and ranked in descending order in an effort to identify a consensus among stakeholders regarding the most important factors. We also considered data availability when selecting biophysical and socioeconomic variables to determine suitable areas for CA. In addition, we investigated the mechanisms by which factors influence the performance and acceptability of CA, as well as the action direction and scope of variables. We concurrently conducted an in-depth analysis of the interdependencies between variables. Defining the direction and scope of variable effects was intended to provide a theoretical foundation for the subsequent fuzzification of variables, while examining the interaction between indicators aimed to offer a theoretical basis for the MIF technique described in the following section. Table 1 presents a comprehensive list of the variables and sources of spatialized data used in this study. We will detail the basis for the selection of indicators and their mechanisms affecting CA in the following sections. This aims to provide a theoretical basis for the normalization of indicators and the MIF technique.
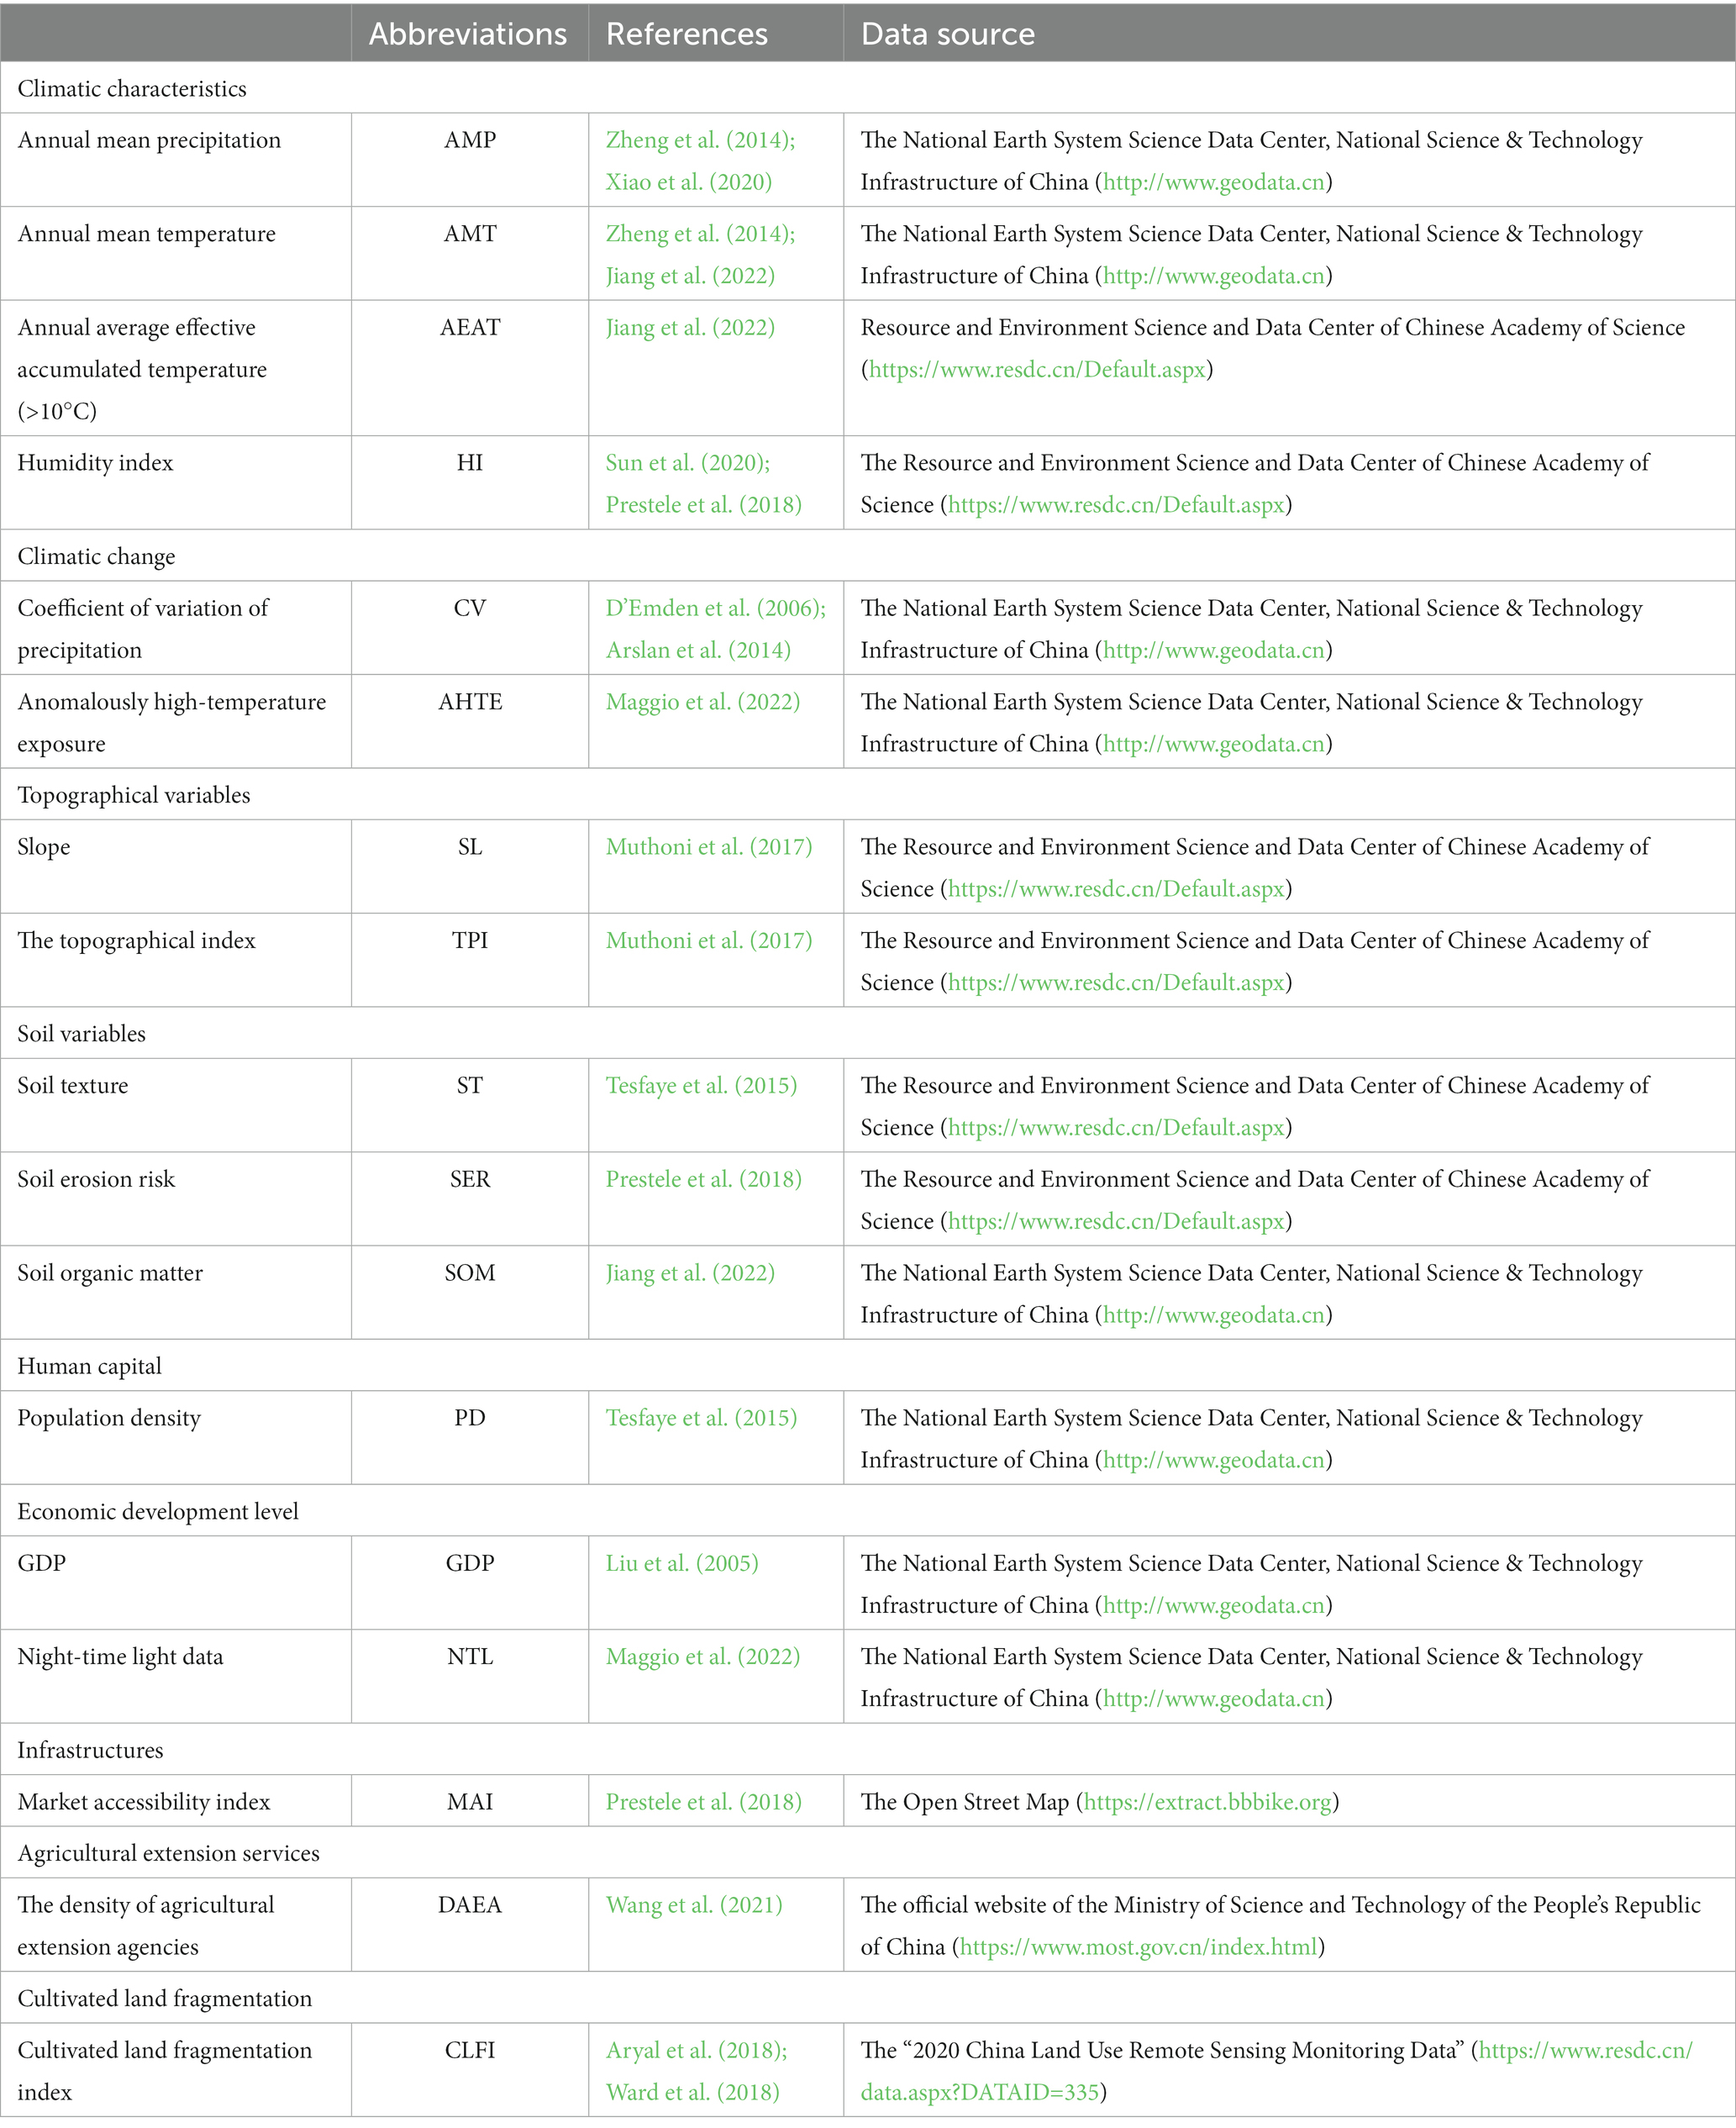
Table 1. Weight assignments of factors based on multi-influencing factor technique and fuzzy analytical hierarchy process models.
For examining the influence of biophysical parameters on the viability of CA, precipitation, temperature, humidity index (HI), climate change, soil texture (ST), soil erosion risk (SER), soil organic matter (SOM), slope (SL) and the topographical index (TPI) were used as proxies. It was believed that precipitation, temperature, HI, ST, SL, and TPI affected the performance of CA, while climate change, SER, and SOM affected the adoption of CA from a demand perspective.
The annual mean precipitation (AMP) was used to measure the impact of precipitation. The use of CA in humid regions is more likely to just enhance soil organic carbon, whereas CA can be particularly beneficial in arid areas, reaching a win-win situation of increased carbon sequestration and higher crop yields (Sun et al., 2020; Xiao et al., 2020).
The annual mean temperature (AMT) and annual average effective accumulated temperature (>10°C) (AEAT) were used to measure the impact of temperature. The performance of CA is affected by temperature, because CA considerably reduces soil temperature compared to traditional tillage, and the surface soil temperature at the seedling stage is decreased by CA which in turn affects crop growth (Jiang et al., 2022).
HI was used to measure the combined impact of precipitation and temperature. Under CA, the interaction between precipitation and temperature has a major impact on soil organic carbon and crop yield. Sun et al. (2020) revealed that in arid and warm regions with a HI <40, both soil organic carbon sequestration and crop yield increased when all CA components (minimum tillage or no-till, biomass mulch soil cover, and crop rotation) were implemented. CA has the potential to increase soil organic carbon in semiarid to humid regions without significantly impacting crop yield. In regions that are cold, humid, and tropical humid, CA might have negative effects.
The precipitation coefficient of variation (CV) and anomalously high-temperature exposure (AHTE) were used to characterize climate change (Asfaw et al., 2015). Climate change will considerably contribute to the adoption of CA from a demand perspective, given CA’s vital role in climate change mitigation and adaptation. Nyanga et al. (2011) demonstrated a positive correlation between farmers’ perceptions of climate variability and CA adoption, with a greater likelihood of adoption in regions with high rainfall variability. Farmers use CA as an important strategy to mitigate the threat of rainfall variability (Arslan et al., 2014). And farmers are more likely to apply sustainable land management practices in regions with substantial temperature variability (Asfaw et al., 2015).
The percentage of soil clay was used to characterize the ST. The effects of ST on crop yield vary depending on precipitation and temperature under CA. During high-rainfall seasons, the positive effect of increasing heat stress on the efficacy of CA diminishes as the clay content of the soil rises (Steward et al., 2018; Wan et al., 2018). Under situations of high precipitation, the infiltration and retention of soil moisture under CA may exacerbate all production problems connected with waterlogging, whereas an increase in clay content may exacerbate waterlogging problems and lead to lower yields (Baudron et al., 2012; Jiang et al., 2022).
SER and SOM were identified as relevant for the viability of CA. The loss of fertile soils owing to soil deterioration, especially erosion, is one of the fundamental reasons for the development of no-till and reduced-tillage techniques (Kassam et al., 2009). Farmers that are confronted with severe agroecological constraints and land degradation are more likely to adopt CA (Arslan et al., 2014; Aryal et al., 2018). According to Govaerts et al. (2009) and Schmitz et al. (2015), CA could benefit agricultural producers in erosion-prone locations in Asia and Africa.
The SL has a significant impact on the CA yield, as yields tend to increase logarithmically with increasing SL (Jiang et al., 2022). CA lowers sediment loss on steeper areas more than on flatter landscapes (Gowda et al., 2003). Farmers prefer to implement soil and water conservation techniques on moderately to steeply sloping croplands over flat croplands (Kassie et al., 2013; Kotu et al., 2017). In addition, based on research conducted in the United States, CA was deployed more commonly on steeper croplands (Gowda et al., 2003).
TPI was identified as relevant for the feasibility of CA. Beehler et al. (2017) demonstrated a potential interaction between topographic position and the carbon sequestration benefits of cover crops, with soil organic carbon being significantly higher in cover crops on slopes and summits compared to that of uncovered crops; however, there was little distinction between cover crops and uncovered crops in depressions. Aside from that, Negassa et al. (2015) found that cover crops in depressions result in lower crop yields than on slopes and summits and are associated with the highest rise in CO2 emissions.
In addition to an appropriate biophysical context, the impact of a technology intervention depends on the adoption pathway. Socio-economic factors typically influence regional agricultural development. Thus, the local socioeconomic climate is crucial for the acceptance and implementation of CA. Population density (PD), gross domestic product (GDP), night-time light data (NTL), the market accessibility index (MAI), extension services, and the cultivated land fragmentation index (CLFI) were used as proxies to assess how socioeconomic factors affected the viability of CA.
PD were taken into consideration. Due to population pressure-induced land scarcity, farmers may employ land-saving and yield-boosting strategies to increase agricultural productivity (Kassie et al., 2013). CA is viewed as an intensive production strategy, and high PD is a key factor in the intensification of agricultural systems in developing countries (Tesfaye et al., 2015).
GDP and NTL statistics are frequently employed to quantify economic development levels in the economics and human development literature of the social sciences (Maggio et al., 2022). No-till seeding is more susceptible to pest and disease problems than conventional tillage, demanding more chemical spraying, which increases production costs (Rodenburg et al., 2021). Adoption of CA therefore requires large financial incentives, and access to financing for investment in agricultural equipment is easier in prosperous countries than in impoverished ones.
MAI was calculated by Verburg et al. (2011) as a proxy for market access and transport input capacity. Improved market accessibility can impact the use of both input and output markets, the availability of knowledge and assistance from organizations (e.g., credit agencies), the opportunity cost of labor, and the availability of technology (Wollni et al., 2010). The labor and/or capital intensity can be increased via market accessibility by improving the output-to-input price ratio. CA implementation is more likely when market conditions are favorable than when market conditions are unfavorable (Giller et al., 2011; Tessema et al., 2015).
The density of agricultural extension agencies (DAEA) was utilised to determine the impact of extension services on CA adoption. Extension services serve as a bridge for agricultural innovations and policy directives to reach farmers in developing nations. According to Gwandu et al. (2014), more than 90% of farmers view public extension as the most trustworthy information source. In China, the primary providers of agricultural extension services are national agricultural extension agencies, research institutes, and rural professional and technical cooperative organizations. Agricultural research institutions (ARIs) and national agricultural science and technology parks (NASTPs) were regarded as public agricultural extension services (Wang et al., 2021, 2022).
CLFI was utilised to evaluate the impact of plot size on CA adoption. Land availability is a critical necessity for the implementation of CA. Moreover, CA necessitates mechanization, as large acreages improve the productivity of agricultural machines. According to Ward et al. (2018) and Aryal et al. (2018), the size of a plot significantly affected the adoption of no-till or minimum tillage. Maggio et al. (2022) also suggested that as farm size increased, so did the proportion of CA.
An exhaustive list of sources and references for the spatial data (Supplementary Figures S1–S5) used to determine the RDs for CA is presented in Table 1. Talukdar et al. (2022) proposed using long-term climate data in the modeling of agricultural suitability to increase the robustness and trustworthiness of the results. Therefore, in this study, AMP and AMT were obtained by calculating the rainfall and temperature over a 20-year period from 2001 to 2020 in China. CV was measured as the standard deviation of rainfall over the 20-year period divided by the mean for the respective periods. AHTE was identified by developing a variable to measure the positive deviation of the maximum temperature from the historical average over the 20-year period. SL was generated based on DEM data using the spatial analysis tool in ArcGIS10.6. TPI (De Reu et al., 2013) was calculated based on DEM data using equation (1):
where Z0 is the elevation of the center point, R is the predetermined neighborhood, Zi is the elevation in the neighborhood, and n is the number of elevation points in the neighborhood.
Road network data (including railroads, highways, primary or secondary roads, tertiary roads, and large rivers) were used to calculate the MAI. To spatialize the role of agricultural extension agencies, this study gathered the distribution list of ARIs and NASTPs, as well as the point-of-interest data of NASTPs and ARIs using the global positioning system. Hence, point-of-interest data were used to calculate DAEA using ArcGIS10.6.
CLFI is uscalculated based on the landscape index analysis method by considering the average plot size (APS), edge density (ED), and aggregation index (AI) (eg. Xu et al., 2020). The smaller the APS and the higher the ED and AI, the greater the CLFI. The calculation method is shown in equation (2):
where wAPS, wAI, and wED represent the corresponding weights of APS, ED, and AI, respectively. APS, ED, and AI were considered equally important to CLFI, (wAPS = wAI = wED = 1/3). The calculation process for APS, AI, and ED is based on equation (3).
where LA and NP represent the total area of cultivated land and the number of patches of cultivated land in the study area, respectively. Pi denotes the perimeter of patch i, and P denotes the total perimeter of all cultivated land. All grid layers were resampled to a resolution of 1 km based on a tradeoff between the resolution of the majority of the aforementioned data, the appropriate degree of detail for the size of the study area, and the computational time.
First, on the basis of the literature review and expert opinions, the Delphi method was used to construct a fuzzy complementary judgment matrix by quantitatively comparing the relative significance of each aspect in the evaluation indexes, such that the elements of the matrix satisfy the condition aij + aji = 1. The consistency of this matrix was subsequently evaluated; if it failed, the initial value judgment matrix was updated until it satisfied the consistency requirement. In this study, CI and other assessment variables were consistent with an extent of 1%, consistency index (CI) of 0.0136, random index (RI) of 0.0141, and CI/RI of 0.964%.
Second, the constructed fuzzy complementary judgment matrix was transformed into a fuzzy consistent matrix using the following steps:
Each row of the fuzzy complementary-judgment matrix was summed using equation (4):
Next, we used equation (5) to perform a transformation:
Where rij is the element of the transformed matrix.
Indicator weights were calculated. Currently, the standard approaches for determining ranking vectors consist primarily of the square root, sum normalization, and power methods. The first two methods only sum up each row of the Fuzzy Consistency Matrix and perform the square root or sum normalization method, resulting in substantial inaccuracy in the computation results. The power method, which employs iterations to obtain the ranking vector and can control the number of iterations while minimizing errors, has become the mainstream calculation method. However, the number of iterations in the power approach is directly influenced by the initial value. To optimize the starting value of the power iteration and increase the convergence speed, the average values of the weights acquired using the square root technique and sum row normalization method were used as the initial values of the power iteration and the target weights were calculated. Following the aforementioned procedure, a MATLAB code was created to determine the weights of each indication (Table 2).
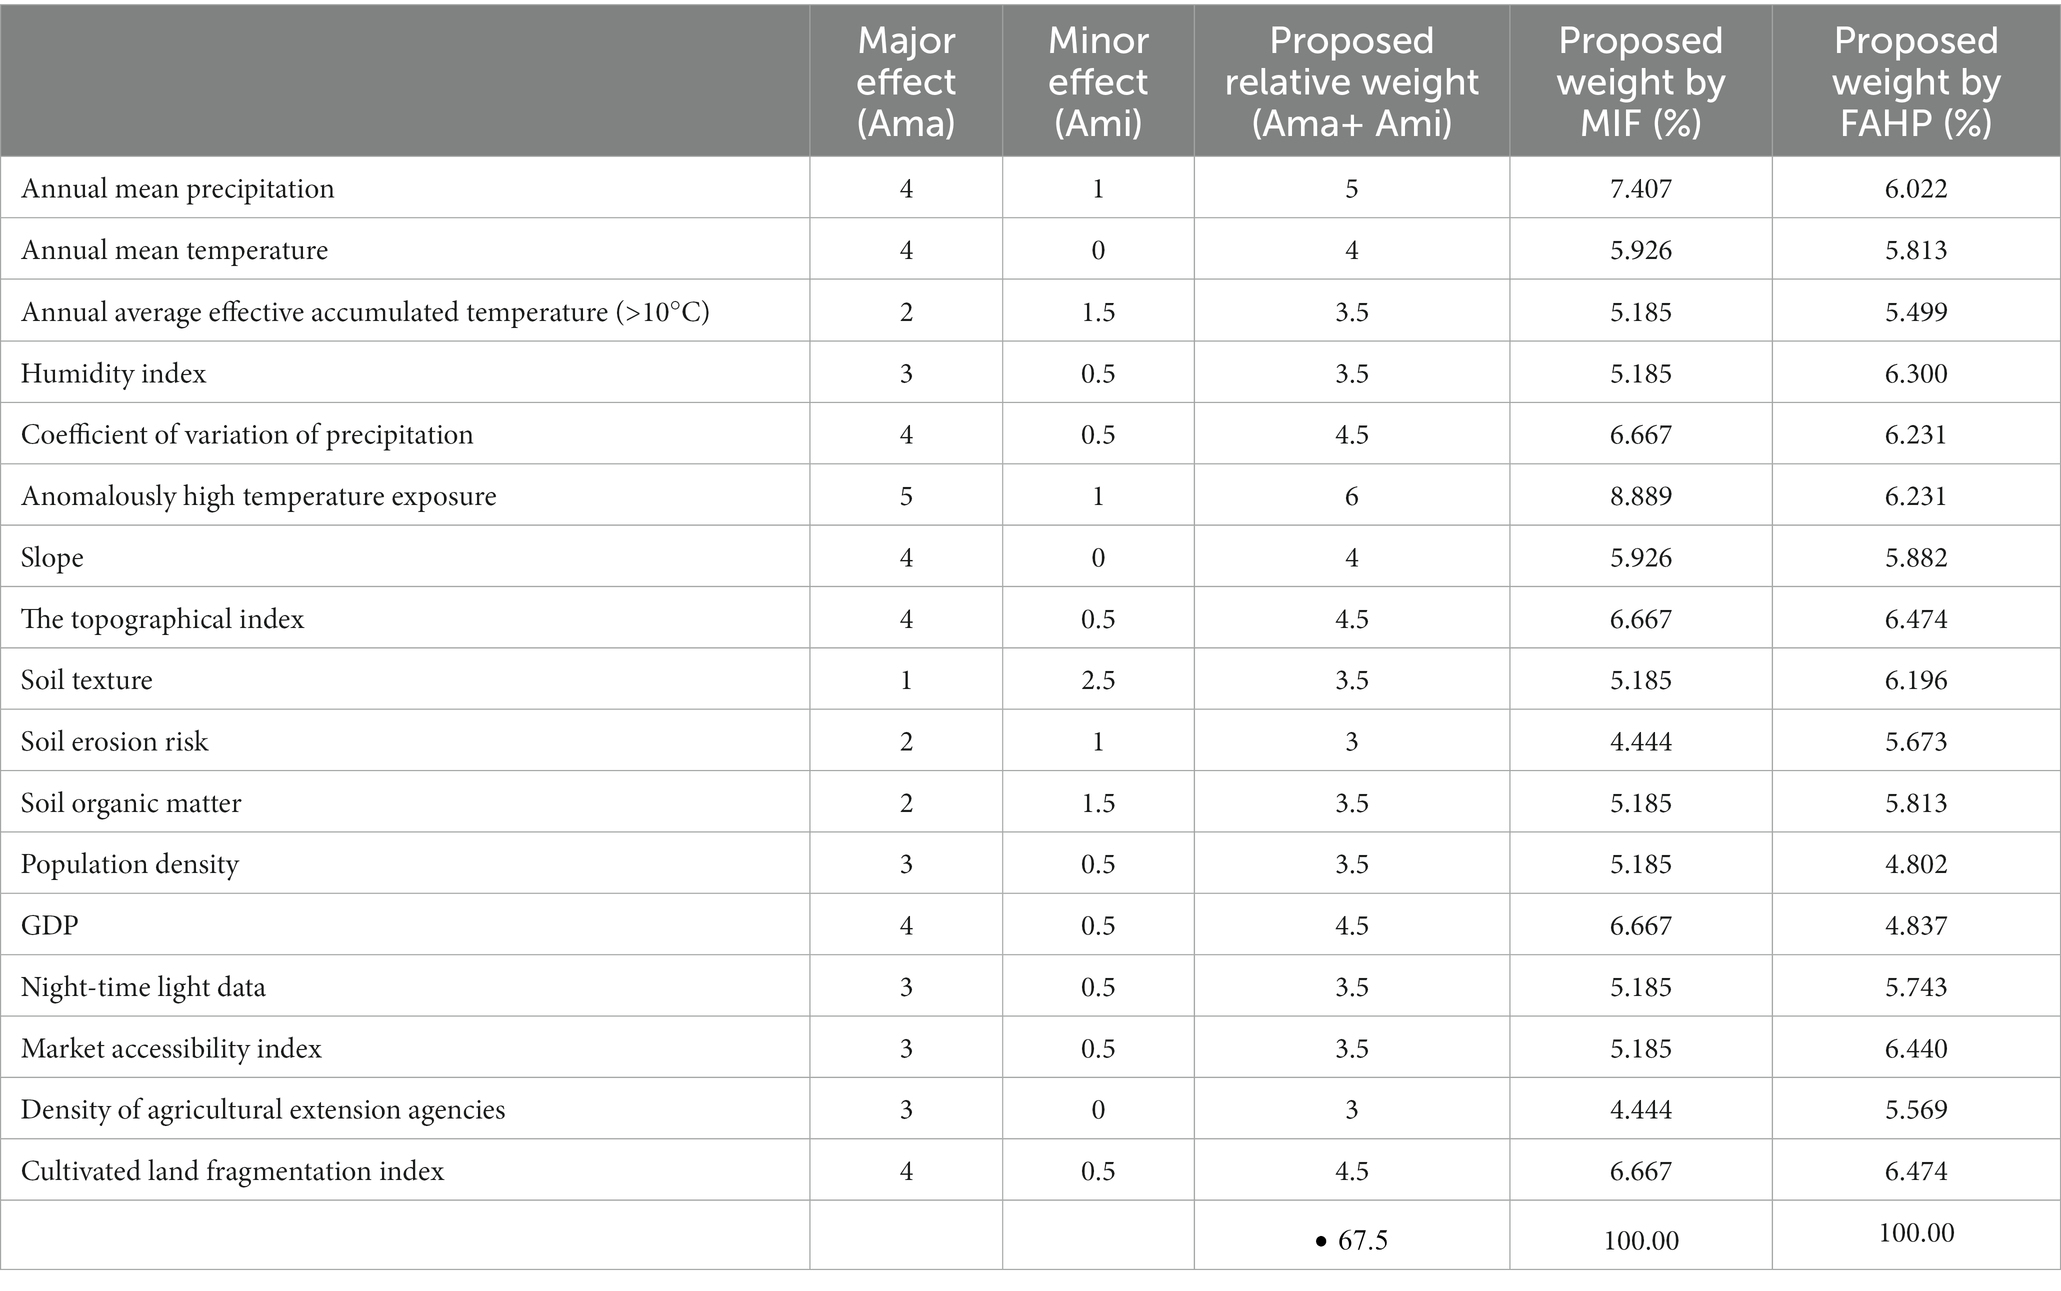
Table 2. Weight assignments of factors based on multi-influencing factor technique and fuzzy analytical hierarchy process models.
Shaban et al. (2001) were the first to introduce and apply the MIF modeling technique for groundwater potential zone mapping within a GIS framework. In this method, the weight of each factor is rated based on its influence on other factors that control the evaluation objective. Therefore, when applying the MIF technique, it is essential to identify how these factors are related to one another and how they affect one another. Table 1 lists the main factors that determine the RDs for CA. Correlation analysis was used to identify the interrelationships between each factor and determine the robustness of the variables impacting CA suitability. The correlation matrix was obtained through a principal component analysis (PCA) approach in the ArcGIS software using a raster dataset with the same spatial resolution. Finally, the correlation matrix’s output was prepared using the “R” software (Figure 1).
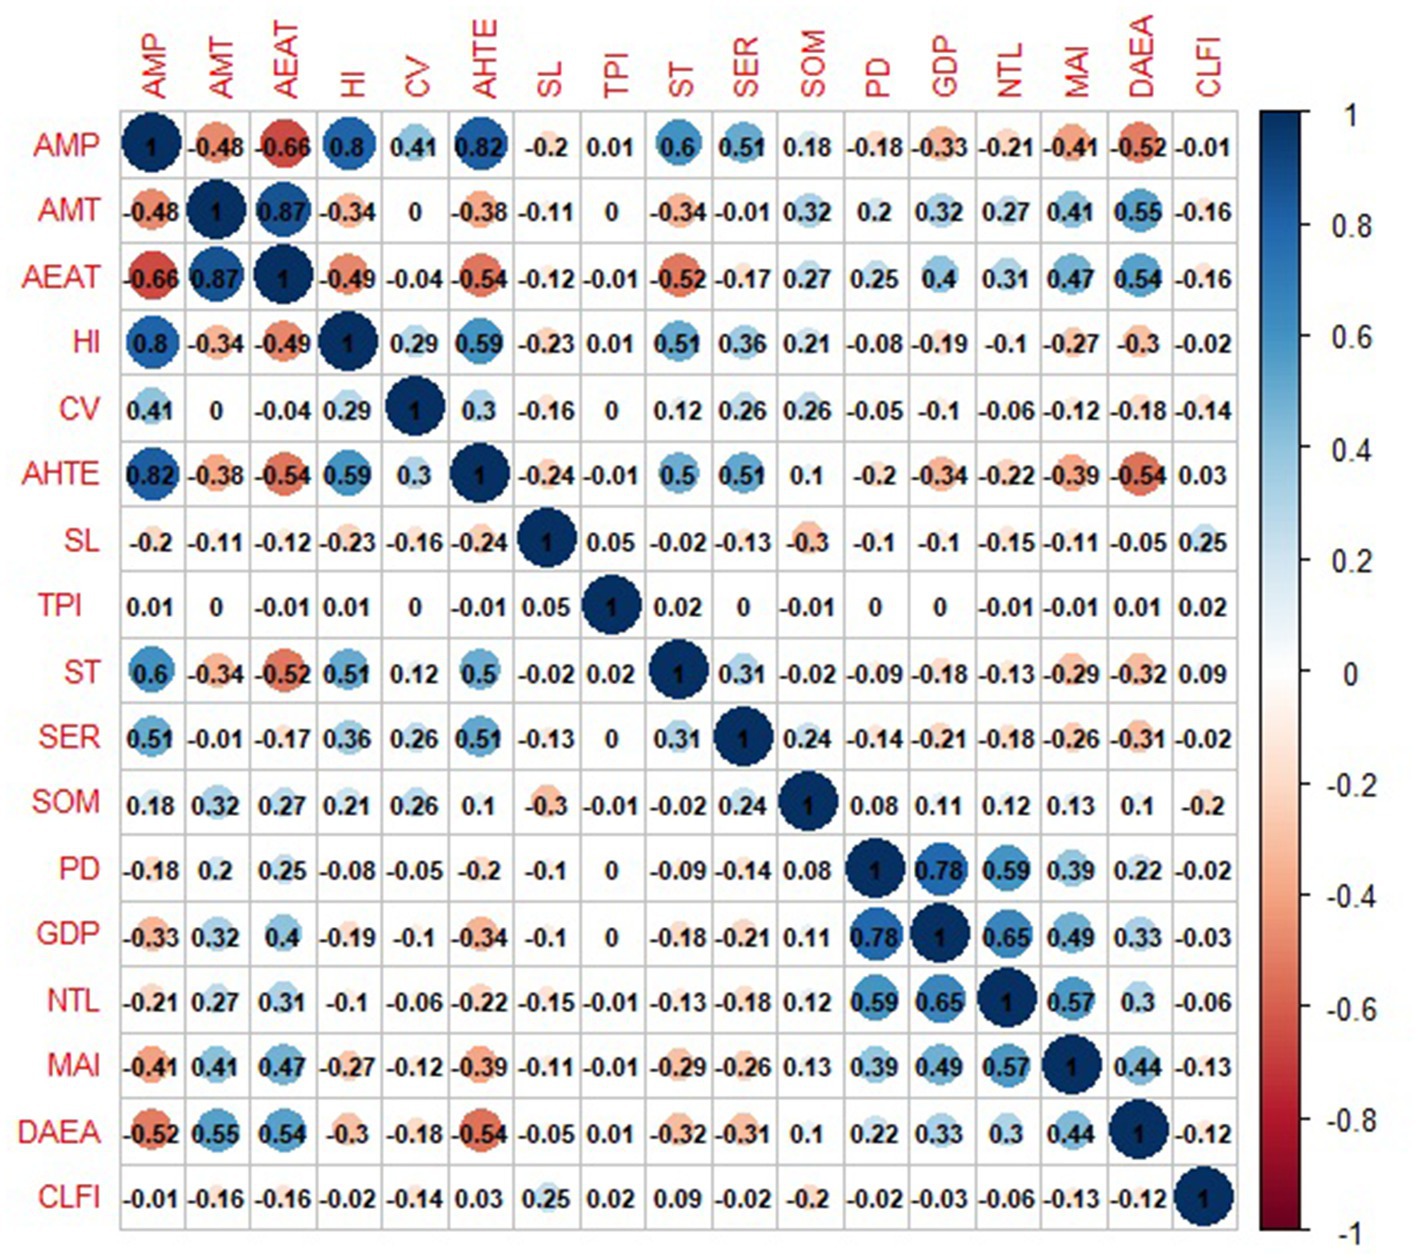
Figure 1. Correlation coefficient between the multi-influencing factors controlling recommended domains for conservation agriculture. The spectrum from dark blue to light blue indicates the high positive to low positive relationship among different factors, while dark maroon to light maroon indicates high to low negative relation.
The interrelations between each factor were established based on the correlation analysis of all elements and theoretical analysis described within section 2.1, combined with field observations and expert knowledge. The relationships are depicted in Figure 2, with major factors being represented by solid lines and minor factors being represented by dashed lines. The effects of each major and minor factor were assigned weights of 1.0 and 0.5, respectively (Taheri et al., 2020; Mandal et al., 2021). Relative rates were calculated using the cumulative weight of both the major and minor effects (Table 2). These rates were subsequently used to calculate the score of each influencing factor, using equation (6).
Where Wi is the weight of individual factors, WMa indicates the major relationships among different factors, and WMi represents the minor relationships among variables.
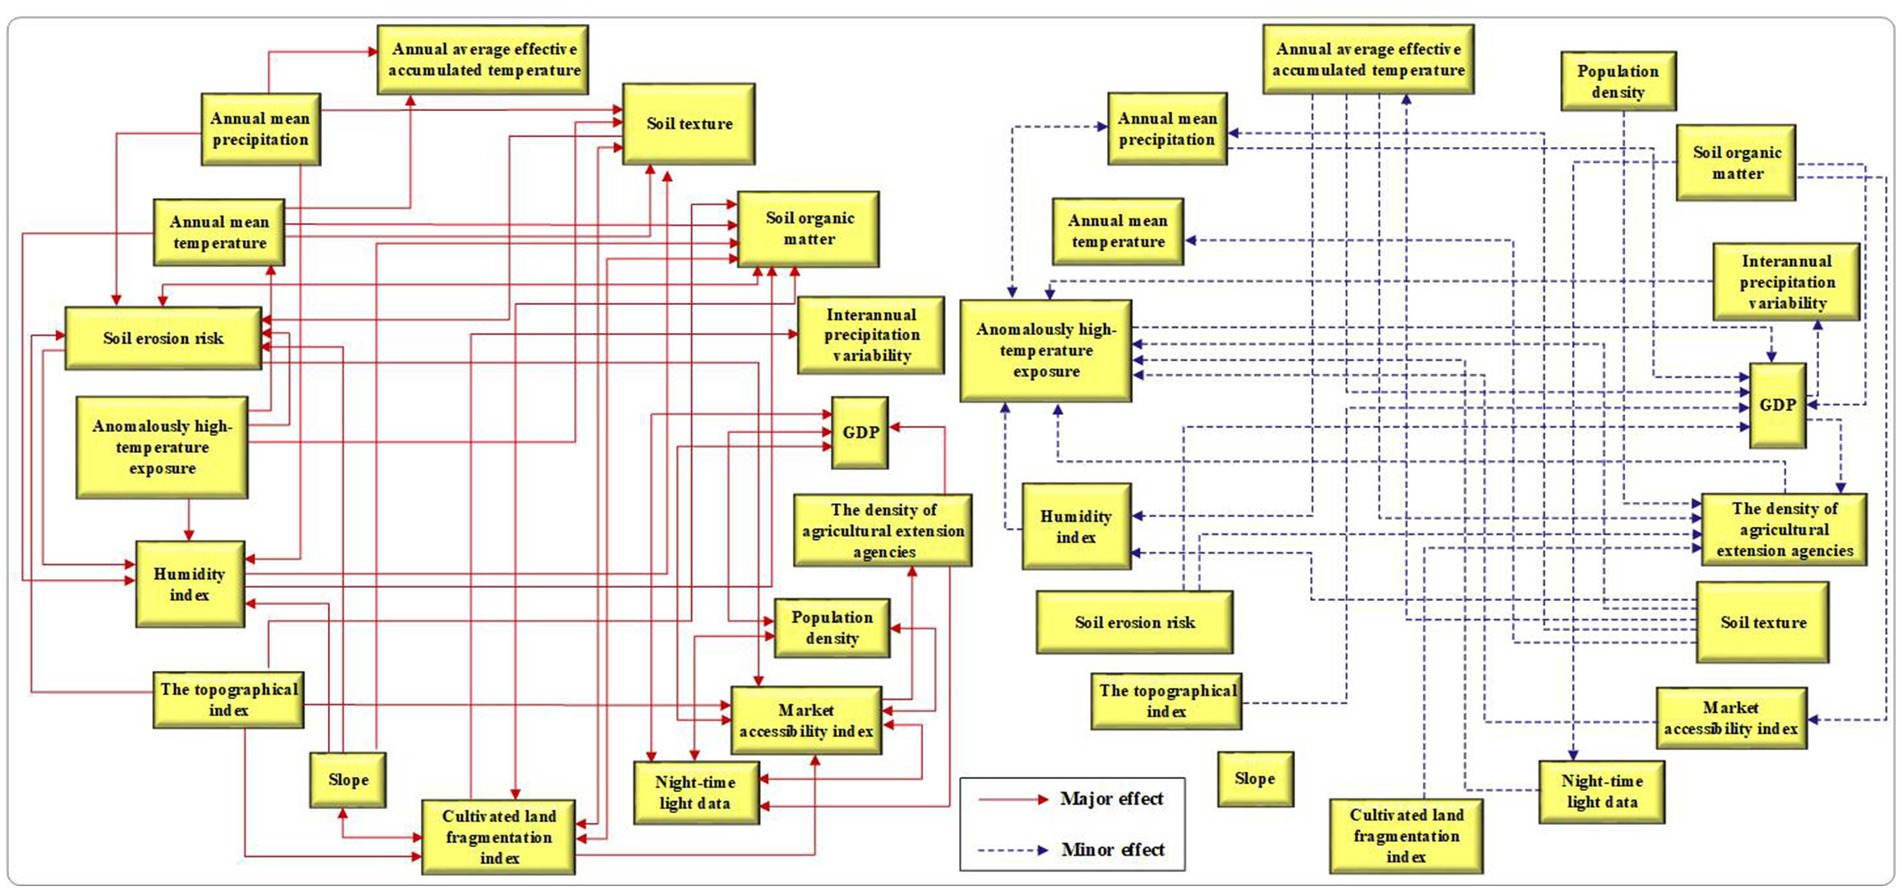
Figure 2. Interrelationship between the multi-influencing factors controlling recommended domains for conservation agriculture.
Fuzzy logic approaches use fuzzy membership to represent the probability that a parameter belongs to a particular level rather than assigning the parameter to a fixed rank (Corona et al., 2008). In agricultural suitability evaluation, common fuzzy membership functions include the Euclidean distance; bell-shaped curves or S-function; sigmoid, parabolic, and linear functions; and Gaussian combination membership function (Akpoti et al., 2019). For each parameter, it is necessary to set its range and select a fuzzy membership function based on the purpose of the study. Outside the range, the membership value is either 0 or 1, whereas within the range, the fuzzy membership function is used to calculate the specific membership value, which varies between 0 and 1. Based on the literature review and theoretical analysis described in Section 2.1, a suitable range and convergence of each indicator in the study region were identified (Table 3). Based on this, the fuzzy membership tool in ArcGIS 10.6 was utilised to generate a fuzzy map for each parameter using (Supplementary Figures S6–S10). The final RDs for CA mapping in this paper were achieved in two steps. First, the influencing factors were integrated to obtain suitability indices for CA using the multi-factor weighted overlay method (equation 7). The suitability indices for CA were subsequently divided into five descriptive levels (unsuitable, marginally suitable, moderately suitable, good, and highly suitable) using the natural breakpoint method, and the regions with good and highly suitable values were the RDs for CA.
SICA is the suitability indices of CA, wi represents the weight value of each indicator, and Ai represents the membership degree of each indicator.
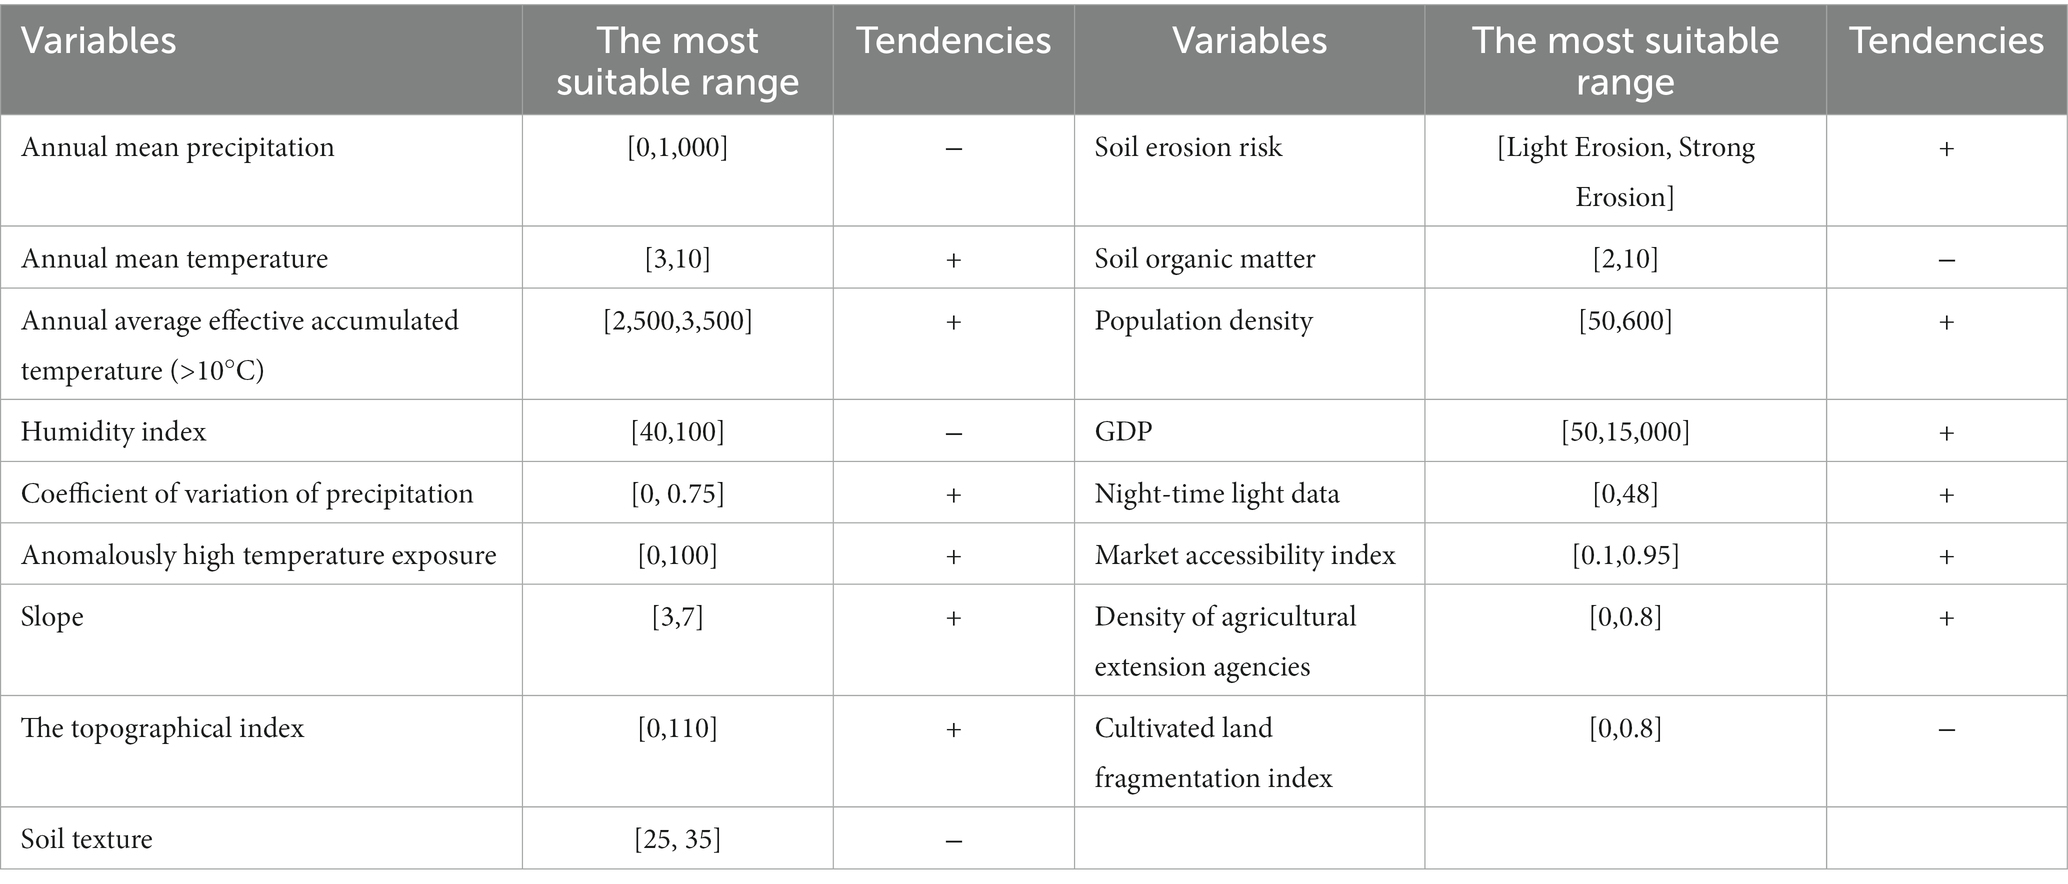
Table 3. Range of suitability for all influence factors.
Sensitivity analysis can be used to evaluate the effect of changes in input parameters on the model simulation results (Napolitano and Fabbri, 1996). In this study, the map removal sensitivity analysis method (Lodwick et al., 1990) and the extended Fourier amplitude sensitivity test (EFAST) (Saltelli, 1999) were used to evaluate the effects of each thematic layer on the suitability map of CA.
After removing one or more thematic layers from the input data, map removal analysis assesses the sensitivity of the final suitability map (Lodwick et al., 1990). Several suitability maps were generated based on the number of input layers. Comparing the new suitability index to the original index provides a direct measurement of the parameter’s impact. Using the following equation (8), the sensitivity of the final map to the absence of each major factor can be determined.
where S is the sensitivity measure expressed as the variation index and RD and RD’ are the unperturbed (RDs for the CA index without removing any parameter) and perturbed (vulnerability index after removing one or more parameters) RDs for the CA indices, respectively. N and n are the numbers of thematic layers used to calculate RD and RD’, respectively.
The map removal sensitivity analysis provided interesting insights into the effect of modifying one model parameter at a time on the model’s output. Nevertheless, systematic variations in the model’s key parameters can significantly affect the model’s output. Therefore, it is advantageous to examine how the interaction of input parameters impacts model output. To further explore the interaction effects between parameters, we applied the EFAST method to a global sensitivity analysis. In EFAST, the first-order indices (Si) measure the local sensitivity of each parameter, whereas the total indices (STi) represent the global sensitivity by accounting for the effects of higher-order interactions or correlations among multiple inputs. The ranges of both Si and STi were between 0 and 1, with higher values indicating a greater influence of the parameter.
EFAST was conducted using Simlab software (Tarantola, 2005). The implementation of this method consisted of the four phases listed below: (1) Defining the parameters and their distributions. A Constructing a fishing net using ArcGIS10.6 to evenly extract data from 5,934 points in each of the parameter maps. Generating scatter plots based on the extracted data to determine the probability distribution for each parameter; (2) Performing Monte Carlo sampling of the distributions based on the probability distribution and range of values for each parameter to generate sets of crop parameters; (3) Writing the programs using MATLAB to invoke the CA-RD models based on the MIF and FAHP to read the samples, and the model simulation results were written to a local file according to the SimLab software sample output format; (4) Selecting the results using the SimLab software, executing Monte Carlo simulations, and using the post-processing procedure for uncertainty and sensitivity analysis.
Figure 3 illustrates the final biophysical suitability map of CA. According to the MIF, 13.70, 18.61, 22.36, 23.93, and 21.41% of the cultivated land were identified as unsuitable, marginally, moderately, good, and highly suitable for CA, respectively. According to the FAHP, 21.92, 23.94, and 23.53% of cultivated land were assessed to be moderately suitable, good suitable, and highly suitable, respectively. In contrast, 13.41 and 17.20% were assessed to be unsuitable and marginally suitable. Approximately 50% of China’s cultivated land had a high biophysical potential for CA adoption. Cultivated land with good or high biophysical suitability were concentrated in the Northeast China Plain, Northern arid and semiarid region, Huang-Huai-Hai Plain, and Loess Plateau, all regions with high biophysical potential. In contrast, cultivated lands with no or marginal biophysical suitability were concentrated in the Middle-lower Yangtze Plain, Yunnan-Guizhou Plateau and Southern China, regions with low biophysical potential (Supplementary Table S1; Supplementary Figure S11).
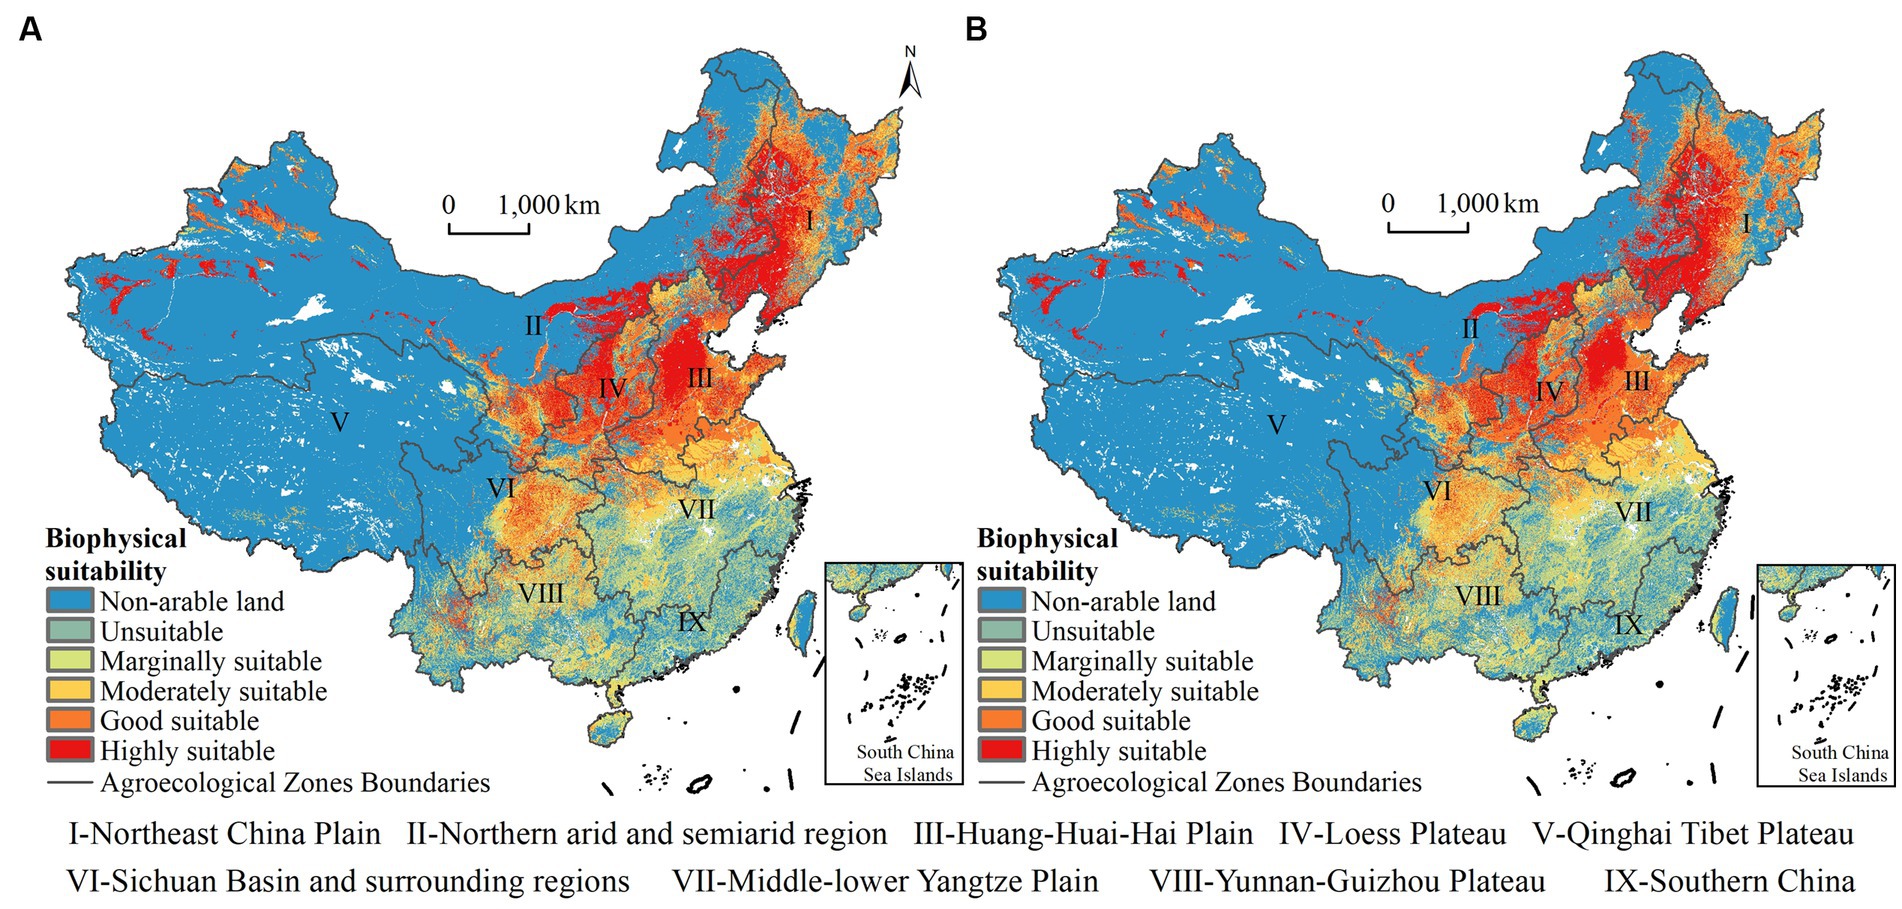
Figure 3. Biophysical suitability for conservation agriculture based on the FAHP (A) and MIF technique (B) within the cultivated land of China.
Figure 4 depicts the socioeconomic suitability map of CA. According to MIF, the overall socioeconomic potential of CA adoption in the study area was low: 36.19% of the cropland was socioeconomically unsuitable; 36.45% was marginally suitable; and 18.05, 6.88, and 2.40% were moderately, good, and highly socioeconomically suitable, respectively. The FAHP indicates that 32.12% of the cropland were economically unsuitable, 36.21% were marginally economically suitable, and only 20.02, 8.64, and 3.04% were economically moderate, good, and marginally suitable, respectively. Cropland with good or high socioeconomic suitability were concentrated in the Huang-Huai Plain, Middle-lower Yangtze Plain, and Southern China. Cropland was socioeconomically unsuitable for concentration in the Northeast China Plain, Northern arid and semiarid region, and Loess Plateau (Supplementary Table S2).
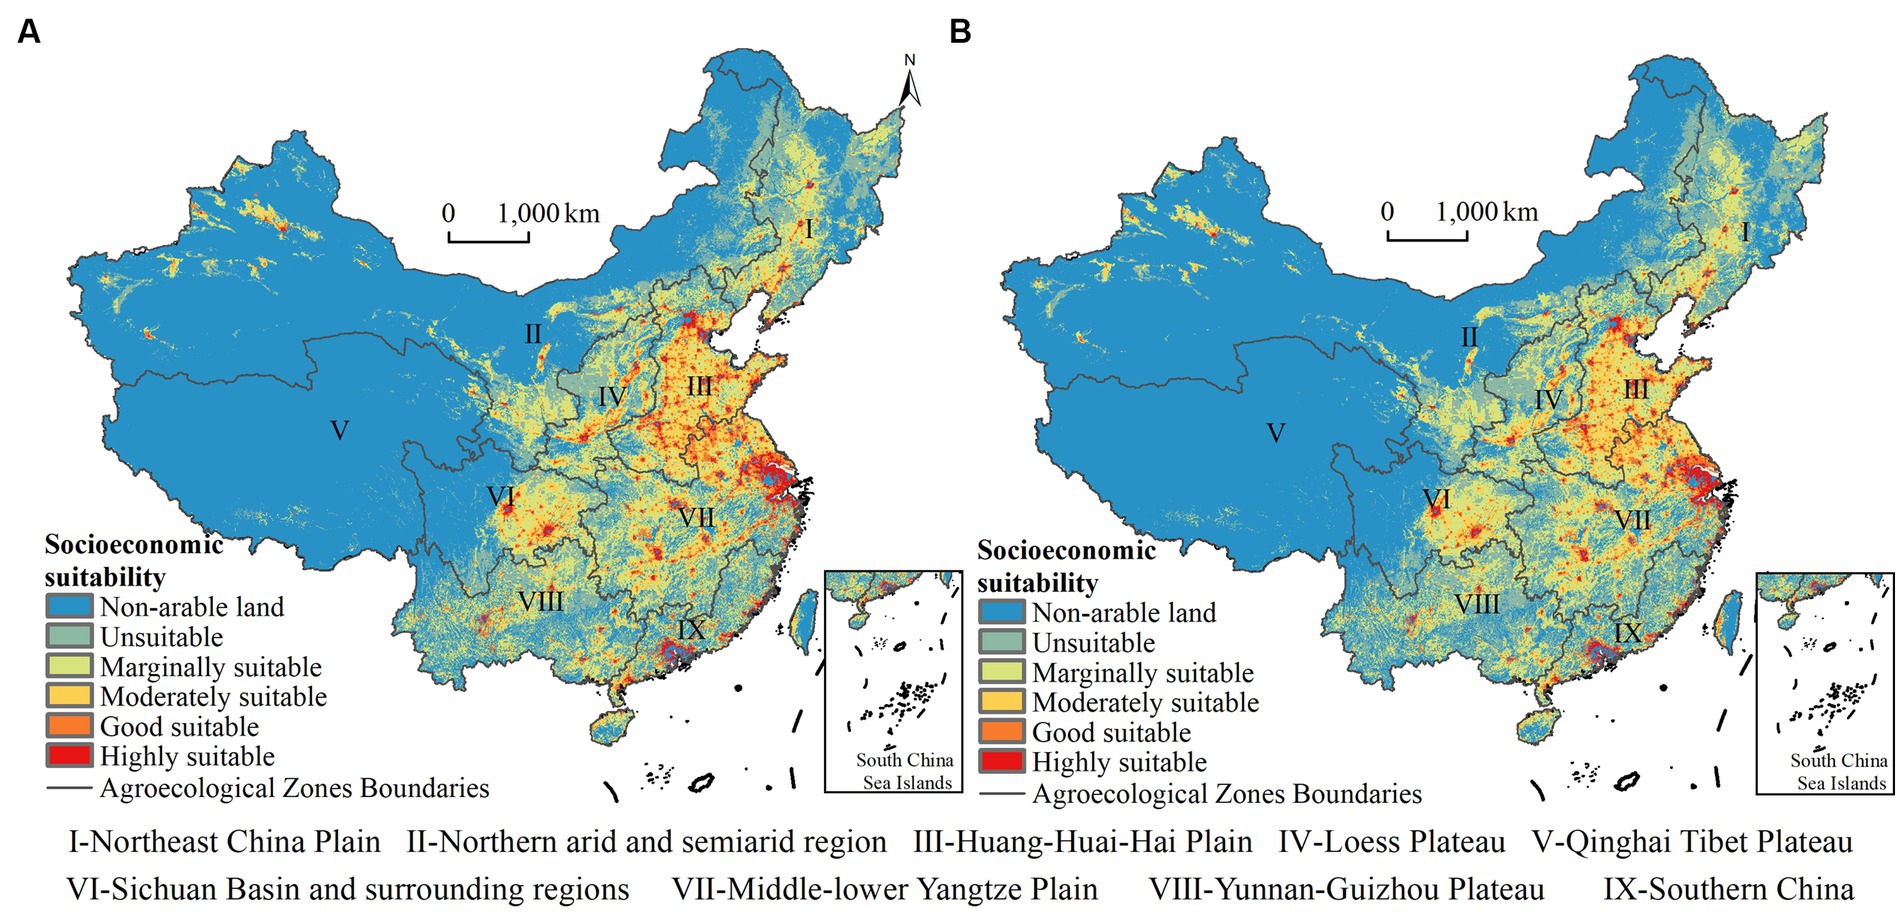
Figure 4. Socioeconomic suitability for conservation agriculture based on the FAHP (A) and MIF technique (B) within the cultivated land of China.
The final map of CA suitability was produced by superimposing 17 fuzzy data layers (Figure 5). According to the FAHP method, while 9.75% of cultivated land was unsuitable for CA, 21.44% was marginally suitable, 27.14% was moderately suitable, 27.22% was good suitable, and 14.45% was highly suitable. Based on the MIF technique, the marginally suitable, moderately suitable, good suitable, and highly suitable areas for CA comprised 20.80, 29.30, 27.02, and 13.90% of the cultivated land, while only 8.98% was unsuitable for CA. Results indicate that there is a considerable portion of cropland with significant biophysical and socioeconomic potential for CA adoption.
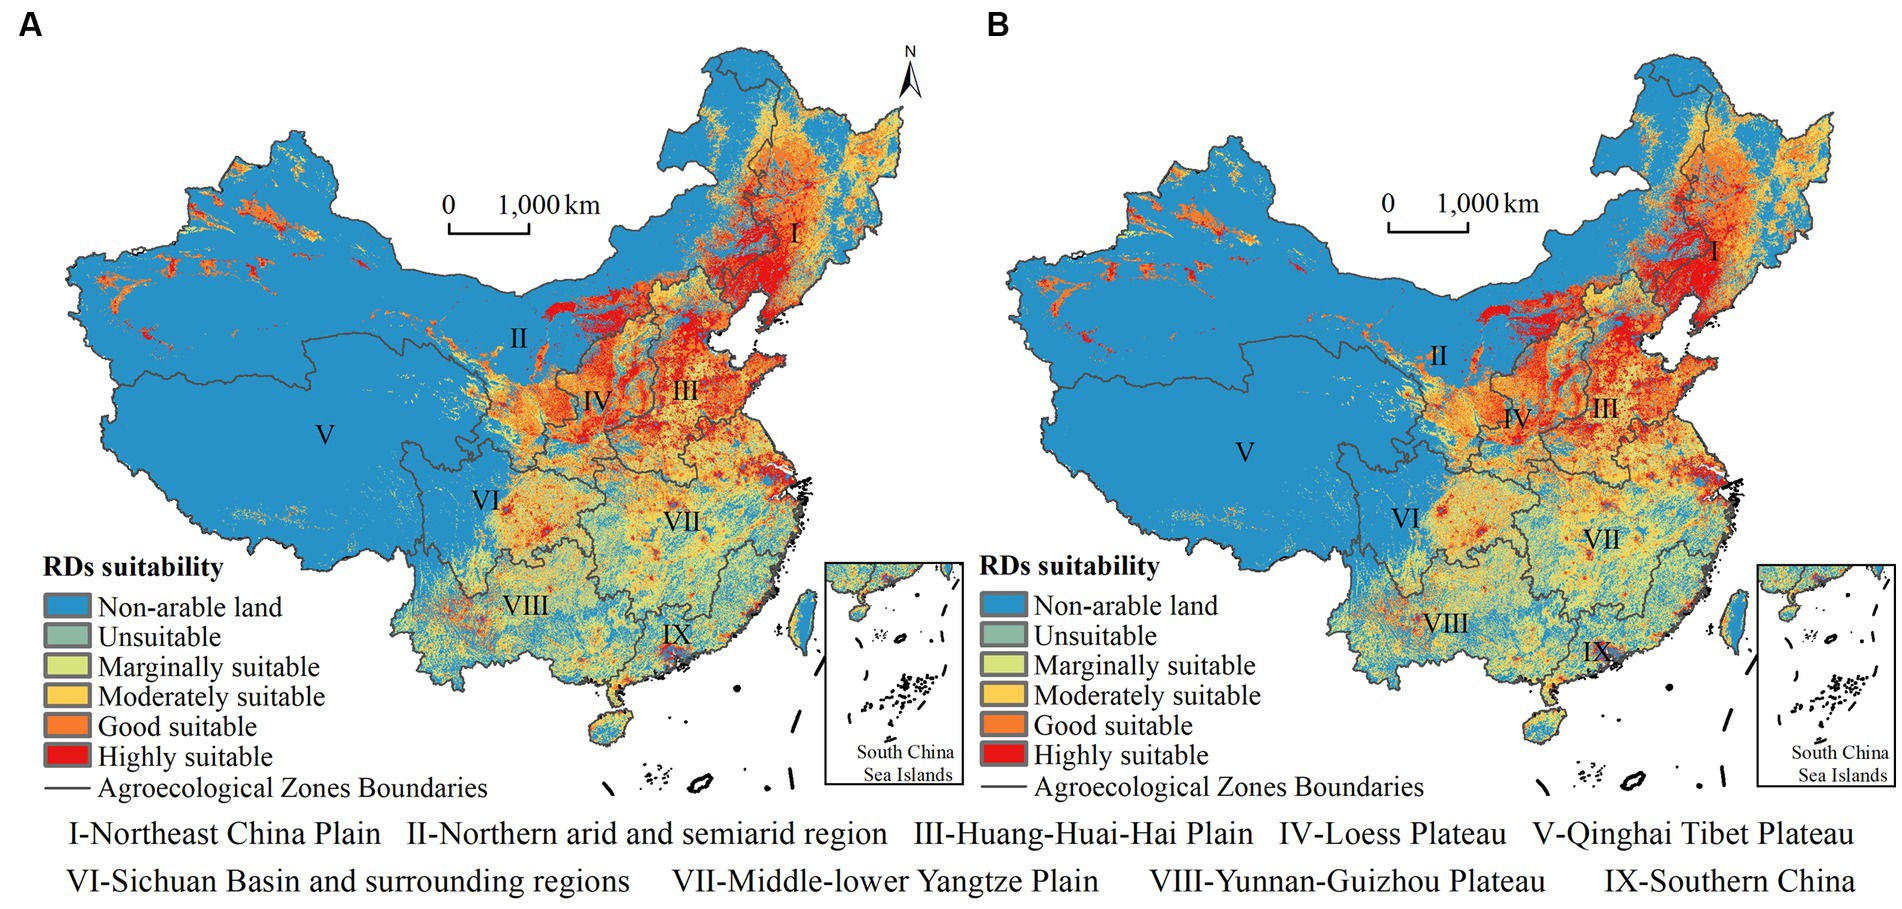
Figure 5. Suitability maps of conservation agriculture based on the FAHP (A) and MIF technique (B) within the cultivated land of China.
Although good and highly suitable areas scattered over a range of ecological zones, they were mainly distributed in the northern arid and semi-arid region, the Loess Plateau, the Huang-Huai-Hai Plain, and the Northeast China Plain. Most unsuitable and marginally suitable areas were concentrated in the Qinghai Tibet Plateau, middle–lower Yangtze Plain, Sichuan Basin and surrounding regions, Yunnan-Guizhou Plateau, and southern China (Supplementary Figure S12). The sum of good and highly suitable areas constituted more than 50% of the cultivated land in Northeast China Plain, Northern arid and semiarid regions, Huang-Huai-Hai Plain, and Loess Plateau, whereas the sum of unsuitable and marginally suitable areas comprised more than 50% of all cultivated land in the Yunnan-Guizhou Plateau and Southern China (Supplementary Figure S13). The Northeast China Plain, Northern arid and semiarid region, Huang-Huai-Hai Plain, and Loess Plateau have great potential for CA adoption, whereas the Middle-lower Yangtze Plain, Sichuan Basin and surrounding regions, Southern China, and Yunnan-Guizhou Plateau have a lower potential for CA adoption.
As ground-based monitoring is not feasible, it is crucial to test the model output robustness to changes in parameters. A sensitivity analysis was performed for the suitability models based on the FAHP and MIF techniques. Table 4 lists the variations in sensitivity indices of both the FAHP and MIF models after removing each layer from the assessment. The contribution of each thematic layer to the map of suitability is summarized by our findings. Despite differences in the mean variation index, the elimination of each parameter had an effect on the output map, indicating that each of the thematic layers used in the FAHP and MIF techniques played a unique role in the suitability map. For the FAHP model, the highest sensitivity index was observed when the ST data layer was removed from the computation (0.528%). HI and SOM also had a significant impact on the map, while AMT, PD, NTL, GDP, TPI, and AMP had a moderate impact. The TPI, ST, and HI had relatively high standard deviations, indicating an important dispersion or a large variation in their sensitivity indices at the regional scale. For the MIF model, AHTE and AMP were identified as critical parameters in determining the CA suitability map. This could be ascribed to AHTE and AMP being assigned the highest theoretical weights. The suitability map was shown to be extremely sensitive to changes in HI and ST, while changes in PD, TPI, SOM, AMT, NTL, and GDP appeared to have a moderate effect. The CA suitability map was less strongly impacted by changes in the CLFI and CV in both the FAHP and MIF models.
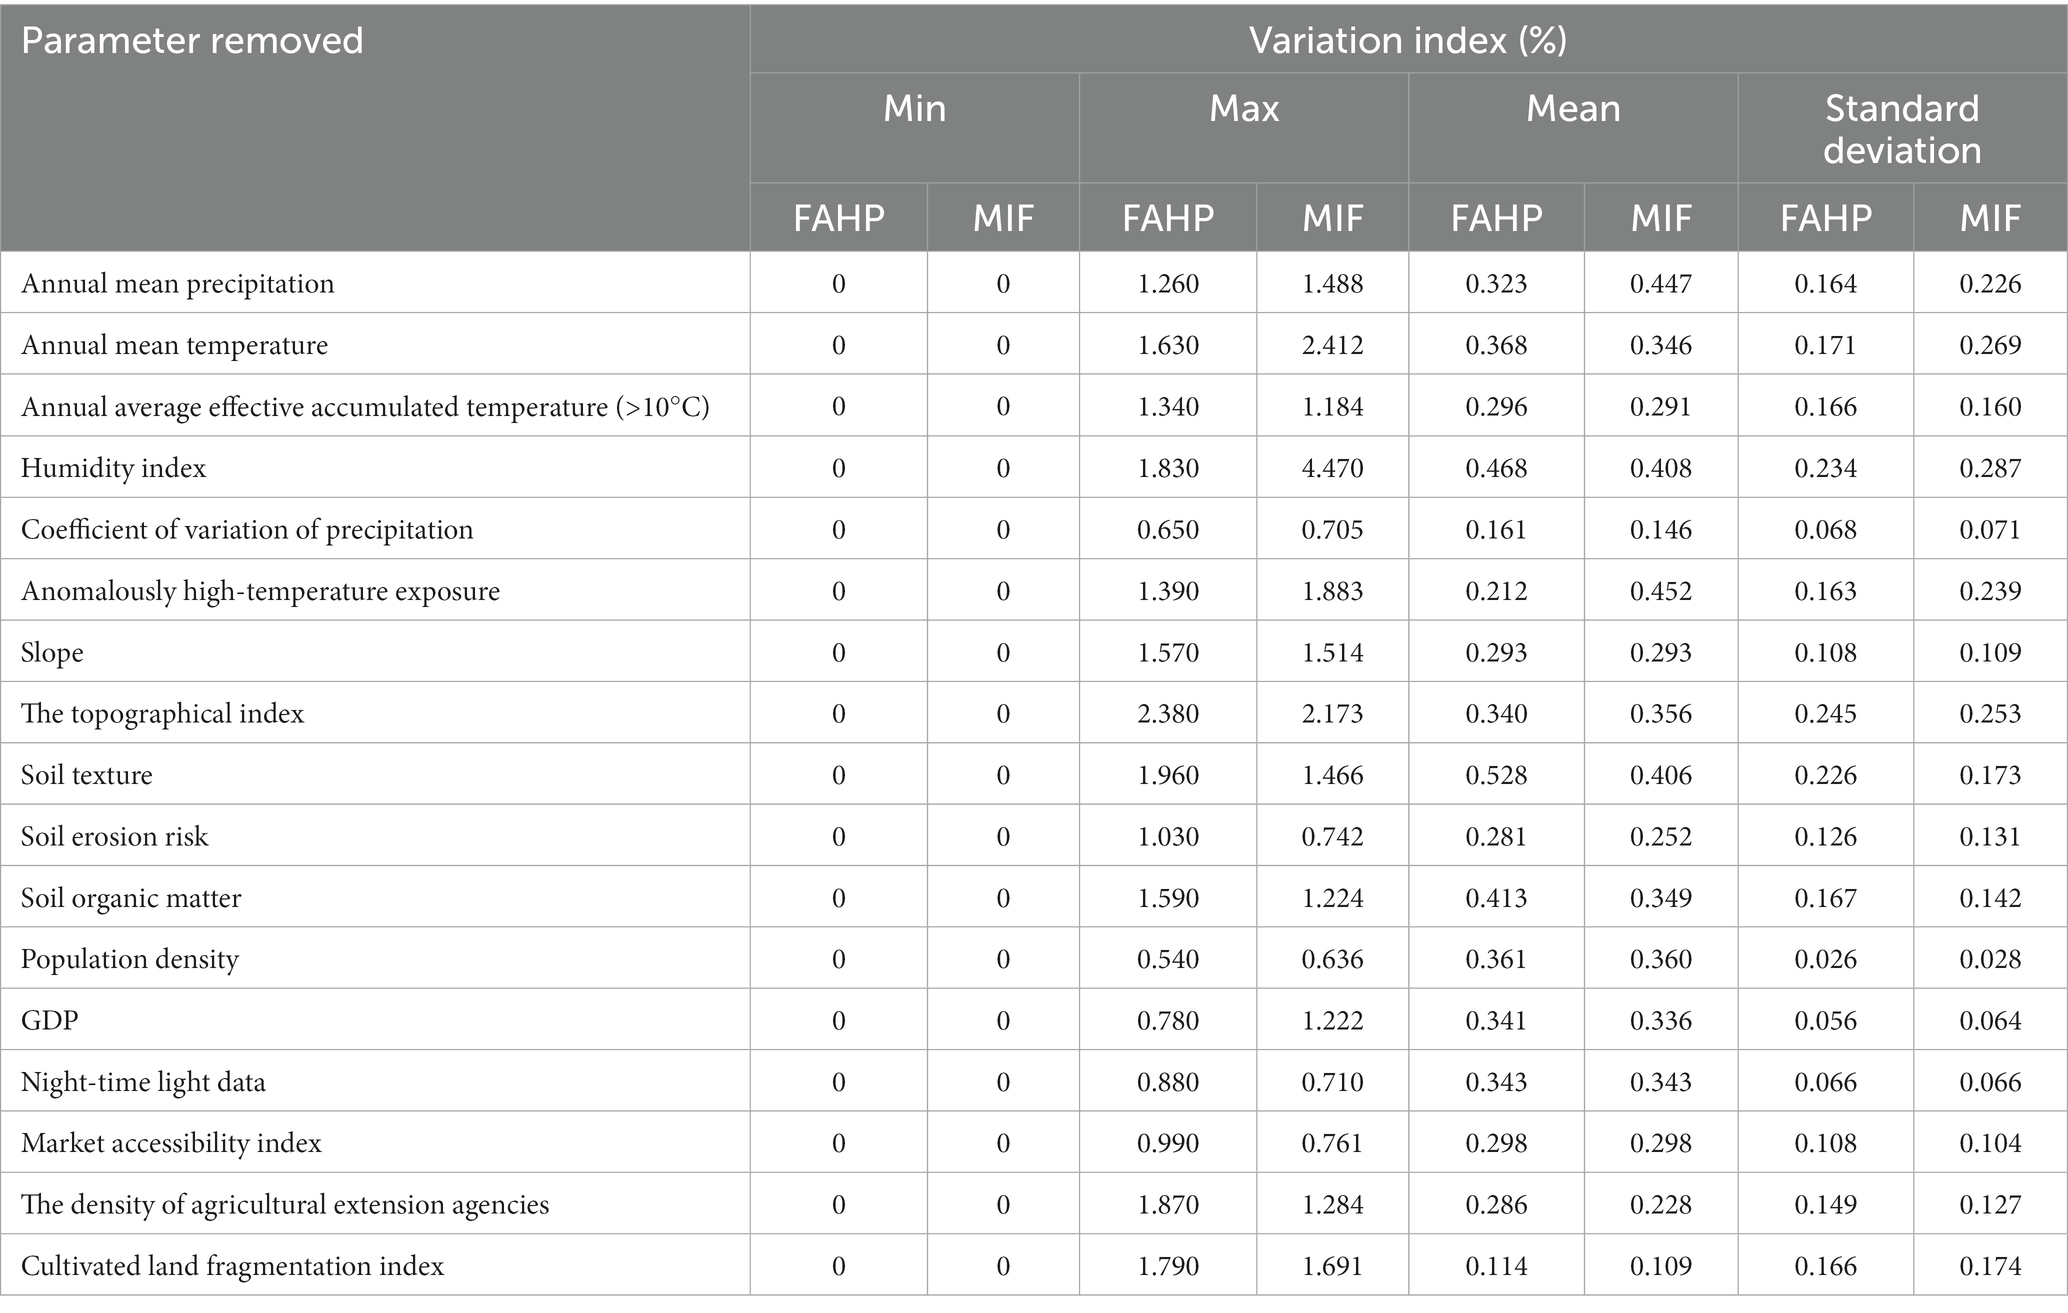
Table 4. Sensitivity index according to the map removal sensitivity analysis test.
The Si and the STi of the 17 parameters of the CA suitability map are depicted in Figure 6 based on EFAST. For the FAHP model, EFAST confirmed that SL, CV, TPI, AMP, and AHTE were the most influential parameters with a combined STi of 0.872. Their individual effects are all higher than 0.1 (Jin et al., 2018), whereas their interaction effects are all lower than their individual effects. In addition, PD and HI have relatively high effects on output variance, while having higher interaction effects. For the MIF model, the top seven parameters were AHTE, HI, AMP, GDP, CV, SL, and PD, with a combined STi of 1.500. We discovered that six parameters were the same in the top seven for both the FAHP and MIF models based on STi. In addition, CLFI, AEAT, NTL, SER, and DAEA were identified as the least influential parameters based on STi for both the FAHP and MIF models. These results confirm the rationality of the indicator selection and the robustness of the model results.
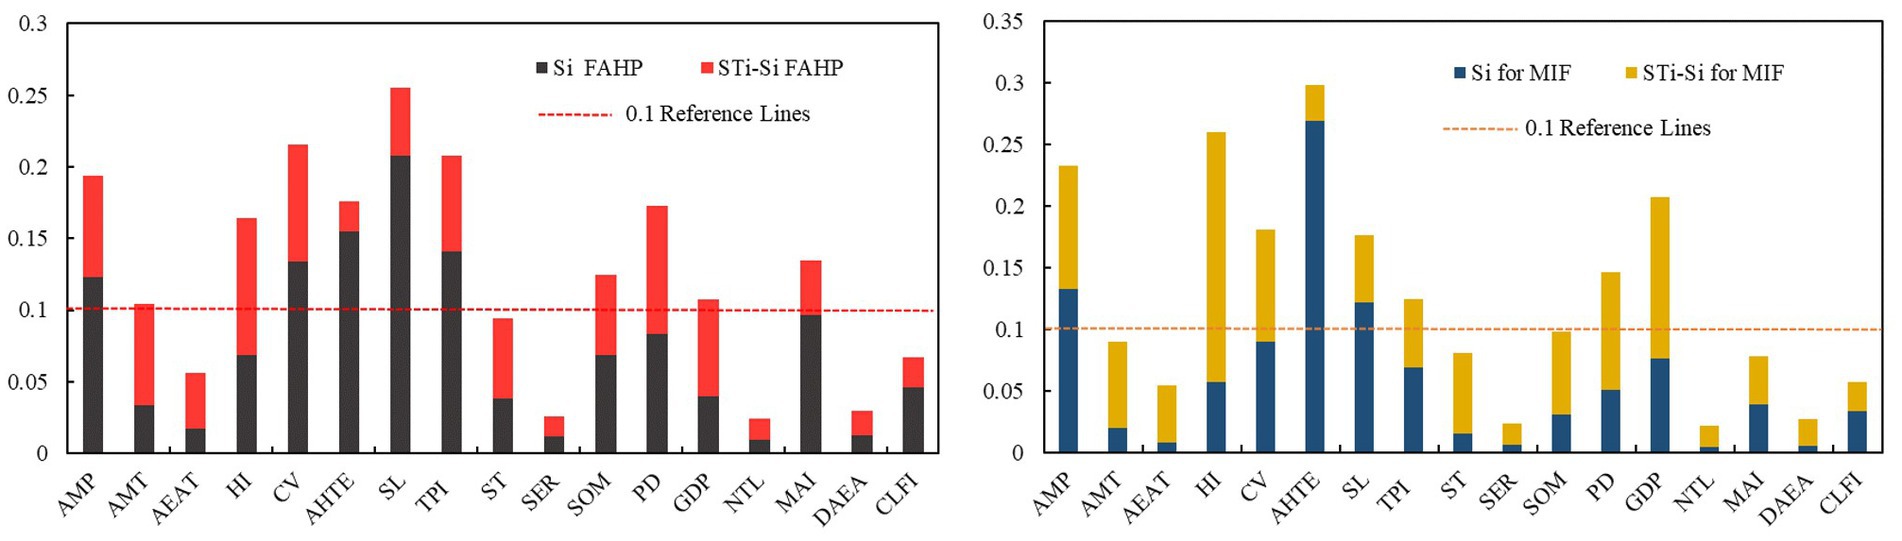
Figure 6. Sensitivity indices for the CA suitability maps using the EFAST method. Si represents the first-order sensitivity, STi – Si indicates parameter interactions. Parameter abbreviations on the x-axis are listed in Table 1.
SL, AHTE, TPI, CV, AMP, MAI, PD, SOM, and HI were identified as critical indicators in the FAHP model based on Si (>0.05; Jin et al., 2018). The top nine FAHP model parameters were ST, HI, SOM, AMT, PD, NTL, GDP, TPI, and AMP as identified using the map removal method. The FAHP model’s significant parameters included TPI, AMP, SOM, HI, and PD, as identified by both the EFAST and map removal methods. Using the MIF model based on Si, AHTE, AMP, SL, CV, GDP, TPI, HI, and PD were strongly responsible for the suitability map of CA (>0.05; Jin et al., 2018). It can be concluded that TPI, AMP, HI, and PD considerably impacted the suitability for CA through both the map removal and EFAST approaches for the FAHP and MIF models. Our findings reveal that the most ubiquitously sensitive factors are TPI, AMP, HI, and PD. In addition, parameter interactions accounted for a larger part of the total variance, except for AHTE in the MIF model. The ratio of Si to STi for all parameters of the FAHP model was greater than that of the MIF model, except for AHTE, which indicates that the MIF model is more effective in reflecting the interactions between parameters than the FAHP model (Supplementary Figure S14).
This study developed an evaluation index system for the suitability of CA based on an in-depth theoretical study, stakeholder opinions, and data availability. For biophysical factors, in addition to the classical variables used in CA suitability studies (Tesfaye et al., 2015; Prestele et al., 2018), this study used variables that characterize climate change, such as CV and AHTE, highlighting the significance of CA in climate change mitigation and adaptation. Farmers’ adoption of CA is positively related to variations in precipitation and temperature (Arslan et al., 2014; Asfaw et al., 2015). Therefore, CV and AHTE can effectively measure the severity of the need for CA in various places owing to climate change adaptation. Considering climate change-related variables, the RDs for CA identified in this study can better direct extension agencies to promote CA in regions with a greater risk of climate change, thereby maximizing the climate adaptation and mitigation effectiveness of CA. From a socioeconomic perspective, we combined the factors used by Tesfaye et al. (2015) and Prestele et al. (2018), while also considering the impact of extension services, a key source of agricultural knowledge for farmers, on the adoption of CA, as the knowledge required for practicing CA has been identified as a significant determinant of adoption.
In contrast to Tesfaye et al. (2015), we did not consider the livestock density. Although most agricultural producers in China are smallholders, crop production and animal husbandry are not interdependent for most smallholders. In regions where there is a trade-off between using residues as fodder or mulch retention, livestock density should be incorporated into the indicator system. The results of the sensitivity analysis demonstrated the appropriateness of the measurement indicators. Our evaluation index system provides a theoretical foundation for the accurate evaluation of CA suitability and is potentially extendable to other regions or countries.
MIF techniques and fuzzy logic methods were integrated to identify the RDs for CA, which could provide a more reliable outcome for all stakeholders. Previous studies mapping RDs for agricultural management practices assumed that various factors had an equal contribution (Muthoni et al., 2017; Andrade et al., 2019; Andrieu et al., 2021). MIF techniques allow for the quantitative analysis of the interactions between indicators. We employed the MIF technique to derive weights for indicators based on their relative importance. Using the PCA method and image analysis, a correlation matrix was created to precisely identify the interrelationships between indicators. The EFAST demonstrated that the MIF model better reflects the interactions between indicators than the FAHP model. Since CA adoption and performance are influenced by physical, economic, sociocultural, institutional, and environmental factors, all these components are interrelated (Steward et al., 2018; Swanepoel et al., 2018; Rodenburg et al., 2021). It is obvious that the combination of MIF and GIS techniques is advantageous, as it provides a dependable outcome for identifying suitable areas for CA in heterogeneous environments. Additionally, fuzzy logic methods were used to normalize the input data. This is a valid extension to previous studies in which variables were classified based on thresholds (Notenbaert et al., 2013; Tesfaye et al., 2015; Andrade et al., 2019; Andrieu et al., 2021). According to their level of expertise and knowledge, common classifications like ‘lowlands’, ‘mid-latitudes’ and ‘highlands’ may differ between regions or scholars (Muthoni et al., 2017). Moreover, the classification of a variable does not reflect the continuous variation and geographic heterogeneity of variables at a small scale, which means it does not accurately communicate the information reflected in the data itself. Fuzzy logic is the optimal method for resolving such issues, as it is specifically created to handle problems with a degree of uncertainty by converting data to a range between 0 and 1. Based on the aforementioned analysis, the integration of MIF techniques and fuzzy logic methods provides an effective strategy for accurately and successfully identifying RDs for agricultural management practices.
Suitability maps for CA were generated by considering the interaction and diversity of biophysical and socioeconomic factors that influenced the performance and adoption of all CA components. Because we considered CA in its entirety, our research revealed that the most suitable arable land is mainly distributed in the northern arid and semi-arid zone, the Loess Plateau, the Yellow-Huaihai Plain, and the Northeast Plain (Figure 5). Notably, Xiao et al. (2020) conducted a study that focused on a specific CA component and found that it was more suitable for the southern region. However, their research also supported our findings as they demonstrated that straw mulching combined with tillage reduction, including no tillage and reduced tillage, performed exceptionally well in the northern areas. This alignment with the findings of Xiao et al. (2020) provides partial validation for our study. Furthermore, our investigation aligns with the discoveries of Prestele et al. (2018), who identified substantial potential for adopting CA in the Yellow and Huaihai plains, as well as in the northeastern and western regions of China. Consistent with Prestele et al. (2018), we found that a significant portion of cultivated land in these regions exhibited either suitability or high suitability for CA. The sensitivity analysis results further demonstrated the reliability of our findings.
The preceding analysis demonstrates that the results of this study are trustworthy and may be relied upon for decision-making. The spatial prioritization of zones with the greatest suitability for scaling out agricultural technologies rationalizes limited resources and reduces failure risk (Muthoni et al., 2017). The study’s suitability maps can help policymakers, administrators, and decision-makers target CA on a national scale to suitable regions where it functions best and can be adopted quickly. In addition, it can help decision makers prioritize CA interventions across the nation. This may involve selecting regions with high biophysical and socioeconomic suitability as implementation entry sites for scaling-up CA. Additionally, the use of suitability indices would promote the rational investment of available resources to achieve the greatest prospective impact at scale. For example, they provide the foundation for establishing the best number and placement of experimental demonstration stations and demonstration sites at a certain scale or give a basis for decisions pertaining to the optimisation of existing experimental sites (Andrade et al., 2019). In general, suitability maps can serve as tools to guide discussions with other stakeholders regarding sustainable food production and to design effective CA promotion strategies.
According to our analysis, 40.92% of the currently cultivated areas are suitable for CA, whereas 8.89% of arable land is unsuitable for CA. However, only 6.42% China’s arable land is currently processed under CA conditions, which is far less than the 13.90% land identified as highly suitable in this study (Figure 5). Targeting highly suitable cultivated areas in the near future with appropriate CA technologies and extension systems could increase the coverage and benefits of CA in China. To promote CA in suitable areas more effectively, a deeper exploration of the specific drivers and constraints to CA implementation practices is required. Our sensitivity analysis revealed that TPI, AMP, HI, and PD were the most ubiquitous factors influencing the suitability of CA. Consequently, when promoting CA, these factors should be carefully considered.
Similarly, the availability of more affordable credit services can encourage small-scale producers to engage in activities with long-term advantages. In regions with high biophysical suitability but low socioeconomic suitability, such as the Northern arid and semi-arid region, Loess Plateau, and Northeast Plain (Figures 3, 4), increasing subsidies or improving credit access mechanisms could be effective strategies for promoting CA adoption. Farmers can avoid the financial restrictions of purchasing farm machinery by outsourcing machinery services, whereas socialized agricultural service organizations can circumvent the land-scale constraints of adopting CA by serving a larger number of farmers (He, 2021; Qing et al., 2023). In these regions, supporting and guiding the development of agricultural socialization services is also a viable alternative.
At the same time, regions with low biophysical suitability may permit the implementation of one or two CA practices, but not the entire set. In these regions, such as the Middle and Lower Yangtze River Plain, the Yunnan-Guizhou Plateau, and southern China (Figure 3), CA practices should be adapted and redesigned to match the local biophysical conditions, based on a thorough knowledge of the local limitations and opportunities, as well as the advantages and disadvantages of CA in these locations. Farmers’ participation in research and extension networks enables CA promotion to be flexible and transitional by allowing them to test and adapt their components (Rodenburg et al., 2021). Attracting farmers to participate in the CA research and promotion would be an effective strategy to improve its adaptability in regions with low biophysical suitability.
Agricultural land management has a significant effect on the regional climate and determines local responses to anticipated climate change. CA, crop residue management, and no-till farming have received increasing attention in the literature on climate change mitigation and adaptation. However, large-scale assessments have largely ignored the spatially variable effects of agricultural land management practices, which leads to an overestimation of agricultural output and climate change mitigation potentials (Prestele and Verburg, 2020). This is mostly due to the absence of spatially explicit datasets reflecting the implementation of this type of management. Moreover, CA is performed optimally when all three fundamental principles are adequately combined in the field (Pittelkow et al., 2015), and the agricultural production’s growth potential is likely to be underestimated if a single CA practice is implemented (Xiao et al., 2020). We have generated the high-resolution (1,000 × 1,000 m) national dataset of the potential distribution of CA in its three practices. The maps provide useful input to land surface models for evaluating the impacts of alterations to agricultural land management strategies on production potential and associated climate variables.
It is well known that there is significant heterogeneity among various types of farmers within a certain region based on production goals and resource endowments (Giller et al., 2011). Technology adoption may differ between large and smallholder farms situated in a favorable zone. As spatial information generally fails to account for micro-heterogeneity at the field/local level, one limitation of this study is that it does not consider the great diversity of smallholder farms’ resource endowment. More precise targeting of optimal alternatives that match farm characteristics and expectations is required. Therefore, future research should focus on coupling the two approaches (RDs and farm household typologies) to complement spatial information with household-level data. As noted in similar studies (Andrieu et al., 2021), widely accessible cross-sectional household data could represent effective means of bridging this gap.
By conducting a thorough theoretical examination of biophysical and socioeconomic factors influencing CA adoption and performance, and incorporating stakeholder input, we developed a systematic and robust framework for evaluating CA suitability. Additionally, we introduced an innovative assessment approach that combines the MIF technique and fuzzy logic methods to identify areas suitable for CA implementation. Fuzzy logic application enables the normalization of biophysical and socioeconomic variables, effectively capturing continuous variation and geographic heterogeneity at a granular level. Conversely, the MIF technique allows for considering interrelationships among indicators when calculating their respective weights, leading to a more comprehensive analysis. To test the reliability of the results, we conducted a sensitivity analysis using the map removal method and EFAST. This analysis demonstrated that the integration of MIF techniques and fuzzy logic methods exhibited a high degree of flexibility in addressing variations in biophysical and socioeconomic conditions and facilitated a more accurate identification of suitable areas for CA promotion.
Applying the proposed method to China, we generated CA suitability maps, revealing that 29.30 and 40.92% of cultivated land was moderately and quite suitable for CA, respectively. Compared to the current adoption rate of 6.42%, China holds significant potential to promote sustainable CA across more cultivated land. Regions with high biophysical and socioeconomic suitability can serve as entry points for scaling up CA. In areas with high biophysical suitability but low socioeconomic suitability, strategies such as increasing subsidies or improving credit access mechanisms could effectively promote CA adoption. In regions with low biophysical suitability, adapting and redesigning CA practices to align with local conditions is essential.
Our research contributes to guiding land use policy-making by spatially identifying areas suitable for CA implementation. This information enables policymakers to concentrate on appropriate areas for CA deployment to achieve sustainable food production and climate objectives, thereby informing land use policy formulation and execution. Moreover, our findings enhance policy implementation effectiveness by reducing the risk of failure in CA promotion, maximizing its impact and adoption rate. Implementing CA in suitable areas contributes to improved resource use efficiency, ecological environment protection, enhanced agricultural disaster resilience, and increased crop yield and quality. Additionally, our maps serve as essential inputs for ex-ante impact assessments of CA, as they illustrate the scale and distribution of croplands where CA adoption is likely, providing valuable information for evaluating the potential effects of wide-scale CA promotion. Overall, our study sets the stage for future research on land use policy and CA implementation, with potential applications in other regions facing similar challenges.
The original contributions presented in the study are included in the article/Supplementary material, further inquiries can be directed to the corresponding author.
ZW: conceptualization, methodology, investigation, formal analysis, and writing—original draft preparation. YD: conceptualization, investigation, writing—reviewing and editing, and supervision. JL: methodology, formal analysis, and visualization. ZC: methodology, investigation, and writing—reviewing and editing. ZY: writing—reviewing and editing and funding acquisition. All authors contributed to the article and approved the submitted version.
This study was supported by the National Natural Science Foundation of China under project (no. 42171217); and the China Institute for Rural Studies, Tsinghua University (grant no. CIRS2022-11).
We would like to acknowledge the data support from Yangtze River Delta Science Data Center, National Earth System Science Data Center, National Science & Technology Infrastructure of China (http://geodata.nnu.edu.cn/)’’. We also thank the conservation agriculture technology experts, agricultural extension workers, and agricultural social service organizations of the “National Science and Technology Innovation Alliance for Blackland Conservation and Utilization” for their great support and constructive opinions in the selection of evaluation indicators.
The authors declare that the research was conducted in the absence of any commercial or financial relationships that could be construed as a potential conflict of interest.
All claims expressed in this article are solely those of the authors and do not necessarily represent those of their affiliated organizations, or those of the publisher, the editors and the reviewers. Any product that may be evaluated in this article, or claim that may be made by its manufacturer, is not guaranteed or endorsed by the publisher.
The Supplementary material for this article can be found online at: https://www.frontiersin.org/articles/10.3389/fsufs.2023.1219938/full#supplementary-material
Akpoti, K., Kabo-bah, A. T., and Zwart, S. J. (2019). Agricultural land suitability analysis: state-of-the-art and outlooks for integration of climate change analysis. Agric. Syst. 173, 172–208. doi: 10.1016/j.agsy.2019.02.013
Andrade, J. F., Rattalino Edreira, J. I., Farrow, A., van Loon, M. P., Craufurd, P. Q., Rurinda, J., et al. (2019). A spatial framework for ex-ante impact assessment of agricultural technologies. Glob. Food Sec. 20, 72–81. doi: 10.1016/j.gfs.2018.12.006
Andrieu, N., Dumas, P., Hemmerlé, E., Caforio, F., Falconnier, G. N., Blanchard, M., et al. (2021). Ex ante mapping of favorable zones for uptake of climate-smart agricultural practices: a case study in West Africa. Environ. Dev. 37:100566. doi: 10.1016/j.envdev.2020.100566
Arslan, A., McCarthy, N., Lipper, L., Asfaw, S., and Cattaneo, A. (2014). Adoption and intensity of adoption of conservation farming practices in Zambia. Agric. Ecosyst. Environ. 187, 72–86. doi: 10.1016/j.agee.2013.08.017
Aryal, J. P., Jat, M. L., Sapkota, T. B., Khatri-Chhetri, A., Kassie, M., Rahut, D. B., et al. (2018). Adoption of multiple climate-smart agricultural practices in the Gangetic plains of Bihar, India. Int. J. Clim. Change Strateg. Manag. 10, 407–427. doi: 10.1108/IJCCSM-02-2017-0025
Asfaw, S., McCarthy, N., Lipper, L., Arslan, A., Cattaneo, A., and Kachulu, M. (2015). Climate variability, adaptation strategies and food security in Malawi. Rome: FAO.
Baudron, F., Tittonell, P., Corbeels, M., Letourmy, P., and Giller, K. E. (2012). Comparative performance of conservation agriculture and current smallholder farming practices in semi-arid Zimbabwe. Field Crops Res. 132, 117–128. doi: 10.1016/j.fcr.2011.09.008
Beehler, J., Fry, J., Negassa, W., and Kravchenko, A. (2017). Impact of cover crop on soil carbon accrual in topographically diverse terrain. J. Soil Water Conserv. 72, 272–279. doi: 10.2489/jswc.72.3.272
Bongaarts, J. (2020). United nations department of economic and social affairs, population division world family planning 2020: highlights. Popul. Dev. Rev.. United Nations Publications 46, 857–858. Portico. doi: 10.1111/padr.12377
Brandt, P., Kvakić, M., Butterbach-Bahl, K., and Rufino, M. C. (2017). How to target climate-smart agriculture? Concept and application of the consensus-driven decision support framework “targetCSA”. Agric. Syst. 151, 234–245. doi: 10.1016/j.agsy.2015.12.011
Burrough, P. A., McDonnell, R. A., and Lloyd, C. D. (2015). Principles of geographical information systems. Oxford University Press, Oxford.
Campbell, B. M., Thornton, P., Zougmoré, R., van Asten, P., and Lipper, L. (2014). Sustainable intensification: what is its role in climate smart agriculture? Curr. Opin. Environ. Sustain. 8, 39–43. doi: 10.1016/j.cosust.2014.07.002
Chen, R., de Sherbinin, A., Ye, C., and Shi, G. (2014). China’s soil pollution: farms on the frontline. Science 344:691. doi: 10.1126/science.344.6185.691-a
Corona, P., Salvati, R., Barbati, A., and Chirici, G. (2008). “Land suitability for short rotation coppices assessed through fuzzy membership functions,” in Patterns and Processes in Forest Landscapes. eds. R. Lafortezza, G. Sanesi, J. Chen, and T. R. Crow (Dordrecht: Springer), 191–211.
D’Emden, F. H., Llewellyn, R. S., and Burton, M. P. (2006). Adoption of conservation tillage in Australian cropping regions: an application of duration analysis. Technol. Forecasting Soc. Change. 73, 630–647. doi: 10.1016/j.techfore.2005.07.003
De Reu, J., Bourgeois, J., Bats, M., Zwertvaegher, A., Gelorini, V., De Smedt, P., et al. (2013). Application of the topographic position index to heterogeneous landscapes. Geomorphology 186, 39–49. doi: 10.1016/j.geomorph.2012.12.015
Giller, K. E., Corbeels, M., Nyamangara, J., Triomphe, B., Affholder, F., Scopel, E., et al. (2011). A research agenda to explore the role of conservation agriculture in African smallholder farming systems. Field Crops Res. 124, 468–472. doi: 10.1016/j.fcr.2011.04.010
Govaerts, B., Castellanos-Navarrete, A., Sayre, K. D., Dixon, J., and Dendooven, L. (2009). Conservation agriculture and soil carbon sequestration: between myth and farmer reality. Crit. Rev. Plant Sci. 28, 97–122. doi: 10.1080/07352680902776358
Gowda, P. H., Mulla, D. J., and Dalzell, B. J. (2003). Examining the targeting of conservation tillage practices to steep vs. flat landscapes in the Minnesota River basin. J. Soil Water Conserv. 58, 53–57.
Gwandu, T., Mtambanengwe, F., Mapfumo, P., Mashavave, T. C., Chikowo, R., and Nezomba, H. (2014). Factors influencing access to integrated soil fertility management information and knowledge and its uptake among smallholder farmers in Zimbabwe. J. Agric. Educ. Extension. 20, 79–93. doi: 10.1080/1389224X.2012.757245
He, Y. P. (2021). Operations outsourcing: A Chinese option for agricultural modernization – A preliminary analytical framework. The ‘three agriculture’ decision-making guide. Available at: http://www.cirs.tsinghua.edu.cn/sannjcyc/3283.jhtml. (in Chinese)
Jat, M. L., Chakraborty, D., Ladha, J. K., Rana, D. S., Gathala, M. K., McDonald, A., et al. (2020). Conservation agriculture for sustainable intensification in South Asia. Nat. Sustain. 3, 336–343. doi: 10.1038/s41893-020-0500-2
Jiang, F. H., Qian, Y. Q., Guo, Z. C., Gao, L., and Zhang, Z. B. (2022). Evaluating the regional suitability of conservation tillage and deep tillage based on crop yield in the black soil of Northeast China: a meta-analysis. Acta Pedol. Sin. (in Chinese) 59, 935–952. doi: 10.11766/trxb202202220070
Jin, X., Li, Z., Nie, C., Xu, X., Feng, H., Guo, W., et al. (2018). Parameter sensitivity analysis of the AquaCrop model based on extended fourier amplitude sensitivity under different agro-meteorological conditions and application. Field Crops Res. 226, 1–15. doi: 10.1016/j.fcr.2018.07.002
Kan, Z. R., Qi, J. Y., Zhao, X., Zhang, X. Q., Lu, Z. Y., Cheng, Y. C., et al. (2020). “No-Till Farming Systems in Rain-Fed Areas of China,’’ in No-till Farming Systems for Sustainable Agriculture. eds. Y. Dang, R. Dalal, and N. Menzies (Springer, Cham).
Kassam, A., Friedrich, T., Shaxson, F., and Pretty, J. (2009). The spread of conservation agriculture: justification, sustainability and uptake. Int. J. Agric. Sustain. 7, 292–320. doi: 10.3763/ijas.2009.0477
Kassie, M., Jaleta, M., Shiferaw, B., Mmbando, F., and Mekuria, M. (2013). Adoption of interrelated sustainable agricultural practices in smallholder systems: evidence from rural Tanzania. Technol. Forecasting Soc. Change. 80, 525–540. doi: 10.1016/j.techfore.2012.08.007
Komarek, A. M. (2018). Conservation agriculture in western China increases productivity and profits without decreasing resilience. Food Sec. 10, 1251–1262. doi: 10.1007/s12571-018-0833-0
Kotu, B. H., Alene, A., Manyong, V., Hoeschle-Zeledon, I., and Larbi, A. (2017). Adoption and impacts of sustainable intensification practices in Ghana. Int. J. Agric. Sustain. 15, 539–554. doi: 10.1080/14735903.2017.1369619
Lal, R. (2018). Sustainable intensification of China’s agroecosystems by conservation agriculture. Int. Soil Water Conserv. Res. 6, 1–12. doi: 10.1016/j.iswcr.2017.11.001
Li, H., He, J., Bharucha, Z. P., Lal, R., and Pretty, J. (2016). Improving China’s food and environmental security with conservation agriculture. Int. J. Agric. Sustain. 14, 377–391. doi: 10.1080/14735903.2016.1170330
Liu, H., Jiang, D., Yang, X., and Luo, C. (2005). Spatialization approach to 1 km grid GDP supported by remote sensing. Geogr. Inf. Sci. 7, 120–123.
Lodwick, W. A., Monson, W., and Svoboda, L. (1990). Attribute error and sensitivity analysis of map operations in geographical informations systems: suitability analysis. Int. J. Geogr. Inf. Syst. 4, 413–428. doi: 10.1080/02693799008941556
Maggio, G., Mastrorillo, M., and Sitko, N. J. (2022). Adapting to high temperatures: effect of farm practices and their adoption duration on total value of crop production in Uganda. American J. Agri. Economics. 104, 385–403. doi: 10.1111/ajae.12229
Mandal, P., Mandal, S., Halder, S., and Paul, S. (2021). Assessing and mapping cropland suitability applying geospatial and MIF techniques in the semiarid region with an integrated approach. Arab. J. Geosci. 14:1948. doi: 10.1007/s12517-021-08171-3
Muthoni, F. K., Baijukya, F., Bekunda, M., Sseguya, H., Kimaro, A., Alabi, T., et al. (2019). Accounting for correlation among environmental covariates improves delineation of extrapolation suitability index for agronomic technological packages. Geocarto Int. 34, 368–390. doi: 10.1080/10106049.2017.1404144
Muthoni, F. K., Guo, Z., Bekunda, M., Sseguya, H., Kizito, F., Baijukya, F., et al. (2017). Sustainable recommendation domains for scaling agricultural technologies in Tanzania. Land Use Policy 66, 34–48. doi: 10.1016/j.landusepol.2017.04.028
Napolitano, P., and Fabbri, A. G. (1996). Single-parameter sensitivity analysis for aquifer vulnerability assessment using DRASTIC and SINTACS. IAHS publications-series of proceedings and reports-intern assoc hydrological sciences. 235, 559–566.
Negassa, W., Price, R. F., Basir, A., Snapp, S. S., and Kravchenko, A. (2015). Cover crop and tillage systems effect on soil CO2 and N2O fluxes in contrasting topographic positions. Soil Till. Res. 154, 64–74. doi: 10.1016/j.still.2015.06.015
Nganga, W. B., Ngetich, K. O., Macharia, M. J., Kiboi, N. M., Adamtey, N., and Ngetich, K. F. (2020). Multi-influencing-factors’ evaluation for organic-based soil fertility technologies out-scaling in upper Tana catchment in Kenya. Sci. Afr. 7:e00231. doi: 10.1016/j.sciaf.2019.e00231
Notenbaert, A., Herrero, M., De Groote, H., You, L., Gonzalez-Estrada, E., and Blummel, M. (2013). Identifying recommendation domains for targeting dual-purpose maize-based interventions in crop-livestock systems in East Africa. Land Use Policy 30, 834–846. doi: 10.1016/j.landusepol.2012.06.016
Notenbaert, A., Pfeifer, C., Silvestri, S., and Herrero, M. (2017). Targeting, out-scaling and prioritising climate-smart interventions in agricultural systems: lessons from applying a generic framework to the livestock sector in sub-Saharan Africa. Agric. Syst. 151, 153–162. doi: 10.1016/j.agsy.2016.05.017
Nyanga, P. H., Johnsen, F. H., Aune, J. B., and Kalinda, T. H. (2011). Smallholder farmers’ perceptions of climate change and conservation agriculture: evidence from Zambia. J. Sustain. Dev 4:v4n4p73. doi: 10.5539/jsd.v4n4p73
Ortiz-Bobea, A., Ault, T. R., Carrillo, C. M., Chambers, R. G., and Lobell, D. B. (2021). Anthropogenic climate change has slowed global agricultural productivity growth. Nat. Clim. Chang. 11, 306–312. doi: 10.1038/s41558-021-01000-1
Palombi, L., and Sessa, R. (2013). Climate-smart agriculture: sourcebook[M]. Food and Agriculture Organization of the United Nations (FAO). Available at: http://www.fao.org/docrep/018/i3325e/i3325e.pdf
Pittelkow, C. M., Liang, X., Linquist, B. A., van Groenigen, K. J., Lee, J., Lundy, M. E., et al. (2015). Productivity limits and potentials of the principles of conservation agriculture. Nature 517, 365–368. doi: 10.1038/nature13809
Prestele, R., Hirsch, A. L., Davin, E. L., Seneviratne, S. I., and Verburg, P. H. (2018). A spatially explicit representation of conservation agriculture for application in global change studies. Glob. Chang. Biol. 24, 4038–4053. Portico. doi: 10.1111/gcb.14307
Prestele, R., and Verburg, P. H. (2020). The overlooked spatial dimension of climate-smart agriculture. Glob. Chang. Biol. 26, 1045–1054. doi: 10.1111/gcb.14940
Qing, C., Zhou, W., Song, J., Deng, X., and Xu, D. (2023). Impact of outsourced machinery services on farmers’ green production behavior: evidence from Chinese rice farmers. J. Environ. Manag. 327:116843. doi: 10.1016/j.jenvman.2022.116843
Rodenburg, J., Büchi, L., and Haggar, J. (2021). Adoption by adaptation: moving from conservation agriculture to conservation practices. Int. J. Agric. Sustain. 19, 437–455. doi: 10.1080/14735903.2020.1785734
Roy, S., Singha, N., Bose, A., Basak, D., and Chowdhury, I. R. (2023). Multi-influencing factor (MIF) and RS–GIS-based determination of agriculture site suitability for achieving sustainable development of sub-Himalayan region. India. Environ. Dev. Sustain. 25, 7101–7133. doi: 10.1007/s10668-022-02360-0
Saltelli, A. (1999). Sensitivity analysis: could better methods be used? J. Geophys. Res. 104, 3789–3793. doi: 10.1029/1998JD100042
Schmitz, P. M., Mal, P., and Hesse, J. W. (2015). The importance of conservation tillage as a contribution to sustainable agriculture: A special case of soil erosion. Institute für Agribusiness, Gießen, Germany.
Shaban, A., Khawlie, M., Bou Kheir, R., and Abdallah, C. (2001). Assessment of road instability along a typical mountainous road using GIS and aerial photos, Lebanon–eastern Mediterranean. Bull. Eng. Geol. Environ. 60, 93–101. doi: 10.1007/s100640000092
Steward, P. R., Dougill, A. J., Thierfelder, C., Pittelkow, C. M., Stringer, L. C., Kudzala, M., et al. (2018). The adaptive capacity of maize-based conservation agriculture systems to climate stress in tropical and subtropical environments: a meta-regression of yields. Agric. Ecosyst. Environ. 251, 194–202. doi: 10.1016/j.agee.2017.09.019
Sun, W., Canadell, J. G., Yu, L., Yu, L., Zhang, W., Smith, P., et al. (2020). Climate drives global soil carbon sequestration and crop yield changes under conservation agriculture. Glob. Chang. Biol. 26, 3325–3335. doi: 10.1111/gcb.15001
Swanepoel, C. M., Rötter, R. P., van der Laan, M., Annandale, J. G., Beukes, D. J., du Preez, C. C., et al. (2018). The benefits of conservation agriculture on soil organic carbon and yield in southern Africa are site-specific. Soil Till. Res. 183, 72–82. doi: 10.1016/j.still.2018.05.016
Taheri, K., Missimer, T. M., Taheri, M., Moayedi, H., and Mohseni Pour, F. (2020). Critical zone assessments of an alluvial aquifer system using the multi-influencing factor (MIF) and analytical hierarchy process (AHP) models in Western Iran. Nat. Resour. Res. 29, 1163–1191. doi: 10.1007/s11053-019-09516-2
Talukdar, S., Naikoo, M. W., Mallick, J., Praveen, B., Shahfahad, S., Sharma, P., et al. (2022). Coupling geographic information system integrated fuzzy logic-analytical hierarchy process with global and machine learning based sensitivity analysis for agricultural suitability mapping. Agric. Syst. 196:103343. doi: 10.1016/j.agsy.2021.103343
Tarantola, S. (2005). SimLab 2.2 reference manual. Institute for Systems, informatics and safety, European Commission, Joint Research Center, Ispra, Italy.
Tesfaye, K., Jaleta, M., Jena, P., and Mutenje, M. (2015). Identifying potential recommendation domains for conservation agriculture in Ethiopia, Kenya, and Malawi. Environ. Manag. 5, 330–346. doi: 10.1007/s00267-014-0386-8
Tessema, Y., Asafu-Adjaye, J., Rodriguez, D., Mallawaarachchi, T., and Shiferaw, B. (2015). A bio-economic analysis of the benefits of conservation agriculture: the case of smallholder farmers in Adami Tulu district. Ethiopia. Ecol. Econ. 120, 164–174. doi: 10.1016/j.ecolecon.2015.10.020
Thomas, R., and Duraisamy, V. (2018). Hydrogeological delineation of groundwater vulnerability to droughts in semi-arid areas of western Ahmednagar district. Egypt. J. Remote Sens. Space Sci. 21, 121–137. doi: 10.1016/j.ejrs.2016.11.008
Thornton, P. K., Whitbread, A., Baedeker, T., Cairns, J., Claessens, L., Baethgen, W., et al. (2018). A framework for priority-setting in climate smart agriculture research. Agric. Syst. 167, 161–175. doi: 10.1016/j.agsy.2018.09.009
Verburg, P. H., Ellis, E. C., and Letourneau, A. (2011). A global assessment of market accessibility and market influence for global environmental change studies. Environ. Res. Lett. 6:034019. doi: 10.1088/1748-9326/6/3/034019
Wan, X., Xiao, L., Vadeboncoeur, M. A., Johnson, C. E., and Huang, Z. (2018). Response of mineral soil carbon storage to harvest residue retention depends on soil texture: a meta-analysis. Forest Ecol. Manag. 408, 9–15. doi: 10.1016/j.foreco.2017.10.028
Wang, Z., Huan, M., Li, T., and Dai, Y. (2022). Access to information on sustainable intensification practices for new agricultural business entities in China. Environ. Sci. Pollut. Res. 1–15, 27683–27697. doi: 10.1007/s11356-022-24158-3
Wang, Z., Liu, J., Li, T., Ren, W., and Rui, Y. (2021). Spatial heterogeneity of agricultural science and technology parks technology diffusion: a case study of Yangling ASTP. Chin. Geogr. Sci. 31, 629–645. doi: 10.1007/s11769-021-1196-6
Ward, P. S., Bell, A. R., Droppelmann, K., and Benton, T. G. (2018). Early adoption of conservation agriculture practices: understanding partial compliance in programs with multiple adoption decisions. Land Use Policy 70, 27–37. doi: 10.1016/j.landusepol.2017.10.001
Wiśniewski, Ł., Biczkowski, M., and Rudnicki, R. (2021). Natural potential versus rationality of allocation of common agriculture policy funds dedicated for supporting organic farming development – assessment of spatial suitability: the case of Poland. Ecol. Indic. 130:108039. doi: 10.1016/j.ecolind.2021.108039
Wollni, M., Lee, D. R., and Thies, J. E. (2010). Conservation agriculture, organic marketing, and collective action in the Honduran hillsides. Agric. Econ. 41, 373–384. doi: 10.1111/j.1574-0862.2010.00445.x
Xiao, L., Zhao, R., and Zhang, X. (2020). Crop cleaner production improvement potential under conservation agriculture in China: a meta-analysis. J. Clean. Prod. 269:122262. doi: 10.1016/j.jclepro.2020.122262
Xu, W., Jin, X., Liu, J., and Zhou, Y. (2020). Impact of cultivated land fragmentation on spatial heterogeneity of agricultural agglomeration in China. J. Geogr. Sci. 30, 1571–1589. doi: 10.1007/s11442-020-1800-1
Keywords: climate change, climate-smart agriculture, land management, scaling out, spatial targeting, China
Citation: Wang Z, Dai Y, Liu J, Chen Z and Yu Z (2023) Integrating multi-influencing factor techniques and fuzzy methods to identify recommendation domains for out-scaling conservation agriculture in China. Front. Sustain. Food Syst. 7:1219938. doi: 10.3389/fsufs.2023.1219938
Edited by:
Leonard Rusinamhodzi, International Institute of Tropical Agriculture (IITA), NigeriaReviewed by:
Xianfeng Liu, Shaanxi Normal University, ChinaCopyright © 2023 Wang, Dai, Liu, Chen and Yu. This is an open-access article distributed under the terms of the Creative Commons Attribution License (CC BY). The use, distribution or reproduction in other forums is permitted, provided the original author(s) and the copyright owner(s) are credited and that the original publication in this journal is cited, in accordance with accepted academic practice. No use, distribution or reproduction is permitted which does not comply with these terms.
*Correspondence: Yao Dai, eWFvZGFpQHRzaW5naHVhLmVkdS5jbg==
Disclaimer: All claims expressed in this article are solely those of the authors and do not necessarily represent those of their affiliated organizations, or those of the publisher, the editors and the reviewers. Any product that may be evaluated in this article or claim that may be made by its manufacturer is not guaranteed or endorsed by the publisher.
Research integrity at Frontiers
Learn more about the work of our research integrity team to safeguard the quality of each article we publish.