 Ciniro Costa Jr
 Philip Thornton
 Eva Wollenberg
- 1Alliance of Bioversity International and the International Center for Tropical Agriculture, Cali, Colombia
- 2Clim-Eat, Wageningen, Netherlands
- 3Gund Institute for Environment University of Vermont, Burlington, VT, United States
As countries prioritize climate action under the Paris Agreement, determining the overlap in agricultural areas requiring both adaptation and mitigation (A&M) interventions could lead to more efficient use of resources and support for farmers. Here, we identify global priorities for A&M by evaluating global datasets on greenhouse gas (GHG) emissions and climate hazards related to agriculture. We show that joint A&M hotspots cover <23% of global agricultural emissions and include 52% of the areas with significant climate hazards. The major portion of the joint area is croplands (ranging from 213 to 364 Mha), followed by pastures (3–74 Mha), and is concentrated in countries with limited ability to investment in adaptation actions. The most substantial A&M hotspots are situated across South Asia, with smaller areas in South East Asia, Africa, and Latin America. We highlight three findings from this analysis. First, most emissions and climate hazards do not occur in the same agricultural areas, suggesting the need for different strategies to address adaptation and mitigation separately in these areas. Second, in the areas where emissions and climate hazards do overlap, coordinated climate interventions that address emission reductions and adaptation at the same time would be a more effective use of scarce climate action investments. Third, A&M hotspots span national borders, emphasizing the importance of setting priorities and implementing action at regional and international scales. While our analysis highlights that focusing on adaptation and mitigation actions in the agricultural landscapes where they are most needed could help make the best use of climate finance, we recognize the pragmatic and justice-related implications may limit the extent of such prioritization. Balancing these considerations is essential for effective climate finance allocation and equitable climate action outcomes.
1 Introduction
Mitigating greenhouse gas emissions (GHG) and adapting to the impacts of climate change hold significance for the agricultural sector. Both climate actions are necessary to meet food demands and the goals of the Paris Agreement, and calls for their integration at the field, landscape or national and international policy level are common (Lipper et al., 2014; Di Gregorio et al. 2017; Kongsager, 2018).
The agricultural sector’s dependence on climatic stability makes it vulnerable to shifting patterns, necessitating proactive measures. Emission reduction strategies, such as the adoption of improved nitrogen fertilizer efficiency, direct seeding in rice and manure management, contribute to curbing climate impacts (Smith et al., 2008). Concurrently, adaptation efforts involving resilient crop varieties, irrigation practices, and weather forecasting enhance the sector’s capacity to cope with changing conditions (Steiner et al., 2020). Addressing these challenges not only secures food production but also ensures the livelihoods of farmers and the sustainability of agricultural systems, aligning with global climate goals and the sector’s long-term viability (Crippa et al., 2021; Roe et al., 2021; Costa et al., 2022; Gebre et al., 2023).
Therefore, identifying global adaptation and mitigation (A&M) hotspots for climate change action in agriculture could play a vital role in shaping investment and policy strategies to effectively realize climate policy targets. By channeling resources strategically into regions of geographical significance, the international community could optimize resources and reduce overlap, and establish a tangible pathway for collaboration in tackling climate, food security, and poverty challenges on a global scale (Zhao et al., 2018; Islam and Kieu, 2020). Hotspot information could target investment, such as private sector participation in more sustainable ventures, as businesses are compelled to adjust to evolving environmental demands. For instance, the utilization of public-private partnerships to raise capital, encompassing foreign direct investments for climate-resilient development projects (Awuni et al., 2023).
As stipulated by the Paris Agreement, nations outline their agendas for climate change A&M, as they have the option of including priorities and plans for adaptation to climate change in their Nationally Determined Contributions (NDCs). By 2021, the majority of low, lower middle-, and upper middle-income countries (135 nations) undertook this action, with 89 among them prioritizing agriculture for adaptation (Rose et al., 2021). These numbers might evolve as more countries revise and submit updated NDCs. However, despite their interconnectedness, A&M efforts are frequently treated in isolation across policy, research, and technological advancement.
Although, there is a growing recognition of the need for integrated approaches, this isolation persists due to various factors. For example, A&M actions usually operate on different timeframes. Mitigation seeks to reduce emissions now to prevent long-term climate change, while adaptation addresses immediate and long-term impacts. Second, stakeholders often hold conflicting interests, as mitigation may necessitate structural changes (e.g., economic and industrial shifts), whereas adaptation focuses on safeguarding communities and ecosystems, and typically, agricultural agencies prioritize adaptation measures, while mitigation efforts often fall within the scope of environmental offices. Third, resource constraints sometimes force prioritization, driving a wedge between the two approaches. Thus, addressing A&M together demands a deep understanding of their interconnections and synergies (Klein et al., 2007; Richards et al., 2016; Kongsager, 2018; Malhi et al., 2021).
In this context, a major question is whether A&M hotspots in agriculture occur in the same geographic areas, thereby enabling more efficient investment and action in the delivery of support to farmers. To guide global geographic priorities, in this article we demonstrate one approach to identify global biophysical hotspots for climate change adaptation and mitigation and examine the extent to which hotspots for adaptation and mitigation spatially coincide. By investigating this interplay, the research aims to shed light on the potential harmony between adaptation and mitigation efforts, uncovering synergies that can be harnessed to foster climate resilience. This examination contributes to a comprehensive understanding of how these intertwined priorities can be strategically aligned to maximize their impact on a global scale.
2 Methods
To locate mitigation and adaptation hotspots, we used global datasets for greenhouse (GHG) emissions and climate hazards related to agriculture. We developed a mitigation hotspots map in CO2 equivalents using EDGAR data (5-min resolution) for agricultural CH4 and N2O emissions in 2015 (EDGAR, 2021). Mitigation hotspots were identified as those spatial units representing the global top 95th, 90th, 85th, and 80th percentiles (pctl) of agricultural GHG emissions.The adaptation hotspots map was generated using the IPCC’s risk framework to reflect agricultural climate risk (Climate Change, 2014). In this framework, climate risk is defined as the intersection of hazard exposure, sensitivity to the hazard, and vulnerability to the hazard. Accordingly, hotspots were mapped as those places with high exposure to current and future climate hazards, high sensitivity owing to the importance of agriculture in the region, and high vulnerability arising from low county-level incomes (Jarvis et al., 2021). Additional details regarding the estimation of the potential reach of adaptation and mitigation (A&M) are provided below.
2.1 Mitigation hotspots
We develop the mitigation hotspots map by first creating a global agricultural GHG emissions map in equivalents of CO2 using EDGAR’s data (5-min resolution) on global agriculture CH4 and N2O emissions for the year of 2015, which were combined using the global warming potential values of the 5th IPCC Assessment Report (CH4 = 28 and N2O = 265; Climate Change, 2014). The mitigation hotspots were determined by considering emissions values representing the top 5%, 10%, 15%, and 20%, which correspond to global areas with emissions at the 95th, 90th, 85th, and 80th percentiles, respectively (i.e., higher than 1.8, 1.0, 0.6 and 0.4 tCO2e ha−1y−1, respectively).
In order to generate a global spatially distributed Ag-GHG emissions layer, this work used the GHG emissions layers from agricultural practices for the year of 2015 of the Emissions Database for Global Atmospheric Research (EDGAR) of the Joint Research Center (JRC). For better data handling, the memos were converted from NetCDF (Network Common Data Form) format to GeoTIFF using a Python language together with the GDAL (Geospatial Data Abstraction Library) raster and vector processing library.
Next, data layers emissions were converted into CO2 equivalent (CO2e) by multiplying CH4 and N2O emissions by their respective global warming potential (GWP) of the 5th IPCC Assessment Report (Climate Change, 2014): CO2 * 1, CH4 emission * 28 and N2O emission * 265. Finally, it was performed the conversion of values from kg/m2s-1 (base unit of EDGAR data) to Gigaton/cell area (~ 120km2)/year.
Estimates of CO2e were carried out using total emission values and above the top 20th, 15th, 10th and 5th percentiles for countries present in the boundaries provided by the GADM (Global Administrative Area Database) and, aiming at the inclusion of emissions from offshore sources or near the sea, an extension of the limits of coastal countries by 0.1 degrees (~11 km) was carried out. Emission estimates were also performed for pasture and agriculture areas, climate hazards, value of production, population and their respective intersections by country.
2.2 Adaptation hotspots
The adaptation hotspots map was generated by using the Climate Change (2014) risk framework. For exposure, we used the extent of cropland and pastureland (Ramankutty et al., 2008). For vulnerability, we followed Ericksen et al. (2011). Countries with “high” and “very high” levels of stunting (UNICEF/WHO/World Bank Group, 2021) were defined to be vulnerable. Adaptation hotspots refer to the intersection of the climate hazards, exposure and vulnerability data layers. These hotspots are widely spread across the agricultural areas of sub-Saharan Africa and South Asia, with more localized pockets in Central America and South-East Asia, affecting some 73 countries.
We further overlayed the developed mitigation and adaptation hotpots maps with the following maps:
• Crop and pasture area: spatially disaggregated dataset (5-min resolution) for the year of 2000 provided by Ramankutty et al. (2008). For defining agricultural land, we used a threshold of 12% for cropland and 35% for pasture land.
• Value of production (VoP): spatially disaggregated global livestock dataset (5-min resolution) containing information on VoP (in US$/km2/yr) for 28 world regions, 8 livestock production systems (including mixed crop-livestock systems), 4 animal species (cattle, small ruminants, pigs, and poultry), and 3 livestock products (milk, meat, and eggs) for the year of 2000 (Herrero et al., 2013). We used this as a proxy for total agricultural VoP.
• Country readiness: measure of the ability of countries to leverage investments and convert these investments into adaptation actions. This indicator measures the overall readiness by considering the following components: economic, governance and social readiness (ND-GAIN, 2020). Values range from 0 (weak) to 1.0 (strong) readiness.
3 Results
Our global map comprises an agricultural area of 5.8 billion hectares, of which 44, 42 and 14% are crops, pastures/grassland and undefined areas, respectively. These areas emitted approximately 5.0 GtCO2e in 2015 and include 952 mil ha vulnerable to climate hazards.
Joint adaptation and mitigation (A&M) hotspots account for less than 25% of global agriculture emissions and the area subject to climate hazards, suggesting that setting global priorities to achieve both adaptation and mitigation in the same geographic area has limited impact. A&M hotspot clusters nevertheless warrant attention, with South Asia as a priority (Table 1; Figure 1). Joint hotspots comprise less than 10% of the global agricultural area for cropland and pasture.
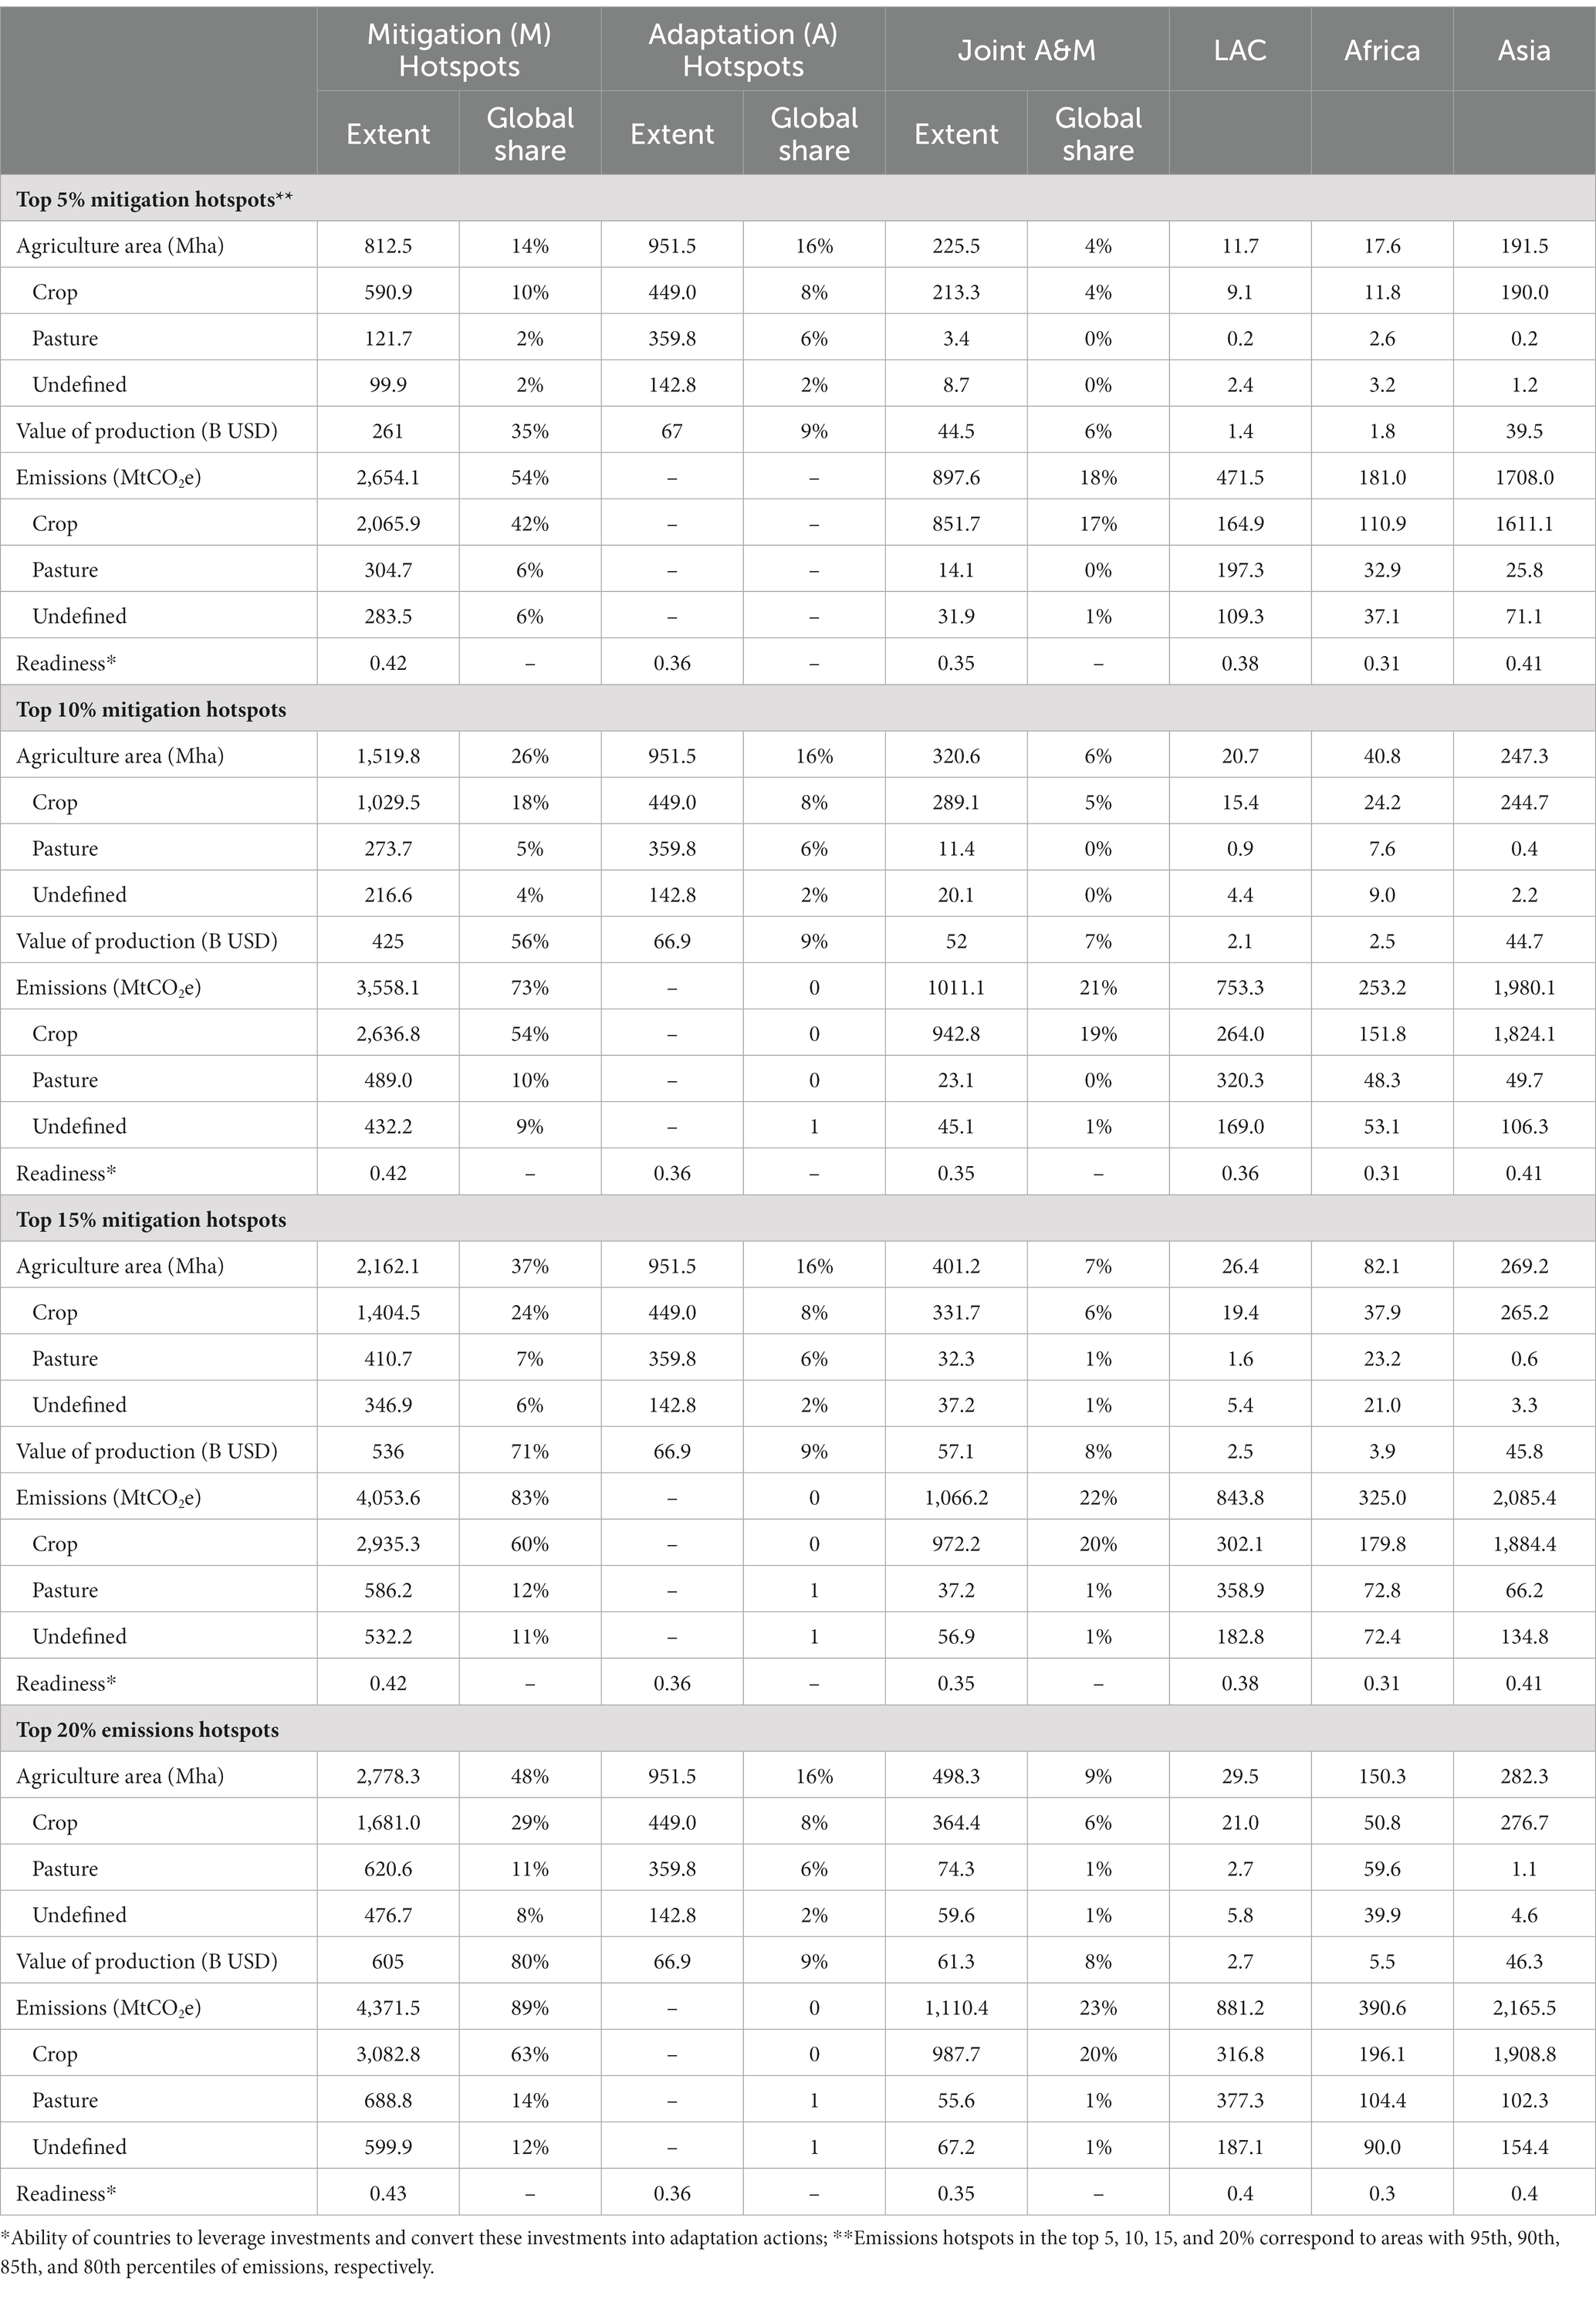
Table 1. Characterization of global adaptation and mitigation (A&M) hotspots and clusters in agriculture.
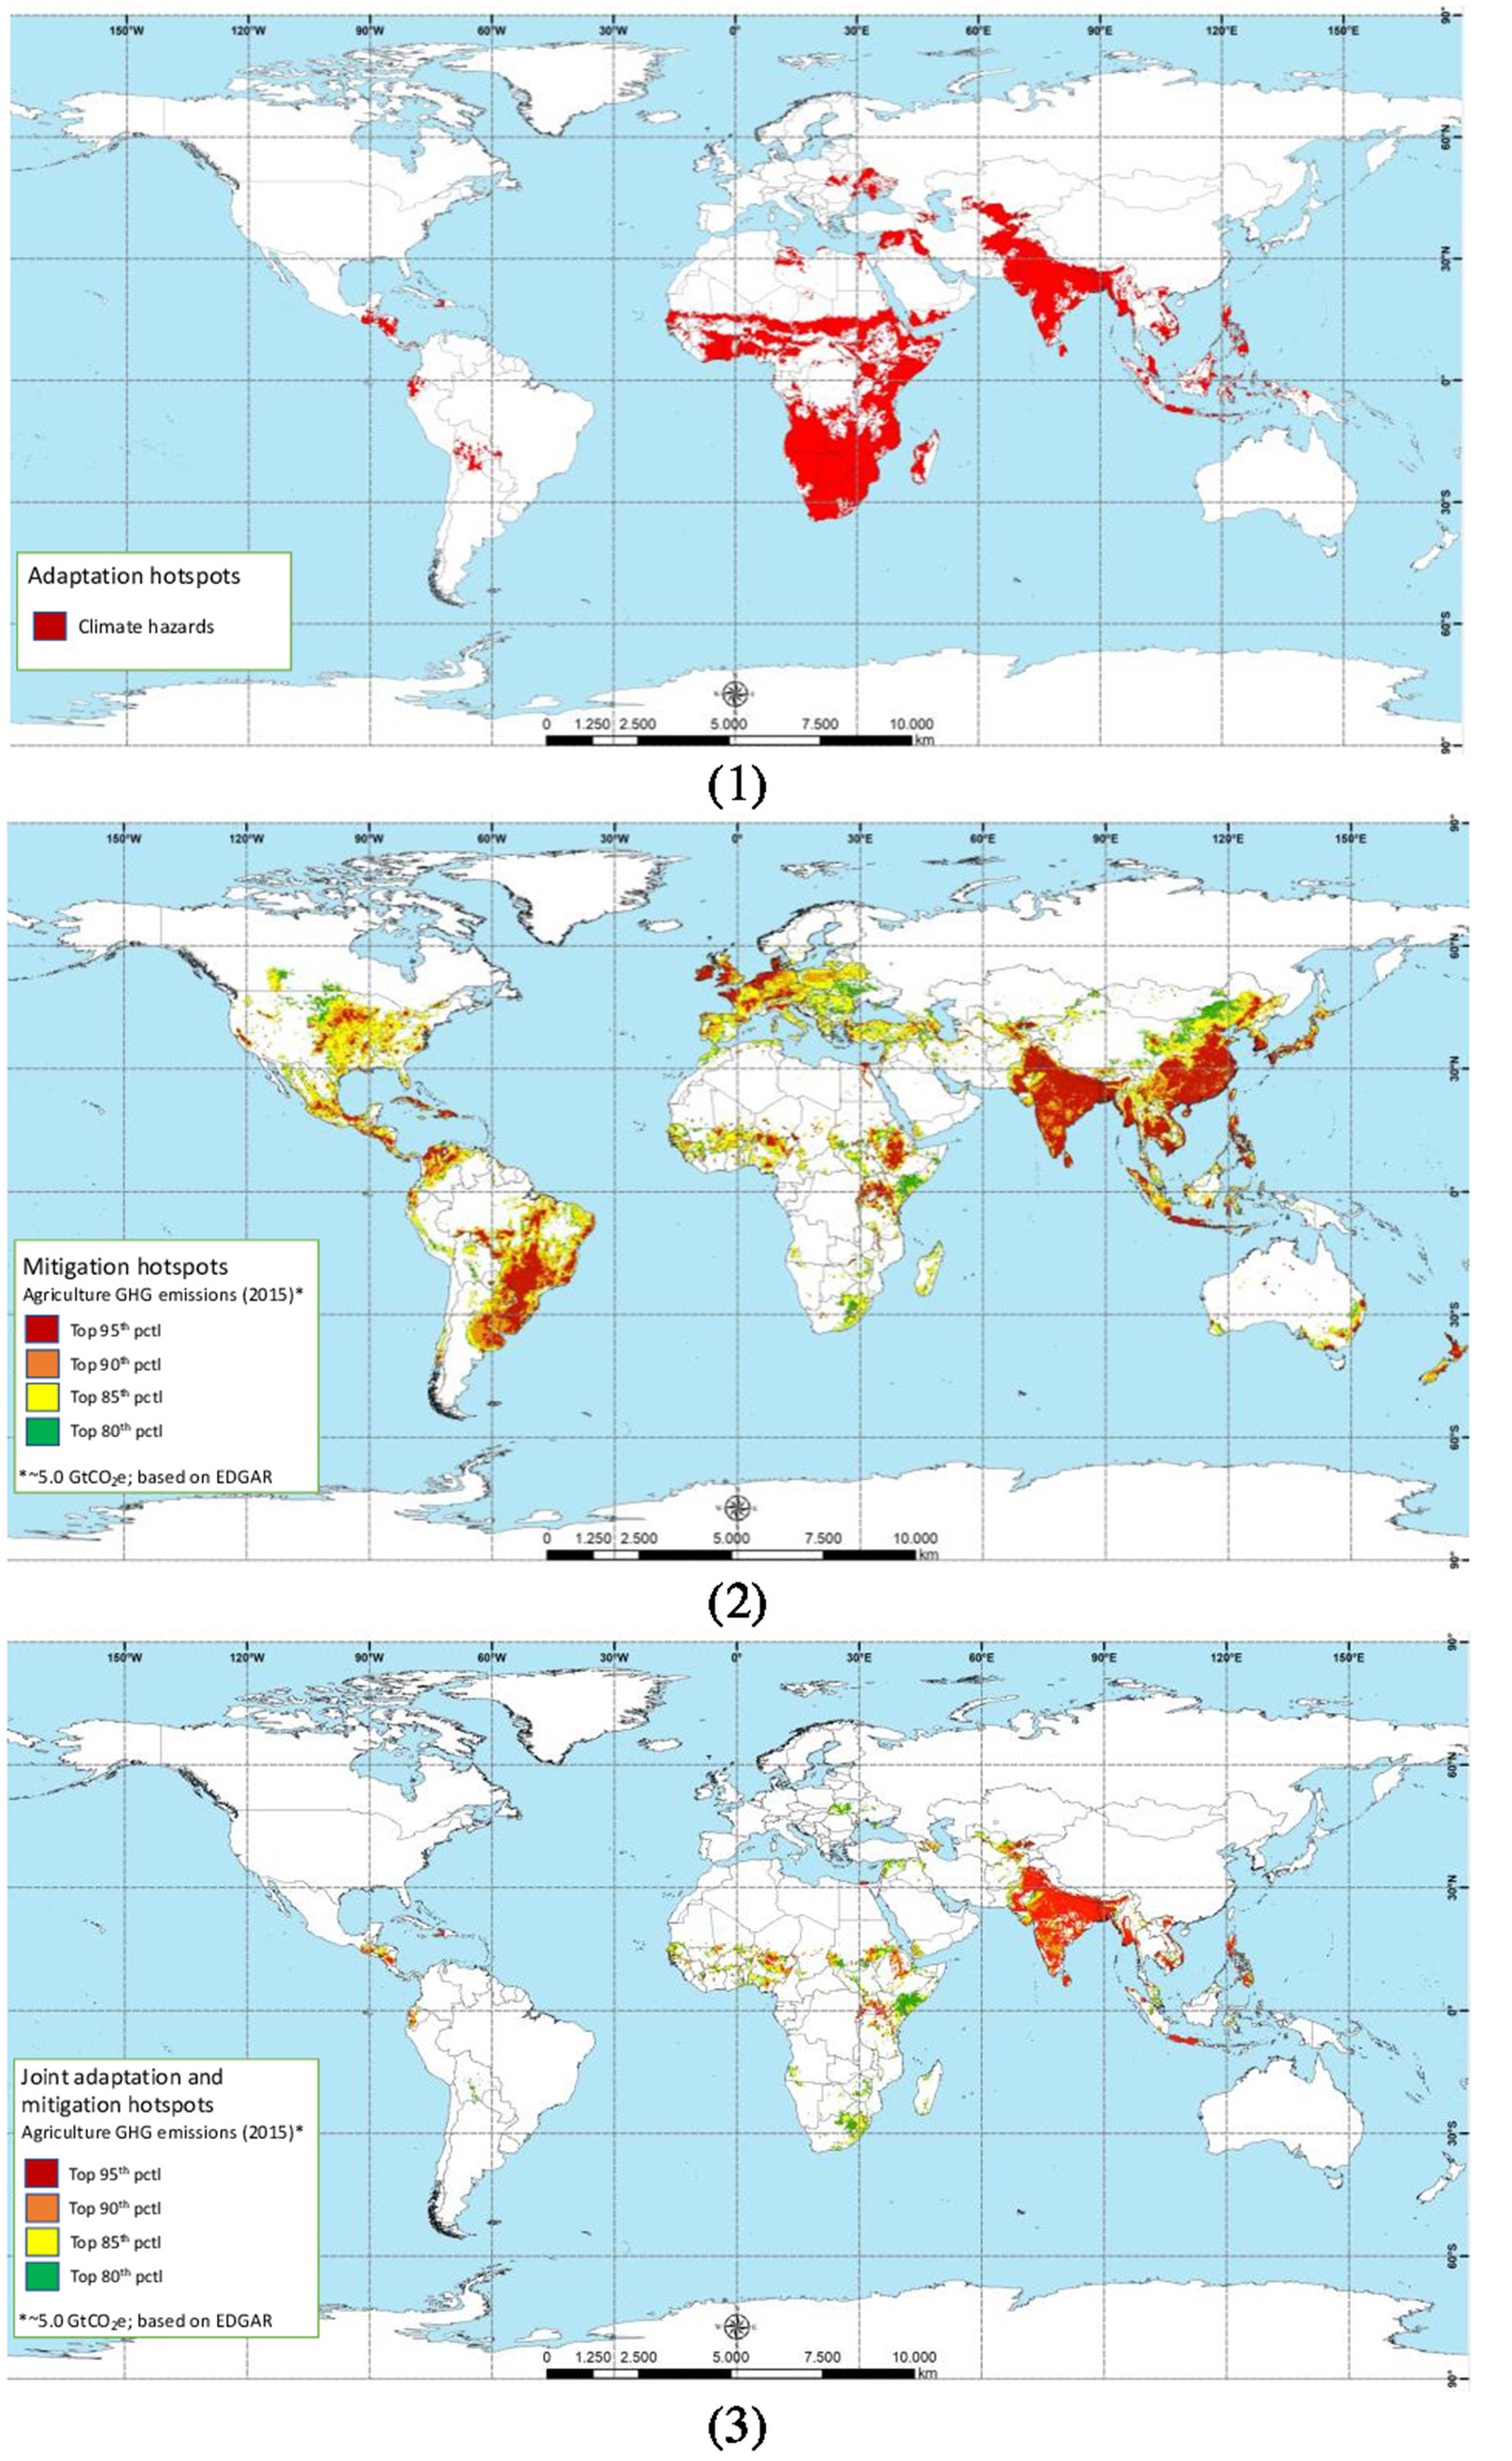
Figure 1. Hotspot areas of adaptation (1) and mitigation (top 20, 15, 10 and 5% of emission hotspots) (2), and joint adaptation and mitigation hotspot areas (3).
Mitigation hotspots, when defined as spatial units with emissions in the top 80th pctl globally (top 20% of hotspots), account for 89% of agricultural GHG emissions and 48% of the global agriculture area (Table 1; Figure 1). They occur mostly in croplands (61%), and secondarily pasture (22%) and undefined areas (17%). The hotspots comprise almost 80% of the VoP of livestock production globally and are in countries with medium (0.42–0.43) readiness. Hotspots are located across continents, with significant regional areas of concentration in China-Southeast Asia, South Asia, Brazil-Argentina, European Union, and North America-Central America-Colombia. More fragmented zones of hotspots exist in East and West Africa.
Adaptation hotspots collectively account for 952 Mha or 16% of the global agricultural area. Hotspots are in croplands (47%), followed by pasture (38%) and undefined areas (15%). Adaptation hotspots encompass only about 9% of the global livestock VoP and are in countries with lower level of readiness (0.36) compared to emission hotspots (Table 1). Adaptation hotspots are geographically concentrated in Southern Africa and sub-Saharan Africa generally (except the Congo Basin) and South Asia. Smaller regional hotspots occur in Southeast Asia; Central Asia; Middle East; Ecuador, Bolivia, Haiti and the Dry Corridor of Central America; and Eastern Europe (primarily Ukraine) (Figure 1).
Joint A&M hotspots, defined most broadly using the top 20% mitigation hotspots, capture 52% of the area under adaptation hotspots, but only 18% of the area under mitigation hotspots (Table 1; Figure 1). Focusing on the top 5% mitigation hotspots captures proportionally more emissions than area of climate hazards (Table 1; Figure 1). Most of the joint area is cropland (213 to 364 Mha), follow by pasture (3–74 Mha) and in countries with an average readiness of 0.35 compared to the global average of 0.43.
The largest A&M hotspots, using the range of top 5 to 20% mitigation hotspots, occurred, across six countries in South Asia (71% in India) (160–236 Mha). A&M hotspots also occurred over 10 countries in Africa (15–113 Mha) in Latin America (5–18 Mha) and South East Asia (36–53 Mha) over four countries in each location. Constraining the mitigation hotspots (from the top 20 to the top 5%) reduces A&M hotspots most sensitively in Africa, as this region has lower emissions (Table 1; Figure 1).
4 Discussion
Our results demonstrate an approach to determining global adaptation and mitigation priorities based on the geographic distribution of top percentile values. We found that joint A&M hotspots constituted less than 20% of the agricultural area affected by the climate hazards identified and contributed less than 20% of global agriculture emission (Table 1; Figure 1). From our analysis, we draw three conclusions. First, treating climate change adaptation and mitigation jointly to set global priorities only gets us so far. The majority of emissions and agricultural areas vulnerable to high climate hazards are not captured in joint hotspots (Figure 1). Focusing on the hotspots specific to adaptation and mitigation, respectively, will have the largest impact globally.
This points to the need for more careful consideration of where calls for integrated approaches to adaptation and mitigation in agriculture or climate-smart agriculture, which seeks to jointly achieve productivity, adaptation and mitigation (Lipper et al., 2014), or make sense. For example, focusing on joint hotspots would exclude large areas of sub-Saharan Africa (SSA) from climate investment, despite the region being a major cluster of adaptation hotspots. While governments, corporations and donors increasingly needing to show action for both adaptation and mitigation, their emphasis is often on productivity and adaptation, and mitigation becomes a co-benefit, with insignificant impacts for global targets. For example, at the field level, an agricultural development project in Mali may improve farmer’s resilience with irrigation infrastructure, and then claim mitigation impacts due to higher crop yields leading to better nitrogen use efficiency and lower nitrous oxide emissions per ton of crop, even though fertilizer use is very low. A separate investment to optimize use of nitrogen fertilizer in places of overuse, such as some parts of India, would have a much higher mitigation impact (Hijbeek et al., 2019). Ticking the adaptation or mitigation box may be sufficient to meet an organization’s reporting requirement, but tick box climate action is not an effective strategy for making rapid progress toward 2030 climate policy targets. Emphasizing the need for a nuanced approach, it’s important to recognize that certain geographic regions may prioritize adaptation over mitigation, while others may prioritize mitigation over adaptation. Climate responses should be tailored to each region’s specific needs and vulnerabilities.
Second, for the hotspots where joint A&M action is indicated, there still may be benefits from a coordinated approach, rather than siloed adaptation and mitigation action as IPCC reports have tended to do (Porter et al., 2019). Focusing on the top 5% mitigation hotspots yields the most impact in the smallest area. Further refinement of adaptation indicators to enable consideration of a range of 95 to 80% percentile of hazards would similarly help focus investments in the most geographically efficient areas for adaptation. Coordinated adaptation and mitigation planning and support to farmers can have synergistic effects and reduce the costs of scaling up actions (Barrett et al., 2020; Rosenzweig et al., 2020). At national scales, India stands out as a country for joint A&M action due to the large area of joint A&M hotspots. But even here, to achieve maximal impact, action likely would need to target differing systems, as livestock produce the highest emissions, while cropping systems remain highly vulnerable to climate hazards.
Third, significant areas of adaptation or mitigation hotspots concentration occur across national boundaries and most countries with joint A&M hotspots also have areas that are just adaptation hotspots or mitigation hotspots, so priority setting at different scales matters. Global priority setting is necessary to efficiently achieve the Paris Agreement net zero emissions targets. Even the best priority setting within a country may not be significant globally if that country is not a major emitter (Wiese et al. 2021). Subnational hotspots can be used to refine countries’ National Determined Contributions, which often refer to climate-smart agriculture as a technical measure (Richards et al., 2016; Ross et al., 2016). As spatial datasets improve to have higher-resolution and use more accessible remote sensing, crowd-sourcing, big data approaches, multi-scale analysis will be more feasible. Socioeconomic and policy data also should be included in prioritization exercises and investment returns analyzed. For adaptation, the ongoing lack of widely accepted, simple-to-measure indicators for tracking progress at different scales remains a significant challenge.
Regarding some data sets used in this work, it’s important to note that there are no more recent published datasets available on the VOP that provide livestock information at the same level of detail, leaving only FAOSTAT (2023) national data as an alternative source. Furthermore, acknowledging changes in land use, recent studies, such as Potapov et al. (2022) for cropland, which indicates a 9% increase between 2003 and 2019, and Winkler et al. (2021) for pastureland, showing a downward trend in pasture and rangeland areas, provide valuable insights into these evolving dynamics. However, it’s worth noting that, to the best of our knowledge, there are no more recent datasets that offer harmonized cropland and rangeland extent data for the same year. This suggests that our results may underestimate the extent of adaptation hotspots, considering the growth in both cropland and rangeland since 2000. We anticipate refining our analysis in the future as more suitable datasets become accessible.
5 Conclusion
Our analysis shows the spatial distribution of A&M hotspots and highlights the importance of global priority setting. We found that joint A&M hotspots covered less than 23% of global agriculture emissions and 52% of the regions with significant climate hazards. Although addressing joint A&M actions could have synergistic effects and reduce the costs of scaling up practices, our results show that A&M jointness occurs less frequently than previously thought.
For geographic efficiency, global strategies should consider adaptation and mitigation action in their respective hotspots. Coordinated approaches are still warranted where joint hotspots occur and setting priorities at global, regional, national and subnational levels hotspots can also enhance the efficiency of investments. A better understanding of global A&M hotspots contributes to the growing evidence for science-based targets and efficient allocation of resources to achieve climate goals.
Data availability statement
The datasets generated during and/or analyzed during the current study are available from the corresponding author on reasonable request.
Author contributions
All authors listed have made a substantial, direct, and intellectual contribution to the work and approved it for publication.
Funding
Funding was provided by United States Agency for International Development (USAID). The views expressed in this document cannot be taken to reflect the official opinions of this organization.
Acknowledgments
The team is grateful to all partners and colleagues that contributed to this study, especially Vinicius Mesquita (LAPIG) and Nina Safavi (UVM), for their thoughtful feedback on the analysis. We would also like to thank the support of the One CGIAR Initiative on Livestock and Climate and the One CGIAR Hub for Sustainable Finance.
Conflict of interest
The authors declare that the research was conducted in the absence of any commercial or financial relationships that could be construed as a potential conflict of interest.
The reviewer JH declared a shared research partnership group [CGIAR] with the authors to the handling editor at the time of review.
Publisher’s note
All claims expressed in this article are solely those of the authors and do not necessarily represent those of their affiliated organizations, or those of the publisher, the editors and the reviewers. Any product that may be evaluated in this article, or claim that may be made by its manufacturer, is not guaranteed or endorsed by the publisher.
References
Awuni, S., Adarkwah, F., Ofori, B. D., Purwestri, R. C., Huertas Bernal, D. C., and Hajek, M. (2023). Managing the challenges of climate change mitigation and adaptation strategies in Ghana. Heliyon 9:e15491. doi: 10.1016/j.heliyon.2023.e15491
Barrett, C. B., Benton, T. G., Cooper, K. A., Fanzo, J., Gandhi, R., Herrero, M., et al. (2020). Bundling innovations to transform Agri-food systems. Nat Sustainability 3, 974–976. doi: 10.1038/s41893-020-00661-8
Climate Change (2014). Synthesis Report. Contribution of Working Groups I, II and III to the Fifth Assessment Report of the Intergovernmental Panel on Climate Change [Core Writing Team, R.K. Pachauri and L. A. Meyer (eds.)]. IPCC, Geneva, Switzerland, 151.
Costa, C., Wollenberg, E., Benitez, M., Newman, R., Gardner, N., and Bellone, F. (2022). Roadmap for achieving net-zero emissions in global food systems by 2050. Sci. Rep. 12:15064. doi: 10.1038/s41598-022-18601-1
Crippa, M., Solazzo, E., Guizzardi, D., Monforti-Ferrario, F., Tubiello, F. N., and Leip, A. (2021). Food systems are responsible for a third of global anthropogenic GHG emissions. Nat Food 2, 198–209. doi: 10.1038/s43016-021-00225-9
Di Gregorio, M., Nurrochmat, D. R., Paavola, J., Maya Sari, I., Fatorelli, L., Pramova, E., et al. (2017). Climate policy integration in the land use sector: Mitigation, adaptation and sustainable development linkages. Environmental Science & Policy 67, 35–43. doi: 10.1016/j.envsci.2016.11.004
EDGAR, (2021). Emissions database for global atmospheric research (EDGAR) - Joint Research Centre (JRC). Available at: https://edgar.jrc.ec.europa.eu/dataset_ghg50
Ericksen, P. J., Thornton, P. K., Notenbaert, A. M. O., Cramer, L., Jones, P. G., and Herrero, M. T. (2011). Mapping hotspots of climate change and food insecurity in the global tropics. CCAFS report no. 5. CGIAR research program on climate change, agriculture and food security (CCAFS). Copenhagen, Denmark. Available at: www.ccafs.cgiar.org.
FAOSTAT (2023). Food and agriculture Organization of the United Nations (FAO) Faostat Database Available at: https://www.fao.org/faostat/en/.
Gebre, G. G., Amekawa, Y., Fikadu, A. A., and Rahut, D. B. (2023). Farmers’ use of climate change adaptation strategies and their impacts on food security in Kenya. Clim. Risk Manag. 40:100495. doi: 10.1016/j.crm.2023.100495
Herrero, M., Havlík, P., Valin, H., Notenbaert, A., Rufino, M. C., Thornton, P. K., et al. (2013). Biomass use, production, feed efficiencies, and greenhouse gas emissions from global livestock systems. Proc. Natl. Acad. Sci. U. S. A. 110, 20888–20893. doi: 10.1073/pnas.1308149110
Hijbeek, R., van Loon, M.P., and van Ittersum, M.K. (2019). Fertiliser use and soil carbon sequestration: opportunities and trade-offs CCAFS working paper. Wageningen, the Netherlands: CGIAR.
Islam, M. S., and Kieu, E. (2020). Tackling regional climate change impacts and food security issues: a critical analysis across ASEAN, PIF, and SAARC. Sustainability 12:883. doi: 10.3390/su12030883
Jarvis, A., Rosenstock, T. S., Koo, J., Thornton, P. K., Loboguerrero Rodriguez, A. M., Govaerts, B., et al. (2021). Climate-informed priorities for one CGIAR regional integrated initiatives. CGIAR Research Program on Climate Change, Agriculture and Food Security (CCAFS)
Klein, R. J., Huq, S., Denton, F., Downing, T. E., Richels, R. G., et al. (2007): Inter-relationships between adaptation and mitigation. Climate change 2007: impacts, adaptation and vulnerability. Contribution of working group II to the fourth assessment report of the intergovernmental panel on climate change, M.L. Parry, O.F. Canziani, J.P. Palutikof, P.J. Lindenvan der, and C.E. Hanson, Eds., Cambridge University Press, Cambridge, UK, 745–777.
Kongsager, R. (2018). Linking climate change adaptation and mitigation: a review with evidence from the land-use sectors. Land 7:158. doi: 10.3390/land7040158
Lipper, L., Thornton, P., Campbell, B., and Baedeker, T. (2014). Climate-smart agriculture for food security. Nat. Clim. Chang. 4, 1068–1072. doi: 10.1038/Nclimate243
Malhi, G. S., Kaur, M., and Kaushik, P. (2021). Impact of climate change on agriculture and its mitigation strategies: a review. Sustainability 13:1318. doi: 10.3390/su13031318
ND-GAIN - The Notre dame global adaptation initiative – country index. (2020). Available at: https://gain.nd.edu
Porter, J. R., Challinor, A. J., Henriksen, C. B., Howden, S. M., Martre, P., and Smith, P. (2019). Invited review: intergovernmental panel on climate change, agriculture, and food—a case of shifting cultivation and history. Glob. Chang. Biol. 25, 2518–2529. doi: 10.1111/gcb.14700
Potapov, P., Turubanova, S., Hansen, M. C., Tyukavina, A., Zalles, V., Khan, A., et al. (2022). Global maps of cropland extent and change show accelerated cropland expansion in the twenty-first century. Nat Food 3, 19–28. doi: 10.1038/s43016-021-00429-z
Ramankutty, N., Evan, A. T., Monfreda, C., and Foley, J. A. (2008). Farming the planet: 1. Geographic distribution of global agricultural lands in the year 2000. Glob. Biogeochem. Cycles 22:952. doi: 10.1029/2007GB002952
Richards, M. B., Bruun, T. B., Campbell, B. M., Gregersen, L. E., Huyer, S., Kuntze, V., et al. (2016). How countries plan to address agricultural adaptation and mitigation: an analysis of intended nationally determined contributions. CCAFS dataset version 1.2. CGIAR research program on climate change, agriculture and food security (CCAFS).
Roe, S., Streck, C., Beach, R., Busch, J., Chapman, M., Daioglou, V., et al. (2021). Land-based measures to mitigate climate change: Potential and feasibility by country. Glob. Change Biol 27, 6025–6058. doi: 10.1111/gcb.15873
Rose, S., Khatri-Chhetri, A., Stier, M., Vu, T., Nelson, K., and Dittmer, K. (2021). “Agricultural sub-sectors in new and updated NDCs: 2020-2021 dataset” in CCAFS dataset version 2.1., updated October 2022 (Wageningen, Netherlands: CGIAR) Research Program on Climate Change, Agriculture and Food Security (CCAFS)
Rosenzweig, C., Mbow, C., Barioni, L. G., Benton, T. G., Herrero, M., Krishnapillai, M., et al. (2020). Climate change responses benefit from a global food system approach. Nature Food 1, 94–97. doi: 10.1038/s43016-020-0031-z
Ross, N., Agostini, A., and Frick, M. (2016). Agricultural sectors in nationally determined contributions (NDCs): priority areas for international support. FAO. Available at: http://www.fao.org/3/a-i6400e.pdf
Smith, P., Martino, D., Cai, Z., Gwary, D., Janzen, H., Kumar, P., et al. (2008). Greenhouse gas mitigation in agriculture. Philos. Trans. R. Soc. Lond. Ser. B Biol. Sci. 363, 789–813. doi: 10.1098/rstb.2007.2184
Steiner, A., Aguilar, G., Bomba, K., Bonilla, J.P., Campbell, A., Echeverría, R.G., et al. (2020). Actions to transform food systems under climate change. Wageningen, The Netherlands: CGIAR Research Program on Climate Change, Agriculture and Food Security (CCAFS).
Wiese, L., Wollenberg, E., Alcántara-Shivapatham, V., et al. (2021). Countries’ commitments to soil organic carbon in Nationally Determined Contributions. Climate Policy. 21, 1005–1019. doi: 10.1080/14693062.2021.1969883
Winkler, K., Fuchs, R., Rounsevell, M., and Herold, M. (2021). Global land use changes are four times greater than previously estimated. Nat. Commun. 12:2501. doi: 10.1038/s41467-021-22702-2
World Bank Group. (2021). World Bank Group climate change action plan 2021–2025: Supporting green, resilient, and inclusive development. World Bank, Washington, DC.
Keywords: climate change, policy, resilience, global strategies, food security, poverty alleviation, Paris Agreement
Citation: Costa Jr C, Thornton P and Wollenberg E (2023) Global hotspots of climate change adaptation and mitigation in agriculture. Front. Sustain. Food Syst. 7:1216205. doi: 10.3389/fsufs.2023.1216205
Edited by:
Ngonidzashe Chirinda, Mohammed VI Polytechnic University, MoroccoReviewed by:
Nester Mashingaidze, One Acre Fund, RwandaFrancisco Javier Solorio, Universidad Autónoma de Yucatán, Mexico
James Hammond, International Livestock Research Institute (ILRI), Kenya
Copyright © 2023 Costa, Thornton and Wollenberg. This is an open-access article distributed under the terms of the Creative Commons Attribution License (CC BY). The use, distribution or reproduction in other forums is permitted, provided the original author(s) and the copyright owner(s) are credited and that the original publication in this journal is cited, in accordance with accepted academic practice. No use, distribution or reproduction is permitted which does not comply with these terms.
*Correspondence: Ciniro Costa Jr., Yy5jb3N0YWpyQGNnaWFyLm9yZw==