- 1Agricultural Research Council-Vegetable, Industrial and Medicinal Plants, Pretoria, South Africa
- 2Centre for Transformative Agricultural and Food Systems, School of Agricultural, Earth and Environmental Sciences, University of KwaZulu-Natal, Scottsville, Pietermaritzburg, South Africa
- 3School of Life Sciences, University of KwaZulu-Natal, Scottsville, Pietermaritzburg, South Africa
- 4International Water Management Institute (IWMI), Pretoria, South Africa
Introduction: Estimates indicate that food and nutritional demand in sub-Saharan African nutrient-poor soils will exceed the high population demand. Vegetables such as amaranth and cowpea are key in contributing to food and nutritional security. Fertilizers are used to mitigate low nutrient levels in soils. This study aimed to investigate the yield parameters of cowpea and amaranth vegetables.
Methods: The experiment was designed with a 2 × 4 factorial treatment structure in a completely randomized design, with intercropping and fertilizer level as treatment factors and with four replications.
Results and discussion: The biomass of amaranth and cowpea increased with increased fertilizer application up to the level of 100% nitrogen, phosphorus, and potassium (NPK) fertilizer. A measure of land utilization showed values greater than one. Crop comparison showed that cowpea was more aggressive, had higher actual yield loss, and was highly competitive compared to amaranth. More income could be obtained from intercropping. The research shows the benefits of fertilizer application in improving the biomass of amaranth and cowpea. Overall, the application of NPK fertilizer at levels up to 100%, based on the results of this study, resulted in higher biomass accumulation and improved intercropping indices.
1. Introduction
While it is important to recognize the imperative need for food security for the growing population (FAO, 2009; Asongu and Odhiambo, 2019), crop response to management factors is very important for realistic results. There is convincing evidence from research that soil nutrients can be manipulated to suit individual crop needs, making soil fertility a well-known factor in crop production (Lehman et al., 2015). Water availability is a more variable factor in dryland farming, the predominant form of global food production (Stewart and Peterson, 2015). Season is a reasonably predictable factor, given that all crops can be classified based on season as summer, winter, or spring crops (Sacks et al., 2010). The soil environment is the factor that remains most interesting for agronomy studies because it plays a critical role in its influence on the reduction and absorption of mineral nutrients (Elbasiouny et al., 2022). This influence is dependent on the amount of fertilizer applied, the availability of soil water, and the temperature (aerial and soil) (Harper et al., 1987). The soil environment is a complex biological, physical, and chemical factor, meaning that this field of research continues to be attractive (Fageria and Stone, 2006; Pouyat et al., 2010; König et al., 2020).
Food crops are grown to directly or indirectly provide supplies of carbohydrates, proteins/amino acids, lipids, 17 minerals, and 13 vitamins for human sustenance (Medeiros and Wildman, 2022). It is the absorption of the correct quantities and forms of minerals that influences the concentrations of the correct forms and quantities of other food elements (Soetan et al., 2010). Scientific research and management practices continue to prioritize quantity of crop biomass in terms of yield in order to satisfy the need for food security. The aspect of crop quality is generally studied as a response that is associated with the yield (Anjum et al., 2011). Taken together, fertilizer application, crop protection, soil environment, aerial environment, and additional management practices (tillage, crop rotation, organic farming, intercropping, classical breeding, and genetic modification) form a combination of crop production factors (Watson et al., 2002). Effects of fertilization can be explained based on mineral category (macro and micro) and from the perspectives of individual elements. Research has shown that nitrogen (N), phosphorus (P), potassium (K), and the majority of macro-elements generally have a direct correlation with dry matter accumulation (yield) (Goswami et al., 2022). However, this effect can be explained in the context of carbohydrate and protein concentrations, which have been shown to be inversely proportional. Carbohydrate concentration can be associated with diluted concentration of proteins. Quantity, form, and timing of fertilizer application have a significant effect on crop response with respect to yield quantity and quality (Karagöz, 2021). Crop management systems such as water supply, tillage type (minimum, no-till, and conventional), cropping type (sole, intercropping, and rotation), and fertilizer supply (organic vs. fertilization) all have various effects on crop yield and quality, which vary depending on the crop (e.g., cereal, vegetable, roots, or tubers) and soil type, among other factors (Imadi et al., 2016).
A study that seeks to explain crop response to fertilizer in terms of variables that are associated with the global view of performance is important as we integrate underutilized crops into the food system (Chivenge et al., 2015). These crops promise to be suitable for non-conventional cultivation, which is predominant on small farms around the world. Small farms (<10 ha) dominate world agriculture, but they are less effective in terms of contribution to food security (Gashu et al., 2019). Crop production on these farms predominantly involves less fertile soils compared to large-scale agriculture, where fertilizer and other resources are supplied in high quantities (Pastori et al., 2019; Nanganoa et al., 2020; Stewart et al., 2020). It is important to recognize the role of small-scale farming and how the production of its underutilized crops can be enhanced. This knowledge needs to be linked to an understanding of the production systems used to cultivate such crops.
Among the list of vegetables available for rural resource-poor farming communities are African leafy vegetables (ALVs). African leafy vegetables are crop species that originated from specific agroecologies and over time have established themselves in new environments through choice by the corresponding communities or through evolution (Van Rensburg et al., 2007). These ALVs have been part of the human diet for centuries in sub-Saharan households (Odhav et al., 2007; Vorster et al., 2008). Among the commonly cultivated vegetables, and usually consumed all over South Africa, are Amaranthus cruentus (amaranth) and Vigna unguiculata L. Walp (cowpea) (Van Rensburg et al., 2007; Oelofse and Van Averbeke, 2012; Mavengahama, 2013). These vegetables are commonly harvested sequentially. The scale of production and yield from ALVs is insufficient to meet the food and nutritional needs of the growing population. Therefore, it is important to address food and nutritional security sustainably in consideration of limited resources such as productive agricultural land (Jayne and Muyanga, 2012). One of the mechanisms for sustainable crop production is intercropping, which is mainly practiced to optimize for efficient utilization of resources, thereby ultimately increasing yield (taking both crops into consideration). Common intercropping practices entail the inclusion of a legume in combination with a non-legume crop (Ahamefule and Chinedu, 2014), for example, cowpea and amaranth.
Inter- and intra-specific competition, as well as facilitation (also referred to as agro-biological parameters), are key components of intercropping (Vandermeer, 1992; Zhang and Li, 2003). Inter- and intra-specific competition relates to the development of two crops in which there is a variation between them, while facilitation describes the improvement in yield of companion crops in an intercropping scenario (Fan et al., 2006; Mei et al., 2012). Several ratios are used to determine the agro-biological parameters. These include the land equivalent ratio (LER) (De Wit and Van den Bergh, 1965), land use efficiency (LUE), relative yield (RY), actual yield loss (AYL) (Banik, 1996), the relative crowding coefficient (RCC) (De Wit, 1960), aggressivity (A) (McGilchrist, 1965), and the competition ratio (CR) (Willey and Rao, 1980). Others include over-yielding (OY), the area time equivalent ratio (ATER) (Tan et al., 2020), intercropping advantage (IA) (Banik et al., 2000), and the monetary advantage index (MAI) (Tan et al., 2020). In an intercropping system, the yield of one crop exceeds the other, therefore reducing it (Li et al., 2011). In an intercrop, there is commonly an improvement in the yield of companion crops in a concept known as facilitation. Facilitation promotes interactions among crops necessary for complementarity.
In facilitation, if one crop is unable to harness available nutrients, the other species take over (Brooker et al., 2008). This outcome is manifested in the determination of factors such as the intercropping advantage and the monetary advantage index. Therefore, the primary objective of this study was to investigate the effect of different rates of fertilizer application on yield, as well as agro-biological parameters, in an amaranth–cowpea intercrop. The hypotheses were that (i) fertilizer application would increase the yield of amaranth and cowpea in an intercropping scenario (considering both crops); and (ii) there would be variable inter- and intra-specific competition, as well as facilitation, between amaranth and cowpea. The outcomes (i) amaranth and cowpea yield and (ii) agro-biological parameters in an amaranth–cowpea intercrop were determined through testing.
2. Materials and methods
2.1. Study site and plant material
The experiment was conducted at the Agricultural Research Council (ARC), Vegetables and Ornamental Plants campus, situated in Roodeplaat, Pretoria, South Africa (25°35′ S, 28°21′ E, 1165 masl) during the 2014/15 and 2015/16 summer seasons, each of which ran from November to March. The field experiment was carried out on soils as described by Mndzebele et al. (2020) in Table 1. The area has a long-term summer rainfall of ~635 mm annually. The highest precipitation is normally experienced during December and January, although precipitation is highly variable. Variations in the weather conditions occurred during these two growing seasons (2014/15 and 2015/16). On average, in the first season, maximum temperatures ranged between 23.5 and 40.3°C. In the second season, maximum temperatures ranged from 20.6 to 34.8°C. Daily minimum temperatures ranged from 10.3°C for the first season to 21.2°C for the second season (Figure 1). Seasonal rainfall was 369 mm in the first season and 390 mm in second season.
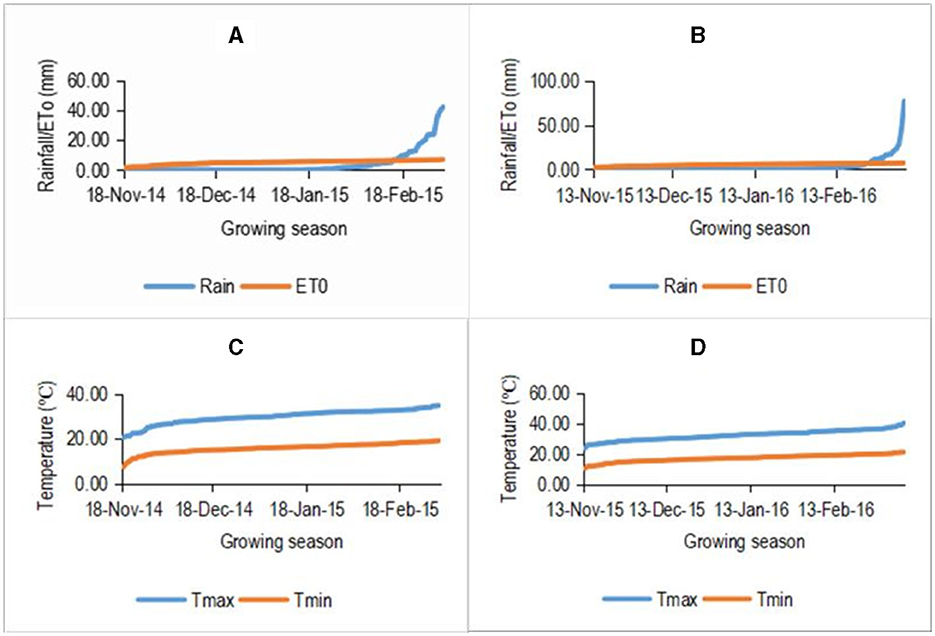
Figure 1. Rainfall and reference evapotranspiration for the 2014/15 season 1 (A) and 2015/16 season 1 (B) as well as temperature for the 2014/15 season 1 (C) and 2015/16 season 1 (D) in Roodeplaat. Preroria, South Africa. The reported values are daily climatic data during season 1 (S1) and season 2 (S2) from day of direct seeding of cowpea and transplanting of amaranth until the end of harvest. Tmax, maximum temperature (°C); Tmin, minimum temperature (°C); Rain, rainfall (mm); ET0, reference evapotransoiration (mm).
The experimental treatments, layout, and management of the experiment were as described by Mndzebele et al. (2020). These specified the amount of fertilizer applied, seedling preparation, transplanting, planting, inter-row spacing, intra-row spacing, and irrigation amounts applied (Mndzebele et al., 2020). The ratios of NPK were informed by the recommended fertilizer rates for cowpea based on soil analysis results; these were 135 kg N ha−1, 31 kg P ha−1, and 18 K ha–1 for the 2014/15 season, and 135 kg N ha−1, 20 kg P ha−1, and 250 kg K ha−1 in the case of the 2015/16 recommendations. The ratios of NPK used were 7:2:1 for the 2014/15 season and 7:1:13 for the 2015/2016 season.
Soil analysis was carried out and the fertilizers were applied according to the soil requirements, as shown in Table 1.
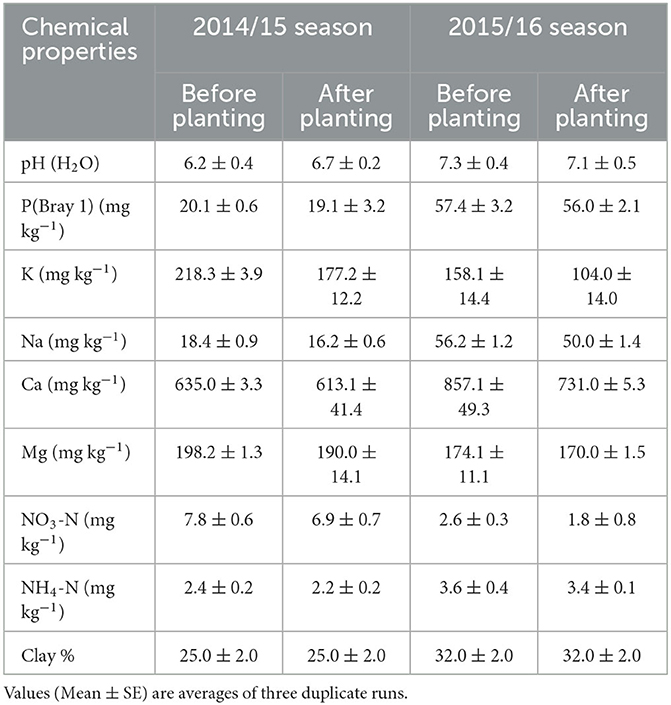
Table 1. Chemical properties of the topsoil layer (0.3 m) for the experimental sites before and after harvesting.
The actual amounts that were applied for the 2014/15 (season 1) and 2015/16 (season 2) seasons are indicated in Table 2. The rationale behind the presentation of the amounts applied in % instead of numerical amounts is the variations in the amounts, which would take up more space in all the tables and/or make data presentation difficult. The vegetables planted were cowpea and amaranth.

Table 2. Above ground edible biomass (AGEB), in amaranth and cowpea in the first harvest under sole and intercropping systems at four fertilizer (NPK) levels in 2014/15 (season 1) and 2015/16 (season 2) seasons.
Cowpea (cultivar Vigna ONB) is morphologically herbaceous, is planted in summer, and has a semi-prostrate growth habit. The color of Vigna ONB is dark purple, with small seeds which are ovoid. The cowpea rooting system is thick and well-built (Gerrano and Thungo, 2022).
Amaranthus cruentus L. is an annual herbaceous plant propagating only through seeds (Makinde et al., 2010). It has predominantly a tap root with stems that are either straight or branched, growing to a height of up to 2 m. Amaranth leaves are spiral, devoid of stipules, and coupled with ovate to rhombic-ovate shape. The leaves and stems have hairy surfaces with unisexual flowers which are green. It has large and complex inflorescence with concentrated cymes with racemes and spikes (Grubben and Denton, 2004) and with variable colors. On average, each Amaranthus cruentus plant has ~50,000 shiny and dark brown seeds, which are round or lenticular in shape (Gerrano et al., 2015).
2.2.1. Above-ground edible biomass
Vegetable crops were sequentially harvested at 8, 10, 12, 14, and 16 weeks after planting for cowpea and at 4, 6, 8, 10, and 12 weeks after transplanting for amaranth during the first and second growing seasons. In the case of cowpea, only leaves were defoliated to determine above-ground edible biomass (AGEB). Amaranth was cut above ground in order for its biomass to include leaves and stems. The stems were separated from the leaves to determine above-ground edible biomass (AGEB). In amaranth, twelve plants were sampled per plot on sole cropping, amounting to an area of 1.08 m2. In cowpea, nine plants were harvested per plot, amounting to a harvested area of 1.62 m2 on both sole and intercropping. Finally, in amaranth intercropping, nine plants were sampled per plot. The above-ground material was weighed to determine fresh above-ground biomass and thereafter oven-dried at 50°C for 48 h to determine dry above-ground biomass and above-ground edible biomass.
2.2.2. Estimation of agro-biological parameters
2.2.2.1. Land equivalent ratio
The land equivalent ratio (LER) was calculated as described in Mndzebele et al. (2020). An LER value of 1.0 indicates no difference in yield between the intercropping and the sole cropping systems. In constrast, any value >1.0 indicates a yield advantage, while values <1 demonstrate a yield disadvantage for the intercropping system (Kurata, 1986).
2.2.2.2. Land utilization efficiency, %
The land equivalent ratio was applied in this study to evaluate the utilization efficiency of the land occupied by the crops, using a measure known as land utilization efficiency (LUE). This is defined as the total land area of sole crops required to achieve the same yields as intercrops (Willey, 1979). In an intercropping system, the partial land utilization efficiency ratio (PLUE) of each component comprises the total land utilization efficiency ratio (TLUE), which was calculated as:
2.2.2.3. Actual yield loss
The actual yield loss (AYL) was calculated as the proportionate yield loss or gain of intercrops in comparison to the respective sole crop; specifically, this was calculated using the following formula, as described by Banik (1996).
2.2.2.4. Relative crowding coefficient
The total relative crowding coefficient (RCCtotal) was used to estimate the relative dominance of one species over the other in intercropping, via the following formula (De Wit, 1960).
2.2.2.5. Aggressivity
Aggressivity (A) was used as an indicator of whether the relative yield increase in A amaranth crop was greater than that of Acowpea in an intercropping system, and vice versa (McGilchrist, 1965). This measure was expressed as follows:
If the value of A is zero, both crops are equally competitive.
A positive or larger value for aggressivity means that the crop is dominant in comparison to the companion crop, and vice versa.
2.2.2.6. Competition ratio
The competition ratio (CR) was computed as a measure of the competitive abilities of amaranth and cowpea (Willey and Rao, 1980) via the following formula:
2.2.2.7. Over-yielding
Over-yielding of intercropped crops relative to sole crops was assessed based on the increase or decrease in the yield of intercropped crops over the corresponding mono-cropped crops, following Li et al. (2011); this was calculated as:
where Yintercrop and Ysolecrop are the yields of either amaranth or cowpea in intercropping and sole cropping systems, respectively, and P is the proportion of a given crop in the intercropping system.
A positive overyielding value indicated a yield advantage and a negative value denoted a yield disadvantage.
2.2.2.8. The area time equivalent ratio
The area time equivalent ratio (ATER) provided a more realistic comparison of the yield advantage of intercrops:
where:
RYa = relative yield of component A (cowpea) in intercrop
Ta and Tb = duration (in days) of components “a” and “b”
RYb = relative yield of component “b” (amaranth) in the mixture T = total duration of the intercropping system in days.
A value of ATER > 1 implies yield advantage, while ATER <1 indicates yield disadvantage.
2.2.2.9. Intercropping advantage
The intercropping advantage (IA) was calculated using the following formula (Banik et al., 2000):
where:
IAamaranth = the intercropping advantage of amaranth
IAcowpea = the intercropping advantage of cowpea
AYLamaranth = the actual yield loss in amaranth
AYLcowpea = the actual yield loss in cowpea
Pcowpea = the average commercial value of cowpea (R5.50/kg) P amaranth = the average commercial value of amaranth (R5.50/kg).
2.2.2.10. Monetary advantage index
The monetary advantage index (MAI) was computed using the following formula:
where the value of the combined intercrops represents the yields of amaranth and cowpea in an intercrop system. Each was multiplied by the price. Thereafter, these were added to determine with the value of the combined intercrops.
2.2.3. Experimental design and statistical analysis
The experimental treatments, layout, and management of the experiment were as described by Mndzebele et al. (2020). These specifications covered the amount of fertilizer applied, seedling preparation, transplanting, planting, inter-row spacing, intra-row spacing, and irrigation amounts applied (Mndzebele et al., 2020). The different fertilizer levels and cropping systems in multiple-harvested cowpea and amaranth were entered as independent factors into appropriate analyses of variance (ANOVAs) to analyse AGEB and estimated agro-biological parameters. The Shapiro–Wilk test was performed on the standardized residuals to test for deviations from normality (Shapiro and Wilk, 1965). In cases where significant deviation from normality was observed and this was due to skewness, outliers were removed until the data were normally or symmetrically distributed (Glass et al., 1972). Least significant differences (LSDs) at 5% significance level were used to compare means of significant source effects (Snedecor, 1967). These analyses were performed using SAS (1999) (SAS version 9.3, SAS Institute Inc. Cary, NC, the United States of America) and Genstat Release 19 (Version 19, VSN International, Hemel Hempstead, UK).
3. Results
3.1. Above-ground edible biomass
There were significant interactions (p ≤ 0.05) between cropping system and fertilizer level in terms of their effects on above-ground edible biomass (AGEB) of amaranth and cowpea vegetables from the first to the fifth harvest in both the 2014/15 and the 2015/16 seasons (Tables 3–7). Mean AGEB for amaranth and cowpea showed a gradual increase from the first harvest until it reached a peak in the third harvest. This was followed by a gradual decrease in the fourth harvest, with the lowest value being obtained at the fifth harvest (Tables 3–7). Mean AGEB values in both amaranth and cowpea were consistently higher in sole cropping relative to intercropping in all harvests.
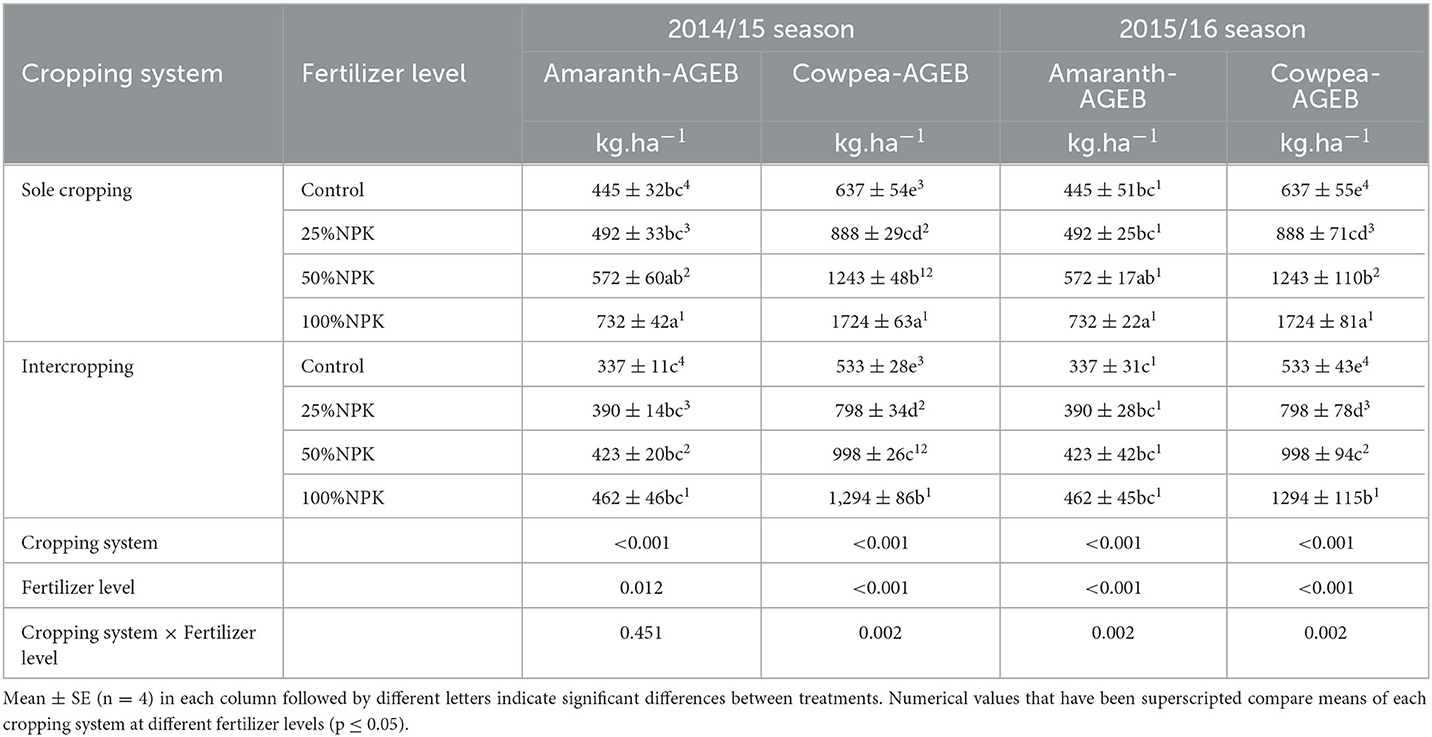
Table 3. Above ground edible biomass (AGEB), in amaranth and cowpea in the second harvest under sole and intercropping systems at four fertilizer (NPK) levels in 2014/15 (season 1) and 2015/16 (season 2) seasons.
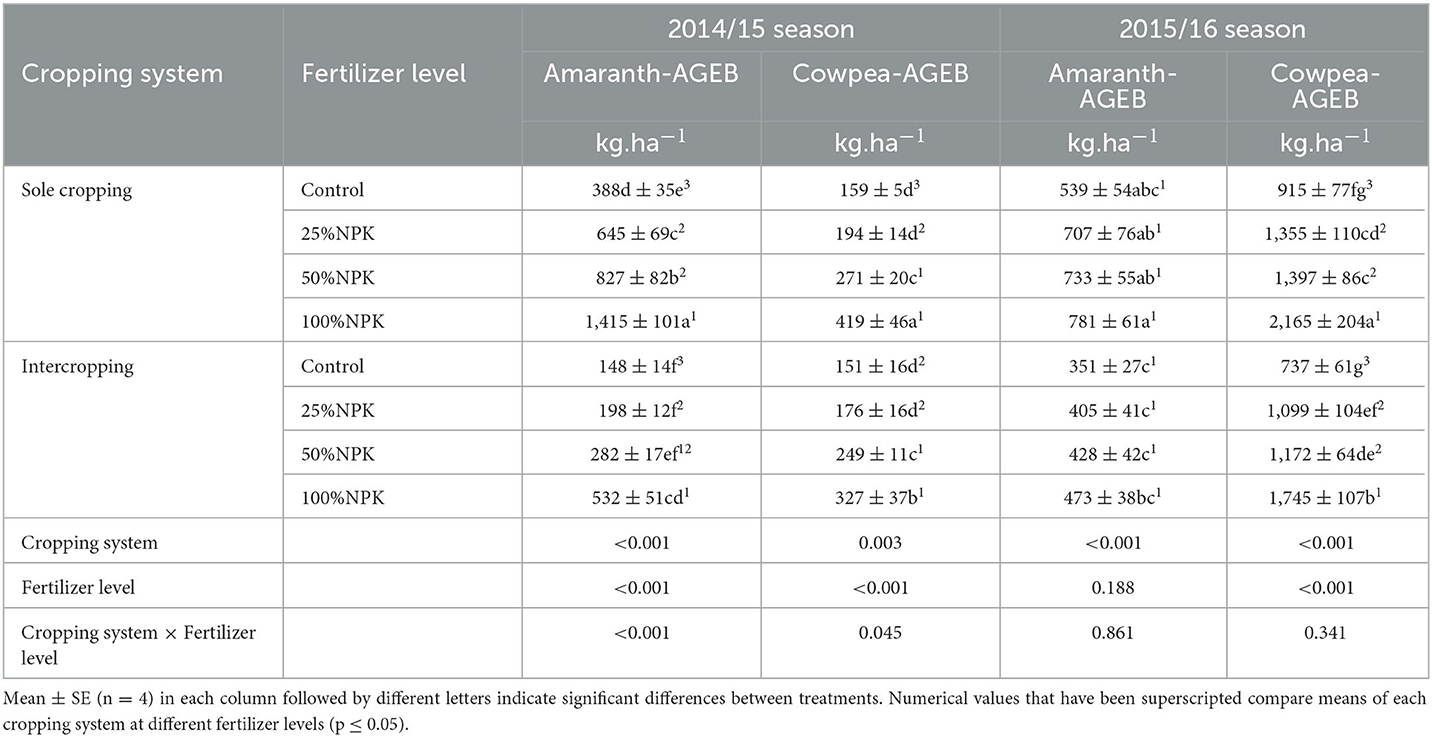
Table 4. Above ground edible biomass (AGEB), in amaranth and cowpea in the third harvest under sole and intercropping systems at four fertilizer (NPK) levels in 2014/15 (season 1) and 2015/16 (season 2) seasons.
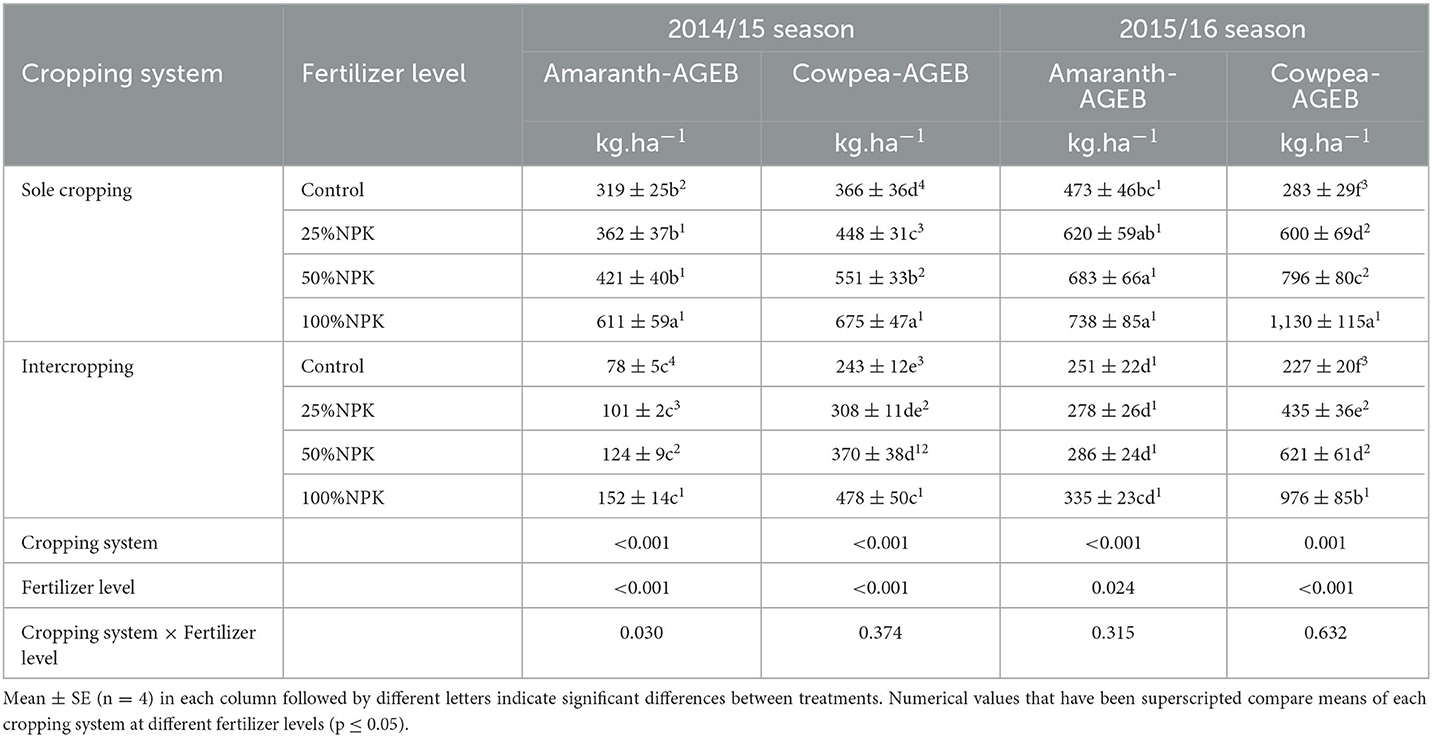
Table 5. Above ground edible biomass (AGEB), in amaranth and cowpea in the fourth harvest under sole and intercropping systems at four fertilizer (NPK) levels in 2014/15 (season 1) and 2015/16 (season 2) seasons.
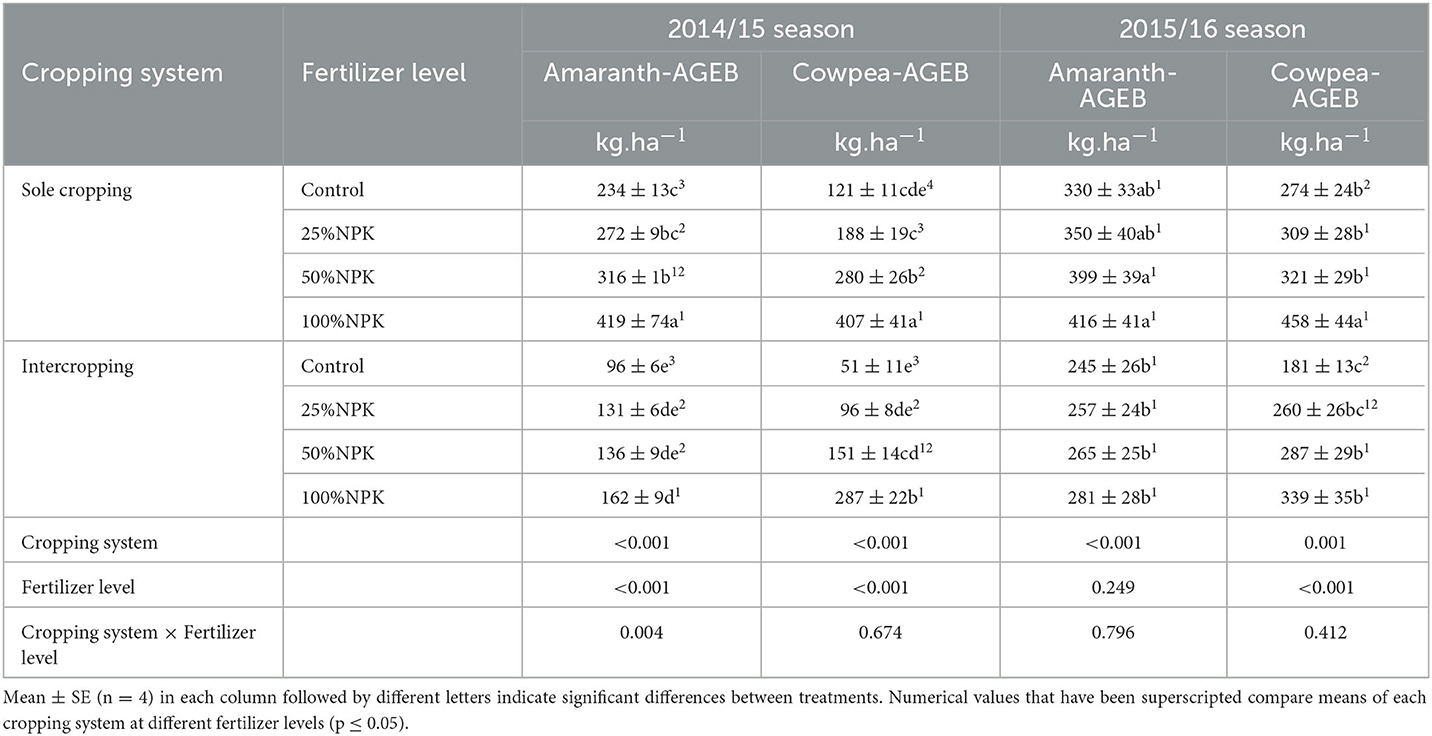
Table 6. Above ground edible biomass (AGEB), in amaranth and cowpea in the fifth harvest under sole and intercropping systems at four fertilizer (NPK) levels in 2014/15 (season 1) and 2015/16 (season 2) seasons.
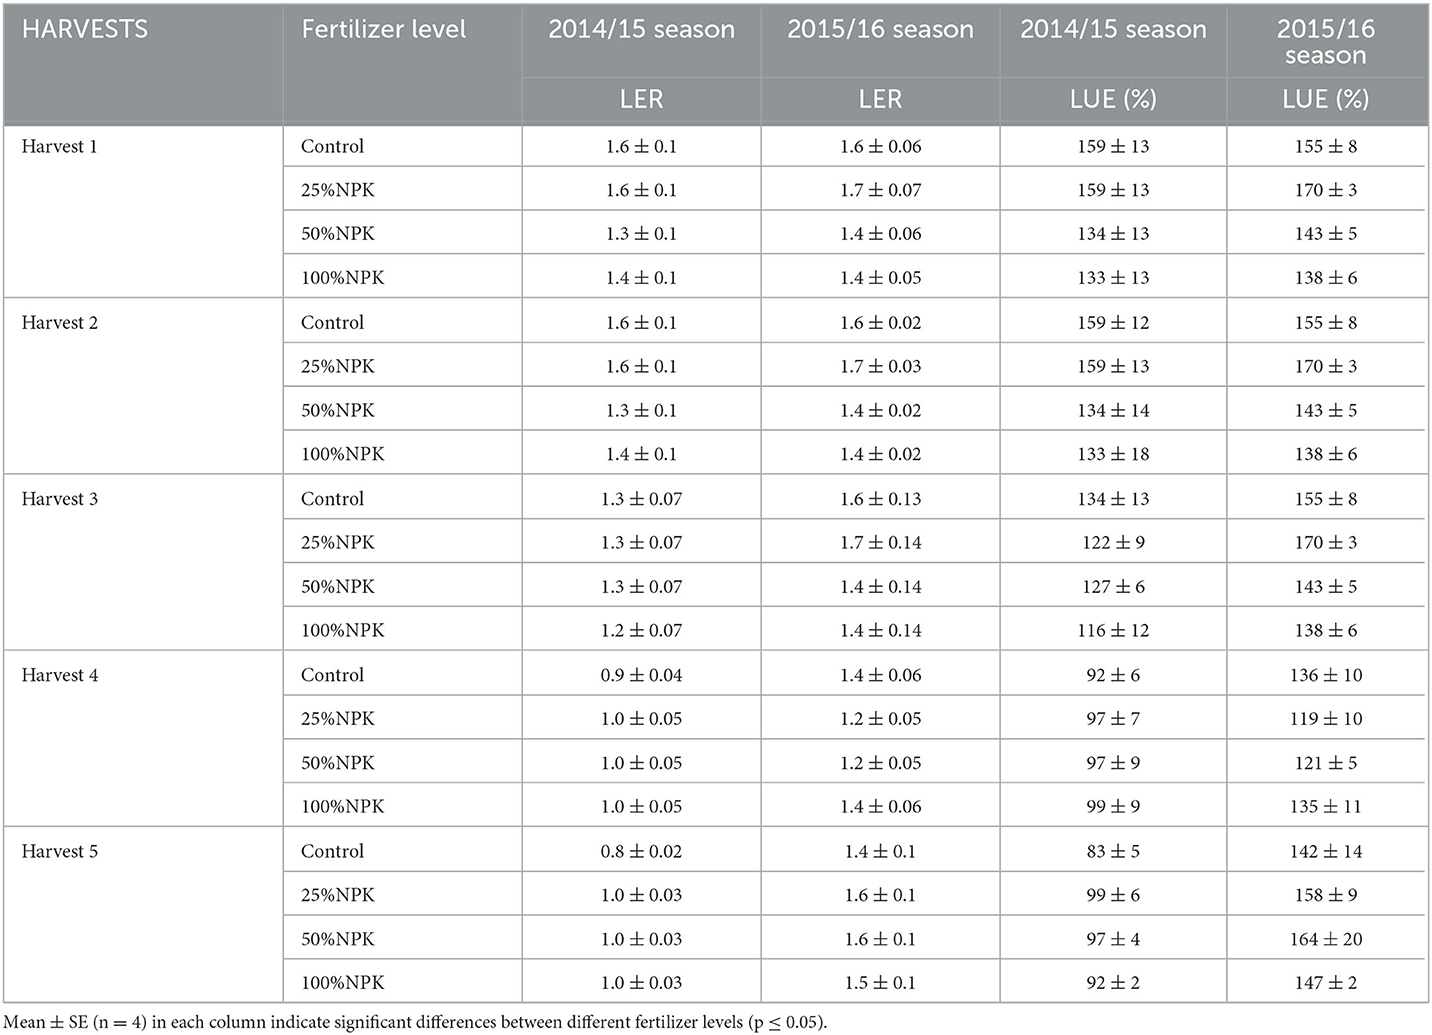
Table 7. Land equivalent ratio (LER) and Land use efficiency (LUE) of the five harvests fertilized with four different NPK levels in 2014/15 (season 1) and 2015/16 (season) seasons.
In both the 2014/15 and the 2015/16 seasons, the highest AGEB was obtained at 100% NPK in combination with sole cropping in the third harvest for both crops. The lowest AGEB was obtained under the control condition (0% NPK) in combination with the intercropping system in the 2014/15 and 2015/16 seasons. The lowest AGEB in both crops was obtained in the first and fifth harvests (Tables 3–7). There was a significant increase in AGEB of amaranth and cowpea from 0% NPK to 100% NPK in all harvests under both cropping systems and in both seasons (Tables 3–7).
3.2. Land equivalent ratio and land utilization efficiency %
The study showed mean land equivalent ratio (LER) values greater than one (LER>1) for all fertilizer levels, except in the case of the control treatments in the fourth and fifth harvests in the first season (2014/15) (Table 8). LER ratios ranged from 0.8 to 1.6 in the first season and from 1.2 to 1.7 in the second season. Mean LER values in the first and second harvests were higher under the control and 25% NPK treatments (1.6) and lower at 50% NPK (1.3) in the first season. In the third harvest, the LER showed statistically similar values of 1.3 under fertilizer levels ranging from the control to 50% NPK; this was followed by 100% NPK, which was lowest in the first season. In the fourth and fifth harvests, mean LER values increased from 0.9 and 0.8 under the control condition to 1.0 at 25% NPK, which was also equal to the values obtained at 50% NPK and 100% NPK, respectively, in the first season (Table 8). Mean LER values in the second season showed a gradual increase from the control up to 25% NPK, which produced the highest values. This was followed by a drop at 50% NPK and 100% NPK, which were lowest in the first, second, and third harvests. The fourth harvest showed increased values under the control treatment and 100% NPK. However, the values for the fifth harvest increased at 25% NPK and 50% NPK, with the lowest obtained under the control condition, at 1.4 (Table 8). Mean values of land utilization efficiency (LUE), expressed in percentages, showed trends similar to those observed for LER in all harvests in both seasons (Table 8).
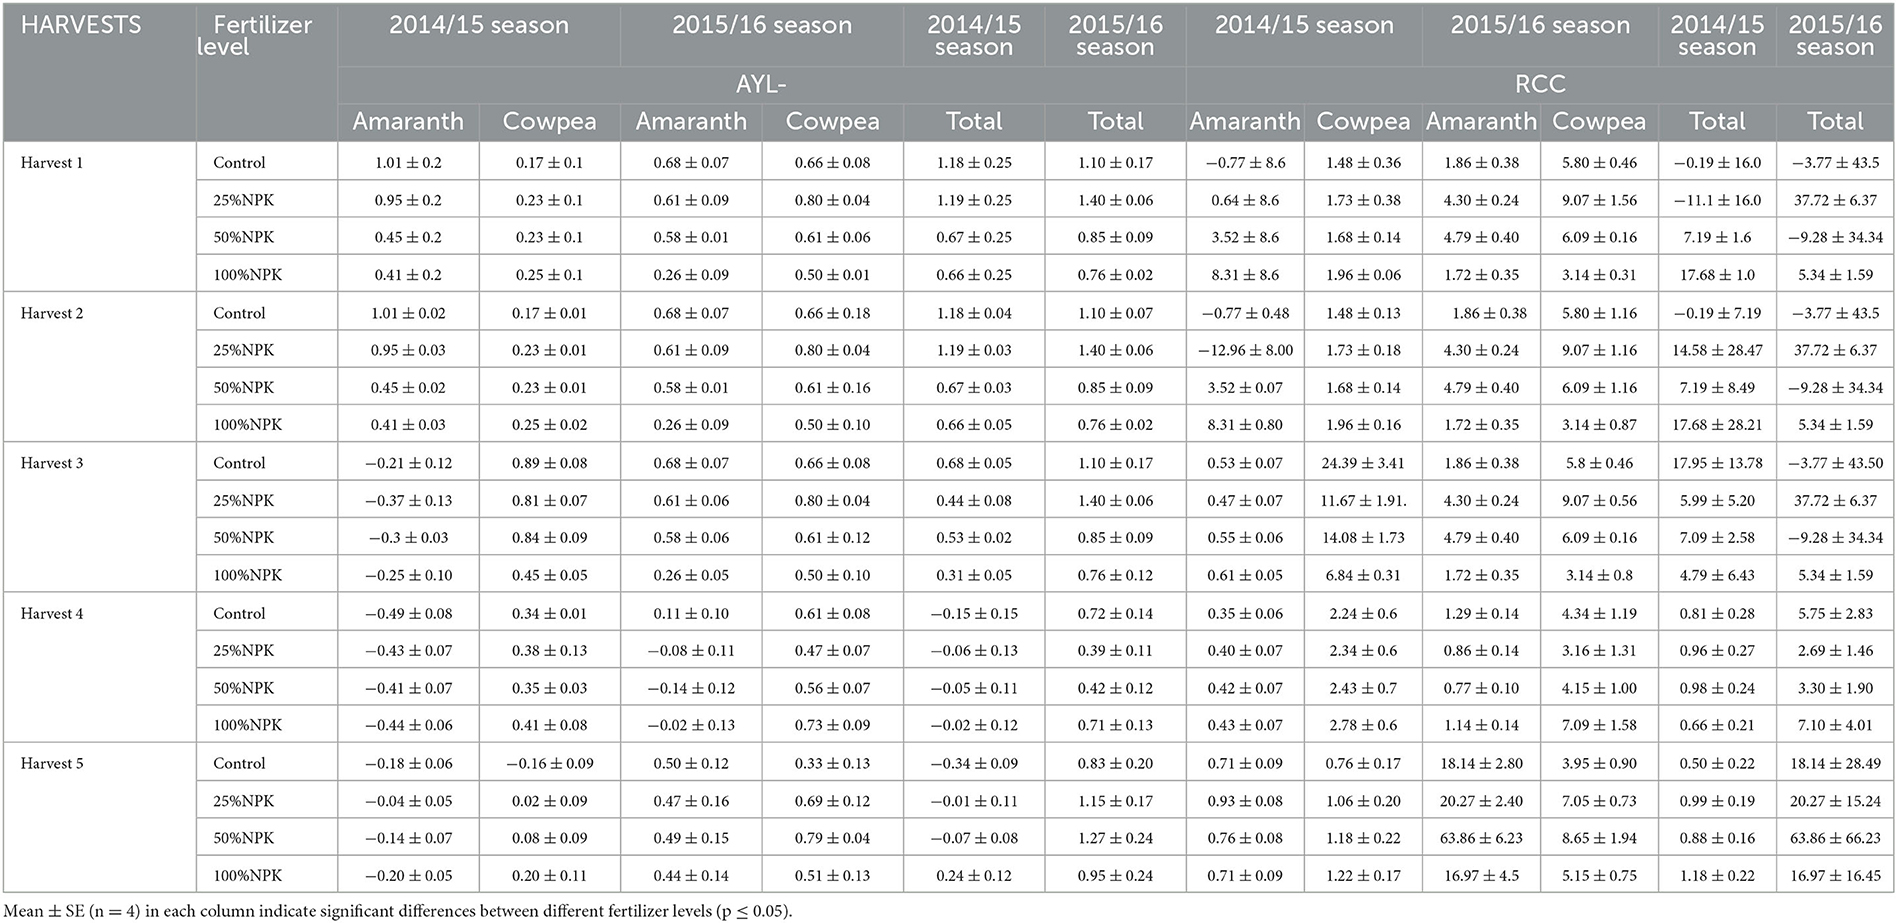
Table 8. Actual yield loss of amaranth (AYL-amaranth), Actual yield loss of cowpea (AYL-cowpea), Relative crowding coefficient of amaranth (RCC-amaranth), and Relative crowding coefficient of cowpea (RCC-cowpea) for harvests one to five grown under four NPK fertilization levels in 2014/15 (season 1 = S1) and 2015/16 (season 2 = S2) seasons.
3.3. Actual yield loss, relative crowding coefficient, aggressivity, and competition ratio
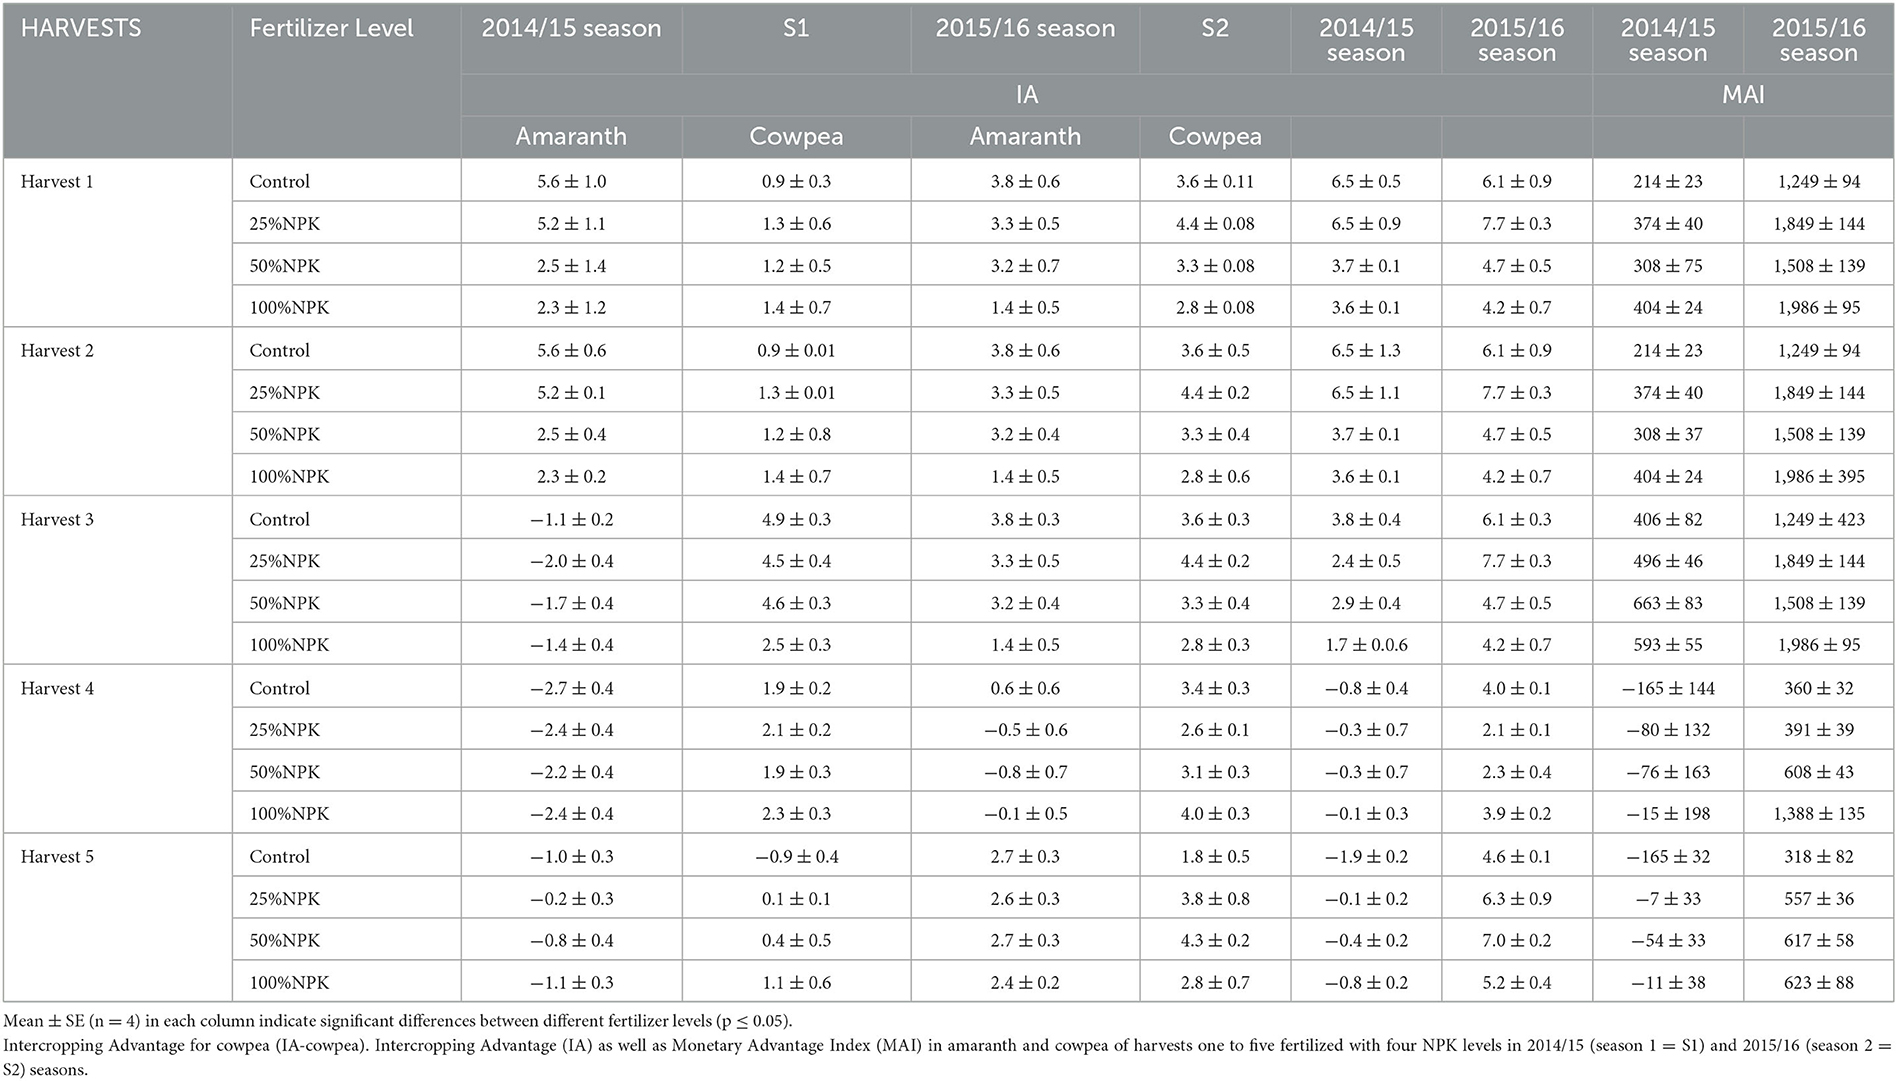
Mean actual yield loss (AYL) values for amaranth at the four different fertilizer levels were positive for the first and second harvests (ranging from 0.41 to 1.01) in the first season, indicating an increase in yield by 41 to 101% when amaranth was intercropped with cowpea. There was a characteristic decrease in mean AYL values under fertilizer treatments from the control (1.01) up to 100% NPK (0.41) in the first season. In contrast, the second season showed a gradual decrease in AYL from 0.68 under the control treatment to 0.26 at 100% NPK, in the first to third harvests. The third, fourth, and fifth harvests in the first season showed AYL mean values to be highest under the control treatment (−0.21), 50% NPK (−0.41), and 25% NPK (−0.04), translating to yield decreases by 21%, 41%, and 4%. The lowest values were observed under the control condition (−0.37), 50% NPK (−0.49), and 100% NPK (−0.20) (Table 9).
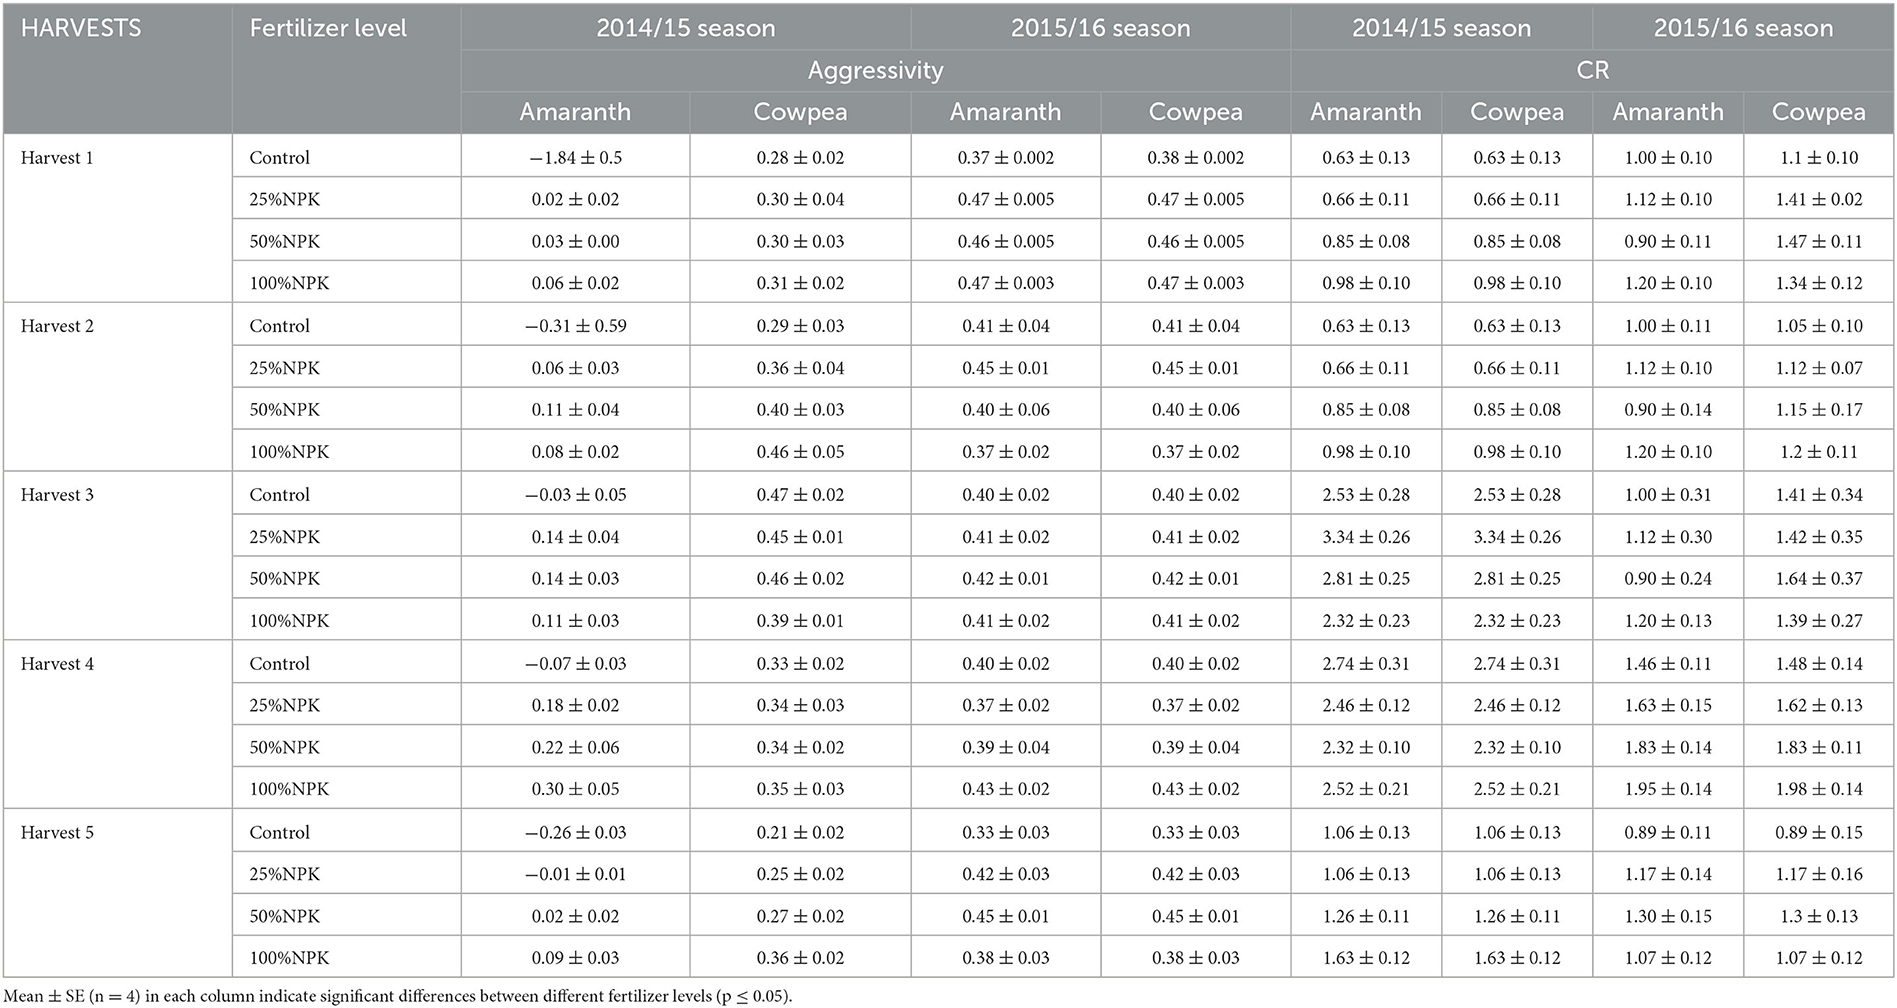
Table 9. Aggressivity of amaranth (Aggressivity-amaranth), aggressivity of cowpea (aggressivity-cowpea), competition ratio of amaranth (CR-amaranth) and competition ratio of cowpea (CR-cowpea) of harvests one to five fertilized with four NPK levels in 2014/15 (season 1 = S1) and 2015/16 (season 2 = S2) seasons.
Actual yield loss values for cowpea in the first season showed characteristic increases from the control treatment up to 100% NPK in the first (0.17 to 0.25), second (0.17 to 0.25), and fifth (−0.16 to 0.20) harvests. This translated to 17% to 25% increases in the first and second seasons, respectively. This was followed by a loss of 16% under a further increase in NPK, which increased to 20% under the 100% NPK condition at the fifth harvest. The third harvest showed decreases in AYL from the control condition (0.89) to 100% NPK (0.45), which was associated with the lowest value, indicating yield increases of 89% and 45%, respectively. The fourth harvest showed the lowest values under the control condition (0.34) and the highest under 100% NPK (0.41). In the second season, there were characteristic increases from 0.66 under the control condition to 0.80 in the first, second, and third harvests, with an exception for the fifth harvest, where an increase occurred from the control condition up to 50% NPK. The lowest AYL was obtained at the 100% NPK fertilizer level in the first to third harvests. The fourth and fifth harvests showed the lowest values at 25% NPK (0.47) and under the control treatment (0.33) (Table 9).
In the first season, for the first and second harvests, the total AYL increased from the control condition to 25% NPK, where its value was at its highest; it fell under further increases in fertilizer level up to the 100% NPK level, at which it was at its lowest. The third harvest had the highest AYL mean values under the control condition and lowest at the 100% NPK. For the fourth harvest, AYL was highest under the 100% NPK fertilizer level and lowest under the control treatment. The fifth harvest showed high AYL mean values at the 25% NPK level and lowest values under the control condition. In the second season, total AYL increased from the control condition up to 25% NPK and thereafter decreased up to 100% NPK, which was associated with the lowest AYL in the first, second, third, and fifth harvests. The control condition and the 100% NPK condition showed high AYL mean values, with the lowest values at 25% NPK (Table 9).
The highest mean relative crowding coefficient (RCC) values for amaranth showed increasing trends from the control treatment to 100% NPK for the first and second harvests in the first season. For the fifth harvest, RCC increased up to 25% NPK and then dropped to itns lowest value under the100% NPK condition. The fourth harvest showed the highest mean values at 100% NPK, with 25% NPK being associated with the lowest values in the first season. In the second season, the RCC for amaranth gradually increased from the control condition up to 25% NPK, after which there was a drop at 50% NPK. However, there was another increase at 100% NPK in the first to third harvests. The fifth harvest showed mean RCC values that increased from the control condition to 50% NPK, with 100% NPK being associated with the lowest value in the second season. The fourth harvest was associated with the highest value under the control condition, with the lowest being observed at 50% NPK in the second season (Table 9).
For the RCC of cowpea in the first season, there were higher mean values under the 100% NPK condition in the first, second, fourth, and fifth harvests, with values of 1.96, 1.96, 2.78, and 1.22, respectively. The lowest mean values were obtained under the control treatment for all harvests except for the fourth harvest in the first season. The fourth harvest showed high mean RCC values for cowpea under the control treatment the and lowest RCC value at 100% NPK in the first season. In the second season, there was a gradual increase from the control condition to the 25% NPK fertilizer level, which was associated with the highest values in the first to third harvests. The lowest RCC for cowpea was obtained at 100% NPK. The total RCC showed increasing trends from the control treatment to 100% NPK in the first, second, and fifth harvests in the first season. The third and fourth harvests were associated with higher mean values under the control treatment and the 50% NPK treatment in the first season. The second season had higher total mean RCC values under 100% NPK, 25% NPK, 25% NPK, the control treatment, and 50% NPK, respectively, for the first to fifth harvests.
Crop comparison showed equal aggressivity between amaranth and cowpea. The aggressivity of amaranth and cowpea increased with increasing levels of fertilization from the control condition to 100% NPK in all harvests, except for the third harvest in the case of cowpea (Table 10). The second season showed more aggressivity in the first to third harvests at 25% NPK, with the lowest at 100% NPK (Table 10). The fourth harvest and fifth harvest showed high mean aggressivity values under the control treatment and at 50% NPK (Table 10).
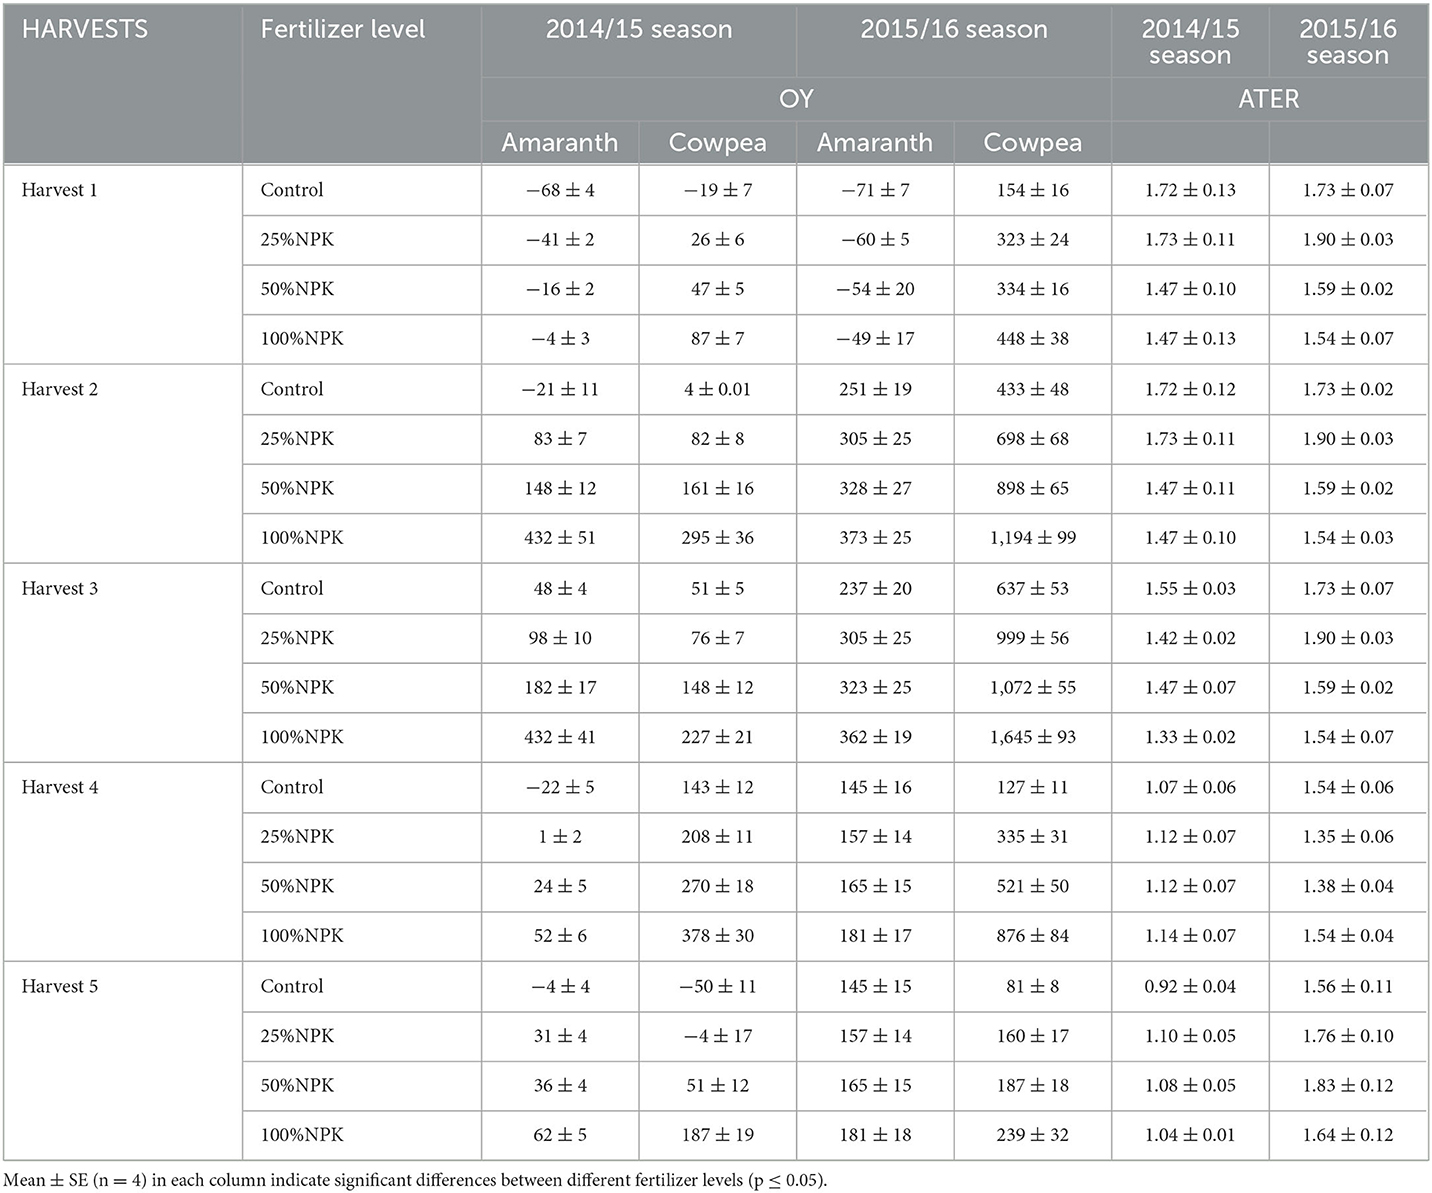
Table 10. Overyield of amaranth (OY-amaranth), Overyield of cowpea (OY-cowpea) and area time equivalent ratio (ATER) of harvests one to five fertilized with four NPK levels in 2014/15 (season 1 = S1) and 2015/16 (season 2 = S2) seasons.
The competition ratio (CR) of amaranth and cowpea showed comparably similar values due to the equal plant population on intercropping plots. There was increased competitiveness in the third (2.3 to 3.3) and fourth (2.3 to 2.7) harvests in both seasons. There was an increasing trend in CR for amaranth and cowpea from the control treatment up to 100% NPK in the first, second, and fifth harvests. In the third and fourth harvests, the highest CR values occurred at 25% NPK and under the control treatment (Table 10).
3.4. Over-yielding and the area time equivalent ratio
Crop comparison showed more over-yielding for cowpea when compared to amaranth. The over-yielding ratio of amaranth in the first and second seasons increased from the control treatment up to 100% NPK, at which it was highest. Similarly, over-yielding (OY) of cowpea in both seasons revealed characteristic increases from the control treatment up to the 100% NPK fertilizer level, at which it which was highest (Table 11).
The mean values of the area time equivalent ratio increased from the control treatment up to the 25% NPK fertilizer level, with the lowest values at 100% NPK for the first and second harvests (Table 11). In the fourth and fifth harvests, the values increased with fertilizer level from the control treatment to 100% NPK, which was associated with the highest ratio. The third harvest showed similar patterns to the first and second harvests in the second season. However, in the first season, the third harvest showed the highest values in the control condition, with the lowest values occurring at 100% NPK (Table 11).
3.5. Intercropping advantage and monetary advantage index
The intercropping advantage (IA) of cowpea was greater than that of amaranth in both seasons at all harvests and at the different fertilizer levels. The IA of amaranth in the first and second seasons showed the highest mean values in the case of the control treatments, except in the fourth harvest, when the highest value was observed at 50% NPK. The lowest mean IA values for amaranth were obtained at 100% NPK, with the exceptions of the third and fourth harvests, when the lowest values were observed at 25% NPK and under the control condition, respectively, in the first season. In the second season, the IA of amaranth showed the lowest mean values at 100% NPK. In contrast, higher mean values were observed for the IA of cowpea in the first season at 100% NPK, with the exception of the third harvest, where higher values were observed under the control treatment. The lowest mean values were obtained under the control treatment for all harvests except the third harvest. In the second season, the IA of cowpea showed the highest values at 25% NPK from the first to the third harvest, with the highest values then occurring at 100% NPK fertilizer level and 50% NPK fertilizer level in the fourth and fifth harvests, respectively. Overall, the total IA was above one (1) for the first to the third harvest. However, the fourth and fifth harvests showed negative mean values in the first season. The highest IA was obtained at 25% NPK from the first to the second harvests. In the third, fourth, and fifth harvests, the IA was highest under the control treatment, at 100% NPK, and at 25% NPK, respectively. The IA in the second season showed values above one (1) for all harvests. In the first season, the highest IA was obtained at 25% NPK from the first to the third harvests. In the fourth and fifth harvests, the IA was highest under the control treatment and at 50% NPK, respectively.
The monetary advantage index (MAI), an indicator of economic feasibility, showed higher mean values in the second season relative to the first season. In the first to the fifth harvests in both seasons, the MAI showed an increase with fertilizer level from the control treatment, which was associated with the lowest MAI, up to 100% NPK, which was associated with the highest.
4. Discussion
African leafy vegetable production can be improved through a number of different interventions, and among them is fertilizer application and intercropping (Mndzebele et al., 2020). The combined effects of fertilizer and intercropping yielded variable biomass in amaranth and cowpea. The yield of amaranth and cowpea significantly increased in sole cropping systems at fertilizer levels up to 100% NPK (Tables 3–7), indicating a positive response to fertilizer application. The high biomass achieved at 100% NPK was due to the response of cowpea and amaranth to the additional nutrient supply. This increase can be attributed to the fact that NPK fertilization, as guided by the 4R principles, is beneficial for the physical properties of the soil, which ultimately increases crop productivity (Gellings and Parmenter, 2016). Efficient utilization of NPK enhances plant growth (Addai, 2016; Tongos, 2016). These findings corroborate other results, such as results on spinach in sole cropping (El-Saady, 2016; Zikalala et al., 2017; Patel et al., 2021). In addition, there was more biomass in sole cropping when compared to intercropping. The closer spacing between alternate rows of amaranth and cowpea in an intercropping system led to competition between crops for resource utilization (Ndakidemi, 2006). On the other hand, the higher yields achieved in sole cropping were the result of high plant density (only in amaranth) as well as the absence of competition for resources such as nutrients (Eskandari and Ghanbari, 2009). These findings corroborate those of other studies conducted on cowpea and maize, where low yields were recorded in an intercropping system due to lower plant densities of individual crops than those occurring in sole cropping (Manasa et al., 2018). However, the study did not assess the effects of fertilizer and various harvesting frequencies on biomass accumulation, and therefore on yield. Together with biomass accumulation, there are carbohydrates, proteins, lipids, and vitamins, which are key to human sustenance. It is the absorption of the correct quantities and forms of minerals that influences the concentrations of the correct forms and quantities in crops, for example, cowpea and amaranth.
Agro-biological parameters or intercropping indices are used to quantify the effects of an intercropping system on biomass and/or yield (Dordas et al., 2019; Saeidi et al., 2019). Numerous intercropping indices, such as land equivalent ratio (LER), land utilization efficiency (LUE), relative crowding coefficient (RCC), aggressivity (A), competitive ratio (CR), actual yield loss (AYL), and intercropping advantage (IA), are used to explain competition between crops (Banik et al., 2000; Ghosh, 2004; Dhima et al., 2007). The ultimate goal of intercropping is economic benefit, which can be measured through the monetary advantage index (MAI) (Willey, 1979; Ghosh, 2004).
One of the ratios used to determine efficient resource utilization in an intercropping system relative to sole cropping is the LER (Tan et al., 2020). LER ratios above one (>1), achieved under different fertilizer levels across all harvests, in both seasons, indicated an advantage, with a few exceptions. Higher LER values (Table 8) indicated more biomass in intercropping relative to sole cropping of each crop due to efficient land utilization (Banik et al., 2006). The response of the LER to different fertilzer levels indicated that there was greater land utilization efficiency at lower fertilizer levels up to the second harvest. Other harvests showed the highest LER values at 100% NPK. LER and LUE ratios above one (>1) were caused by the combined biomass from both amaranth and cowpea. A total LER higher than 1.0 indicates the presence of positive interference among cowpea and amaranth growth or yield components. The findings corroborated this, with LER values higher than one at different fertilizer levels, indicating an intercropping advantage (Singh et al., 2017; Raza et al., 2019). However, in the first season, the fourth and fifth harvests under the control condition were associated with values less than one (<1). Observations, irrespective of fertilizer level, have shown that LERs below 1.00 demonstrate a disadvantage of intercropping vis-a-vis sole cropping (Banik et al., 2000; Ghosh, 2004; Midya et al., 2005). Similar to the LER, the land use efficiency (LUE) (>100%) was an indication, in both seasons and in all harvests, that intercropping was beneficial: hence, it was associated with increased biomass relative to sole cropping as a result of efficient land utilization (Table 8) (Banik et al., 2006). These are important findings for farmers to identify the optimum fertilizer level for the best land utilization efficiency.
Actual yield loss (AYL) data provide accurate information on intercropping advantages or disadvantages (Banik et al., 2000). The findings showed positive mean AYL values, which were at their highest at 25% NPK or 50% NPK fertilizer levels and at their lowest at 100% NPK fertilizer levels in the first to the fifth harvests in both seasons. However, the fertilizer levels in the fourth and fifth harvests in the first season were negative (Table 9). Positive mean AYL values across the varying fertilizer levels in different harvests indicated advantages of the intercropping system, but negative values showed the contrary in consideration of crop yield (Thorsted et al., 2006). In particular, the increase in yield in this association is related to the yield advantage of both crops compared to sole cropping. Furthermore, the yield advantage for amaranth probably had a positive effect on cowpea when these were grown in intercropping systems. According to Banik et al. (2000), the AYL index can give more precise information than other indices on the inter- and intra-specific competition of the component crops and the behavior of each species involved in intercropping systems. Our study is comparable with others, in which positive AYL values for maize have indicated that there is an increase in yield when maize is intercropped with cowpea. However, negative AYL values for cowpea showed a decrease in yield (Alla et al., 2015).
The relative crowding coefficient (RCC) was estimated in order to calculate the relative dominance of one species over the other in an intercropping system (De Wit, 1960). In our study, the RCC of amaranth showed lower mean values in both seasons for all harvests relative to RCC of cowpea, which was higher (Table 9). The higher relative crowding coefficient in cowpea relative to amaranth was caused by the response of these crops to fertilizer, in which cowpea grows more quickly and more aggressively, and accumulates more biomass relative to amaranth (personal observation). In general, the 100% NPK fertilizer level showed the highest RCC in both crops, except for the fifth harvest, when the highest RCC occurred at 25% NPK. The higher RCC ta higher nutrient amounts was proportionate to the greater biomass accumulation. The total RCC showed positive mean values in both crops in the fourth and fifth harvests in both seasons, with an increase from the control treatment to 25% NPK, 50% NPK, or 100% NPK fertilizer levels, indicating a yield advantage. However, the first to the third harvest had negative RCC mean values under fertilizer levels from the control treatment to 50% NPK, indicating yield disadvantages within the intercropping system (Willey and Rao, 1980; Ghosh, 2004), if no or low fertilizer was applied.
Aggressivity indicates the relative yield increase in one crop in relation to the other one in an intercropping system (McGilchrist, 1965). The findings on aggressivity showed that cowpea was more aggressive than amaranth in the first season (Table 9). However, there were similarities in the aggressivity of both amaranth and cowpea in the second season. Generally, there was characteristically more aggressivity at the 100% NPK and 50% NPK fertilizer levels in all harvests in the first and second seasons, respectively, with a few exceptions, with the lowest levels of aggressivity occurring at the control level of fertilizer. This could be explained by increased growth in the legume as a result of the plants being able to harness more nutrients (Jat et al., 2012; da Silva et al., 2020), especially at higher levels, such as 50% NPK or 100% NPK, in an intercropping system (Tables 3–7). The higher aggressivity in cowpea relative to amaranth was caused by the crop response to fertilizer application, which was faster in the legume. Our study corroborates others in terms of aggressivity, including the findings of Li et al. (2009) and Hu et al. (2016) on maize–legume strip intercropping, in which the legume was more aggressive relative to the non-legume. While studies (Banik et al., 2000; Xu et al., 2006a,b) have reported a greater competitive ability of non-leguminous crops irrespective of fertilizer, our study demonstrated higher competitiveness in cowpea.
The CR provides better determination of the competitive ability between crops (Dhima et al., 2007). Our study showed relatively equal CR for both amaranth and cowpea, with the highest mean values at the 100% NPK and 50% NPK fertilizer levels for the first and second seasons, respectively (Table 10). The proportionately equal plant populations of amaranth and cowpea in the intercropping treatments could have caused this; hence, their ratio becomes zero (Willey and Rao, 1980; Dhima et al., 2007).
Over-yielding was assessed by an increase or decrease in the intercropped crops over the corresponding mono-cropped crops, following Li et al. (2011). Our study showed an increasing trend in OY for both amaranth and cowpea with increasing fertilizer levels from the control treatment to the 100% NPK fertilizer level. This could have been caused by the biomass corresponding to the additional fertilizer application. The findings showed higher mean OY values for cowpea relative to amaranth (Table 11), which corroborated a study on maize–cowpea intercropping (Masvaya et al., 2017), indicating more OY in a legume. The area time equivalent ratio (ATER) provides a more realistic comparison of the yield advantage of intercropping. The findings showed ATER values greater than one, with the highest values occurring at levels of fertilizer varying from 25% NPK to 100% NPK in different harvests in both seasons (Table 11). The lowest ATER value was obtained under the control level of fertilizer treatment. If the ATER was greater than one irrespective of fertilizer level, this implied yield advantage, while mean values below one indicated yield disadvantage. Several studies (Takim, 2012; Olowolaju and Okunlola, 2017; El-Ghobashy et al., 2018) have proven that intercropping with a legume as a companion crop results in ATERs above one. The intercropping advantage (IA) was worked out following Banik et al. (2000). The overall IA showed mean values varying under different fertilizer levels from the control treatment to the 100% NPK fertilizer level in both seasons. The increased IA could be attributed to the response to fertilizer application, in which additional fertilizer application resulted in more biomass (Tables 3–7). The findings corroborate previous work by Dhima et al. (2007) on common vetch and cereal intercropping to measure the economic feasibility of intercropping systems, hence showing the advantage of intercropping systems.
The ultimate form of assessment is economic assessment, measured in terms of the monetary advantage index (MAI), which can indicate the most profitable fertilizer level and harvest. There was an increasing trend in mean MAI mean values with fertilizer levels from the control treatment to 100% NPK in the first to the fourth harvest, with the fifth harvest showing an increase only until the 50% NPK fertilizer level. The lowest MAI was obtained at the control level of fertilizer. This means that, in terms of money, it was economical to harvest the crop until the fourth harvest, after which it was wasteful. Similar to our results, Banik et al. (2000) and Yang et al. (2015) reported an intercropping advantage on the basis of positive values of monetary advantage at all fertilizer levels. This index is an indicator of the economic viability of the most profitable fertilizer level and harvest. The findings address the yield in amaranth–cowpea intercropping, as well as its intercropping indices, which are indicators for resource utilization to address low food security in rural resource-poor communities. However, more studies must be conducted, examining other parameters in addition to yield, to determine the nutritional value of plants and ultimately to relate the harvested biomass and nutrition to the daily recommended allowance.
5. Conclusion
Fertilizer application increased yields of amaranth and cowpea, as well as improving the agro-biological parameters. The application of 100% NPK fertilizer contributed to increased biomass, and hence higher yields of amaranth and cowpea. The lowest plant growth was observed under the control treatment (0% NPK). Each of the vegetable crops (both amaranth and cowpea) showed higher yield under sole cropping compared to intercropping at each of the harvesting frequencies in both seasons. There was greater land utilization efficiency in the case of the amaranth–cowpea intercrop at all fertilizer levels and across different harvests in both seasons. There was higher actual yield loss and higher relative competition in cowpea when compared to amaranth across different fertilizer levels in all harvests. Amaranth–cowpea intercrop showed an intercropping advantage at the 100% NPK fertilizer level. Additional income was obtained at the 100% NPK fertilizer level in all harvests in both seasons. This study addresses the effects of fertilizer application and intercropping on yield and agro-biological parameters, which are determinants of intercropping. The study has implications for increased food and nutrition in rural communities, through amaranth and cowpea intercropping. Therefore, smallholder farmers should intercrop and should also apply the recommended 100% NPK fertilizer dosage. The study recommends the collection of additional data on nutritional concentration and nutritional yield in the amaranth and cowpea intercrop. In addition, the benefit of amaranth and cowpea to human nutrition should be studied in relation to the daily nutrient requirements. It is recommended to investigate how yield parameters can be linked to both crop quantity (yield) and quality in order to see how intercropping can be used to enhance crop value. For example, amaranth is a dual-purpose crop, providing leafy vegetable and grain. Cowpea is a nitrogen-fixing crop that is also a grain. It is important to find out whether amaranth benefits as a leafy vegetable or as a grain, or both. It is also important to explain whether the benefit to amaranth leafy vegetable is expressed early or late in the season, as it is harvested many times. Although the study did not compare different types of intercropping, the findings are unique in terms of the focus on underutilized crops. The results also create an opportunity for future research.
Data availability statement
The raw data supporting the conclusions of this article will be made available by the authors, without undue reservation.
Author contributions
BM, TM, AM, and MF conceptualized the research project while BM executed the experiments and data collection. BM and BN analyzed the data and wrote the original draft manuscript. BN, MF, TM, and AM reviewed and edited the manuscript. TM, AM, and BN did critical review, redrafting, and supervised the student's research project. All authors have read and agreed to the published version of the manuscript.
Funding
The authors would like to acknowledge the support from the Agricultural Research Council. In addition the Centre for Transformative Agricultural and Food Systems (CTAFS) of the University of KwaZulu-Natal is acknowledged for supporting the APC.
Conflict of interest
The authors declare that the research was conducted in the absence of any commercial or financial relationships that could be construed as a potential conflict of interest.
Publisher's note
All claims expressed in this article are solely those of the authors and do not necessarily represent those of their affiliated organizations, or those of the publisher, the editors and the reviewers. Any product that may be evaluated in this article, or claim that may be made by its manufacturer, is not guaranteed or endorsed by the publisher.
References
Addai, I. K. (2016). “Response of Cowpea (Vigna unguiculata L.) to simulated leaf herbivory and rate of application of npk 15: 15: 15 in the guinea savannah agroecology of ghana. UDS Int. J. Dev. 3, 13–19. doi: 10.47740/95.UDSIJD6i
Ahamefule, E. H., and Chinedu, P. P. (2014). Cowpea (Vigna unguiculata L. Walp) response to phosphorus fertilizer under two tillage and mulch treatments. Soil. Tillage. Res. 136, 70–75. doi: 10.1016/j.still.2013.09.012
Alla, W. H., Shalaby, E. M., Dawood, R. A., and Zohry, A. A. (2015). Effect of cowpea (Vigna sinensis L.) with maize (Zea mays L.) intercropping on yield and its components. Int. J. Agric. Biol. Eng. 8, 1258–1264.
Anjum, S. A., Xie, X., Wang, L. C., Saleem, M. F., Man, C., and Lei, W. (2011). Morphological, physiological and biochemical responses of plants to drought stress. Afr. J. Agric. Res. 6, 2026–2032.
Asongu, S. A., and Odhiambo, N. M. (2019). Economic development thresholds for a green economy in sub-Saharan Africa. Energy. Explor. Exploit. 38, 3–17. doi: 10.1177/0144598719835591
Banik, P. (1996). Evaluation of wheat (Triticum aestivum) and legume intercropping under 1:1 and 2:1 row-replacement series system. J. Agron. Crop. Sci. 176, 289–294. doi: 10.1111/j.1439-037X.1996.tb00473.x
Banik, P., Midya, A., Sarkar, B. K., and Ghose, S. S. (2006). Wheat and chickpea intercropping systems in an additive series experiment: advantages and weed smothering. Eur. J. Agron. 24, 325–332. doi: 10.1016/j.eja.2005.10.010
Banik, P., Sasmal, T., Ghosal, P. K., and Bagchi, D. K. (2000). Evaluation of mustard (Brassica compestris Var. Toria) and legume intercropping under 1: 1 and 2: 1 row-replacement series systems. J. Agron. Crop. Sci. 185, 9–14. doi: 10.1046/j.1439-037X.2000.00388.x
Brooker, R. W., Maestre, F. T., Callaway, R. M., Lortie, C. L., Cavieres, L. A., Kunstler, G., et al. (2008). Facilitation in plant communities: the past, the present, and the future. J. Ecol. 96, 18–34. doi: 10.1111/j.1365-2745.2007.01295.x
Chivenge, P., Mabhaudhi, T., Modi, A. T., and Mafongoya, P. (2015). The potential role of neglected and underutilised crop species as future crops under water scarce conditions in Sub-Saharan Africa. Int. J. Environ. Res. Public Health 12, 5685–5711. doi: 10.3390/ijerph120605685
da Silva, E. C., Muraoka, T., Bastos, A. V. S., Franzin, V. I., Buzetti, S., Soares, F. A. L., et al. (2020). Biomass and nutrient accumulation by cover crops and upland rice grown in succession under no-tillage system as affected by nitrogen fertilizer rate. Jackson County School Board 23, 117–126. doi: 10.1007/s12892-019-0288-0
De Wit, C. D., and Van den Bergh, J. P. (1965). Competition between herbage plants. J. Agric. Sci. 13, 212–221. doi: 10.18174/njas.v13i2.17501
Dhima, K. V., Lithourgidis, A. S., Vasilakoglou, I. B., and Dordas, C. A. (2007). Competition indices of common vetch and cereal intercrops in two seeding ratio. Field. Crops. Res. 100, 249–256. doi: 10.1016/j.fcr.2006.07.008
Dordas, C. A., Lithourgidis, A. S., and Galanopoulou, K. (2019). Intercropping of faba bean with barley at various spatial arrangements affects dry matter and n yield, nitrogen nutrition index, and interspecific competition. Not. Bot. Horti. Agrobot. Cluj. Napoca. 47, 4. doi: 10.15835/nbha47411520
Elbasiouny, H., El-Ramady, H., Elbehiry, F., Rajput, V. D., Minkina, T., and Mandzhieva, S. (2022). Plant nutrition under climate change and soil carbon sequestration. Sustainability 14, 914. doi: 10.3390/su14020914
El-Ghobashy, Y. E., Shams, A. S., and Lamlom, M. M. (2018). Maximizing land-use efficiency by intercropping cowpea with some maize hybrids under different maize planting geometries. J. Agric. Sci. 9, 1601–1620. doi: 10.4236/as.2018.912112
El-Saady, W. A. (2016). Spinach (Spinacia oleracea L.) growth, yield and quality response to the application of mineral NPK fertilizer ratios and levels. Middle. East. J. 5, 908–917.
Eskandari, H., and Ghanbari, A. (2009). Intercropping of maize (Zea mays) and cowpea (Vigna sinensis) as whole-crop forage: Effect of different planting pattern on total dry matter production and maize forage quality. Not. Bot. Horti. Agrobot. Cluj. Napoca. 37, 152−155.
Fageria, N. K., and Stone, L. F. (2006). Physical, chemical, and biological changes in the rhizosphere and nutrient availability. J. Plant Nutr. 29, 1327–1356. doi: 10.1080/01904160600767682
Fan, F., Zhang, F., Song, Y., Sun, J., Bao, X., Guo, T., et al. (2006). Nitrogen fixation of faba bean (Vicia faba L.) interacting with a non-legume in two contrasting intercropping systems. Plant. Soil. 283, 275–286. doi: 10.1007/s11104-006-0019-y
FAO (2009). How to Feed the World in 2050. Proceedings of the Expert Meeting on How to Feed the World in 2050 24-26 June 2009, FAO Headquarters, Rome.
Gashu, D., Demment, M. W., and Stoecker, B. J. (2019). Challenges and opportunities to the African agriculture and food systems. African J. Food, Agric. Nutr. Dev. 19, 14190–14217. doi: 10.18697/ajfand.84.BLFB2000
Gellings, C. W., and Parmenter, K. E. (2016). “Energy efficiency in fertilizer production and use. Efficient use and conservation of energy,” in Encyclopedia of Life Support Systems, ed C. W. Gellings, 123–136.
Gerrano, A. S., Adebola, P. O., Jansen van Rensburg, W. S., and Laurie, S. M. (2015). Genetic variability in cowpea (Vigna unguiculata (L.) Walp.) genotypes. S Afr. J. Plant Soil 32, 165–174. doi: 10.1080/02571862.2015.1014435
Gerrano, A. S., Thungo, Z. G., and Mavengahama, S. (2022). Phenotypic description of elite cowpea (Vigna ungiculata L. Walp) genotypes grown in drought-prone environments using agronomic traits. Heliyon 8, 855. doi: 10.1016/j.heliyon.2022.e08855
Ghosh, P. K. (2004). Growth, yield, competition and economics of groundnut/cereal fodder intercropping systems in the semi-arid tropics of India. Field. Crops. Res. 88, 227–237. doi: 10.1016/j.fcr.2004.01.015
Glass, G. V., Peckham, P. D., and Sanders, J. R. (1972). Consequences of failure to meet assumptions underlying the fixed effects analyses of variance and covariance. Educ. Res. Rev. 42, 237–288. doi: 10.3102/00346543042003237
Goswami, S., Singh, S. K., Patra, A., Dutta, A., and Mohapatra, K. K. (2022). Residual effects of nickel and its interaction with applied zinc and npk improve the growth, yield, and nutritional quality of cowpea and urease activity of soil grown in vertisols. J. Soil Sci. Plant Nutr. 22, 4262–4272. doi: 10.1007/s42729-022-01024-2
Grubben, G. J. H., and Denton, O. A. (2004). Plant Resources of Tropical Africa 2. Vegetables. Wageningen, NL: PROTA Foundation; Backhuys Publishers; CTA.
Harper, L. A., Sharp, R. R., Langdale, G. W., and Giddens, J. E. (1987). Nitrogen cycling in a wheat crop: soil, plant, and aerial nitrogen transport 1. Agron. J. 79, 965–973. doi: 10.2134/agronj1987.00021962007900060004x
Hu, F., Gan, Y., Chai, Q., Feng, F., Zhao, C., Yu, A., et al. (2016). Boosting system productivity through the improved coordination of interspecific competition in maize/pea strip intercropping. Field. Crops. Res. 198, 50–60. doi: 10.1016/j.fcr.2016.08.022
Imadi, S. R., Shazadi, K., Gul, A., and Hakeem, K. R. (2016). Sustainable crop production system. Plant Soil Microbes Implicat. Crop Sci. 16, 103–116. doi: 10.1007/978-3-319-27455-3_6
Jat, S. L., Shivay, Y. S., Parihar, C. M., and Meena, H. N. (2012). Evaluation of summer legumes for their economic feasibility, nutrient accumulation and soil fertility. Legume Prot. Food Technol. 25, 240–243.
Jayne, T. S., and Muyanga, M. (2012). Land constraints in Kenya's densely populated rural areas: Implications for food policy and institutional reform. Food Secur. 4, 399–421. doi: 10.1007/s12571-012-0174-3
Karagöz, I. (2021). Fertilization and fertilizer types. Appl. Environ. Soil Sci. 21, 123–148. doi: 10.1002/9781119711520.ch7
König, S., Vogel, H. J., Harms, H., and Worrich, A. (2020). Physical, chemical and biological effects on soil bacterial dynamics in microscale models. Front. Ecol. Evol. 8, 53. doi: 10.3389/fevo.2020.00053
Lehman, R. M., Cambardella, C. A., Stott, D. E., Acosta-Martinez, V., Manter, D. K., Buyer, J. S., et al. (2015). Understanding and enhancing soil biological health: the solution for reversing soil degradation. Sustainability 7,988–1027. doi: 10.3390/su7010988
Li, Q. Z., Sun, J. H., Wei, X. J., Christie, P., Zhang, F. S., and Li, L. (2011). Overyielding and interspecific interactions mediated by nitrogen fertilization in strip intercropping of maize with faba bean, wheat and barley. Plant. Soil. 339, 147–161. doi: 10.1007/s11104-010-0561-5
Li, Y., Yu, C., Cheng, X., Li, C., Sun, J., Zhang, F., et al. (2009). Intercropping alleviates the inhibitory effect of N fertilization on nodulation and symbiotic N2 fixation of faba bean. Plant. Soil. 323, 295–308. doi: 10.1007/s11104-009-9938-8
Makinde, E. A., Ayeni, L. S., and Ojeniyi, S. O. (2010). Morphological characteristics of Amaranthus cruentus L. as influenced by Kola Pod Husk, organomineral and NPK fertilizers in Southwestern Nigeria. N. Y. Sci. J. 3, 130–134.
Manasa, P., Maitra, S., and Reddy, M. D. (2018). Effect of summer maize-legume intercropping system on growth, productivity and competitive ability of crops. IJEMR 8, 2871–2875.
Masvaya, E. N., Nyamangara, J., Descheemaeker, K., and Giller, K. E. (2017). Is maize-cowpea intercropping a viable option for smallholder farms in the risky environments of semi-arid southern Africa? Field. Crops. Res. 209:73–87. doi: 10.1016/j.fcr.2017.04.016
Mavengahama, S. (2013). The contribution of indigenous vegetables to food security and nutrition within selected sites in South Africa.
McGilchrist, C. A. (1965). Analysis of competition experiments. Biometrics 12, 975–985. doi: 10.2307/2528258
Medeiros, D. M., and Wildman, R. E. (2022). Advanced Human Nutrition. Burlington, MA: Jones and Bartlett Learning.
Mei, P., Gui, L., Wang, P., Huang, J., Long, H., Christie, P., et al. (2012). Maize/faba bean intercropping with rhizobia inoculation enhances productivity and recovery of fertilizer P in a reclaimed desert soil. Field. Crops. Res. 130, 19–27. doi: 10.1016/j.fcr.2012.02.007
Midya, A., Bhattacharjee, K., Ghose, S. S., and Banik, P. (2005). Deferred seeding of black gram (Phaseolus mungo L.) in rice (Oryza sativa L.) field on yield advantages and smothering of weeds. J. Agron. Crop. Sci. 191, 195–201. doi: 10.1111/j.1439-037X.2005.00157.x
Mndzebele, B., Ncube, B., Fessehazion, M., Mabhaudhi, T., Amoo, S., du Plooy, C., et al. (2020). Effects of cowpea-amaranth intercropping and fertiliser application on soil phosphatase activities, available soil phosphorus, and crop growth response. Agron. 10, 79. doi: 10.3390/agronomy10010079
Nanganoa, L. T., Ngome, F. A., Suh, C., and Basga, S. D. (2020). Assessing soil nutrients variability and adequacy for the cultivation of maize, cassava, and sorghum in selected agroecological zones of cameroon. Int. J. Agron. 20, 2020. doi: 10.1155/2020/8887318
Ndakidemi, P. A. (2006). Manipulating legume/cereal mixtures to optimize the above and belowground interactions in the traditional African cropping systems. Afr. J. Biotechnol. 5, 2526–2533.
Odhav, B., Beekrum, S., Akula, U. S., and Baijnath, H. (2007). Preliminary assessment of the nutritional value of traditional leafy vegetables in KwaZulu-Natal, South Africa. J. Food. Compost. Anal. 20, 430–435. doi: 10.1016/j.jfca.2006.04.015
Oelofse, A., and Van Averbeke, W. (2012). Nutritional Value and Water Use of African Leafy Vegetables for Improved Livelihoods. Water Research Commission.
Olowolaju, E. D., and Okunlola, G. O. (2017). Comparative advantage of intercropping maize, cowpea and tomato to sole and mixed culture. Ann. West Univ. Timiş. Ser. Biol. 20, 31.
Pastori, M., Dondeynaz, C., Minoungou, B., Udias, A., Ameztoy, I., Hamatan, M., et al. (2019). “Identification of optimal agricultural development strategies in the West African sahel mékrou transboundary River Basin,” in Agriculture and Ecosystem Resilience in Sub Saharan Africa (Cham: Springer), 729–746.
Patel, V. K., Vikram, B., Sikarwar, P. S., and Sengupta, J. (2021). Effect of different levels of nitrogen and phosphorus on growth and yield of spinach (Spinacea oleracea L.) cv. all green. J. pharmacogn. phytochem. 10, 2229–2231.
Pouyat, R. V., Szlavecz, K., Yesilonis, I. D., Groffman, P. M., and Schwarz, K. (2010). Chemical, physical, and biological characteristics of urban soils. Urban Ecosyst., 55, 119–152. doi: 10.2134/agronmonogr55.c7
Raza, M. A., Khalid, M. H. B., Zhang, X., Feng, L. Y., Khan, I., Hassan, M. J., et al. (2019). Effect of planting patterns on yield, nutrient accumulation and distribution in maize and soybean under relay intercropping systems. Sci. Rep. 9, 1–14. doi: 10.1038/s41598-019-41364-1
Sacks, W. J., Deryng, D., Foley, J. A., and Ramankutty, N. (2010). Crop planting dates: an analysis of global patterns. Glob. Ecol. Biogeogr. 19, 607–620. doi: 10.1111/j.1466-8238.2010.00551.x
Saeidi, M., Yaghoub, R. A. E. I., Amini, R., Taghizadeh, A., Pasban-Eslam, B., and Saralan, A. R. (2019). Competition indices of safflower and faba bean intercrops as affected by fertilizers. Not. Sci. Biol. 11, 130–137. doi: 10.15835/nsb11110340
Shapiro, S. S., and Wilk, M. B. (1965). An analysis of variance test for normality (complete samples). Biometrika. 52, 591–611. doi: 10.1093/biomet/52.3-4.591
Singh, H., Sharma, P., Kumar, P., Dhillon, N. S., and Sekhon, B. S. (2017). Influence of mulching on growth and yield of Tomato (Solanum lycopersicum L.) under Protected Environment. Biotechnol. J. 65, 1–6. doi: 10.9734/BJI/2017/35410
Soetan, K. O., Olaiya, C. O., and Oyewole, O. E. (2010). The importance of mineral elements for humans, domestic animals and plants: a review. Afr. J. Food Sci. 4, 200–222
Stewart, B. A., and Peterson, G. A. (2015). Managing green water in dryland agriculture. Agron. J. 107, 1544–1553. doi: 10.2134/agronj14.0038
Stewart, Z. P., Pierzynski, G. M., Middendorf, B. J., and Prasad, P. V. (2020). Approaches to improve soil fertility in sub-Saharan Africa. J. Exp. Bot. 71, 632–641. doi: 10.1093/jxb/erz446
Takim, F. O. (2012). Advantages of maize-cowpea intercropping over sole cropping through competition indices. J.A.B.R. 1, 53–59.
Tan, Y., Hu, F., Chai, Q., Li, G., Coulter, J. A., Zhao, C., et al. (2020). Expanding row ratio with lowered nitrogen fertilization improves system productivity of maize/pea strip intercropping. Eur. J. Agron. 113, 125986. doi: 10.1016/j.eja.2019.125986
Thorsted, M. D., Olesen, J. E., and Weiner, J. (2006). Mechanical control of clover improves nitrogen supply and growth of wheat in winter wheat/white clover intercropping. Eur. J. Agron. 24, 149–155. doi: 10.1016/j.eja.2005.07.004
Tongos, M. D. (2016). Yield of vegetable amaranth (Amaranthus cruentus L.) as influenced by row spacing and nitrogen fertilizer in Mubi, Northern Guinea Savannah Zone of Nigeria. Int. J. Agric. Innov. Res. 4, 40.
Van Rensburg, W. J., Van Averbeke, W., Slabbert, R., Faber, M., Van Jaarsveld, P., Van Heerden, I., et al. (2007). African leafy vegetables in South Africa. Water SA 33, 317–326. doi: 10.4314/wsa.v33i3.180589
Vorster, H. J., Stevens, J. B., and Steyn, G. J. (2008). Production systems of traditional leafy vegetables: challenges for research and extension. S.A.S.A.E. 37, 85–96.
Watson, C. A., Atkinson, D., Gosling, P., Jackson, L. R., and Rayns, F. W. (2002). Managing soil fertility in organic farming systems. Soil Use Manag. 18, 239–247. doi: 10.1079/SUM2002131
Willey, R. (1979). Intercropping-its importance and research needs: Part 1. competition and yield advantages. In Field crop abstracts. 32, 1–10.
Willey, R. W., and Rao, M. R. (1980). A competitive ratio for quantifying competition between intercrops. Exp. Agric. 16, 117–125. doi: 10.1017/S0014479700010802
Xu, B., Li, F., Shan, L., Ma, Y., Ichizen, N., and Huang, J. (2006a). Gas exchange, biomass partition, and water relationships of three grass seedlings under water stress. Weed Biol. Manag. 6, 79–88. doi: 10.1111/j.1445-6664.2006.00197.x
Xu, B. C., Gichuki, P., Shan, L., and Li, F. M. (2006b). Aboveground biomass production and soil water dynamics of four leguminous forages in semiarid region, northwest China. S. Afr. J. Bot. 72, 507–516. doi: 10.1016/j.sajb.2006.01.005
Yang, F., Wang, X., Liao, D., Lu, F., Gao, R., Liu, W., et al. (2015). Yield response to different planting geometries in maize–soybean relay strip intercropping systems. J. Agron. 107, 296–304. doi: 10.2134/agronj14.0263
Zhang, F., and Li, L. (2003). Using competitive and facilitative interactions in intercropping systems enhances crop productivity and nutrient-use efficiency. Plant. Soil. 248, 305–312. doi: 10.1023/A:1022352229863
Keywords: amaranth, cowpea, intercropping, intercropping indices, yield justified, indent
Citation: Mndzebele B, Ncube B, Fessehazion M, Mabhaudhi T and Modi AT (2023) Assessment of the effects of NPK fertilizer on edible yield and agro-biological parameters in a cowpea–amaranth intercrop. Front. Sustain. Food Syst. 7:1210984. doi: 10.3389/fsufs.2023.1210984
Received: 08 May 2023; Accepted: 11 September 2023;
Published: 24 October 2023.
Edited by:
Priscilla Ntuchu Kephe, Potsdam Institute for Climate Impact Research (PIK), GermanyReviewed by:
Nompumelelo Thelma Mobe, Council for Scientific and Industrial Research (CSIR), South AfricaAlen Manyevere, University of Fort Hare, South Africa
Copyright © 2023 Mndzebele, Ncube, Fessehazion, Mabhaudhi and Modi. This is an open-access article distributed under the terms of the Creative Commons Attribution License (CC BY). The use, distribution or reproduction in other forums is permitted, provided the original author(s) and the copyright owner(s) are credited and that the original publication in this journal is cited, in accordance with accepted academic practice. No use, distribution or reproduction is permitted which does not comply with these terms.
*Correspondence: Buhlebelive Mndzebele, bW5kemViZWxlYm1AZ21haWwuY29t
 Buhlebelive Mndzebele
 Bhekumthetho Ncube
 Melake Fessehazion1
 Tafadzwanashe Mabhaudhi
 Albert Thembinkosi Modi