 Na Ta1
 Haicheng Wei
- 1School of Electrical and Information Engineering, North Minzu University, Yinchuan, Ningxia, China
- 2School of Medical Technology, North Minzu University, Yinchuan, Ningxia, China
An intelligent wine detection and traceability method based on infrared spec-troscopy and machine learning is proposed, in order to meet the needs of online rapid nondestructive testing of wine. On the basis of extracting infrared spectrum of wine, the principal component analysis (PCA) – support vector machine (SVM) model was modified by chemometrics. A total of 300 grape wine samples were collected from six production areas. The composition of the samples was analyzed by ultra performance liquid chromatography-quadrupole time-of-flight mass spectrometry (UPLC-Q-TOF-MS). According to the experimental results, indole, sulfacetamide and caffeine were selected as characteristics of different origins. Near infrared spectral wavelengths of wine samples were compressed between 900 and 2,500 nm. The ranges of 1,000 nm ~ 1,400 nm and 1,500 nm ~ 1800 nm were selected for PCA principal component analysis and key spectral wavelengths were extracted. The unsupervised learning model of SVM is used to classify and identify key spectral wavelengths. The experimental results show that the algorithm has higher classification accuracy than traditional PCA-LDA, PCA and other algorithms. The classification accuracy of the algorithm is improved from 98.3 to 99.75%. The improved PCA-SVM algorithm can achieve fast and loss-less source tracing of wine.
1. Introduction
Wines with unique geographic markers are favored by consumers and recognized by the market. Wine tracing technology is increasingly concerned with the improvement of people’s living standards (Tomic et al., 2017). However, traditional wine traceability detection has some problems, such as high price, complex operation and time-consuming analysis. Therefore, the development of the wine industry urgently needs to find a convenient and high-precision method to detect wine.
At present, the technology of wine origin tracing mainly depends on the chemical detection method. Based on the results of the characteristic components detected by gas chromatography or liquid chromatography, the statistical relationship between the origin and the characteristic components is established, in order to realize the wine origin identification (Souza Gonzaga et al., 2020). For example, Sudol et al. (2022) used two-dimensional gas chromatography-time-of-flight mass spectrometry to analyze the volatile components of five white ‘Grillo’ wines originating in Sicily, found the characteristic components that can characterize the geographical differences, and traced their origins. Šorgić et al. (2022) analyzed principal components of volatile compounds in Cabernet Sauvignon and Merlot wine samples and found that these compounds can be used for wine region identification. Pan et al. (2022) used the UPLC-QTOF-MS method to screen a total of 86 metabolites in positive and negative ion modes as markers for wine origin differentiation. Wang et al. (2023) used LC-IM-QTOF-MS and multivariate chemometrics methods to analyze the difference components in 114 Chinese production areas and wine samples for the division of origin and year.
The above chemometric methods have rigorous experimental conditions and are not suitable for large-scale range and sample detection. With the continuous development of spectral technology, the purpose of fast and convenient origin tracing can be achieved, by collecting spectra of grapes from different origins and finding the characteristic peaks of grapes from different origins (Kljusurić et al., 2022). In this respect, Daniel et al. (2015) established a discriminant model for 64 white wine samples from Australia and New Zealand by spectroscopy, with an accuracy of 86%. Hu et al. (2019) traced the origin of Cabernet Sauvignon wine by principal component analysis, SIMCA spectral modeling and discriminant analysis of infrared spectrum data from Australia, Chile and China.
In the above studies, although the spectral detection method is simple and easy to operate, it is still a difficult point to find the characteristic peaks from the massive spectral data. The detection accuracy is easily affected by environmental noise and cannot be improved. For this reason, an improved PCA-SVM algorithm is proposed based on a large number of experiments. First, the algorithm analyzes the near infrared spectral data collected from 900 to 2,500 nm. Then, the major chemical components corresponding to the spectral differences were found. Finally, the final confirmation was carried out using Ultra High Performance Liquid Chromatography-Quadrupole Time of Flight Mass Spectrometry (UPLC-Q-TOF-MS, Q-TOF) chemometrics. Based on the results of Q-TOF experiment, the input spectral range is compressed, the sensitive bands of the spectrum are selected for spectral eigenvector extraction, and the origin trace principal component spectrum is formed. The wine origin can be traced to a lower cost, more practical and more accurate source, by clustering the characteristic spectra of the principal components in the feature space.
2. Establishment of improved PCA-SVM spectral analysis model
The improved PCA-SVM model for feature extraction and origin traceability analysis of the collected near-infrared spectra of wine is shown in Figure 1.
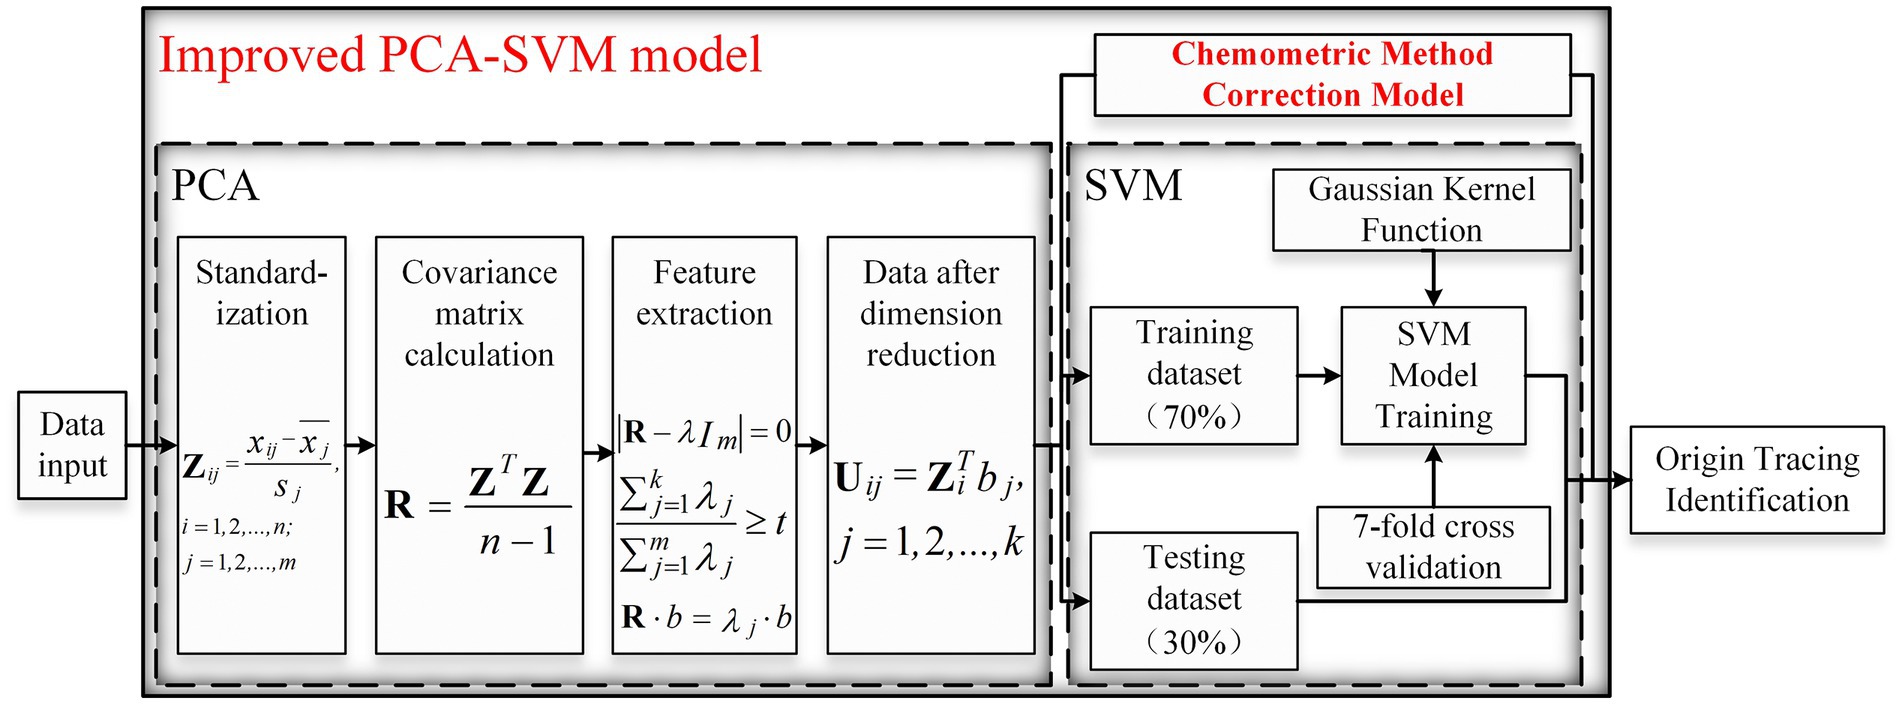
Figure 1. Improved PCA-SVM model.
The model uses the Principal Component Analysis (PCA) algorithm (Kandi and Linton, 2020) to filter the characteristic bands of near infrared spectral data. The goal of the PCA algorithm is to find components that reflect the main characteristics of things, compress the size of the original data matrix, reduce the dimensionality of the eigenvectors, and select the smallest dimension to summarize the most important features. The data space is compressed, and the features of multivariate data are visually represented in low-dimensional space, by principal component analysis. It can remove noise and redundancy, extract the main feature information from the data, and realize data dimension reduction (Usman Ali et al., 2017). PCA algorithm mainly includes standardization, covariance matrix, feature vector extraction, etc. The algorithm normalizes the input spectral data. The eigenvectors of the normalized data covariance matrix are calculated, and the n-dimensional eigenvectors are mapped to a brand new m-dimensional eigenvector with orthogonal properties. Keep the k eigenvectors that contribute the most to the m-dimensional eigenvectors to reduce the dimension of multidimensional data (Han et al., 2022). The main calculation steps of the algorithm are as follows:
1. Matrix standardization, calculating the eigenvectors and eigenvalues of co-variance matrix S;
2. Projecting data into the space generated by the eigenvectors to find the principal components.
The dimension-reduced feature data from PCA is used as a new input and fed into the Support Vector Machines (SVM) model for classification (Maldonado et al., 2018). SVM belongs to supervised machine learning, which can transform the non-linear data of principal component analysis into a linear classification in the feature space. Using a non-linear mapping, the data is mapped to the feature space, a linear learner is used in the feature space, and the classification function is distorted as formula (1):
The mapping of φ from the input space to a characteristic space in the formula; Then a linear learner is used to classify (Bzdok et al., 2018) in the feature space. The kernel function of the whole algorithm is trained using Gaussian kernel (box constraint level: 0.25, kernel scale mode: 998.67, standardize data: false), formula (2) as SVM algorithm.
Vector denotes the samples in the original space, and denotes the new vector after is mapped to the eigenvalue space. Then the segmented hyperplane corresponding to the non-linear SVM is: .
In order to ensure the accuracy of the final results, the algorithm uses k-fold cross-validation. The training set samples are divided into k groups on average. Each k-1 fold training is performed, and the other fold is used for validation. Each set of data is used as validation data to validate the recognition rate of the model and make up for the shortage of small sample training data (Veluchamy and Karlmarx, 2017).
On this basis, the model input is corrected by chemometrics, and the near infrared spectral data collected from 900 to 2,500 nm are analyzed. The main components corresponding to the spectral differences are found, and their corresponding spectral positions are confirmed by ultra-high performance liquid chromatography-quadrupole time-of-flight mass spectrometry (Q-TOF), and the whole spectrum is clipped. Near infrared spectroscopy data are collected for the wine samples to be measured according to their origin. The characteristic wavelength range is reduced, the weights of the analyzed spectral signals are strengthened, the proportion of useful signals is increased, and the improved PCA-SVM model based on the wine near infrared spectroscopy is implemented for origin identification.
3. Materials and methods
3.1. Wine sample collection
In order to verify the classification accuracy of the improved PCA-SVM model, wines from different origins are selected for relevant experiments and results analysis. In order to ensure that the results of the experiment are as free as possible from external factors, the wine samples used in the experiment are finished wines made from Cabernet Sauvignon and aged in oak barrels through temperature controlled fermentation. The selected wine samples are from six regions where it is difficult to trace the origin through tasting. The samples shown in Figure 2 are from six different production areas, namely, Chile and Turpan (Xinjiang), eastern foot of Helan mountain in Ningxia (Hongsibu and Zhenbeibu), Changli (Hebei), and Yantai (Shandong). There are 50 samples in each production area, totaling 300 samples.
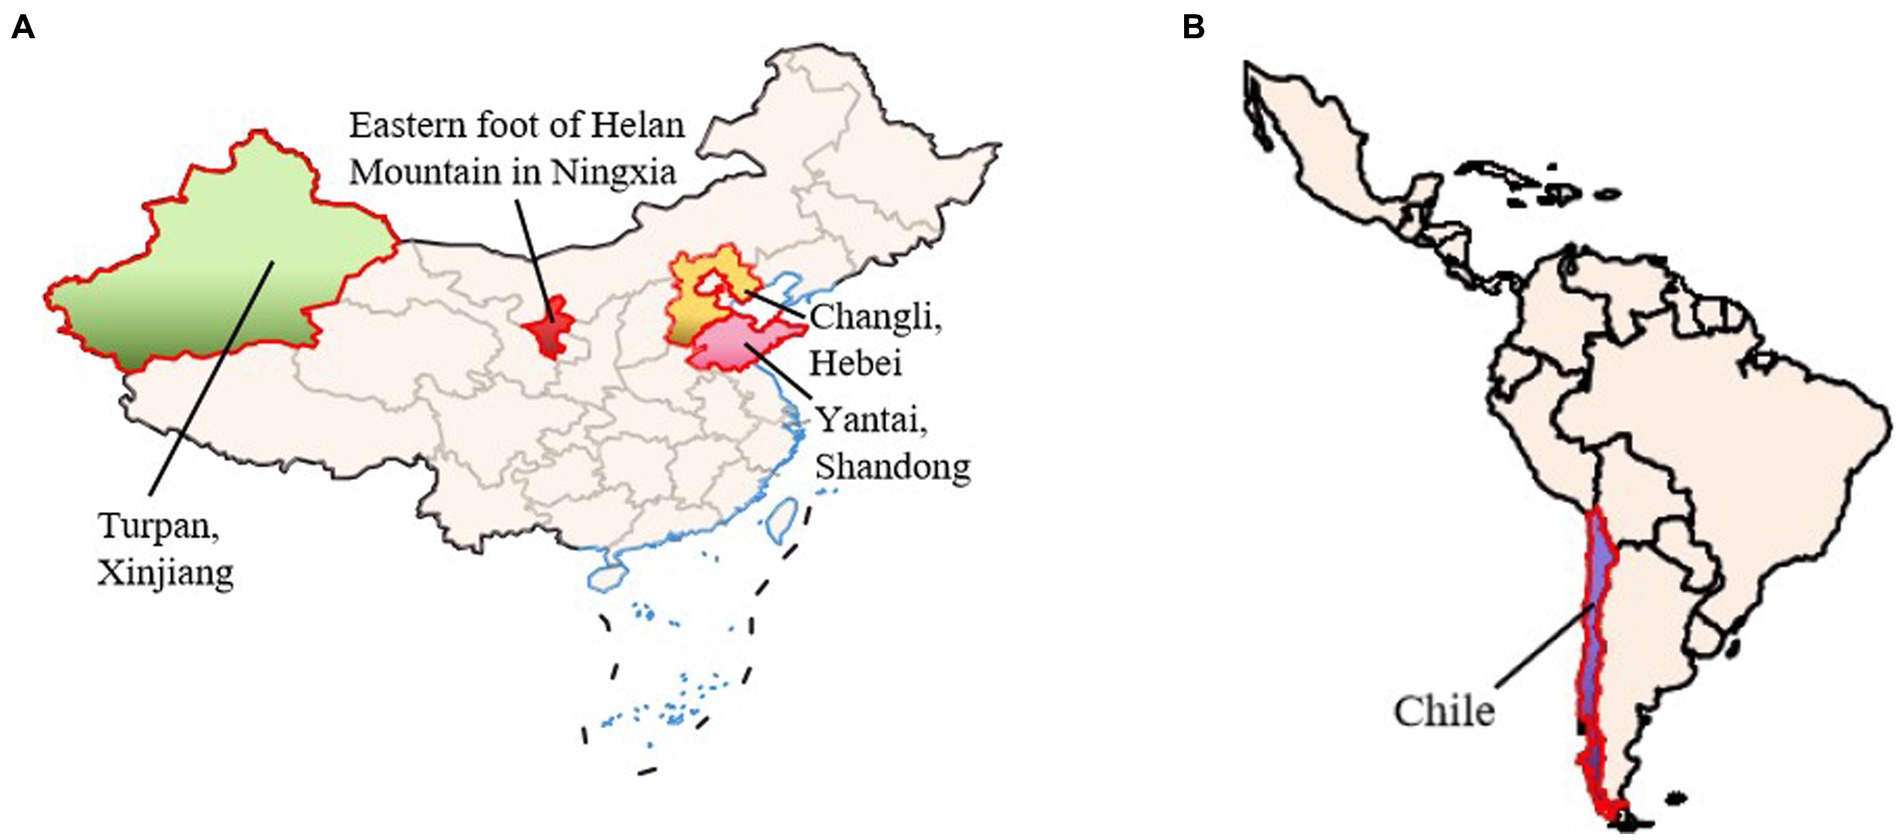
Figure 2. Schematic diagram of wine sample source. (A) Wine region map of China (Shandong, Hebei, Xinjiang and Ningxia). (B) Wine region map of abroad (Chile).
3.2. Wine near infrared spectrum collection device
The NIR test platform is composed of NIR2500 (Ideaoptics Instruments Co., Ltd., China), HL2000-12 halogen light source, RIB-600-NIR direct optical fiber, R4 color dish spectral measuring stand and Morpho spectral acquisition software. The RIB-600-NIR direct optical fiber is used for optical transmission. The wave-length range of the spectrometer is 900 nm ~ 2,500 nm, the signal-to-noise ratio is 7,500:1, and the integration time is 1 ms ~ 120 s.
The experiment is carried out in a constant temperature and humidity environment. The wine samples are opened after 10 min’ rest, placed in a 10 mm quartz cell, and the wine samples are collected using a near-infrared spectroscope. The wavelength range of the near-infrared spectrum collected by the wine samples ranged from 900 nm to 2,500 nm, and the acquisition time of each spectral scan is 10 s. The spectrum collection time of all samples is 50 min in total.
3.3. UPLC-Q-TOF-MS experimental method
The Q-TOF equipment used in the experiment is Agilent High Resolution Liquid Mass Spectrometry (HRLC-MS) system (Agilent Technologies, Santa Clara, CA, United States). The main components of wine are extracted and analyzed by MassHunter B.06.00 (Agilent Technologies, Inc. 2006–2019, Santa Clara, CA, United States) and Mass Profiler Professional 12.5 software (Agilent Technologies, Santa Clara, CA, United States). The experiment uses the same bottle for all the samples according to the same protocol and collects the spectrum in the same environment.
The experimental methods are as follows: Firstly, 1 mL sample is accurately measured in a 1.5 mL centrifugal tube, centrifuged at 4°C for 10 min at 10,000 rpm, and passed through 0.22 μM Microporous filter, on-machine detection. The chromatographic column is Agilent Eclipse Plus C18 (3 × 150 mm, 1.8 μM). Column temperature: 40°C; Automatic sampler temperature: 4°C; Input: 2 μL; Flow rate: 0.3 mL/min; Column balance time: 0.5 mL/min; Analysis time: 20 min. The mobile phase is 5 mmol/L ammonium formate aqueous phase and methanol phase.
In each data collection cycle, parent ions with an intensity greater than 5,000 are screened. TOF-MS scan time is 150 ms, quality detection range is 50–1,000 Da, collected in HighSensitivity mode.
3.4. Statistical method
Statistical analysis was performed using SPSS software (Version19.0, SPSS Inc., Chicago, IL, United States). On the basis of normal distribution test and variance homogeneity analysis of the data, independent sample t-test is carried out to show the significance of the results. When the value of p is less than 0.05, it is considered to be statistically significant.
4. Results
The near infrared spectrum of the wine collected is shown in Figure 3. The original spectral data is normalized, and the singular value decomposition is used for principal component analysis. The components with the largest variance and the largest amount of information are retained, and the contribution ratio is calculated. For dimension reduction of PCA data, the modeling accuracy is judged by the model determination factor Rc2. The closer the model determination factor approaches 1, the better the model fits. The selection of principal components is mainly based on the contribution ratio of each component (Clary et al., 2021). At the same time, the correlation coefficient is used to filter the sensitive spectral bands, eliminating the collinearity between spectral variables.
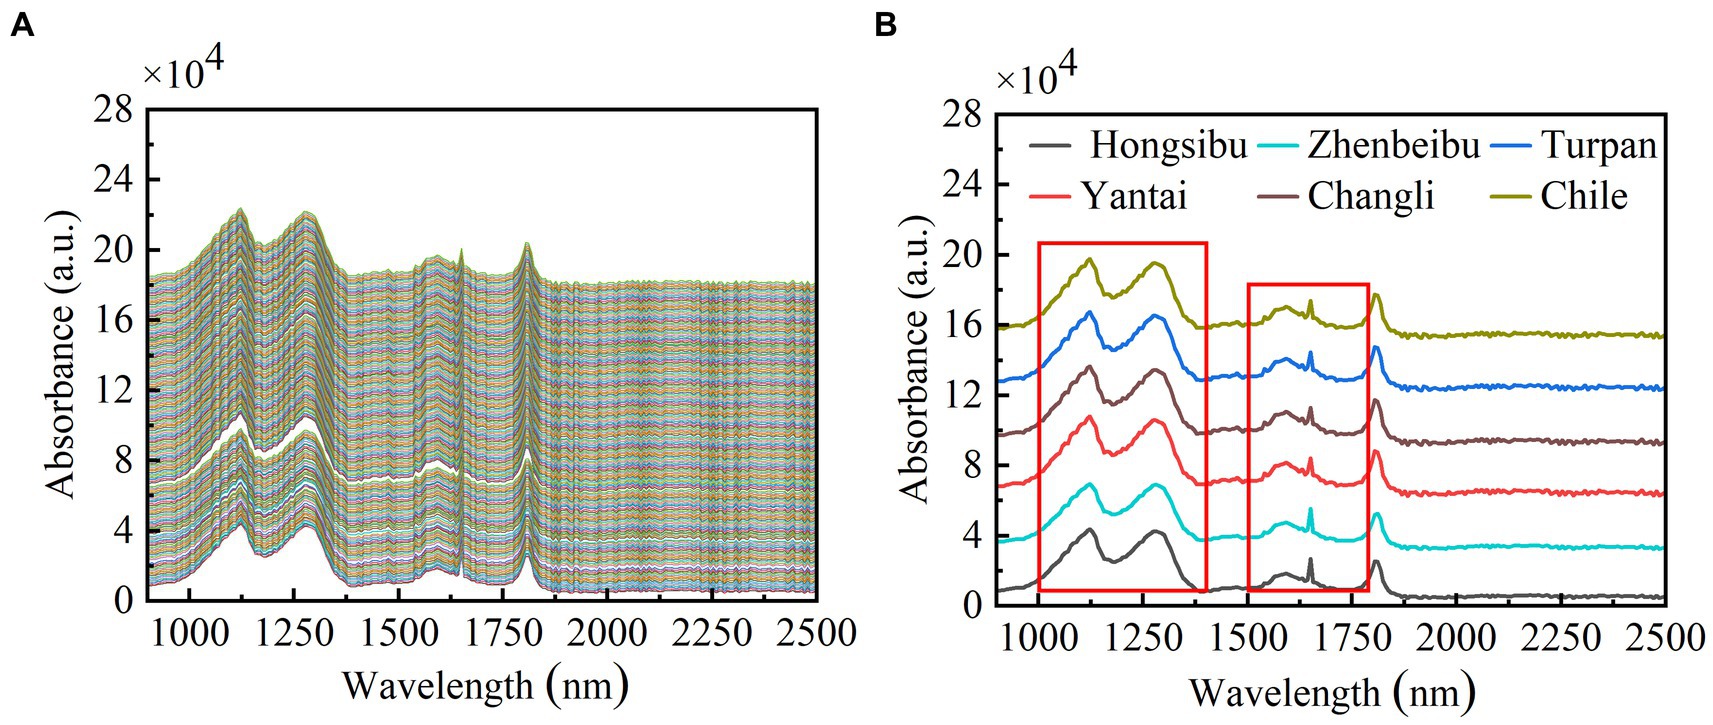
Figure 3. NIR spectroscopy of wine samples. (A) Near infrared spectroscopy of all wine samples. (B) Average spectral diagram of wine samples from each production area.
The NIR data of grape wine are collected in 256 dimensions. After principal component analysis, 9 principal components with 93.37% contribution are selected, and the coefficient of determination is 0.824. The cumulative contribution of principal component 1 (PC1), 2 (PC2) and 3 (PC3) is 88.72% when the spectral data are reduced by PCA. The greater the dispersion of sample data points, the greater the difference of near infrared spectra among different wine producing areas. As shown in Figure 4, the near infrared spectral data of grapes from different regions are significantly clustered. Wines from foreign and domestic regions are distributed in different regions, indicating that the near infrared spectra of different wines from different regions are different.
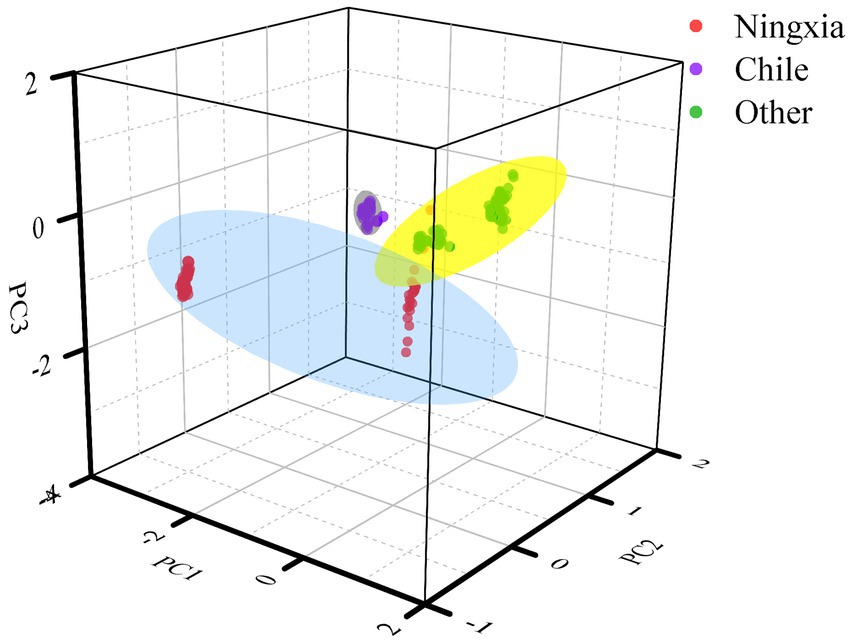
Figure 4. Principal component analysis diagram. Among them, Ningxia represents the wine samples of Hongsibu and Zhenbeibu production areas; other include the wine samples of Hebei, Shandong and Xinjiang production areas.
In order to further improve the accuracy, a SVM algorithm with Gaussian kernel as the kernel function is selected for the origin classification. Considering both computational efficiency and recognition accuracy, the cross-validation value k in SVM algorithm is set to 7. The model takes 4.35 s and the spectral recognition accuracy can reach 98.3%. The accuracy of PCA-SVM model has reached more than 95%, but the reliability of model classification accuracy has not been verified. Therefore, it is necessary to verify the reliability of the model through the Q-TOF experimental results and on this basis, in order to refine the PCA-SVM model further.
In Section 3.3, in accordance with the Q-TOF method described, the chemical composition of the precipitated grape wine samples from six producing areas is analyzed differently. The main differential metabolite analysis results are shown in Table 1. The results of Q-TOF experiments show that the three characteristic sub-stances that can distinguish the wine producing areas of the experimental samples are indole, sulfacetamide and caffeine. SPSS 19.0 software is used to perform t-test on the extracted substances. When the value of p is less than 0.05, there is a significant difference. The p-values of indole, sulfonamide and caffeine are 0.03, 0.02 and 0.05, respectively. The results show that these three substances can be used as characteristic components of experimental wine samples.
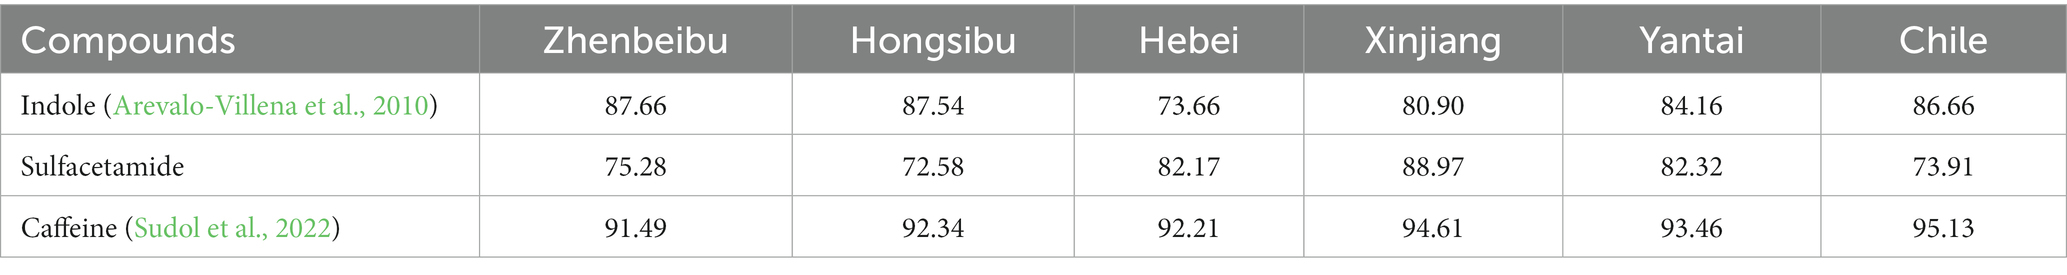
Table 1. Mass spectral peak areas of wine metabolites from different origins.
In order to further narrow the range of characteristic wavelength, three characteristic components obtained from Q-TOF experiments are analyzed in this paper. Among them, indole is an aromatic heterocyclic organic compound, which has a bicyclic structure in the chemical structure formula, including a six-membered benzene ring and a five-membered pyrrole ring containing nitrogen (Mir et al., 2021). Because the lone pairs of electrons of nitrogen participate in the formation of aromatic rings, indole is an imine with weak alkalinity. Therefore, it is possible that the substance exists in the range of 1,000 to 1,400 nm according to the IR major functional group control table. Based on the analysis of the IR major functional group control table, it is known that sulfacetamide may exist in the band (Agbonkonkon et al., 2021) from 1,000 nm to 1,400 nm. Caffeine is an alkaloid compound of methylxanthine with a spectrum ranging from 1,500 nm to 1,800 nm.
On this basis, the near-infrared spectral wavelength ranges of wine samples are further compressed. As shown in Figure 5, the near-infrared spectral wavelength ranges are set as characteristic region 1 (1,000 nm ~ 1,400 nm) and characteristic region 2 (1,500 nm ~ 1,800 nm). The classification accuracy of the input spectral data is compared among the four models. When the input range of the model is reset and the dimensionality of PCA data is reduced again, the model determinant increases from 0.824 to 0.928. This method improves the accuracy of the model while making it more suitable for the identification and classification of near infrared spectra of wine samples. Moreover, the corrected model accuracy has been improved.
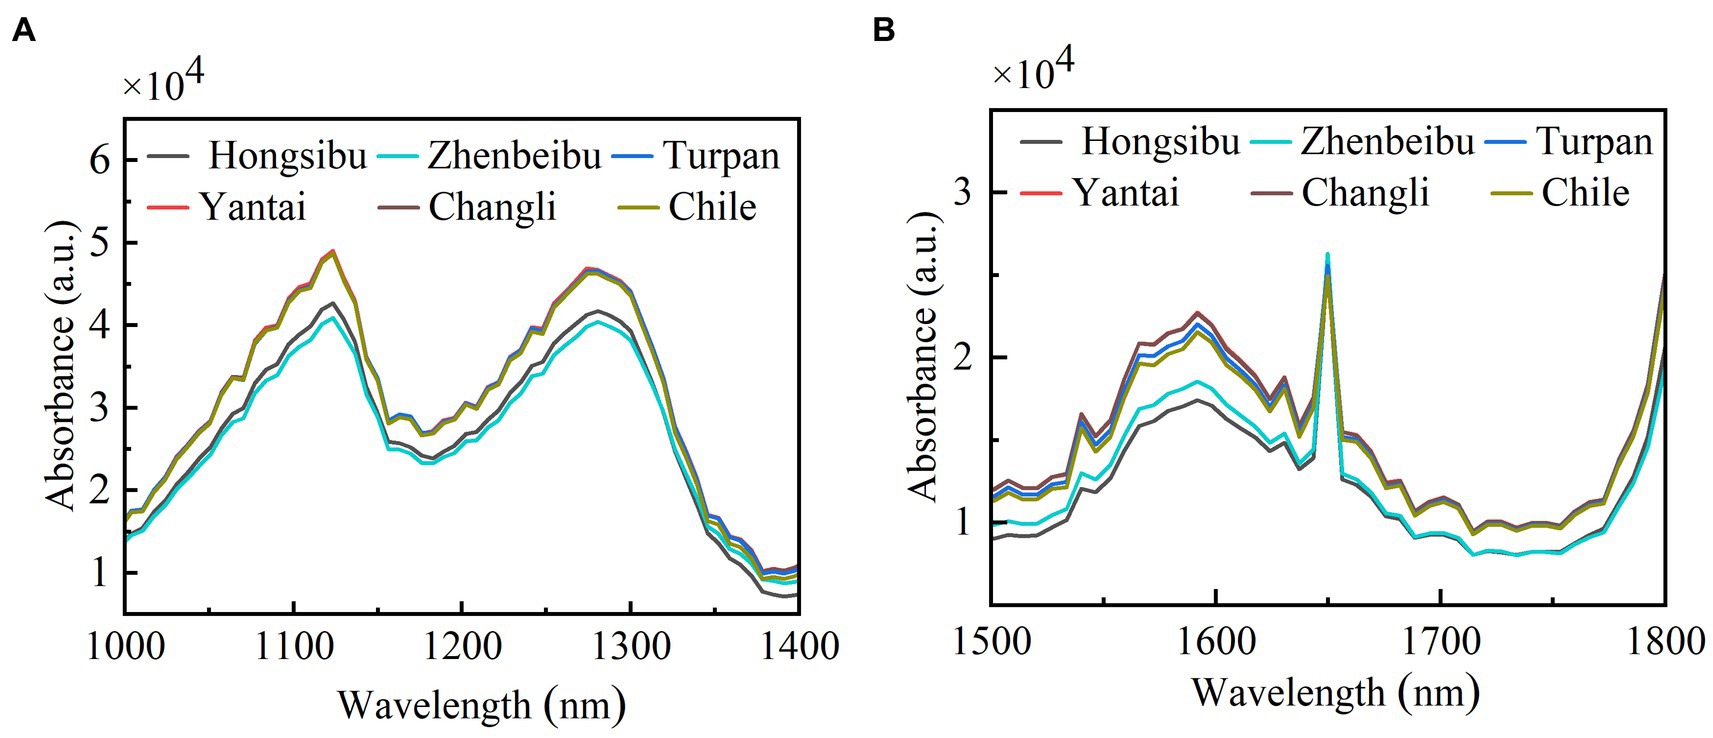
Figure 5. Characteristics of near infrared spectra from different origins. (A) Characteristic region 1 spectrogram (1,000 nm ~ 1,400 nm); (B) Characteristic region 2 spectrogram (1,500 nm ~ 1800 nm).
Figure 6 shows that when the input spectrum is in the same wavelength range, the improvement of model accuracy by PCA dimension reduction fluctuates from 0.1 to 7.8%. When the characteristic wavelength is used as the model input data, the same model accuracy is improved by 1.45 to 16.65%. Therefore, the classification accuracy of the model modified by chemometrics method is doubled compared with the model processed by traditional PCA method. Through in-depth analysis of the different input spectra, it is found that when full spectral data is input, several origin tracing accuracy is not high when using LDA and SVM models alone. Using principal component analysis, the accuracy of the model is significantly improved, with the recognition accuracy of PCA-LDA model increased by 7.8%, and that of PCA-SVM model increased by 0.5%, as shown in Table 2. The spectral characteristic bands are selected by Q-TOF experimental results, and the recognition accuracy of the whole model is improved significantly. The classification accuracy of LDA increased by 16.65% and that of PCA-LDA model by 8.85%. The PCA-SVM model can increase the recognition accuracy to 99.75%. It is able to distinguish wines from these six regions accurately and conveniently using near-infrared spectral data of short wavelengths.
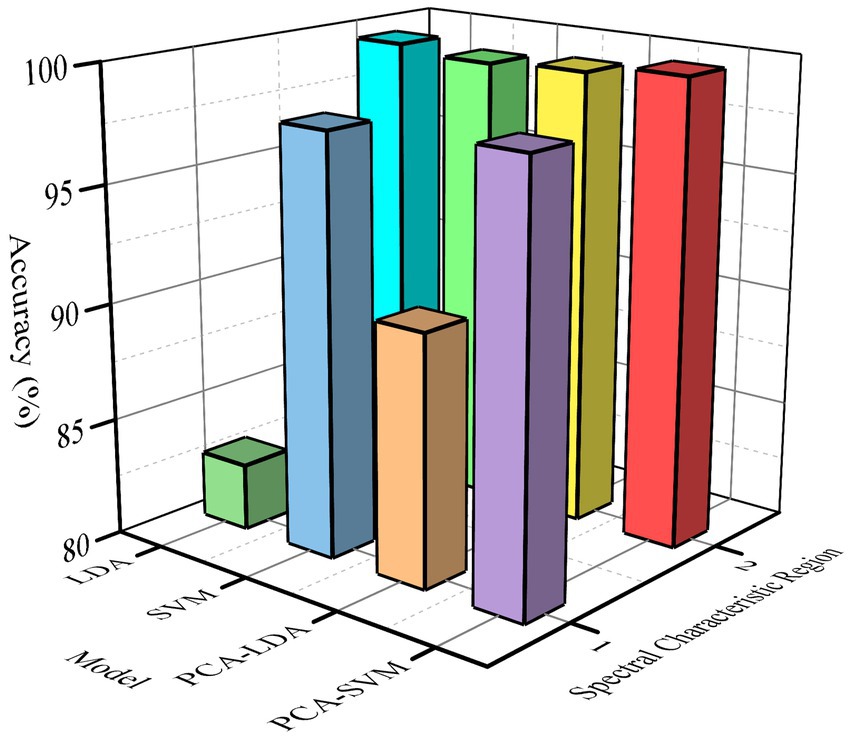
Figure 6. Comparison of accuracy of different models before and after Correction.
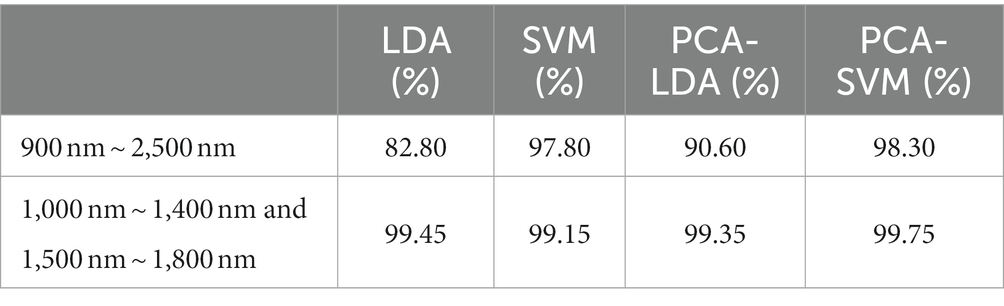
Table 2. Comparing accuracy of different models.
The above experimental results show that the improved algorithm of chemo-metric method and PCA-SVM model fusion. Not only can the accuracy of classification and recognition be improved, but also the detection range can be reduced, thus shortening the running time of the algorithm and improving the detection efficiency. Origin tracing based on the near infrared spectral characteristics of wine can be achieved using an improved PCA-SVM model with fused chemometrics.
5. Discussion
Wine origin tracing technology is of great importance. Effective Traceability Technology and detection method can not only improve the quality of wine, but also improve economic efficiency. Therefore, the application of information technology in this field can simplify the operation of traditional traceability technology, and the incorporation of chemometrics schools can compensate for the low accuracy of models. With the continuous development of information technology and chemical detection methods, many scholars have made more and more in-depth research on these two aspects. In terms of information technology based detection, Basalekou et al. (2020) used FT-IR to trace the origin of wine, in which PCA and statistical methods were used to analyze the differences between different production zones. Although the origin of wine has been distinguished from the perspective of information technology, further analysis has not been conducted based on the differential components of the wine itself. In traditional chemical methods, Vitali Čepo et al. (2022) used isotope analysis to effectively distinguish wines from different regions. Although chemical analysis can obtain accurate classification results, the real-time and convenience of this method are not good, which restricts the large-scale application of this technology. In recent years, the technology of chemical detection has been continuously improved, and more differential substances can be detected. But the detection technology has not significantly improved in terms of time and price costs. The emergence of near-infrared technology has greatly saved detection time and reduced detection costs, but its accuracy has been questioned by professionals. In this context, a new method for fusing the advantages of spectral techniques and chemical detection is presented in this paper.
Among, near infrared spectroscopy reflects the frequency doubling and combination of the base frequency vibrations of molecules with hydrogen groups as the dominant group (Xu et al., 2022). Near-infrared scanning of the sample can obtain the near-infrared absorption intensity of the vibration and combination frequencies of each molecule, obtain the characteristic information of organic molecules, and analyze the composition of the sample (Claudia et al., 2021). Near infrared spectroscopy analysis technology is widely used in the field of rapid analysis because of its advantages of fast analysis, no chemical pollution to samples, high operability of detection de-vices, high accuracy of measurement and low cost of analysis (Hernández-Hernández et al., 2020). Taking wine analysis as an example, different light, water and soil conditions make the components of wine grapes slightly different. This results in different substances being produced during the fermentation process. Because near infrared spectroscopy can characterize the chemical bond information contained in wine components, different spectral segments contain different components.
Nevertheless, near infrared spectroscopy still has some drawbacks, spectral noise is not good for screening sensitive bands, and data redundancy increases the amount of computation. To solve these problems, this study first uses unsupervised Principal Component Analysis (PCA) to reduce the dimension of the original spectral data. On the basis of preserving the original information conditions, the model uses the method of dimension reduction to concentrate the data characteristics of multiple dimension spaces into the main components. The interference in near infrared spectral acquisition is reduced and the speed of model calculation is improved. At the same time, the Gaussian kernel is chosen as the kernel function of the support vector machine, which has only one parameter and saves running time. In addition, the model was corrected by high performance liquid chromatography quadrupole time-of-flight mass spectrometry chemical detection to verify the reliability of the model. The accuracy of the model was increased to 0.924, which improved the fitness of the model data and further refined the near-infrared input spectral range. The original 900 nm ~ 2,500 nm spectrum was reduced to 1,000 nm ~ 1,400 nm and 1,500 nm ~ 1800 nm, removing a large amount of redundant data of near infrared spectrum. The modified spectral data as a new input to the model can avoid dimension disasters to some extent and enhance the robustness of the improved algorithm.
Since the chemometric analysis can be done ahead of time, when the whole model is established, the above methods can be used to detect the spectrum data of wines from different origins on-line nondestructively. This method can be used to identify the origin of wine with low data volume and high accuracy, and to establish a rapid detection method for the origin of wine to be measured.
6. Conclusion
The results show that spectral detection and chemometric methods are combined, near infrared spectral detection technology is used to collect spectral data of wine from different production areas, and high performance liquid chromatography quadrupole time-of-flight mass spectrometry is used to select sensitive data segments. This method can help to further improve the accuracy of principal component analysis of the model and eliminate the small weight data in the whole spectral data. It is easy to extract spectral features that have a greater impact on the analysis results. The above methods can improve the accuracy of PCA-SVM model classification and recognition, and achieve up to 99.75% classification accuracy.
Data availability statement
The original contributions presented in the study are included in the article/supplementary material, further inquiries can be directed to the corresponding author.
Author contributions
All authors listed have made a substantial, direct, and intellectual contribution to the work and approved it for publication.
Funding
This research was funded by the Natural Science Foundation of Ningxia, grant number 2022AAC03224, National Natural Science Foundation of China, grant number 61861001, and Postgraduate education reform project of Ningxia Autonomous Region, grant number 2021-34. Ningxia Technology Innovative Team of advanced intelligent perception and control, leading talent project plan of the State Ethnic Affairs Commission.
Conflict of interest
The authors declare that the research was conducted in the absence of any commercial or financial relationships that could be construed as a potential conflict of interest.
Publisher’s note
All claims expressed in this article are solely those of the authors and do not necessarily represent those of their affiliated organizations, or those of the publisher, the editors and the reviewers. Any product that may be evaluated in this article, or claim that may be made by its manufacturer, is not guaranteed or endorsed by the publisher.
References
Agbonkonkon, N., Wojciechowski, G., Abbott, D. A., Gaucher, S. P., Yim, D. R., Thompson, A. W., et al. (2021). Faster, reduced cost calibration method development methods for the analysis of fermentation product using near-infrared spectroscopy (NIRS). J. Ind. Microbiol. Biotechnol. 48, 5–6. doi: 10.1093/jimb/kuab033
Arevalo-Villena, M., Bartowsky, E. J., Capone, D., and Sefton, M. A. (2010). Production of indole by wine-associated microorganisms under oenological conditions. Food Microbiol. 27, 685–690. doi: 10.1016/j.fm.2010.03.011
Basalekou, M., Pappas, C., Tarantilis, P. A., and Kallithraka, S. (2020). Wine authenticity and traceability with the use of FT-IR. Beverages 6:30. doi: 10.3390/beverages6020030
Bzdok, D., Krzywinski, M., and Altman, N. (2018). Machine learning: supervised methods. Nat. Methods 15, 5–6. doi: 10.1038/nmeth.4551
Clary, W., Worthington, L., Scuderi, L., Gulick, S. P. S., and Scudiero, E. (2021). Quantifying the relative influence of ice sheets, faults, and instability on channel and gully cross-profile shapes in the Gulf of Alaska. Mar. Geol. 435:106416. doi: 10.1016/j.margeo.2020.106416
Claudia, G. V., Sigfredo, F., and Carmen, H.-B. (2021). Smart detection of faults in beers using near-infrared spectroscopy, a low-cost electronic nose and artificial intelligence. Fermentation 7:117. doi: 10.3390/fermentation7030117
Daniel, C. (2015). The role of visible and infrared spectroscopy combined with chemometrics to measure phenolic compounds in grape and wine samples. Molecules 20, 726–737. doi: 10.3390/molecules20010726
Han, Y., Wang, C., Zhang, X., Li, X., and Gao, Y. (2022). Characteristic volatiles analysis of Dongbei Suancai across different fermentation stages based on HS‐GC‐IMS with PCA. J. Food Sci. 87, 612–622. doi: 10.1111/1750-3841.16045
Hernández-Hernández, C., Fernández-Cabanás, V. M., Rodríguez-Gutiérrez, G., Bermúdez-Oria, A., and Morales-Sillero, A. (2020). Viability of near infrared spectroscopy for a rapid analysis of the bioactive compounds in intact cocoa bean husk. Food Control 120:107526. doi: 10.1016/j.foodcont.2020.107526
Hu, X. Z., Liu, S. Q., Li, X. H., Wang, C. X., Ni, X. L., Liu, X., et al. (2019). Geographical origin traceability of cabernet sauvignon wines based on infrared fingerprint technology combined with chemometrics. Sci. Rep. 9, 1–9. doi: 10.1038/s41598-019-44521-8
Kandi, S., and Linton, C. A. (2020). Grape skin extracts as a sustainable source of antioxidants in an oil-in-water emulsion: an alternate natural approach to synthetic antioxidants using principal component analysis. Int. J. Food Sci. Technol. 56, 1937–1945. doi: 10.1111/IJFS.14825
Kljusurić, J. G., Boban, A., Mucalo, A., and Budić-Leto, I. (2022). Novel application of NIR spectroscopy for non-destructive determination of ‘Maraština’ wine parameters. Foods 11:1172. doi: 10.3390/foods11081172
Maldonado, S., Merigó, J., and Miranda, J. (2018). Redefining support vector machines with the ordered weighted average. Knowl. Based Syst. 148, 41–46. doi: 10.1016/j.knosys.2018.02.025
Mir, R. H., Mohi-ud-din, R., Wani, T. U., Dar, M. O., Shah, A. J., Lone, B., et al. (2021). Indole: a privileged heterocyclic moiety in the management of Cancer. Curr. Org. Chem. 25, 724–736. doi: 10.2174/1385272825666210208142108
Pan, Y., Gu, H. W., Lv, Y., Yin, X. L., Chen, Y., Long, W., et al. (2022). Untargeted metabolomic analysis of Chinese red wines for geographical origin traceability by UPLC-QTOF-MS coupled with chemometrics. Food Chem. 394:133473. doi: 10.1016/j.foodchem.2022.133473
Šorgić, S., Sredović Ignjatović, I., Antić, M., Šaćirović, S., Pezo, L., Čejić, V., et al. (2022). Monitoring of the wines’ quality by gas chromatography: HSS-GC/FID method development, validation, verification, for analysis of volatile compounds. Fermentation 8:38. doi: 10.3390/fermentation8020038
Souza Gonzaga, L., Capone, D. L., Bastian, S. E. P., Danner, L., and Jeffery, D. W. (2020). Sensory typicity of regional Australian cabernet sauvignon wines according to expert evaluations and descriptive analysis. Food Res. Int. 138:109760. doi: 10.1016/j.foodres.2020.109760
Sudol, P. E., Galletta, M., Tranchida, P. Q., Zoccali, M., Mondello, L., and Synovec, R. E. (2022). Untargeted profiling and differentiation of geographical variants of wine samples using headspace solid-phase microextraction flow-modulated comprehensive two-dimensional gas chromatography with the support of tile-based fisher ratio analysis. J. Chromatogr. A 1662:462735. doi: 10.1016/j.chroma.2021.462735
Tomic, N., Kokovic, J., Jaksic, D., Ninkov, J., Vasin, J., Malicanin, M., et al. (2017). Terroir of the tri Morave wine region (Serbia) as a basis for producing wines with geographical indication. Geogr. Pannonica 21, 166–178. doi: 10.5937/GeoPan1703166T
Usman Ali, M., Ahmed, S., Ferzund, J., Mehmood, A., and Rehman, A. (2017). Using PCA and factor analysis for dimensionality reduction of bio-informatics data. Int. J. Adv. Comput. Sci. Appl. 8, 415–426. doi: 10.14569/IJACSA.2017.080551
Veluchamy, S., and Karlmarx, L. R. (2017). System for multimodal biometric recognition based on finger knuckle and finger vein using feature-level fusion and k-support vector machine classifier. IET Biom. 6, 232–242. doi: 10.1049/iet-bmt.2016.0112
Vitali Čepo, D., Karoglan, M., Borgese, L., Depero, L. E., Marguí, E., and Jablan, J. (2022). Application of benchtop total-reflection X-ray fluorescence spectrometry and chemometrics in classification of origin and type of Croatian wines. Food Chem. X 13:100209. doi: 10.1016/j.fochx.2022.100209
Wang, Z., Chen, X., Liu, Q., Zhang, L., Liu, S., Su, Y., et al. (2023). Untargeted metabolomics analysis based on LC-IM-QTOF-MS for discriminating geographical origin and vintage of Chinese red wine. Food Res. Int. 165:112547. doi: 10.1016/j.foodres.2023.112547
Keywords: wine, component tracing, near infrared spectroscopy, principal component analysis, PCA-SVM model, Q-TOF
Citation: Ta N, Wei H, Hu Z, Cao X and Xiao M (2023) Wine component tracing method based on near infrared spectrum fusion machine learning. Front. Sustain. Food Syst. 7:1197508. doi: 10.3389/fsufs.2023.1197508
Edited by:
Xiao-Hua Zhang, Xuchang Univerisity, ChinaReviewed by:
Seyed-Hassan Miraei Ashtiani, Ferdowsi University of Mashhad, IranXiao-Li Yin, Yangtze University, China
Copyright © 2023 Ta, Wei, Hu, Cao and Xiao. This is an open-access article distributed under the terms of the Creative Commons Attribution License (CC BY). The use, distribution or reproduction in other forums is permitted, provided the original author(s) and the copyright owner(s) are credited and that the original publication in this journal is cited, in accordance with accepted academic practice. No use, distribution or reproduction is permitted which does not comply with these terms.
*Correspondence: Haicheng Wei, d2VpX2hjQG51bi5lZHUuY24=