 Xinlei Yan1†
 Nafei Yang1†Baiting Chen1Jing Miao1Jiaqi Guo1
 Yufei Sun1Jing Wang2Wenhui Guo1Xiujuan Zhang3Feiyun Yang1*Ruigang Wang4*
- 1College of Food Science and Engineering, Inner Mongolia Agricultural University, Hohhot, China
- 2Agriculture and Animal Husbandry Technology Extension Center, Hohhot, China
- 3The Institute of Biotechnology, Inner Mongolia Academy of Science and Technology, Hohhot, China
- 4College of Life Sciences, Inner Mongolia Key Laboratory of Plants Adversity Adaptation and Genetic Improvement in Cold and Arid Regions of Inner Mongolia, Inner Mongolia Agricultural University, Hohhot, China
Hibiscus manihot L. seed oil is an emerging high-value edible vegetable oil that also has a variety of important health functions, and concerns about its pressing method have great significance for commercial and consumer health. This study compared triacylglycerols (TAGs), diacylglycerol (DAG), free fatty acids (FFAs), and volatile flavor compounds for discriminating cold-pressed oil from hot-pressed oil. The profiles of TAGs, DAGs, FFAs, and flavor compounds were established by a lipidomic approach and electronic-nose (E-nose). Our results demonstrated that a slight decrease in TAG content and a significant increase in FFA and DAG contents were observed after roasting. The E-nose results showed that sulfides, terpenes, methane, compounds containing oxygen and nitrogen, alcohol and aromatic compounds greatly influenced the oil flavor. The PCA result of the E-nose data indicated that flavor compounds showed great promise for distinguishing the two samples. The quality indices and the oxidative stability of oil samples were detected to identify their nutritional value and edible quality. This study revealed that roasting greatly influenced the lipid and flavor substances of the Hibiscus manihot L. seed oil. Our findings could provide useful information on the impact of the pressing method for Hibiscus manihot L. seed oil.
1. Introduction
Hibiscus manihot L., a Malvaceae, Abelmoschus annual herb, is widely distributed in China, India and other Southeast Asian countries and has the highest nutritional and commercial value among over 200 species of Abelmoschus genus. Hibiscus manihot L. is highly resilient and has low requirements for its growth environment. With cultivation, Hibiscus manihot L. has become a potential cash crop in China (Qiu and Song, 2012). Hibiscus manihot L. flowers possess various medicinal, culinary, health, and other beneficial properties, with its main active components being flavonoids and polysaccharides (Lai et al., 2007; Cui et al., 2020). Different tissues of Hibiscus manihot L., such as roots, stems, leaves and flowers, are rich in proteins, polysaccharides, organic acids, vitamins, minerals, flavonoids, polyphenols, and other nutrients (Gunawan et al., 2016). Because of the abundant nutrients and active components in different organs, Hibiscus manihot L. has wide application prospects and high economic value (Qiu et al., 2017). Hibiscus manihot L. seeds are mature black seeds in a pod that are the size of mung beans. It is rich in amino acids and unsaturated fatty acids, and the total amount of unsaturated fatty acids can reach over 65%. It regulates blood lipids, lowers blood pressure and protects the liver. According to preliminary laboratory tests, its oil content can reach approximately 20%. Therefore, Hibiscus manihot L. is poised to become a highly promising economic crop.
It is well known that vegetable oil is a basic pillar of the daily diet. For health reasons, most people concentrate on healthy oil (Wang et al., 2021; Li et al., 2022). Vegetable oil is indispensable in daily life, and its nutritional value is different because of its lipid type and content (Mikolajczak et al., 2021). Nevertheless, production methods and conditions could impact the bio-active components of the oils. There are two main methods of mechanical expression: cold-pressing and hot-pressing. Cold-pressed oils’ quality and nutritive value are affirmed to be better than the thermal-pressed oils’ and the solvent-processed oils’, although its oil yield is lower (Ren et al., 2019). The pity is the low yield of the oils impedes the commercial viability of the method. Heat pretreatment of the oilseeds, for instance, baking or microwave treatment, might distinctly raise the oil yield (Azadmard-Damirchi et al., 2010). Multiple researches have shown that baking could expedite the Maillard reaction, increase the oilseeds’ flavor, and improve the oil quality (Lai et al., 2007; Durmaz and Gokmen, 2011; Suri et al., 2020). In addition, some vegetable oils have antibacterial effect on many microorganisms, which can be used in the food and pharmaceutical industries (Petropoulos et al., 2021; Durazzo et al., 2021). TAG, phospholipids (PLs), and other particular kinds of lipid compounds are the most important ingredients of Hibiscus manihot L. seed oils, and the influence of baking on these lipid compounds was not quite clear.
In this context, UPLC-QTOF-MS (Ultra performance liquid chromatography – quadrupole – time of flight – mass spectrometry) was used to characterize the lipid composition of Hibiscus manihot L. cold-pressed oils and hot-pressed oils and to analyze the differences in lipid composition, and gas chromatography (GC) was used to identify the fatty acid composition of these two oil samples. With these techniques, the effect of roasting treatment of Hibiscus manihot L. seeds on the contents of TAGs, DAGs, and FFAs of the Hibiscus manihot L. seed oil was investigated. Furthermore, E-nose headspace injection and PCA clustering analysis were used to explore the main olfactory response values of the cold-pressed oil and the hot-pressed oil. This study provided a foundation for the commercial application of Hibiscus manihot L. seed oil and offered a theoretical basis for further research and utilization on cold-pressed and hot-pressed oil.
2. Materials and methods
2.1. The oil samples acquisition
The Hibiscus manihot L. seeds were harvested from the experimental base of Inner Mongolia Academy of Science and Technology. Hibiscus manihot L. seeds were stored in dry, ambient temperature warehouse. The cold-pressed oil (Hm) was produced using the cold-pressing mode of a household oil pressing machine (ZYJ 9018, Jiangmen Bestday Electric Co. Ltd, China). And the hot-pressed oil (HmB) was produced with hot-pressing mode. The crude oil was collected in clean centrifuge tubes, then centrifuged at 2655 g for 10 minutes. The clear oil was poured into a glass container, and the oil yield was calculated by weight (%). Hibiscus manihot L. seed oil samples were stored −20°C and analyzed within 2 weeks.
2.2. Fatty acid composition and content detection
For the cold-pressing oil, the seeds were used to extract directly. As for the hot-pressing oil, the seeds were roasted in an oven at 160°C for 10 min, then extracted with the same way. Fatty acid (FA) composition and content were studied by derivatization to their methyl esters, which was consistent with the method described in Yang’s article (Yang et al., 2022). The gas chromatography flame ionization detector (GC-FID; Agilent 7890A, Palo Alto, CA, USA) coupled with a capillary column (FFAP, 30 m, 0.25 mm i.d., 0.5 μm film thickness) was used. The relative percentage of individual fatty acid was expressed as percentage of total lipids (%) by comparing retention time and peak area with standard. Statistical analysis of the differences between the oil samples was performed using SPSS Statistics software 25.0, where p<0.05 indicated significant differences.
2.3. Lipid extraction and analysis by UPLC-QTOF-MS
For the cold-pressing oil, the seeds were extracted directly. As for the hot-pressing oil, the seeds were roasted in an oven at 160°C for 10 min. Place the seeds in 4 mL of preheated isopropanol at 75°C, heat it at 75°C for 15 minutes, then dry and crush. Weigh 25 mg of the sample, add 100 μL of internal standard (10 μL/mL), 2 mL of methanol, then 2 mL of dichloromethane. After vortexing for 1 h, add 2 mL of dichloromethane and 1.6 mL of ultrapure water. After vortexing and centrifugation, remove the supernatant. The remaining supernatant was further extracted with 4 mL of dichloromethane, repeated twice, and the extracted liquids were combined. After nitrogen blowing, re-dissolve in 1 mL of isopropanol, filter through a 0.22 μm organic membrane to obtain the sample for testing (Yang et al., 2022). The sample extracts were analyzed using a UPLC-QTOF-MS system (HPLC, shimadzu UPLC LC-30A system; MS, AB Sciex TripleTOF® 6600).
2.4. Electronic-nose detection
The detection parameters of PEN3 electronic-nose (AIRSENSE Analytics, Germany) were set as follows: sampling interval of 1 s, cleaning time of 90s, adjustment time of 10s, compression time of 5 s, detection time of 120 s, gas injection flow of 400 ml/min, initial injection flow of 300 ml/min, test temperature of 25°C. The E-nose sensor is composed of 10 metal oxide conduction arrays. The testing was carried out with three independent samples, with each sample detected in triplicate.
2.5. Determination of the oil quality indices
The oxidative stability index (OSI) of the oil samples was determined with the official method Cd 12c-16 of AOCS on an oxidation test reactor (Velp Scientifica, Italy). The pressure was set to 6 bar, the temperature was set to 90°C, and the data recording started after the pressure rised to the set pressure. The recording stopped when the pressure was less than 2 bar, and the data result was expressed as the OSI (when the pressure was less than 5 bar).
Vitamin E was detected by HPLC procedure according to the food safety national standard of China (GB5009.82-2016). The sample pre-treatment procedure was the same with Yang’s (Yang et al., 2022). The samples were detected by HPLC of Shimadzu LC-20AT system equipped with a Thermo Scientific Acclaim C30 column (4.6×250mm, 5µm). The detection conditions were: mobile phase (H2O/A MeOH/B), flow rate of mobile phase 0.8 mL/min, sample volume 20 µL, testing wavelength 294 nm, and column box temperature 22°C. The content of Vitamin E were expressed in terms of α-tocopherol equivalents. The testing was carried out with three independent samples, with each sample detected in triplicate (Yang et al., 2022).
The total phenolic content was determined with the Folin-Ciocalteu’s method. The sample pre-treatment procedure was the same with Yang’s (Yang et al., 2022). Take 3 mL of sample liquid, add 1 mL of Folin phenol reagent, shake for 1 min and then add 3 mL of 10% Na2CO3 solution, shake well and add water to 10 mL, and water bath in 45°C for 1.5 h. Use the solution without standard as a blank control, and determine the absorbance at 765 nm. Use the standard curve to calculate the total phenolic content of the sample (Yang et al., 2022).
The peroxide value (PV) was detected with the titration procedure according to the food safety national standard of China (GB5009.227-2016). Weigh 2 g of the oil sample into a conical flask, add 30 mL of a trichloromethane acetic acid mixture, add 1 mL of a saturated solution of potassium iodide, seal and shake for 0.5 min. After placing in dark for 3 min, add 100 mL of distilled water, shake well, and immediately add 1 mL of starch indicator and titrate with a 0.1 mol/L sodium thiosulfate standard solution until the blue color disappears. For the blank control, use water in place of the sample(Yang et al., 2022).
The acid value (AV) was detected with the cold solvent indicator titration procedure following the food safety national standard of China (GB5009.229-2016). Add 5 g of the sample to a 250 mL conical flask, then add 12.5 mL of a mixture of ether and isopropanol, along with 3-4 drops of thymolphthalein indicator. Shake well and titrate with 0.1 mol/L NaOH until the liquid turned blue, indicating the endpoint of titration. Use water in place of the sample for blank control (Yang et al., 2022).
2.6. Statistical analysis
All the analytical tests and experiments were carried out in triplicate and data were expressed as mean ± standard deviation (SD) values of these triplicates. For statistical assessment, principal component analysis (PCA) and hierarchical cluster analysis (HCA) were employed on the data to establish relation between different parameters. Partial least squares discriminant analysis (PLS-DA) and orthogonal partial least squares discriminant analysis (OPLS-DA) were used to screen the significantly regulated lipids between different samples which were determined by VIP >1.0 and fold change (>2 or <0.5). The R package MetaboAnalystR was used for analysis. The data were pared to scaling before PLS-DA.
3. Results
3.1. Quality indices of the cold-pressed oil and hot-pressed oil
3.1.1. Oil yield
Oil yield is a very important index of the lipid industry and is closely related to the benefit of oil production enterprises. The oil yields of cold-pressed oil and hot-pressed oil are shown in Table 1. A significant increase in the oil yield of hot-pressed oil was observed. The oil yields of the cold-pressed oil and hot-pressed oil were 10.65 ± 0.182% and 10.95 ± 0.02%, respectively, in this study.
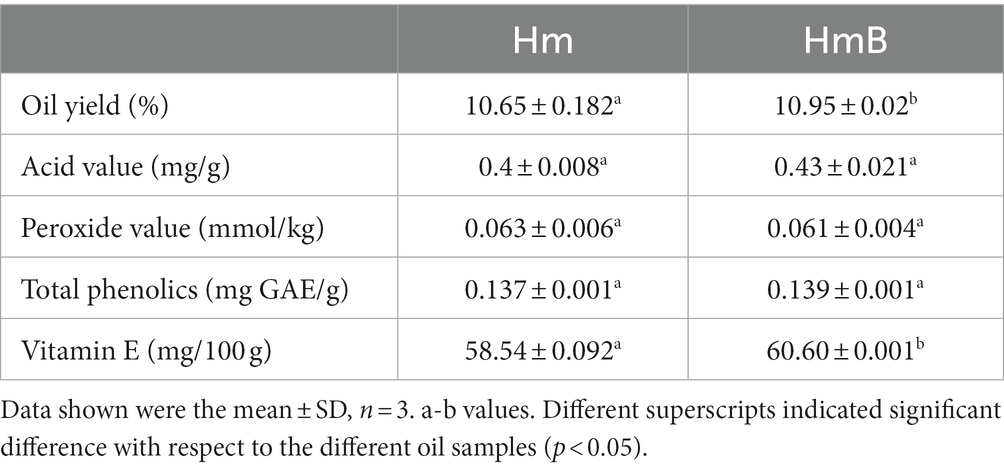
Table 1. The oil yield, total phenolics, acid value, peroxide value and Vitamin E of the two oil samples.
3.1.2. Acid value
AV serves as an indicator of quality deterioration occurring in oil, as it determines the amount of free fatty acid produced as a result of glyceride hydrolysis (Suri et al., 2020; Tenyang et al., 2022). The AV of the cold-pressed oil and the hot-pressed oil of Hibiscus manihot L. seeds are given in Table 1. The cold-pressed oil had an AV of 0.4 ± 0.008 mg KOH/g, and the hot-pressed oil had an AV of 0.43 ± 0.021 mg KOH/g. There was no significant difference between the AV of the two oil samples, which indicated that roasting did not significantly increase the free fatty acids of the oil sample.
3.1.3. Peroxide value
PV determines the stability of oil against oxidative degradation. It is widely used for the measurement of peroxides and hydroperoxide forms due to oxidation in oils. The PV of the cold-pressed oil and the hot-pressed oil of the Hibiscus manihot L. seeds are given in Table 1. The cold-pressed oil had a PV of 0.063 ± 0.006 mmol/kg, and the hot-pressed oil had a PV of 0.061 ± 0.004 mmol/kg. There was no significant difference between the two oil samples’ PVs, which indicated that roasting did not significantly increase the peroxides of the oil sample.
3.2. The oxidative stability of the cold-pressed oil and hot-pressed oil
3.2.1. Oxidative stability index
Edible oils are easily oxidized to produce hydroperoxides and small molecules. The oxidative inductive time is often used to estimate the oxidative stability of edible oils, which is an important quality and safety indicator of oils for their utilization. The OSI is a measurement of the resistance of oil to oxidation, and the OSI duration is closely related to edible oil stability. In this study, OSI was used to examine the oxidative stability of the cold-pressed oil and hot-pressed oil. The OSIs of the cold-pressed oil and hot-pressed oil are shown in Figure 1. The OSI (time point with the pressure less than 5 bar) of the cold-pressed oil was 22.15 h, and the OSI of the hot-pressed oil was 23.54 h. The results showed that roasting could increase the OSI of Hibiscus manihot L. seed oil.
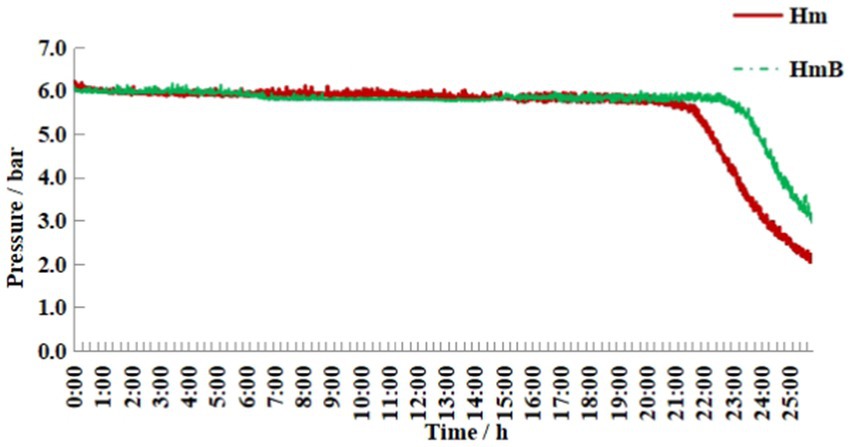
Figure 1. Oxidative induction time (OSI) curves of the two oil samples. The OSI reflects the effect of roasting on oxidative stability of Hibiscus manihot L. seed oil. The OSI was the time point with the pressure of 5 bar. The X axis represents the oxidative induction time, and the Y axis represents the oxygen pressure. The red curve indicates the cold-pressed oil (Hm) and the green curve indicates the hot-pressed oil (HmB).
3.2.2. Total phenolic content
The phenolics found in food products significantly affect their stability and sensory and nutritional characteristics and may prevent their spoilage by quenching radical reactions responsible for lipid oxidation. Phenolic compounds are important endogenous antioxidants in vegetable oils, and their contents depend on the oil source and production method to a great extent and vary greatly (Mikolajczak et al., 2021). The phenolic contents in the cold-pressed oil and hot-pressed oil were investigated in this study (Table 1). There was a slight variation in TPC between the cold-pressed oil and hot-pressed oil, which increased by roasting the Hibiscus manihot L. seeds.
3.2.3. Vitamin E
Vitamin E (tocopherol) is a natural antioxidant in vegetable oils that can prevent lipid oxidation. The effect of roasting on vitamin E in Hibiscus manihot L. seed oil is shown in Table 1. The vitamin E content was significantly increased in the oil sample obtained from roasted Hibiscus manihot L. seeds. The content of vitamin E of the hot-pressed oil was higher than the cold-pressed oil, which meant that it might have strong antioxidant activity, which might be the cause of its strong oxidative stability.
3.3. Profiling and comparison of fatty acids in the cold-pressed oil and hot-pressed oil
The results of this study showed that there was almost no difference between the fatty acid profiles of the two oil samples (Table 2). Sixteen fatty acids were quantified, and the most abundant fatty acid was methyl linoleate [C18:2 (n-6)], followed by oleic acid (C18:1), palmitic acid (C16:0), and methyl stearate (C18:0). Very small amounts of arachidic acid (C20:0), eicosenoic acid (C20:1), methyl myristate (C14:0), methyl pentadecanoate (C15:0), cis-10-heptadecanoic acid methyl ester (C17:1), methyl linolenate [C18:3(n-6)], methyl γ-linolenate [C18:3(n-3)], cis-5,8,11,14,17-eicosapentaenoic acid methyl ester [C20:5(n-3)], methyl lignocerate (C24:0) and erucic acid (C10:0) were also detected. Methyl pentadecanoate (C15:0) decreased obviously in the hot-pressed oil, but methyl octanoate (C8:0) was produced in the hot-pressed oil, and other fatty acid contents had no obvious change.
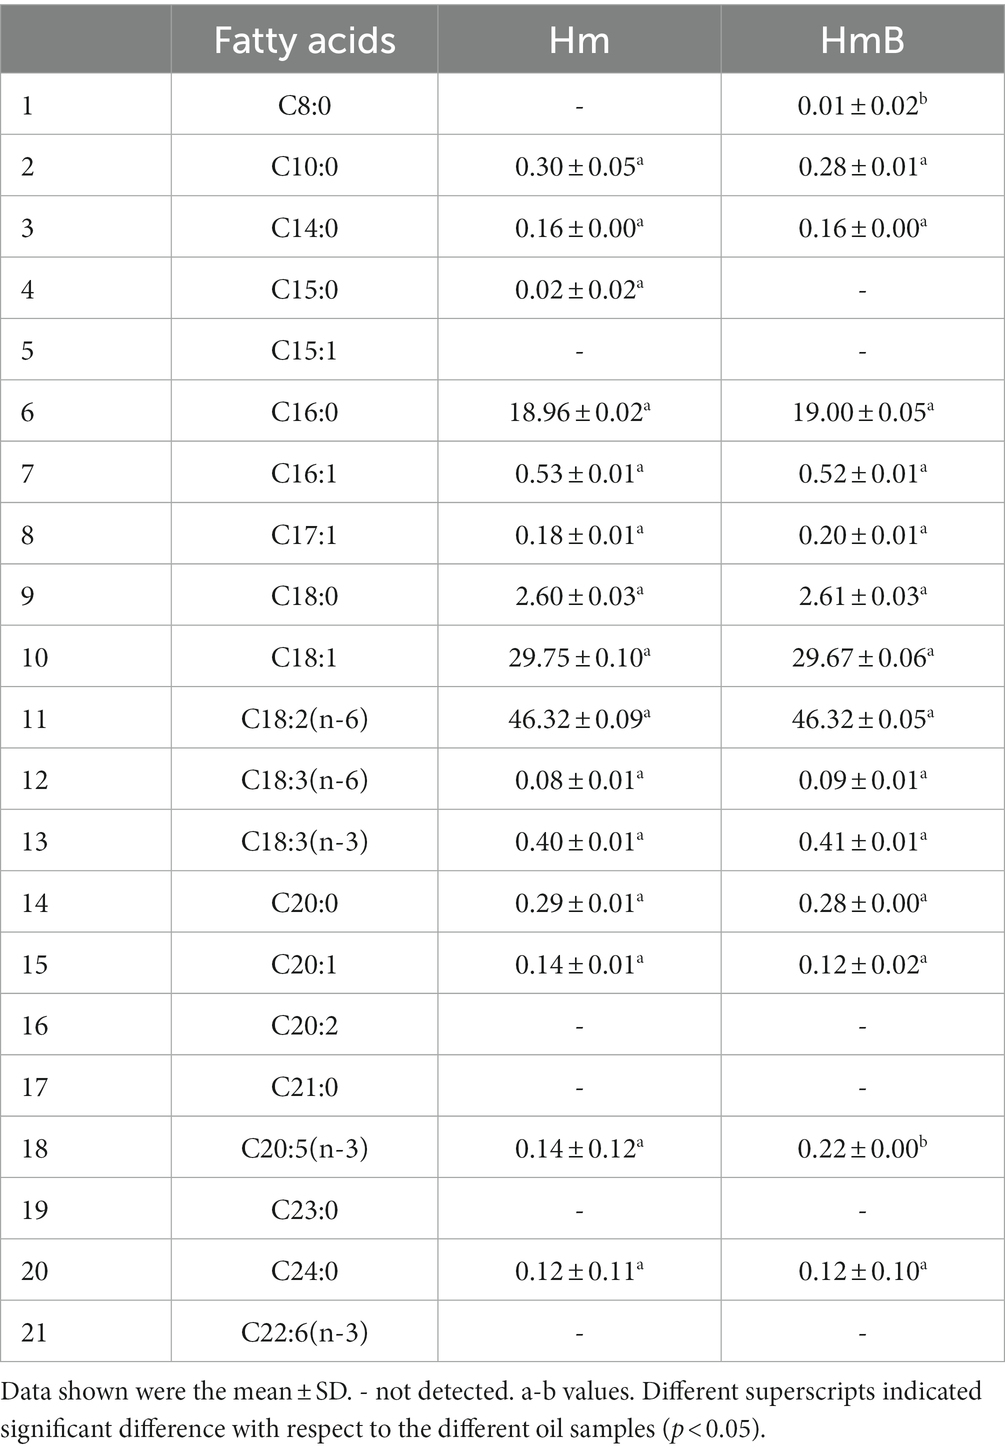
Table 2. Fatty acid composition of the two oil samples (% total fatty acid).
Vegetable oils are rich in unsaturated fatty acids, mainly consisting of monounsaturated and polyunsaturated fatty acids, which are the main cause of lipid oxidation. Oleic acid (C18:1) and linoleate [C18:2 (n-6)] were the predominant monounsaturated and polyunsaturated fatty acids of the two oil samples. C18:2 accounted for 46.32% of the total fatty acids in the two oil samples, and C18:1 accounted for 29.75 and 29.67% of the total fatty acids in the cold-pressed oil and hot-pressed oil, respectively. Linoleic acid (C18:3) is an essential fatty acid that is important in the maintenance of physiological functions of the human body. The Hibiscus manihot L. seed oil contained a linolenic acid content of approximately 0.4%.
3.4. Multivariate analysis of lipid substances in the cold-pressed oil and hot-pressed oil
3.4.1. Profiling and comparison of lipid classes in the two oil samples
The lipid classes and contents were analyzed by UPLC-QTOF-MS, and the results showed that a total of 267 lipid species were characterized and quantified in Hibiscus manihot L. seed oil, which could be divided into 13 categories (Supplementary Table S1). They were 116 species of triacylglycerol (TAG), 23 species of diacylglycerol (DAG), 33 species of glycerophosphocholin (PC), 33 species of glycerophosphoethanolamine (PE), 11 species of phosphatidylglycerol (PG), 4 species of glycerophosphatidic acid (PA), 11 species of digalactosyldiacylglycerol (DGDG), 1 species of simple diacylglyceryl glucuronide (DGGA), 2 species of monogalactosyl diacylglycerol (MGDG), 4 species of sulfoquinovosyldiacylglycerol (SQDG), 3 species of lysophosphatidylcholine (LPC), 9 species of lysophosphatidylethanolamine (LPE), and 17 species of free fatty acid (FFA).
The sum of each lipid class was calculated, and the difference between the two oil samples was analyzed. A total of 116 individual TAG species were detected in Hm and HmB, and the most abundant TAG species were LLL, PLL, OLL, OOL, and POL. Most of the fatty acids in vegetable oils were in the form of TAGs. TAGs are the main component of edible oils and have a great effect on the functional and nutritional characteristics of oils.
Almost half of the lipid classes had significant differences between the cold-pressed oil and hot-pressed oil, which confirmed that the lipid composition of different pressing methods was evidently different. In detail, LPC, LPE, MGDG and FFA showed extremely significant differences between the two samples (p < 0.01). DAG and PE indicated significant differences between the two samples (p < 0.05; Table 3). The abundance of free fatty acids in HmB was extremely significantly higher than that in Hm. Supplementary Table S1 and Table 3 show the free fatty acid composition and contents in the two oil samples. Seventeen FFAs were quantified, and the most abundant FFA was oleic acid (C18:1), followed by linoleic acid (C18:2), palmitic acid (C16:0), stearic acid (C18:0), and docosanoic acid (22:0). The oil samples also contained a small amount of linolenic acid (C18:3). The tables illustrate the content and distribution of all detected FFAs in the different oil samples (Supplementary Table S1; Table 3). The content of all detected FFAs was elevated to varying degrees in the hot-pressed oil. C18:1 dramatically increased in the hot-pressed oil, which rose more than three times, followed by C18:2, which rose more than twice. A significant increase in the C16:0, C18:0, C18:3, C20:0, and C20:1 content was also found in the hot-pressed oil.
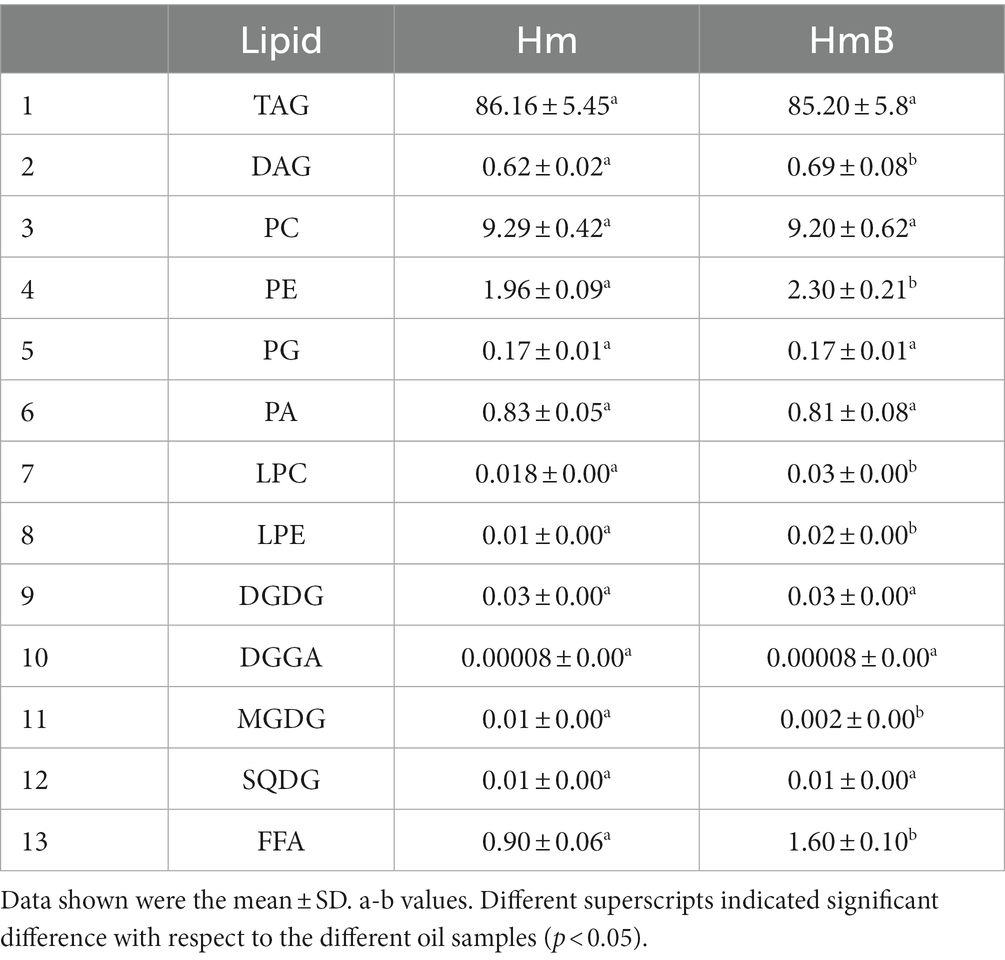
Table 3. The abundance of lipid classes in different oil samples (% total lipid).
3.4.2. Identification of the differential lipids with PCA and OPLS-DA analysis
To compare the changes in lipid substances between the cold-pressed oil and hot-pressed oil, PCA and OPLS-DA were performed on the data obtained by UPLC-QTOF-MS, and the results are shown in Figure 2 Based on VIP (variable importance in projection) values (VIP >1.0), which were obtained from the PLS-DA analysis and fold change (>2 or <0.5), a total of 55 differential lipids were screened in the cold-pressed oil and hot-pressed oil, in which 30 lipids were upregulated and 25 lipids were downregulated (Supplementary Table S2).
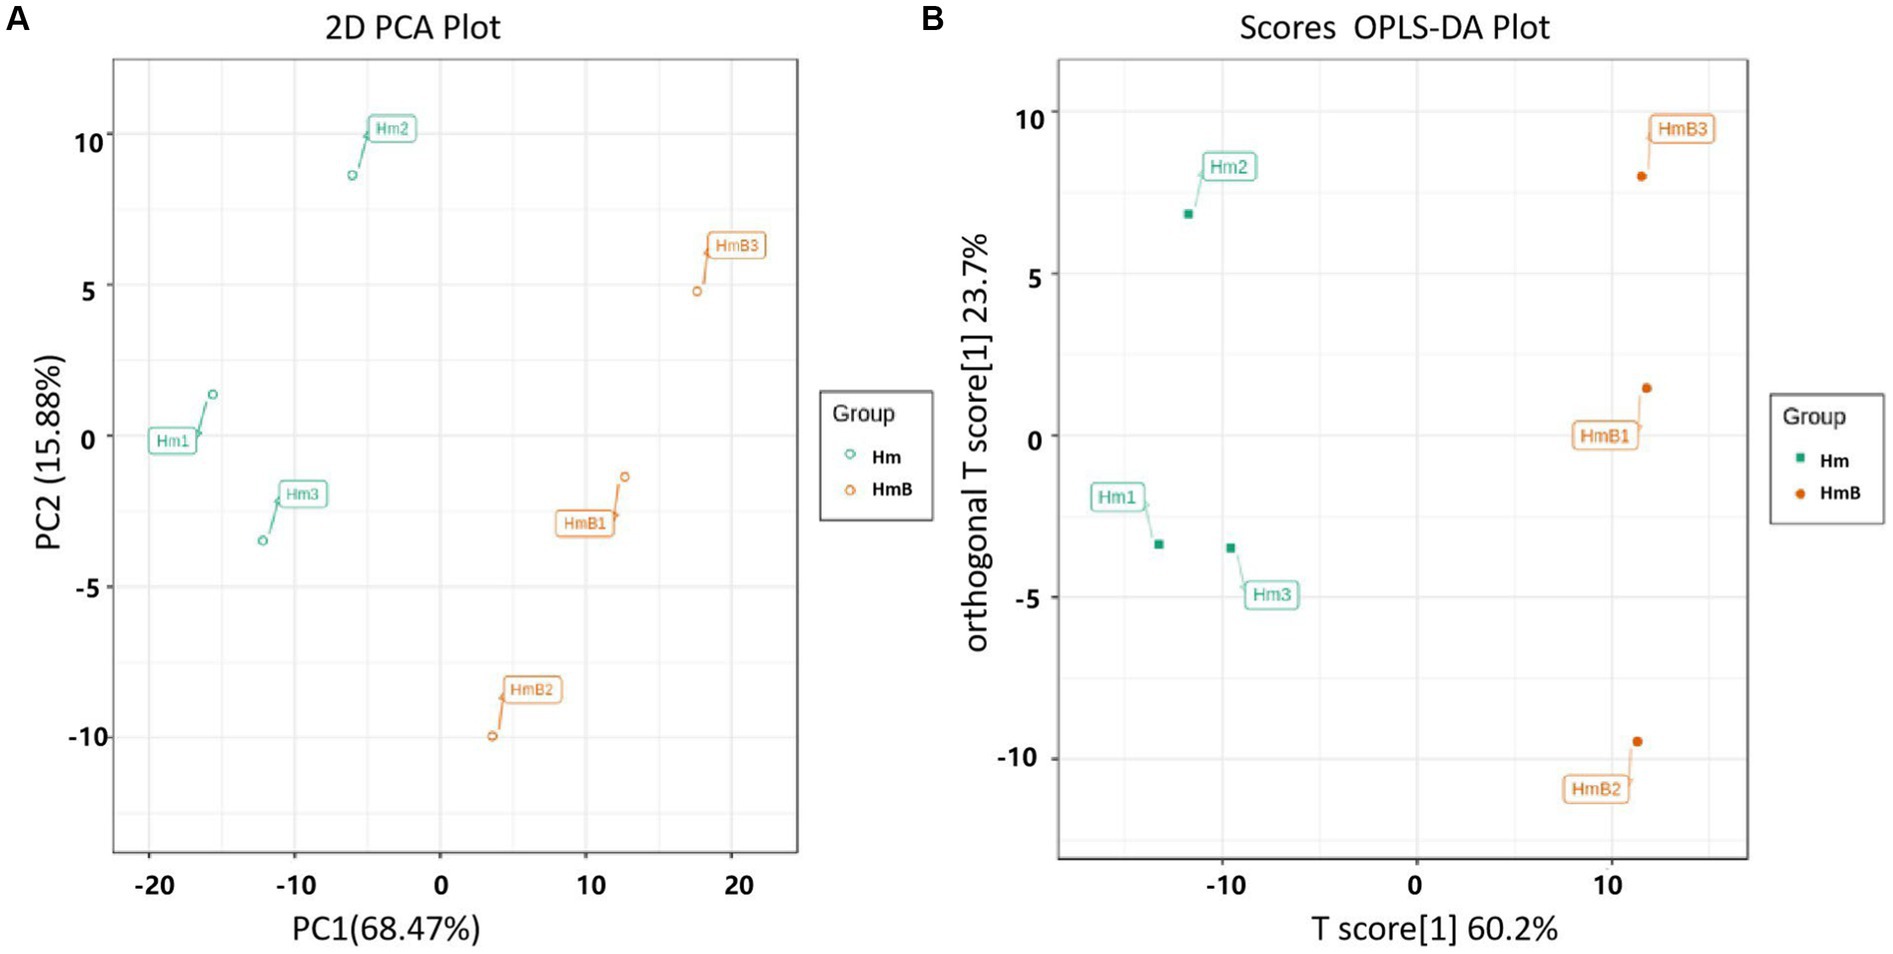
Figure 2. PCA (A), OPLS-DA (B) of the lipidomic data obtained from Hm and HmB. Score plots were derived using UPLC-QTOF-MS data-sets from the cold-pressed oil and the hot-pressed oil. The X axis represents PC1 (A) and T score (B), and the Y axis represents PC2 (A) and Orthogonal T score (B). Each sample has three independent duplicates and is been represented on the plot by a unique symbol.
As shown in Figure 2, there was obvious separation between Hm and HmB without overlap, and both Hm and HmB had good intragroup repeatability, indicating that lipid substances of Hibiscus manihot L. seed oil changed significantly with roasting. As expected from the PCA, the accumulated contribution rate of the first two principal components added up to 84.35% of the variation when separating different samples. Two oil samples were completely distinguished (Figure 2A). The OPLS-DA score plot showed good separation (The T score indicated 60.2% of the predictive principal components, and the orthogonal T score indicated 23.7% of the orthogonal principal components. Together, these two components explained a total of 83.9% of the total variation Figure 2B). PCA, PLS-DA (Figure 3), and OPLS-DA are multivariate statistical illustration measures that focus on different preemptions. Using them together can generate more comprehensive and accurate statistical calculation results. The analysis results of this study reflected the major differences in lipid composition and content between the two samples and demonstrated the clustering patterns of different samples.
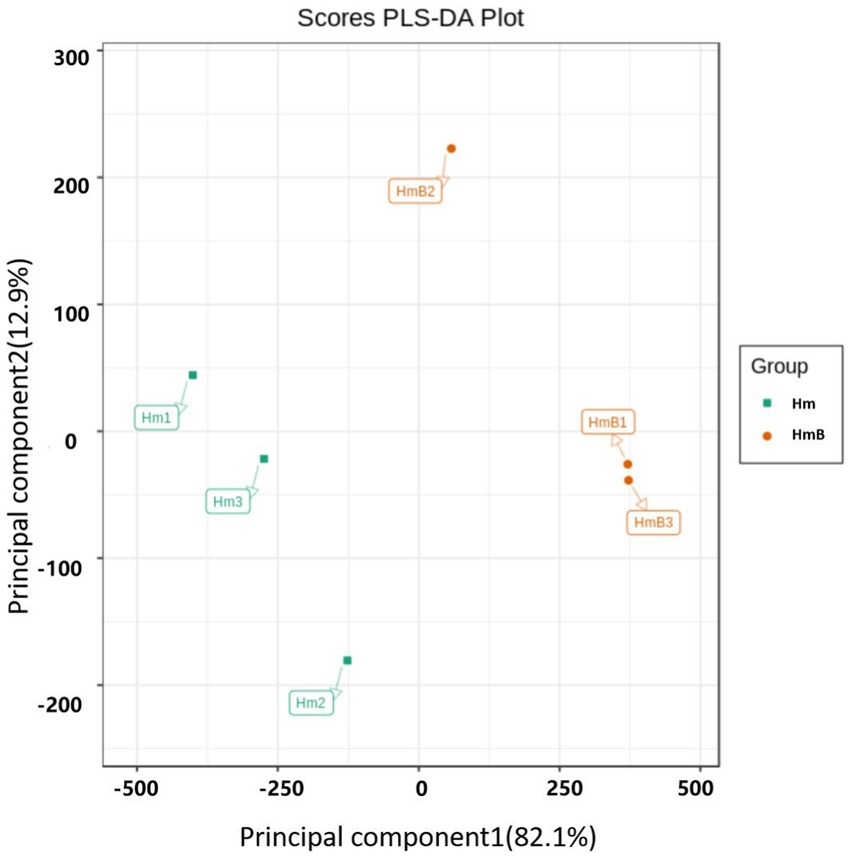
Figure 3. PLS-DA of the lipidomic data obtained from Hm and HmB. PLS-DA score plot was derived using UPLC-QTOF-MS data-set from the cold-pressed oil and the hot-pressed oil. The X axis represents principal component 1, and the Y axis represents principal component 2. Each sample has three independent duplicates and has been represented on the plot by a unique symbol.
To better visualize the difference between Hm and HmB, a cluster heatmap was established based on the identified lipid substances. The results obtained in this study clearly demonstrated that there was obvious hierarchical clustering between Hm and HmB (Figure 4A), and there were a large number of lipid substances with significant differences. After roasting, the contents of DAG and free fatty acids were significantly upregulated, and the contents of TAG were downregulated. Among them, each kind of lipid compound showed an accumulation trend. For instance, 16 TAGs and 3 DAGs were significantly upregulated, while 15 TAGs and 5 DAGs were significantly downregulated in the hot-pressed oil, which meant that roasting had quite different effects on every kind of lipid.
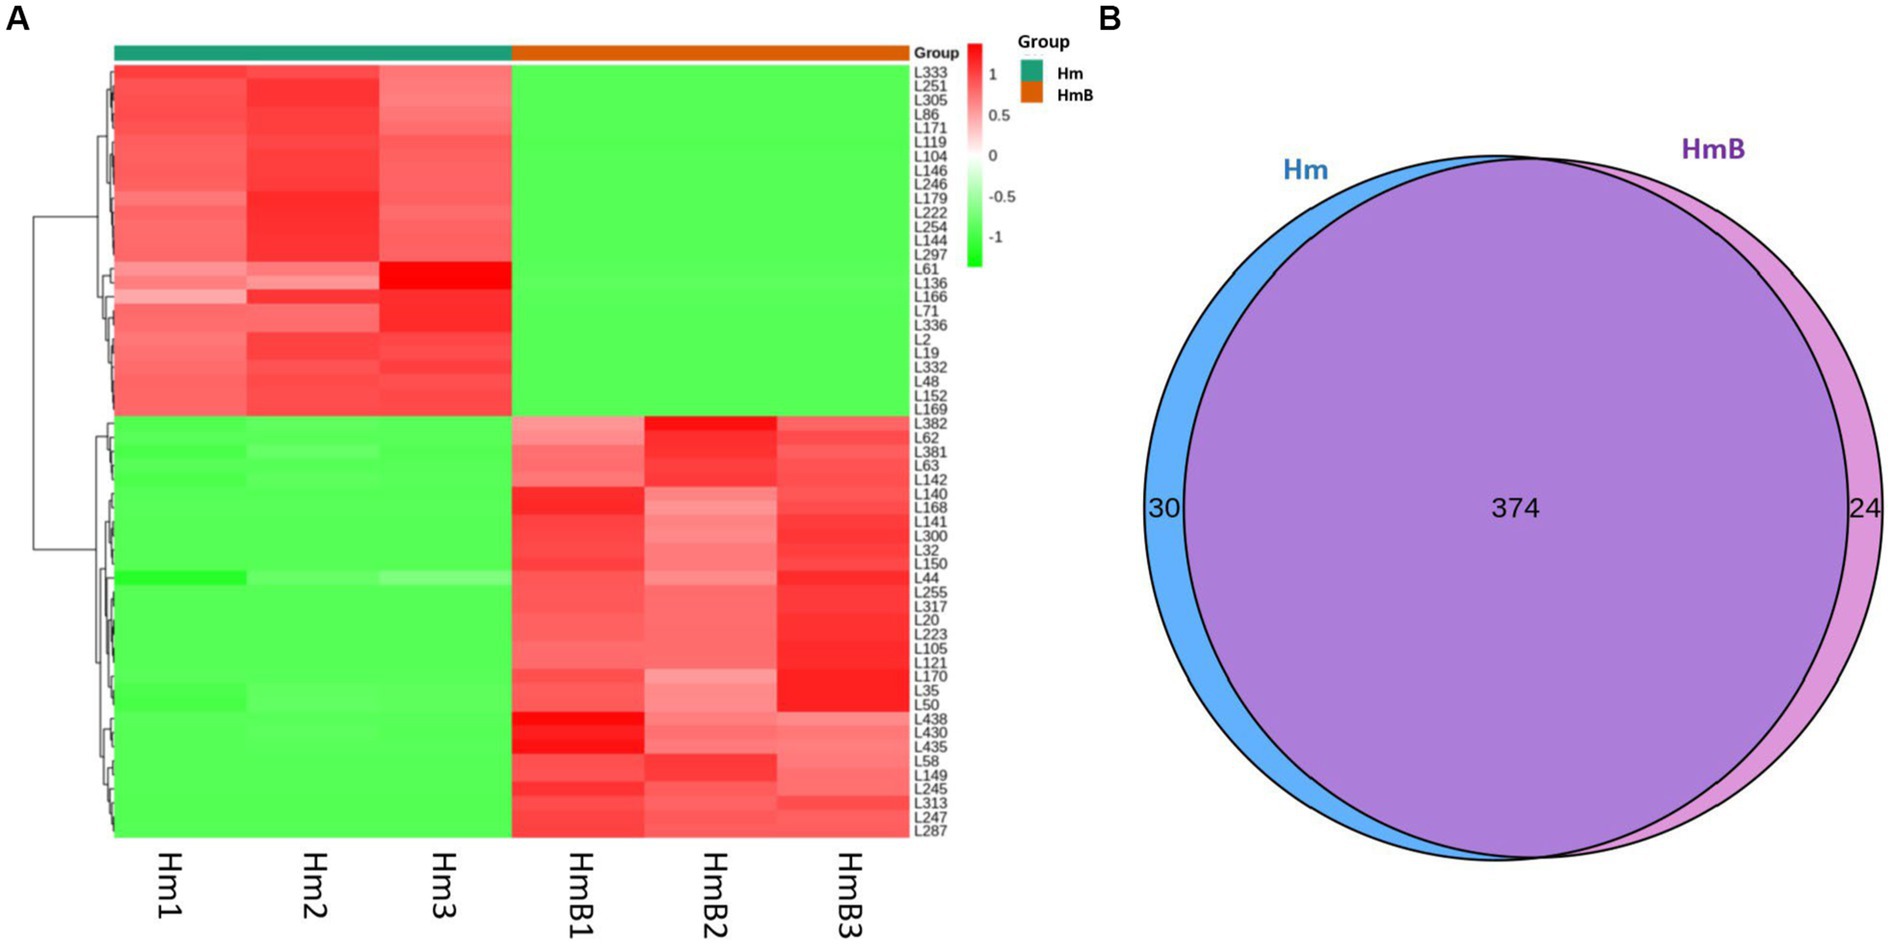
Figure 4. Heatmap (A), Venn diagram (B) of the lipidomic data obtained from Hm and HmB. (A) Significantly different lipids in the cold-pressed oil (Hm) and the hot-pressed oil (HmB). Significantly different lipids of Hm and HmB were assessed by variable important in projection (VIP) and fold change. The numbers on the right side of the picture were the codes of the result of the UPLC-QTOF-MS with specific information shown in Supplementary Table S1. Red rectangles indicate the higher lipid contents, while green rectangles indicate the lower lipid contents. The values of lipids are the averages of three independent duplicate samples. (B) The lipids detected from the cold-pressed oil (Hm) and the hot-pressed oil (HmB). The blue ones indicate the lipids detected from Hm, the pink ones indicate the lipids detected from HmB, and the purple ones indicate the lipids detected from Hm and HmB simultaneously.
In view of the lipid metabolite information acquired in this study, the discrepancy lipid metabolites between the two samples were displayed using a Venn diagram (Figure 4B). The result indicated that fifty-four lipids were discrepancy lipids. The data revealed that the lipid types and heft of the two samples were palpable diverse, which indicated that the lipid types and heft might be regarded as possible biomarkers to distinguish the two oil samples. Consequently, the cold-pressed oil and the hot-pressed oil might be discriminated with the Venn diagram. Future research should check more kinds of cold- and hot-pressed oil samples to find common identification methods for these two kinds of oils. Particularly, due to the persistent improvement of lipidomics and the persistent update of the essential knowledge of all kinds of edible oil, the Venn diagrams and other statistical methods might be used to distinguish the edible oils to escape the steady progress of the edible oil industry.
3.5. Electronic nose analysis of the flavor compounds of the cold-pressed oil and hot-pressed oil
The flavor of edible oils is an important sensory index to estimate the oilseed varieties and processing methods of different oils (Li and Hou, 2018). In recent years, E-nose has often been used to detect the volatile flavor components of edible oils. E-nose can mimic the human smelling process and offer fast and low-cost information to evaluate edible oil freshness as well as to monitor the processes and appraise their quality. E-nose is also a new technique among the various technologies available for testing the adulteration of edible oils and can provide precise information for arriving at a conclusion (Karami et al., 2020).
The E-nose sensors used in this study are listed in Table 4. The volatile substance radar diagram of Hm and HmB (Figure 5) showed that the signal response trends of the two samples in the 10 sensors were basically consistent, indicating that the volatile component compositions of the two samples were similar. The sensors with high response values were W1W, W1S, W2W, W5S, and W2S, which meant that sulfides, terpenes, methane, compounds containing oxygen and nitrogen, alcohol and aromatic compounds greatly influenced the flavor of Hm and HmB. Nevertheless, the flavor compounds of the two samples were different to some extent. For example, the response values of the sensors W1W, W1S, W2W, and W2S of Hm were macroscopically higher than those of HmB. However, the response value of the W1C sensor was higher in HmB, indicating that the content of aromatic compounds was rich in HmB. Thus, the flavor of the cold-pressed oil and hot-pressed oil varied to some extent.
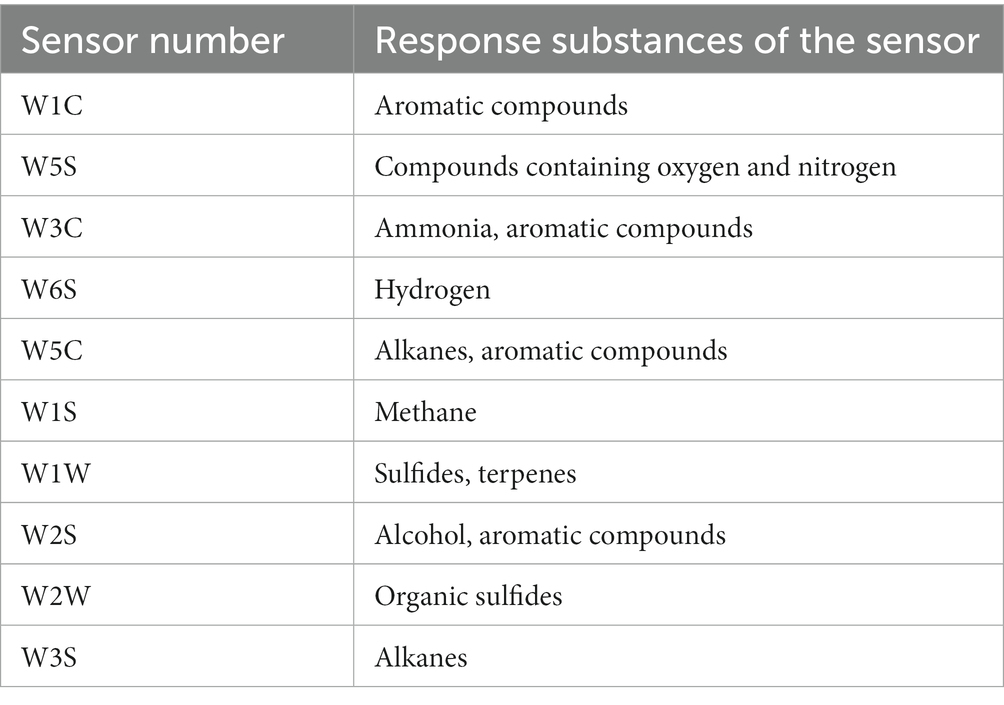
Table 4. The E-nose sensors.
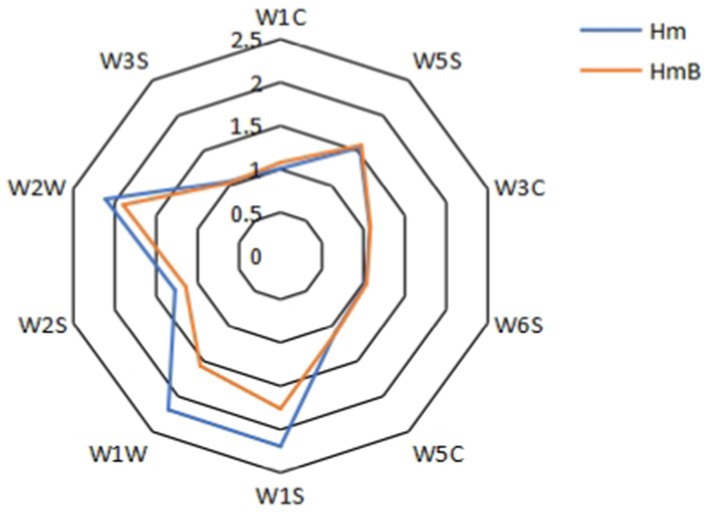
Figure 5. The volatile substances radar diagram of Hm and HmB. The volatile substance radar diagram of the cold-pressed oil and the hot-pressed oil was plotted. The numbers on the chart are the E-nose sensors used in this study. The figures on the chart are the response values of each sensor of the E-nose, and a larger figure indicates a stronger response of the sensor.
To analyze the difference between the two oil samples, the PCA method was applied. The score diagram of the two major components is represented in Figure 6. This diagram was generally used to classify the separate data clusters to identify their patterns (Karami et al., 2020). The results of PCA showed that the contribution rates of the first and second principal components were 74.34 and 14.95%, respectively, and the total contribution rate was 89.29%. According to the score diagram, the flavor components of the cold-pressed oil and hot-pressed oil were well differentiated. It could be concluded that the E-nose data obtained in this study were capable of differentiating the flavor of the cold-pressed oil and hot-pressed oil, which meant that different processing methods resulted in the flavor difference between the two oil samples.
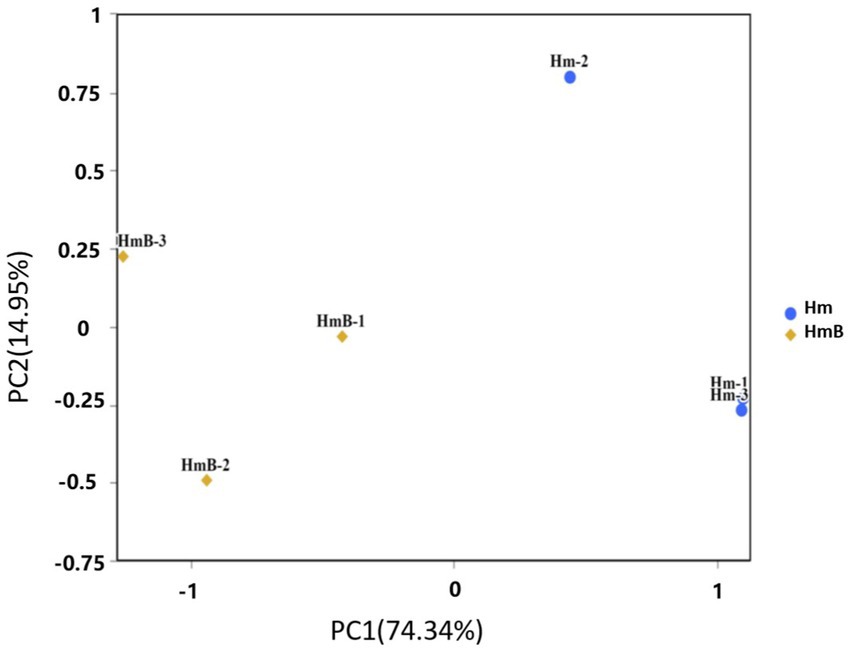
Figure 6. Score diagram of PCA of Hm and HmB. Score plot was derived using E-nose from the cold-pressed oil and the hot-pressed oil. The X axis represents PC1 (A), and the Y axis represents PC2 (A). Each sample has three independent duplicates and has been represented on the plot by a unique symbol.
4. Discussion
As a cash crop of great economic value, every tissue of Hibiscus manihot L. has high nutritional value and utilization value. In particular, its seed oil is rich in unsaturated fatty acids and bioactive ingredients and has many functions, so it has attracted increasing attention. Different processing methods have a great influence on oil yield and oil quality indices. This study investigated the disparity between cold-pressed and hot-pressed Hibiscus manihot L. seed oil with lipidomic analysis and E-nose. First, we analyzed the quality indices of different Hibiscus manihot L. seed oils. For the oil yield, the hot-pressed oil was significantly higher than the cold-pressed oil, which was in agreement with the published result reporting an improvement in the oil yield from roasted peanut (Zhang et al., 2020), which showed that the hot-pressing method could improve the oil yield of Hibiscus manihot L. seed oil. For the acid value (AV) and peroxide value (PV), there was no significant difference between the two oil samples. The lower AV indicated that the oil contained less free fatty acid. Hibiscus manihot L. seed roasting slightly increased the AV of the hot-pressed oil. An increase in the AV of oil indicated hydrolytic degradation of glycerides and formation of free fatty acids during roasting at high temperature (Suri et al., 2020). Hibiscus manihot L. seed roasting slightly decreased the PV of the hot-pressed oil. The decrease in the hot-pressed oil PV might be due to the peroxides decomposing into secondary oxidation products (aldehydes, ketones, etc.) at high temperature because of their unstable nature. There was no significant difference between the two oil samples’ PVs, which indicated that roasting did not significantly increase the peroxides of the oil sample.
The OSI of the cold- and the hot-pressed oil was discussed in this study. The results revealed that roasting could promote the OSI of Hibiscus manihot L. seed oil. The result could be caused by the synergetic antioxidant activity of Maillard reaction offspring which were engendered in the baking process and the nutritive materials in the oil, such as phenolics, vitamin E and other naturally occurring antioxidants, thereby increasing the oxidative stability of the hot-pressed oil. Analogical conclusion was reported about roasting peanuts oil (Zhang et al., 2020), rapeseed oil (Lee et al., 2007) and sesame seeds oil (Gharby et al., 2017). These results concurred with another research indicating a more phenolic content in Pistacia terebinthus oil with roasting. The difference observed in the total phenolic content could have relation to the lipid manufacturing technics and parameters which were used for assessment of total phenolic content of the oil samples. After roasting the oil seeds, it became easier for the phenolic compounds to transfer into the oil phase. The increase of the phenolics in the oil was perhaps caused by the dissolution from the seeds or chemical reaction of phenolics under high temperature during roasting (Durmaz and Gokmen, 2011). Vitamin E has attracted tremendous attention because of its effective antioxidant activities, what might postpone the edible oils oxidation and extend the quality guarantee period of the oils. The content of vitamin E in hot-pressed oil was significantly higher, which meant that vitamin E could be the significant component for the oil sample’s oxidation stability. Roasting might cause the dissociation of lipid and lipid-soluble components from the tissues, such as vitamin E, as a result of the thermal degradation of cellular structure. An analogous conclusion was obtained by Zhang et al. (2020), who exhibited that the content of VE was higher after roasting.
The fatty acids and other lipid substances in the cold-pressed oil and hot-pressed oil were compared with GC and lipidomic approaches. The results showed that there was almost no difference between the fatty acid profiles of the two oil samples, which meant that different processing methods did not change the fatty acid composition of oil. However, the contents of various types of lipids changed greatly. For example, the abundance of free fatty acids in HmB was significantly higher than that in Hm. It is well known that triglycerides undergo hydrolysis to release FFAs when heated (Rękas et al., 2017). A previous study reported a similar phenomenon in which TAGs were slightly hydrolyzed to produce FFAs by roasting (Xie et al., 2019), and the result was consistent with the observed decrease in TAG contents and the increase in FFA and DAG contents in this study. Free fatty acids released from TAGs were related to fatty acid composition and positional distribution. Fatty acids on the second carbon atoms of TAG molecules were more easily hydrolyzed to form FFAs. Ordinarily, saturated fatty acids, especially stearic acid (C18:0), are mostly distributed on the first and third carbon atoms, whereas unsaturated fatty acids, particularly oleic acid (C18:1) and linoleic acid (C18:2), primarily occupy the second carbon atoms of TAGs (Lassner et al., 1995). As a result of hydrolysis with roasting, the levels of FFAs, including C18:1 and C18:2, were increased significantly in the hot-pressed oil.
5. Conclusion
The fatty acids, lipid composition and content of the cold- and hot-pressed oil of Hibiscus manihot L. seeds were determined by GC and lipidomics with UPLC-QTOF-MS. Lipids with the highest content were TAG, PC and PE, and the particular kinds of lipid compounds of the two oils were clearly distrinct. The E-nose data indicated that the aroma components of the cold- and hot-pressed oil were well differentiated. The oil yield and the oxidative stability (oxidative stability index, total phenolic content and vitamin E) of the hot-pressed oil were obviously better than those of the cold-pressed oil. From this point of view, the hot-pressing method is more suitable for Hibiscus manihot L. seed oil. This study provided a foundation for the commercial application of Hibiscus manihot L. seed oil and offered a theoretical basis for further research and utilization on cold-pressed and hot-pressed oil.
Data availability statement
The original contributions presented in the study are included in the article/Supplementary material, further inquiries can be directed to the corresponding author.
Author contributions
XY and NY drafted the manuscript. NY, BC, JG, JM, YS, and WG performed the experiments and analyzed the data obtained. JW and RW devised the main conceptual ideas and supervised the experiments. XZ provided the materials. FY and RW designed the study and analyzed the results. All authors contributed to the article and approved the submitted version.
Funding
This research was funded by Project of Introduction of High-level Personnel of Inner Mongolia Agricultural University, grant number NDYB2019-34 and the Science and Technology Project of Inner Mongolia, grant number 2021GG0365.
Conflict of interest
The authors declare that the research was conducted in the absence of any commercial or financial relationships that could be construed as a potential conflict of interest.
Publisher’s note
All claims expressed in this article are solely those of the authors and do not necessarily represent those of their affiliated organizations, or those of the publisher, the editors and the reviewers. Any product that may be evaluated in this article, or claim that may be made by its manufacturer, is not guaranteed or endorsed by the publisher.
Supplementary material
The Supplementary material for this article can be found online at: https://www.frontiersin.org/articles/10.3389/fsufs.2023.1194765/full#supplementary-material
References
Azadmard-Damirchi, S., Habibi-Nodeh, F., Hesari, J., Nemati, M., and Achachlouei, B. F. (2010). Effect of pretreatment with microwaves on oxidative stability and nutraceuticals content of oil from rapeseed. Food Chem. 121, 1211–1215. doi: 10.1016/j.foodchem.2010.02.006
Cui, Q., Liu, J. Z., Yu, L., Gao, M. Z., Wang, L. T., Wang, W., et al. (2020). Experimental and simulative studies on the implications of natural and green surfactant for extracting flavonoids. J. Clean. Prod. 274, 122652. doi: 10.1016/j.jclepro.2020.122652
Durazzo, A., Fawzy Ramadan, M., and Lucarini, M. (2022). Editorial: cold pressed oils: a green source of specialty oils. Front. Nutr. 8:836651. doi: 10.3389/fnut.2021.836651
Durmaz, G., and Gokmen, V. (2011). Changes in oxidative stability, antioxidant capacity and phytochemical composition of Pistacia terebinthus oil with roasting. Food Chem. 128, 410–414. doi: 10.1016/j.foodchem.2011.03.044
Gharby, S., Harhar, H., Bouzoubaa, Z., Asdadi, A., El Yadini, A., and Charrouf, Z. (2017). Chemical characterization and oxidative stability of seeds and oil of sesame grown in Morocco. J. Saudi Soc. Agric. Sci. 16, 105–111. doi: 10.1016/j.jssas.2015.03.004
Gunawan, I. W. G., Bawa Putra, A. A., and Widihati, I. A. G. (2016). The response to oxidative stress α-Humulene compounds Hibiscus manihot L leaf on the activity of 8-Hydroxy-2-Deoksiquanosin levels pancreatic β-cells in diabetic rats. Biom. Pharmacol. J. 9, 433–441. doi: 10.13005/bpj/956
Karami, H., Rasekh, M., and Mirzaee-Ghaleh, E. (2020). Qualitative analysis of edible oil oxidation using an olfactory machine. J. Food Meas. Charact. 14, 2600–2610. doi: 10.1007/s11694-020-00506-0
Lai, X. Y., Zhao, Y. Y., Liang, H., Bai, Y. J., and Wang, B. (2007). SPE-HPLC method for the determination of four flavonols in rat plasma and urine after oral administration of Abelmoschus manihot extract. J. Chromatogr. B-Analyt. Technol. Biomed. Life Sci. 852, 108–114. doi: 10.1016/j.jchromb.2006.12.043
Lassner, M. W., Levering, C. K., Davies, H. M., and Knutzon, D. S. (1995). Lysophosphatidic acid acyltransferase from meadowfoam mediates insertion of erucic-acid at the SN-2 position of triacylglycerol in transgenic rapeseed oil. Plant Physiol. 109, 1389–1394. doi: 10.1104/pp.109.4.1389
Lee, S. W., Jeung, M. K., Park, M. H., Lee, S. Y., and Lee, J. (2010). Effects of roasting conditions of sesame seeds on the oxidative stability of pressed oil during thermal oxidation. Food Chem. 118, 681–685. doi: 10.1016/j.foodchem.2009.05.040
Li, C. C., and Hou, L. X. (2018). Review on volatile flavor components of roasted oilseeds and their products. Grain Oil Sci. Technol. 1, 151–156. doi: 10.3724/sp.J.1447.Gost.2018.18052
Li, J., Yang, Y., Sun, X., Liu, R., Xia, W., Shi, P., et al. (2022). Development of intron polymorphism markers and their association with fatty acid component variation in oil palm. Front. Plant Sci. 13, 885418. doi: 10.3389/fpls.2022.885418
Mikolajczak, N., Tanska, M., and Ogrodowska, D. (2021). Phenolic compounds in plant oils: a review of composition, analytical methods, and effect on oxidative stability. Trends Food Sci. Technol. 113, 110–138. doi: 10.1016/j.tifs.2021.04.046
Petropoulos, S. A., Fernandes, A., Calhelha, R. C., Rouphael, Y., Petrovic, J., and Sokovic, M. (2021). Antimicrobial properties, cytotoxic effects, and fatty acids composition of vegetable oils from purslane, linseed, luffa, and pumpkin seeds. Appl. Sci. 11, 1–16. doi: 10.3390/app11125738
Qiu, Y., Ai, P. F., Song, J. J., Liu, C., and Li, Z. W. (2017). Total flavonoid extract from Abelmoschus manihot (L.) medic flowers attenuates D-Galactose-induced oxidative stress in mouse liver rhrough the Nrf2 pathway. J. Med. Food 20, 557–567. doi: 10.1089/jmf.2016.3870
Qiu, Y., and Song, J. J. (2012). In vitro free radical scavenging activity and total flavonoid of Abelmoschus manihot (L.) medic extracts. Appl. Mech. Mater. 140, 355–359. doi: 10.4028/www.scientific.net/AMM.140.355
Rękas, A., Wroniak, M., and Ścibisz, I. (2017). Microwave radiation and conventional roasting in conjunction with hulling on the oxidative state and physicochemical properties of rapeseed oil. Eur. J. Lipid Sci. Technol. 119, 1600501. doi: 10.1002/ejlt.201600501
Ren, X. F., Wang, L., Xu, B. G., Wei, B. X., Liu, Y. G., Zhou, C. S., et al. (2019). Influence of microwave pretreatment on the flavor attributes and oxidative stability of cold-pressed rapeseed oil. Dry. Technol. 37, 397–408. doi: 10.1080/07373937.2018.1459682
Suri, K. C., Singh, B., Kaur, A., Yadav, M. P., and Singh, N. (2020). Influence of microwave roasting on chemical composition, oxidative stability and fatty acid composition of flaxseed (Linum usitatissimum L.) oil. Food Chem. 326, 126974. doi: 10.1016/j.foodchem.2020.126974
Tenyang, N., Ponka, R., Tiencheu, B., Djikeng, F. T., and Womeni, H. M. (2022). Effect of boiling and oven roasting on some physicochemical properties of sunflower seeds produced in Far North, Cameroon. Food Sci. Nutr 10, 402–411. doi: 10.1002/fsn3.2637
Wang, H. P., Xin, Y. J., and Wan, X. (2021). Spectral detection technology of vegetable oil: spectral analysis of porphyrins and terpenoids. Spectrochim. Acta Part A 261, 119965. doi: 10.1016/j.saa.2021.119965
Xie, Y., Wei, F., Xu, S. L., Wu, B. F., and Zheng, C. (2019). Profiling and quantification of lipids in cold-pressed rapeseed oils based on direct infusion electrospray ionization tandem mass spectrometry. Food Chem. 285, 194–203. doi: 10.1016/j.foodchem.2019.01.146
Yang, F. Y., Zhang, B., Chen, B. T., Yang, N. F., Wang, R. G., and Zhang, X. J. (2022). A lipidomic approach for profiling and distinguishing seed oils of Hibiscus manihot L., flaxseed, and oil sunflower. J. Am. Oil Chem. Soc. 99, 203–213. doi: 10.1002/aocs.12567
Keywords: Hibiscus manihot L. seed oil, cold-pressed oil, hot-pressed oil, lipidomics, electronic-nose
Citation: Yan X, Yang N, Chen B, Miao J, Guo J, Sun Y, Wang J, Guo W, Zhang X, Yang F and Wang R (2023) Study on the lipid and flavor compounds of Hibiscus manihot L. oil induced by different pressing method. Front. Sustain. Food Syst. 7:1194765. doi: 10.3389/fsufs.2023.1194765
Edited by:
Caili Fu, National University of Singapore Suzhou Research Institute (NUSRI), ChinaReviewed by:
Jiangqi Wen, Oklahoma State University, United StatesMaria Simona Chi, University of Agricultural Sciences and Veterinary Medicine of Cluj-Napoca, Romania
Copyright © 2023 Yan, Yang, Chen, Miao, Guo, Sun, Wang, Guo, Zhang, Yang and Wang. This is an open-access article distributed under the terms of the Creative Commons Attribution License (CC BY). The use, distribution or reproduction in other forums is permitted, provided the original author(s) and the copyright owner(s) are credited and that the original publication in this journal is cited, in accordance with accepted academic practice. No use, distribution or reproduction is permitted which does not comply with these terms.
*Correspondence: Feiyun Yang, eWFuZ2ZlaXl1bkBpbWF1LmVkdS5jbg==; Ruigang Wang, cnVpZ2FuZ3dhbmdAMTI2LmNvbQ==
†These authors have contributed equally to this work