 Hester Vermeulen
 Ferdinand Meyer1,2
 Hettie C. Schönfeldt
- 1Bureau for Food and Agricultural Policy, Pretoria, South Africa
- 2Department of Agricultural Economics, Faculty of AgriSciences, Stellenbosch University, Stellenbosch, South Africa
- 3Department of Animal Science/NRF SARCHi Chair Nutrition and Food Security, Faculty of Natural and Agricultural Sciences, University of Pretoria, Pretoria, South Africa
- 4ARUA CoE Sustainable Food Systems, Pretoria, South Africa
Introduction: Understanding the affordability of healthy eating has always been a critical question but has escalated in importance considering the global context of more recent soaring food prices and the worsening of food and nutrition security indicators since the COVID-19 pandemic. The objective of this study was to evaluate the cost and affordability of basic healthy eating in South Africa and Kenya, through the application of a Basic Healthy Food Basket (BHFB) modeling framework applied within the food intake and nutritional context of the target countries.
Methods: The construction of the BHFB models was based on a number of key considerations (i.e., ‘building blocks’): household demographic (size and composition), socio-economically disaggregated household income levels, minimum wage data, typical food intake patterns, nationally monitored food retail prices and official country-specific nutrient intake and food consumption guidelines. For both countries BHFB’s were compiled and interpreted at a national level, as well as for a ‘more plant-based’ BHFB. The nutritional adequacy of the national BHFB’s was evaluated.
Results: Based on national demographical statistics in Kenya and South Africa, the reference family was defined as a four-member reference household consisting of 2 adults and 2 children. The detailed composition of the national BHFB’s is presented, consisting of 31 food items in Kenya and 24 food items in South Africa – covering all the food groups according to nutritional guidelines. The nutritional adequacy of the various BHFB’s is discussed and were generally deemed adequate for the majority of micro-nutrients – particularly the micro-nutrients of concern in the various countries. In January 2023 the cost of the national BHFB in Kenya and South Africa amounted to KSh33 800 (US$270) and R4 715 (US$ 262) respectively, − potentially excluding approximately 60% of the population from being able to afford a basic healthy food basket. A movement to ‘more plant-based’ BHFB’s (i.e., proportionally less meat/fish/eggs and proportionally more legumes) reduced the cost of the BHFB’s with 15% in Kenya and in South Africa. From a social support perspective, the analyses indicated that social support in the form of child support grants and children benefiting from school feeding programmes could result in the share of households able to afford basic healthy eating to increase by approximately 10 percentage points in the South African context.
Conclusions and recommendations: The study showed that the high (and rising) cost of basic healthy eating prevents large numbers of households in South Africa and Kenya from being able to afford basic healthy eating when considering current income distribution data. The research outcomes of the BHFB methodology applied in this study to monitor and evaluate the cost and affordability of basic healthy eating, should be monitored regularly and taken into consideration to inform food and nutrition policy decisions and actions. However, from a methodological perspective several critical challenges will have to be addressed to improve the measurement accuracy of the BHFB models, including the availability of official food retail price monitoring of a wider range of food items; household demographics, household income data, food intake data and household-level food expenditure data that are more frequently updated, as well as socio-economically and geographically disaggregated data on typical food intake behavior. From the perspective of plant versus animal protein sources, the study suggested that food intake patterns with an increased focus on legumes as a source of plant-based protein could help to improve the affordability of basic healthy eating. However, it is also important to consider consumer acceptability in this context from various perspectives, including sensory acceptability, cultural acceptability, and the available time for food preparation. The study identified the critical need to evaluate the cost of basic healthy eating on a geographically more refined level. This is based on the diversity of food intake behavior in different regions within the target countries as pointed out by in-country experts. However, future research to develop an improved understanding of food intake pattern in different regions/provinces/counties will be a critical enabler, along with geographically disaggregated food retail price data and demographical information.
1. Introduction
Food intake relates strongly to two of the Sustainable Development Goals (SDGs), targeting the window 2016–2030, specifically the second goal (to “end hunger, achieve food security, improved nutrition and promote sustainable agriculture”) and the third goal (to “ensure healthy lives and promote well-being for all at all ages”) (UNDP, 2018). Even though the third SDG is largely focused on disease eradication, food intake also plays a significant role in improving the health status of individuals by satisfying the nutritional requirements of individuals, to enhance general health and prevent chronic diseases (FAO, 2018).
Urbanization is a key driver of food system dynamics, affecting a wide range of factors such as consumer preferences, spatial food demand patterns and households’ ability to produce their own food (Seto and Ramankutty, 2016; Tefft et al., 2017; De Bruin et al., 2021). In Sub-Sahara African countries (including South Africa and Kenya – the case study countries within this paper), increasing urbanization is a well-established socio-economic trend. According to the UN World Urbanization Prospects (United Nations, Department of Economic and Social Affairs, Population Division, 2018) the urban population in South Africa increased from 63% in 2012 to 68% in 2022 (projected to further increase to 80% in 2050) (United Nations, Department of Economic and Social Affairs, Population Division, 2018). Comparatively, urban residents in Kenya increased from 24% in 2012 to 29% in 2022 (projected to further increase to 46% in 2050).
With high and rising urbanization levels in South Africa, a strong reliance on purchased food is a dominant food procurement strategy for households. According to the Statistics South Africa (Stats SA) Community Survey 2016 (Statistics South Africa, 2017a) only 6% of all households obtained the majority of their food from their own agricultural activities in 2016. Several other sources confirm the increasing importance of purchased food from supermarkets as the dominant source of food for households (D'Haese and Van Huylenbroeck, 2005; Hendriks, 2005; Baipheti and Jacobs, 2009; Schönfeldt et al., 2010; Crush and Frayne, 2011; Pereira, 2013; Peyton et al., 2015).
With lower (but increasing) urbanization levels in Kenya, the 2015/2016 Kenya integrated Household Budget survey (KIHBS) (Kenya National Bureau of Statistics, 2018) indicated that at a national level purchased food account for 68% of total food consumed, with own food production only contributing 18%. As could be expected urbanites purchase a larger share of their food supply (86%) with only a 2% contribution from own food production. Rural households had a 28% contribution from own production while purchasing more than half (57%) of their food supply.
Food affordability can be defined as “the cost of the diet of a household relative to the household’s income” (Lee et al., 2013), where the cost of the diet is strongly affected by food prices and the quantity of food purchased. Food prices and food affordability affect consumer food choices, with subsequent influences on dietary patterns, nutrition, health and food security status (James et al., 1997; Beydoun and Wang, 2008; Lee et al., 2013).
The intake of a healthy diet (in terms of dietary patterns and diversity) is an integral part of the concept of health, contributing to the prevention of malnutrition and non-communicable diseases (NCDs) (World Health Organization, 2015; World Health Organization, 2018). Unhealthy diets and inadequate physical activity are widely acknowledged as prominent global risks to health. Dissimilarities in the cost of healthy and less healthy food items and diets have been linked to public health issues such as obesity and NCDs (Drewnowski and Darmon, 2005). An increasing global policy focus on promoting the intake of healthier food options is fueling a need for data on the comparative prices and affordability of healthy foods versus less healthy alternatives (Lee et al., 2013).
In recent years various factors have increased the pressure on households’ livelihoods, particularly factors such as food inflation, household income (or lack thereof), the prevalence of food insecurity and the nutrition transition which are explored in more detail below.
Global food prices (as measured by the FAO Food Price Index) soared to record high levels in 2021 and 2022 due to a complex combination of factors, particularly supply chain disruptions linked to the COVID-19 pandemic, the impact of the Russia-Ukraine war on grain and oil crop prices, high energy prices and weather disruptions (e.g., droughts in key global food production regions) (FAO, 2023). Despite some lagged response in upward inflation movements, food price inflation in developing African countries such as South Africa and Kenya also followed an upward trajectory for 2021 and 2022 (see Figure 1; Kenya National Bureau of Statistics, 2023; Statistics South Africa, 2023).
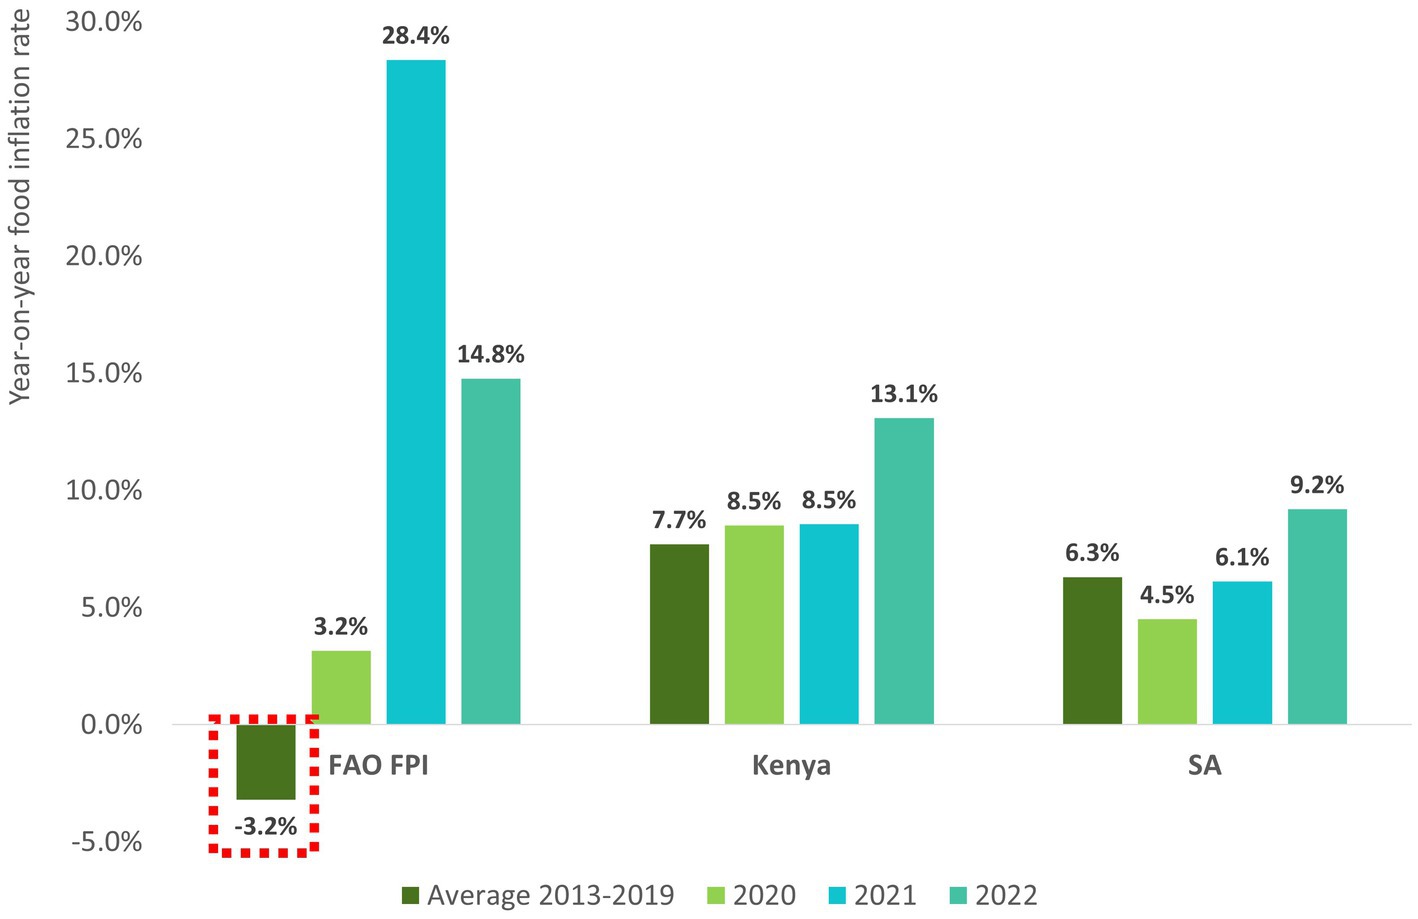
Figure 1. Global, South African and Kenyan year-on-year food price inflation for the period 2013–2022 (Sources: FAO, 2023; Kenya National Bureau of Statistics, 2023; Statistics South Africa, 2023).
In addition to high and rising food prices, the COVID-19 pandemic and the state of the global economy in recent years has contributed to pressure on household income. As illustrated in Figure 2 year-on-year overall inflation was higher than income growth (as measured by Gross Domestic Product (GDP) per capita) from 2018/2019 to 2020/2021 (World Bank data on ‘GDP per capita’ and ‘Inflation, consumer prices’ for Kenya and South Africa as reported by The World Bank, 2023a,b,c,d) – with significant negative income growth observed in Kenya and South Africa for the period 2019/2020 which are strongly linked to the negative economic consequences of the pandemic. Thus, over the last few years there was a general deterioration in households’ ability to purchase items and services to fulfill their needs in Kenya and South Africa.
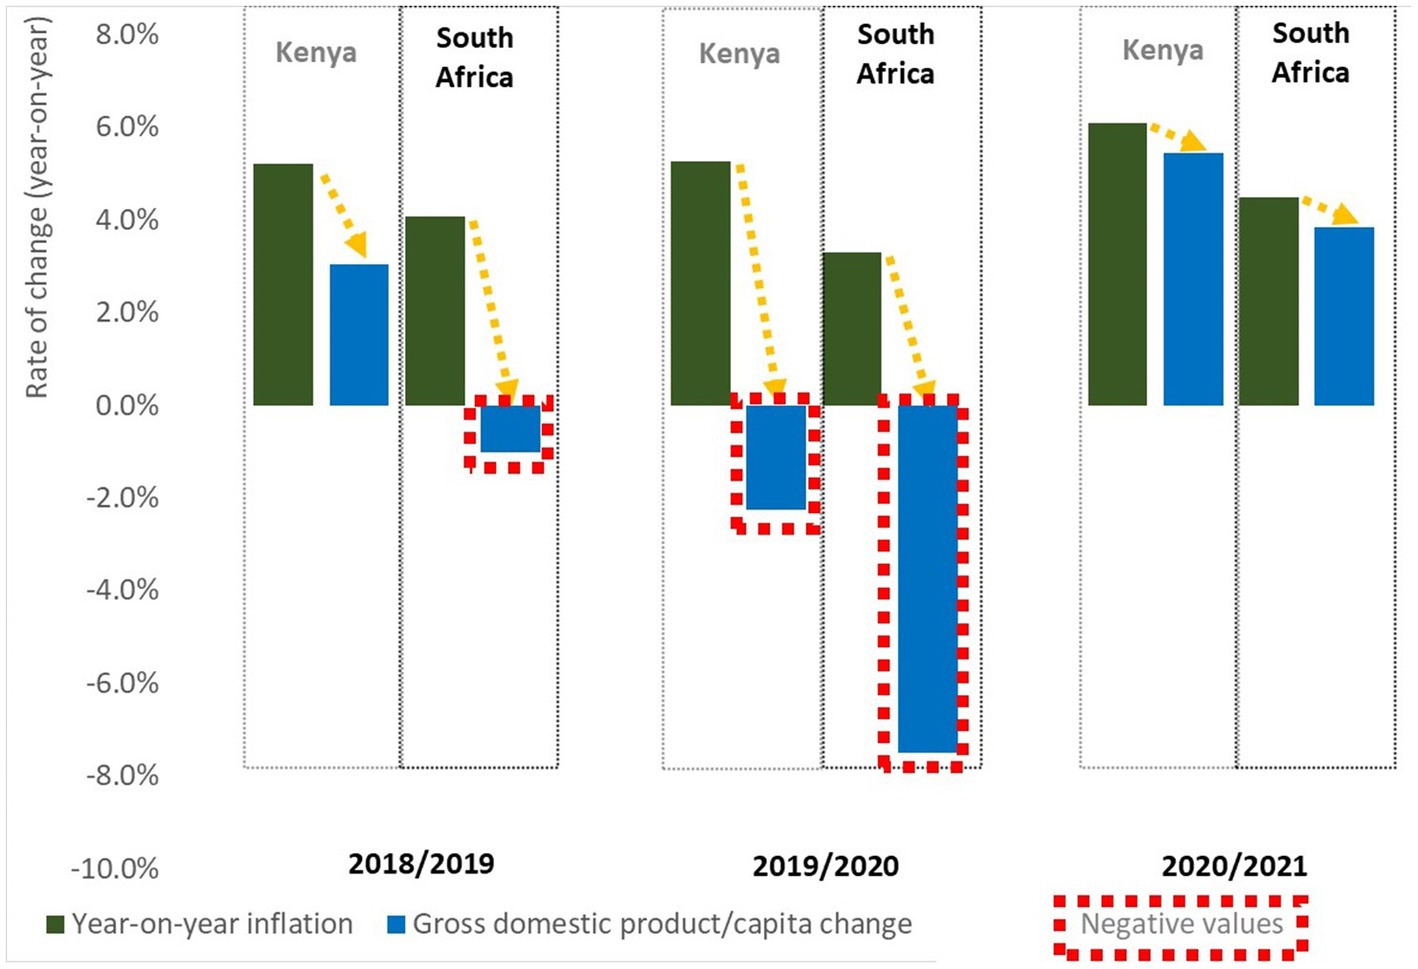
Figure 2. Is household income keeping up with inflation? Comparing annual year-on-year inflation with the annual change in GDP (Gross Domestic Product) per capita in Kenya and South Africa for the period 2018/2019 to 2020/2021 (Source: World Bank data on ‘GDP per capita’ and ‘Inflation, consumer prices’ for Kenya and South Africa The World Bank, 2023a,b,c,d).
The mounting pressure on the livelihoods of households in South Africa and Kenya is also evident when considering food security dynamics. According to the Global Food Security Index (The Economist Group, 2023), South Africa had a food security index of 61.7/100 in 2022 (being ranked 59th out of 113 countries), while Kenya had a comparably worse food security index of 53.0/100 in 2022 (being ranked 82nd out of 113 countries). According to the 2021 Stats SA General Household Survey (GHS) (Statistics South Africa, 2022a), the percentage of South African individuals that experienced hunger improved from 29% in 2002 to 11% in 2019, increasing to 12% in 2021. The percentage of individuals with limited food access improved from 29% in 2010 to 20% in 2019, worsening to 24% in 2021. In Kenya, FAO et al. (2022) estimates that for the period 2019–2021 severe and moderate food insecurity affects 27 and 70% of the population, respectively, (in the recent FAO publication ‘The state of food security and nutrition in the world 2022’). The United Nations Children’s Fund UNICEF (2022) reported that the population facing food insecurity in Kenya increased from 2.1 million in September 2021 to 4.5 million people in October 2022, strongly associated with the severe drought in Kenya in addition to other pressure factors as discussed in this section.
Food choices also have a critical impact on the livelihood and health of individuals. As mentioned earlier in this paper, changing food intake patterns often result from urbanization. From a broader perspective the nutrition transition refers to the shifts in dietary patterns toward more Western-orientated diets characterized by the intake of more animal protein, fat, salt, sugar and refined foods, while the intake of fresh produce and fiber-rich foods tend to decline (Bourne et al., 2002; Delgado, 2003; Popkin and Du, 2003; Du et al., 2004; Kruger et al., 2005; Steyn, 2006; Ghattas, 2014; Shisana et al., 2014). The nutrition transition is linked to adverse health outcomes such as overweight, obesity and resulting NCDs. Driving factors of the nutrition transition include rapid demographic, social and economic changes (due to economic growth and rising per capita income), increased urbanization and changes in food systems (including technological advances making low-cost, energy-dense and nutrient-poor foods more available) (Delgado et al., 1999; Pica-Ciamarra and Otte, 2009; Ghattas, 2014). Various studies have investigated and confirmed elements of the nutrition transition in Kenya (e.g., Peters et al., 2019; Mbogori et al., 2020; Rousham et al., 2020) and South Africa (e.g., Bourne et al., 2002; Steyn and Mchiza, 2014; Mbogori et al., 2020; Watson et al., 2021).
When considering the combined ‘perfect storm’ of the negative health outcomes associated with the nutrition transition, coupled with household income pressure, high food inflation and the prevalence of food insecurity, the necessity to measure the affordability of healthy eating is evident. An improved understanding of the cost of basic healthy eating in South Africa and Kenya can contribute to more comprehensive insights into the food and nutrition security landscape in these countries and can be a useful tool for policy analysis involving elements of consumer food choices and food affordability – ultimately helping the nation to achieve the goals of the UN sustainable development goals (SDGs) pertaining to food and nutrition security. In this study the main objective was to develop cost-effective and nationally representative models of basic healthy eating for Kenya and South Africa to measure the affordability of healthy eating. Furthermore, the study also focused on the formulation of policy recommendations to improve the measurement and application of the affordability of healthy eating in the target countries. The models of healthy eating presented in this paper flowed from an independent research initiative to explore the cost and affordability of healthy eating in the African context. These models could be adopted and applied by non-governmental organizations and/or government entities, and could also be applied to other African countries, to improve their ability to evaluate the cost and affordability of healthy eating in the continent.
2. Literature review
Before discussing the methodology applied to develop the models of basic healthy eating, this section presents an introduction to the concept of healthy food baskets, as well as examples of current applications in the target countries. A number of countries (e.g., United Kingdom, Canada, New Zealand, the United States of America (USA), Australia and Ireland) have been using baskets of ‘healthy’ food to monitor food cost and availability (Friel et al., 2004; Palermo and Wilson, 2007; Tsang et al., 2007; Carlson et al., 2007a,b; Health Canada, 2009; Williams, 2010; Department of Human Nutrition, University of Otago, 2018; Scott et al., 2018). The various reviewed healthy food baskets aimed to achieve a variety of objectives such as comparing the cost of healthy versus unhealthy foods, comparing the cost of healthy food in urban versus rural settings, examining the availability of healthy foods in various geographical settings, informing social grant policies, development of educational resources on healthy eating with a limited budget, investigating trends in food prices of healthy food items over time and comparing the affordability of healthy eating against particular household income scenarios (Williams, 2010; Lee et al., 2013). Methodologically these healthy food baskets vary in terms of numerous components (Williams, 2010; Lee et al., 2013), such as:
• The geographical level of monitoring (national, state, provincial or community level);
• The regularity of monitoring (e.g., monthly, ad hoc or once-off);
• The basis for defining ‘healthy’ food (e.g., focusing only on fruits and vegetables, based on national dietary guidelines, a selection of items which include ‘more realistic’ food items which are not generally considered as healthy or a selection of food items based on actual food choices made by consumers, measured with the help of nutritional surveys or household expenditure surveys);
• The socio-economic level of the target audience (e.g., healthy basket options varying from low-cost to moderate-cost to liberal-cost);
• The ‘target audience’ (e.g., hypothetical reference households or developed for specific age or gender groupings);
• The format of food items included [e.g., packaging sizes monitored, branded, generic or least expensive items monitored, level of processing considered (e.g., fresh, frozen, refrigerated, canned, juice options)];
• The methodology employed to obtain food price data (e.g., manual or electronic observations, in-store or online, the type of food stores surveyed, quantity of stores monitored and control for seasonality).
For South Africa limited existing food baskets could be found. The monthly monitored National Agricultural Marketing Council (NAMC) 28-item food basket (NAMC, 2022) is based on a selection of food items (and specific popular packaging sizes) commonly purchased by South African households and not on nutritional principles or a particular family size or composition. In a study investigating the “status of household food security targets in South Africa,” Jacobs (2009) mainly applied the NAMC food basket. However, the basket was not nutritionally balanced or compiled for any specific household size or time period.
Rose and Charlton (2002) applied quantitative indicators from income and expenditure data surveys to investigate food insecurity in South Africa and calculated the cost of nine different individual types of food plans. The food plans (also referred to as food ration scales) were compiled in 1993 by the previous South African Department of National Health and Population Development. It was based on nutrient recommendations from the USA. The plans specified the minimum quantities of food items that would fulfill the nutritional needs of nine different age-gender groups. A tender process was followed by the South African National Department of Health (DoH) to update the Food Ration Scales.
The Pietermaritzburg Economic Justice and Dignity Group (PMBEJD) (2023) monitors a basic and nutritionally complete diet on a monthly basis, focusing on several geographical locations in South Africa (Johannesburg, Cape Town, Durban, Springbok and Pietermaritzburg) where a small selection of food prices is recorded monthly at 44 supermarkets and 30 butcheries targeting the low-income market.
Similar to South Africa, limited existing food baskets could be found in the context of Kenya. The African Population and Health Research Center (Mohamed et al., 2021) investigated the cost of healthy eating in Kenya. The study used data from the 2015/2016 KIHBS which was evaluated against nine WHO/FAO healthy eating guidelines to evaluate the healthiness of diets. Comparisons involved gender, rural versus urban and different counties in Kenya. The study showed that 84% of households only achieved four or less of the healthy eating guidelines and that healthier eating habits were associated with factors such as higher income levels, rural living locations, the presence of young children in households, female headed households and higher education levels among the household head.
Based on the 2015/2016 KIHBS, the ‘Basic Report on Well-being in Kenya’ (Kenya National Bureau of Statistics, 2018) describes a rural and an urban food basket (achieving an energy intake of 2250 Kcal based on typical food preferences) compiled to determine food poverty lines. Both baskets contain a selection of 44 food and beverage items typically purchased by rural and urban households, within nine food categories (starch-rich foods, dairy, meat/fish/eggs, fruit, vegetables, legumes, fats/oils, sugar, and non-alcoholic beverages). The compilation of these baskets was based on typical food expenditure patterns and did not focus on healthy eating guidelines.
To the best knowledge of the authors, no evidence could be found of existing examples of nationally representative, regularly updated healthy or nutritionally balanced food baskets in South Africa and Kenya.
3. Materials and methods
The paper is based on two case study countries – South Africa and Kenya. The selection of these two countries was based on three main considerations: food security status, the availability of national food price data and the availability of official food intake guidelines at a national level. Within Sub-Saharan Africa, South Africa is the country with the best Global Food Security Index score (overall score of 61.7/100, ranking 59th out of 113 global countries and a food affordability score of 63.4/100). Kenya on the other hand has a much lower Global Food Security Index score (overall score of 53.0/100, ranking 82nd out of 113 global countries and a worse food affordability score of 41.7/100 compared to South Africa). In both countries monthly national food price data for a selection of foods is published regularly by national statistical agencies and both countries have official food-based dietary guidelines.
As previously mentioned, the BHFB’s aimed to provide an approach to enable the regular (monthly) monitoring of the cost and affordability of healthy eating in the target countries at a nationally representative level in a cost-effective manner. These healthy food baskets were based on the best publicly available data foundations as listed above. These BHFB’s were also developed to be a versatile and adaptable tool to monitor the cost and affordability of healthy eating, by allowing for the characteristics of different households to be accounted for, e.g., in terms of the total household size, as well as the number of household members from different age and gender groupings. Furthermore, the models were developed to have the potential to be expanded to a geographically disaggregated level (e.g., provincial level or even more specific geographical regions) subject to the availability of data on food prices and food preferences pertaining to the particular geographical area.
A schematic view of the methodology applied to develop the basic healthy food baskets (BHFB’s) in South Africa and Kenya is illustrated in Figure 3. By interpreting official dietary guidelines along with typical food preferences and household characteristics the food items and food quantities required to feed the reference family for a one-month period was determined. Official food composition data for the target countries was applied to evaluate the nutritional adequacy of the BHFB’s. Food retail price data was subsequently applied to determine the BHFB’s cost per month after which the BHFB costs were analyzed in the context of typical household income levels and food expenditure shares to evaluate the affordability of healthy eating. Specific model inputs for each country (i.e., in terms of official dietary guidelines, typical household size, typical household composition, defining single serving units, food retail price data, food composition data and household income data) are described in more detail below.
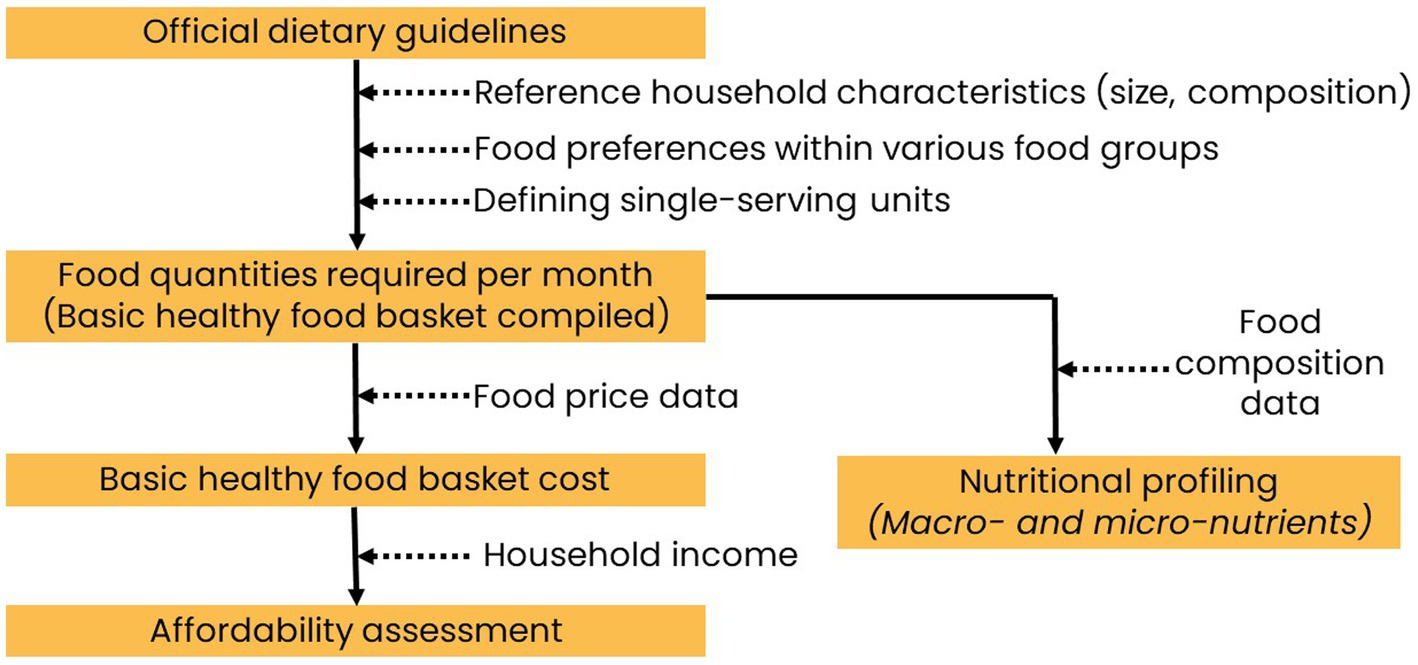
Figure 3. Overview of basic healthy food basket methodology (Source: Authors’ depiction of the methodology).
A number of assumptions were applied to develop the BHFB models, based on lessons learnt from literature (Lee et al., 2013): minimal food waste at household-level, the majority of purchased foods are consumed, all food consumed by the reference group is prepared at home, equitable consumption of food amongst individual household members according to their nutritional needs and the purchasing of all food required by the household (i.e., no production of food at household-level taken into consideration).
3.1. Defining healthy eating
Official national healthy eating guidelines formed the basis of the BHFB’s, with specific reference to the South African Food-based Dietary Guidelines (Vorster et al., 2013), the Kenya National Guidelines for Healthy Diets and Physical Activity (2017) (Kenya Ministry of Health, 2017) and the WHO healthy diet guidelines (WHO, 2020). These guidelines were applied within the practical framework included in the South African DoH “Guidelines for Healthy eating” (National Department of Health, South Africa, 2013a), providing guidance on the number of servings from different food groups to be consumed by different age and gender groupings with average height and moderate activity levels with different energy needs. Single serving units (a single unit of a particular food within a particular food group providing a similar amount of nutrients as other units within the same group) were also defined based on the content of the “Guidelines for Healthy eating” and the respective country dietary guidelines (for example one slice of bread, half a cup of cooked starch-rich food, an 80 g edible serving of fresh produce, half a cup cooked beans, one teaspoon of plant oil and 85 g lean cooked meat).
3.2. Household characteristics
Table 1 presents the characteristics of a typical household in Kenya and South Africa (with relevant literature sources), consisting out of a 4-member household with two adults and two children in both countries. It should be noted that the flexible design of the BHFB models allows for the calculation of the cost of basic healthy eating for other household sizes and compositions as well if required.
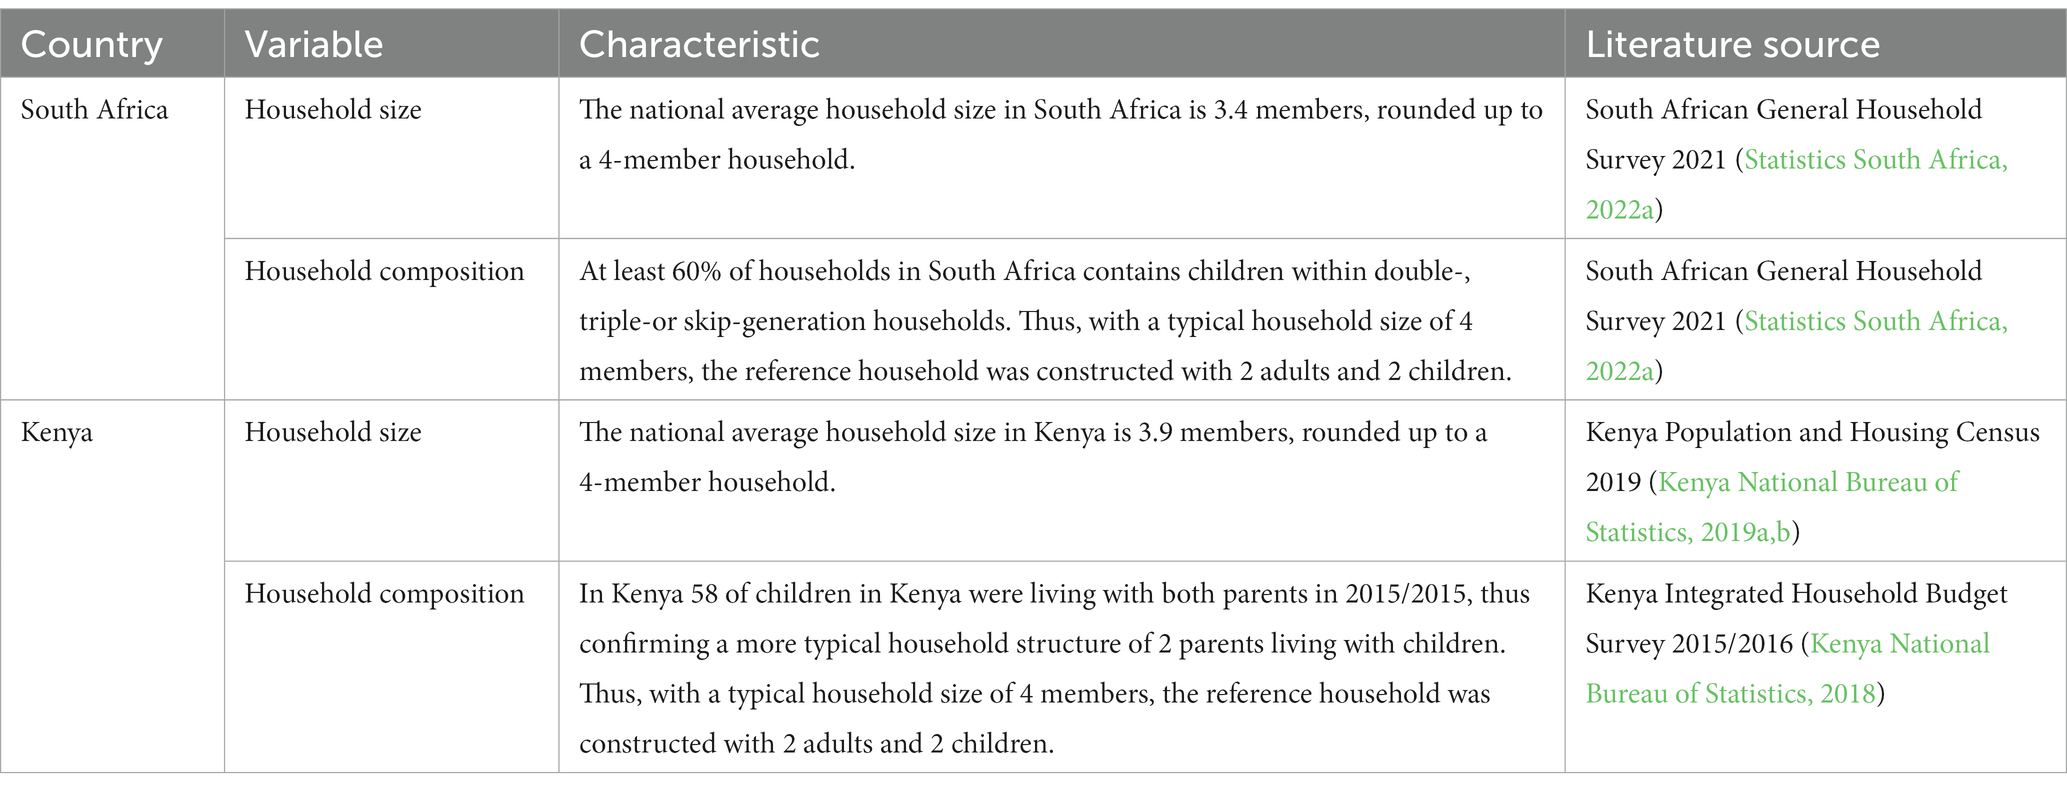
Table 1. Household characteristics.
3.3. Typical food preferences in South Africa and Kenya
Tables 2, 3 presents summaries of the literature information applied to select the food items to be included in the BHFB’s for Kenya and South Africa, respectively. In addition to literature sources a survey among experts within the food and nutrition context in Kenya was conducted in 2022 to identify the dominant food items within the food groups. The combination of sources were applied to identify the dominant food items within the various food groups for inclusion in the BHFB’s.
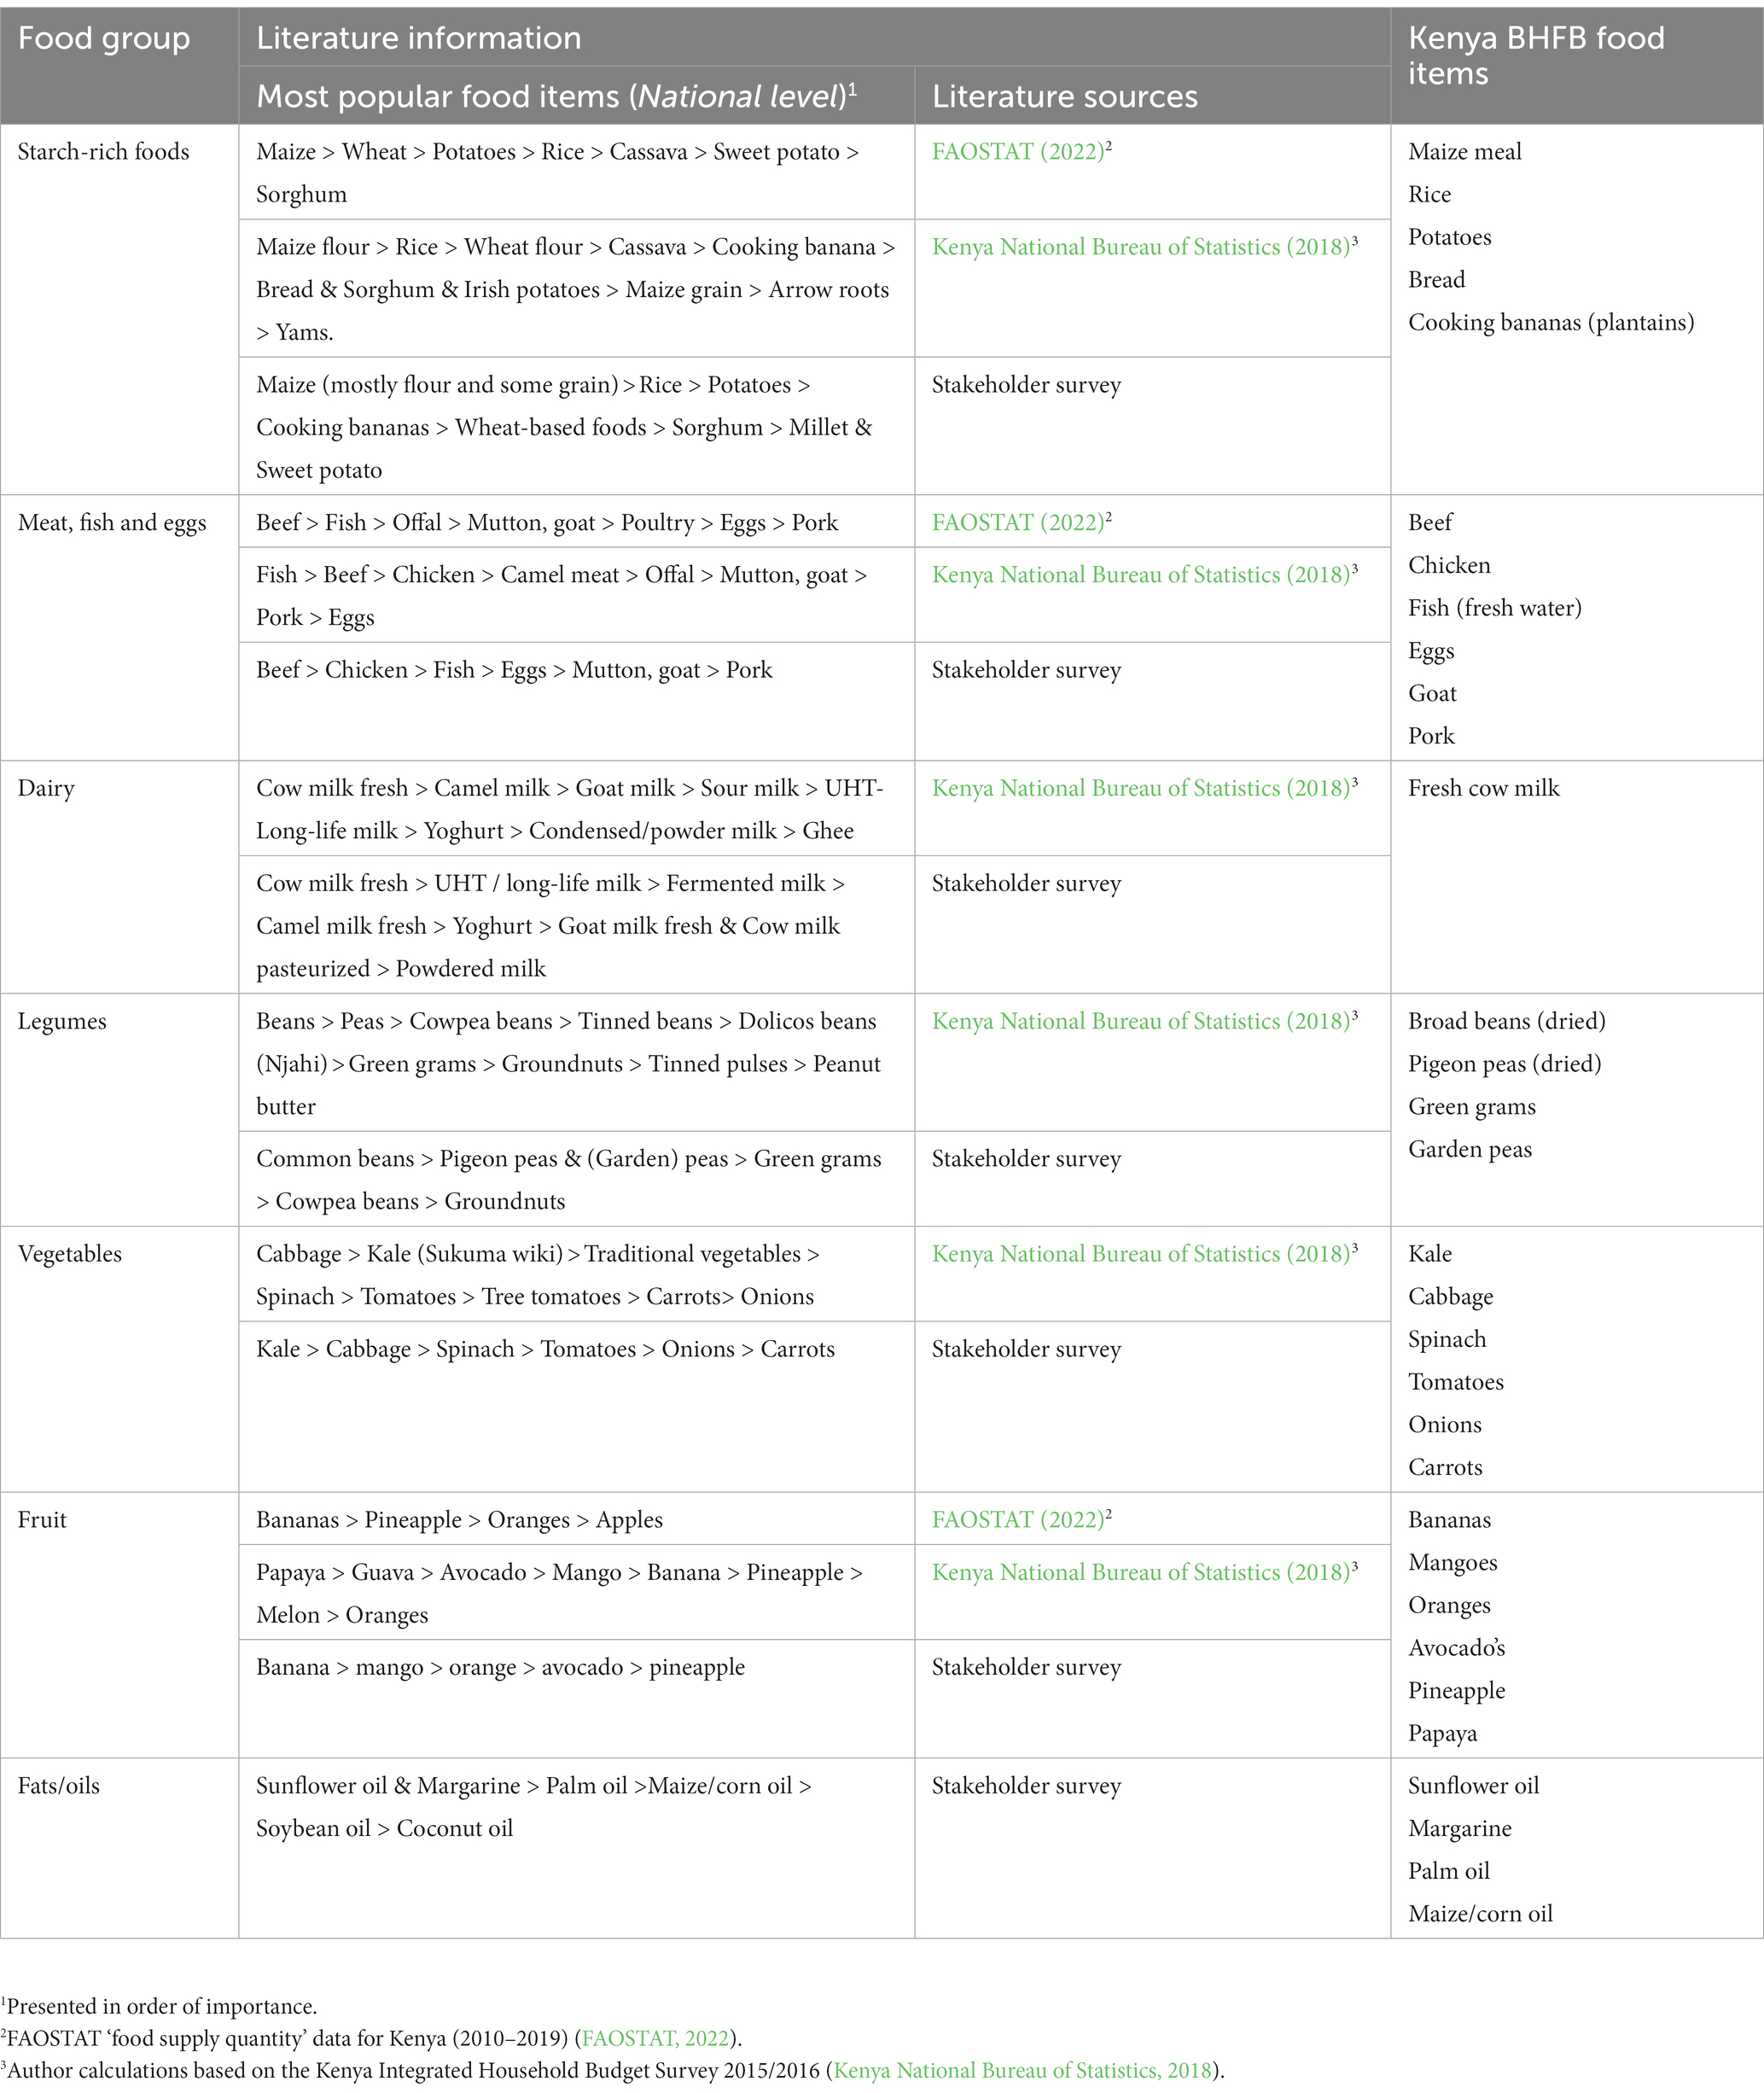
Table 2. Dominant food items consumed in Kenya.
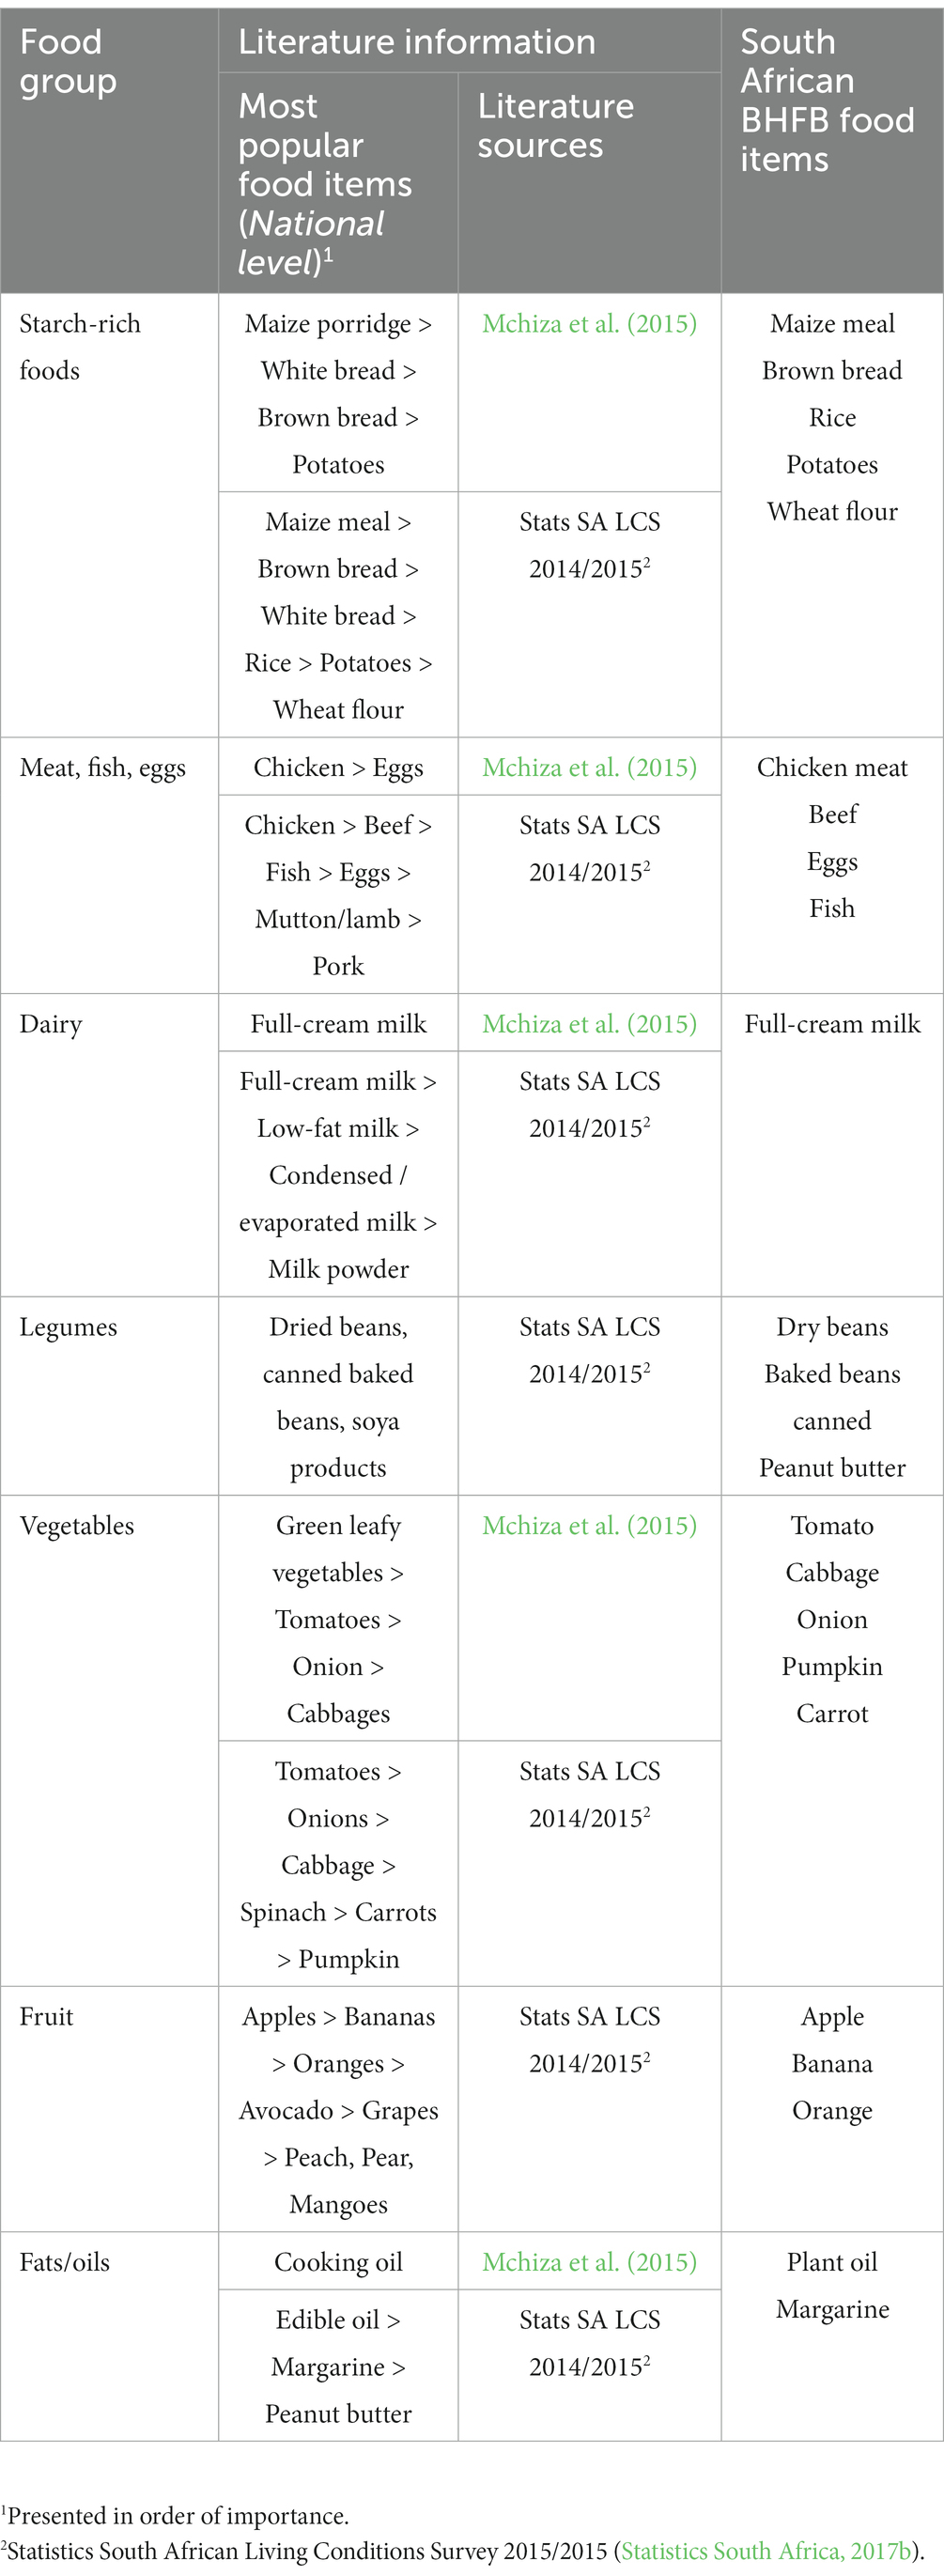
Table 3. Dominant food items consumed in South Africa.
3.4. Food retail price data
3.4.1. Food retail price data in Kenya
The retail-level food prices available on the World Food Programme (2022) Price Database for Kenya, include foods from a variety of food groups: maize grain, maize meal, rice, sorghum, wheat flour, Irish potatoes, beef meat, camel meat, goat meat, fresh camel milk, fresh cow milk, UHT milk, cooking fat, vegetable oil, bananas, dry beans, salt and sugar. The availability of recent food retail prices in Kenya within this source is problematic with the most recent data for March 2022 for selected items only, with some items only having observations captured until 2020 or even earlier dates. Furthermore, the current selection of food retail prices for Kenya in the WFP food price database contains a limited selection of fruit, legumes, vegetable oil products, meat and no non-starch-rich vegetables.
The complete food price database applied by the Kenya Bureau of Statistics to compile the CPI (consumer price index) is not available in the public domain and despite the best efforts of the authors could not obtained from the Kenya Bureau of Statistics. Only the average monthly retail prices of some varied food items are reported in the monthly publication ‘Consumer Price Indices and Inflation Rates’ (more detail on the food prices reported for 2022/2023 can be obtained from the authors on request). Based on an analysis of the 2022 and 2023 Consumer Price Indices and Inflation Rates’ publications the following food items are monitored:
• Starch-rich foods (fortified maize flour, loose maize flour, sifted maize flour, loose maize grain, white wheat flour, white bread, Irish potatoes, aromatic and unbroken rice, non-aromatic and unbroken rice).
• Animal-source foods (Beef with bones, eggs, cow milk (fresh, packeted), cow milk (fresh, unpacketed), goat milk).
• Vegetables (avocado, capsicums, cabbages, carrots, kale, onions, spinach, tomatoes).
• Fruit (mangoes, oranges).
• Legumes (beans, cowpeas, green grams).
• Fats/oils (cooking fat, cooking oil).
• Sugar.
Comparing these food items against the food included in the Kenya BHFB revealed a number of foods with non-available national average retail prices: chicken meat, fish (Tilapia & Nile perch), goat meat, pork meat, broad beans (dried), pigeon peas (dried), garden peas, bananas, avocado’s, pineapple, papaya, sunflower oil, margarine, palm oil and maize/corn oil.
Costing the Kenya BHFB for January 2023 was based on the available retail prices from the Kenya Bureau of Statistics, supplemented with retail prices obtained from prominent Kenyan retailer(s) (researched online) to enable costing based on all food items included the basket design.
3.4.2. Food retail price data in South Africa
In South Africa, Statistics South Africa engage in the monthly monitoring of a wide range of food items from all food groups (Statistics South Africa, 2023):
• Starch-rich foods (rice, white bread, brown bread, sweet biscuits, savory biscuits, bread rolls, rusks, spaghetti, macaroni, other pasta, instant noodles, cake wheat flour, bread wheat flour, maize meal, breakfast cereals, hot cereals (porridge) including instant porridge, ready-mix flour, samp (coarsely crushed maize grain), potatoes, frozen potato chips, sweet potatoes).
• Animal-source foods beef (rump steak, brisket, chuck, T-bone, mince, filet, sirloin, stewing meat, offal, corned beef), pork (chops, ribs, filet, ham, bacon), mutton/lamb (rib chops, loin chops, leg, neck, offal, stewing meat), chicken [whole bird, fresh portions, individually quick frozen (IQF) portions, giblets (neck, gizzards, hearts, etc)], other meat options (polony, dried meat, sausage, beef extract), fish (frozen hake, frozen fish fingers, canned tuna, canned pilchards), eggs, dairy (fresh and long life full cream and low-fat milk, powdered milk, condensed milk, yogurt, cheese, fresh cream, sour milk, prepared custard, maize based food drink with dairy, flavored milk).
• Vegetables (lettuce, spinach, cabbage, cauliflower, broccoli, tomatoes, pumpkin, sweet peppers, frozen vegetables, cucumber, onions, carrots, beetroot, mushrooms, prepared salads, canned mixed vegetables).
• Fruit (oranges, bananas, apples, pears, avocados, papaya, pineapple).
• Legumes (peanut butter, peanuts, dried beans, caned baked beans).
• Fats/oils [margarine, sunflower oil (including canola oil)]
• Sugar-rich foods (white sugar, brown sugar, jam, chocolates, sweets, chewing gum, ice cream).
• Other foods (potato crisps, corn chips, vinegar, chutney, tomato sauce, mayonnaise, salad dressing, whiteners, salt, spices, curry powder, baby food, instant yeast, baking powder, soup powder).
• Non-alcoholic beverages (coffee, tea, drinking chocolate, mineral water, fizzy drinks, fruit juices, dairy mixture drinks)
All the food prices needed to cost the South African BHFB are monitored and reported by Stats SA. Even though the food price monitoring activities of Stats SA are very comprehensive selected items could be added to improve the applicability of the database, including different types of plant oils (sunflower oil, canola oil, cooking oil (mixed content) and olive oil), as well as a more comprehensive selection of legumes, e.g., specific types of dried and canned beans (such as split peas, lentils, samp and beans mix, sugar beans, white beans, speckled beans, kidney beans and sugar beans), as well as a more comprehensive selection of soya-based foods, e.g., soya beans, soya ‘mince’ (budget meat alternative product). The inclusion of these products could expand the possibilities of calculating food baskets with proportionally larger plant-based components in future.
3.5. Nutritional adequacy evaluation
The nutritional profile of the two BHFB’s were calculated according to data from the South African Food Data System (SAFOODS) as described in the South African Medical Research Council Food Composition Tables for South Africa (SAFOODS, 2017), as well as the Kenya Food Composition Tables of 2018. Reference intake values for macro-nutrients were obtained from the Institute of Medicine (2005), with the recommended share of total energy derived from macronutrients applied (total carbohydrates: 45–65%; total fat: 20–35%; total protein: 10–35%) (Institute of Medicine, 2005). The following energy conversion factors were applied: 17 kilojoules (kJ) per gram for protein and total carbohydrates, and 37 kJ per gram for fat (Klensin et al., 1989). Reference intake values for micro-nutrients were obtained from the Institute of Medicine (2006). An adult female within the reference family was used as a reference person focus to analyze the nutritional adequacy of the South Africa BHFB’s. The nutritional adequacy of the BHFB’s was evaluated by comparing the nutritional profile of the baskets with intake recommendations.
3.6. Affordability assessment
To analyze the affordability of the BHFB’s in the two target countries, the calculated cost of BHFB’s were compared against household income from one or two household members earning a minimum wage, as well as the typical household income levels within the target countries with typical food expenditure shares also taken into consideration (see Table 4).
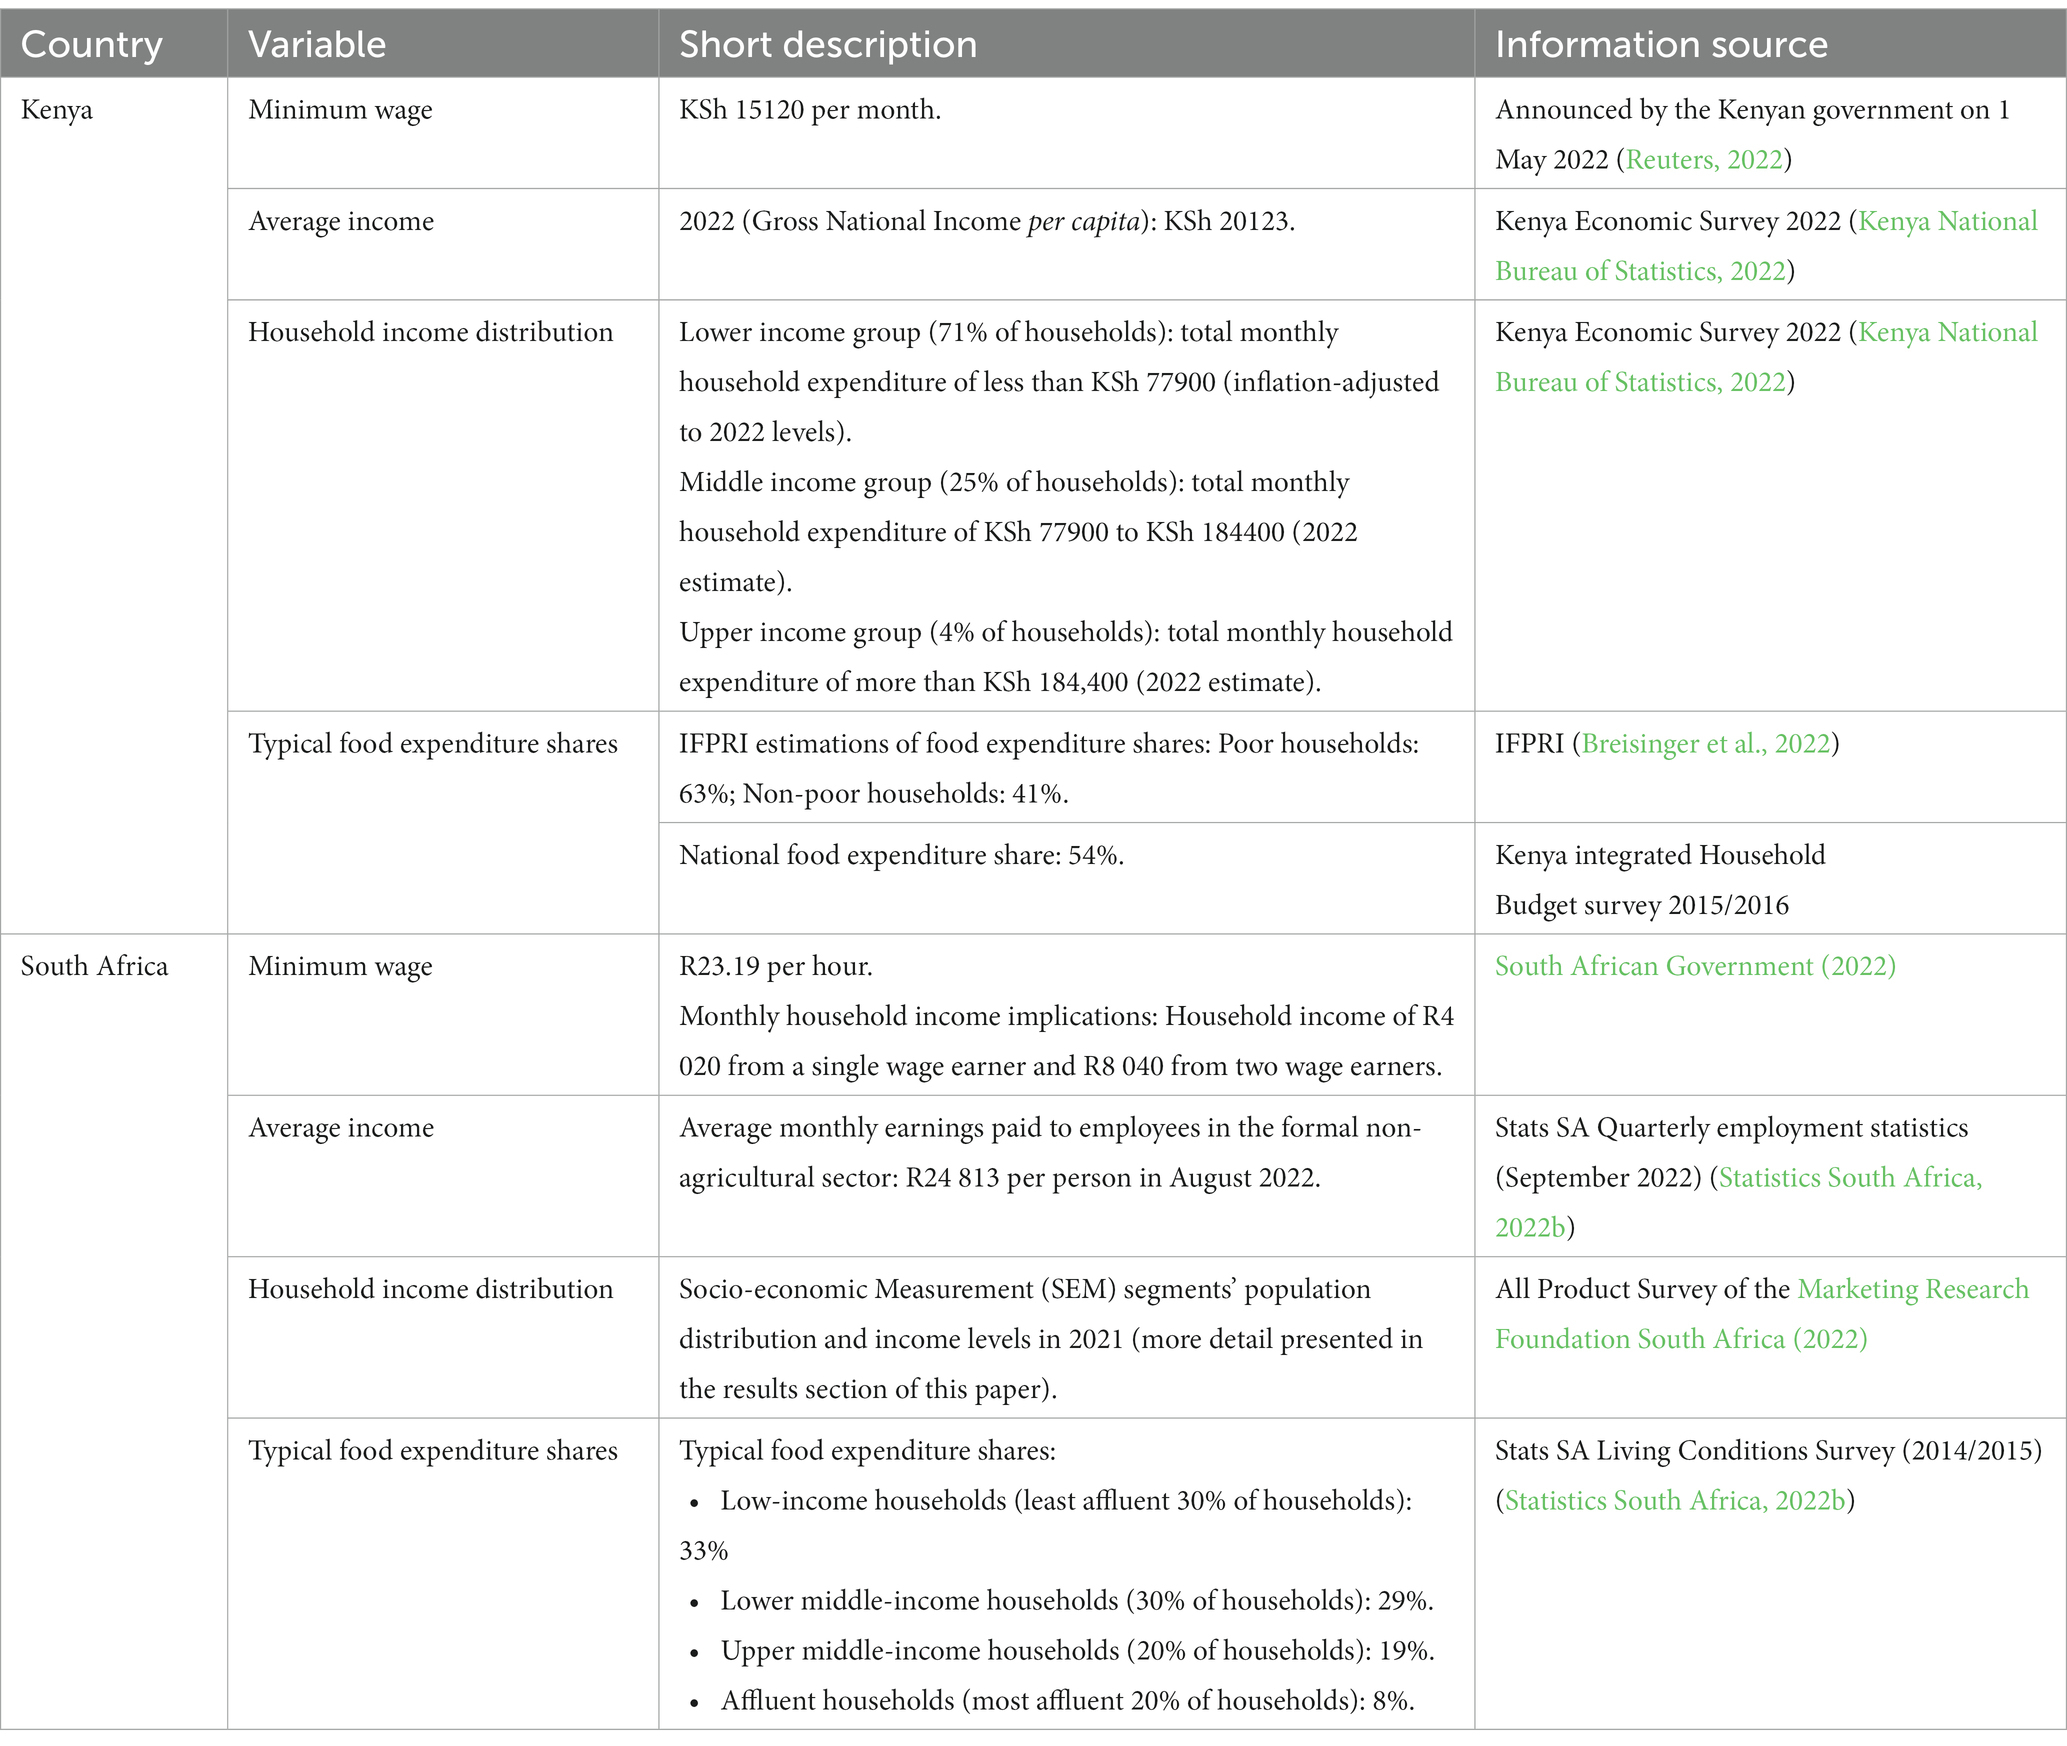
Table 4. Data applied to measure BHFB affordability in South Africa and Kenya.
4. Results
4.1. A model of basic healthy eating for Kenya
Table 5 presents an overview of the composition of the Kenyan BHFB, based on the interpretation of the typical food consumption patterns in Kenya and national nutritional guidelines. The Kenya BHFB contains 31 food items within all the food categories: starch-rich foods, meat/fish/eggs, dairy, fats/oils, fruit, vegetables and legumes.
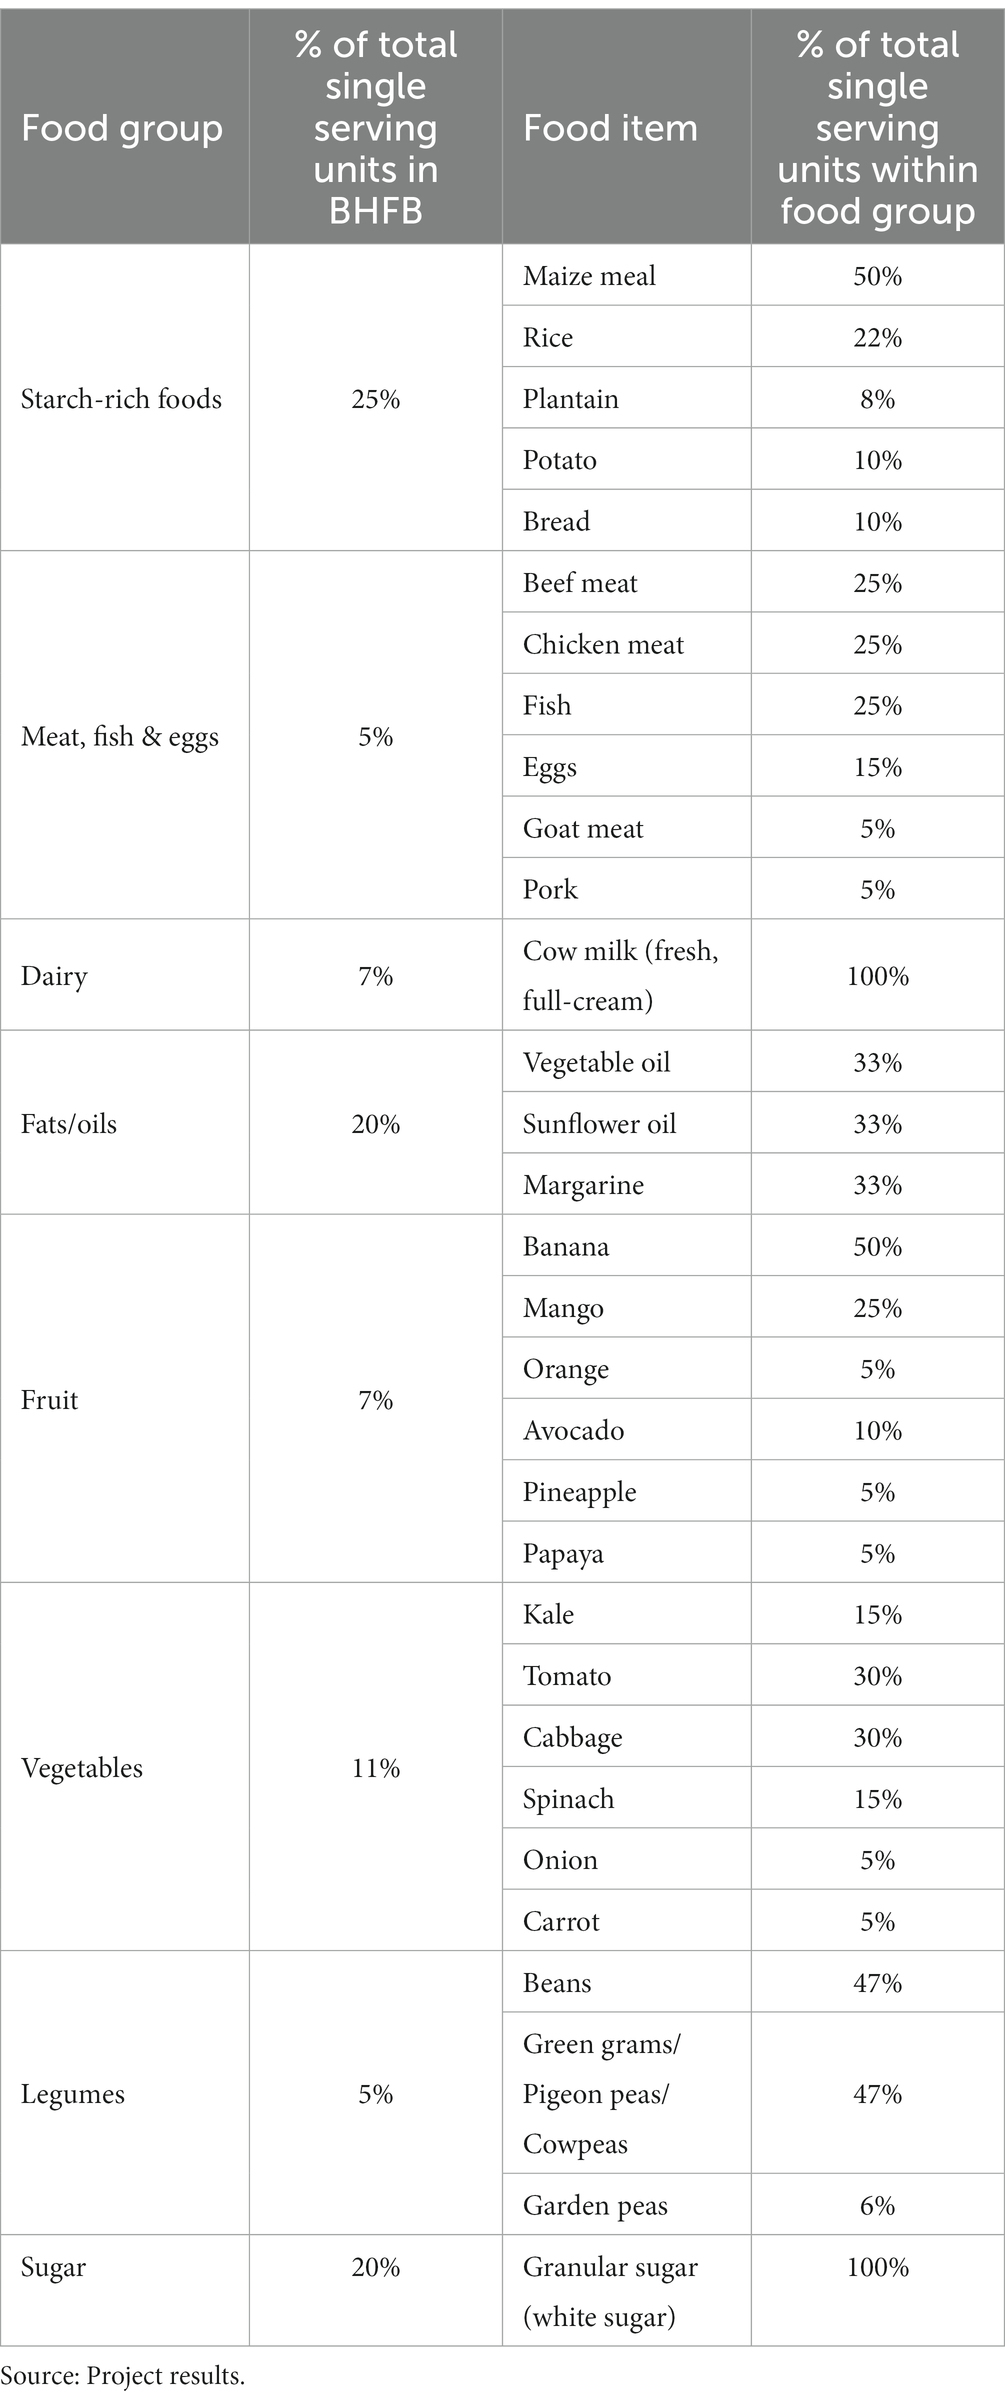
Table 5. Composition of the national BHFB for Kenya.
The Kenya BHFB’s met 95–97% of the estimated energy requirements (EER) of an adult female. The energy derived from carbohydrates, protein and fat is within the recommended ranges. In terms of fiber, the required intake was satisfied in all the Kenya BHFB’s. The Kenya national BHFB met more than 100% of the micro-nutrient requirements for Mg, P, K, Zn, Thiamine, Riboflavin, Niacin, Folate, Vitamin B12 and Vitamin C, while meeting at least 90% of more of the daily requirements for Ca, Fe, Se and Vitamin A. The Kenya urban BHFB met more than 100% of the micro-nutrient requirements for P, K, Zn, Se, Vitamin A, Thiamine, Riboflavin, Niacin, Folate, Vitamin B12 and Vitamin C, while meeting at least 90% of more of the daily requirements for Ca, Fe and Mg. The Kenya rural BHFB met more than 100% of the micro-nutrient requirements for Ca, Mg, P, K, Zn, Thiamine, Riboflavin, Folate, Vitamin B12 and Vitamin C, while meeting at least 85% or more of the daily requirements for Fe, Se, Vitamin A and Niacin.
From the perspective of micro-nutrients of concern in Kenya [as reported in the Kenya national micronutrient survey of 2011 (Kenya Medical Research Institute et al., 2011)], the Kenya BHFB’s developed in this project could supply more than 100% the daily needs for Zinc and Folate, and at least 90% or more of the daily needs for Iron and Vitamin A.
In January 2023 the cost of the Kenyan BHFB for the reference family of four amounted to KHs (Kenyan Shilling) 33800 (US$ 270), with the largest cost contribution from animal-source foods followed by starch-rich foods as shown in Figure 4. If the ration of meat/fish/eggs to legumes in the Kenyan BHFB is changed from 1:1 to 1:2 (i.e., a more plant-based basket) the January 2023 cost of the Kenyan BHFB could be reduced by approximately 15%. Thus, a more plant-based eating pattern could contribute to households’ ability to afford basic healthy eating in Kenya.
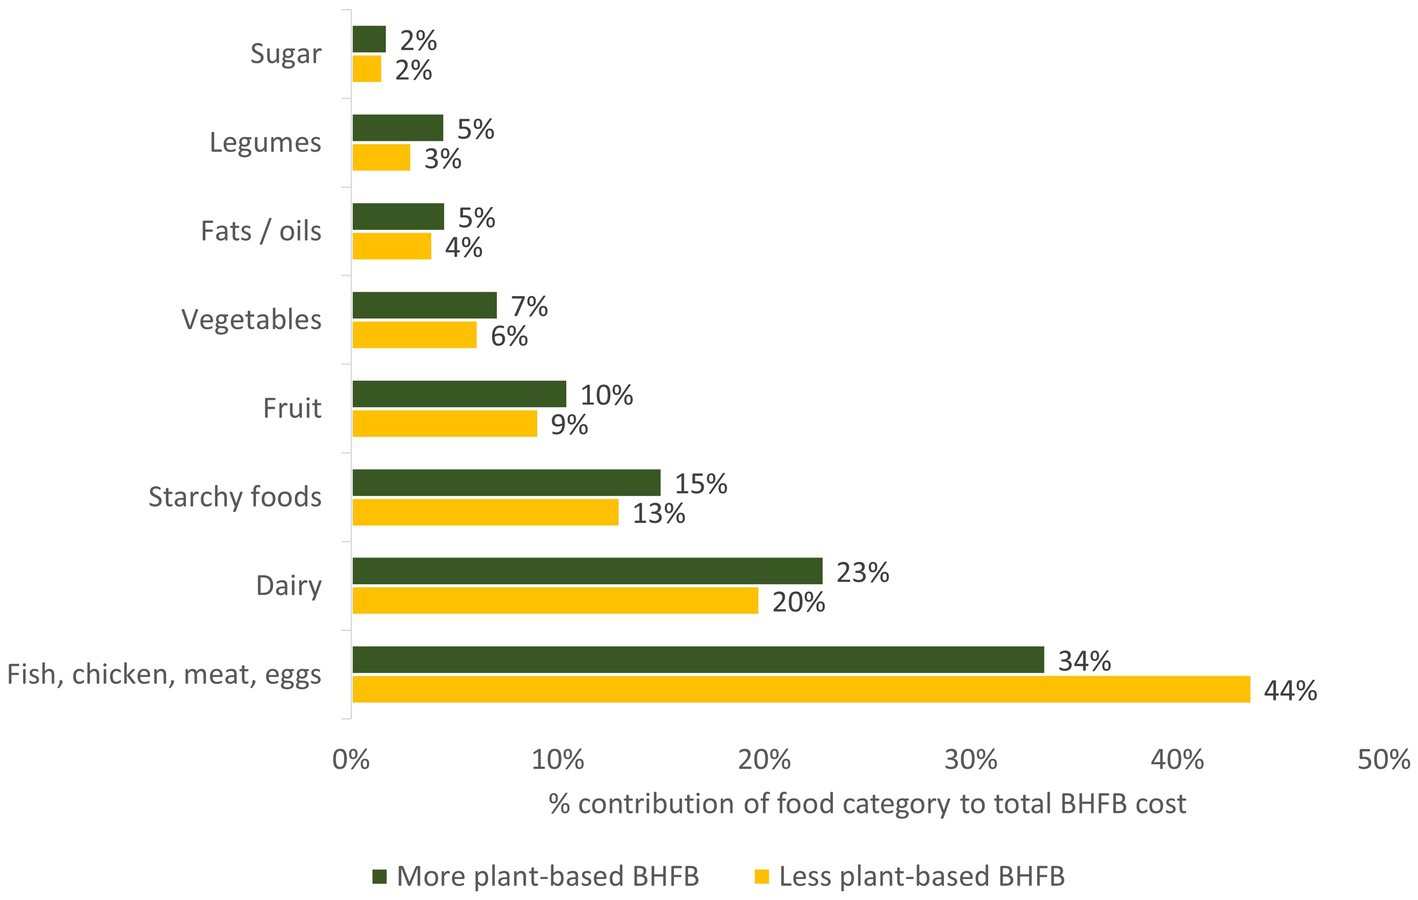
Figure 4. Food category cost contributions within the nation Kenyan BHFB (Source: Project results). BHFB, Basic healthy food basket.
Table 6 explores the affordability of the Kenyan national BHFB for January 2023. The BHFB is not affordable to households with a dual minimum wage income or households earning two average salaries.
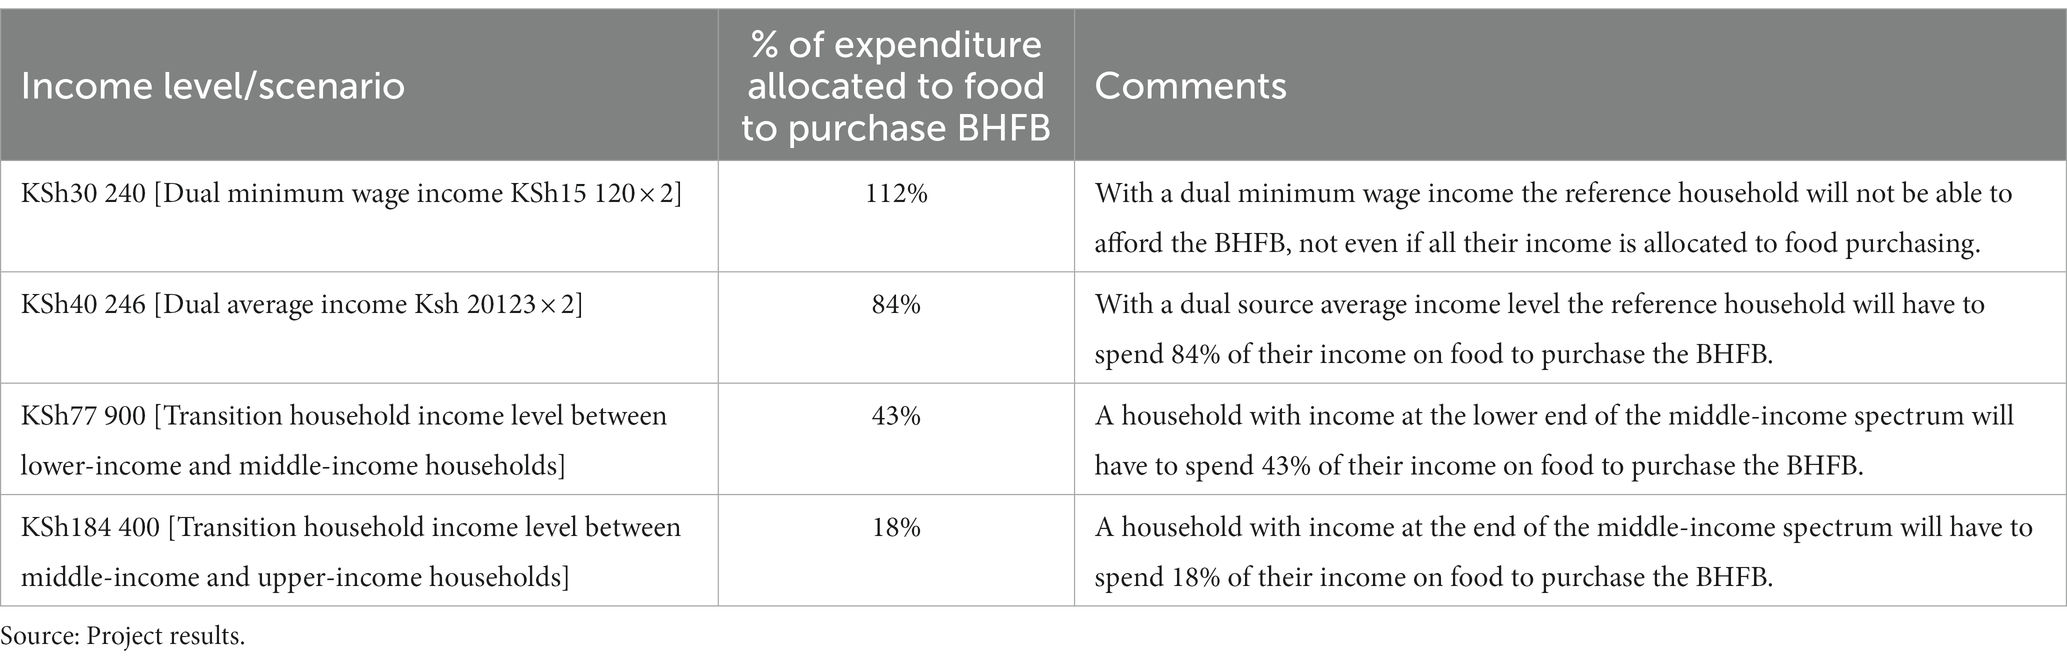
Table 6. The affordability of the Kenyan national BHFB (KSh 33800 in January 2023).
A household with income at the lower end of the middle-income spectrum will have to spend 43% of their income on food to purchase the BHFB. This food expenditure share is close to the 41% food expenditure indicated by the International Food Policy Research Institute (IFPRI) (Breisinger et al., 2022) for non-poor households in Kenya.
If the reference household wanted to purchase the BHFB in January 2023 with a 54% food expenditure share (i.e., the national average food expenditure share) the household would require a total monthly income of approximately KSh62 600 (US$500) – representing a household income only approximately 20% below the upper-limit of the lower-income household bracket. With 71% of households classified with the lower-income bracket it could be argued that the bulk of lower-income households will not be able to afford the BHFB.
The challenge of healthy diets in Kenya was also confirmed by Mohamed et al. (2021) who concluded that more than half of households in Kenya only met two out of nine healthy diet recommendations (total fat 15–30% of total energy and total dietary fiber 25 g/day or more), with 84% of households only achieving four or less of the healthy eating guidelines. Only 21% of households attained a total protein intake of 10–15% of total energy and only 45% of households managed to consume fruits and vegetables of 400 g/day or more.
4.2. A model of basic healthy eating for South Africa
Table 7 presents an overview of the composition of the South African BHFB, based on the interpretation of the typical food consumption patterns in South Africa and national nutritional guidelines. The BHFB contains 24 food items within all the food categories: starch-rich foods, meat/fish/eggs, dairy, fats/oils, fruit, vegetables and legumes. The differences in the composition of the BHFB models for South Africa and Kenya are mainly rooted in:
1. Different typical food intake patterns within the various food groups;
2. The nature of the reference group used to analyze typical food intake (low-income consumers in the case of South Africa and the average population in the case of Kenya);
3. In the case of the South African BHFB model the availability of historical time series data was also a significant factor leading to a smaller number of basket items compared to the Kenya BHFB.
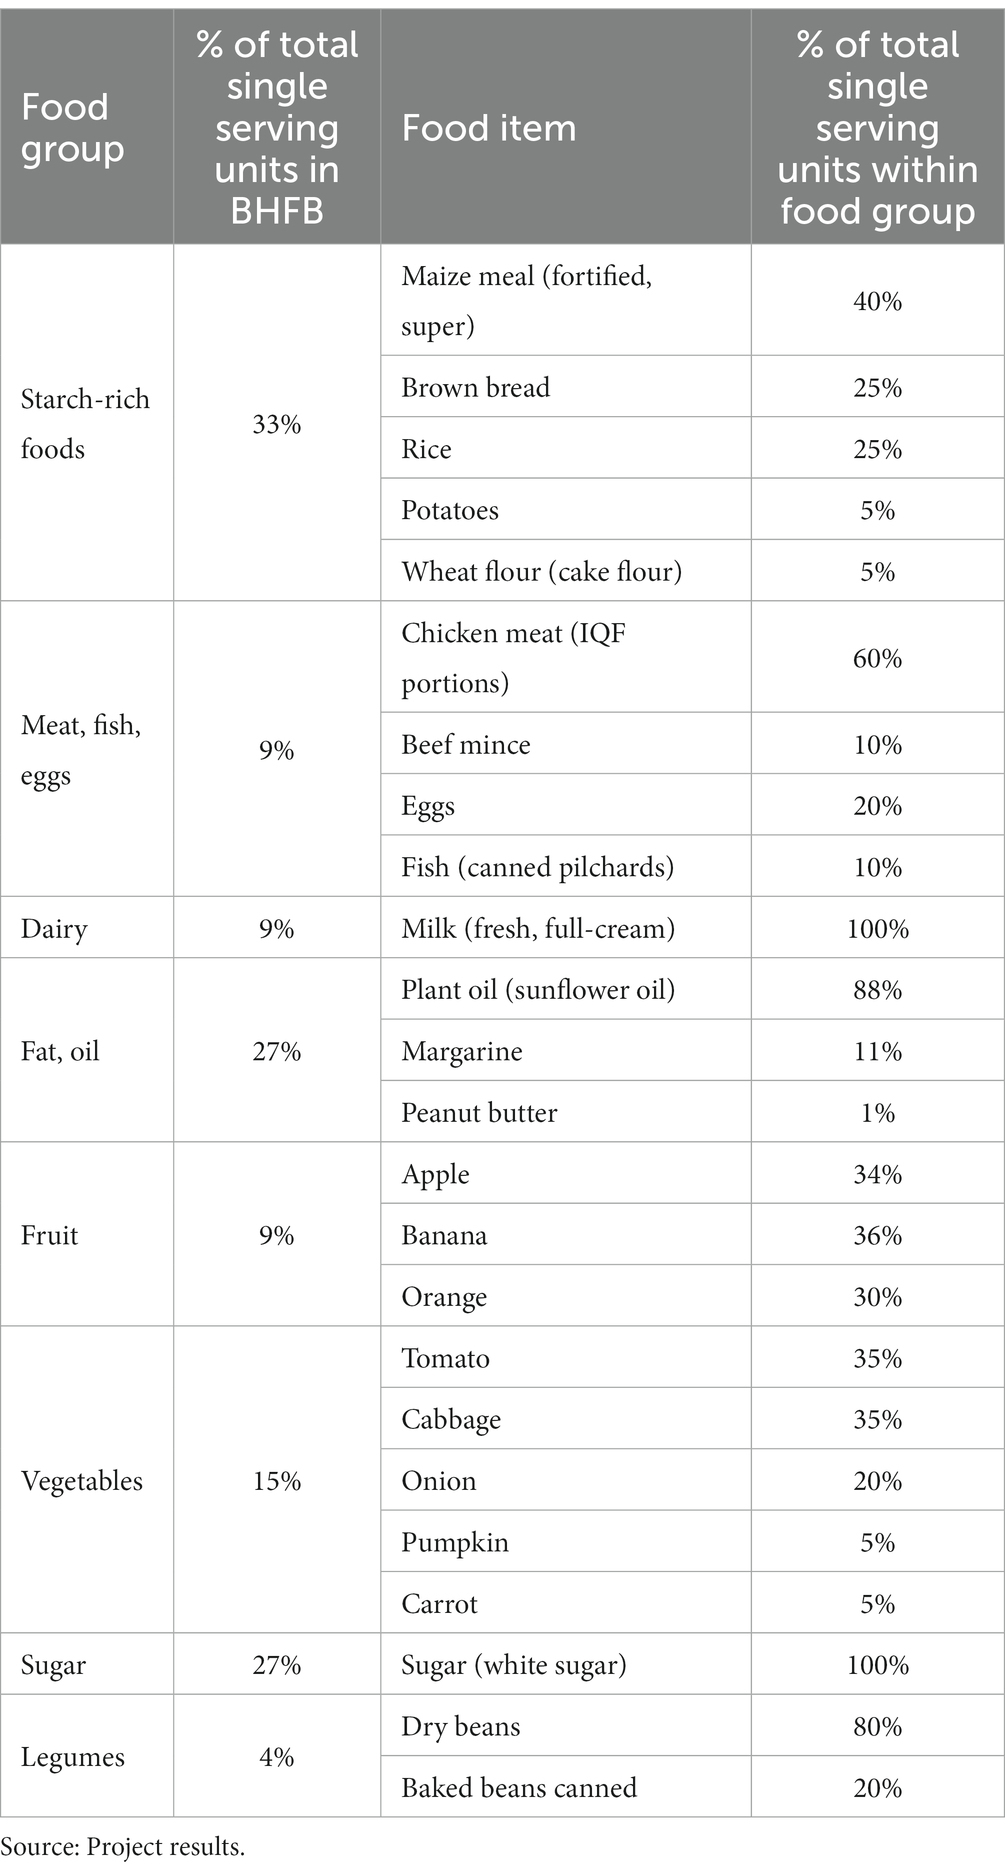
Table 7. Composition of the national BHFB for South Africa.
The South African BHFB met 97–101% of the estimated energy requirements (EER) of an adult female. The energy derived from carbohydrates, protein and fat is within the recommended ranges for all three baskets. The South Africa national BHFB met more than 100% of the micro-nutrient requirements for P, K, Zn, Cu, Mn and vitamins A, B1, B2, B3, B12, B5, B7, C, E and folate, while meeting 81% of iron requirements, 86% for calcium and 91% for magnesium. The South Africa BHFB that are more plant-based met more than 100% of the micro-nutrient requirements for Mg, P, K, Zn, Cu, Mn and vitamins A, B1, B2, B3, B12, B5, B7, C, E and folate, while meeting 81% of the daily requirements for iron and 87% for calcium. Both baskets were low in vitamin D.
According to a consensus study report of the Academy of Science of South Africa (2013) micro-nutrients of concern in South Africa include vitamin A, vitamin D, folate and the minerals iron and zinc. The South Africa BHFB’s developed in this project could supply more than 100% the daily needs for zinc, vitamin A and folate, and at 71–81% of the daily needs for iron.
In December 2022 (latest month for available Stats SA food retail prices) the cost of the South African BHFB for the reference family of four amounted to R (South African Rand) 4715 (US$ 262). The largest cost contributions came from animal-source foods (meat/fish/eggs & dairy) (55% contribution), followed by vegetables (15%), fruit (10%) and starch-rich foods (9%), with smaller contributions from legumes (5%), fats / oils (4%) and sugar (1%).
If the ratio of meat/fish/eggs to legumes in the South African BHFB is changed from 1:1 to 1:2 (i.e., a more plant-based basket) the December 2022 cost of the South African BHFB could be reduced by approximately 15%. Thus, similar to Kenya, a more plant-based eating pattern could contribute to households’ ability to afford basic healthy eating in South Africa.
In December 2022, the South African reference household with four members, with two members earning the minimum wage, had to spend approximately 58% of income to afford basic healthy eating in the form of the BHFB. If such a household could benefit from government child support grants [R480 (US$ 24)/child/month (Western Cape Government, South Africa, 2022)], combined with receiving meals at school within the South African National School Nutrition Programme (South African Government, 2023), such a household had to spend approximately 45% of income to afford basic healthy eating. According to the Stats SA LCS 2014/2015 (Statistics South Africa, 2017b) the least affluent 30% of households allocated 33% of total expenditure to food implying that a food expenditure share of 45% is beyond the financial reach of a household with this type of income typology.
For an alternative perspective on the affordability of healthy eating in South Africa, a reference household with a 33% food expenditure share will have to earn approximately R13 400 (US$ 733) per month to afford the BHFB (see the gray income line in Figure 5), or R 9574 (US$532) per month if also receiving child support grants and school meals within the NSNP (see the red income line in Figure 5). According to the South African income distribution reported by BFAP (2022) based on the SEM (Socio-economic Measurement) segmentation tool of the Marketing Research Foundation, these required income levels implies that approximately 64% of households (i.e., SEM 1 to SEM 6 with income levels below the gray line) cannot afford basic healthy eating (without additional support from child support grants and school meals). In the case where the impact of child support grants and school meals are taken into consideration, Figure 5 illustrates that 52% if households (i.e., SEM 1 to SEM 5 with income levels below the red line) will not be able to afford basic healthy eating. Thus, child support grants and school meals could increase the share of households that could afford basic healthy eating from approximately 36–48% of South African households.
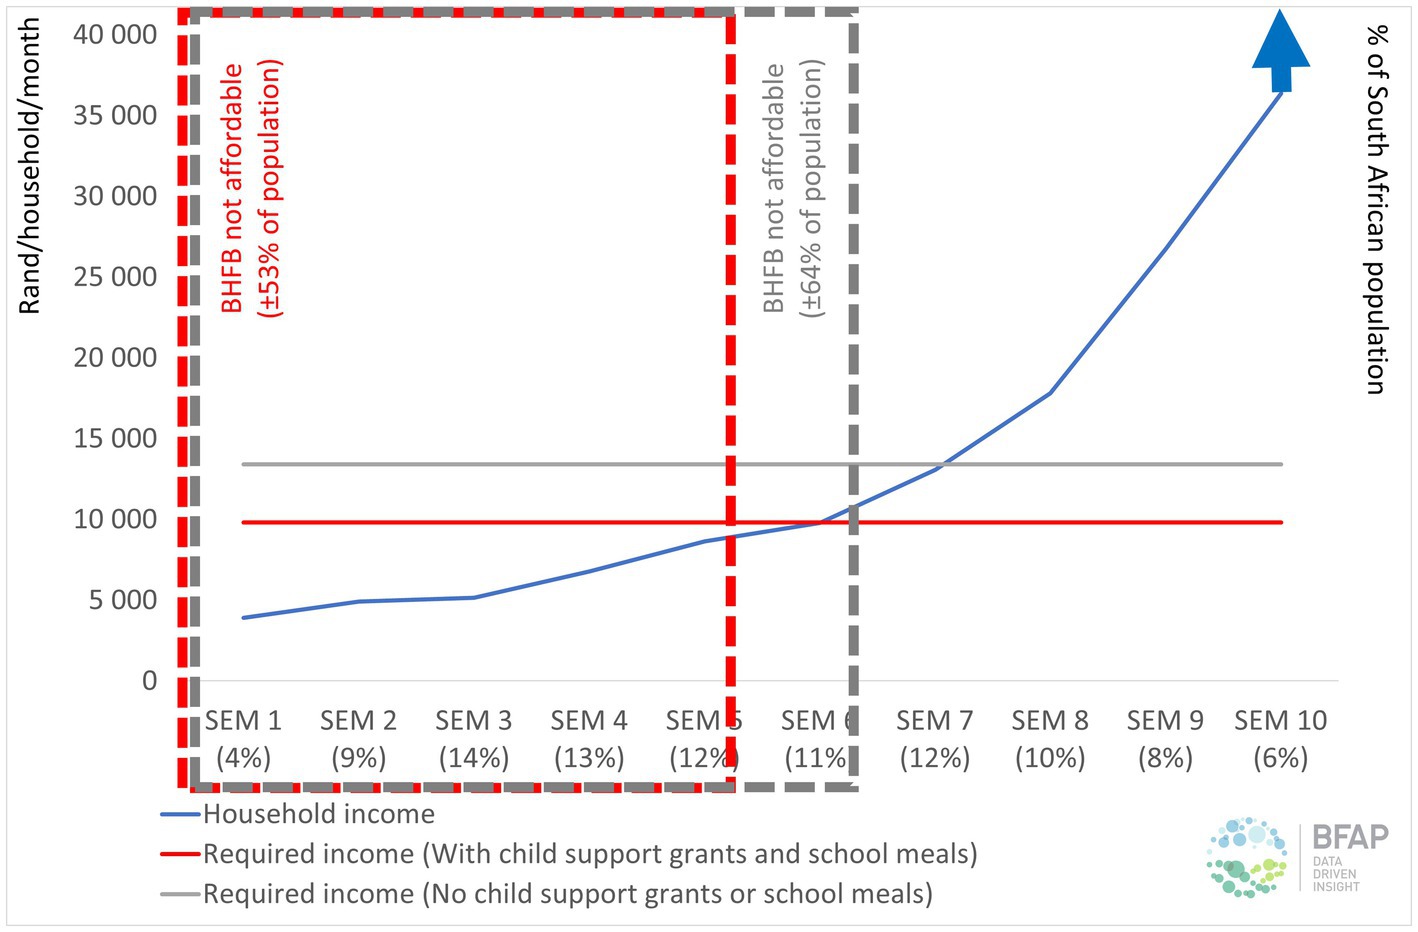
Figure 5. The affordability of the South African national BHFB within the socio-economic spectrum in 2022 [Sources: SEM distribution and income levels from the Marketing All Product Survey of the Marketing Research Foundation South Africa (2022)]. SEM, Socio-economic Measurement Segment; BHFB, Basic Healthy Food Basket.
5. Discussion
In this study the main objective was to develop Basic Healthy Food Basket (BHFB) models for South Africa and Kenya to evaluate the cost and affordability of basic healthy eating. The methodology relied on a number of key considerations (i.e., ‘building blocks’): household demographic, household income, typical food intake patterns, nationally monitored food retail prices and official country-specific nutrient intake and food consumption guidelines. Suitable food composition data was applied to evaluate the nutritional adequacy of the BHFB models.
In December 2022/January 2023 the cost of the BHFB’s for the reference family of four amounted to US$ 270 in Kenya and US$262 in South Africa, potentially excluding more than half of households in Kenya and South Africa from basic healthy eating from an affordability perspective. However, with mounting pressure on households from factors such as income pressure, as well as high and rising food, many more households could rapidly move into a space where basic healthy eating will not be affordable.
The inclusion of a larger selection of more expensive food items in the BHFB’s to improve dietary diversity will also have a negative impact on the affordability of the basket. Another factors that could have a negative impact on the affordability of healthy eating relates to food waste. Even though the BHFB model assumes zero waste at household level, food waste is a reality at household level. In developing countries the most significant food waste occurs from the farm to the retailer, with a lesser contribution of consumer waste. In contrast consumer-level food waste has a dominant contribution in first world countries (FAO, 2019). According to the World Wildlife Foundation (WWF) (2017) total food waste in South Africa is estimated at 10 metric tons per annum (approximately 33% of average annual production), with the largest proportion of waste occurring from the farm to the retailer. Household-level food waste (representing the focus of this study) contributed an estimated 5% to total food waste in the value chain [World Wildlife Foundation (WWF), 2017]. Critical thinking and appropriate future research are needed on the relevant intervention levels in value chains and potential intervention strategies to curb food waste effectively in the South African context.
Even though the costing of the national BHFB models is designed to be based on nationally monitored food retail prices, it could be argued that households might lower the cost of the BHFB by engaging in actions such as ‘shopping around’ for special offerings, selective bulk purchasing to utilize economies of scale discounts and switching to less expensive brands. Taking South Africa is an example, a hypothetical 20% reduction in the cost of the BHFB though the application of these actions will enable approximately 10% more of households to afford basic healthy eating. However, more than 40% of households will still not being able to afford the BHFB despite best efforts from households to optimize the value-for-money in their food spending.
According to the FAO (2012), sustainable diets are defined as “those diets with low environmental impacts which contribute to food and nutrition security and to healthy life for present and future generations. Sustainable diets are protective and respectful of biodiversity and ecosystems, culturally acceptable, accessible, economically fair and affordable; nutritionally adequate, safe and healthy; while optimizing natural and human resources.” Considering the affordability impact of potential movements to ‘more plant-based’ BHFB’s (i.e., proportionally less animal-source foods and proportionally more legumes as a plant-based protein source) the study indicated a reduction of about 15% in the BHFB cost in both countries. Thus, these results suggest that food intake patterns with an increased focus on legumes as a source of plant-based protein could help to improve the affordability of basic healthy eating. However, it is also important to consider consumer acceptability in this context from various perspectives, including sensory acceptability, cultural acceptability, and the available time for food preparation (Alcorta et al., 2021; Tyndall et al., 2022). Future research should focus on the development and application BHFB models addressing both basic nutrition needs as well as optimal sustainability objectives.
5.1. Reflecting on the building blocks of BHFB’s
The design of BHFB models, as applied in this study, relies on the availability of accurate and representative input data pertaining to typical household size, typical household composition, household income levels, typical food intake patterns, nationally monitored food retail prices, official country-specific nutrient intake and food consumption guidelines, as well as suitable food composition data.
5.1.1. Typical household characteristics
The identification of typical household characteristics in terms of household size and composition is a critical ‘building block’ of BHFB’s. The compilation and publication of such data are usually performed by national statistical agencies such as Stats SA and the Kenya National Bureau of Statistics. Data should ideally be nationally representative, regularly updated and recent, and should be available at a national average level, for rural vs. urban households and for households within different geographical regions within a country. Especially in the case of Kenya these data sources dated back to 2015/2016 and 2019, creating the need for more recent official data on household characteristics.
5.1.2. Household income
Evaluating the affordability of BHFB’s requires household income data that is detailed, regularly updated, and socio-economically disaggregated. Ideally nationally representative household income data per expenditure decile (ED) (where each ED represents 10% of households in the country) should be gathered and released annually or at least every 2 years to optimize food affordability calculations. This aspect requires attention in both Kenya and South Africa.
5.1.3. Food intake
Food intake data (applied to identify typical food choices feeding into the design of BHFB’s), should ideally be based on nationally representative food intake studies, incorporating disaggregation in terms of income groups, rural vs. urban consumers and different geographical regions. However, the cost of such studies often prohibits the regular gathering and release of such datasets. In this study food intake data was obtained from sources such as household-level expenditure studies, food expenditure / intake studies in specific locations and national-level FAOSTAT data. The gathering and release of more regular detailed socio-economically disaggregate household-level food expenditure data (for various levels such as national, rural/urban and main geographic sub-regions) will make a significant contribution to improve the study of food intake dynamics over time in the target countries. Interaction with experts in the target countries also revealed the existence of food intake variations between regions / provinces / counties in the target countries. However, due to current data limitations further research will be needed to explore the geographically disaggregated food intake patterns in the target countries in a time-effective and cost-effective manner – and to supplement the available data in years when no ‘big data’ national studies are available.
5.1.4. Food retail price data
Ideally, for the optimal application in the context of BHFB’s, official national food retail price data should be gathered and released monthly, avoiding time lags, covering a wide range of relevant food items and cover national average food prices as well as geographically disaggregated data. The availability of such data in a time-series format allows for the more accurate monitoring of food inflation and the affordability of healthy eating over time. The potential of monitoring online food retail prices in the target countries could also be investigated, to serve as a source of more timely food retail price data and as an ‘early warning’ system for food price movements. Based on the outcomes of this study, it is recommended that the product coverage of official food retail price monitoring activities in the two target countries should be expanded.
In South Africa the food retail price monitoring activities of Stats SA are comprehensive and cover a wide range of food items from all food categories (as presented in the methodology section of this paper). Within the fats / oils food category it is recommended that different types of plant oils should be monitored, including foods such as sunflower oil, canola oil, cooking oil (mixed content) and olive oil. A more comprehensive selection of legumes should also be monitored, e.g., specific types of dried and canned beans (such as split peas, lentils, samp and beans mix, sugar beans, white beans, speckled beans, kidney beans and sugar beans), as well as a more comprehensive selection of soya-based foods, e.g., soya beans, soya ‘mince’ (budget meat alternative product). The inclusion of these products could expand the possibilities of calculating food baskets with proportionally larger plant-based components in future consisting of product variety within the legumes food category.
In Kenya, public domain access to the comprehensive database of monthly food retail prices monitored by the Kenya National Bureau of Statistics (on a national level as well as for sub-regions) is critical for future actions toward monitoring the affordability of basic healthy eating in Kenya on a regular basis. Certain food items could also be added to monthly food retail price monitoring activities in Kenya, including plantain / cooking bananas, brown bread, dominant cuts / product options of chicken meat, dominant cuts of pork, beef mince, fish (Tilapia and Nile perch), sunflower oil, margarine., pineapple, papaya, pigeon peas and canned garden peas.
5.2. An improved understanding of consumers
From a consumer perspective, future research should establish a better understanding of consumers’ awareness and understanding of healthy eating, as well as the factors preventing them from acquiring and consuming a healthy diet. The availability of healthy food choices should also be investigated. Research on these topics should ideally be done at national and regional levels, as well as in rural and urban locations to add maximum value. Based on these outcomes, consumer education campaigns could be formulated and rolled out to advise consumers regarding healthy food choices taking into consideration what is available, affordable and culturally acceptable in the area of residence. Furthermore, consumer education could also address aspects such as a better understanding of the nutrition transition and the negative health impacts associated with it. Helping consumers understand the correct portion sizes and the relative affordability of these portions for recommended food items – which should be updated and published monthly to help consumers make the best of available food budgets.
Improving the practical interpretation and implementation of food-based dietary guidelines by consumers from all socio-economic sub-groups could also be prioritized. For example, this could be done by designing example eating patterns, stating the number of food guide units needed per day from the various food group based on the energy requirements of individuals (an example of this was published in the South African Nutrition Week 2012), taking into consideration typical food choices of consumer sub-groups. Along with well-explained food guide unit quantities, such a tool can help consumers to adopt food-based dietary guidelines within their household in a practical manner. Furthermore, building upon the establishment of food labeling and marketing practices that are not misleading and adhere to legislative requirements, consumer education can help consumers to make more informed healthy food decisions.
5.3. Conclusion and policy outlook
Policy actions to improve the affordability of healthy eating often focus on the household income and food price components. Policy actions aimed at increasing household income levels (with a particular focus on vulnerable population segments) can help to relieve consumer debt, inequality and poverty (The Pietermaritzburg Economic Justice and Dignity Group (PMBEJD), 2016; Saskatchewan Food Costing Task Group, 2017; Rakotoniaina, 2018). Such policies could for example focus on increased household income through higher minimum wages, child support grants and old-age pensions. The complexity of raising household income levels should not be underestimated, when we consider the broader economic and fiscal implications of such actions, as well as the wide range of factors that could potentially affect household income, such as the number of income earners, the health of income earners (mental and physical), education levels, living location (e.g., rural versus urban) (Reardon et al., 2000; Alves, 2012; Statistics South Africa, 2017a).
When we shift the focus to food price interventions it is critical to keep in mind that food prices are affected by numerous complex factors, such as “political, economic, socio-cultural and environmental factors at the local, national and international levels” (Lee et al., 2013). For example, in recent months severe and persistent electricity loadshedding has caused upward pressure on food inflation due to direct costs (e.g., fuel expenses to operate electricity generators during load shedding) as well as indirect costs [e.g., the increased occurrence of food waste and spoilage within food supply chains (BFAP, 2023)]. Consequently, the ease in global commodity prices, is not currently reflected in South African food inflation dynamics.
Taxation can be used to increase the cost (with the aim to reduce the popularity) of less-desirable food options like sugar-rich soft drinks [e.g., implemented in countries like South Africa (National Treasury, South Africa, 2016)], France and the United States of America (Brownell et al., 2009; Villanueva, 2011). Lee et al. (2013) emphasized the importance of evaluating the health outcomes of such interventions. A second example of taxation to affect food prices pertains to the association between fast-food (take-away food) intake and the global prevalence of obesity (Zobel et al., 2016). In 2011 Hungary implemented a ‘junk food tax’ on “food high in salt, sugar and caffeine” (Bíró, 2015) which was observed to decrease the consumption of processed food and improve eating patterns particularly for lower income households.
The first example of policy action aimed at improving the affordability of healthy eating involves the exemption of certain food products from value added tax (VAT) (Powell and Chaloupka, 2009; Lee et al., 2013; Assefa et al., 2016). In South Africa based on the Value-added Tax Act of 1991 (South African Revenue Service, 2019) a selection of widely consumed food items (samp, maize meal, rice, brown bread, maize rice, dried maize, brown wheaten meal, bread flour and cake flour) is exempted from VAT (National Treasury, South Africa, 2018). Temple and Steyn (2009) argued that the VAT exempted food items in South Africa could be expanded to include other healthy food options with “a low and intermediate cost of dietary energy and a low energy density,” such as oats. The Pietermaritzburg Economic Justice and Dignity Group (PMBEJD) (2016) suggested that chicken portions should also be added to the list of VAT exempted food items as chicken portions are the dominant meat source for households in South Africa.
Policy actions aimed at improving the affordability of healthy eating can also rely on subsidies targeting vulnerable groups to impact food affordability (Sassi et al., 2009; Lee et al., 2013). In the United States of America food stamps have been in use since 1939 as part of the Supplemental Nutrition Assistance Program (USDA, 2018). In the UK the Healthy Start scheme has been active since 2006 (Crawley and Dodds, 2018). An example of a policy measure targeting vulnerable groups is the Farmers Market Nutrition Program of the Massachusetts Department of Agriculture in the United States of America (Massachusetts Department of Agricultural Resources, 2019). In this scheme coupons to buy fresh fruit and vegetables at farmer markets in the state are given to vulnerable women (pregnant and breastfeeding), children and the elderly. Webber et al. (1995) observed an increase of approximately 30% in the quantity of fresh fruit and vegetables purchased by these participating households.
From a more general health perspective the South African DoH is involved in numerous policy initiatives. For example, legislation to decrease the mean salt intake of the population to less than 5 g per day has been implemented through a two stage approach (effective dates were 30 June 2016 and 30 June 2019) [Foodstuffs, Cosmetics and Disinfectants Act, 1972 (Act 54 of 1972), Regulations relating to the reduction of sodium in certain foodstuffs’ (R.214), 20 March 2013, DoH, National Department of Health, South Africa, 2013b]. A second example relates to the mandatory fortification of the main staples in South Africa started in 2003, with the current list of fortified foods including maize meal, wheat flour for white-and brown bread and cake flour (National Gazettes, No. 39776 of 03 March, 2016, as part of the Foodstuffs, Cosmetics and Disinfectants Act (54/1972): Regulations relating to the Fortification of certain Foodstuffs) (National Department of Health, South Africa, 2016). When we consider the potential substitution of maize meal with rice it is recommended that the mandatory fortification of rice should be applied in the South Africa context.
The increasing emphasis on the importance of sustainability in food choices (Willett et al., 2019) can prompt the future revision of the current food-based dietary guidelines in countries like Kenya and South Africa, to incorporate sustainable food choice considerations. Such recommendations should be based on sound scientific evidence in the national food and socio-economic context. Furthermore, an increased focus on the consumption of food that is not only affordable but also sustainable, will have significant implications for farming practices and supply chain systems in South Africa.
Data and trends regarding the affordability of basis healthy eating could contribute to the ultimate improvement in food-and nutrition security by backing and informing policy decisions. Thus, it is recommended that suitable organizations could also engage in the monthly calculation and publication of the cost and affordability of basic healthy eating in the particular country and provide context regarding the dominant factors driving food prices for that time period. For example, the BFAP Food Inflation Brief as an example of such an initiative released monthly within the South African context to a diverse audience of role-players (BFAP, 2023).
It is important to keep in mind that the improvement of the affordability of healthy eating in South Africa has no simple solution, but would require a complex, multi-dimensional strategy involving both the public sector (e.g., appropriate policies and legislation) and the private sector. Private sector contributions could include the application of technology to develop foods which are affordable and healthy (Ronquest-Ross et al., 2015), as well as the potential role of retailers to make healthy food such as fresh fruit and vegetables more affordable to consumers by initiatives such as bulk discounts when a variety of healthy products are purchased. Follow-up research should include a comprehensive review of actions undertaken around the world to improve the affordability of healthy eating, combined with research to investigate the viability of policy options at multiple levels (e.g., fiscal, nutritional, consumer and industry levels) in the South African context.
Robust, up-to-date, nationally representative food intake data is critical to enable the design and implementation of timely policy interventions to address the nutritional challenges (Van Heerden and Schönfeldt, 2011). In the absence of regularly updated food intake data in countries such as Kenya and South Africa, one possible solution could be to derive food intake data from food expenditure data, to fill this data gap. The development, testing and implementation of a ‘rapid assessment’ methodology to keep tabs on consumers’ food consumption patterns, that is time and cost effective, could be critical in tough economic times with limited funding available for conventional nationally representative (and expensive) food intake studies.
To further improve the research findings and expand BHFB approach to a level with maximum practical relevance, further in-country testing is recommended. This relates specifically to the investigation of food intake patterns within different regions / provinces / counties in Kenya and South Africa to better understand consumers’ disaggregated food intake patterns. More detailed data on food preferences could then enable the compilation and application of region-specific basic healthy food baskets and could also help to align food price monitoring activities to develop regional food prices in addition to national average food prices on a monthly basis.
Efforts to improve the nutritional status of a population, also through the improved affordability of healthy eating, should always be cognisant of socio-economic complexity and diversity. Various sub-segments could be facing unique nutritional challenges. Affluent consumers have the luxury to demand food attributes in line with their needs for aspects such as indulgence, health / wellness and innovative food solutions to assist them with time pressure in their daily lives and their social aspirations such as sustainability. With less-desirable lifestyle choices and over-nutrition, some individuals in this segment face challenges controlling weight (particularly overweight and obesity) and the subsequent development of NCDs such as diabetes and coronary heart disease. At the lower end of the spectrum numerous households cannot even afford purchasing foods in order to follow a healthy eating pattern, resulting in monotonous diets with large volumes of affordable staples and a preference for inexpensive, energy dense and often micronutrient-poor foods. The occurrence of overweight and obesity increases the risk to develop NCDs. At the same time under-nutrition (evident for example in the prevalence of childhood stunting and micronutrient deficiencies in children, females and vulnerable groups) often pose another major challenge for less affluent individuals.
Improving the affordability of healthy eating in countries like Kenya and South Africa requires a complex combination of multiple interventions involving public and private sector role-players with a broad range of interventions aimed at consumers, food production and processing systems. With significant input cost pressure at farm-level combined with dualism that is also pertinent in the farming sector in South Africa, comprising of a combination of commercial and small-scale farmers, the complexity of the policy intervention and actions required to produce affordable and healthy food become even more prominent. Working toward improved food systems and a healthier population will require passion, skill, innovative thinking, solid science backing and a strong desire to make a difference – from all role-players in the supply chain spanning from farm to fork.
Data availability statement
The original contributions presented in the study are included in the article/supplementary material, further inquiries can be directed to the corresponding author.
Author contributions
HV, FM, and HS contributed to the conception and design of the study. HV gathered data, performed data analysis, constructed the models, and wrote up the manuscript. All authors contributed to the manuscript revision, read, and approved the submitted version.
Acknowledgments
The authors acknowledge(s) funding from the Economic and Social Research Council [grant number ES/T003871/1] under the ARUA-GCRF UKRI Partnership Program as part of the Capacity Building in Food Security (CaBFoodS-Africa) project and the Department of Science and Innovation (DSI)/National Research Foundation (NRF) South African Research Chairs Initiative (SARChl) in the National Development Plan Priority Area of Nutrition and Food Security (Unique number: SARCI170808259212). The grant holders acknowledge that opinions, findings and conclusions or recommendations expressed in this publication are that of the author(s) and that they accept no liability whatsoever in this regard.
Conflict of interest
The authors declare that the research was conducted in the absence of any commercial or financial relationships that could be construed as a potential conflict of interest.
Publisher’s note
All claims expressed in this article are solely those of the authors and do not necessarily represent those of their affiliated organizations, or those of the publisher, the editors and the reviewers. Any product that may be evaluated in this article, or claim that may be made by its manufacturer, is not guaranteed or endorsed by the publisher.
References
Academy of Science of South Africa. (2013). Improved nutritional assessment of micronutrients. Consensus Study Report. Available at: https://research.assaf.org.za/handle/20.500.11911/54.
Alcorta, A., Porta, A., Tárrega, A., Alvarez, M. D., and Vaquero, M. P. (2021). Foods for plant-based diets: challenges and innovations. Foods 10:293. doi: 10.3390/foods10020293
Alves, N. (2012). The impact of education on household income and expenditure inequality. Appl. Econ. Lett. 19, 915–919. doi: 10.1080/13504851.2011.607125
Assefa, T., Abebe, G., Lamoot, I., and Minten, B. (2016). Urban food retailing and food prices in Africa: the case of Addis Ababa, Ethiopia. J. Agribusiness Dev. Emerg. Econ 6, 90–109. doi: 10.1108/JADEE-02-2015-0009
Baipheti, M., and Jacobs, P. (2009). The contribution of subsistence farming to food security in South Africa. Agrekon 48, 459–482. doi: 10.1080/03031853.2009.9523836
Beydoun, M., and Wang, Y. (2008). How do socio-economic status, perceived economic barriers and nutritional benefits affect quality of dietary intake among US adults? Eur. J. Clin. Nutr. 62, 303–313. doi: 10.1038/sj.ejcn.1602700
BFAP. (2022). BFAP Baseline Agricultural Outlook 2022-2031. Available at: https://baseline.bfap.co.za/.
BFAP. (2023). BFAP food inflation brief – December 2022. Available at: https://www.bfap.co.za/food-inflation-brief_december-2022/.
Bíró, A. (2015). Did the junk food tax make the Hungarians eat healthier? Food Policy 54, 107–115. doi: 10.1016/j.foodpol.2015.05.003
Bourne, L., Lambert, E., and Steyn, K. (2002). Where does the black population of South Africa stand on the nutrition transition? Public Health Nutr. 5, 157–162. doi: 10.1079/phn2001288
Breisinger, C., Diao, X., Dorosh, P. A., Mbuthia, J., Omune, L., Oseko, E. O., et al. (2022). Kenya: Impacts of the Ukraine and global crises on poverty and food security. Global Crisis Country Brief 1. Washington, DC: International Food Policy Research Institute (IFPRI).
Brownell, K. D., Farley, T., Willett, W. C., Popkin, B. M., Chaloupka, F. J., Thompson, J. W., et al. (2009). The public health and economic benefits of taxing sugar-sweetened beverages. NEJM 361, 1599–1605. doi: 10.1056/NEJMhpr0905723
Carlson, A., Lino, M., and Fungwe, T. (2007a). The low-cost, moderate-cost, and liberal food plans, 2007 (CNPP-20). Available at: https://ideas.repec.org/p/ags/usacnr/45850.html.
Carlson, A., Lino, M., and Juan, W Y., Hanson, K., and Basiotis, P.P. (2007b). Thrifty food plan, 2006 (CNPP-19). Available at: https://ageconsearch.umn.edu/record/42899/files/TFP2006Report.pdf
Crawley, H., and Dodds, R. (2018). The UK healthy start scheme. Available at: https://static1.squarespace.com/static/59f75004f09ca48694070f3b/t/5b8e2d0e575d1f6f1e5d2dcd/1536044307456/Healthy_Start_Report_for_web.pdf.
Crush, J., and Frayne, B. (2011). Supermarket expansion and the informal food economy in Southern African cities: implications for urban food security. J. South. Afr. Stud. 37, 781–807. doi: 10.1080/03057070.2011.617532
De Bruin, S., Dengerink, J., and Van Vliet, J. (2021). Urbanisation as driver of food system transformation and opportunities for rural livelihoods. Food Secur. 13, 781–798. doi: 10.1007/s12571-021-01182-8
Delgado, C. (2003). Rising consumption of meat and milk in developing countries has created a new food revolution. J. Nutr. 133, S3907–S3910. doi: 10.1093/jn/133.11.3907s
Delgado, C., Rosegrant, M., Steinfeld, H., Ehui, S., and Courbois, C. (1999). “Livestock to 2020. The next food revolution” in Food, agriculture and the environment discussion paper 28 (Washington, USA: IFPRI). Available at: https://hdl.handle.net/10568/333
Department of Human Nutrition, University of Otago. (2018). Information package for users of the New Zealand estimated food costs 2018. Available at: https://ourarchive.otago.ac.nz/bitstream/handle/10523/8056/Otago%20FCS%20Information%20package%202018.pdf?sequence=1&isAllowed=y.
D'Haese, M., and Van Huylenbroeck, G. (2005). The rise of supermarkets and changing expenditure patterns of poor rural households: case study in the Transkei area, South Africa. Food Policy 30, 97–113. doi: 10.1016/j.foodpol.2005.01.001
Drewnowski, A., and Darmon, N. (2005). The economics of obesity: dietary energy density and energy cost. AJCN 82, 265S–273S. doi: 10.1093/ajcn/82.1.265s
Du, S., Mroz, T., Zhai, F., and Popkin, B. (2004). Rapid income growth adversely affects diet quality in China - particularly for the poor. Soc. Sci. Med. 59, 1505–1515. doi: 10.1016/j.socscimed.2004.01.021
FAO. (2012). Sustainable diets and biodiversity: directions and solutions for policy, research and action. Rome, Italy: FAO.
FAO. (2018). Food-based dietary guidelines. Available at: http://www.fao.org/nutrition/education/food-dietary-guidelines/en/.
FAO. (2023). World food situation – FAO food price index. Available at: https://www.fao.org/worldfoodsituation/foodpricesindex/en/.
FAO, IFAD, UNICEF, WFP and WHO. (2022). The state of food security and nutrition in the world 2022. Repurposing food and agricultural policies to make healthy diets more affordable. Rome, Italy: FAO.
FAOSTAT. (2022). Food balances 2010–2019: Kenya. Available at: https://www.fao.org/faostat/en/#data/FBS.
Friel, S., Walsh, O., and McCarthy, D. (2004). The financial cost of healthy eating in Ireland. Working Paper 04/01, October 2004. Combat Poverty Agency. Available at: https://www.safefood.net/getattachment/74ac867a-2e4f-495a-ba7c-343f5e7e31cd/2004-01_WP_TheFinancialCostOfHealthyEatingInIreland-(1).pdf?lang=en-IE.
Ghattas, H. (2014). Food security and nutrition in the context of the nutrition transition. Technical Paper. Rome, Italy: FAO.
Health Canada. (2009). National nutritious food basket. Available at: https://www.canada.ca/en/health-canada/services/food-nutrition/food-nutrition-surveillance/national-nutritious-food-basket.html.
Hendriks, S. (2005). The challenges facing empirical estimation of household food (in)security in South Africa. Dev. South. Afr. 22, 103–123. doi: 10.1080/03768350500044651
Institute of Medicine. (2005). Dietary reference intakes for energy, carbohydrate, fiber, fat, fatty acids, cholesterol, protein, and amino acids. Washington, DC: The National Academies Press.
Institute of Medicine. (2006). Dietary reference intakes: the essential guide to nutrient requirements. Washington, DC: The National Academies Press.
Jacobs, P. (2009). The status of household food security targets in South Africa. Agrekon 48, 410–433. doi: 10.1080/03031853.2009.9523834
James, W., Nelson, M., Ralph, A., and Leather, S. (1997). Socioeconomic determinants of health: the contribution of nutrition to inequalities in health. BMJ 314, 1545–1549. doi: 10.1136/bmj.314.7093.1545
Kenya Medical Research Institute, Kenya National Bureau of Statistics, Kenya Ministry of Health, United Nations Children’s Fund (UNICEF), Micronutrient Initiative, Global Alliance for Improved Nutrition (GAIN). (2011). The Kenya national micronutrient survey 2011. Available at: https://www.gainhealth.org/resources/reports-and-publications/kenya-national-micronutrient-survey-2011.
Kenya Ministry of Health. (2017). National guidelines for healthy diets and physical activity. Nairobi, Kenya: Government of Kenya.
Kenya National Bureau of Statistics. (2018). Basic report on well-being in Kenya - based on the 2015/2016 Kenya integrated household budget survey (KIHBS). March 2018. Nairobi, Kenya: Kenya National Bureau of Statistics.
Kenya National Bureau of Statistics. (2019a). Kenya population and household census. Volume II: Distribution of population by administrative units. Nairobi, Kenya: Kenya National Bureau of Statistics.
Kenya National Bureau of Statistics. (2019b). Kenya population and household census. Volume III: Distribution of population by age and sex. Nairobi, Kenya: Kenya National Bureau of Statistics.
Kenya National Bureau of Statistics. (2022). Economic survey 2022. Nairobi, Kenya: Kenya National Bureau of Statistics.
Kenya National Bureau of Statistics. (2023). Consumer price indices and inflation rates for January 2023. Nairobi, Kenya: Kenya National Bureau of Statistics.
Klensin, J.C., Feskanich, D., Lin, V., Truswell, S., and Southgate, D.A.T. (1989). Identification of food components for INFOODS data interchange. Tokyo: The United Nations University.
Kruger, H., Puoane, T., Senekal, M. M., and Van Der Merwe, M. (2005). Obesity in South Africa: challenges for government and health professionals. Public Health Nutr. 8, 491–500. doi: 10.1079/PHN2005785
Lee, A., Mhurchu, C. N., Sacks, G., Swinburn, B., Snowdon, W., Vandevijvere, S., et al. (2013). Monitoring the price and affordability of foods and diets globally. Obes. Rev. Supplement 1, 82–95. doi: 10.1111/obr.12078
Marketing Research Foundation South Africa. (2022). MAPS22W3 - MAPS August 2022 release (Apr 2021 - Mar 2022). Johannesburg, South Africa: Marketing Research Foundation South Africa.
Massachusetts Department of Agricultural Resources (2019). Farmers market nutrition program. Massachusetts, USA: Massachusetts Department of Agricultural Resources.
Mbogori, T., Kimmel, K., Zhang, M., Kandiah, J., and Wang, Y. (2020). Nutrition transition and double burden of malnutrition in Africa: a case study of four selected countries with different social economic development. AIMS Public Health 7, 425–439. doi: 10.3934/publichealth.2020035
Mchiza, Z. J., Steyn, N. P., Hill, J., Kruger, A., Schönfeldt, H. C., Nel, J., et al. (2015). A review of dietary surveys in the adult South African population from 2000 to 2015. Nutrients 7, 8227–8250. doi: 10.3390/nu7095389
Mohamed, S., Wambiya, E., Kisia, L., and Osindo, J. (2021). The cost of eating healthy in Kenya. Policy brief. Nairobi, Kenya: African Population and Health Research Centre.
National Department of Health, South Africa. (2013a). Guidelines for healthy eating - information for nutrition educators. Available at: https://www.nutritionweek.co.za/NNW2014/docs/NNW-2013-Nutrition%20Educators%20Guideline.pdf.
National Department of Health, South Africa. (2013b). Foodstuffs, cosmetics and disinfectants act, 1972 (act 54 of 1972), regulations relating to the reduction of sodium in certain foodstuffs (R.214), 20 March 2013.
National Department of Health, South Africa. (2016). National Gazettes, No. 39776 of 03 March, 2016, as part of the foodstuffs, cosmetics and disinfectants act (54/1972): regulations relating to the fortification of certain foodstuffs.
National Treasury, South Africa. (2016). Taxation of sugar sweetened beverages. Policy paper. 8 July 2016. Available at: http://www.treasury.gov.za/public%20comments/Sugar%20sweetened%20beverages/POLICY%20PAPER%20AND%20PROPOSALS%20ON%20THE%20TAXATION%20OF%20SUGAR%20SWEETENED%20BEVERAGES-8%20JULY%202016.pdf.
National Treasury, South Africa. (2018). Zero-rated and exempt supplies. Available at: http://www.treasury.gov.za/search.aspx?cx=018115738860957273853%3Aj5zowsrmpli&cof=FORID%3A11&q=vat%20exempt#.
Palermo, C., and Wilson, A. (2007). Development of a healthy food basket for Victoria. ANZJPH 31, 360–363. doi: 10.1111/j.1753-6405.2007.00087.x
Pereira, L. (2013). The future of the food system: cases involving the private sector in South Africa. Sustainability 5, 1234–1255. doi: 10.3390/su5031234
Peters, R., Amugsi, D., Mberu, B., Ensor, T., Hill, A., Newell, J. N., et al. (2019). Nutrition transition, overweight and obesity among rural-to-urban migrant women in Kenya. Public Health Nutr. 22, 3200–3210. doi: 10.1017/S1368980019001204
Peyton, S., Moseley, W., and Battersby, J. (2015). Implications of supermarket expansion on urban food security in Cape Town, South Africa. Afr. Geogr. Rev 34, 36–54. doi: 10.1080/19376812.2014.1003307
Pica-Ciamarra, U., and Otte, J. (2009). “The ‘livestock revolution’: rhetoric and reality” in Pro-poor livestock policy initiative (Rome, Italy: FAO). Available at: https://www.fao.org/3/bp263e/bp263e.pdf
Pietermaritzburg Economic Justice and Dignity Group (PMBEJD). (2016). PACSA food price barometer annual report, October 2016. Pietermaritzburg, South Africa: PACSA.
Pietermaritzburg Economic Justice and Dignity Group (PMBEJD). (2023). Household affordability index: Johannesburg, Durban, Cape Town, Springbok, Pietermaritzburg. January 2023rd. Pietermaritzburg, South Africa: PMBEJD.
Popkin, B., and Du, S. (2003). Dynamics of the nutrition transition toward the animal foods sector in China and its implications: a worried perspective. J. Nutr. 133, S3898–S3906. doi: 10.1093/jn/133.11.3898s
Powell, L., and Chaloupka, F. (2009). Food prices and obesity: evidence and policy implications for taxes and subsidies. Milbank Q. 87, 229–257. doi: 10.1111/j.1468-0009.2009.00554.x
Rakotoniaina, A. (2018). How to increase fruit and vegetable consumption: a multistakeholder approach for improved health outcomes - a report from the Alliance for Food & Health. J. Am. Coll. Nutri. 37, 251–266. doi: 10.1080/07315724.2017.1376298
Reardon, T., Taylor, J. E., Stamoulis, K., Lanjouw, P., and Balisacan, A. (2000). Effects of non-farm employment on rural income inequality in developing countries: an investment perspective. J. Agric. Econ. 51, 266–288. doi: 10.1111/j.1477-9552.2000.tb01228.x
Reuters. (2022). Kenyan president hikes country’s minimum wage by 12%. 1 May 2022. Available at: https://www.reuters.com/world/africa/kenyan-president-hikes-countrys-minimum-wage-by-12-2022-05-01/.
Ronquest-Ross, L., Vink, N., and Sigge, G. (2015). Food consumption changes in South Africa since 1994. S. Afr. J. Sci. 111, 1–12. doi: 10.17159/sajs.2015/20140354
Rose, D., and Charlton, E. (2002). Prevalence of household food poverty in South Africa: results from a large, nationally representative survey. Public Health Nutr. 5, 383–389. doi: 10.1079/PHN2001320
Rousham, E., Pradeilles, R., Akparibo, R., Aryeetey, R., Bash, K., Booth, A., et al. (2020). Dietary behaviours in the context of nutrition transition: a systematic review and meta-analyses in two African countries. Public Health Nutr. 23, 1948–1964. doi: 10.1017/S1368980019004014
SAFOODS. (2017). South African Medical Research Council (SAMRC) food composition tables for South Africa. 5th. Cape Town, South Africa: South African Medical Research Council.
Saskatchewan Food Costing Task Group. (2017). The cost of healthy eating in Saskatchewan. Available at: https://www.saskatchewan.ca/government/government-structure/ministries/health/other-reports/a-report-on-the-cost-of-healthy-food-in-saskatchewan.
Sassi, F., Cecchini, M., Lauer, J., and Chrisholm, D. (2009). Improving lifestyles, tackling obesity: The health and economic impact of prevention strategies. OECD Publishing: Paris.
Schönfeldt, H., Gibson, N., and Vermeulen, H. (2010). The possible impact of inflation on nutritionally vulnerable households in a developing country using South Africa as a case study. Nutr. Bull. 35, 253–266. doi: 10.1111/j.1467-3010.2010.01837.x
Scott, C., Sutherland, J., and Taylor, A. (2018). Affordability of the UK’s Eatwell Guide. Available at: https://foodfoundation.org.uk/sites/default/files/2021-10/Affordability-of-the-Eatwell-Guide_Final_Web-Version.pdf.
Seto, K. C., and Ramankutty, N. (2016). Hidden linkages between urbanization and food systems. Science 352, 943–945. doi: 10.1126/science.aaf7439
Shisana, O., Labadarios, D., Rehle, T., Simbayi, L., Zuma, K., Dhansay, A, et al. (2014). African National Health and nutrition examination survey (SANHANES-1): 2014. Cape Town, South Africa: HSRC Press.
South African Government. (2022). Minister Thulas Nxesi announces 2022 National Minimum Wage increases. Media Statement. 8 Feb 2022. Available at: https://www.gov.za/speeches/minister-thulas-nxesi-announces-2022-national-minimum-wage-increases-8-feb-2022-0000.
South African Government. (2023). What is the National School Nutrition Programme (NSNP)? Available at: https://www.gov.za/faq/education/what-national-school-nutrition-programme-nsnp.
South African Revenue Service. (2019). Value-added tax. Available at: https://www.sars.gov.za/types-of-tax/value-added-tax/.
Statistics South Africa. (2017a). Community survey 2016: agricultural households. Report 03-01-05. Available at: https://www.statssa.gov.za/?p=9468.
Statistics South Africa. (2017b). Living conditions of households in South Africa: an analysis of household expenditure and income data using the LCS 2014/2015. Statistical release P0310. Pretoria. Available at: https://www.statssa.gov.za/publications/P0310/P03102014.pdf.
Statistics South Africa. (2022a). General household survey 2021. Statistical release P0318. Available at: https://www.statssa.gov.za/publications/P0318/P03182021.pdf.
Statistics South Africa. (2022b). Quarterly employment statistics (QES), September 2022. Statistical release P0277. Available at: https://www.statssa.gov.za/publications/P0277/P0277September2022.pdf.
Statistics South Africa. (2023). Consumer Price index December 2022. CPI (COICOP) from Jan 2008 (202212). Statistical release P0141. Available at: https://www.statssa.gov.za/publications/P0141/P0141December2022.pdf.
Steyn, N. (2006). “Nutrition and chronic diseases of lifestyle in South Africa” in Chronic diseases of lifestyle in South Africa: 1995-2005. eds. K. Steyn, J. Fourie, and N. Temple (Medical Research Council: Cape Town)
Steyn, N. P., and Mchiza, Z. J. (2014). Obesity and the nutrition transition in sub-Saharan Africa. Ann. N. Y Acad. Sci. 1311, 88–101. doi: 10.1111/nyas.12433
Tefft, J., Jonasova, M., Adjao, R., and Morgan, A. (2017). Food Systems for an Urbanizing World. World Bank Group and the Food and Agricultural Organization of the United Nations. Available at: https://openknowledge.worldbank.org/handle/10986/32502.
Temple, N., and Steyn, N. (2009). Food prices and energy density as barriers to healthy food choices in Cape Town. JHEN 4, 203–213. doi: 10.1080/19320240902915474
The Economist Group. (2023). Global food security index 2022. Available at: https://impact.economist.com/sustainability/project/food-security-index/explore-countries.
The World Bank. (2023a). GDP per capita (current US$) – Kenya. Available at: https://data.worldbank.org/indicator/NY.GDP.PCAP.CD?locations=KE.
The World Bank. (2023b). GDP per capita (current US$) – South Africa. Available at: https://data.worldbank.org/indicator/NY.GDP.PCAP.CD?locations=ZA.
The World Bank. (2023c). Inflation, consumer prices (annual %) – Kenya. Available at: https://data.worldbank.org/indicator/FP.CPI.TOTL.ZG?locations=KE.
The World Bank. (2023d). Inflation, consumer prices (annual %) – South Africa. Inflation South Africa. Available at: https://data.worldbank.org/indicator/FP.CPI.TOTL.ZG?locations=ZA.
Tsang, A., Ndungu, M., Coveney, J., and O’Dwyer, L. (2007). Adelaide healthy food basket: a survey on food cost, availability and affordability in five local government areas in metropolitan Adelaide, South Australia. Nutr. Diet. 64, 241–247. doi: 10.1111/j.1747-0080.2007.00169.x
Tyndall, S. M., Maloney, G. R., Cole, M. B., Hazell, N. G., and Augustin, M. A. (2022). Critical food and nutrition science challenges for plant-based meat alternative products. Crit. Rev. Food Sci. Nutr. 1–16. doi: 10.1080/10408398.2022.2107994
UNDP. (2018). Sustainable development goals. Available at: https://www.undp.org/sustainable-development-goals.
UNICEF. (2022). Kenya drought flash update no. 06 - reporting period: 1 October to 31 October 2022. Available at: https://www.unicef.org/media/132236/file/Kenya-Drought-SitRep-October-2022.pdf.
United Nations, Department of Economic and Social Affairs, Population Division (2018). World urbanization prospects: the 2018 revision, Available at: https://population.un.org/wup/.
USDA. (2018). A short history of SNAP. Available at: https://www.fns.usda.gov/snap/short-history-snap.
Van Heerden, I., and Schönfeldt, H. C. (2011). The lack of food intake data and the consequences thereof. South Afr. J. Clin. Nutr. 24, 10–18. doi: 10.1080/16070658.2011.11734345
Villanueva, T. (2011). European nations launch tax attack on unhealthy foods. Can. Med. Assoc. J. 183, 109–403. doi: 10.1503/cmaj.109-4031
Vorster, H., Badham, J., and Venter, C. (2013). 1. An introduction to the revised food-based dietary guidelines for South Africa. South African Journal of Clinical Nutrition 26, S5–S12.
Watson, D., Kehoe, S., Erzse, A., Compaoré, A., Debpuur, C., Nonterah, E. A., et al. (2021). Community perspectives on maternal and child health during nutrition and economic transition in sub-Saharan Africa. Public Health Nutr. 24, 3710–3718. doi: 10.1017/S1368980020003018
Webber, D., Balsam, A., and Oehlke, B. (1995). The Massachusetts Farmers’ market coupon program for low income elders. Am. J. Health Promot. 9, 251–253. doi: 10.4278/0890-1171-9.4.251
Western Cape Government, South Africa. (2022). SASSA child support grant. Available at: https://www.westerncape.gov.za/service/sassa-child-support-grant#:~:text=Not%20earn%20more%20than%20R52,(R8%20800%20a%20month).
Willett, W., Rockström, J., Loken, B., Springmann, M., Lang, T., Vermeulen, S., et al. (2019). Food in the Anthropocene: the EAT-lancet commission on healthy diets from sustainable food systems. Lancet Commissions 393, 447–492. doi: 10.1016/S0140-6736(18)31788-4
Williams, P. (2010). Monitoring the affordability of healthy eating: a case study of 10 years of the Illawarra healthy food basket. Nutrients 2, 1132–1140. doi: 10.3390/nu2111132
World Food Programme. (2022). Kenya food prices. WFP price database. Available at: https://data.humdata.org/dataset/wfp-food-prices-for-kenya.
World Health Organization. (2018). Health impact assessment – the determinants of health. Geneva, Switzerland: WHO.
World Health Organization. (2020). Healthy diet. April 29, 2020. Geneva, Switzerland: WHO. Available at: https://www.who.int/news-room/fact-sheets/detail/healthy-diet
World Wildlife Foundation (WWF). (2017). Food loss and waste: facts and futures. Available at: www.wwf.org.za/food_loss_and_waste_facts_and_futures.
Keywords: food prices, affordability, food security, healthy diet, food basket, South Africa, Kenya, policy
Citation: Vermeulen H, Meyer F and Schönfeldt HC (2023) A basic healthy food basket approach to evaluate the affordability of healthy eating in South Africa and Kenya. Front. Sustain. Food Syst. 7:1181683. doi: 10.3389/fsufs.2023.1181683
Edited by:
Luc D’Haese, Ghent University, BelgiumReviewed by:
Aida Turrini, Independent Researcher, Scansano, ItalyShalander Kumar, International Crops Research Institute for the Semi-Arid Tropics (ICRISAT), India
Copyright © 2023 Vermeulen, Meyer and Schönfeldt. This is an open-access article distributed under the terms of the Creative Commons Attribution License (CC BY). The use, distribution or reproduction in other forums is permitted, provided the original author(s) and the copyright owner(s) are credited and that the original publication in this journal is cited, in accordance with accepted academic practice. No use, distribution or reproduction is permitted which does not comply with these terms.
*Correspondence: Hester Vermeulen, aGVzdGVyLnZAYmZhcC5jby56YQ==