 Yuxuan He
 Wei Yan
 Feiwu Li
- Institute of Agricultural Quality Standard and Testing Technology, Jilin Academy of Agricultural Sciences, Changchun, China
Meat adulteration caused by economic intentions has long been concerning food safety. Accurate quantification of meat products can distinguish between artificial adulteration and unintentional contamination during its processing or packaging. After determining the species-specific constant and the correlation between mass fraction and copy number of each species, we developed an effective approach-based droplet digital PCR (ddPCR) platform that can identify target species with high detection sensitivity: 13 copies of beef, 6 copies of lamb, 13 copies of pork, 13 copies of chicken, 6 copies of duck, and 6 copies of turkey. Using this method, a level as low as 1% of the adulterated ingredients blended in beef and lamb was accurately quantified. Following the addition of reference species, several quantitative equations were constructed for simultaneous analysis of different species in commercial processed products; even the animal components with a minimum content of 0.5% can be quantified to judge whether the label ingredients are fraudulent. This suggests the feasibility of the proposed strategy for the accurate identification and quantification of animal-derived adulteration according to the processing degree and food commodity.
1. Introduction
Owing to people’s preference for taste and nutrition regarding meat intake, the economic value of meat products has been of utmost importance to meat businesses, and the economic benefits of meat products have triggered the behavior of meat adulteration in commercial trade (Tähkäpää et al., 2015). Illegal traders substitute high-cost meat products with low-cost and undeclared or raw meat materials, such as pork, duck, or chicken, for inappropriate profits (Shi et al., 2019; Li et al., 2020). Although food safety regulators have established several national and local laws to ensure the safety and quality of meat products, previous market studies in China, Canada, Greece, and the US suggested that meat adulteration, in the form of ingredient substitution and mislabeling of meat products, is a worldwide problem. For example, the “horsegate” crisis has caused economic loss of $45.6 million (Brooks et al., 2017), and the “WalMart Fox Meat Scandal” dented the reputation for quality in China’s $1.5 trillion food and grocery market and the company planned to put more money toward ensuring food safety in China (Lawyer, 2013). A study conducted by Chapman University in the United States found that meat adulteration is a serious problem in the US market. Approximately 20% of beef contained other meat ingredients, and 10 of 48 samples analysed were mislabeled. Of the 10 mislabeled meat products, 9 contained other animal ingredients, including 2 containing horse meat, which is sold illegally in the United States (Kane and Hellberg, 2016). Another market survey on the sale of game meat showed that 18.5% of the tested samples was potentially mislabeled, and two products labelled “stewed bison meat” and “rib-eye bison steak” were identified as domestic cattle (Quinto et al., 2016). The Canadian Food Inspection Agency tested 100 “single species” sausages for composition, and 14% of the samples contained additional undeclared species (Shehata et al., 2019). In the China Food safety case study, chicken, pork, beef, duck, and genetically modified soy DNA samples were analysed by real-time and end-point PCR, and 64 of 250 sausage samples (25.6%) were found to have possible adulteration by product removal, addition, and substitution (Song et al., 2019). As the division of the modern food industry and supply chain becomes more complicated with regulation hurdles, the possibility for adulteration increases. Meat adulteration not only involves commercial malpractice but may also compromise religious diets and results in serious public health risks (Hossain et al., 2022). Therefore, in the field of food safety, a rapid and reliable detection technology, which can not only effectively determine adulterants but also accurately quantify the content of adulterated ingredients, should be developed. Such research possesses a great significance for providing a guarantee for the supervision of trade and improving the sustainable development of the industry.
Conventional quality evaluation of meat products primarily depends on manual inspection, which can be highly subjective. Additionally, the advanced techniques for food pre-processing procedures, such as boning, mincing, and emulsifying, have made the sensory identification of meat species more difficult owing to the changes in its external morphological characteristics (Shi et al., 2019). Histology combined with electron microscopy and digital image analysis has recently provided a new standard for morphological identification and has been widely used to evaluate the muscle tissue content in meat processing products; however, these methods must assume that the micro-slicing of muscle tissue does not change its morphology (Prayson et al., 2008; Setiadi et al., 2022). Some analysis techniques can accurately measure relevant chemical components of the origin of the animal, including common techniques for metabolite detection, such as high performance liquid chromatography (Dong et al., 2020; Xu et al., 2021), ion chromatography (Zhu et al., 2018), gas chromatography–mass spectrometry (Al-Amri et al., 2021; Siddiqui et al., 2021), and using various sensors (Zaukuu et al., 2021; Chen et al., 2021b). A surface plasmon resonance enhanced DNA biosensor was developed using a biotinylated reporter and streptavidin functionalized gold nanostars (Stre@GNSs) that exhibited excellent performance compared to traditional biosensor systems. This significantly enhanced the sensitivity and showed good specificity for the target base-mismatch (Mansouri et al., 2020). However, the complexity of these types of detection assays and the difficulties in data analysis restrict their large-scale application for identifying meat adulteration. Immunology is a method used to identify animal components through the specific binding of an antigen and antibody, which is then measured via signal amplification. The enzyme-linked immunosorbent assay (ELISA) is the most widely used immunological approach; it has high sensitivity and requires less time and cost (Thienes et al., 2019a,b). For example, an ELISA/immunosensor was used to identify pork adulteration as low as 0.1% content in meat within 45 min; however, the competitive immunosensor could detect 0.01% of pork adulteration within 20 min (Mandli et al., 2018). A colorimetric smartphone-based immunoassay was developed for the on-site detection of pork adulteration in meat, which demonstrated excellent stability under extreme temperature conditions (50°C; Seddaoui and Amine, 2021). Animal-derived proteins are prone to denaturation under processing conditions, which makes it difficult to screen for markers, thereby reducing identification accuracy. Thus, the standardization and application of this technology are limited (Li et al., 2020).
Methods based on nucleic acid detection, including multiplex PCR (Hou et al., 2015; Skouridou et al., 2019), real-time PCR assays (Li et al., 2021), restriction fragment length polymorphisms (Girish et al., 2005), and single strand conformation polymorphisms (Takahashi et al., 2008), have been used to rapidly determine the animal species source in meat products. Most of the DNA-based assays use mitochondrial DNA as a target because it is highly conserved in animal species (Ha et al., 2017; Ruiz-Valdepenas Montiel et al., 2017). However, numerous mitochondrial genes have multiple copies in cells and tissues (Nizar et al., 2018), which may lead to inaccurate quantification while monitoring meat adulteration.
To overcome this limitation, specific single-copy genes were selected to identify meat adulteration, allowing for the calculation of the target meat content percentage based on a certain threshold (Cq; Li et al., 2021). For example, multiplex real-time PCR was used to quantify single-copy genes from different animals, which obtained a detection and quantification range of 0.32–32 ng total DNA from four species (Köppel et al., 2010). A precise and efficient nucleic acid detection method was recently developed based on digital PCR (dPCR) with the potential to advance both basic and applied biological research (Bogozalec Kosir et al., 2019; Noma et al., 2022). The platform is not dependent on the calibrant and produces an absolute number of original DNA target molecules by diluting and partitioning samples into different compartments using a “water-in-oil” emulsion or a microchannel chip (Felix-Urquidez et al., 2016; Kanagal-Shamanna, 2016; Mock et al., 2016).
As an advancement of conventional PCR and qPCR, dPCR has high sensitivity and accuracy for DNA quantification with low concentrations and composite samples. At present, the detection limits of the dPCR platform have reached the copy number level in the detection of genetically modified organism (Demeke and Dobnik, 2018), clinical microbiology (Kuypers and Jerome, 2017), diagnosis of pathogenic microorganisms (Pomari et al., 2019), and mutant identification (Mock et al., 2016; Hua et al., 2017). Hence, dPCR is a potential method for the quantification of meat adulteration (Ren et al., 2017). In recent studies, some endogenous single-copy genes of major carnivorous livestock were analysed and identified, and the molecular characteristics of animal-derived components were clarified using the genes (Köppel et al., 2010; Cai et al., 2014; Ren et al., 2017; Li et al., 2018; Chen et al., 2021a). For example, Cai et al. (2017) established a duplex digital droplet PCR (ddPCR) method for the simultaneous quantification of beef and pork, while the quantitative results depended on the conversions of the two linear relationships between meat quantity (mg), nucleic acid content (ng), and DNA copy number, which may increase the complication and the deviation. He et al. (2022) designed five pairs of specific primers for quintuple ddPCR and effectively identified the ingredients in DNA mixtures; however, in the actual trade, meat adulteration generally takes the form of mixed meat rather than mixed DNA; factors such as tissue type, species, and sample grinding can affect the DNA extraction efficiency. Yu et al. (2021) transformed the copy numbers to a fraction by adding an internal reference, and the identified and quantified samples were limited to fur-bearing animal ingredients with dynamic ranges from 1 to 90%. To determine the cost-effectiveness, a comparison was made between ddPCR and qPCR; the multiplex ddPCR approach was more cost-effective (from 45 to 383%) than qPCR, while up to 10 samples can be analysed in 8 h with multiplex ddPCR, compared to up to 8 days needed for qPCR (Košir et al., 2017).
Considering the current food safety regulations and the technical advances of dPCR, we established an effective quantitative system based on a digital PCR platform to accurately detect adulteration in meat products. Under the premise of fully considering the discrepancy in amplification efficiency and extraction efficiency among different animal-derived ingredients, the detection limits of six selected species were evaluated to confirm the feasibility of this method for the identification of low content animal-derived ingredients. Using the species-specific constant calculated from the copy number of ratio of the meat mixtures blended in pairs for the six test species, the copy number of the adulterated species can be easily converted into the proportion of meat adulteration with a limit of quantitation as low as 1% (mass to mass). Furthermore, taking turkey as the internal reference species in meat mixtures, the ddPCR platform was employed to quantify the animal-derived components in highly processed meat products, including sausages, meatballs, and meat skewers. Thus, the proposed ddPCR strategy can evaluate the intentional or unintentional adulteration of meat products according to the quantitative results while identifying small amounts of extraneous animal-derived ingredients in meat mixture products, which can be crucial for the regulators to determine the illegal nature of meat adulteration. The proposed method provides valuable technical support for ensuring market order and promoting sustainable development in the meat industry chain.
2. Materials and methods
2.1. Meat sample preparation and DNA extraction
In total, 20 fresh pure meats, including beef (Bos taurus), lamb (Ovis aries), pork (Sus scrofa), chicken (Gallus gallus), duck (Anatidae), and turkey (Meleagris gallopavo), and 15 highly processed meat products were randomly purchased from local markets in Changchun, China. All connective tissues and fat were eliminated from the animal tissues, the remaining animal tissues were separately freeze-dried and ground by an ultra-fine grinder (IKA®A11 basic, Staufen, Germany) for subsequent DNA extraction. The samples were separately treated to prevent cross-contamination. For raw meat matrix mixtures, meat powders of each species were accurately weighed using a precision electronic balance (Ohaus, Shanghai, China) and blended in pairs at 50% (w/w) levels of each in the final sample. For authentication cases of raw meat mixtures, chicken and pork powders were set as “adulterants,” which were individually prepared at 1, 5, 10, 30, 50, 70, 90, and 99% (w/w) levels in beef and lamb.
For each of the meat mixtures, genomic DNA was extracted and purified from 100 mg of sample with the DNeasy Blood & Tissue Kit (QIAGEN, Shanghai, China). The operation was carried out according to the kit manufacturer’s instructions. The extracted concentration and quality were measured using an ND-1000 spectrophotometer (Thermo Fisher Scientific Inc., Wilmington, DE, USA) at OD260 and OD280. The total DNA was stored at −20°C for further research.
2.2. Primers and probes
For detecting animal-derived ingredients, the stably inherited single-copy genes were selected as follows: the beta-actin (β-ACTIN) gene for beef, the replication protein A1 (RPA1) gene for sheep, the beta-actin (β-ACTIN) gene for pork, the transforming growth factor beta3 (TGFB3) gene for chicken, the Interleukin 2 (IL-2) gene for duck, and the transforming growth factor beta3 (TGFB3) gene for turkey products. Published studies have demonstrated that the above genes have interspecific and stable heritability, independent of the cell type of different tissues. The sequences of the primers and probes used in this study have been published elsewhere, the probes were labelled with the 6-carboxyfluorescein (FAM) at the 5′ ends and a black hole quencher 1 (BHQ1) at the 3′ ends to identify target samples (for details see Table 1).
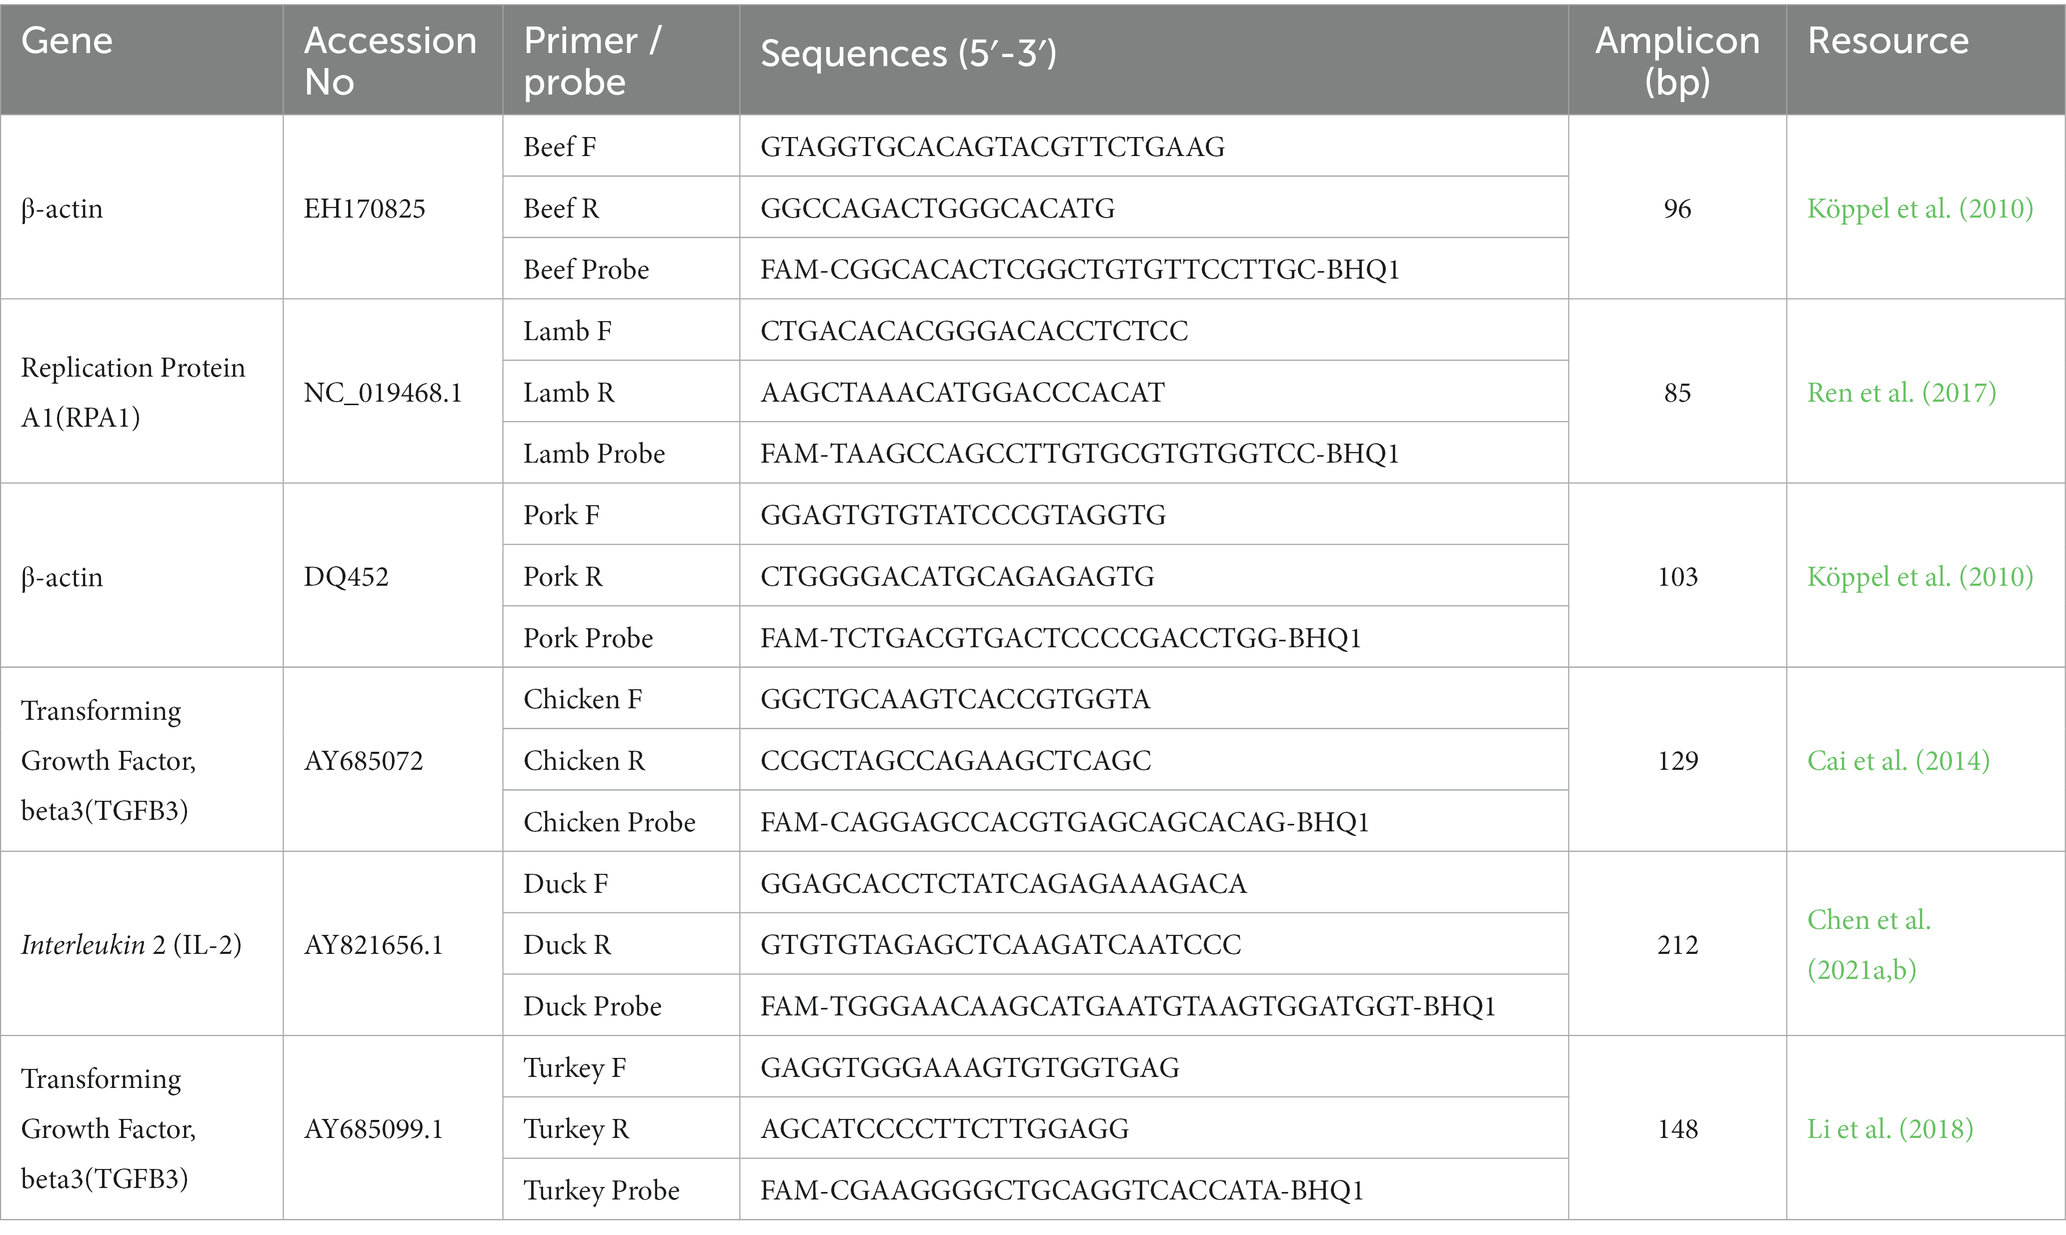
Table 1. The primers and fluorescence probes used in this study.
2.3. Digital droplet PCR and data analysis
The digital droplet PCR was performed on the QX200 Droplet Digital PCR System (Bio-Rad, Pleasanton, CA, USA). The ddPCR procedure involves three steps: generation of the oil–water droplet, PCR amplification, and positive signal collection. According to the manufacturer’s instructions, each 20 μl reaction mixture comprised 10 μl ddPCR Supermix for Probes (2×; Bio-Rad), 1 μl DNA template, 500 nM each of the forward and reverse primers, and 250 nM target gene probes. Subsequently, the final ddPCR reaction mixture was loaded with 70 μl droplet generation oil (EvaGreen 186-3,005, Bio-Rad, Hercules, CA, USA) into the cartridges for oil–water droplet generation on the AutoDGTM instrument (Bio-Rad) owing to density differences from the oil phase. After generating the droplets, the collected monodispersed oil–water droplets were randomly dispensed into a 96-well dPCR plate (1200-1925, Bio-Rad), foil-sealed, and thermal-cycled to the end-point. This step allowed each oil–water droplet to be treated as an independent PCR system for signal statistics. The amplification programs were performed in a C1000 PCR Thermal Cycler (Bio-Rad) according to the following protocol: enzyme activation for 10 min at 95°C, 44 cycles at 94°C for 30 s and at 58°C for 60 s, enzyme inactivation at 98°C for 10 min, and hold at 4°C for droplet analysis. When the amplification was completed, the plate was read using a QX200 Droplet Reader (Bio-Rad), and the quantitative data were finally analysed following the methodology of Košir et al. (2017) by setting up a manual threshold and using the QuantaSoft software (version 1.6.6, Bio-Rad). The absolute copy number per panel was measured by discriminating the positive droplets (target amplicons) from negative droplets (no target amplicons) by applying a fluorescence amplitude threshold and dividing the droplet population into two clusters. Based on Poisson statistics, the absolute copy number of specific gene in each sample was calculated using the following equations (Lun et al., 2008):
where N represents the expected copy number of the target gene measured by digital PCR, X represents the number of positive microdroplets in the system, and N is the total effective microdroplets. Unless otherwise specified, for each meat sample, three biological replicates were analysed within three technical replicates.
2.4. Real-time PCR (RT-PCR)
RT-PCR was used to amplify the DNA fragment for identifying each species; the sequence of DNA template, primers, and probes used in this RT-qPCR were the same as those in ddPCR (Table 1). The reaction mixture in a final volume of 20 μl contained 1 × HiTaq probe qPCR Mastermix (Apexbio Biotechnology, Beijing, China), 500 nM for each primer, 250 nM probe, and 1 μl DNA template. The probes used in RT-PCR were labelled with 6-FAM at the 5′ ends and BHQ1 at the 3′ ends to identify target samples. The thermal cycle protocol on Bio-Rad CFX96 Real-Time thermal analyzer (Bio-Rad, Hercules, USA) proceeded as follows: 95°C for 3 min, 39 cycles at 95°C for 15 s, and 60°C for 45 s. Fluorescence signals were analysed using the software Opticon Montior_2 version 2.02 (MJ Research, Waltham, MA, USA) during every PCR cycle at the annealing and extension steps.
2.5. Specificity detection
The species-specific primers/probes were applied in ddPCR assays using extracted DNA from different meat sources. The reaction mixtures were prepared as ddPCR reaction conditions mentioned above. The ddPCR assays only achieved positive results when the target species was tested with the corresponding specific primers/probes; however, no amplification or fluorescent signal observed for non-target species was defined as negative. Each sample was analysed in duplicate in three parallel assays.
2.6. DNA extraction efficiency
The connective tissue and fat from animal tissues were removed, and fresh lean meat from different species was used for following assays. The DNA from serially collected meat samples ranging from 10 to 100 mg was harvested and used to establish a linear relationship between the nucleic acid content (ng/μl) and meat quantity (mg). The extracted DNA from a serially diluted sample was analysed via ddPCR to quantify the target gene copy number, and a linear relationship was obtained between DNA copy number and nucleic acid content. Three parallel assays were performed with three replicates per diluted sample.
2.7. Limit of detection and limit of quantitation
The weight of the haploid genome size of each species was obtained from NCBI1; 100 ng genomic DNA corresponded to the discrepancy of the gene copy number in each species: 33,650 copies for beef, 32,340 copies for lamb, 866,860 copies for chicken, 37,070 copies for pork, 76,640 copies for duck, and 86,040 copies for turkey. To test the detection capability of ddPCR platform with low content templates, the extracted DNA from each sample was serially diluted over a range of 20,000 copies, 10,000 copies, 5,000 copies, 2,000 copies, 1,000 copies, 200 copies, 100 copies, 50 copies, 25 copies, 13 copies, 6 copies, 3 copies, and 1 copy using ddH2O as the dilution buffer. Moreover, the LOD and LOQ were assayed using six pairs of specific primers/probes. Each dilution was performed and analysed in 12 replicates from three independent experiments.
2.8. Establishment of a quantitative formula
Although the length of DNA fragments of each species is different, the correlation between the meat weight and copy number satisfies the following Eq. (2):
where Q is the total copy number of the target gene in the ddPCR reaction system, M is the weight of meat sample, C is the target gene copy number per unit weight of meat sample.
On the basis of Eq. (2), the mass fraction of the two species can be deduced as follows:
where Ma and Mt. are the mass of adulterated meat and specific meat contained, respectively; Ca and Ct are the copy number per unit weight of adulterated meat and specific meat, respectively; and Qa and Qt are the total copy number of adulterated meat and specific meat, respectively.
The k value was set as a specific species-species constant as the ratio of Ca and Ct was constant. For the quantitation of animal-derived ingredients, the k value can be simply calculated as the ratio of the copy number of the two species with the same amount. In the proposed assay, to determine the accuracy and stability of the k value, a series of target/adulterated mixtures containing various percentages (1–99% w/w) were prepared, and the copy number of species-specific genes was quantified using the dPCR platform. A linear relationship was established between the actual (Y-axis) and experimental (X-axis) values of adulteration. Each mixture of a known mass was tested in three independent assays (N = 18), and the accuracy of the methods should be within ±25% of the accepted reference value over the whole dynamic range according to the FAQ guidelines on performance criteria and validation of methods for food (Codex Committee on Methods of Analysis and Sampling, 2010). To demonstrate the applicability of the dPCR method for detecting highly processed meat products, 100 mg turkey meat was manually added to each sample as an internal reference, whose TGFB3 gene copy number was analysed via ddPCR. The ratio of the TGFB3 gene copy number in turkey to the species-specific gene of each meat sample was calculated to establish a linear relationship, which was used as the calculation equation for target meat mass.
2.9. Quantitative identification of commercial meat products
Based on the established relationship between the copy numbers and mass fractions of different meat products, the ddPCR assay was used to evaluate the animal-derived ingredients in commercially processed products (e.g., sausage, meat rolls, and kebab) and analyze whether a mistake in labelling meat content exists in the domestic market. Fifteen commercial meat products containing different species (e.g., beef and lamb kebabs, sausage, meat rolls, beef jerky, and duck blood) were randomly purchased from different local markets and retail outlets in Changchun City, PR China. All samples were collected in triplicates on three different days and refrigerated at 4°C. Briefly, 100 mg of commercial meat products was used as samples for DNA extraction and further analysis. The DNA extraction and ddPCR protocols used in this analysis are consistent with those presented in Sections 2.1 and 2.3, and the primers and probe sequences are shown in Table 1.
3. Results and discussion
3.1. Specificity assessment of the ddPCR platform for specific animal species identification
Driven by economic interests, illegal practitioners often substitute and adulterate high-priced meats, such as beef and lamb, with low-priced meats, and thus, the specificity of different species is a crucial indicator in the development of detection methods. In this study, the specificity was defined by the cross-amplification of the animal species-specific primers and probes used in the digital PCR platform. DNA was extracted from beef, sheep, chicken, pork, duck, and turkey and tested with two parallel channels. The results indicated that the ddPCR assays of samples had no cross-amplification with any non-target species. Therefore, all these selected primer and probe sets were species-specific, and samples that contained the target species could be accurately identified (Figure 1). Considering the above results, the pure meat products of each species could ensure positive reaction, and turkey was set as negative control for contamination exclusion in subsequent assays.
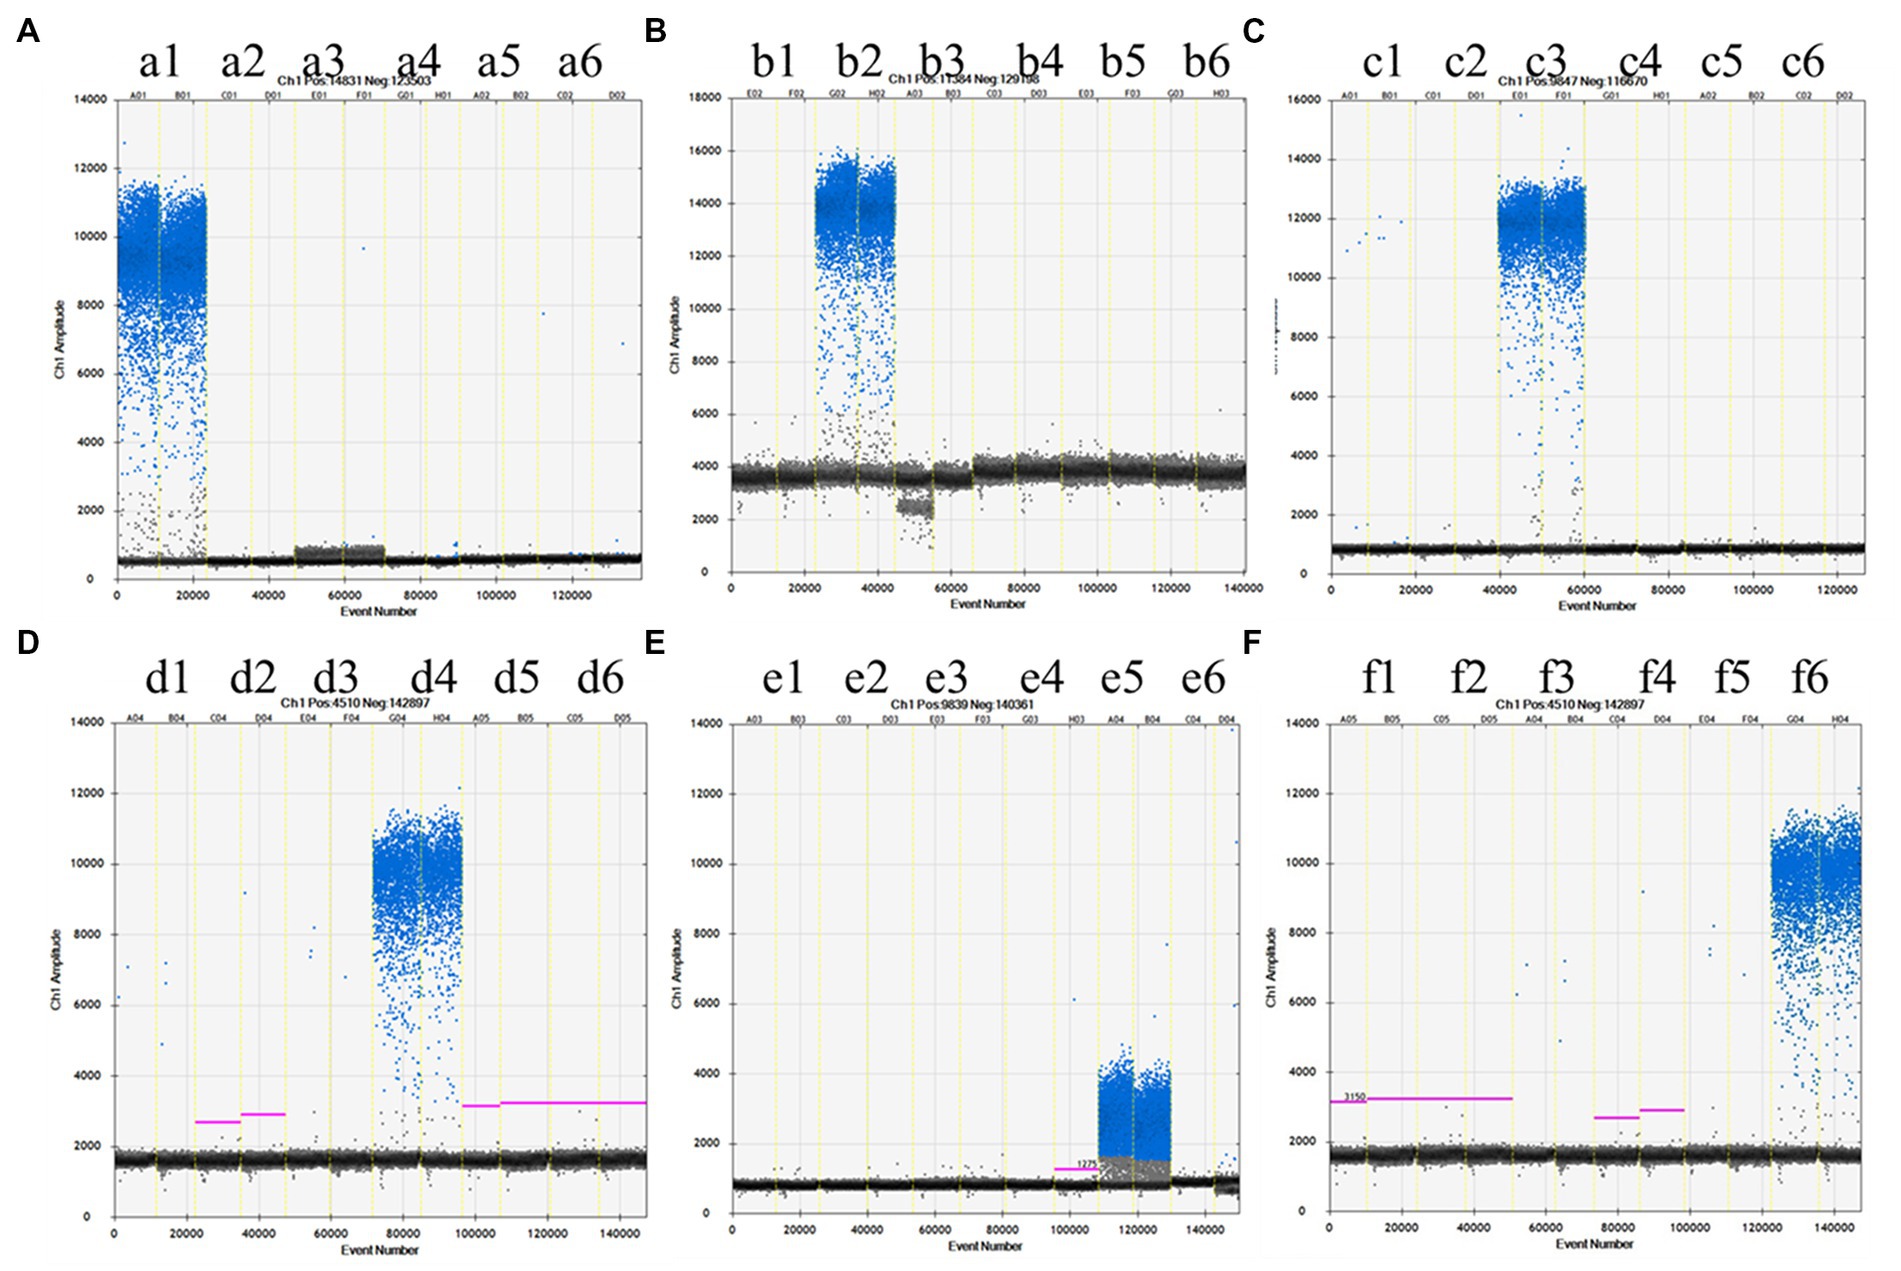
Figure 1. The specificity of ddPCR methods for different species. The X-axis indicates the event number of samples. The Y-axis represents the amplitude of samples. The primer pair for amplification as follows: (A) Beef, (B) Lamb, (C) Chicken, (D) Pork, (E) Duck, and (F) Turkey. The extracted DNA from each species was used as template for ddPCR. The template of each reaction in the six groups was beef (a1,b1,c1,d1,e1,f1), lamb (a2,b2,c2,d2,e2,f2), chicken (a3,b3,c3,d3,e3,f3), pork (a4,b4,c4,d4,e4,f4), duck (a5,b5,c5,d5,e5,f5), turkey (a6,b6,c6,d6,e6,f6) from the left column to the right column. The upper region: droplet cluster positive for FAM. The lower region: droplet cluster negative for FAM. The orthogonal testing for primer and template comprised 36 reactions. Each primer pair was analyzed in duplicate in three parallel assays.
3.2. Determining the linear relationship between meat quality (mg) and copy number
The primary challenge for quantitative analysis of animal-derived ingredients is the complexity of meat products available in the market, and various types of meat products differ in their composition of animal-derived ingredients, processing methods, and disposal procedures. As it is impossible for researchers to obtain all the information on the composition of raw materials or processing methods of meat products, establishing a clear and accurate quantitative analysis model is challenging. To reduce the error of quantitative results caused by measurement uncertainty and verify the positive correlation of each quantitative factor, two linear relationships were established: one between nucleic acid content and meat weight, and the other between gene copy number and nucleic acid content. The total DNA was extracted from several fresh meat tissues and analysed. All meat samples were mixed in the range of 10 to 100 mg, with 36 independent experiments performed per DNA sample on the ddPCR platform. To reduce the impact of tissue type, species, and sample grinding on DNA extraction and to verify the scientific nature of transforming copy number into mass fraction, we first determined the extraction efficiency of each species. The linear relationship between meat quality and DNA concentration is shown below: y = 10.2x − 4.794 for beef, y = 17.473x − 18.429 for lamb, y = 9.888x + 47.549 for chicken, y = 13.144x + 14.728 for pork, y = 17.752x − 28.785 for duck, and y = 12.646x + 11.325 for turkey (Figure 2). The correlation and linear relationship of the data confirmed that the extraction efficiency of different meat species was relatively consistent. Therefore, the determination value of nucleic acid content can directly reflect the meat weight.
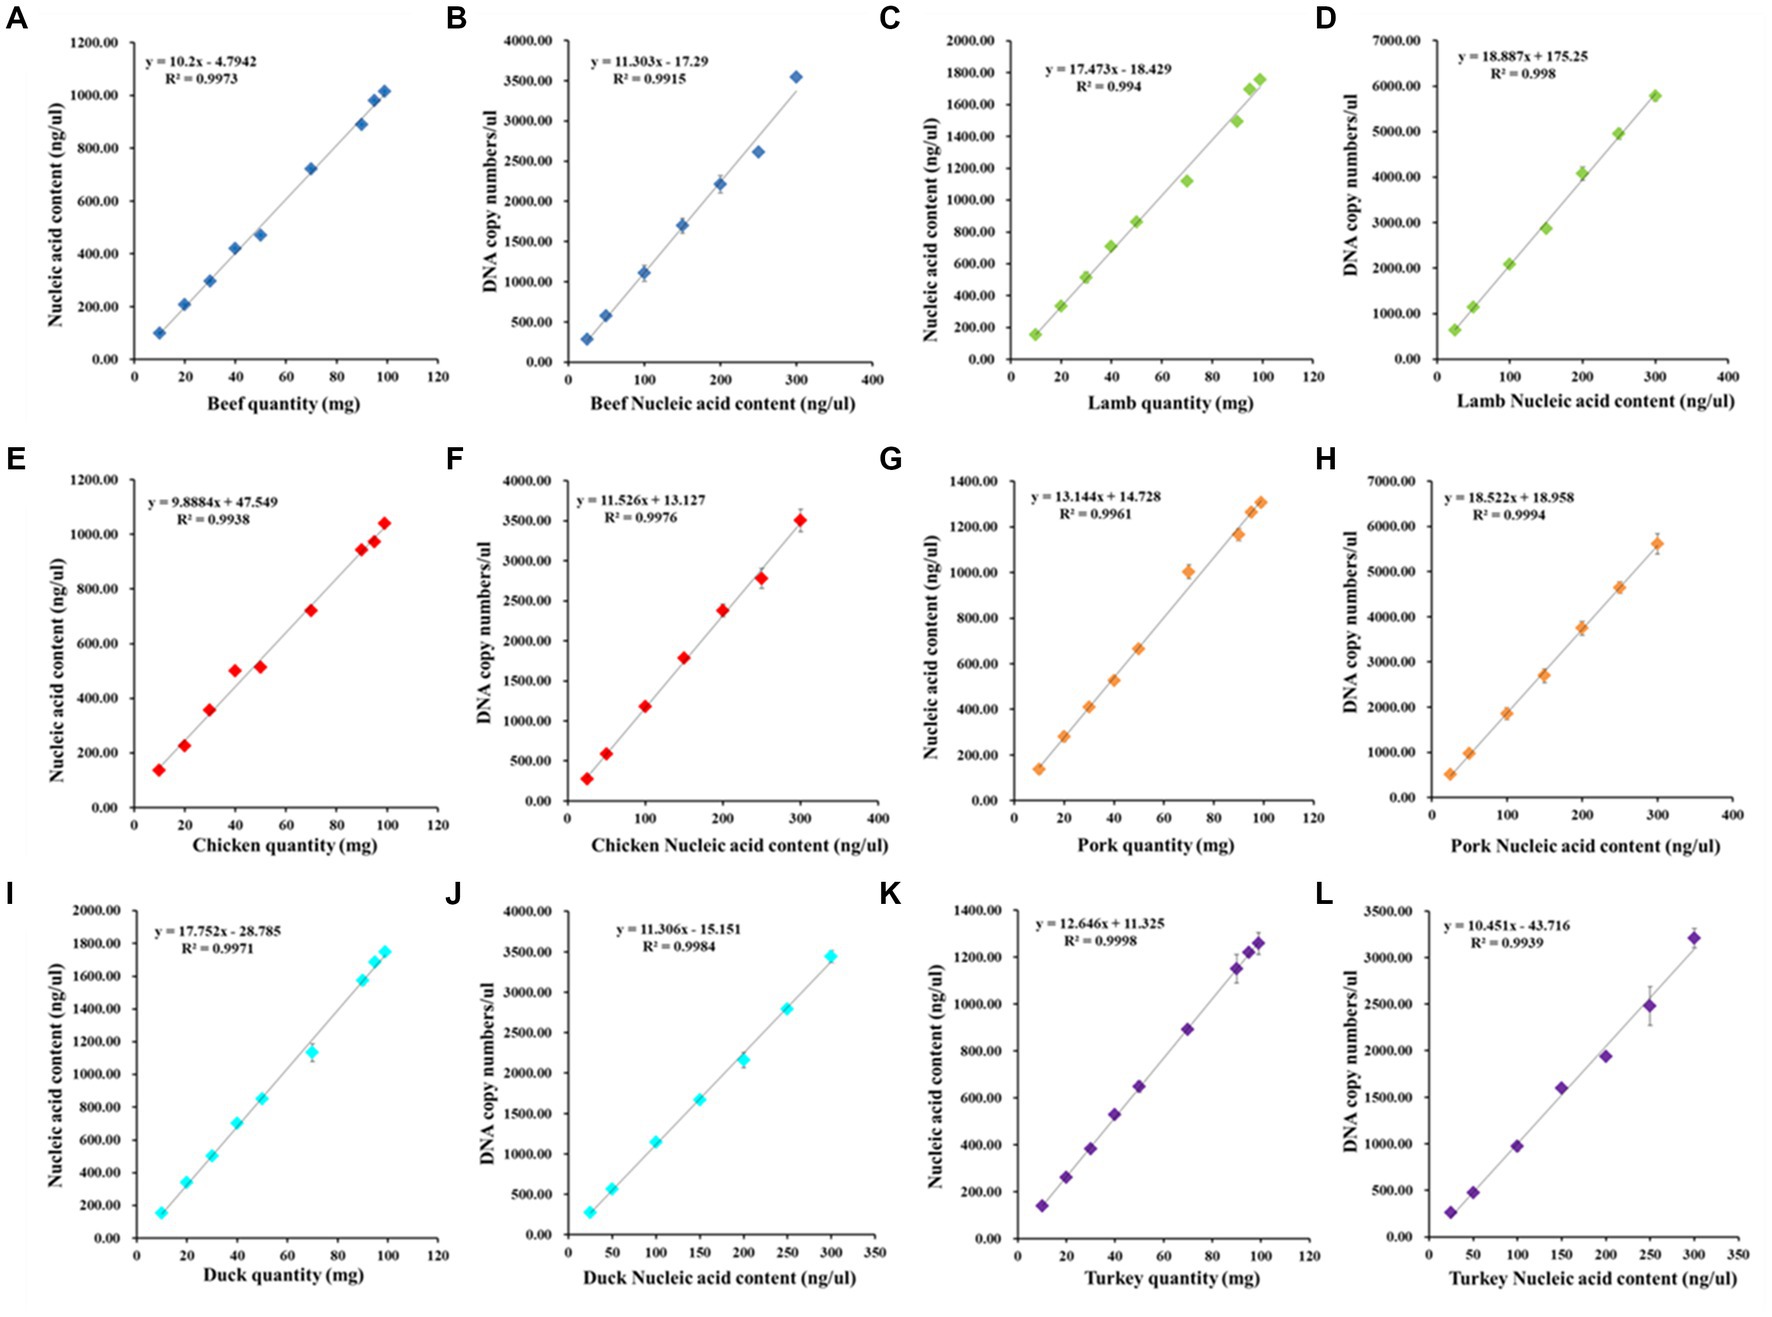
Figure 2. The linear relationships for the determination of DNA extraction efficiency, nucleic acid content and DNA copy numbers. The dynamic range of meat quantity and nucleic acid content, DNA content and ddPCR output (copies/μl)were individually evaluated for beef (A,B), lamb (C,D), chicken (E,F), pork (G,H), duck (I,J), and turkey (K,L). Each point data is the average value of three replicates per samples.
Moreover, it was necessary to determine the accurate quantitative range of ddPCR detection and the species-specific constants among the species. For consistency in the extraction efficiency of different meat products, the linear relationships between DNA concentration at the range of 25 to 300 ng/μl and copy number were established as shown in Figure 2: y = 11.303x − 17.29 for beef, y = 18.887x + 175.25 for lamb, y = 11.526x + 13.127 for chicken, y = 18.522x + 18.958 for pork, y = 11.306x − 15.151 for duck, and y = 10.451x − 43.716 for turkey. R2 is the coefficient of determination, which is used to access the linear regression analysis, and all the squared regression coefficient (R2) values of the amplification curve were satisfactory according to the acceptance criteria (average values of R2 should be ≥0.98), with the average R2 value ranging from 0.9915 to 0.9998. The slopes and intercept values were primarily affected by the PCR efficiency of each meat sample and the accuracy of the data. The dynamic range and the linear dependence indicated that the proposed ddPCR assay was suitable for quantifying meat adulteration even at low content levels.
3.3. LOD and LOQ of the respective species
Although regulations have tolerance limits for different species of meat, the purity of meat products is highly mandated from a religious perspective. Hence, highly sensitive assays were performed to meet this requirement. The LOD was defined as the lowest concentration at which 95% of the positive samples/replicates was detected. The LOQ was estimated as the lowest copy number within the dynamic range, assuming the copy number of the target DNA conformed to the Poisson distribution (Dobnik et al., 2016). In total, 12 repeated reactions per DNA dilution were prepared, and the added DNA was adjusted within a content range from 20,000 to 1 copies/reaction (20 μl volume) as ddPCR templates. As expected, the intensity of the positive signal decreased as the DNA copy number decreased (Supplementary Figure 1). According to the acceptance criteria of analytes in the samples, the LOD should be tested with a level of confidence of 95% (Marchesi and Broll, 2015). In the quantitative assays for beef, chicken, and pork, the positive signal was detected 12 times out of 12 replicates when there were more than 13 copies, indicating that the LOD values for beef, chicken, and pork were 13 copies (Table 2). Based on these statistical criteria, the LOD values for lamb, duck, and turkey were 6 copies. Meanwhile, the same DNA templates were verified via RT-qPCR (Table 2); the results indicated that ddPCR and RT-qPCR were suitable for detecting animal-derived ingredients. As per the criteria of RT-qPCR assays for the identification of animal ingredients from common livestock and poultry, when 35.0 < Ct value <40, repeated tests must be conducted to evaluate the detection results (Standardization Administration of China, 2019), which increase the testing cost and time of RT-qPCR compared with those of ddPCR.
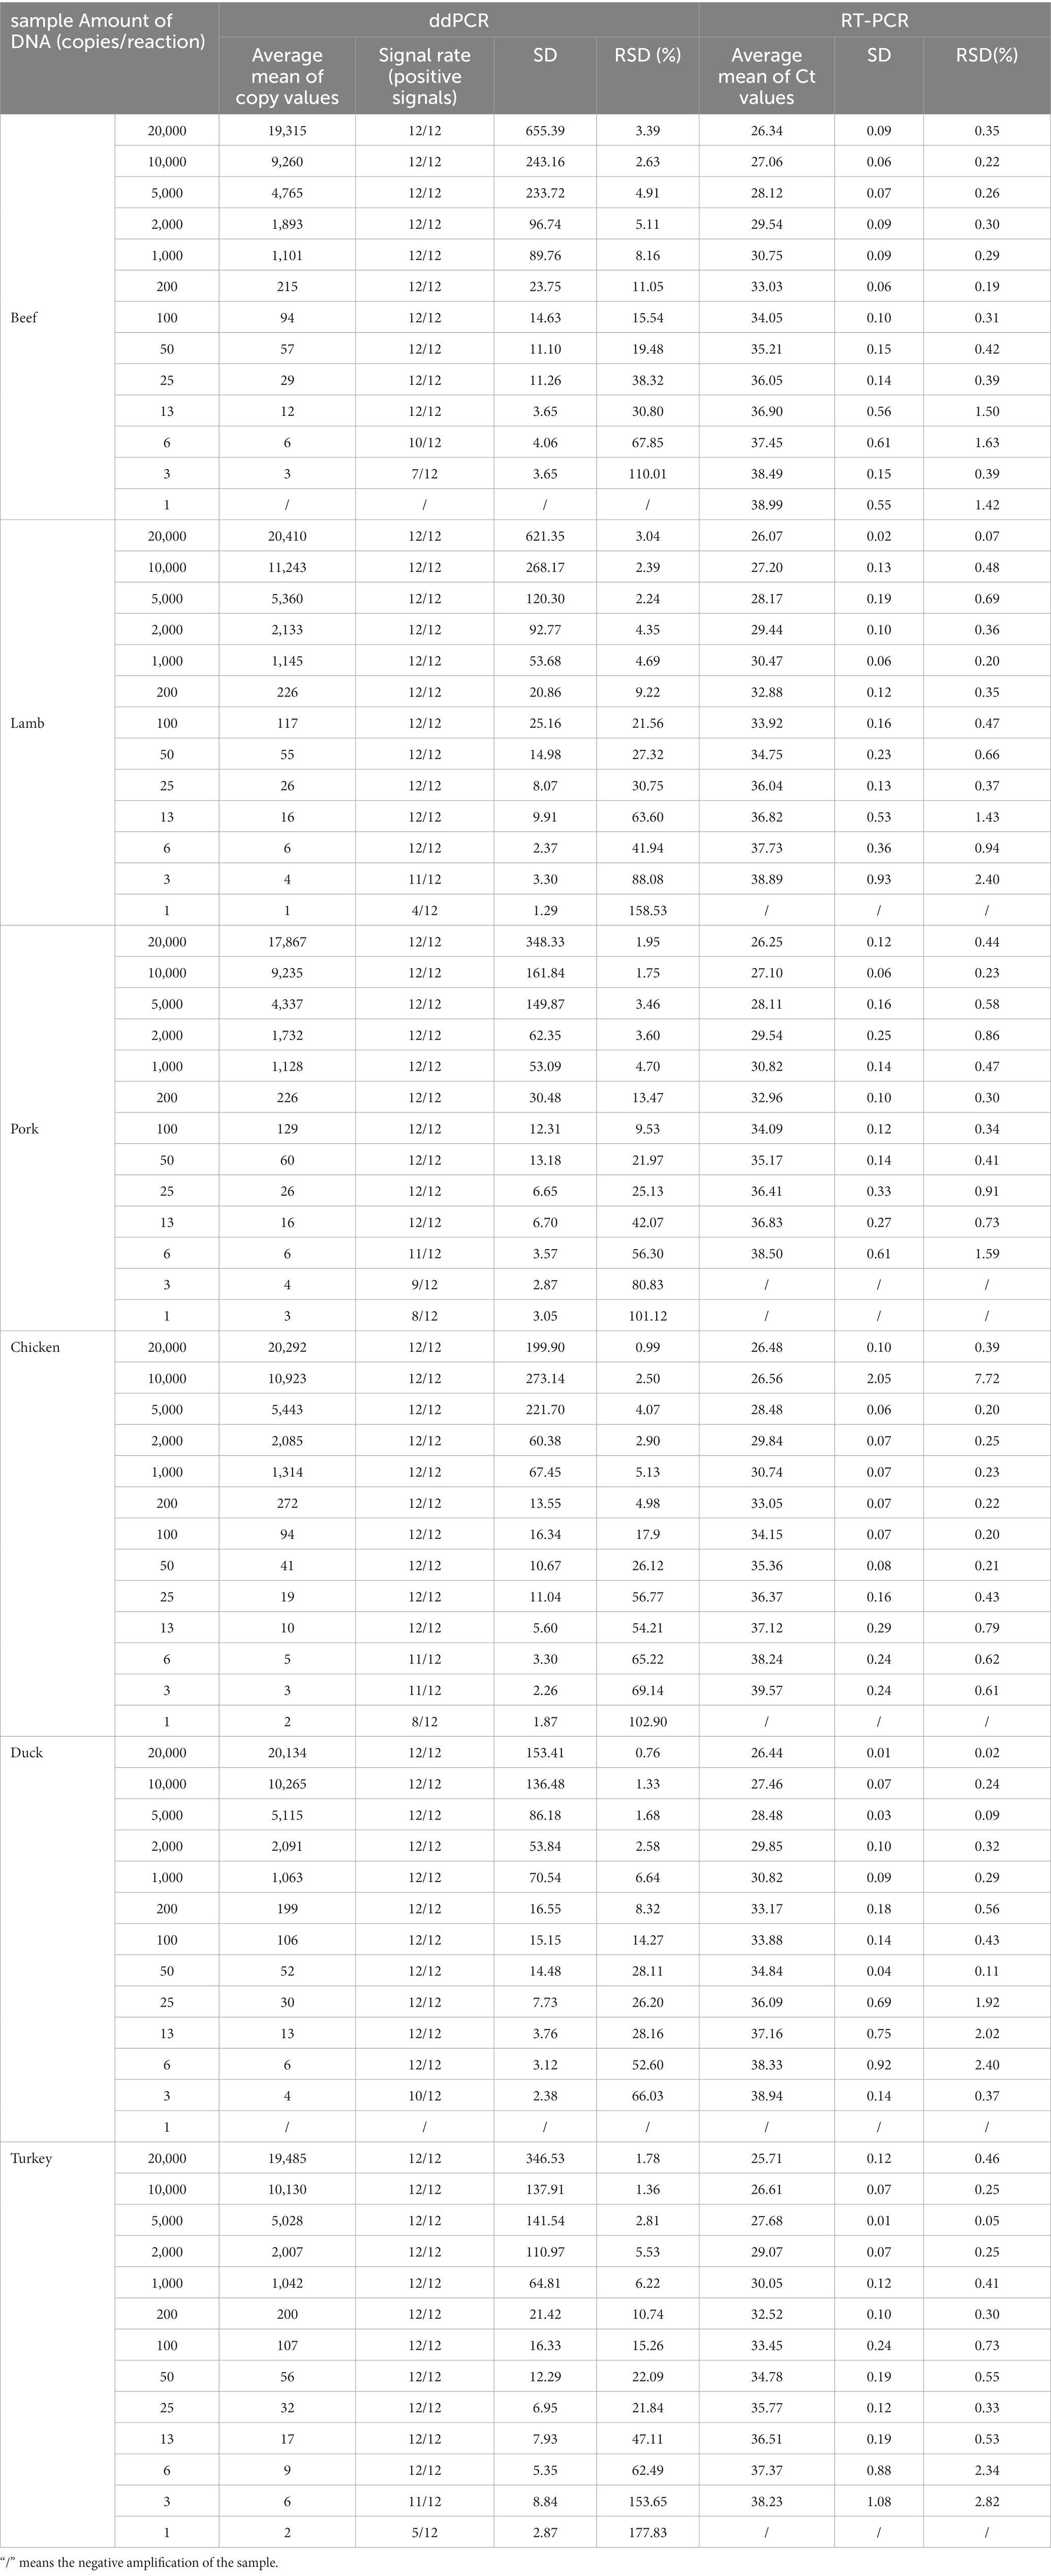
Table 2. The detection sensitivity results of ddPCR and qPCR in the series-diluted DNA solution.
The LOQ was the data group with a relative standard deviation (RSD) value below 25% (Marchesi and Broll, 2015). When the template content of individual beef and pork samples was as low as 50 copies/reaction in ddPCR assay, the RSD of the replicate reactions were 19.48 and 21.97%, respectively, suggesting that the LOQ of ddPCR method was approximately 50 copies for both beef and pork. In addition, we concluded that the LOQ values for lamb, chicken, and duck were 100 initial template copies, and that for turkey was 25 copies. The RSD values of the species-specific ddPCR were also within an acceptable range for the quantitative copy number in the assay (21.56% for lamb, 17.9% for chicken, 14.27% for duck, and 21.84% for turkey). The LOD was previously measured as a content percentage, and LOD values of 1 and 0.01% were observed in multiplex PCR (Hou et al., 2015) and in qPCR, respectively (Xu et al., 2018). Although the above detection limits met the requirements for food regulations, the quantitative results were greatly affected by the amplification efficiency of primers, and a standard curve should be prepared. In the ddPCR assays, the amplification product of target DNA was separated into numerous droplets, and the absolute analysis can be achieved using Poisson distribution without depending on the amplification efficiency and standard curve. Thus, the LOD and LOQ of our ddPCR method enabled the assessment of the copy number level, which met the requirement of both accurate detection and quantitation of meat adulteration of the different species at low levels.
3.4. Construction and validation of the quantitative formula
In previous studies, the quantification of meat products using DNA typically necessitated a comprehensive understanding of the characteristics of the target meat and background meat and relied on using calibration curves to quantify animal-derived ingredients(Martın et al., 2009; Soares et al., 2010; Cai et al., 2017). However, if multi-copy genes were selected as targets, the obtained DNA measurements could not truly reflect the actual content (mass fraction) of the target meat. In addition, the conversion process would introduce parameters such as the composition of animal-derived components of the sample, processing method, and disposing procedures, which might be difficult to accurately convert, leading to inaccurate quantitative results. As the gene copy number per unit mass of each species is constant, the quantitative detection of adulteration in meat products can be realized by establishing the corresponding relationship between the copy number of the target gene and the mass fraction. The derivation of Eq. (3) defines the k value as a species-species constant, which was obtained from the copy number ratio of the two species with equal mass. The k values for different species are presented in Table 3, showing that the relationship between the mass fraction and copy number ratio in meat mixtures was established according to the corresponding k value. The establishment of this quantitative formula overcomes the limitations of previous methods that relied on standard curves and mitochondrial genes for quantification. Taking nuclear single-copy genes as detection targets can eliminate systematic errors caused by copy number variation, and the introduced correction coefficient can achieve an accurate corresponding relationship between the quantitative target genes and the mass fraction of samples. The conversion between the copy number determined by ddPCR and the mass fraction of animal-derived components can be effectively achieved by determining the species-specific constant. To further understand this quantitative strategy, beef and lamb were taken as target meat samples, and chicken and pork were used as the meat adulteration samples; the meat matrix mixtures with different mixture proportions were prepared to evaluate the stability and repeatability of the k values (Tables 4, 5). According to Eqs. (2) and (3), the k values of the different meat fractions between two species were defined by the ratio of copy numbers, where kbc was approximately 0.35 for the beef–chicken adulteration sample; the mass fraction was calculated using the following expression (RSD = 8.69%):
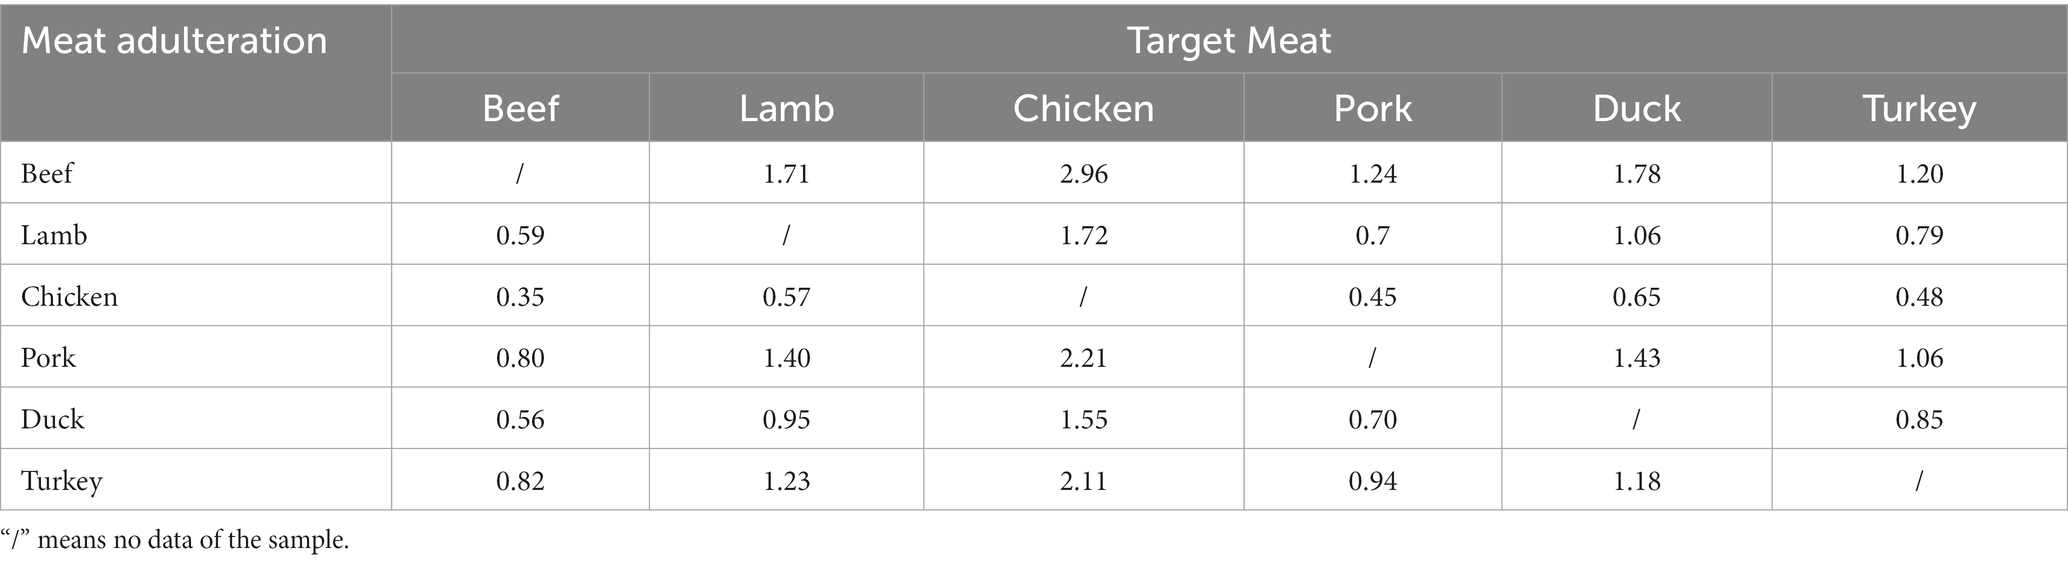
Table 3. The species-specific constant k values of meat mixtures from different species.
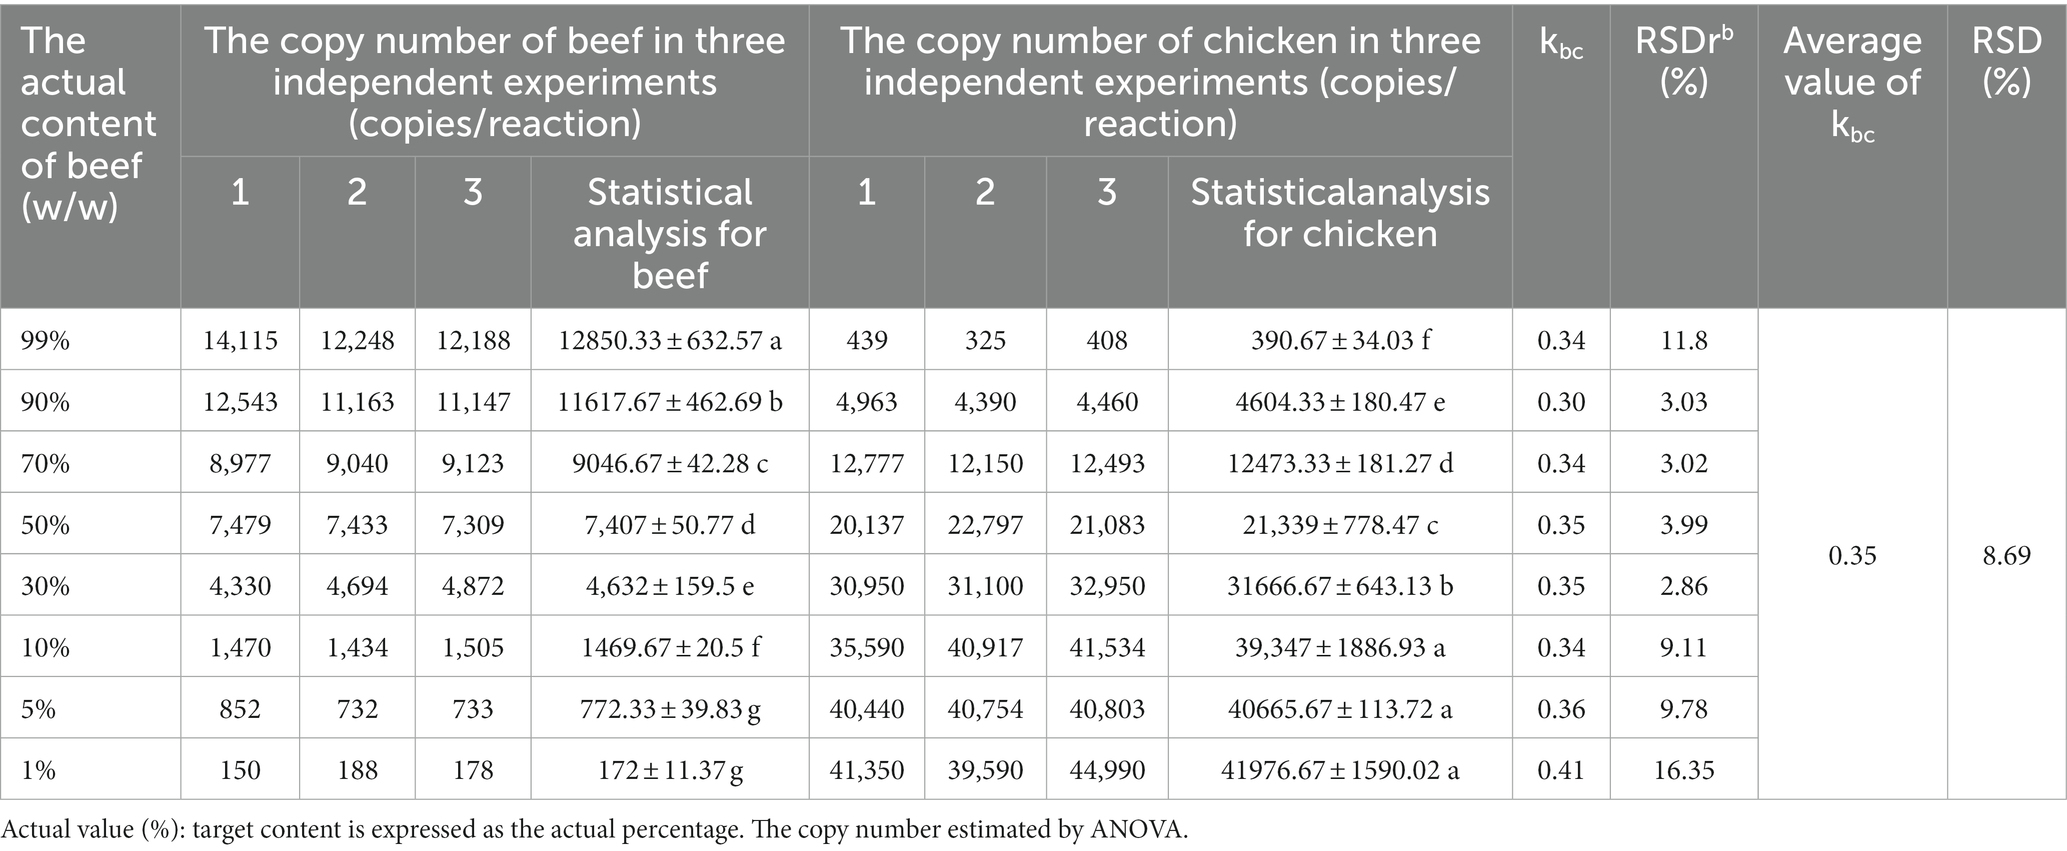
Table 4. The ratio of copy numbers with different proportions of beef-chicken adulteration scenario.
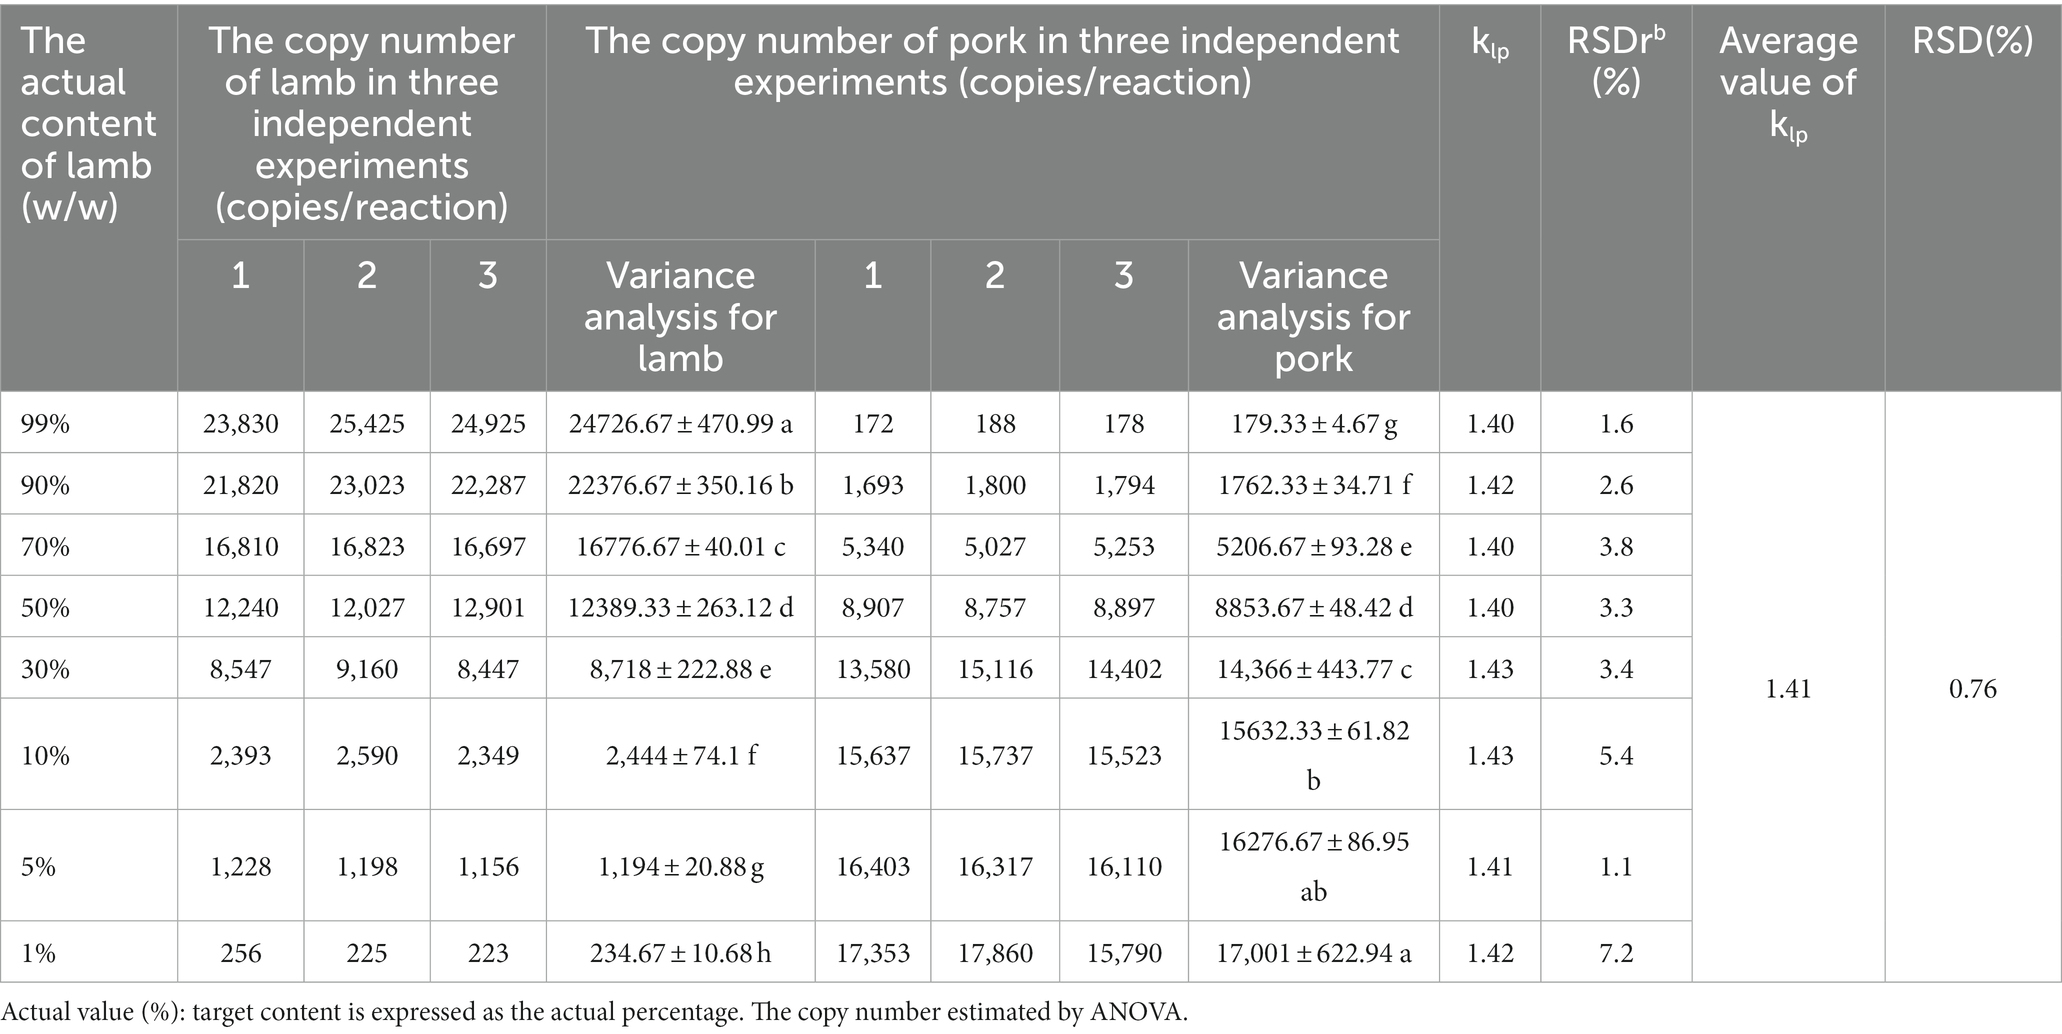
Table 5. The ratio of copy numbers with different proportions of lamb-pork adulteration scenario.
The klp was approximately 1.41 for the lamb–pork adulteration sample, and the mass fraction was calculated using the following expression (RSD = 0.76%):
RSD levels within groups have accepted criteria of trueness (RSD < 25%). Thus, the results indicated that the k values derived from the copy number ratio of respective species were suitable for calculating the adulteration concentration in meat mixtures. The proportions of doped species in meat samples were also estimated, and a linear relationship was established between the experimental mass (w/w) and actual content (w/w) of meat adulteration. For example, in the measurement of beef–chicken and lamb–pork adulteration samples, the slopes of the linear regression curves and the R2 in meat mixtures (Figure 3) were obtained by the quantitative formula for meat mixture using the following expression:
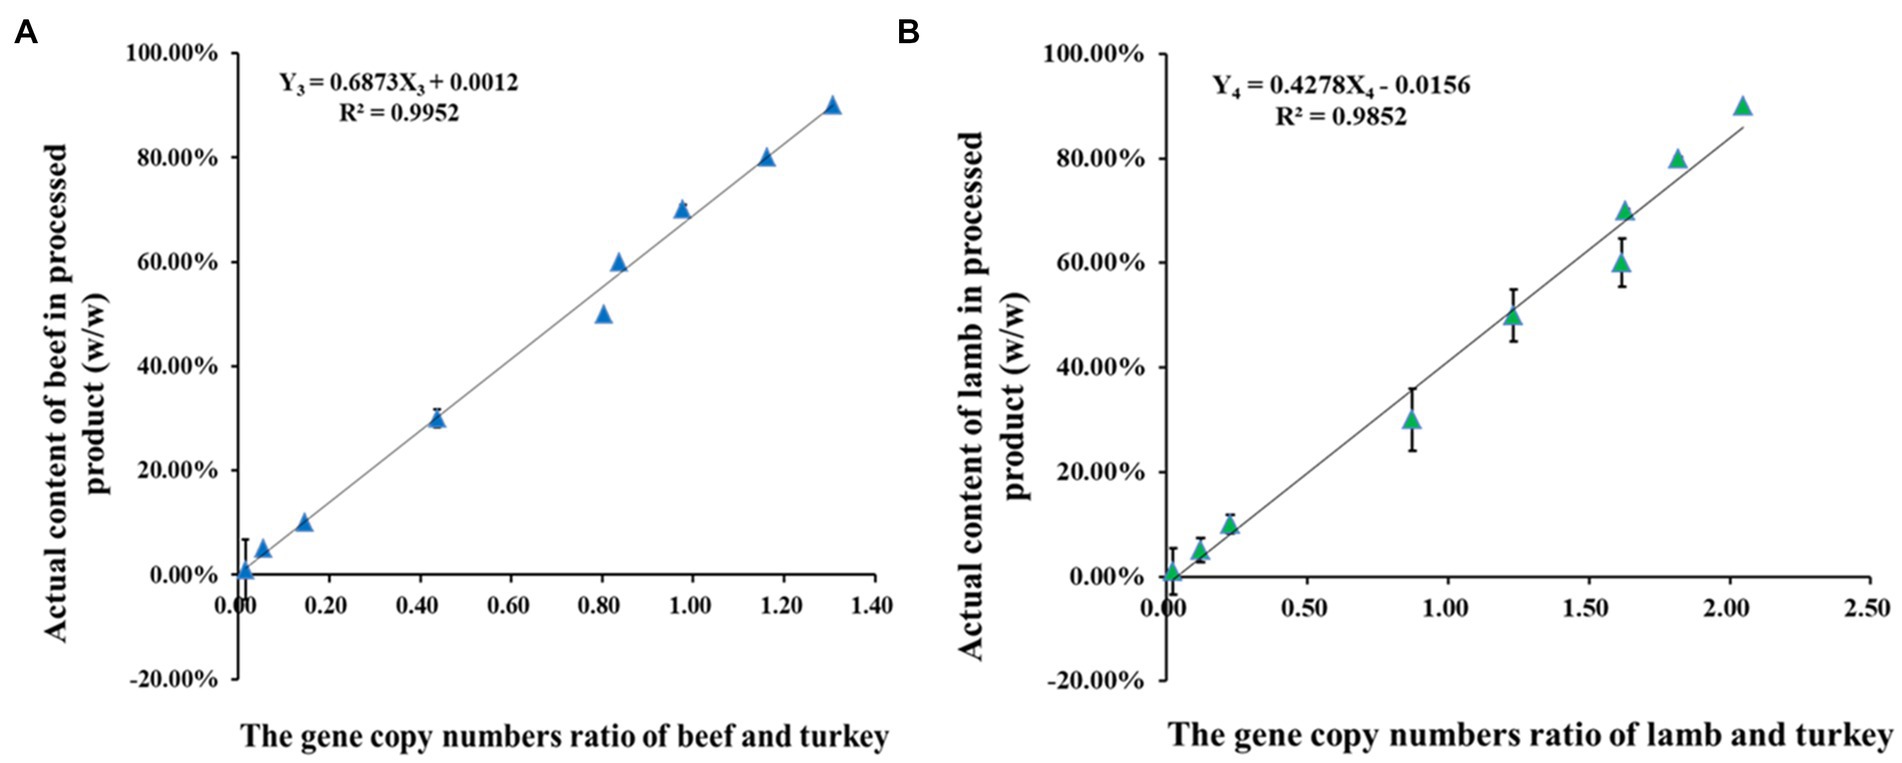
Figure 3. The quantitative dynamic range of chicken and pork fraction in adulteration scenario. The Y-axis represents the actual content of chicken (A) and pork (B) in meat mixture, respectively. The X-axis represents the experimental content of chicken and pork calculated form the quantitative formulas on the basis of the corresponding k value. For the quantification of chicken in beef: The SD ≤ ±2.46% and the RSD ≤ ±7.5%; For the quantification of pork in lamb: The SD ≤ ±1.84% and the RSD ≤ ±9.13%. Three replicates in per mass fractions.
where Y1 and Y2 represent the actual content of chicken and pork in the mixtures, respectively; and X1 and X2 represent the experimental mass of chicken and pork estimated using Eqs. (4) and (5), respectively. The good linear correlation indicated that adulteration with chicken and pork had a mass content (w/w) ranging from 1 to 99% and performed a good recovery through the slope of the standard curves, with R2 values that were evidently higher than 0.99.
To evaluate the accuracy of this method, several minced meat mixtures with known content (1–99%) of chicken and pork were measured and analysed using the ddPCR platform. The experimental mass fraction values were corrected with the k values from the quantitative Eqs. (4) and (5), and the deviations of different meat fractions between the calculated and actual weights were then reported (Table 6). For the beef doped with chicken, the bias (%) varied between −4.44 and 5.75%, and for the lamb doped with pork, the bias (%) varied between −1.43 and 12.13%. Moreover, meat mixtures with an adulteration content as low as 1% (w/w) were accurately quantified with low RSD levels (< 10%), and the bias values for 1% chicken and 1% pork content were 4.41 and 9.13%, respectively, in the meat mixtures. Thus, the quantitative results exhibit trueness within ±25% of the acceptance criterion across the entire dynamic range (Marchesi and Broll, 2015). The discrepancy of the bias in the beef and lamb mixtures was primarily owing to the heterogeneity of the meat components. The quantitative detection in this study indicated that our ddPCR method had a high-level of accuracy, with the weight fractions ranging from 1 to 99%.
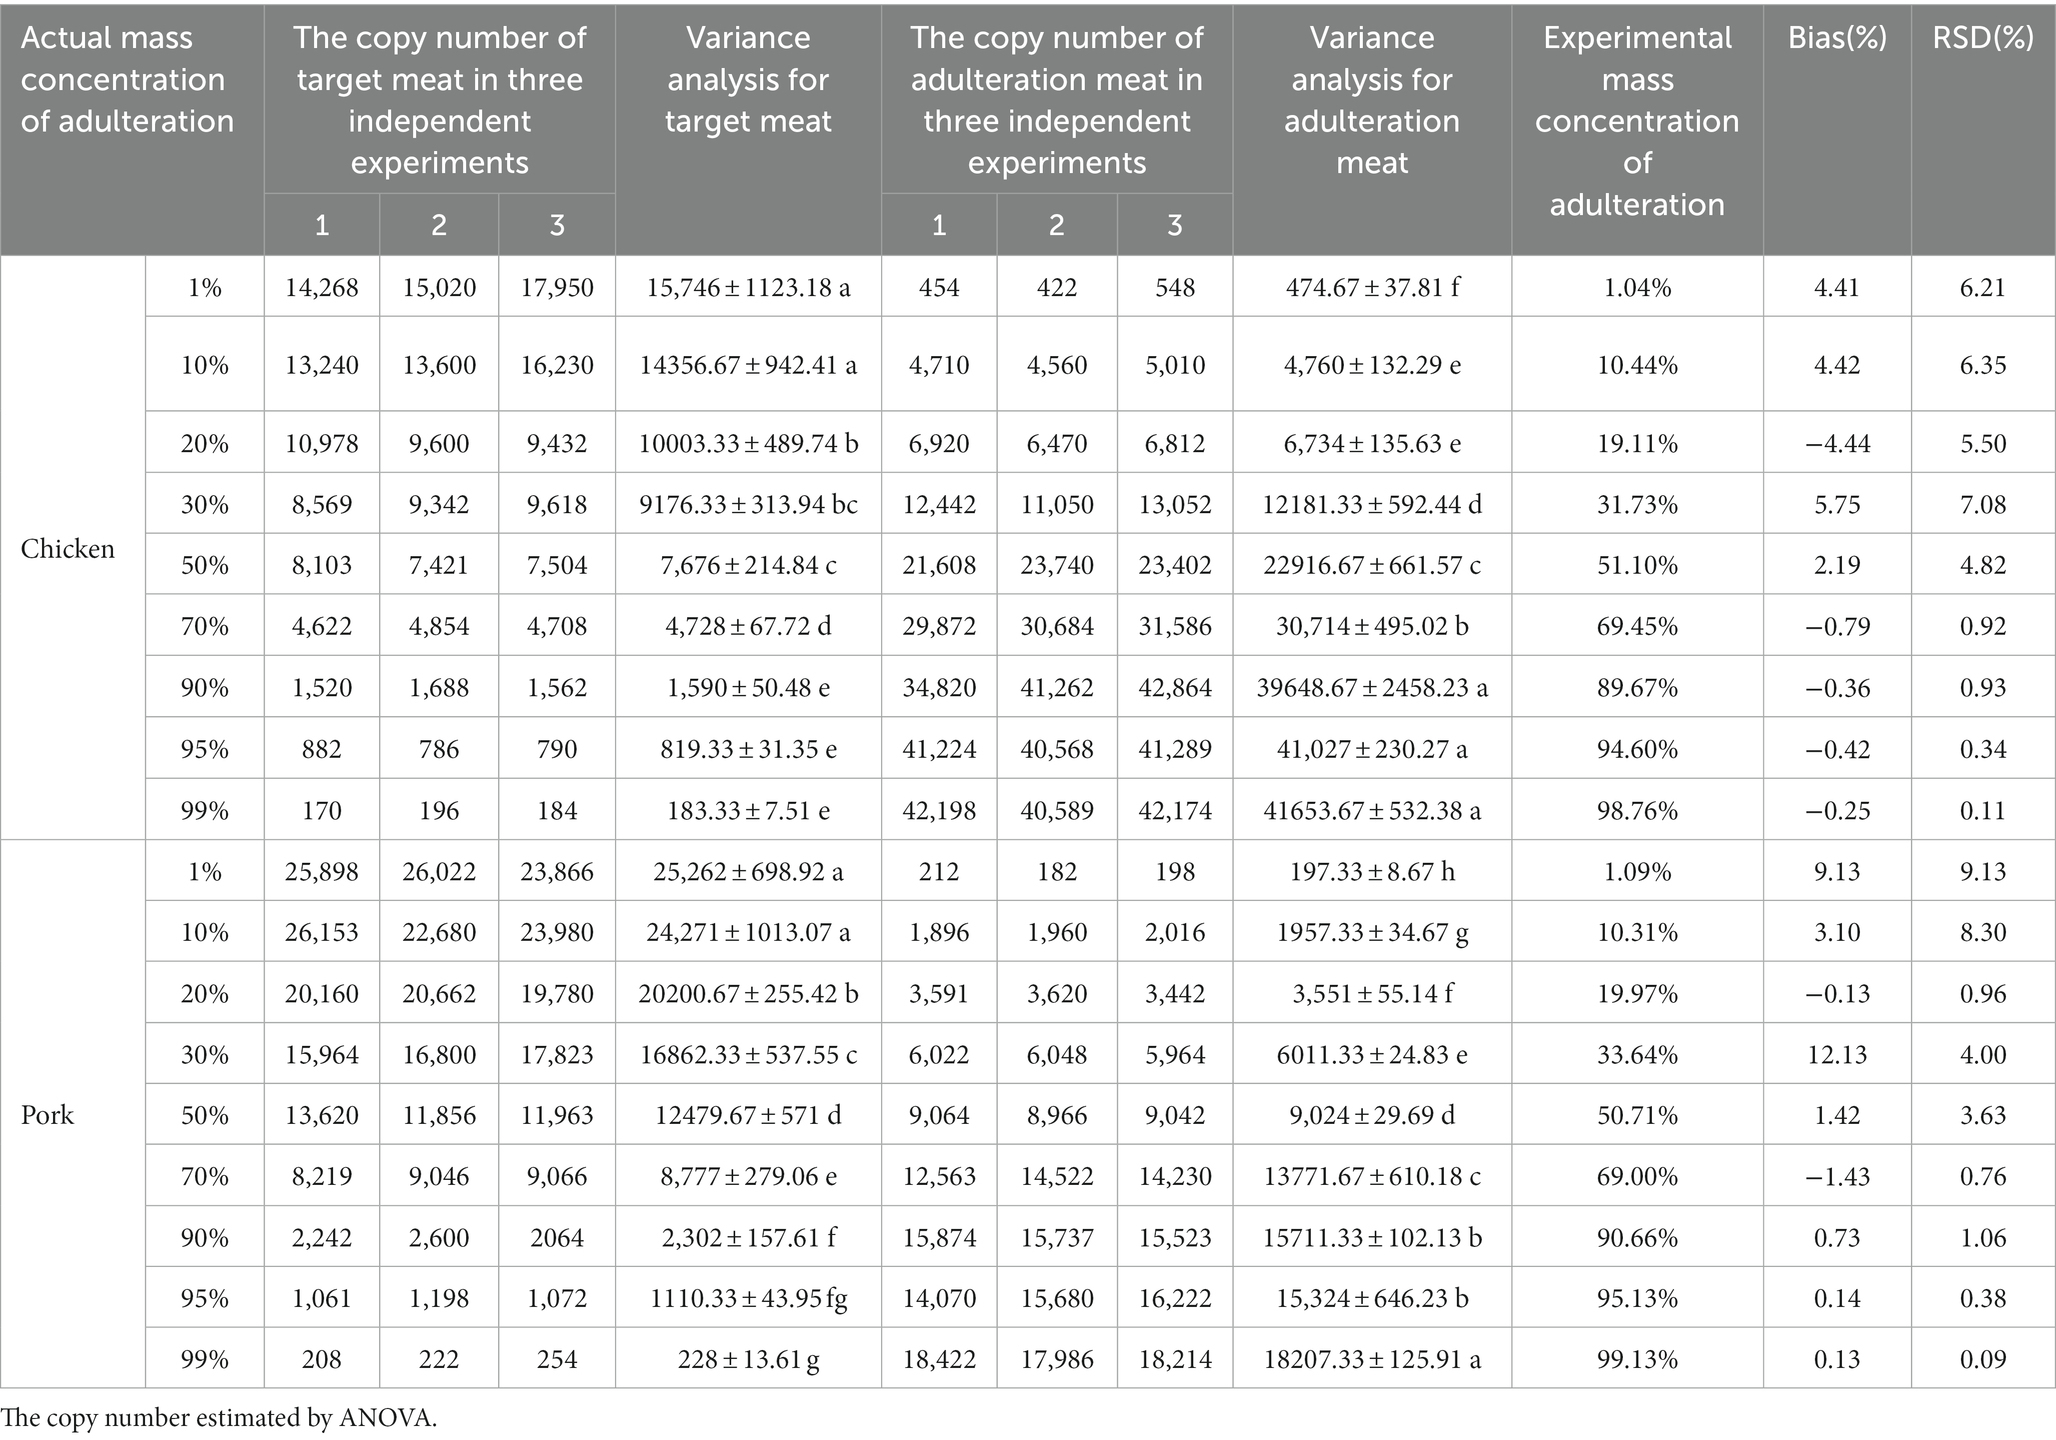
Table 6. The quantitative results for adulteration in beef and lamb with known concentrations.
Some commercial meat products are mixed with non-meat ingredients, such as vegetables, water, spices, condiments, starch, and preservatives, that increase the complexity of identification. To quantify the target meat in known mixed meat products and verify whether the content is consistent with the list of ingredients, an equal amount of turkey was added to each meat mixture at different mass fractions as an internal reference. The quantification of beef and lamb in processed products showed that for the respective fraction, there were linear relationships between the copy number ratio of target meat and the turkey internal reference (X-axis) vs. the actual mass content (Y-axis; Figure 4). For example, using beef and lamb as target species, the quantification equations for processed products are shown below:
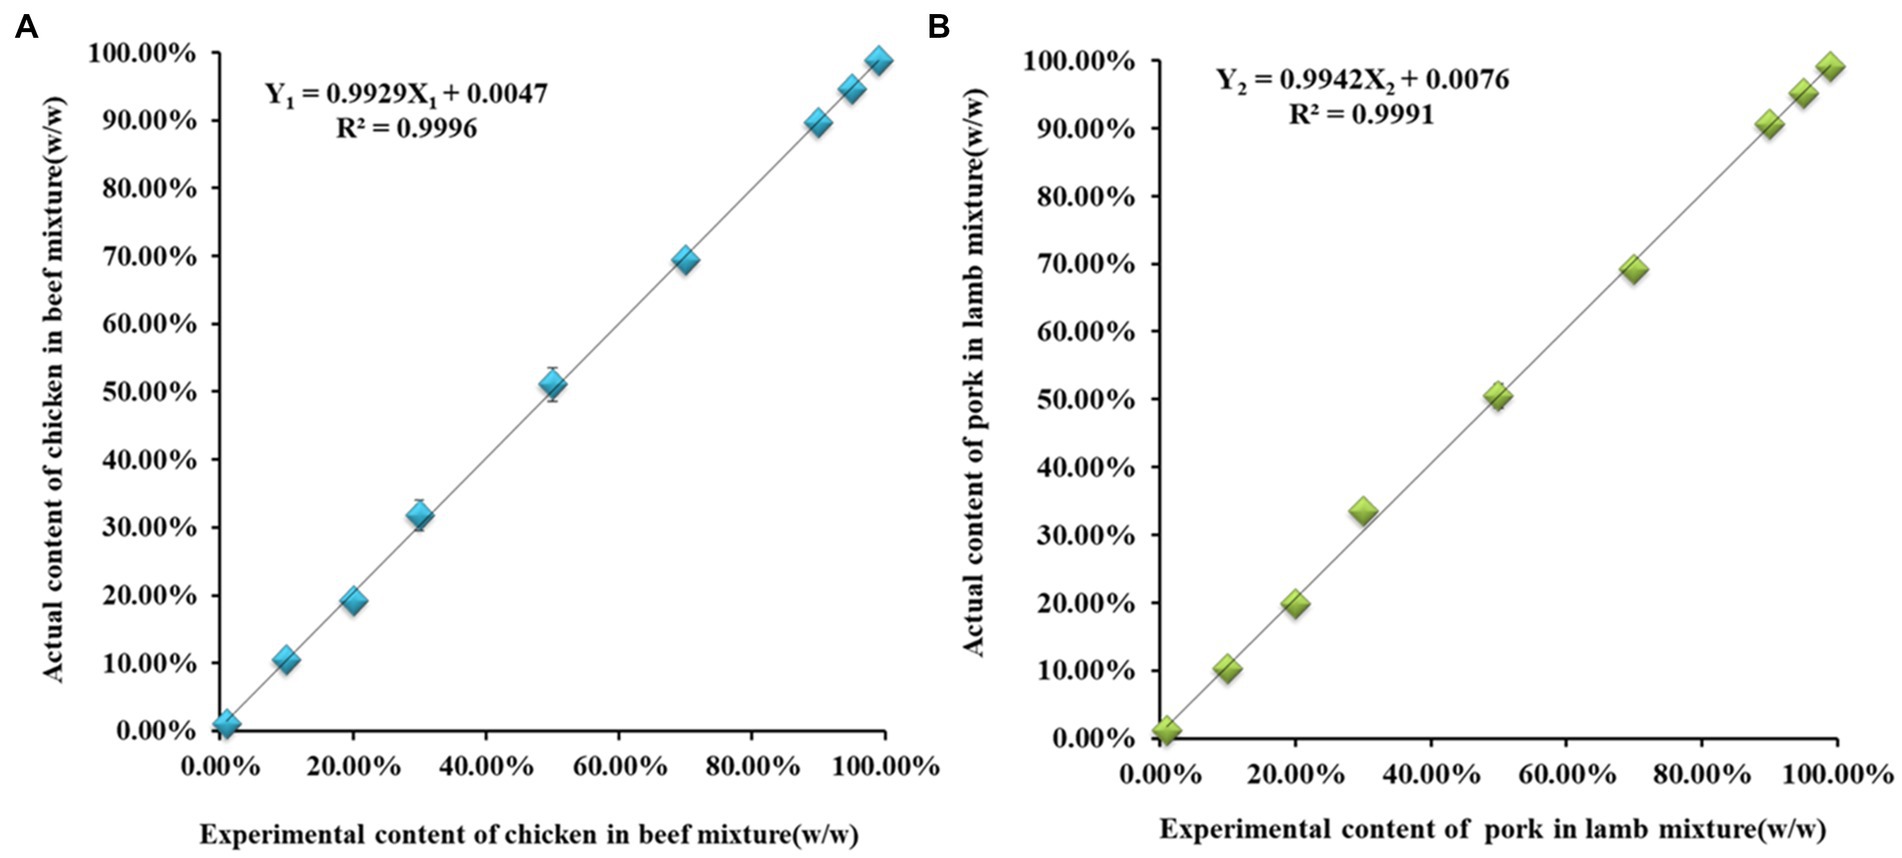
Figure 4. The linear relationships between the gene copy numbers ratio of target meat and internal reference turkey vs. the actual mass content (w/w) in processed products. (A) Beef relationships curves with R2 = 0.9952; (B) Lamb relationships curves with R2 = 0.9852.
where Y3 and Y4 represent the actual mass content of beef and lamb in the meat mixtures, respectively. The quantification equations for the other species were also established and presented in Supplementary Figure 2. The data in both quantification equations confirmed that the proposed system can be used for the analysis of target meat content in commercial products that have known mixed content and additional processing.
3.5. Analysis of processed meat samples
In highly processed products, a discrepancy was observed between the experimental content and the ingredient list owing to the degradation of materials, which may have an impact on the detection of nucleic acid components. As ddPCR has high sensitivity and can detect at the copy number level, the errors do not affect the accuracy of determining the components. To determine the potential application of the ddPCR assay, 15 commercial meat products were purchased from local markets and analysed. The results indicated that no other adulterated meat species were detected in beef/lamb kebabs and rolls, pork mince, or duck blood, which all showed positive signals for their respective target meat species (Table 7). The five highly processed products that contained more than two species were selected for further analysis of ingredients. The baby sausages were primarily made of chicken mixed with duck, and the beef sausage and jerky had extremely low beef content (0.54 and 0.76%, respectively), with relatively higher chicken than beef (24.46 and 3.8%, respectively) content (Figure 5). Similarly, the contents of pork and chicken in pork sausage were 5.59 and 6.71%, respectively. The only meat ingredient in corn sausage was chicken. These analytical results validated that there were adulterated ingredients in these products could be detected by the assay, indicating its potential as a tool to detect meat content in commercial products.
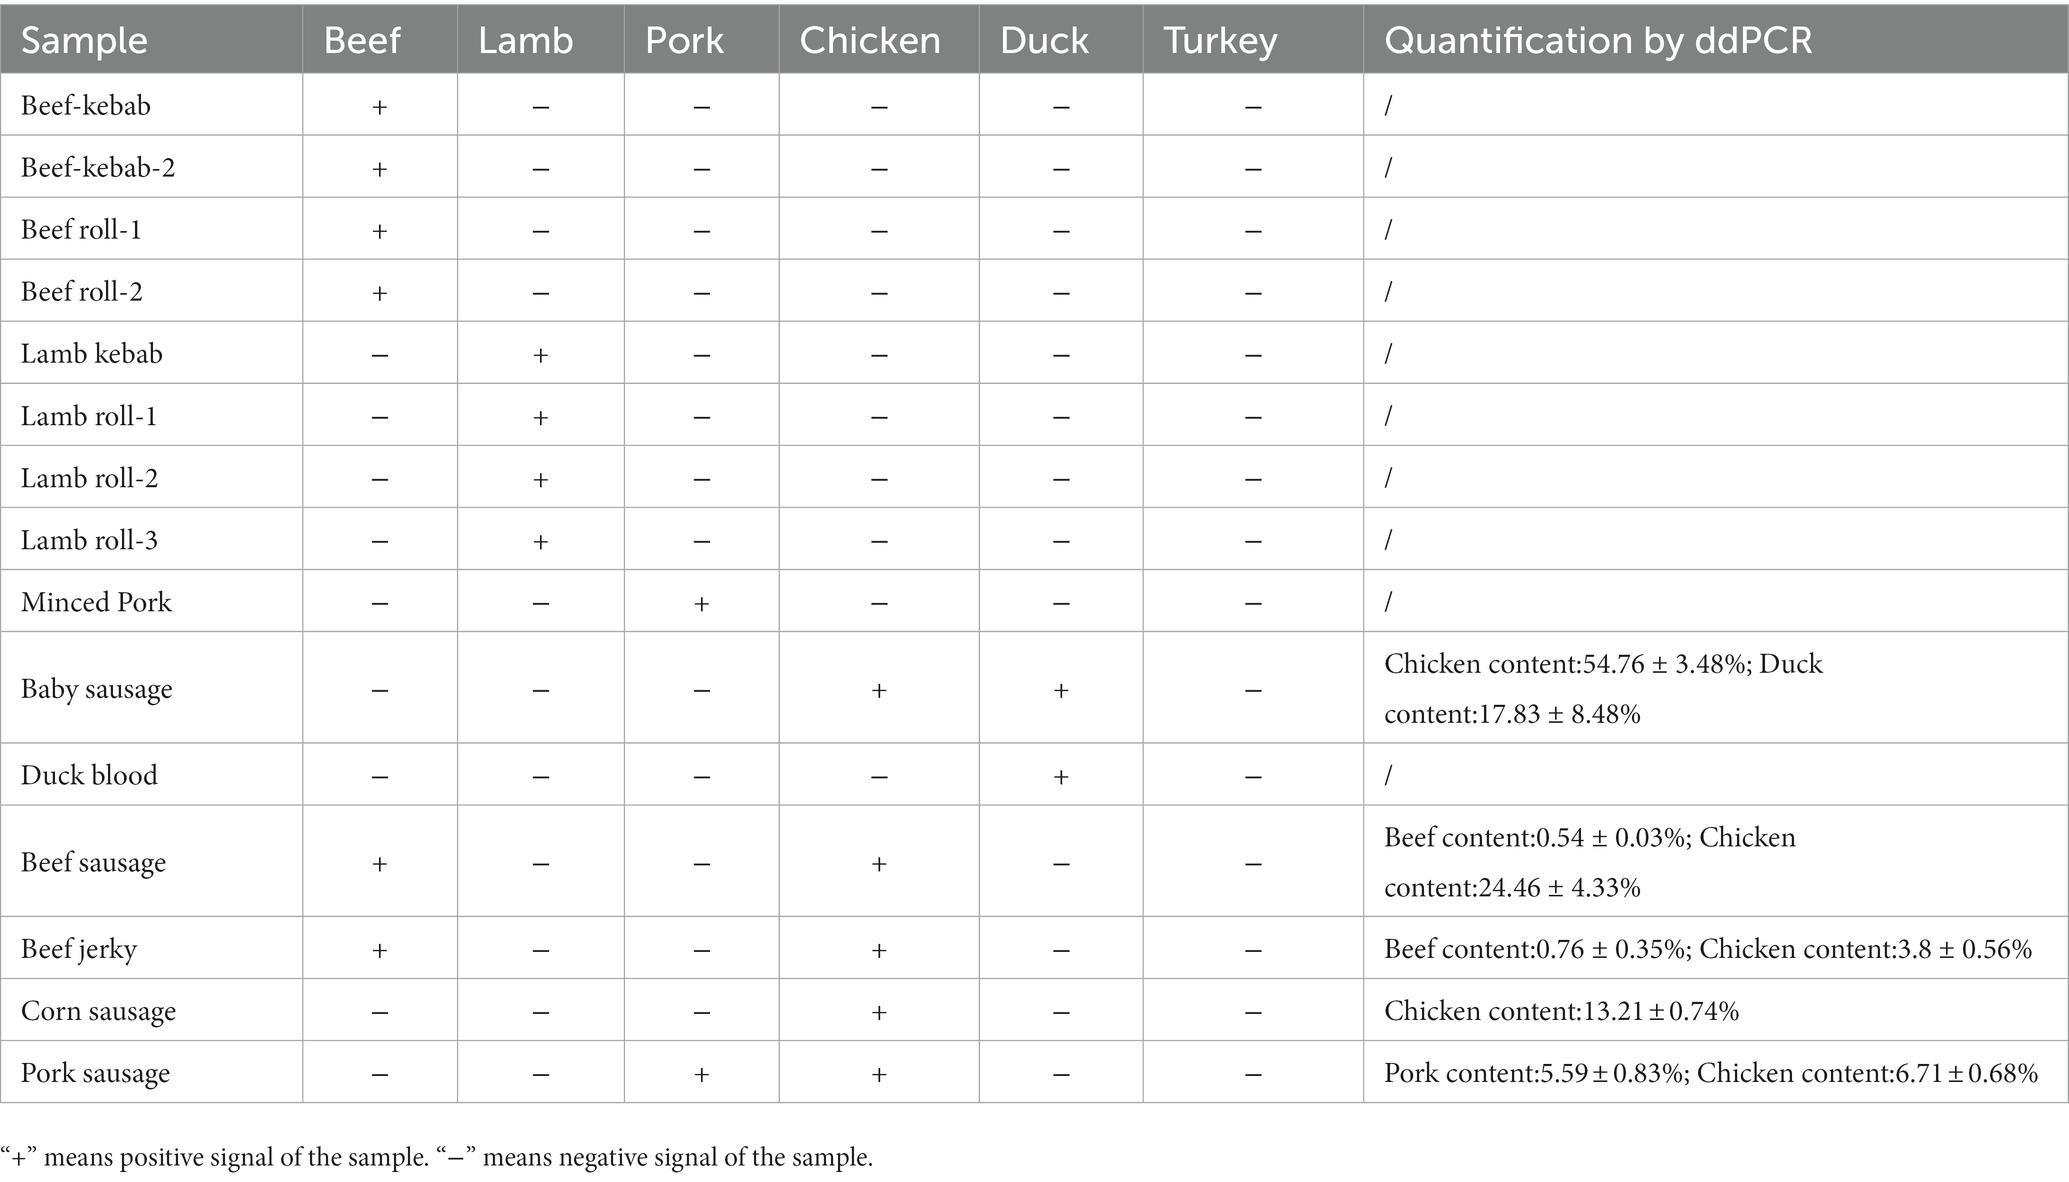
Table 7. Identification and quantification of commercial meat products.
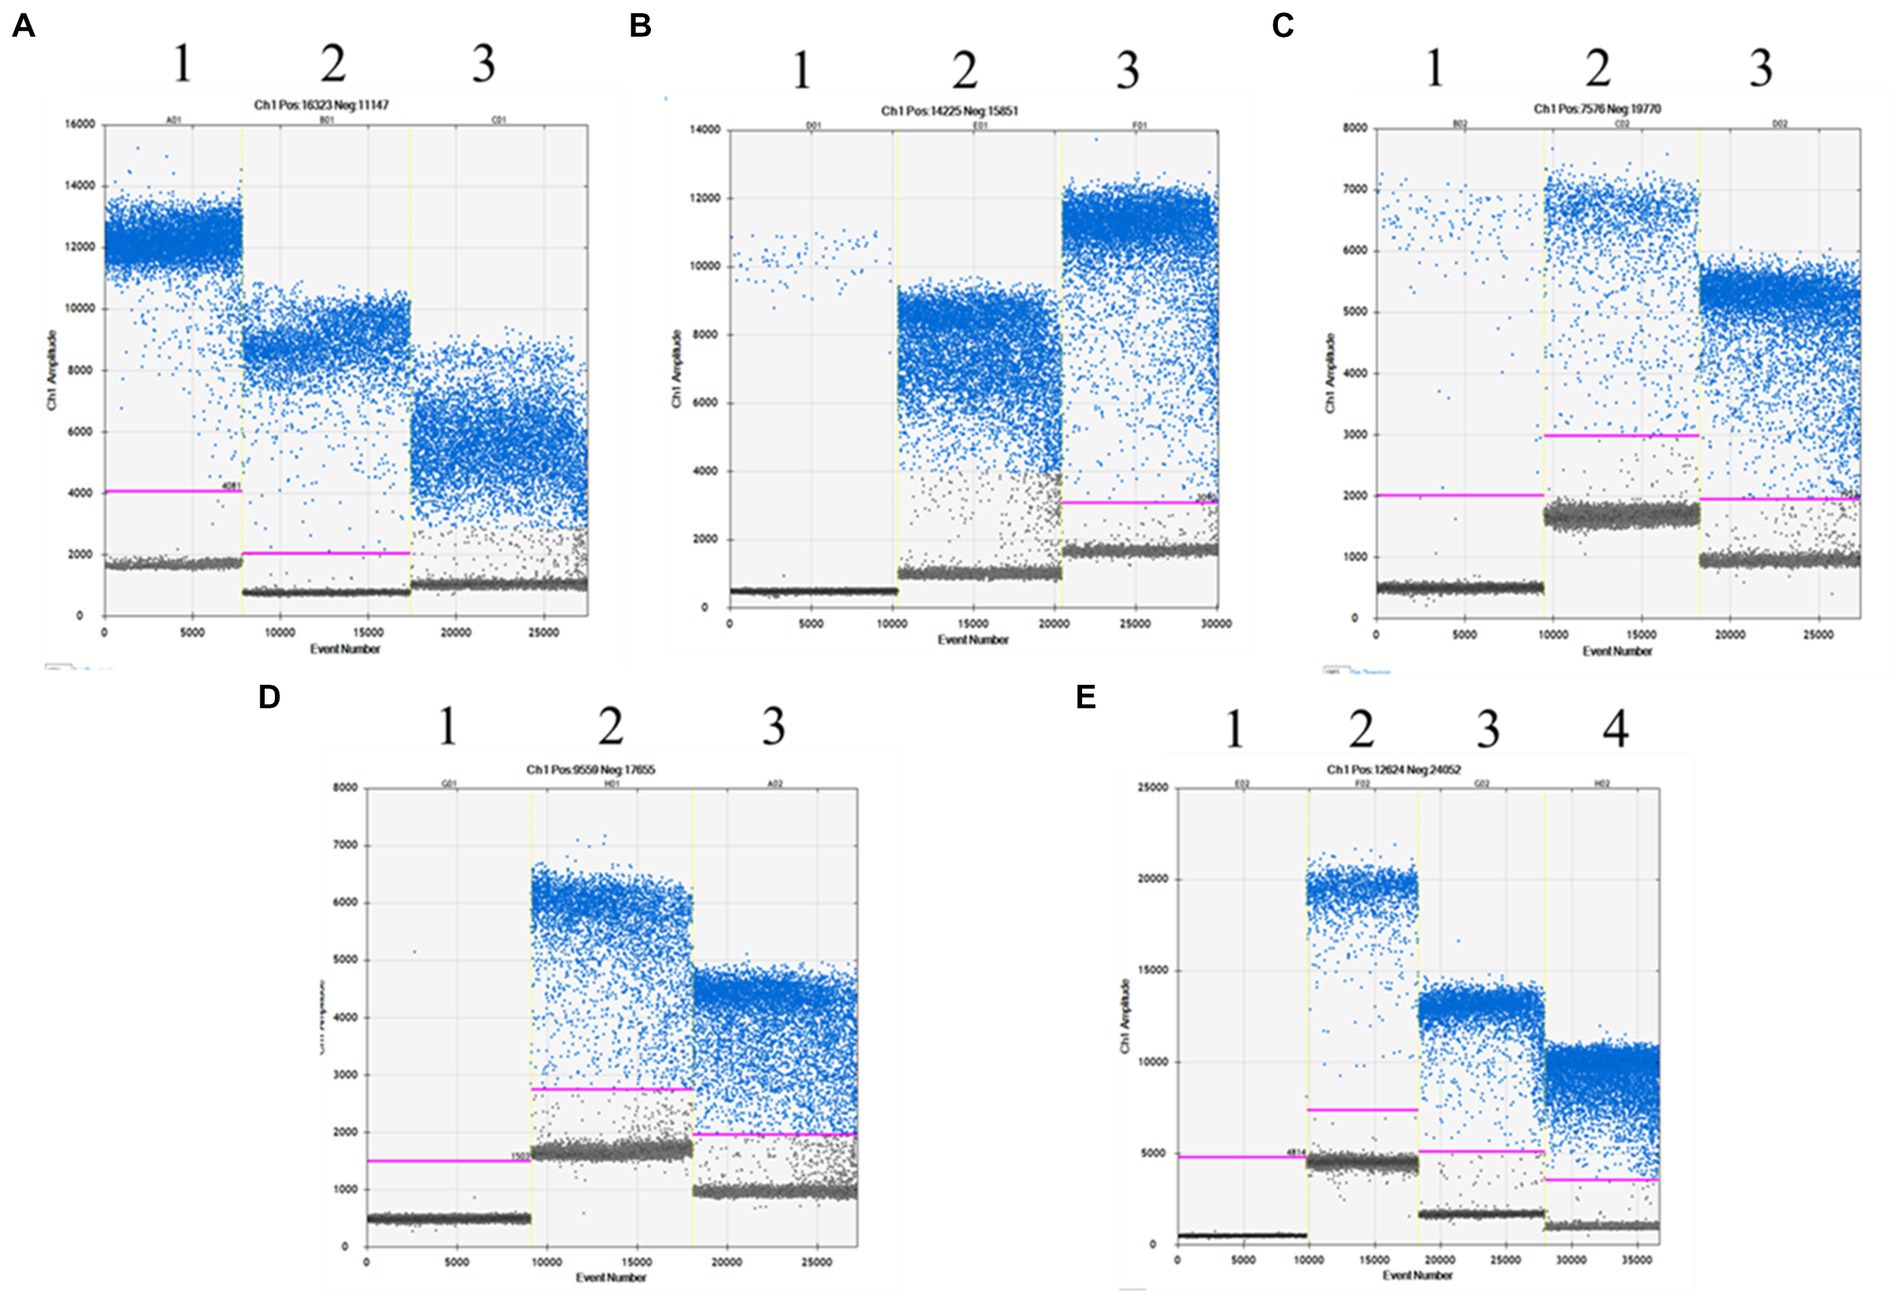
Figure 5. The analysis of highly processed products by ddPCR. (A) Baby sausage, lanes 1: chicken;2: duck; 3: turkey; (B) Beef sausage, lane 1: beef; 2: chicken; 3: turkey; (C) Beef jerky, lanes 1: beef; 2: chicken; 3: turkey; (D) Corn sausage, lanes 1: beef; 2: chicken; 3: turkey; (E) Pork sausage, lanes 1: beef; 2: pork; 3: chicken; 4: turkey.
4. Conclusion
In this study, a novel quantitative method combined with a ddPCR platform was developed for the detection of meat adulteration. An introduced constant converted the DNA copy number into a mass fraction, allowing for the quantification of meat adulteration content by the copy number ratio of each species. Using this strategy, we established a linear regression curve between the theoretical mass content (w/w) and the experimental mass content (w/w). Current published assays are limited to qualitative analysis; therefore, our method not only has high specificity for animal-derived components of commercial market but also has the detection range of gene copy number, which allows for the identification of meat adulteration caused by accidental contamination during meat processing. As the nucleic acid extraction, tissue properties, and processing level may affect the accuracy of the method, our study was conducted to exclude these differences; therefore, although the accuracy of the test may exhibit slight variations compared to the actual results, it has little effect on the determination of adulteration. Because the high amount of food additives and processing of commercial food products can interfere with quantifying the composition of the products, we also tested if our method could provide information about meat adulteration in these complex target meat samples by adding turkey as an internal reference to highly processed meat products. The system successfully identified meat adulteration in these commercial products with good accuracy. Up to now, this study has only carried out the conversion of copy number and mass fraction of adulterants in two kinds of meat. On this basis, in future studies, the detection of other metabolites will be used to realize the confounding determination of various meats. Overall, our results show that the ddPCR platform can identify and quantify meat adulteration at low content levels, making it suitable for routine analysis to be used by government regulators and quality control departments responsible for monitoring commercial meat products and food enterprises.
Data availability statement
The datasets presented in this study can be found in online repositories. The names of the repository/repositories and accession number(s) can be found below: https://www.ncbi.nlm.nih.gov/genbank/, EH170825; https://www.ncbi.nlm.nih.gov/genbank/, NC_019468.1; https://www.ncbi.nlm.nih.gov/genbank/, DQ452; https://www.ncbi.nlm.nih.gov/genbank/, AY685072; https://www.ncbi.nlm.nih.gov/genbank/, AY821656.1; https://www.ncbi.nlm.nih.gov/genbank/, AY685099.1.
Author contributions
YH and LL: conceptualization and writing–review and editing. WY: validation. LD: investigation. YM: investigation and methodology. CL, YX, and NL: resources and supervision. ZX and WX: data curation and formal analysis. FL: funding acquisition and project administration. All authors contributed to the article and approved the submitted version.
Funding
This work was supported by the Jilin Scientific and Technological Development Program, China (grant number: 20210508008RQ), Postdoc Foundation of Jilin Agricultural Technological Innovation Project, Jilin Academy of Agricultural Sciences, China (grant number: CXGC2020RCB002), High-level Talents Research Start-up Foundation of Jilin Agricultural Technological Innovation Project, Jilin Academy of Agricultural Sciences, China (grant number: CXGC2021RCG002), and The IAQST Foundation from Jilin Academy of Agricultural Sciences, Changchun, China (grant number: ZBS20Y02).
Conflict of interest
The authors declare that the research was conducted in the absence of any commercial or financial relationships that could be construed as a potential conflict of interest.
Publisher’s note
All claims expressed in this article are solely those of the authors and do not necessarily represent those of their affiliated organizations, or those of the publisher, the editors and the reviewers. Any product that may be evaluated in this article, or claim that may be made by its manufacturer, is not guaranteed or endorsed by the publisher.
Supplementary material
The Supplementary material for this article can be found online at:
https://www.frontiersin.org/articles/10.3389/fsufs.2023.1180301/full#supplementary-material
Footnotes
References
Al-Amri, I., Kadim, I. T., Alkindi, A., Hamaed, A., Al-Magbali, R., Khalaf, S., et al. (2021). Determination of residues of pesticides, anabolic steroids, antibiotics, and antibacterial compounds in meat products in Oman by liquid chromatography/mass spectrometry and enzyme-linked immunosorbent assay. Vet. World 14, 709–720. doi: 10.14202/vetworld.2021.709-720
Bogozalec Kosir, A., Demsar, T., Stebih, D., Zel, J., and Milavec, M. (2019). Digital PCR as an effective tool for GMO quantification in complex matrices. Food Chem. 294, 73–78. doi: 10.1016/j.foodchem.2019.05.029
Brooks, S., Elliott, C. T., Spence, M., Walsh, C., and Dean, M. (2017). Four years post-horsegate: an update of measures and actions put in place following the horsemeat incident of 2013. NPJ Sci. Food 1, 1:5. doi: 10.1038/s41538-017-0007-z
Cai, Y., He, Y., Lv, R., Chen, H., Wang, Q., and Pan, L. (2017). Detection and quantification of beef and pork materials in meat products by duplex droplet digital PCR. PLoS One 12:e0181949. doi: 10.1371/journal.pone.0181949
Cai, Y., Li, X., Lv, R., Yang, J., Li, J., He, Y., et al. (2014). Quantitative analysis of pork and chicken products by droplet digital PCR. Biomed. Res. Int. 2014:810209. doi: 10.1155/2014/810209
Chen, X., Ji, Y., Li, K., Wang, X., Peng, C., Xu, X., et al. (2021a). Development of a duck genomic reference material by digital PCR platforms for the detection of meat adulteration. Foods 10:1890. doi: 10.3390/foods10081890
Chen, Y., Wang, Y., Xiao, M., Wei, S., Yang, H., and Yin, R. (2021b). Polymerase chain reaction with lateral flow sensor assay for the identification of horse meat in raw and processed meat products. Food Chem. 345:128840. doi: 10.1016/j.foodchem.2020.128840
Codex Committee on Methods of Analysis and Sampling (2010). Guidelines on performance criteria and validation of methods for detection, identification and quantification of specific dna sequences and specific proteins in foods. Rome:Codex Alimentarius-FAQ.2010:CAC/GL 7402010.
Demeke, T., and Dobnik, D. (2018). Critical assessment of digital PCR for the detection and quantification of genetically modified organisms. Anal. Bioanal. Chem. 410, 4039–4050. doi: 10.1007/s00216-018-1010-1
Dobnik, D., Stebih, D., Blejec, A., Morisset, D., and Zel, J. (2016). Multiplex quantification of four DNA targets in one reaction with bio-rad droplet digital PCR system for GMO detection. Sci. Rep. 6:35451. doi: 10.1038/srep35451
Dong, H., Xian, Y., Li, H., Wu, Y., Bai, W., and Zeng, X. (2020). Analysis of heterocyclic aromatic amine profiles in Chinese traditional bacon and sausage based on ultrahigh-performance liquid chromatography-quadrupole-Orbitrap high-resolution mass spectrometry (UHPLC-Q-Orbitrap-HRMS). Food Chem. 310:125937. doi: 10.1016/j.foodchem.2019.125937
Felix-Urquidez, D., Perez-Urquiza, M., Valdez Torres, J. B., Leon-Felix, J., Garcia-Estrada, R., and Acatzi-Silva, A. (2016). Development, optimization, and evaluation of a duplex droplet digital PCR assay to quantify the T-nos/hmg copy number ratio in genetically modified maize. Anal. Chem. 88, 812–819. doi: 10.1021/acs.analchem.5b03238
Girish, P. S., Anjaneyulu, A. S., Viswas, K. N., Shivakumar, B. M., Anand, M., Patel, M., et al. (2005). Meat species identification by polymerase chain reaction-restriction fragment length polymorphism (PCR-RFLP) of mitochondrial 12S rRNA gene. Meat Sci. 70, 107–112. doi: 10.1016/j.meatsci.2004.12.004
Ha, J., Kim, S., Lee, J., Lee, S., Lee, H., Choi, Y., et al. (2017). Identification of pork adulteration in processed meat products using the developed mitochondrial DNA-based primers. Korean J. Food Sci. Anim. Resour. 37, 464–468. doi: 10.5851/kosfa.2017.37.3.464
He, C., Bai, L., Chen, Y., Jiang, W., Jia, J., Pan, A., et al. (2022). Detection and quantification of adulterated beef and mutton products by multiplex droplet digital PCR. Foods 11:3034. doi: 10.3390/genes1030413
Hossain, M. A. M., Uddin, S. M. K., Sultana, S., Wahab, Y. A., Sagadevan, S., Johan, M. R., et al. (2022). Authentication of halal and kosher meat and meat products: analytical approaches, current progresses and future prospects. Food Sci. Nut. 62, 285–310. doi: 10.1080/10408398.2020.1814691
Hou, B., Meng, X., Zhang, L., Guo, J., Li, S., and Jin, H. (2015). Development of a sensitive and specific multiplex PCR method for the simultaneous detection of chicken, duck and goose DNA in meat products. Meat Sci. 101, 90–94. doi: 10.1016/j.meatsci.2014.11.007
Hua, Y., Wang, C., Huang, J., and Wang, K. (2017). A simple and efficient method for CRISPR/Cas9-induced mutant screening. J. Genet. Genomics 44, 207–213. doi: 10.1016/j.jgg.2017.03.005
Kanagal-Shamanna, R. (2016). Digital PCR: principles and applications. Methods Mol. Biol. 1392, 43–50. doi: 10.1007/978-1-4939-3360-0_5
Kane, D. E., and Hellberg, R. S. (2016). Identification of species in ground meat products sold on the U.S. commercial market using DNA-based methods. Food Control 59, 158–163. doi: 10.1016/j.foodcont.2015.05.020
Köppel, R., Ruf, J., and Rentsch, J. (2010). Multiplex real-time PCR for the detection and quantification of DNA from beef, pork, horse and sheep. Eur. Food Res. Technol. 232, 151–155. doi: 10.1007/s00217-010-1371-y
Košir, A. B., Spilsberg, B., Holst-Jensen, A., Žel, J., and Dobnik, D. (2017). Development and inter-laboratory assessment of droplet digital PCR assays for multiplex quantification of 15 genetically modified soybean lines. Sci. Rep. 7, 7:8601. doi: 10.1038/s41598-017-09377-w
Kuypers, J., and Jerome, K. R. (2017). Applications of digital PCR for clinical microbiology. J. Clin. Microbiol. 55, 1621–1628. doi: 10.1128/JCM.00211-17
Lawyer, T. (2013). “Fox meat” scandal shows importance of supplier due diligence, says Eversheds. [online]. Available at: http://www.thelawyer.com/firms-and-the-bar/fox- meat-scandal-shows-importance-of-supplier-due-diligence-sayseversheds/3014490 [Accessed October 01, 2014].
Li, W., Liu, J., Li, Z., Gao, D., and Wang, J. (2018). Development of an universal quantitative detection method on Turkey using digital PCR. J. Nat. Sci. Heilongjiang Univ. 35, 309–316. doi: 10.13482/j.issn1001-7011.2018.04.106
Li, Y. C., Liu, S. Y., Meng, F. B., Liu, D. Y., Zhang, Y., Wang, W., et al. (2020). Comparative review and the recent progress in detection technologies of meat product adulteration. Compr. Rev. Food Sci. Food Saf. 19, 2256–2296. doi: 10.1111/1541-4337.12579
Li, T., Wang, J., Wang, Z., Qiao, L., Liu, R., Li, S., et al. (2021). Quantitative determination of mutton adulteration with single-copy nuclear genes by real-time PCR. Food Chem. 344:128622. doi: 10.1016/j.foodchem.2020.128622
Lun, F. M. F., Chiu, R. W. K., Chan, K. C. A., Leung, T. Y., Lau, T. K., and Lo, Y. M. D. (2008). Microfluidics digital PCR reveals a higher than expected fraction of fetal DNA in maternal plasma. Clin. Chem. 54, 1664–1672. doi: 10.1373/clinchem.2008.111385
Mandli, J., Fatimi, I. E., Seddaoui, N., and Amine, A. (2018). Enzyme immunoassay (ELISA/immunosensor) for a sensitive detection of pork adulteration in meat. Food Chem. 255, 380–389. doi: 10.1016/j.foodchem.2018.01.184
Mansouri, M., Fathi, F., Jalili, R., Shoeibie, S., Dastmalchi, S., Khataee, A., et al. (2020). SPR enhanced DNA biosensor for sensitive detection of donkey meat adulteration. Food Chem. 331:127163. doi: 10.1016/j.foodchem.2020.127163
Marchesi, U., and Broll, H. (2015). Definition of minimum performance requirements for analytical methods of GMO testing. European Union Reference Laboratory for GM Food and Feed and European Network of GMO Laboratories.
Martın, I., Garcıa, T., Fajardo, V., Rojas, M., Pegels, N., Hernández, P. E., et al. (2009). SYBR-Green realtime PCR approach for the detection and quantification of pig DNA in feedstuffs. Meat Sci. 82, 252–259. doi: 10.1016/j.meatsci.2009.01.023
Mock, U., Hauber, I., and Fehse, B. (2016). Digital PCR to assess gene-editing frequencies (GEF-dPCR) mediated by designer nucleases. Nat. Protoc. 11, 598–615. doi: 10.1038/nprot.2016.027
Nizar, N. N. A., Ali, M. E., Hossain, M. A. M., Sultana, S., and Ahamad, M. N. U. (2018). Double gene targeting PCR assay for the detection of Crocodylus porosus in commercial products. Food Addi. Contamin. Part A 35, 1038–1051. doi: 10.1080/19440049.2018.1440644
Noma, S., Kikuchi, Y., Satou, M., Tanaka, T., Takiya, T., Okusu, H., et al. (2022). Simple, precise, and less biased GMO quantification by multiplexed genetic element-specific digital PCR. J. AOAC Int. 105, 159–166. doi: 10.1093/jaoacint/qsab138
Pomari, E., Piubelli, C., Perandin, F., and Bisoffi, Z. (2019). Digital PCR: a new technology for diagnosis of parasitic infections. Clin. Microbiol. Infect. 25, 1510–1516. doi: 10.1016/j.cmi.2019.06.009
Prayson, B. E., McMahon, J. T., and Prayson, R. A. (2008). Applying morphologic techniques to evaluate hotdogs:what is in the hotdogs we eat? Ann. Diagn. Pathol. 12, 98–102. doi: 10.1016/j.anndiagpath.2007.04.012
Quinto, C. A., Tinoco, R., and Hellberg, R. S. (2016). DNA barcoding reveals mislabeling of game meat species on the U.S. commercial market. Food Control 59, 386–392. doi: 10.1016/j.foodcont.2015.05.043
Ren, J., Deng, T., Huang, W., Chen, Y., and Ge, Y. (2017). A digital PCR method for identifying and quantifying adulteration of meat species in raw and processed food. PLoS One 12:e0173567. doi: 10.1371/journal.pone.0173567
Ruiz-Valdepenas Montiel, V., Gutierrez, M. L., Torrente-Rodriguez, R. M., Povedano, E., Vargas, E., Reviejo, A. J., et al. (2017). Disposable Amperometric polymerase chain reaction-free biosensor for direct detection of adulteration with horsemeat in raw lysates targeting mitochondrial DNA. Anal. Chem. 89, 9474–9482. doi: 10.1021/acs.analchem.7b02412
Seddaoui, N., and Amine, A. (2021). Smartphone-based competitive immunoassay for quantitative on-site detection of meat adulteration. Talanta 230:122346. doi: 10.1016/j.talanta.2021.122346
Setiadi, I. C., Hatta, A. M., Koentjoro, S., Stendafity, S., Azizah, N. N., and Wijaya, W. Y. (2022). Adulteration detection in minced beef using low-cost color imaging system coupled with deep neural network. Front. Sustain. Food Syst. 6:1073969. doi: 10.3389/fsufs.2022.1073969
Shehata, R., Naaum, A. M., Chen, S., Murphy, T., Li, J., Shannon, K., et al. (2019). Re-visiting the occurrence of undeclared species in sausage products sold in Canada. Food Res. Int. 122, 593–598. doi: 10.1016/j.foodres.2019.01.030
Shi, Z., Yin, B., Li, Y., Zhou, G., Li, C., Xu, X., et al. (2019). N-glycan profile as a tool in qualitative and quantitative analysis of meat adulteration. J. Agric. Food Chem. 67, 10543–10551. doi: 10.1021/acs.jafc.9b03756
Siddiqui, M. A., Khir, M. H. M., Witjaksono, G., Ghumman, A. S. M., Junaid, M., Magsi, S. A., et al. (2021). Multivariate analysis coupled with M-SVM classification for lard adulteration detection in meat mixtures of beef, lamb, and chicken using FTIR spectroscopy. Foods 10:2405. doi: 10.3390/foods10102405
Skouridou, V., Tomaso, H., Rau, J., Bashammakh, A. S., El-Shahawi, M. S., Alyoubi, A. O., et al. (2019). Duplex PCR-ELONA for the detection of pork adulteration in meat products. Food Chem. 287, 354–362. doi: 10.1016/j.foodchem.2019.02.095
Soares, S., Amaral, J. S., Mafra, I., and Oliveira, M. B. (2010). Quantitative detection of poultry meat adulteration with pork by a duplex PCR assay. Meat Sci. 85, 531–536. doi: 10.1016/j.meatsci.2010.03.001
Song, Q., Chen, Y., Zhao, L., Ouyang, H., and Song, J. (2019). Monitoring of sausage products sold in Sichuan Province, China: a first comprehensive report on meat species’ authenticity determination. Sci. Rep. 9:19074. doi: 10.1038/s41598-019-55612-x
Standardization Administration of China (2019). Identification of animal ingredient from common livestock and poultry-real time PCR. In: GB/T 38164-2019.
Tähkäpää, S., Maijala, R., Korkeala, H., and Nevas, M. (2015). Patterns of food frauds and adulterations reported in the EU rapid alert system for food and feed and in Finland. Food Control 47, 175–184. doi: 10.1016/j.foodcont.2014.07.007
Takahashi, H., Kimura, B., Tanaka, Y., Mori, M., Yokoi, A., and Fujii, T. (2008). Use of single-strand conformation polymorphism of amplified 16S rDNA for grouping of bacteria isolated from foods. J. Food Prot. 71, 839–844. doi: 10.4315/0362-028X-71.4.839
Thienes, C. P., Masiri, J., Benoit, L. A., Barrios-Lopez, B., Samuel, S. A., Krebs, R. A., et al. (2019a). Quantitative detection of beef contamination in cooked meat products by ELISA. J. AOAC Int. 102, 898–902. doi: 10.5740/jaoacint.18-0193
Thienes, C. P., Masiri, J., Benoit, L. A., Barrios-Lopez, B., Samuel, S. A., Meshgi, M. A., et al. (2019b). Quantitative detection of chicken and Turkey contamination in cooked meat products by ELISA. J. AOAC Int. 102, 557–563. doi: 10.5740/jaoacint.18-0136
Xu, Y., Li, H., Liang, J., Ma, J., Yang, J., Zhao, X., et al. (2021). High-throughput quantification of eighteen heterocyclic aromatic amines in roasted and pan-fried meat on the basis of high performance liquid chromatography-quadrupole-orbitrap high resolution mass spectrometry. Food Chem. 361:130147. doi: 10.1016/j.foodchem.2021.130147
Xu, R., Wei, S., Zhou, G., Ren, J., Liu, Z., Tang, S., et al. (2018). Multiplex TaqMan locked nucleic acid real-time PCR for the differential identification of various meat and meat products. Meat Sci. 137, 41–46. doi: 10.1016/j.meatsci.2017.11.003
Yu, N., Ren, J., Huang, W., Xing, R., Deng, T., and Chen, Y. (2021). An effective analytical droplet digital PCR approach for identification and quantification of fur-bearing animal meat in raw and processed food. Food Chem. 355:129525. doi: 10.1016/j.foodchem.2021.129525
Zaukuu, J.-L. Z., Gillay, Z., and Kovacs, Z. (2021). Standardized extraction techniques for meat analysis with the electronic tongue: a case study of poultry and red meat adulteration. Sensors 21:481. doi: 10.3390/s21020481
Keywords: food safety, quality control, droplet digital PCR, meat adulteration, beef, lamb
Citation: He Y, Yan W, Dong L, Ma Y, Li C, Xie Y, Liu N, Xing Z, Xia W, Long L and Li F (2023) An effective droplet digital PCR method for identifying and quantifying meat adulteration in raw and processed food of beef (Bos taurus) and lamb (Ovis aries). Front. Sustain. Food Syst. 7:1180301. doi: 10.3389/fsufs.2023.1180301
Edited by:
Mohd Nasir Mohd Desa, Putra Malaysia University, MalaysiaReviewed by:
Amaladoss Anburaj, Temasek Polytechnic, SingaporeAmalia Mohd Hashim, Putra Malaysia University, Malaysia
Copyright © 2023 He, Yan, Dong, Ma, Li, Xie, Liu, Xing, Xia, Long and Li. This is an open-access article distributed under the terms of the Creative Commons Attribution License (CC BY). The use, distribution or reproduction in other forums is permitted, provided the original author(s) and the copyright owner(s) are credited and that the original publication in this journal is cited, in accordance with accepted academic practice. No use, distribution or reproduction is permitted which does not comply with these terms.
*Correspondence: Likun Long, bG9uZ2xpa3VuQDEyNi5jb20=; Feiwu Li, bGlmZWl3dTMzOTRAc2luYS5jb20=