 Maryam Ladaninezhad
 Hamed Mohammadi
 Ahmad Esmaillzadeh
 Hamed Pouraram
 Mostafa Mohaghegh3
- 1Community Nutrition Department, School of Nutritional Sciences and Dietetics, Tehran University of Medical Sciences, Tehran, Iran
- 2Department of Environmental Health Engineering, School of Public Health, Zanjan University of Medical Sciences, Zanjan, Iran
- 3United Nations Asia and Pacific Centre for Development of Disaster Information Management, Tehran, Iran
Background: Food security is susceptible to disasters and crises. Iran has frequently encountered natural disasters such as earthquakes, floods, and droughts, with a significant portion of its budget allocated to these events. While humanitarian aid and support are beneficial in critical situations, they are temporary and do not reduce vulnerability to future crises. Thus, resilience to food insecurity is a multidimensional concept that enhances the capacity to withstand future shocks and stressors. This study aimed to identify the primary dimensions of household resilience to food insecurity among teachers and characterize them across five zones in Tehran.
Method: We conducted a cross-sectional survey of 400 teacher households in Tehran using the Food Frequency Questionnaire (FFQ), Dietary Diversity Score (DDS), Household Food Insecurity Access Scale (HFIAS), and a resilience questionnaire. We analyzed data by using factor analysis in SPSS 16.0 according to the RIMA-I method proposed by FAO.
Results: The results revealed that only 45% of households across the five zones of Tehran were resilient at various levels. In Zone 1, 65% of households demonstrated resilience. The dietary diversity score was significantly higher in highly resilient households compared to vulnerable ones. Factor analysis indicated that assets were a crucial dimension of household resilience to food insecurity. A regression analysis was conducted to identify the impact of each latent variable on household resilience, revealing that dimensions such as income and food access, adaptive capacity, assets, stability, and access to essential services accounted for 56% of the resilience index.
Conclusion: Additional indicators are required for evaluating and enhancing resilience in food insecurity in urban areas. Consequently, policies and interventions are necessary to improve resilience to food insecurity in vulnerable households.
1. Introduction
Natural disasters have become commonplace events with acute or long-term impacts on human life (Reduction UNOfDR, 1901). These disasters affect various aspects of human capital, including nutrition and health (Baez et al., 2010). A decline in food security is inevitable due to the adverse effects of disasters on sources of livelihood (LIVELIHOODS TBRJFAO, 2015). The Asia-Pacific region has been experiencing natural disasters for decades. Since 1970, a person residing in this region has been five times more likely to be affected by natural disasters compared to other regions. This is noteworthy considering that 60% of the world’s population resides in this region, which covers 40% of the Earth’s landmass (Economic, 2017). Iran, a crisis-prone country in this region, has faced numerous crises such as earthquakes and floods, as well as economic instability in recent years due to international sanctions (Hejazi and Emamgholipour, 2022). Until 2016, the prevalence of food insecurity was 49% among Iranian households (Behzadifar et al., 2016). The prevalence of food insecurity among teachers is reported to be approximately 70%, depending on various economic and social factors (Parvin et al., 2020). Rising food prices adversely affect food security in vulnerable groups (Hejazi and Emamgholipour, 2022). Although humanitarian aid and support can be beneficial in critical situations, they may not always significantly reduce vulnerability to future crises (Safarpour, 2018; Hejazi and Emamgholipour, 2022). Apart from the type of disaster, vulnerability to food insecurity during crises depends on various factors, including physical ability, living conditions, age, and race (Clay et al., 2018). Resilience, a multidimensional concept, has been extensively used in various fields such as food security and is consistently proposed as a means to enhance performance (Hoddinott, 2014). According to Constas and Barrette’s perspective on food security, “Resilience represents the likelihood over time of a person, household or other unit being non-poor and food-secure in the face of various stresses and shocks. If and only if that likelihood is and remains high, then the unit is resilient” (Constas and Barrett, 2013). One of the most notable features of resilience is that it demonstrates the combined effect of several shocks and stressors such as climate change, economic instability, and social conditions that have increased vulnerability in a society (FAO, 2016; II R, 2018). The measurement of resilience in the context of food insecurity is crucial. Firstly, it can help distinguish between individuals with high and low resilience for resource allocation. Secondly, understanding how interventions work in critical situations can be beneficial. Measuring resilience to food insecurity is complex due to its different levels such as individuals, households, and communities. Beyond these level differences, various indicators can be associated with it such as health conditions, cultural and political situations, and ecological factors (Béné et al., 2016). Due to the complexity of the concept of resilience, there is no consensus on an appropriate measurement; however, some experiences have been gained in this regard (Lascano Galarza, 2020). The Food and Agriculture Organization has extensive experience in measuring resilience to food security (FAO, 2016). The most precise empirical attempt at measuring resilience was carried out by Alinovi et al. in 2016 who proposed an econometric approach (FAO, 2016). The livelihood strategy is another method used by households to cope with critical situations; this method was used in Kenya (Alinovi et al., 2010a). Resilience has been measured as a final or short-term outcome in studies. In some studies, resilience has been considered an indicator of food security which can sometimes be difficult to distinguish. Furthermore, in some cases, the dynamic feature of resilience and the role of stress have been overlooked (Ansah et al., 2019).
Evidence from 35 countries indicates that access to assets was the first or second pillar in predicting resilience to food insecurity. However, these results were observed in countries with socioeconomic and crisis profiles that are significantly different from Iran (d’Errico et al., 2021).
According to the climate and hunger vulnerability map, Iran exhibits medium vulnerability with low adaptive capacity, very high sensitivity, and medium exposure to shocks. This underscores the importance of addressing food insecurity and resilience in Iran (Krishnamurthy et al., 2014). While several studies have evaluated household food insecurity in Iran, research on the resilience approach and adaptive capacity to enhance food security during crises is limited. Teachers play a pivotal role in improving human resources, which is crucial during crises. They can serve as an accurate representation of society due to their diverse economic and social conditions (Izadkhah et al., 2012; Hosseinighousheh et al., 2021).
To address this gap, this paper explores a method to answer the question: “What are the main dimensions of household resilience to food insecurity among teachers living in Tehran?” The findings of this research can provide valuable insights for policymakers aiming to improve household resilience to food insecurity in countries similar to Iran in Asia.
2. Methods
2.1. Study population and sampling
Tehran, the capital of Iran, spans an area of 1,274 km2 and is home to over 10 million people. The city is divided into 22 zones and 124 districts. We conducted a cross-sectional survey from October to December 2018. In this study, the target population comprised 400 households selected from five zones, including the north, south, west, east, and center of Tehran using cluster random sampling among teachers. The inclusion criteria for this study were teachers who were living and working part-time or full-time in the same selected zones and were selected from schools at different levels. Teachers who resided in a different zone were excluded. In each zone, 80 households participated in the study (Figure 1). Before the interview, we gave participants a consent form that included information about the study’s purpose and their freedom to withdraw from the study at any time. Participants signed and approved the form before the interview. This study was approved by the Ethics Committee of (BLINDED FOR REVIEW) of Medical Sciences, and all methods were performed in accordance with relevant guidelines and regulations.

Figure 1. Map of study site.
2.2. Questionnaire
In this study, we conducted face-to-face interviews with teachers to answer the questionnaires. The interviewers, who were trained nutritionists, filled the questionnaires. A supervisor checked the completed questionnaires and returned any that were incomplete.
We utilized the Food Frequency Questionnaire (FFQ), Dietary Diversity Score (DDS), and Household Food Insecurity Access Scale (HFIAS) to determine food intake, food diversity, and household food access.
We used the validated FFQ, which includes 148 food items, to determine the usual dietary intake. The wives of the households were interviewed to ascertain the frequency of consumption of each food item in the past year. We computed and analyzed the data in grams per day to calculate household food intake (Esfahani et al., 2010).
We calculated the Food Diversity Score by using the methods proposed by Kant and Schatzkin (1995). Foods were categorized into five food groups according to the food pyramid: bread and cereals, vegetables, fruits, dairy, and meat. These groups were further divided into 23 subgroups.
To score, a person must consume one portion from the subgroup foods. Each group has a maximum of two points, with the total score ranging from zero to 10 (Azadbakht and Esmaillzadeh, 2009). We used a set of nine questions in the HFIAS to measure Food insecurity. These questions included concerns about food, inability to eat preferred food, eating a limited variety of foods, eating unwanted foods, eating smaller meals, eating fewer meals in a day, lack of food in the house, sleeping at night hungry, and being hungry for a whole day and night due to lack of food (Mohammadi et al., 2012).
We designed the resilience questionnaire according to indicators determined in the FAO model used in other studies (Alinovi et al., 2010b). A panel of six experts familiar with the concept of resilience or food insecurity confirmed the content of the questions. Indicators such as average per person daily income, average per person daily expenditure, physical access to health service, perception of security, water and electricity and phone networks, physical access to the school and university, amount of cash assistance, household assets such as the house and car, number of rooms, furniture including 12 items, having insurance, diversity of income sources, education level, employment ratio, available coping strategies, food consumption ratio, number of household members that have lost their jobs, income change, expenditure change, capacity to maintain stability in the future, features of the house include age and structure, debt, and health status of family members were selected by the panel members.
2.3. Empirical model
To measure the resilience of food security, the Food and Agriculture Organization (FAO) has provided two methods: RIMA-I and RIMA-II. While RIMA-II is a newer method, it is more complex and requires a significant amount of data and resources. However, since this study was conducted for the first time with this purpose in Iran and the number of studies that had used RIMA-I at the time we conducted this study was more for comparison of results, we used RIMA-I. Therefore, in this study, given the sample size and the data collected, RIMA-I was deemed a more suitable method for identifying vulnerable households.
According to the FAO framework, in RIMA-I, resilience (RI) is a latent variable that can be identified by six pillars: income and food access (IFA), assets (AS), access to basic services (ABS), social safety net (SSN), stability (S), and adaptive capacity (AC; Unks et al., 2019). This model can be mathematically expressed as follows:
Each component of the resilience framework has a specific set of indicators. These are combined and weighted to produce an overall index called the “resilience score” (Alinovi et al., 2010b).
In this study, qualitative techniques were used for analysis. Factor analysis, principal component analysis, and optimal scaling were administered to estimate latent variables in each pillar. Variance was then calculated to estimate the weighted score of each latent variable. Initially, it is necessary to recognize the relevant variables in each domain. For this purpose, principal components or factor analysis are recommended. Principal component analysis was first used for variables that were measured on a continuous scale. We used the optimal scaling method for non-continuous variables, and factor loadings to select relevant variables. Secondly, to estimate the overall RI, these variables were used as final latent dimensions (Alinovi et al., 2010a).
2.4. Income and food access
The selected indicators in this pillar include:
• The household’s average monthly income, as estimated by the head of the household.
• The average monthly household expenditure on food, expressed as a percentage of salary.
• The household food security score, based on the HFIAS questionnaire.
• The average daily calorie intake of the head of the household, based on the FFQ results.
• The money spent on rent each month as a part of the household’s income.
• The food diversity score, calculated based on food groups in the Food Frequency Questionnaire.
The most critical factors in estimating the income and food access dimension were the household’s average monthly income and the average monthly household expenditure spent on food (Table 1). These two components explained 68.40% of the total variance according to the cumulative variance. In this study, the number of households that owned houses exceeded the number of tenants in all five areas of Tehran, with only 20% of the study population being tenants. Furthermore, 88.25% of the households were food secure, while only 11.75% experienced various levels of food insecurity. The average daily calorie intake of households varied between 2,215 Kcal in Zone 10 and 2,465 Kcal in Zone 5 of Tehran.
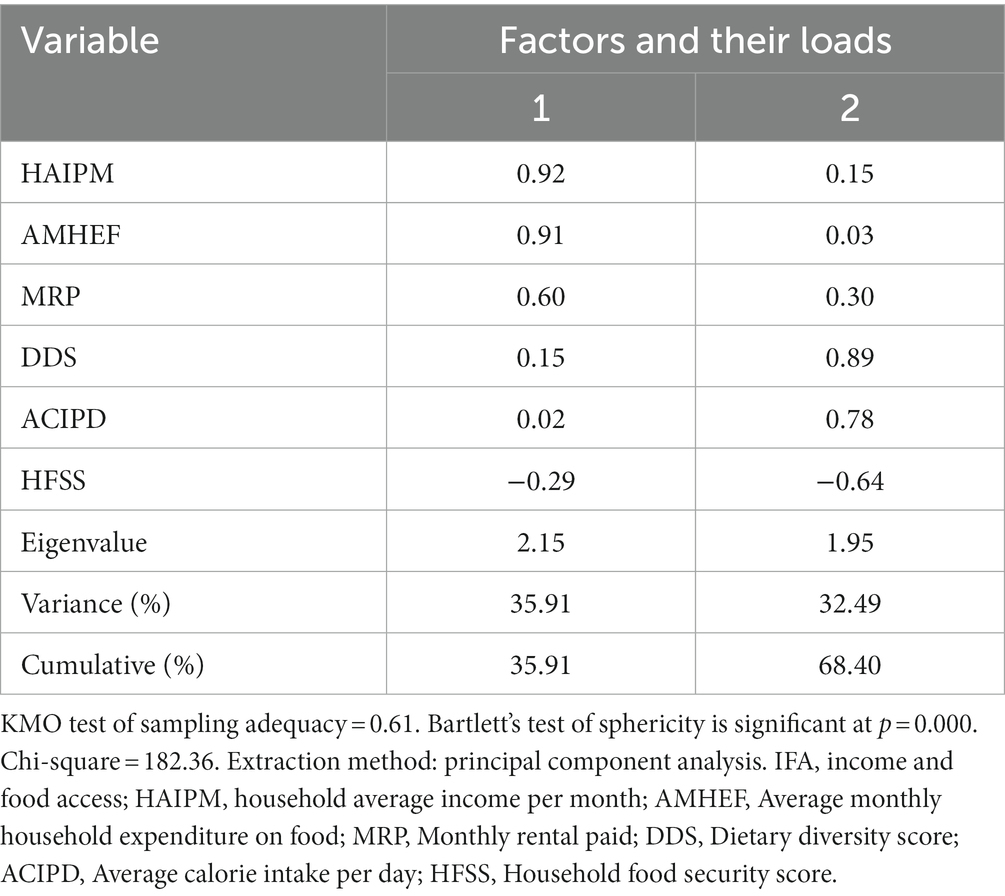
Table 1. Communalities, factor loadings, and correlations of variables with IFA.
Overall, based on the statistical results, the factor score was applied to estimate the Income and Food Access (IFA) as follows:
2.5. Assets
Assets play a crucial role as a dimension in identifying resilience to food security. When a household possesses more assets, it can exhibit greater resilience in the face of crises or shocks. The selected indicators to determine this dimension include:
• The ratio of the number of rooms in the house to the number of members.
• The number of essential items in the house (11 items).
• Total household assets, which include shops, homes, cars, lands, gold, and money.
According to the results of the factor analysis and Bartlett’s scoring method, two indicators were selected to identify this dimension. The number of houses and the amount of gold and money that household members possessed were considered two latent variables (Table 2).

Table 2. Communalities, factor loadings, and correlations of variables with AS.
According to the cumulative variance, these two indicators explained 42% of the total variance.
The following formula was used to estimate the asset dimension:
2.6. Access to basic services
Access to essential services is another dimension of resilience to food security. The selected indicators for this dimension include:
• Quality of physical access to health services such as hospitals, clinics, health centers, and pharmacies.
• Physical access to essential amenities such as potable water, electricity, telephone, gas, sewage, bathrooms and toilets, and the Internet.
• Quality of physical access to schools and universities.
According to the results of the factor analysis and Bartlett’s scoring method, three indicators were selected to identify this dimension: physical access to the clinic, pharmacy, and health center. Based on the cumulative variance, these three indicators explained 59% of the total variance (Table 3).
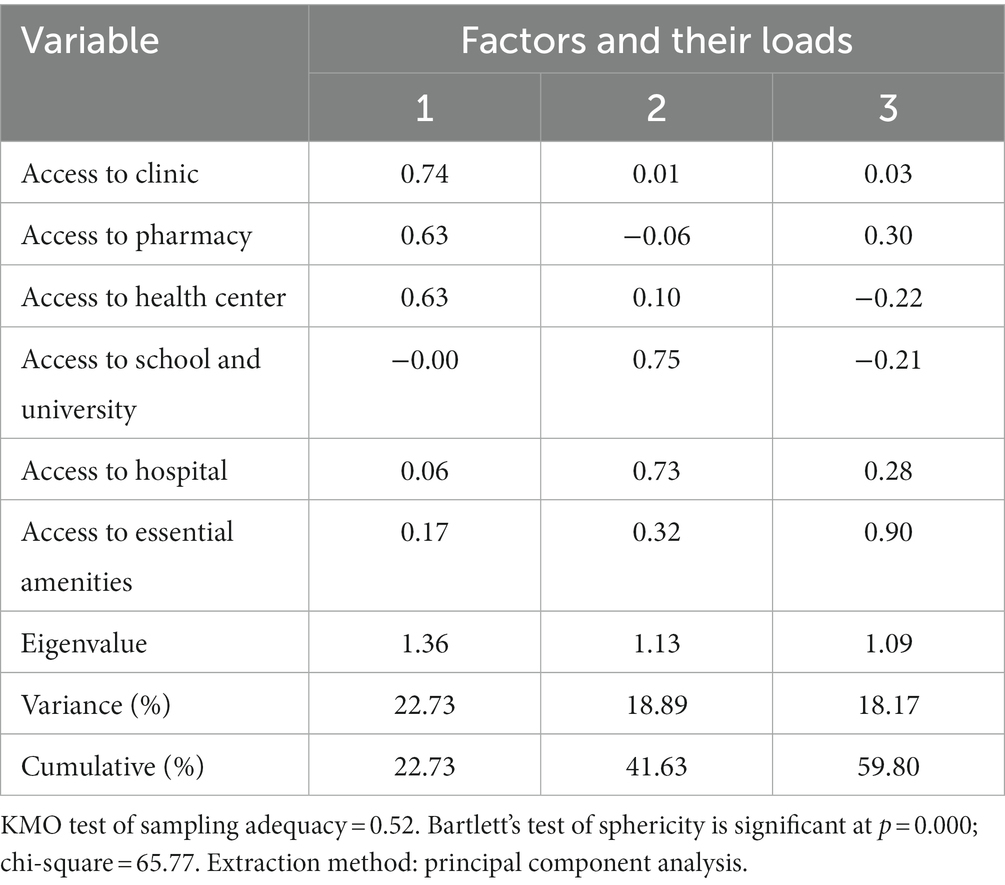
Table 3. Communalities, factor loadings, and correlations of variables with ABS.
The following formula was used to estimate access to basic services:
2.7. Adaptive capacity
During crises or events that threaten resilience to food security, leveraging available capacities to adapt to the situation and return to the previous state is crucial. The selected indicators in this dimension include:
• Diversity of income sources: This capacity aids the household in becoming more resilient when faced with crises and shocks that affect the family’s income source.
• Employment ratio: The ratio of the number of employed members to the total number of family members.
• Education status: The education status of a family member.
• Debt and loans: The debt and loans that family members had borrowed.
• Household food costs: The ratio of household food costs to total household costs in a month.
• House age and structure: The age of the house and its type of structure.
• Health insurance coverage: Health insurance coverage for household members.
• Gender of household head: The gender of the head of the household.
• Health status and coping strategies: The health status of family members and coping strategies, which include getting a second job, saving money, selling assets, reducing educational and health costs, reducing food costs, and not paying installments and loans.
According to the results of the factor analysis and Bartlett’s scoring method, four indicators were selected to identify this dimension. These include the education level of the household head and the second member of the household, the number of income sources, and the ratio of employed members to the total number of family members (Table 4). Based on the cumulative variance, these four indicators explained 52.64% of the total variance.
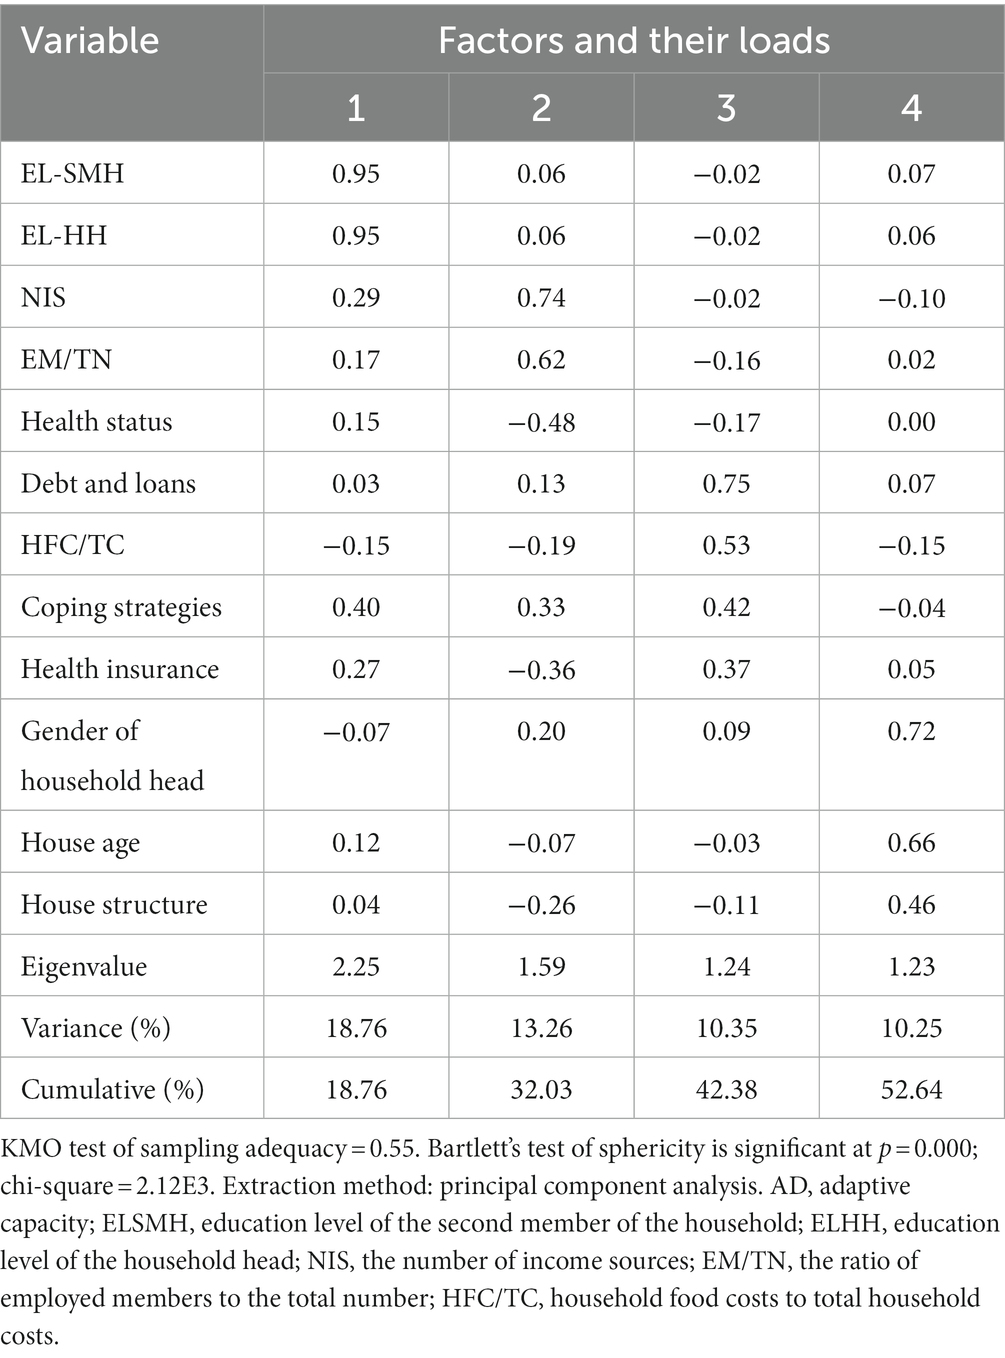
Table 4. Communalities, factor loadings, and correlations of variables with AD.
The following formula was used to estimate adaptive capacity:
2.8. Stability
Stability in food security is associated with food supply. Although it was considered a dimension of resilience in this study, it is related to the household’s economic stability, household assets, and job stability of the employed household members.
• Income Stability: This can be explained as changes in income and expenditure during a specific period.
• Asset Stability: This can be determined by using insurance such as fire insurance for the house or other properties, car insurance, etc.
• Job Stability: This can cover government and non-government jobs of employed members.
Using insurance and the ability to maintain family economic stability in the future were selected to identify stability according to the results of factor analysis and Bartlett’s scoring method. These two indicators explained 53.67% of the total variance (Table 5). The following formula was used to calculate stability:
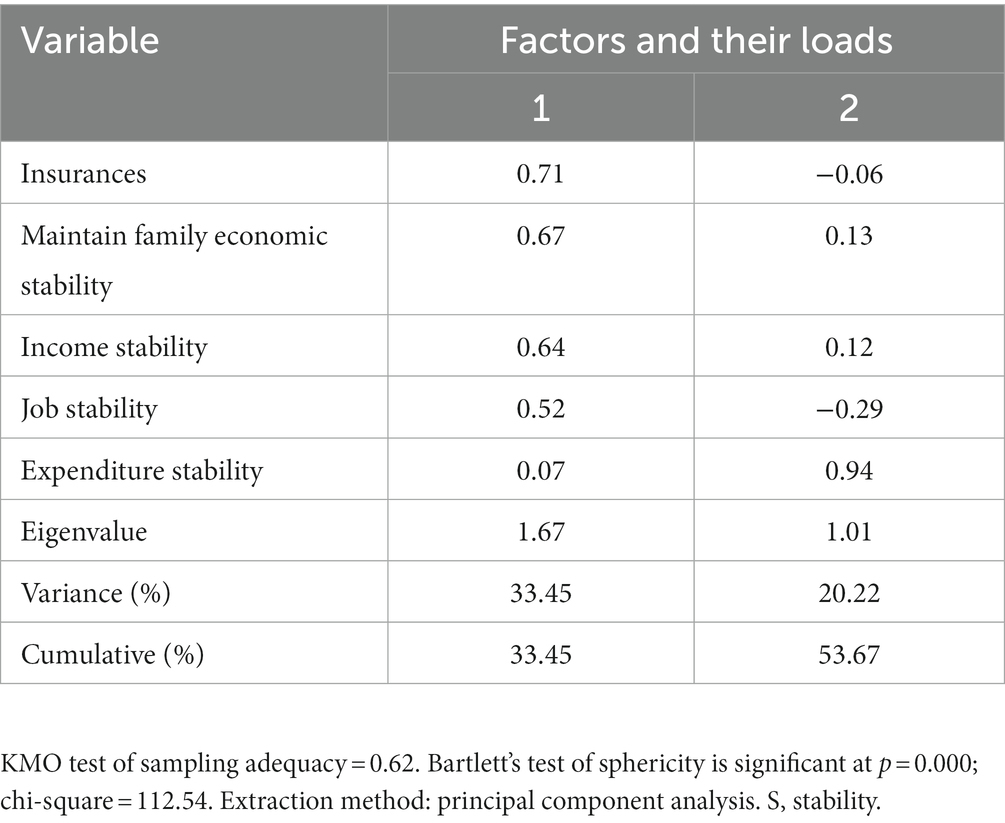
Table 5. Communalities, factor loadings, and correlations of variables with S.
2.9. Social safety net
The social safety net did not influence the results in this study because it was utilized by only two families.
2.10. Estimation of resilience
In the final stage of resilience estimation, the results of previous analyses can be used to highlight important dimensions of resilience using factor analysis and Bartlett’s scoring method (Table 6).
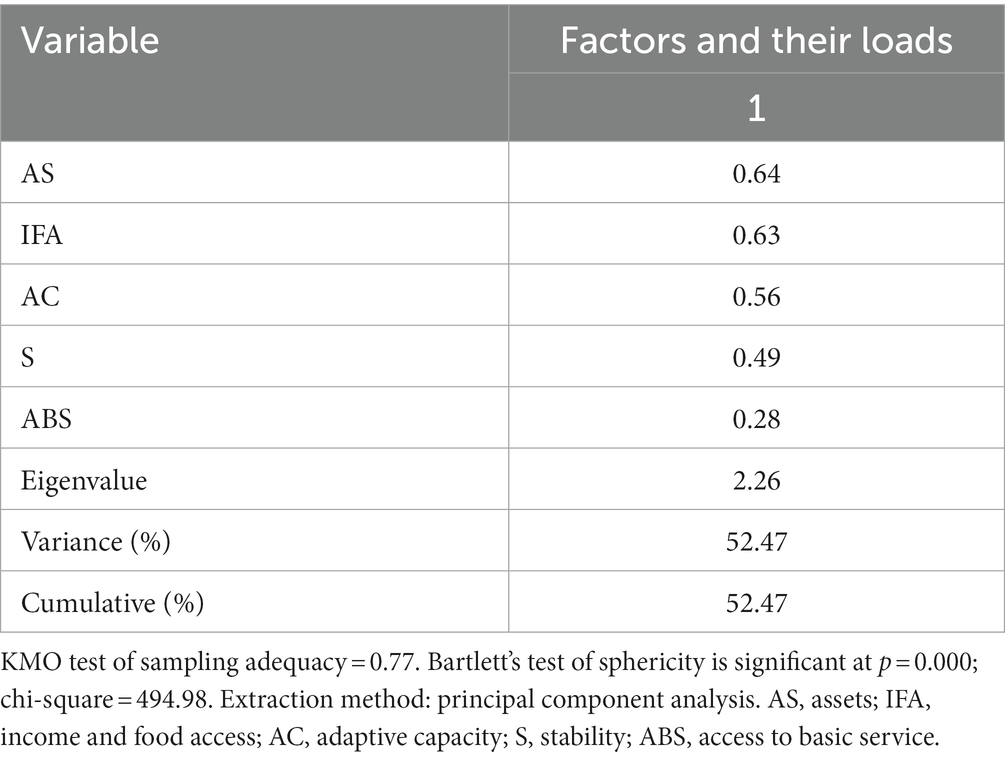
Table 6. Factor loadings, explained variance, of the latent dimension for the household RI.
The final model revealed that assets, as a dimension, accounted for 52.47% of the total variance and were a latent dimension for resilience estimation (Figure 2).
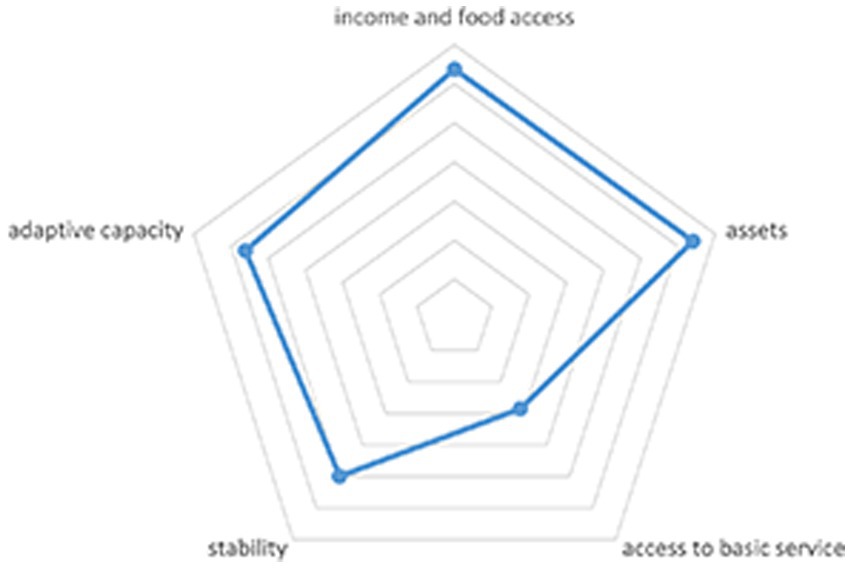
Figure 2. Radar graph for the components of resilience to food security among Iranian teachers.
The Kaiser-Meyer-Olkin (KMO) statistic for this model was 0.778, and Bartlett’s test of sphericity was significant (Chi-square = 494.98).
Finally, resilience was calculated according to the following formula:
The resilience score was categorized into four groups: vulnerable, moderately resilient, resilient, and highly resilient.
3. Results
The study population resided in various zones of Tehran, including the north, south, west, east, and center. Approximately half (51%) of the household heads were over 50 years old. The most common education level among household heads was a bachelor’s degree, accounting for 30%, while only 0.2% of the household heads were illiterate. The number of household members ranged from 2 to 4 in 77% of the households. Men were the head of the household in 94.5% of the households, and 88% of the households had one or two employed members. Furthermore, 42% had two sources of income. The socio-economic status of the study population is presented in Table 7.
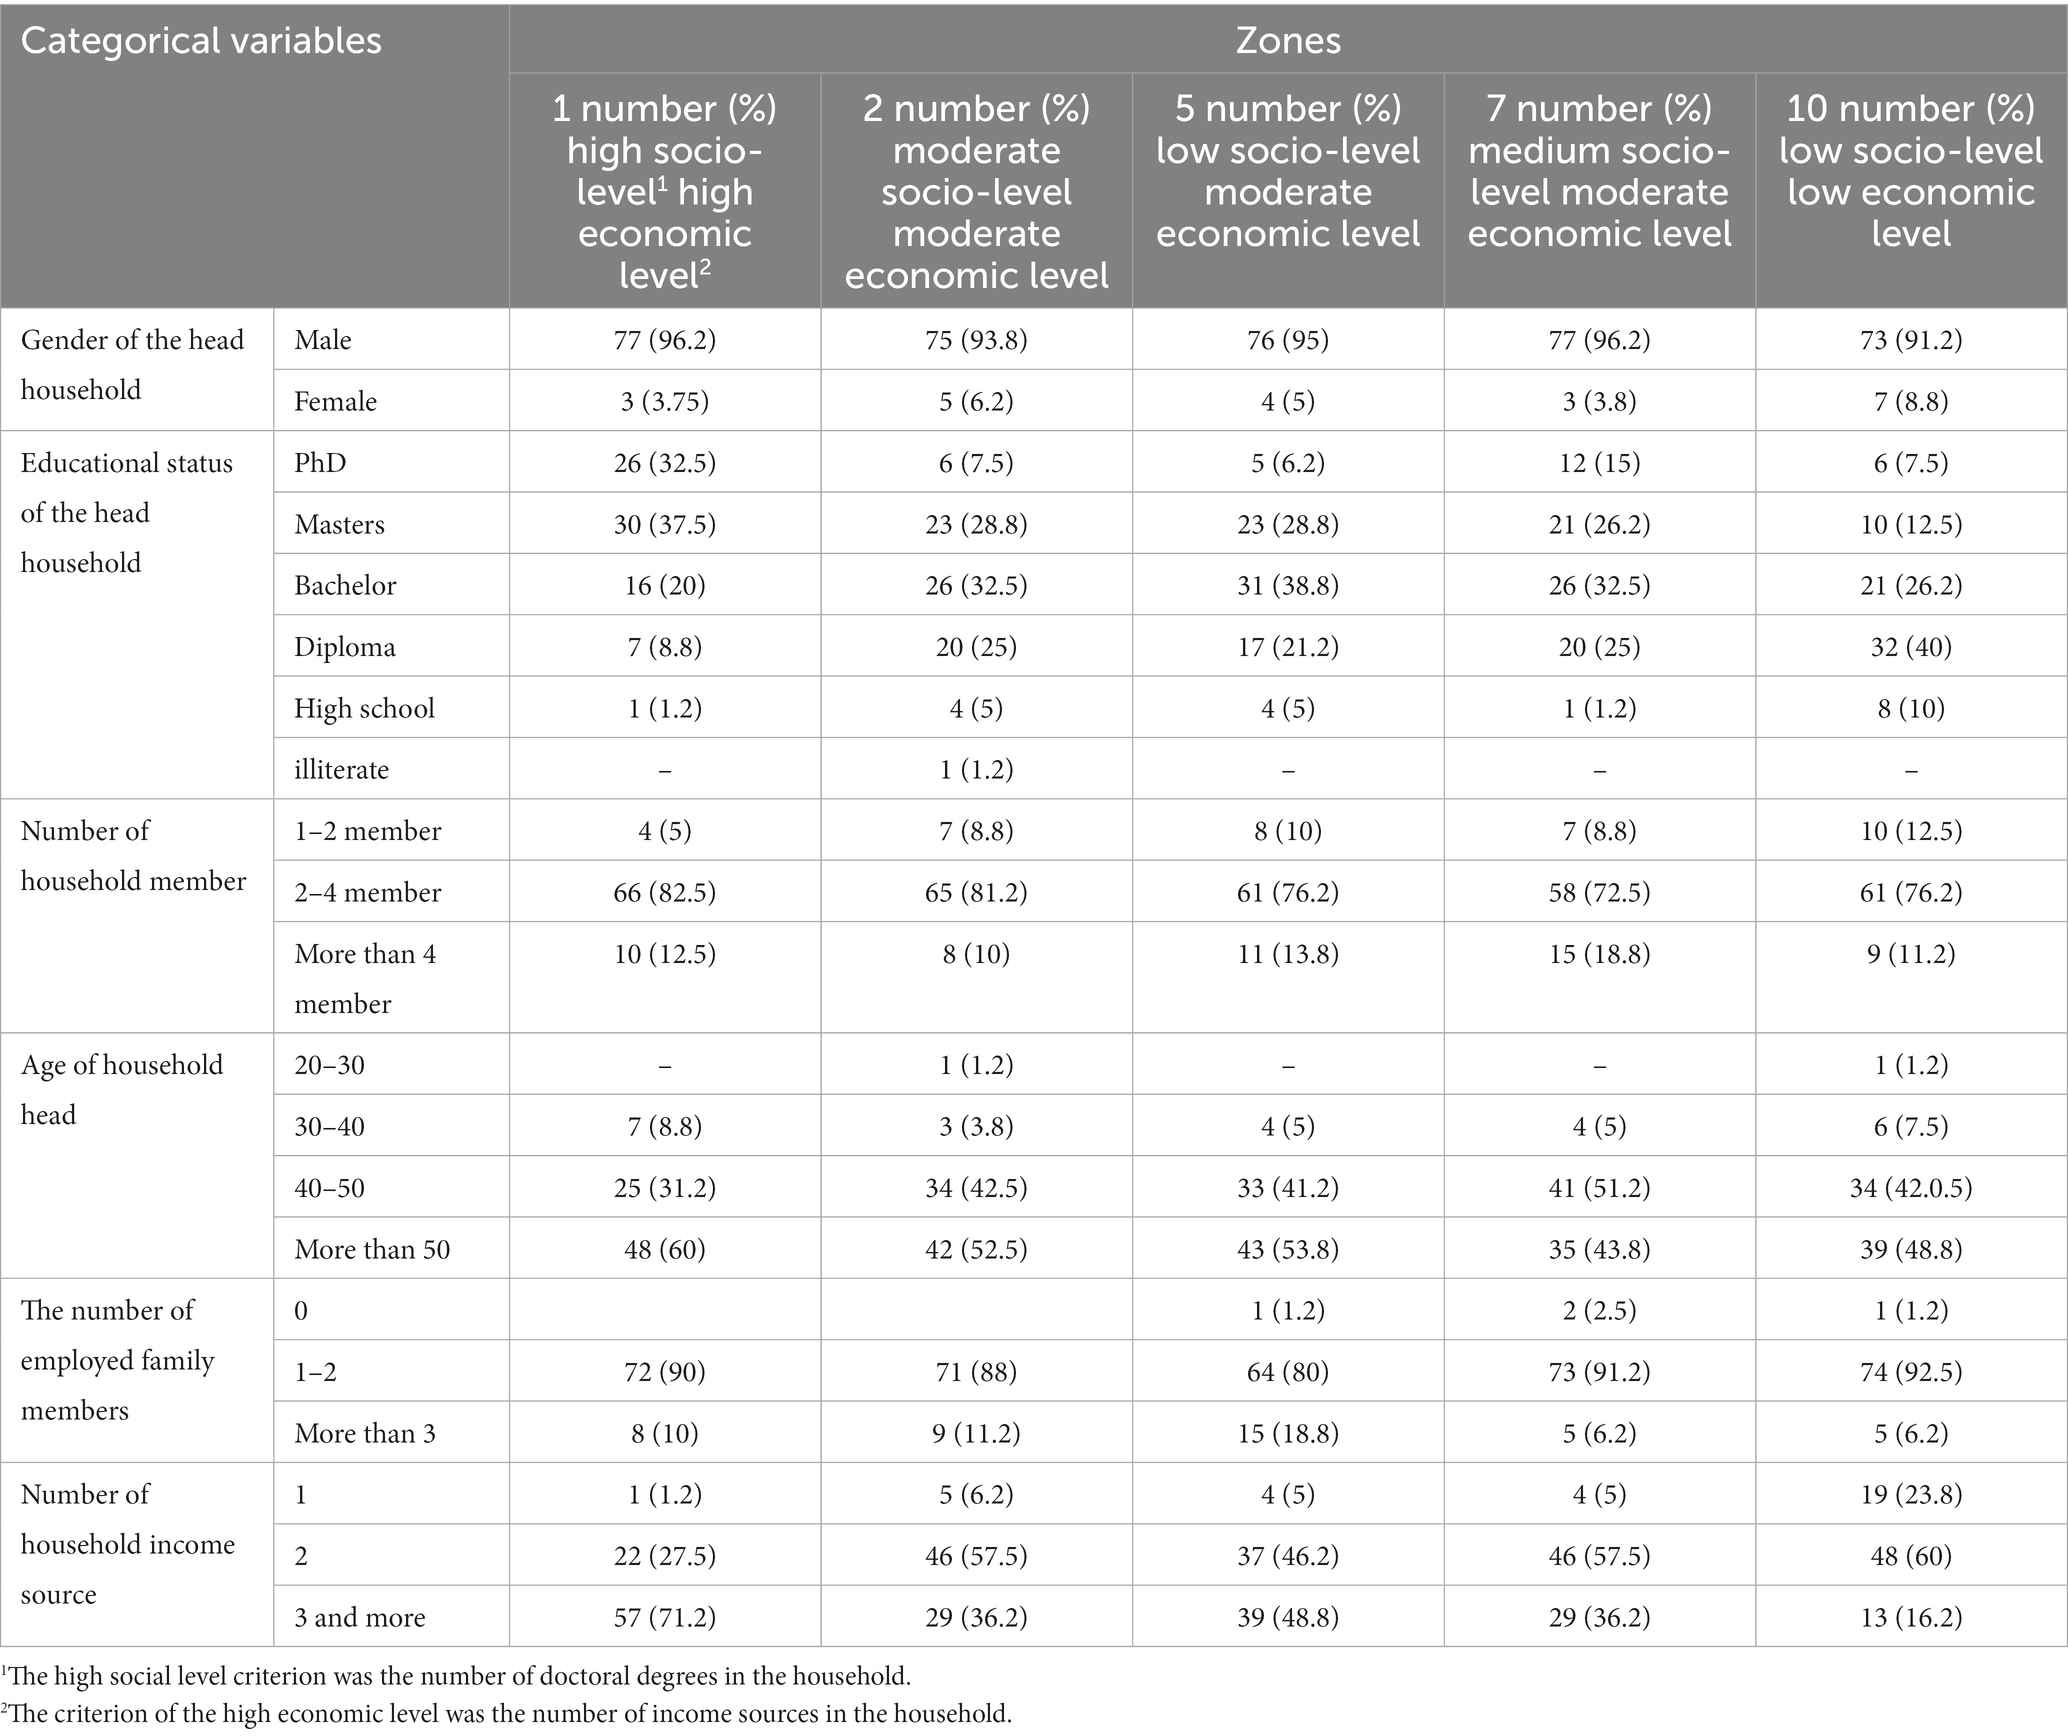
Table 7. The frequency of socio-economic status of the households by five zones of Tehran (n = 400).
In terms of food security, 88.25% of the study population were food security, while 11.75% had experienced some degree of food insecurity. The study results indicated that households in Zone 1 (a region of the municipality located in the north of Tehran) had the highest dietary diversity scores compared to others. In contrast, households in Zone 10 (the most populous area located in the center of Tehran) had the lowest dietary diversity scores.
The average caloric and protein intake was highest in Zone 5 (northwest of Tehran) and lowest in Zone 10. Detailed information on food security and food intake is presented in Table 8.
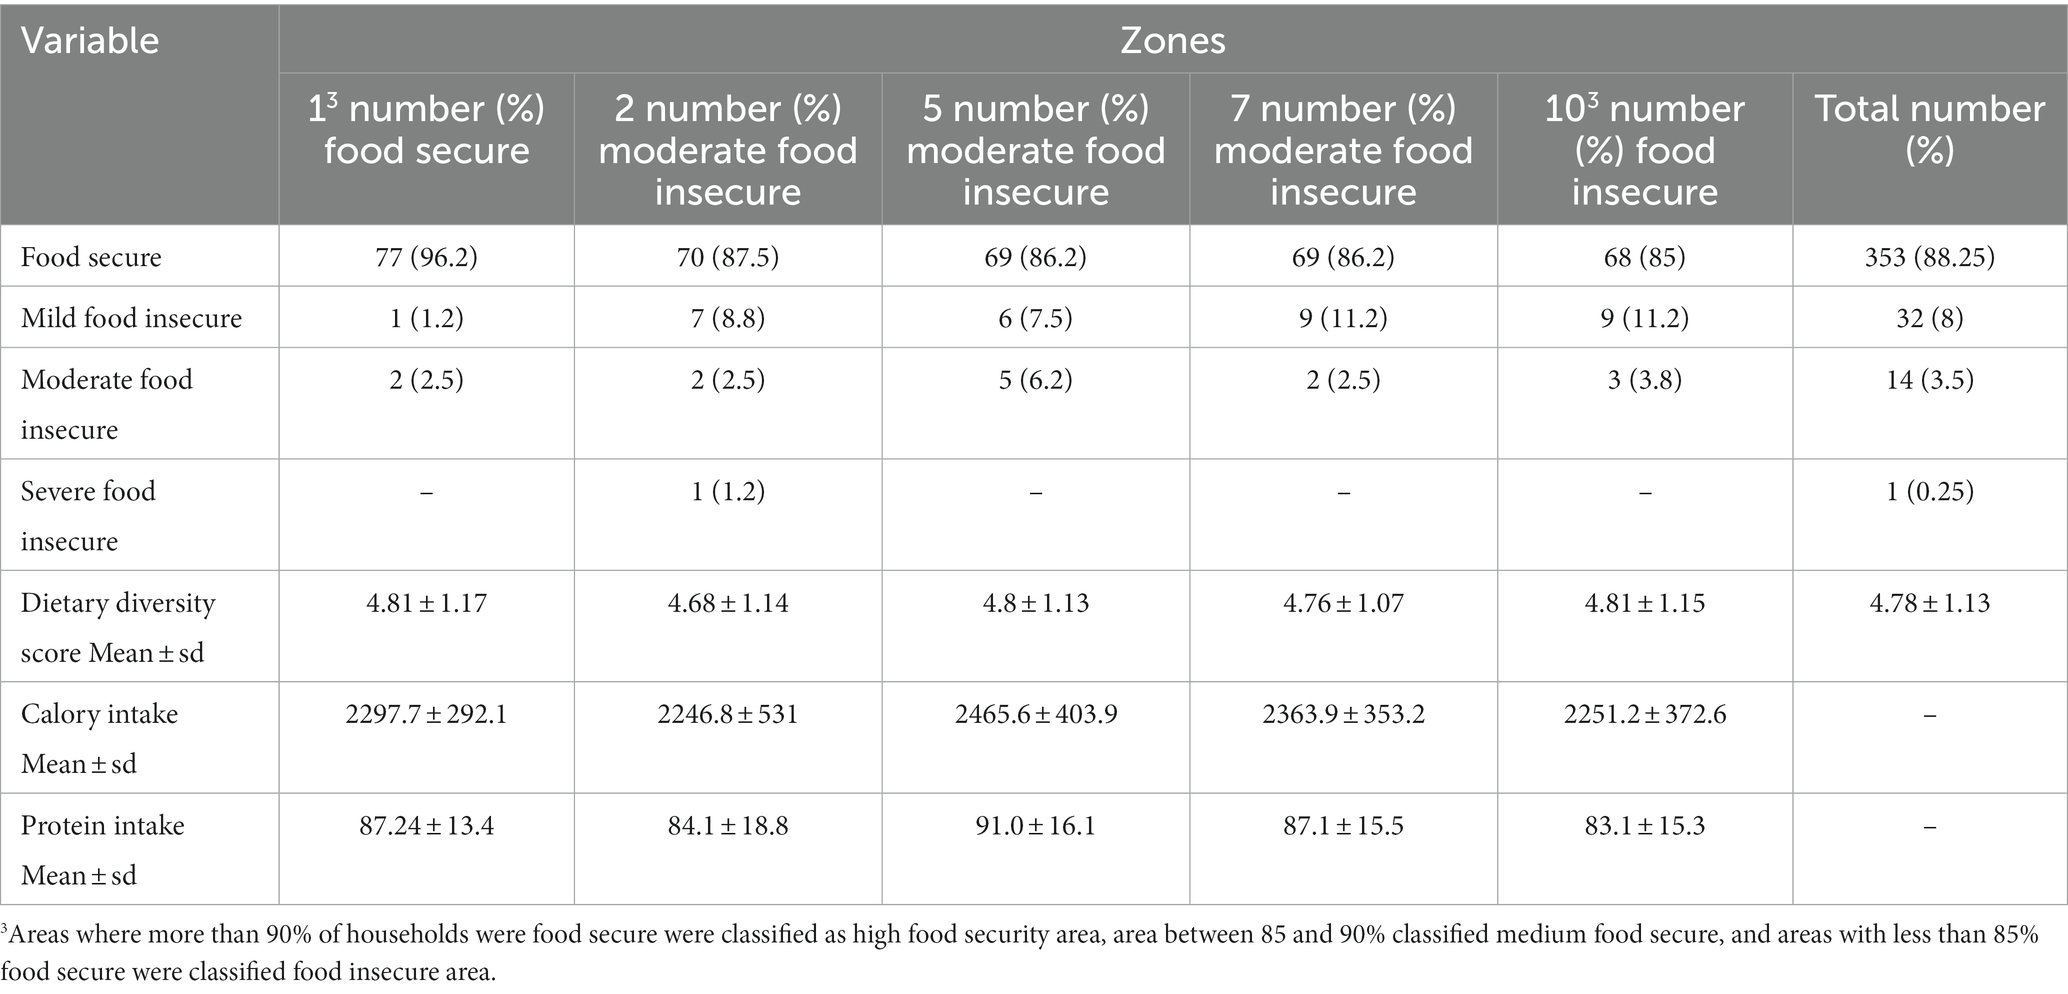
Table 8. Dietary intakes and food security status of households five zones of Tehran (n = 400).
Rising food prices and living costs, experienced by 99.5% of households, and loss of assets, experienced by 20% of households, were identified as the financial shocks with the highest frequency. Households in Zone 10 had the highest rates of household head mortality and disability, job loss, and non-payment compared to other areas. While 99.5% of households had experienced increases in food prices and living costs, using savings was the most common coping strategy. The data related to crises and coping strategies in the study population are presented in Table 9.

Table 9. The frequency of crisis and coping strategies in households by five zones of Tehran.
The results in Table 10 showed that 52% of the households were vulnerable, 18.75% were resilient, 15.5% were moderately resilient, and only 11% were highly resilient.
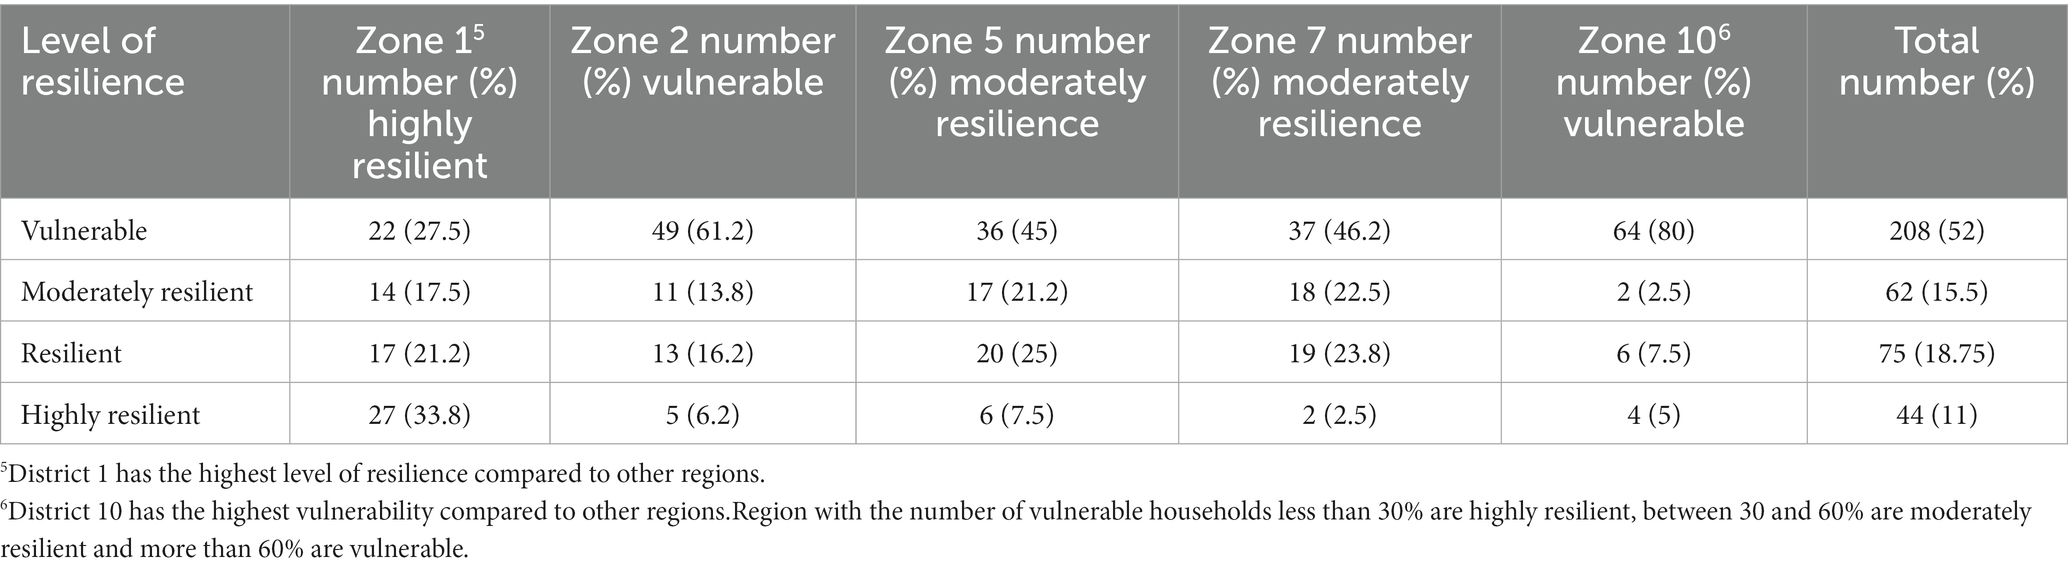
Table 10. Household resilience spectrum in the five zones of Tehran.
We found that the average consumption of red meat in highly resilient households was significantly higher than in vulnerable households (p = 0.003). Additionally, the mean consumption of dairy products in vulnerable households was significantly lower than in highly resilient households (p = 0.02). Furthermore, highly resilient households had a higher average dietary diversity score than vulnerable households (p < 0.001).
According to the results of the regression analysis to identify the effect of each latent variable on household resilience, it was found that all five dimensions explained 56% of the resilience index. Based on this analysis, assets were the most important dimension (ß = 0.33), followed by adaptive capacity (ß = 0.26), stability (ß = 0.22), access to basic services (ß = 0.14), and income and food access (ß = 0.04).
Table 10 reveals that households situated in Zone 1 exhibited a higher degree of resilience relative to other zones. Conversely, Zone 10 was characterized by a heightened vulnerability, with a substantial 80% of its households falling into the vulnerable category.
In this study, we found no significant correlation between the gender of the household head and resilience to food security; however, none of the female-headed households were classified as highly resilient.
4. Discussion
Risk exposure and resilience to existing risks are two factors that significantly influence vulnerability to food insecurity at the household level. Given that many risks are considered unpredictable, measuring resilience to food security becomes crucial in assessing vulnerability. This study utilized a conceptual framework developed for this purpose in similar studies.
The results revealed that assets were the most critical dimension in predicting resilience to food insecurity. According to studies investigating resilience, assets—including natural, physical, human, financial, and social assets—are deemed important capacities for coping with crises (O’Connor et al., 2017). Numerous studies, including those conducted in Ethiopia, have underscored the role of assets in enhancing resilience (Kebede et al., 2016).
In a study conducted in Africa, the asset index was the sole indicator used to assess resilience to food security. The advantage of this method is that data collection can be quick and straightforward, but the validity of the results depends on the quality and reliability of the data (Browne et al., 2014). A study in Kenya found that wealthier families could increase their adaptive capacity through greater access to superior facilities. Assets can help reduce vulnerability in several ways (Unks et al., 2019). According to another study, asset inadequacy was associated with a high risk of food insecurity across all income levels (Chang et al., 2014). In a 2021 study by Nahid et al., stability variables were identified as an important dimension in predicting resilience to food insecurity among rural households in the Fars province of Iran (Nahid et al., 2021). In many countries, assets are either the first or second pillar in predicting resilience capacity (d’Errico et al., 2021). Our study corroborates the findings of previous research that assets are an important dimension in predicting resilience to food insecurity.
There was a significant disparity in the resilience capacity of households across different zones. The percentage of vulnerable households ranged from 27% in Zone 1 to 80% in Zone 10. Notably, the majority of resilient households were located in Zone 1, while Zone 10 had the lowest resilience capacity. Households in Zone 1 were better off in terms of income and food access. Moreover, the number of income sources and employed household members were fewer in Zone 10 compared to other zones, and the household members had a lower level of education.
It is worth mentioning that the value of properties and economic indicators in Zone 1 of Tehran are higher than in other areas. According to a similar study on Social Resilience across different zones of Tehran, Region 1 had the highest correlation between social relations and beliefs, while Region 19 demonstrated a weaker situation in terms of social resilience (Hosseini et al., 2020). However, it is important to note that this study focused solely on social resilience, and the selected zones differed from those in our study.
In a similar study conducted in Sudan, differences in the resilience capacity index were observed across different regions. For instance, regions such as Khartoum and the northern regions exhibited greater resilience due to better access to income, food, and basic facilities (Lokosang et al., 2014). A 2020 study by Atara et al. found that resilience varied based on household livelihood systems (Atara et al., 2020). According to the results, one of the reasons for the differences in the zones of Tehran may be attributed to variations in the type of income source.
There was no significant relationship between resilience in food security and the level of education of the household head. The level of education and literacy is one of the indicators of adaptive capacity. Given that our study population comprised teacher households, this may explain the lack of relationships. However, the number of household heads with Ph.D. and master’s degrees was higher in Zone 1, which is considered a high resilience region. Evaluating the education level of other household members can also be beneficial in predicting resilience in food security. Education was one of the most relevant indicators of adaptive capacity in a 2018 study by d’Errico et al. However, adaptive capacity was the main dimension for determining resilience to food security in Tanzania and Uganda (d’Errico et al., 2018).
There was no significant relationship between resilience to food security and the household head’s gender. However, none of the female-headed households had high resilience to food insecurity. The more significant number of male-headed households in this study can be a reason for the lack of a significant relationship. A similar study conducted in Kenya found no significant association between resilience to food security and the gender of the household head (Alinovi et al., 2010a). In another study in Malawi, households headed by females had higher resilience capacity scores and lower food consumption scores. This finding suggests that for female household heads, the quantity of food is more important than its quality. Indeed, while females earn less, they tend to spend more on food (Lascano Galarza, 2020).
This hypothesis warrants further investigation in our society with a larger population. A similar study conducted in Niger found that resilience to food security was lower in households headed by females due to lower adaptive capacity, greater vulnerability, and loss of assets (Gambo Boukary et al., 2016).
It is essential to study the vulnerability and adaptive capacity of female-headed households during crises in Iran to build resilience. No significant relationship was observed between the number of family members and resilience to food security. In a similar study in Kenya, more family members were associated with less food insecurity resilience due to increased poverty (Alinovi et al., 2010a). Another study in Iran showed a significant relationship between food insecurity and family size (Tabrizi et al., 2018). Family size has a different effect on resilience to food insecurity. It has a positive effect when considered an adaptive capacity, but it can have a negative effect in low-income households. Owen et al. in 2021, found that Family literacy can be considered a form of human capital (Chamdimba et al., 2021). This study observed a significant relationship between resilience to food insecurity and education level. In a similar study in Kenya, the education level was considered one of the critical indicators of adaptation capacity; food security was higher in Meru due to more literate people (Alinovi et al., 2010a). Although budget allocation to education in households may have adverse effects on resilience at first, it can be beneficial in improving resilience in the long term (Chamdimba et al., 2021). A more significant number of family members is considered an opportunity if more literate people accompany it. However, this relationship was not observed in the present study because everyone had the same opportunity to study.
The study found a significant relationship between the number of income sources and resilience to food insecurity. Households with more than three sources of income were more resilient. This aligns with a study by Alinovi in Palestine, where the resilience rate varied from −0.25 in households without a source of income to 0.81 in households with six sources of income. Indeed, increasing the number of income sources is associated with higher food security resilience (Alinovi et al., 2010b).
The study also observed a significant relationship between the food consumption ratio and resilience to food security. Households that could afford more food expenditure were more resilient. This is consistent with a similar study in Sudan, Kordofan, and Darfur, where regions with higher food insecurity also had lower per capita expenditure. According to the results, per capita expenditure is one of the relevant variables for the resilience capacity index (Ibnouf, 2009).
However, it is important to note that per capita food consumption only considers quantity and ignores quality. Additionally, the knowledge of the person who purchases food items is also important but often overlooked (Lascano Galarza, 2020). These factors highlight the complexity of measuring and building resilience to food insecurity.
In this study, household income played a significant role in resilience to food security. The results showed that the estimated income was lower in vulnerable households compared to resilient households. This is consistent with findings from Sudan, where the average household income was lower in Khartoum and Darfur compared to other areas (Lokosang et al., 2014). Higher-income households have better economic power to prepare food, which makes them more resilient to shocks that lead to food insecurity (Kebede et al., 2016).
However, it is important to note that the consequences of income shocks on food security are context-specific. Shocks such as soaring food prices have adverse effects on both the poor and rich in the long term. However, in the short term, those with low income suffer more (Akter and Basher, 2014). This suggests that a high income does not always equate to resilience. These findings underscore the complexity of building resilience to food insecurity and highlight the need for context-specific strategies.
We found that highly resilient households had a higher dietary diversity score than vulnerable households. The average consumption of meat and dairy was lower in vulnerable households, which can be important for policy-making and practical intervention. The available evidence suggests a significant positive relationship between household dietary diversity score and household resilience (Ansah et al., 2019).
Insurance is one of the risk management instruments, and it is observed that more resilient households insure their properties more than others. However, insurance is more important for vulnerable households to protect them against unexpected losses. This aligns with the results of a study in Kenya, where farmers who had insurance were better able to protect their livelihoods (Alinovi et al., 2010a). These findings highlight the importance of insurance as a tool for enhancing resilience, particularly for vulnerable households.
We found a significant relationship between the number of coping strategies and resilience to food insecurity, suggesting that more use of coping strategies is associated with more vulnerability. These coping strategies may involve finding another job, using money saved up, selling belongings, spending less on food, and not making loan payments. Based on the results of a similar study in Malawi, coping strategies are beneficial in the short term but can become a destructive factor in the long term (Lascano Galarza, 2020). A study in Africa found that consuming seeds during famine could increase food security, but due to a shortage of seeds for agriculture in the next season, it reduces food security over a long time (Misselhorn, 2005).
To the best of our knowledge, this study is the first to assess resilience to food insecurity in Tehran. The study population was teachers who were selected from different zones of Tehran. Considering that this study was at the household level and teachers had different socio-economic conditions, these results might also have relevance for wider society.
In this study, we used RIMA-I, which has been widely used in several studies to measure household resilience to food insecurity. This makes it easier to compare the results with similar studies.
The Food Frequency Questionnaire (FFQ) was used for the first time in this study to evaluate resilience to food security. The results suggest that assessing the population’s nutritional status before crises can better manage food insecurity during crises.
Despite the various strengths and novelty of our study, and being the first to evaluate resilience to food insecurity in Tehran, there are some limitations that need to be considered. We used RIMA-I, which had some limitations in predicting resilience to food insecurity. RIMA-I could not show the effect of an increase or decrease in the resilience of food security because food expenditure was one of the Income and Food Access pillar variables. Moreover, shocks were included in the procedure, and it is impossible to analyze shocks.
While many studies have used RIMA-I, FAO has presented RIMA-II. Both models have their advantages and disadvantages. The decision on which model to use should depend on the research question, available data, and resources. Although for our data and study population, using RIMA-I was better than RIMA-II, we suggest that future studies use the RIMA-II method. The results of the present study can help compare these two methods in Tehran.
While assets and income play a crucial role in evaluating resilience, obtaining accurate data in this context is not straightforward. Many households were reluctant to disclose their salary or income accurately, and income was estimated through several questions, which was one of the limitations of this study.
Given the low-income sources in vulnerable zones, key objectives should be to increase the education level of family members to enhance their job prospects and increase their assets. The percentage of non-governmental jobs was higher in Zone 10, which had more vulnerable households. One of the indicators is stability in income sources, and government jobs are more stable than non-governmental jobs. Therefore, it is necessary to pay more attention to households with non-governmental income sources.
Indeed, while assets play a crucial role in enhancing resilience, there is no guarantee that assets are well preserved in times of crisis, especially since only some households use insurance services. It is essential to establish rules that obligate governments to insure vulnerable groups to protect their assets, such as houses and cars.
This study underscores the need for fundamental changes to build resilience. The Sustainable Development Goals (SDGs), particularly the first goal of eradicating poverty, are closely related to the results of resilience studies. Other goals, such as the fourth goal discussing the quality of education, and the eighth goal emphasizing the importance of economic growth, are also related to resilience.
More studies are needed to examine resilience to food security in vulnerable groups of society, and appropriate policies should be devised to maintain resilience to food security in resilient groups during crises. These findings highlight the complexity of building resilience and underscore the importance of a comprehensive and nuanced approach.
5. Conclusion
This study found that assets were a significant dimension in predicting resilience to food insecurity among teacher households in Tehran. However, the use of coping strategies is associated with more vulnerability. The study also highlights the importance of insurance in enhancing resilience, particularly for vulnerable households. Food intake differed in households with various degree of resilience to food insecurity and households with higher dietary diversity scores were more likely to be resilient. The study concludes by emphasizing the need for policies and interventions to improve resilience to food security in vulnerable households.
Data availability statement
The raw data supporting the conclusions of this article will be made available by the authors, without undue reservation.
Ethics statement
The studies involving humans were approved by the Ethics Committee of Tehran University of Medical Sciences (IR.TUMS.VCR.REC.1397.292). The studies were conducted in accordance with the local legislation and institutional requirements. The participants provided their written informed consent to participate in this study. Written informed consent was obtained from the individual(s) for the publication of any potentially identifiable images or data included in this article.
Author contributions
HP and HM designed the study, and supervised the data collection and cleaning. ML collected the data and drafted the manuscript. ML and AE analyzed the data. All authors reviewed, contributed to the article, and approved the submitted version.
Acknowledgments
The authors would like to thank all participants without whom this study was impossible.
Conflict of interest
The authors declare that the research was conducted in the absence of any commercial or financial relationships that could be construed as a potential conflict of interest.
Publisher’s note
All claims expressed in this article are solely those of the authors and do not necessarily represent those of their affiliated organizations, or those of the publisher, the editors and the reviewers. Any product that may be evaluated in this article, or claim that may be made by its manufacturer, is not guaranteed or endorsed by the publisher.
Abbreviations
ABS, Access to basic services; AC, Adaptive capacity; AS, Assets; DDS, Dietary diversity score; FAO, Food and agriculture organization; FFQ, Food frequency questionnaire; HFIAS, Household food insecurity access scale; IFA, Income and food access; SSN, Social safety net; S, Stability.
References
Akter, S., and Basher, S. A. (2014). The impacts of food price and income shocks on household food security and economic well-being: evidence from rural Bangladesh. Glob. Environ. Chang. 25, 150–162. doi: 10.1016/j.gloenvcha.2014.02.003
Alinovi, L., D’errico, M., Mane, E., and Romano, D. (2010a). Livelihoods strategies and household resilience to food insecurity: an empirical analysis to Kenya. European Report Develop. 1, 1–52.
Alinovi, L., Mane, E., and Romano, D. (2010b). “Measuring household resilience to food insecurity: application to Palestinian households,” Agricultural survey methods. Eds. R. Benedetti, M. Bee, G. Espa, and F. Piersimoni 341–368.
Ansah, I. G. K., Gardebroek, C., and Ihle, R. (2019). Resilience and household food security: a review of concepts, methodological approaches and empirical evidence. Food Secur. 11, 1187–1203. doi: 10.1007/s12571-019-00968-1
Atara, A., Tolossa, D., and Denu, B. (2020). Analysis of rural households’ resilience to food insecurity: does livelihood systems/choice/matter? The case of Boricha woreda of sidama zone in southern Ethiopia. Environ. Develop. 35:100530. doi: 10.1016/j.envdev.2020.100530
Azadbakht, L., and Esmaillzadeh, A. (2009). Diet variety: a measure of nutritional adequacy and health. J. Inflamm. Dis. 13, 88–97.
Baez, J., De la Fuente, A., and Santos, I. V. (2010). Do natural disasters affect human capital? An assessment based on existing empirical evidence. IZA Discussion Papers 5164. Institute for the Study of Labor (IZA). Available at: http://www.ftp.iza.org/dp5164.pdf (Accessed September 10, 2011).
Behzadifar, M., Lankarani, K. B., Abdi, S., Taheri Mirghaed, M., Beyranvand, G., Keshavarzi, A., et al. (2016). Prevalence of food insecurity in Iran: a systematic review and meta-analysis. Arch. Iranian Med. 8, 189–200. doi: 10.15171/mejdd.2016.31
Béné, C., Headey, D., Haddad, L., and von Grebmer, K. (2016). Is resilience a useful concept in the context of food security and nutrition programmes? Some conceptual and practical considerations. Food Secur. 8, 123–138. doi: 10.1007/s12571-015-0526-x
Browne, M., Ortmann, G., and Hendriks, S. L. (2014). Developing a resilience Indicator for food security monitoring and evaluation: index construction and household classification for Six African countries. Agrekon 53, 31–56. doi: 10.1080/03031853.2014.929011
Chamdimba, O. Y., Ortmann, G. F., and Wale, E. (2021). Resilience to shocks and food insecurity: determinants, and the impact of smallholder jatropha curcas cultivation in Southern Malawi. Afr. J. Sci. Technol. Innov. Dev. 13, 619–633. doi: 10.1080/20421338.2020.1774962
Chang, Y., Chatterjee, S., and Kim, J. (2014). Household finance and food insecurity. J. Fam. Econ. Iss. 35, 499–515. doi: 10.1007/s10834-013-9382-z
Clay, L. A., Papas, M. A., Gill, K. B., and Abramson, D. M. (2018). Factors associated with continued food insecurity among households recovering from Hurricane Katrina. Int. J. Environ. Res. Public Health 15:1647. doi: 10.3390/ijerph15081647
Constas, M., and Barrett, C. Principles of resilience measurement for food insecurity: metrics, mechanisms, and implementation plans. Expert Consultation on Resilience Measurement Related to Food Security. Rome: Food and Agricultural Organization and World Food Program. (2013).
d’Errico, M., Pinay, J., Luu, A., and Jumbe, E. Drivers and stressors of resilience to food insecurity–Evidence from 35 countries. (2021).
d’Errico, M., Romano, D., and Pietrelli, R. (2018). Household resilience to food insecurity: evidence from Tanzania and Uganda. Food Secur. 10, 1033–1054. doi: 10.1007/s12571-018-0820-5
Economic, U. (2017). Leave no one behind: disaster resilience for sustainable development-Asia-pacific disaster report, 2017.
Esfahani, F. H., Asghari, G., Mirmiran, P., and Azizi, F. (2010). Reproducibility and relative validity of food group intake in a food frequency questionnaire developed for the Tehran Lipid and Glucose Study. J. Epidomol. 20, 150–158. doi: 10.2188/jea.JE20090083
FAO. Analysing resilience for better targeting and action. Food and Agriculture Organization of the United Nations: Rome, Italy; (2016).
Gambo Boukary, A., Diaw, A., and Wünscher, T. (2016). Factors affecting rural households’ resilience to food insecurity in Niger. Sustain. For. 8:181. doi: 10.3390/su8030181
Hejazi, J., and Emamgholipour, S. (2022). The effects of the re-imposition of US sanctions on food security in Iran. Int. J. Health Policy Mange. 11:651. doi: 10.34172/ijhpm.2020.207
Hoddinott, J. Understanding resilience for food and nutrition security. 2020 conference papers. (2014). International Food Policy Research Institute (IFPRI).
Hosseini, A., Yadala Nia, H., Mohammadi, M., and Shekari, S. (2020). Analysis of social resilience based on social capital indicators in Tehran. Sustain City. 3, 19–39. doi: 10.22034/JSC.2020.218514.1192
Hosseinighousheh, S., Arefi, M. F., Pouya, A. B., and Poursadeqiyan, M. (2021). Health in disasters in Iranian schools: a systematic review. J. Educ. Health Promot. 10:365. doi: 10.4103/jehp.jehp_1263_20
Ibnouf, F. O. (2009). The role of women in providing and improving household food security in Sudan: implications for reducing hunger and malnutrition. J. Int. women Stud. 10, 144–167.
Izadkhah, Y., Hosseini, M., and Heshmati, V., (eds). Training teachers on disaster risk reduction in developing countries: challenges and opportunities. Proceedings of the 15th World Conference on Earthquake Engineering, Lisbon, Portugal; (2012).
Kant, A. K., and Schatzkin, A., R. G. Ziegler Dietary diversity and subsequent cause-specific mortality in the NHANES I epidemiologic follow-up study. J. American College Nutrit. (1995). 14:233–238. doi: 10.1080/07315724.1995.10718501
Kebede, T., Haji, J., Legesse, B., and Mammo, G. (2016). Econometric analysis of rural households’ resilience to food insecurity in West Shoa, Ethiopia. J. Food Secur. 4, 58–67. doi: 10.12691/jfs-4-3-2
Krishnamurthy, P. K., Lewis, K., and Choularton, R. (2014). A methodological framework for rapidly assessing the impacts of climate risk on national-level food security through a vulnerability index. Glob. Environ. Chang. 25, 121–132. doi: 10.1016/j.gloenvcha.2013.11.004
Lascano Galarza, M. X. (2020). Resilience to food insecurity: theory and empirical evidence from international food assistance in Malawi. J. Agri. Econom. 71, 936–961. doi: 10.1111/1477-9552.12397
Lokosang, L., Ramroop, S., and Zewotir, T. (2014). Indexing household resilience to food insecurity shocks: the case of South Sudan. Agrekon 53, 137–159. doi: 10.1080/03031853.2014.915486
Misselhorn, A. A. (2005). What drives food insecurity in southern Africa? A meta-analysis of household economy studies. Glob. Environ. Chang. 15, 33–43. doi: 10.1016/j.gloenvcha.2004.11.003
Mohammadi, F., Omidvar, N., Houshiar-Rad, A., Khoshfetrat, M.-R., Abdollahi, M., and Mehrabi, Y. (2012). Validity of an adapted household food insecurity access scale in urban households in Iran. Pub Health Nutrit. 15, 149–157. doi: 10.1017/S1368980011001376
Nahid, N., Lashgarara, F., Farajolah Hosseini, S. J., Mirdamadi, S. M., and Rezaei-Moghaddam, K. (2021). Determining the resilience of rural households to food insecurity during drought conditions in Fars province, Iran. Sustain. For. 13:8384. doi: 10.3390/su13158384
O’Connor, D., Boyle, P., Ilcan, S., and Oliver, M. (2017). Living with insecurity: food security, resilience, and the World Food Programme (WFP). Global Soc. Policy. 17, 3–20. doi: 10.1177/1468018116658776
Parvin, S., Salehi, S. O., Joshan, M. R., Akbar Tabar Tori, M., Malekzadeh, J. M., Pirooz, R., et al. (2020). The situation of food security and related factors in female teachers of Yasuj education school board. Armaghane Danesh. 25, 515–528. doi: 10.52547/armaghanj.25.4.515
Reduction UNOfDR. Global assessment report on disaster risk reduction 2022: our world at risk. United Nations: Transforming Governance for a Resilient Future; (1901).
Safarpour, H. (2018). Donors management in disasters: Kermanshah earthquake experience. Iran Red Crescent Med J 20:e84942. doi: 10.5812/ircmj.84942
Tabrizi, J. S., Nikniaz, L., Sadeghi-Bazargani, H., Farahbakhsh, M., and Nikniaz, Z. (2018). Socio-demographic determinants of household food insecurity among Iranian: a population-based study from northwest of Iran. Iranian J. Pub. Health. 47:893.
Unks, R. R., King, E. G., Nelson, D. R., Wachira, N. P., and German, L. A. (2019). Constraints, multiple stressors, and stratified adaptation: pastoralist livelihood vulnerability in a semi-arid wildlife conservation context in Central Kenya. Glob. Environ. Chang. 54, 124–134. doi: 10.1016/j.gloenvcha.2018.11.013
Keywords: resilience index, food security, disaster, urban, livelihood strategy
Citation: Ladaninezhad M, Mohammadi H, Esmaillzadeh A, Pouraram H and Mohaghegh M (2023) Measuring household resilience to food insecurity among Iranian teachers in disasters and crises. Front. Sustain. Food Syst. 7:1174459. doi: 10.3389/fsufs.2023.1174459
Edited by:
Peter Newton, University of Colorado Boulder, United StatesReviewed by:
Rebecca McLaren, Global Alliance for Improved Nutrition (GAIN), SwitzerlandTagesse Melketo, Wolaita Sodo University, Ethiopia
Copyright © 2023 Ladaninezhad, Mohammadi, Esmaillzadeh, Pouraram and Mohaghegh. This is an open-access article distributed under the terms of the Creative Commons Attribution License (CC BY). The use, distribution or reproduction in other forums is permitted, provided the original author(s) and the copyright owner(s) are credited and that the original publication in this journal is cited, in accordance with accepted academic practice. No use, distribution or reproduction is permitted which does not comply with these terms.
*Correspondence: Hamed Pouraram, aHBvdXJhcmFtQHlhaG9vLmNvbQ==