 Zhaoqiang Jin
 Yixue Mu
 Yusheng Li
 Lixiao Nie
95% of researchers rate our articles as excellent or good
Learn more about the work of our research integrity team to safeguard the quality of each article we publish.
Find out more
ORIGINAL RESEARCH article
Front. Sustain. Food Syst. , 28 June 2023
Sec. Crop Biology and Sustainability
Volume 7 - 2023 | https://doi.org/10.3389/fsufs.2023.1173916
The rice-wheat rotation system is an important planting system in the middle and lower reaches of the Yangtze River. Studies on the effects of different rice planting methods on the water, energy, and carbon footprints of subsequent wheat have rarely been reported. In this study, the effects of different rice cultivation practices on the water, energy, and carbon footprints of subsequent wheat were investigated among different rice-wheat rotation systems including dry direct-seeded rice (DSR)-wheat rotation, wet direct-seeded rice (WSR)-wheat rotation and transplanted rice(TPR)-wheat rotation. Results showed that the yield of wheat after DSR was 8,552 kg ha−1, which was 14.61 and 4.72% higher than the yields after WSR and TPR, respectively. In addition, the water and carbon footprints of wheat after DSR were lower than those after WSR and TPR, while its energy and carbon production efficiencies and net ecosystem economic benefits were higher than those after WSR and TPR. Notably, the use of fertilizers and fuel are the two major contributors to the high energy inputs and greenhouse gas emissions in wheat production. In summary, wheat after DSR has higher ecological and economic benefits, and we recommend that it be promoted as the preferred wheat planting model in rice-wheat rotation areas.
Resource shortages, climate and environmental degradation and food security are three strategic issues affecting human survival and development. Exploring clean and efficient food production models is essential to maintaining the sustainable development of human society. Wheat is the third-largest cereal crop in the world after maize and rice, providing approximately 20% of the calories and protein required by humans (Braun et al., 2010; Li et al., 2023), and is also an essential source of income for a large number of rural people (Choudhary et al., 2020). Globally, wheat accounts for approximately 25% of the global cereal crop acreage. China is the world’s largest wheat producer, with approximately 13% of the world’s total wheat acreage, producing approximately 97 million tons of wheat per year (Singh et al., 2007). Therefore, ensuring high and stable wheat yields in China is significant for improving the standard of living and ensuring regional and even world food security.
Different cropping systems have varying effects on soil structure and nutrient availability, consequently influencing root growth and nutrient uptake in subsequent crops (Nishimura et al., 2008; Cha-un et al., 2017). Dry direct-seeded rice (DSR), wet direct-seeded rice (WSR), and transplanted rice (TPR) are the current widely used rice planting method, and their effects on the physicochemical and biological properties of soil are distinct (Jin et al., 2021). Wheat is highly sensitive to changes in the production environment and management practices (Rahman and Hasan, 2014), and its output attributes are susceptible to the soil environment (Sun et al., 2019).
The environmental footprint method is a new method developed in recent years to quantitatively analyze and judge the level of sustainable development of a country or region (Jin et al., 2023). Essential components of the environmental footprint include the water footprint (WF), energy footprint (EF), and carbon footprint (CF), which measure ecosystem security and sustainability. The net ecosystem economic benefits (NEEB) is an indicator that assesses the ecological and economic benefits of crop production based on yield benefits, production and global warming potential (GWP) costs (Zhang et al., 2015). A systematic assessment of WF, EF, CF, and NEEB in wheat production provides insights into the environmental impacts and the ecological and economic benefits of wheat production technologies and cultivation management practices (Gunady et al., 2012). This is consistent with recent calls for scientists to focus on multiple sustainability metrics (Harrison et al., 2021).
Much previous work has been done on greenhouse gas (GHG) emissions, soil carbon content changes, WF, EF, CF, and NEEB assessment among different rice planting methods (Chaudhary et al., 2017; Yuan et al., 2018; Nguyen et al., 2019; Li et al., 2021; Mullick and Das, 2021). However, studies on the effects of different rice planting methods on the WF, EF, CF, and NEEB of subsequent wheat crop have not been reported. In this study, the effects of different rice planting methods (dry direct-seeded, wet direct-seeded, and transplanted rice) on the WF, EF, CF, and NEEB of their subsequent wheat crops were comprehensively assessed. The results from this research will contribute theoretical basis and data support for the establishment of a long-term sustainable technical system for wheat production.
The experiment was conducted in 2018–2020 at the Modern Agricultural Demonstration Park in Xiangzhou District, Xiangyang City, Hubei Province (112°21′ E, 32°7′ N). The soil of the experimental site is submerged paddy soil, and the thickness of the plow layer is 25 cm. The organic matter content was 17.11 g kg−1, the alkaline N content was 72.66 mg kg−1, the available phosphorus content was 15.85 mg kg−1, the available potassium content was 106.18 mg kg−1, and the pH was 6.4.
The two rice varieties selected for the preceding rice season were Huhan 15 (conventional rice, HH15) and Liangyou 6326 (hybrid rice, LY6326), and the test variety for the wheat season was Zheng Mai 9023. The experiment adopted a split-plot design, with dry direct-seeded, wet direct-seeded and transplanted as the main plots and two rice varieties as the subplots, with four replications. Dry direct-seeded plots were prepared under dry conditions, wet direct-seeded and transplanted plots were soaked with water before preparation, the field surface of wet direct-seeded plots was kept in a mud state, and transplanted plots were kept in a shallow water layer. DSR is mainly rainfed when the plot soil is too dry (soil water potential ≤ −30 kPa) for wet irrigation so that the soil is kept aerobic during the whole reproductive period of rice; WSR continues to keep the soil moist after sowing, and the plot is kept in the 3–10 cm water layer after 4.5 leaves until 2 weeks before rice harvest; the 3–10 cm water layer was kept after transplanting until 2 weeks before rice harvest in TPR. Fertilizer management patterns for rice are the same for different planting methods. After rice harvest, the aboveground rice stubble was removed, and the ground was tilled with a rotary tiller to plant subsequent wheat with a sowing rate of 180 kg ha−1 and a row spacing of 18 cm. The sowing method was manual sowing and was accordingly recorded as wheat after dry direct-seeded rice (WAD), wheat after wet direct-seeded rice (WAW), and wheat after transplanted rice (WAT). The fertilizer application rate in the wheat season was N 180 kg ha−1, P2O5 120 kg ha−1, K2O 90 kg ha−1, and Zn 2 kg ha−1 (local farmers’ practice), of which phosphorus, potassium and zinc fertilizers were applied as base fertilizers at one time and N fertilizer was applied in the ratio of base fertilizer: tillering fertilizer: jointing fertilizer = 2:1:1. Plant samples were collected from each plot at wheat maturity to determine the economic and biological yield of wheat.
The WF of crop production refers to the total amount of freshwater consumed and used to dilute pollutants in the process of crop growth, which is divided into the blue water footprint (WFblue), green water footprint (WFgreen) and gray water footprint (WFgray) and is usually expressed as freshwater consumption per unit product (Zhai et al., 2019). Blue water refers to surface and groundwater consumption, usually expressed as irrigation water. Green water means the amount of effective precipitation (unformed runoff) consumed. Gray water refers to the amount of freshwater required to dilute pollutants from crop growth to environmental water quality standards (Li et al., 2018).
The total water footprint (WFtotal) was the sum of WFblue, WFgreen and WFgray (in m3 t−1).
WFblue and WFgreen were calculated by Equations (2) and (3):
where Wblue referred to the blue water demand during wheat production, which in this study is equal to the amount of irrigation water (m3 ha−1) during the wheat growth period. Wgreen referred to the green water demand during wheat production, which in this study is equal to the amount of effective precipitation (m3 ha−1) during the wheat growth period. Because the rainfall during the wheat growth period is low, the effective precipitation in this study is the rainfall. Y referred to the yield of wheat (t ha−1).
In this study, only the pollution of the water body caused by the application of N fertilizers was considered when estimating the WFgray, and the pollution of the water body by other fertilizers and pesticides was not considered. This paper assumes that the natural concentration of N in the receiving water body is zero to ensure the unification of standards and calculates the WFgray using the critical dilution method (Castellanos et al., 2016):
where AN was the amount of N applied (kg ha−1); α referred to the percentage of N entering the water body through leaching and runoff to the total N application, which was approximately 10% (Hoekstra et al., 2011); and Cmax referred to the maximum acceptable concentration of N in the water body, which was 50 mg L−1 (European Standard).
The energy input (Ei, MJ ha−1) in the wheat production process included irrigation water, machinery, diesel, electricity, labor, seeds, fertilizers and pesticides. The energy output (Eo, MJ ha−1) consisted of wheat grain and straw. The mean energy contained in the inputs of production and outputs was calculated by multiplying the statistical quantities of the input means of production and outputs by the corresponding energy equivalent. The total Ei was the sum of all input energy, and the total Eo was the sum of all output energy. The energy equivalents of the means of production and outputs are shown in Table 1.
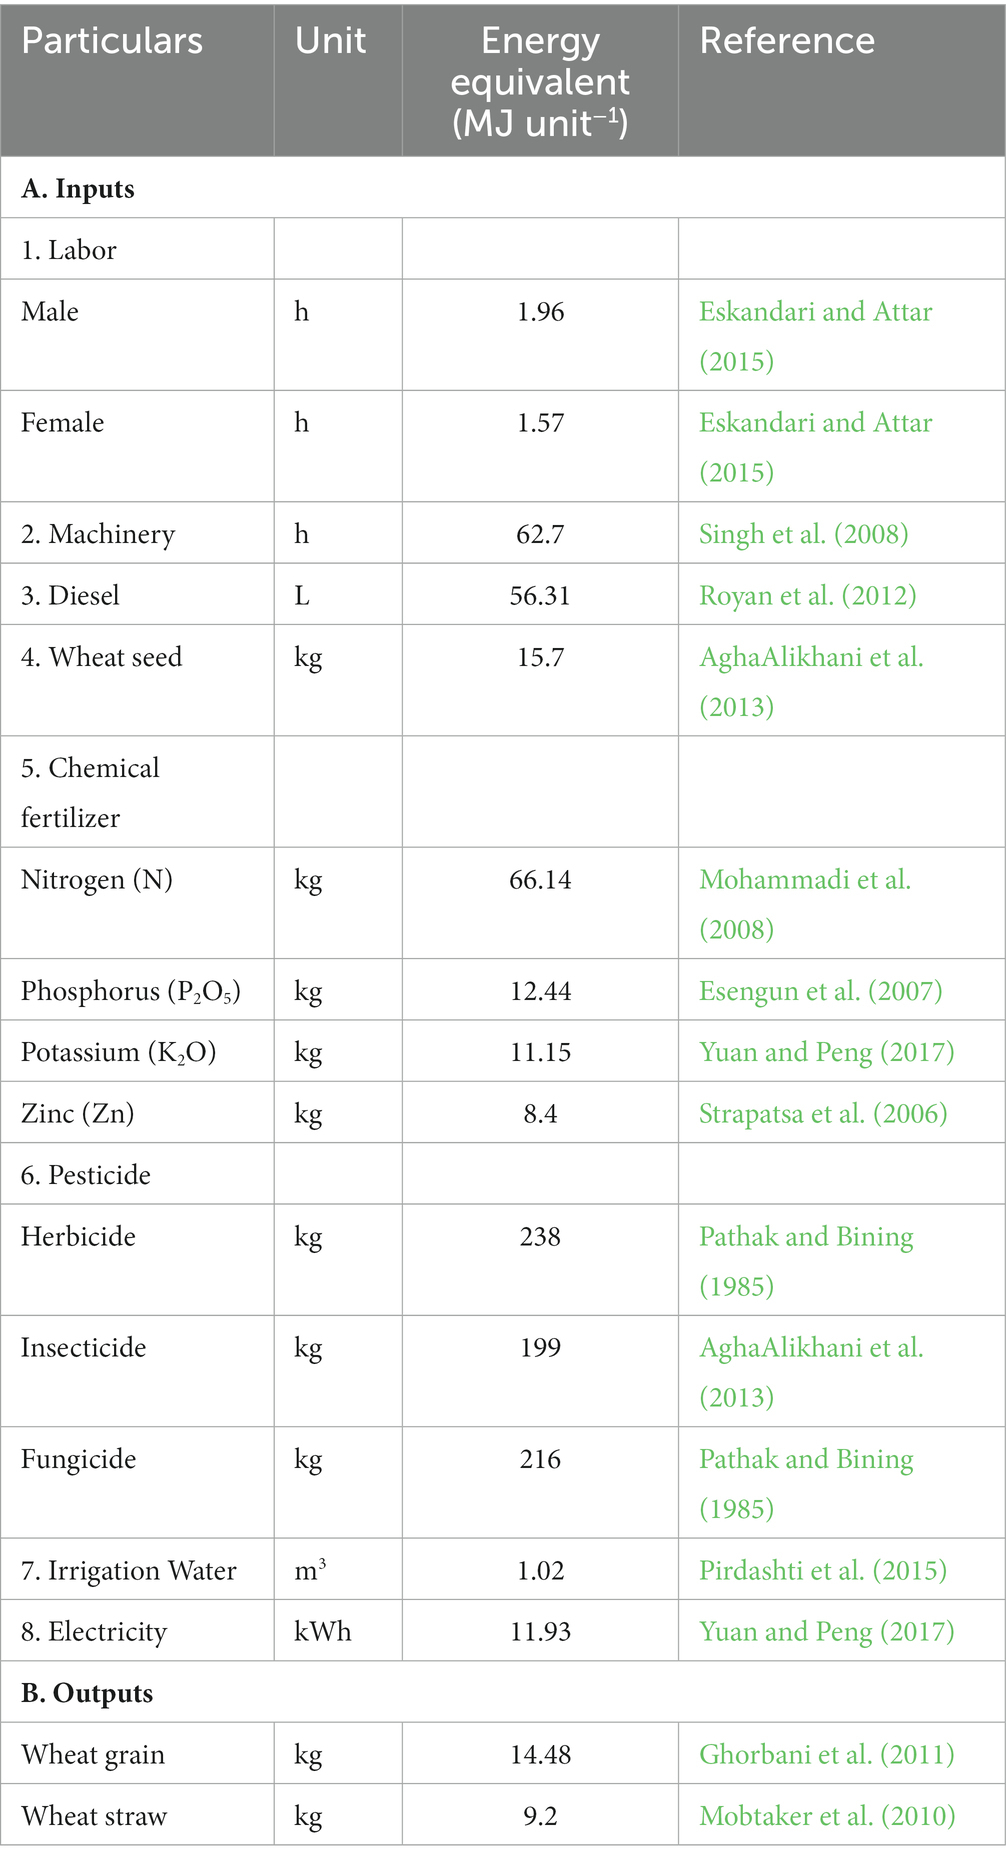
Table 1. Energy equivalent of inputs and outputs in wheat production.
The net energy (NE, MJ ha−1), energy use efficiency (EUE), energy productivity (EP, kg MJ−1), energy profitability (EPF), and human energy profitability (HEPF) of wheat production were calculated from the calculated total Ei and output in the wheat production process by the following equations (Pirdashti et al., 2015; Singh et al., 2019a).
where Eh referred to the human energy input during wheat production (MJ ha−1).
Generally, Ei in agricultural production was divided into renewable energy and nonrenewable energy. Renewable energy included labor, seeds, irrigation water, and wind and hydropower; nonrenewable energy included fertilizers, pesticides, diesel, machinery, and thermal power. The electricity used in China was mainly generated by thermal, wind and hydroelectric power. Thermal power reportedly accounted for 75% of all electricity produced in China, with the remaining 25% mainly coming from wind and hydropower (China’s Electricity Yearbook Committee, 2015).
Greenhouse gas (GHG) emissions include the following: (1) production, storage, transportation and use of agricultural inputs (such as seeds, fertilizers and pesticides); (2) energy consumed by agricultural machinery operations (such as tillage, irrigation, and harvesting) (GHGs from machinery and equipment manufacturing were not considered in this study); and (3) GHG emissions from farmland during the wheat growth period. Since humans naturally produce CO2 through respiration, GHGs from human labor were not accounted for (West and Marland, 2002). Because a certain amount of carbon is fixed during wheat growth, GHGs from wheat respiration and residue decomposition were not considered.
The crop yield carbon footprint was calculated by dividing the GHG emissions from agricultural inputs and non-CO2 GHG emissions from cropland by the crop yield. Calculated according to Equation (10) (Qi et al., 2018):
where CF t was the total GHG emissions (kg CO2-eq ha−1) during wheat production, including GHG emissions from agricultural inputs and N2O emissions from soil (wheat is a dry crop with minimal CH4 emissions during the growth period and is neglected). Calculated by Equation (11):
where CF i was the total indirect GHG emissions related to the input means of production (kg CO2-eq ha−1) and CFN2O was the CO2 equivalent (kg CO2-eq ha−1) converted from direct and indirect N2O emissions due to the application of N fertilizer.
CF i was calculated by Equation (12) (Qi et al., 2018):
where Qm was the input quantity of the mth mean of production in the wheat production process (kg ha−1), including fertilizer, seeds, pesticides, the electrical energy consumed for pesticide application, diesel fuel consumed for farming operations and use time of agricultural machinery; δm was the GHG emission factor (kg CO2-eq unit−1) for the mth means of production (Table 2).
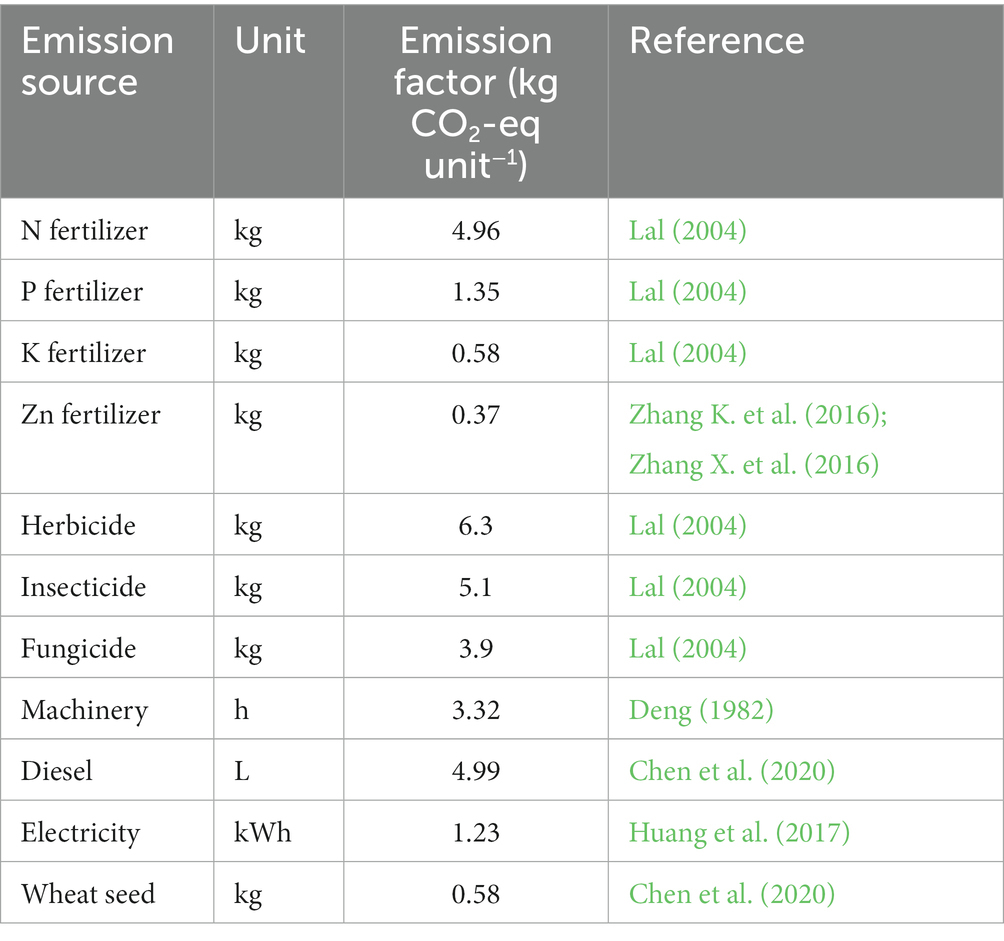
Table 2. Greenhouse gas emission factors of inputs in wheat production.
Farmland N2O emissions was estimated according to the 2006 IPCC Guidelines (IPCC, 2006). In this study, applied chemical N fertilizer was the major contributor to soil direct and indirect N2O emissions (IPCC, 2006). Direct and indirect N2O emissions from farmland were estimated by Equation (13):
where DN2O was the direct N2O emission from farmland (kg CO2-eq ha−1); VN2O was the indirect N2O emission (kg CO2-eq ha−1) from atmospheric deposition of N volatilized to NH3 and NOx in farmland; and LN2O was the amount of N2O produced by N leaching and runoff (kg CO2-eq ha−1). These values were calculated by Equations (14)–(16):
where FSN was the pure N amount (kg N ha−1) obtained from chemical fertilizer during wheat production; EF1 was the emission factor for N2O emitted directly due to N fertilizer application (0.01 kg N2O-N kg−1 N for dryland and 0.003 kg N2O-N kg−1 N for flooded paddy field); FG was the fraction of fertilizer N volatilized as NH3 and NOx in the fertilizer (0.10 kg NH3-N + NOx-N kg−1 N); EF2 was the emission factor for N2O emission from atmospheric deposition of N on the soil surface (0.01 kg N2O-N kg−1 NH3-N + NOx-N volatilization); FL was the ratio of N loss by leaching and runoff/N application (0.30 kg lost by leaching and runoff per 1 kg N applied); EF3 was the emission factor for N2O emission from leaching and runoff loss N (0.0075 kg N2O-N kg−1 N); 44/28 was the mass fraction of N in N2O; 298 was the GWP for the conversion of N2O to CO2 on a 100-year scale.
The above emission factors are the default values in the 2006 IPCC Guidelines for National Greenhouse Gas Inventories (IPCC, 2006).
Carbon output (Co, kg C ha−1) refers to the carbon content of photosynthetic products accumulated by wheat and is calculated by multiplying its biological yield (Yb, kg ha−1) by the average carbon content of photosynthetic products (Cc, kg C kg−1), Equation (17) (Jat et al., 2019). It is worth noting that only the aboveground part of wheat was considered for the Co in this study. The carbon content of the wheat shoots was measured with a carbon/nitrogen analyzer (Elementar Trading Co., Ltd., Germany).
Carbon efficiency (CE) and carbon sustainability index (CSI) were calculated by Equations (18) and (19) (Lal, 2004; Chaudhary et al., 2017):
Carbon efficiency ratio (CER) was calculated by Equation (21) (Chaudhary et al., 2017):
where Cy was the wheat yield in terms of carbon (kg C ha−1); CEE was the carbon emission equivalent (kg C-eq ha−1); and 12.01/44.01 was the mass fraction of C in CO2.
NEEB (CNY ha−1) was calculated by Equation (23) (Song et al., 2021):
where Yr (CNY ha−1) was the yield gain of wheat at market prices; Ic was the cost of wheat production inputs, including seeds, fertilizers, pesticides, labor, machinery, and energy (CNY ha−1); and GWPc (CNY ha−1) was the product of the carbon trade price and GWP. The GWP was the GHG emissions converted into CO2-eq. The carbon-trade price was 232.7 CNY t−1 CO2-eq (Carbonnews, 2020).
Data were analyzed by analysis of variance using Statistix 9.0 (Analytical Software, FL, United States), and multiple comparisons of the means were performed using the least significant difference method at the 0.05 significance level to determine the significance of significant differences between treatments. All figures were generated by OriginPro 2021 (Mapping Software, MA, United States).
The average yield of WAD was 8,552 kg ha−1 in 2 years, 14.61 and 4.72% higher than that after WSR and TPR, respectively (Figure 1). The difference between grain yields of WAD and WAT reached a significant level in 2018–2019, while there was no significant difference between grain yields of WAD and WAT in 2019–2020 (Figure 1). Except for wheat after transplanted HH15 in 2019–2020, the yields of both WAD and WAT were significantly higher than those of WAW (Figure 1).
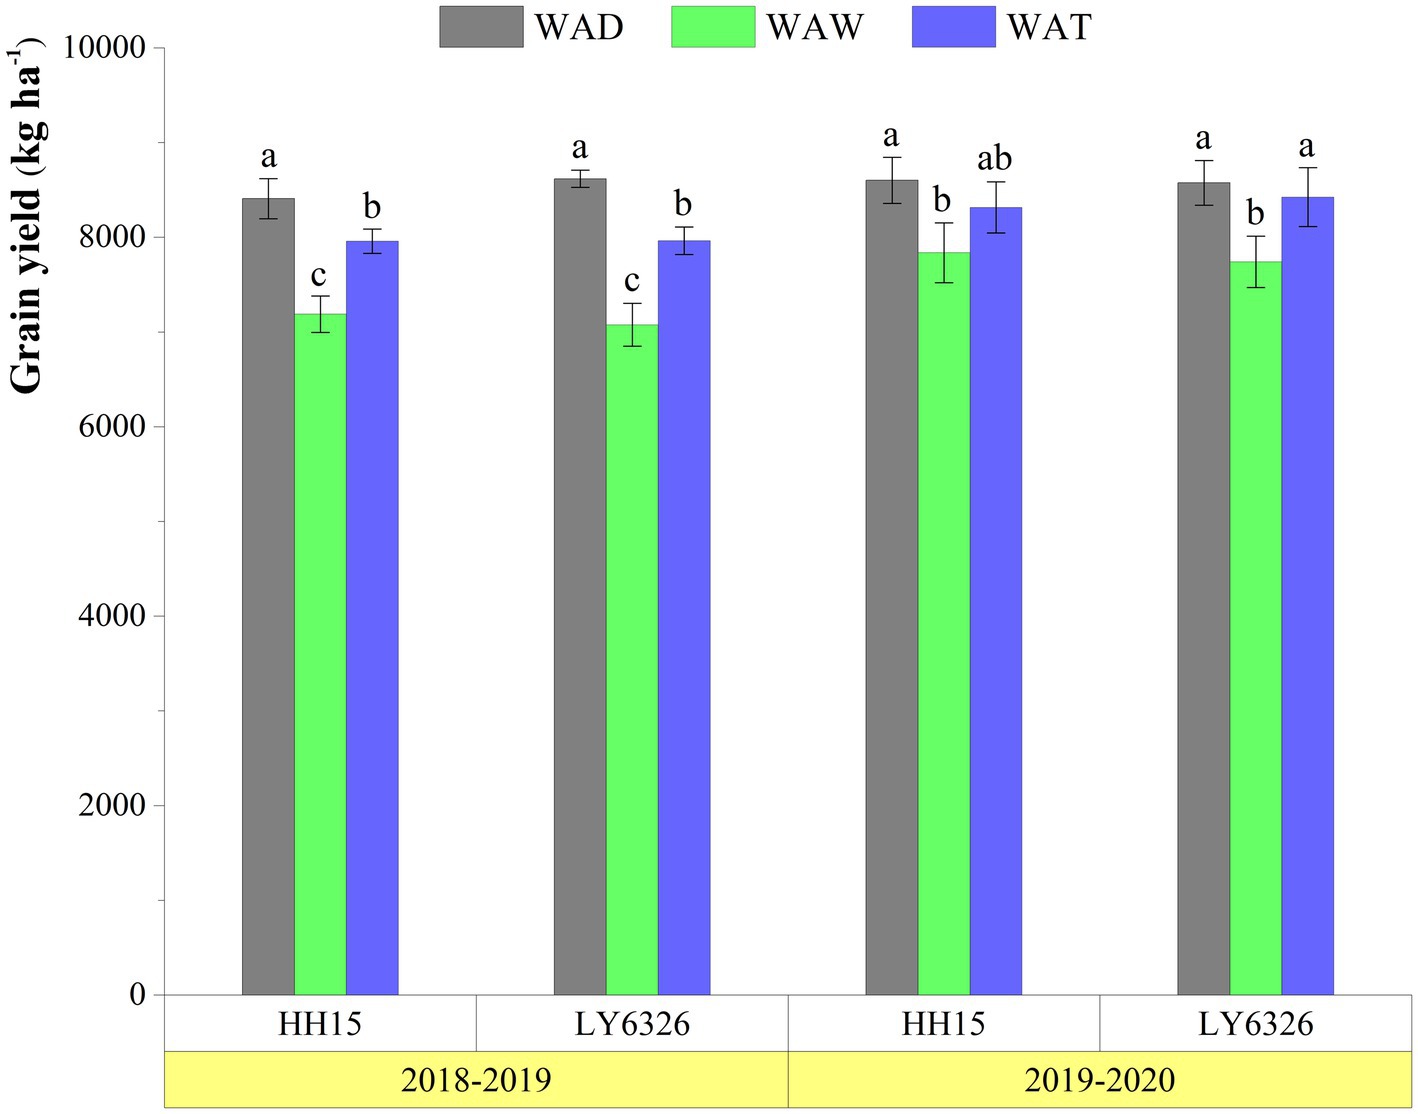
Figure 1. Grain yields of wheat after dry direct-seeded, wet direct-seeded and transplanted rice. HH15, Huhan15; LY6326, Liangyou6326; WAD, Wheat after dry direct-seeded rice; WAW, Wheat after wet direct-seeded rice; WAT, Wheat after transplanted rice. Data are the mean ± standard deviation. Different lowercase letters on the columns indicate significant differences at the 0.05 level for subsequent wheat of the same rice variety in different planting methods in the same year.
The WF of WAW rice was higher than that after DSR and TPR, and the WFtotal of wheat production was mainly influenced by the WFgreen (Figure 2). The two-year average WF of WAW was 280 m3 t−1, 14.86 and 9.61% higher than that after DSR and TPR, respectively (Figure 2). The difference between the WF of WAD and WAT reached a significant level in 2018–2019, while there was no significant difference between the WF of WAD and WAT in 2019–2020 (Figure 2). The WFgreen accounted for more than 69% of the WF of wheat production (Figure 2).
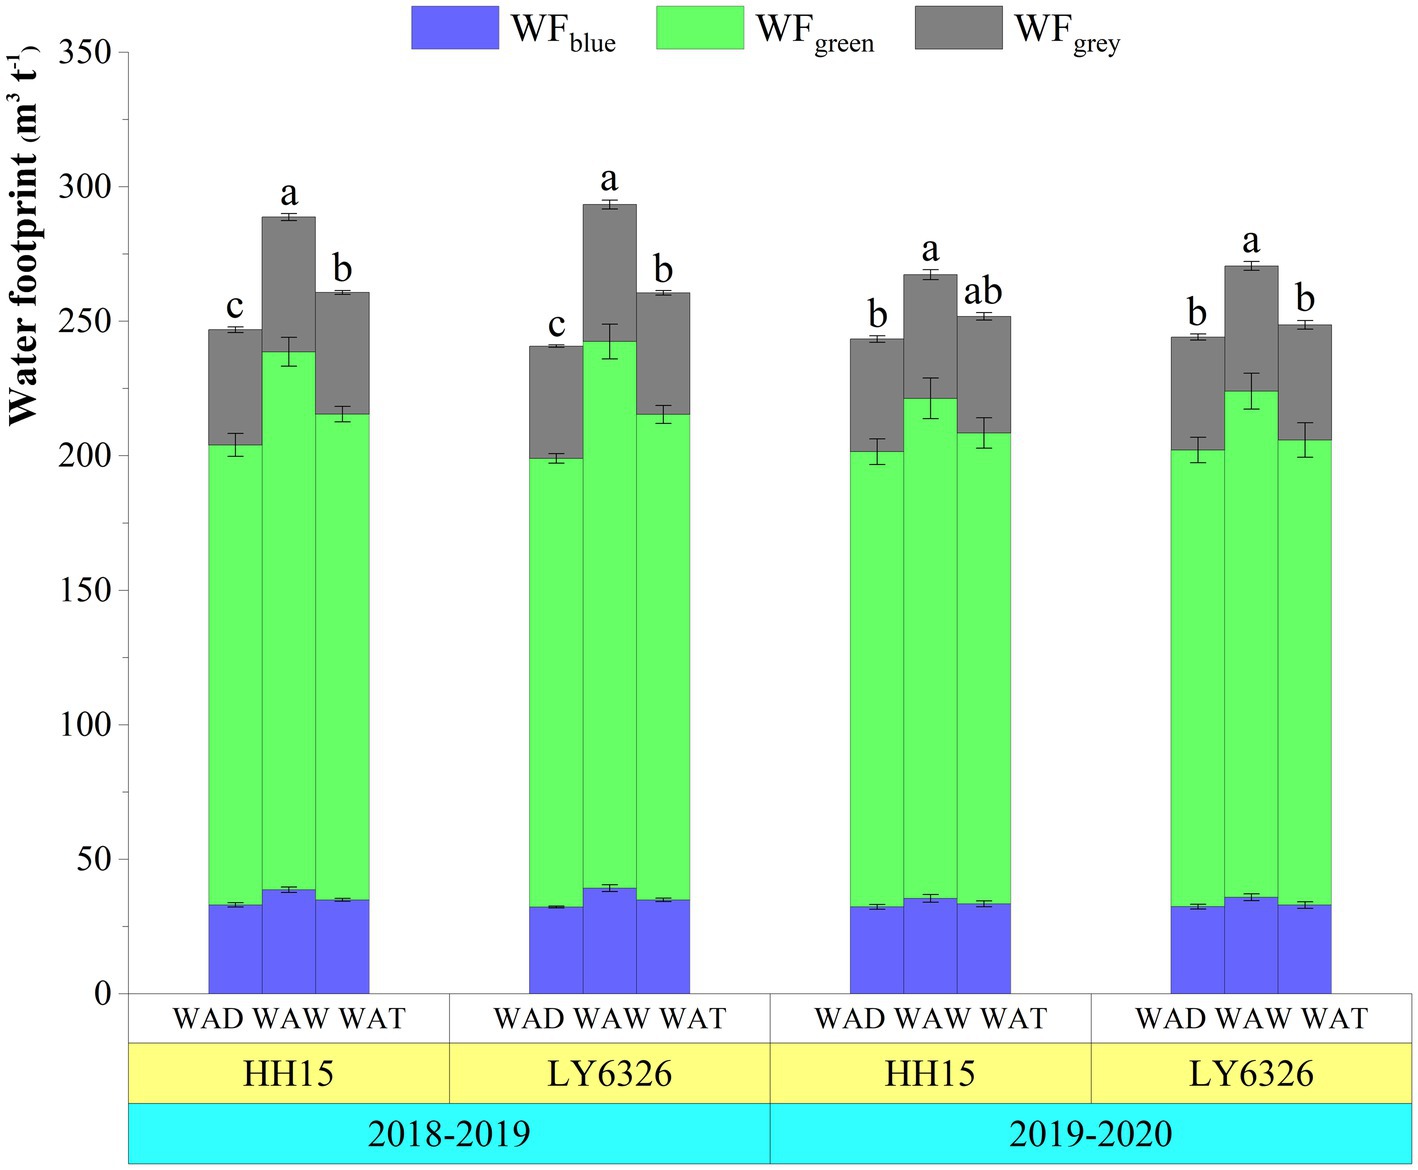
Figure 2. The water footprint of wheat after dry direct-seeded, wet direct-seeded and transplanted rice. HH15, Huhan15; LY6326, Liangyou6326; WAD, Wheat after dry direct-seeded rice; WAW, Wheat after wet direct-seeded rice; WAT, Wheat after transplanted rice; WFblue, Blue water footprint; WFgreen, Green water footprint; WFgray, Gray water footprint. Data are the mean ± standard deviation. Different lowercase letters on the columns indicate significant differences at the 0.05 level for subsequent wheat of the same rice variety in different planting methods in the same year.
The total Ei during the two-year wheat production process was 29,742 MJ ha−1 and 29,949 MJ ha−1, respectively (Table 4). Fertilizers and diesel are the two most abundant energy inputs for wheat production, accounting for 48.31 and 31.27% of the total Ei, respectively (Tables 3, 4). Among the fertilizers, N fertilizer accounted for the largest share of Ei, accounting for 82.57 and 39.89% of the total fertilizer Ei and total Ei, respectively (Figure 3).
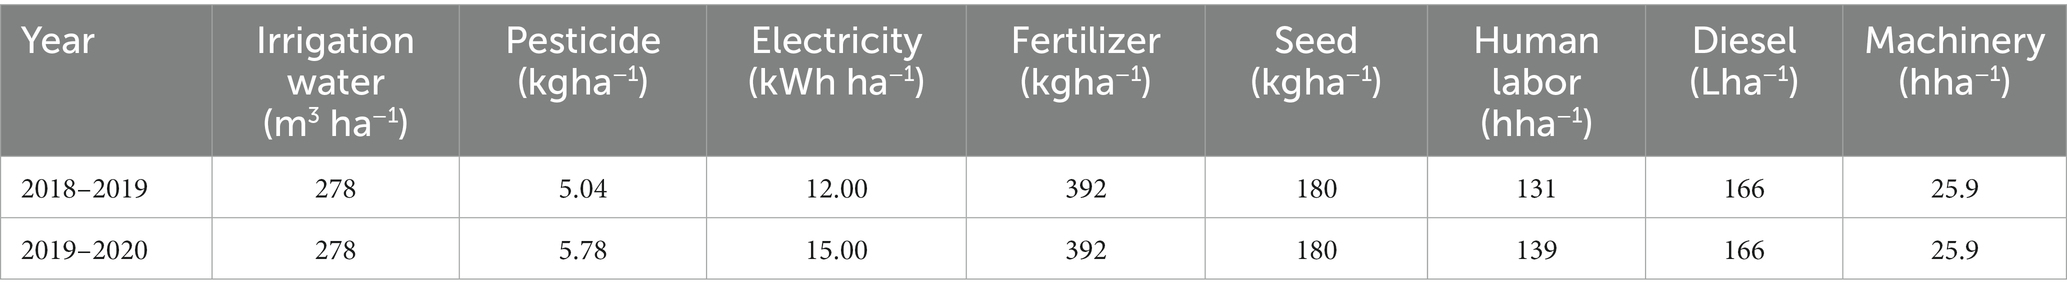
Table 3. Resource inputs for wheat production.
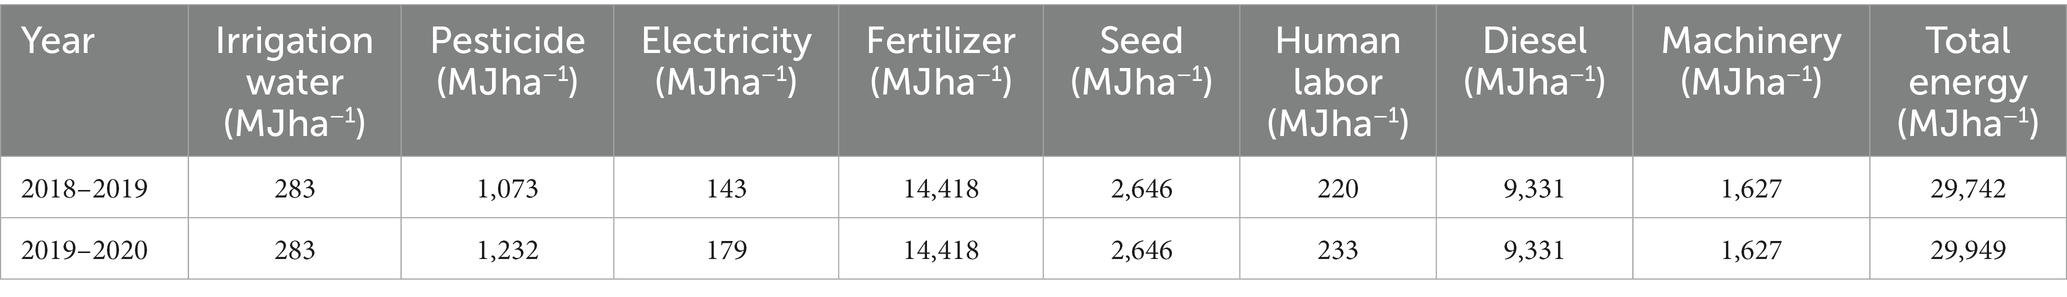
Table 4. Energy inputs for wheat production.
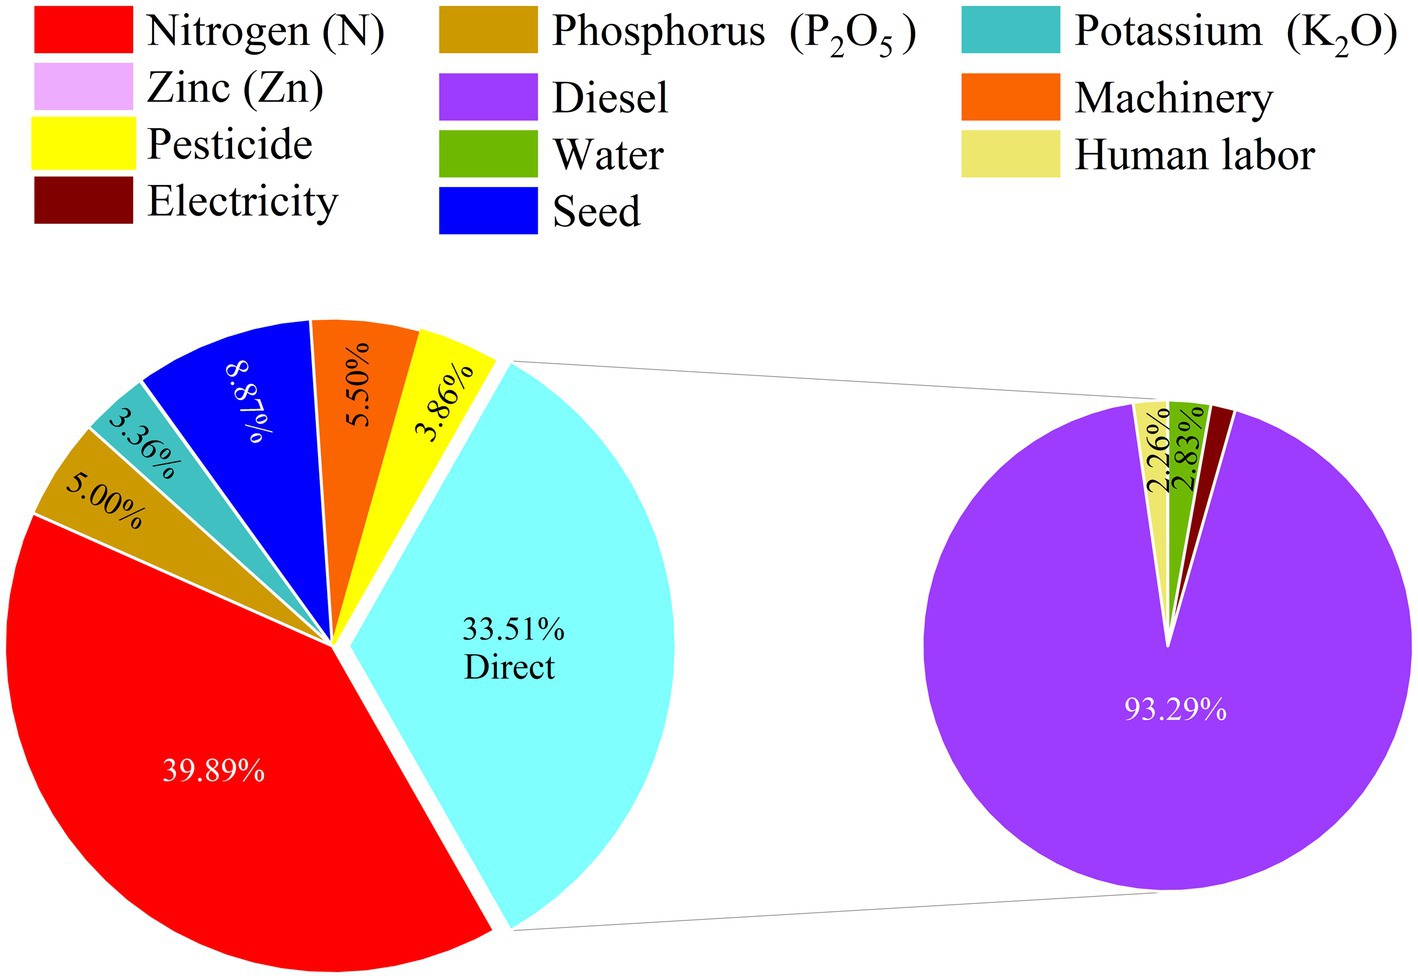
Figure 3. Distribution of direct and indirect energy inputs for wheat production.
The Ei to wheat production was dominated by indirect energy (Figure 3). The average direct Ei of wheat in the 2 years was 10,002 MJ ha−1, accounting for 33.51% of the total Ei (Figure 3). Among the input means of production, the energy contained in the diesel accounts for 93.29% of the total direct Ei (Figure 3). N fertilizer is the means of production with the most indirect Ei, which contains approximately 60% of the total indirect Ei.
Wheat production relies mainly on nonrenewable Ei (Figure 4). The average renewable Ei for two-year wheat production was 3,196 MJ ha−1, accounting for 10.71% of the total input energy (Figure 4). Among the inputs of renewable means of production, seeds, irrigation water, labor, and wind and hydroelectricity are ranked in descending order of energy content, with seeds accounting for 82.79% of the total renewable Ei and wind and hydroelectricity accounting for less than 2% of the total renewable Ei (Figure 4).
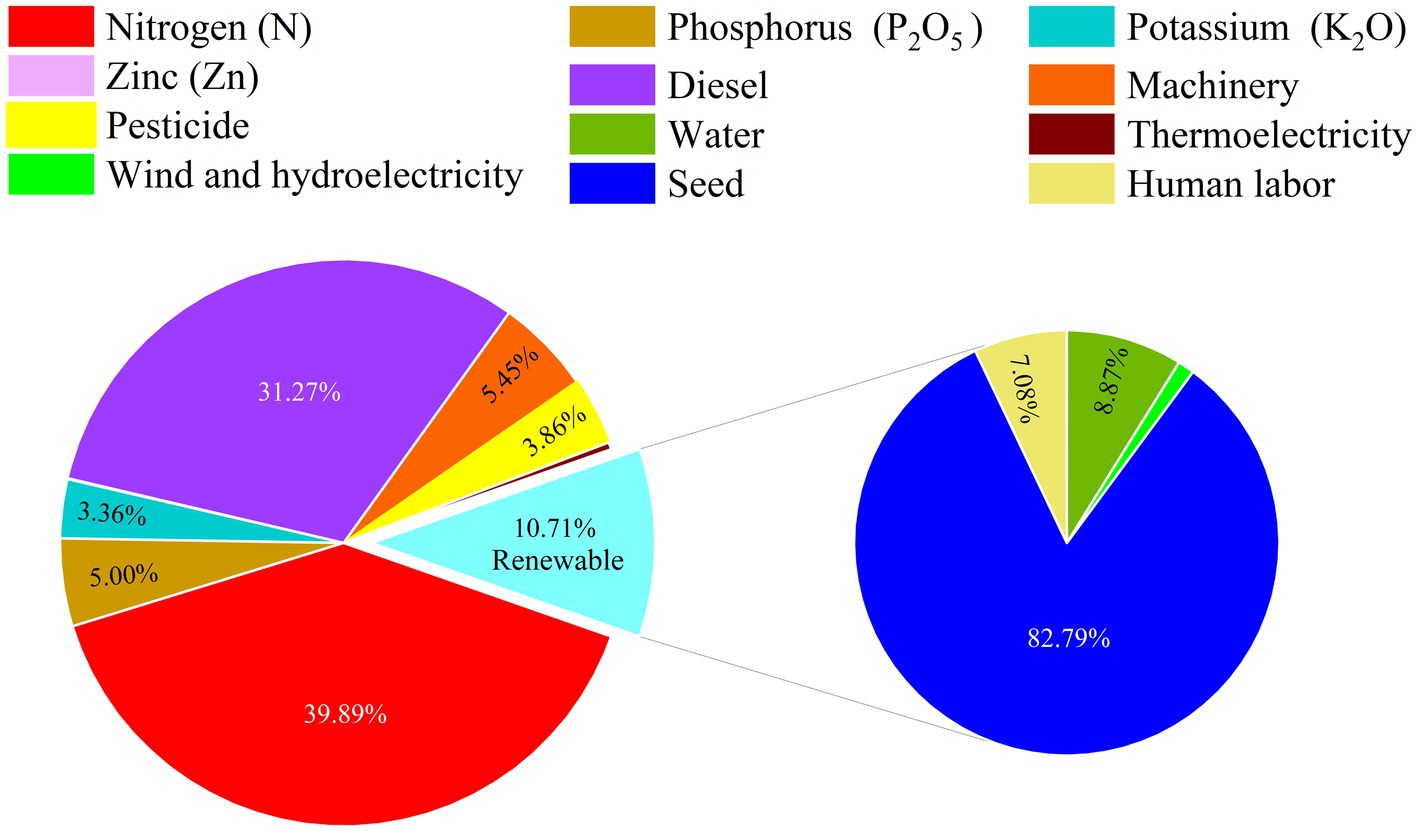
Figure 4. Distribution of renewable and nonrenewable energy inputs for wheat production.
The total Eo and NE of WAD and WAT were higher than those after WSR (Figure 5). The two-year average total Eo of WAD and WAT was 217,724 MJ ha−1 and 206,410 MJ ha−1, respectively, 15.83 and 9.81% higher than WAW (Figure 5). Because the total Ei of wheat after rice was the same for the different rice planting methods, the difference in NE of wheat after rice for the different rice planting methods was consistent with the total Eo (Figure 5).
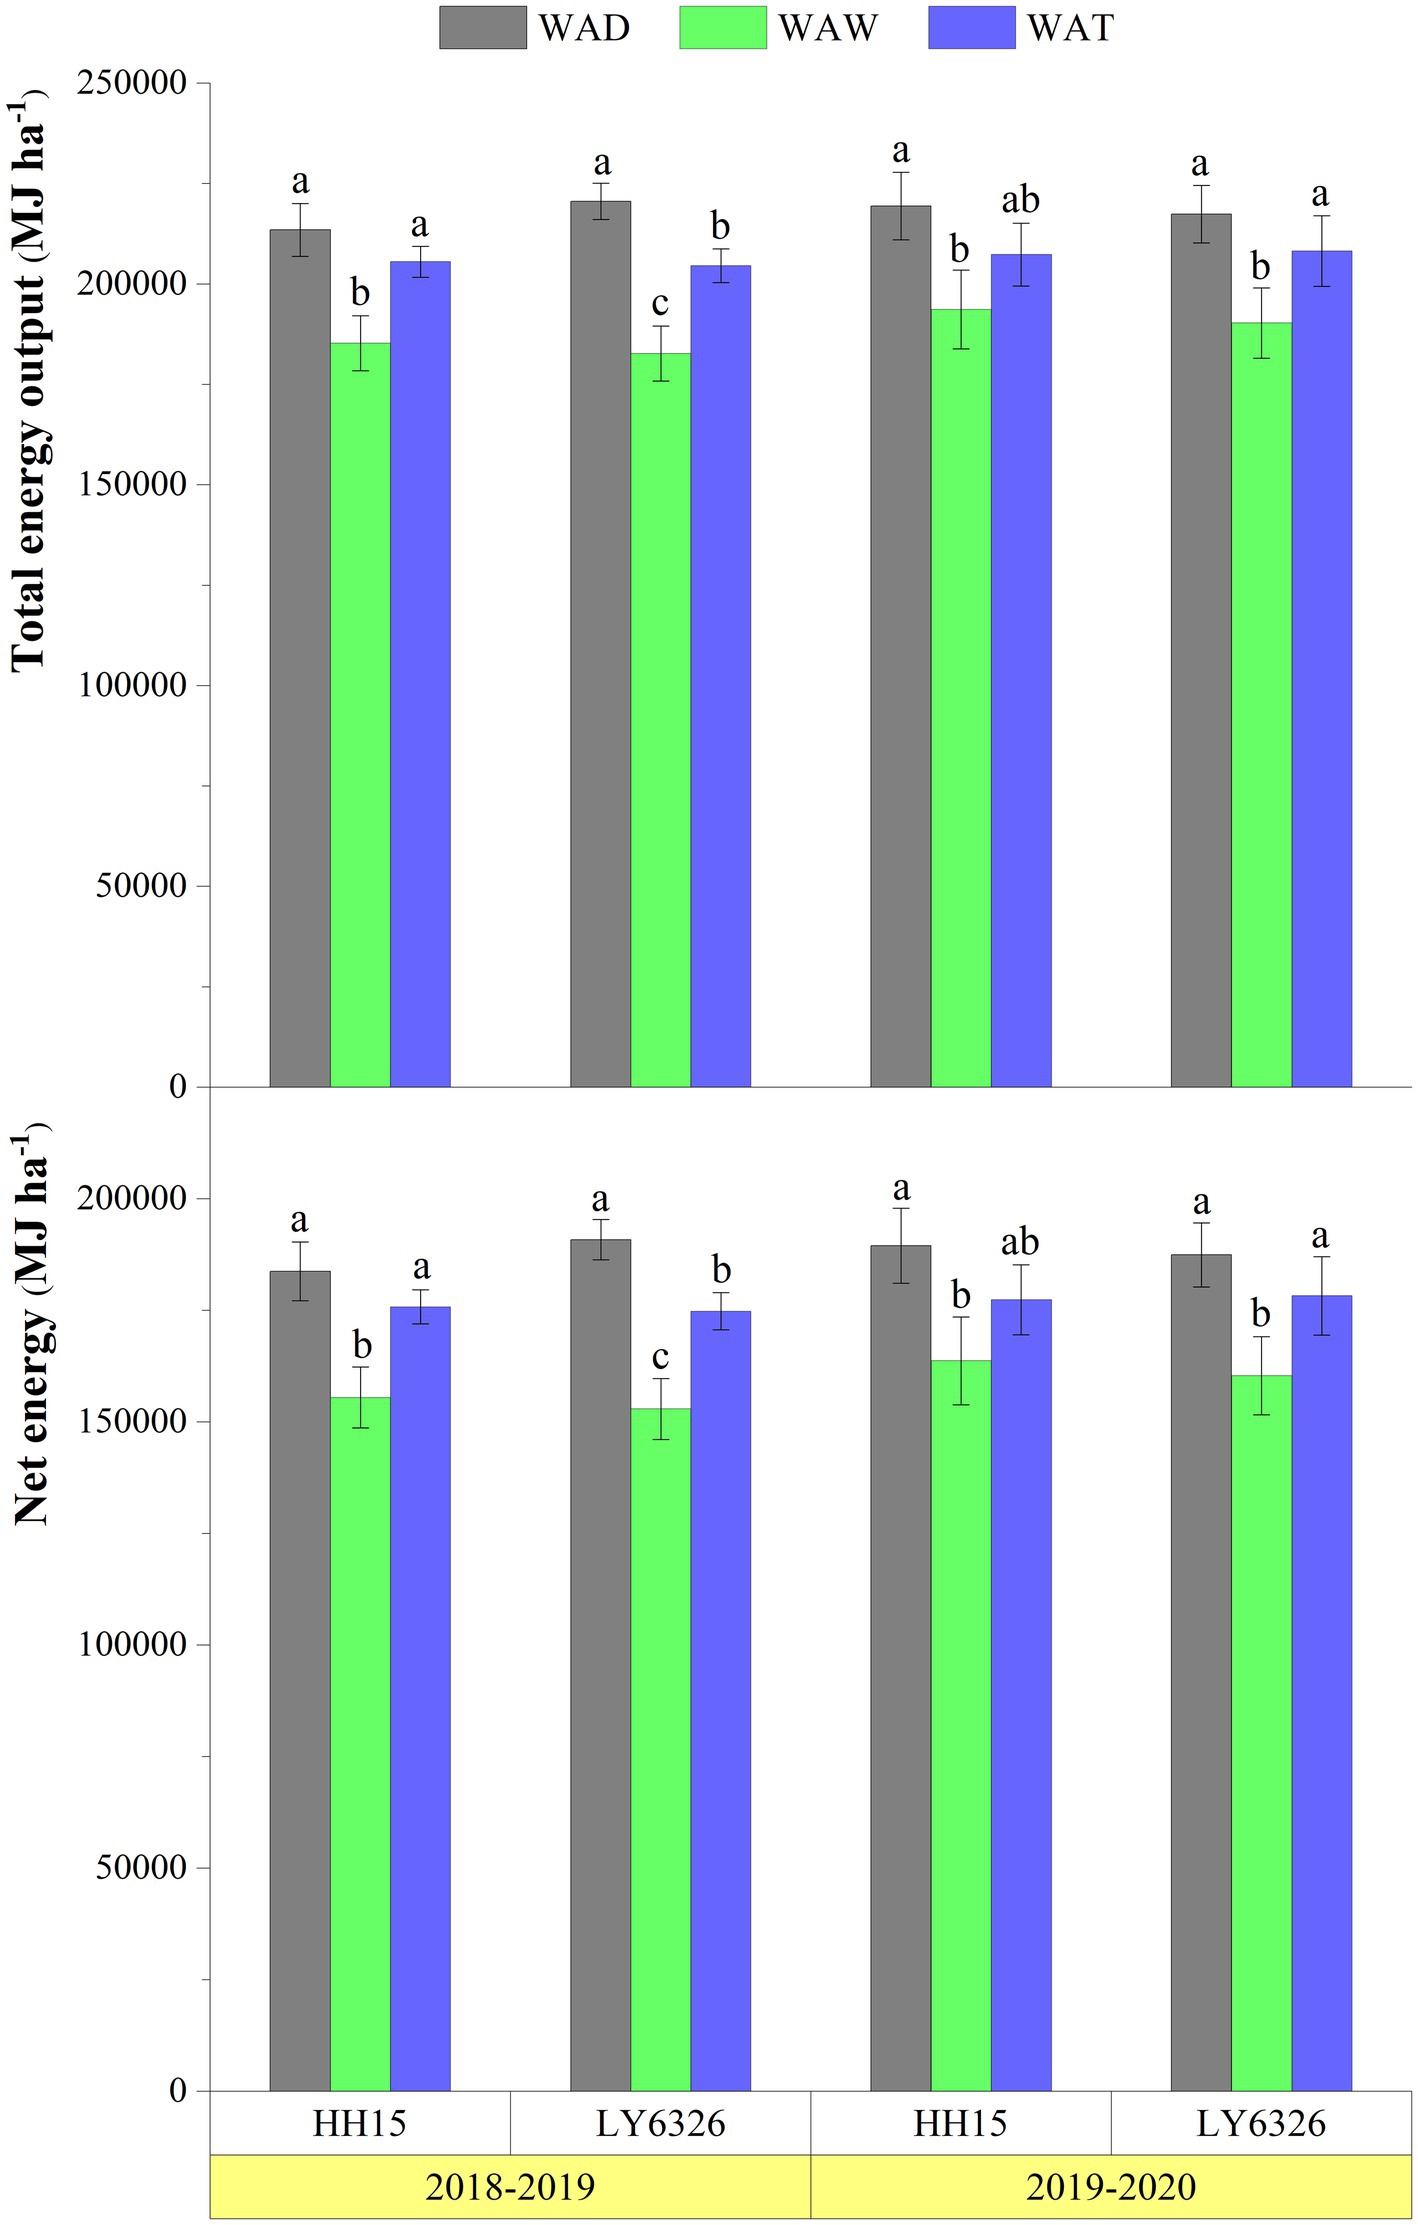
Figure 5. Total energy output and net energy of wheat after dry direct-seeded, wet direct-seeded and transplanted rice. HH15, Huhan15; LY6326, Liangyou6326; WAD, Wheat after dry direct-seeded rice; WAW, Wheat after wet direct-seeded rice; WAT, Wheat after transplanted rice. Data are the mean ± standard deviation. Different lowercase letters on the columns indicate significant differences at the 0.05 level for subsequent wheat of the same rice variety in different planting methods in the same year.
The EUE, EP, EPF, and HEPF of wheat after the three rice planting methods were, in descending order, WAD, WAW, and WAT (Table 5). The EUE, EP, EPF, and HEPF of WAD were 7.30, 0.29 kg MJ−1, 6.30 and 962, respectively, which were 15.87, 18.37, 18.87, 15.90 and 5.49%, 6.42, 6.42, 5.48% higher than those after WSR and TPR, respectively (Table 5). The differences between the EUE, EP, EPF, and HEPF of wheat after all three rice planting methods reached significant levels (Table 5).
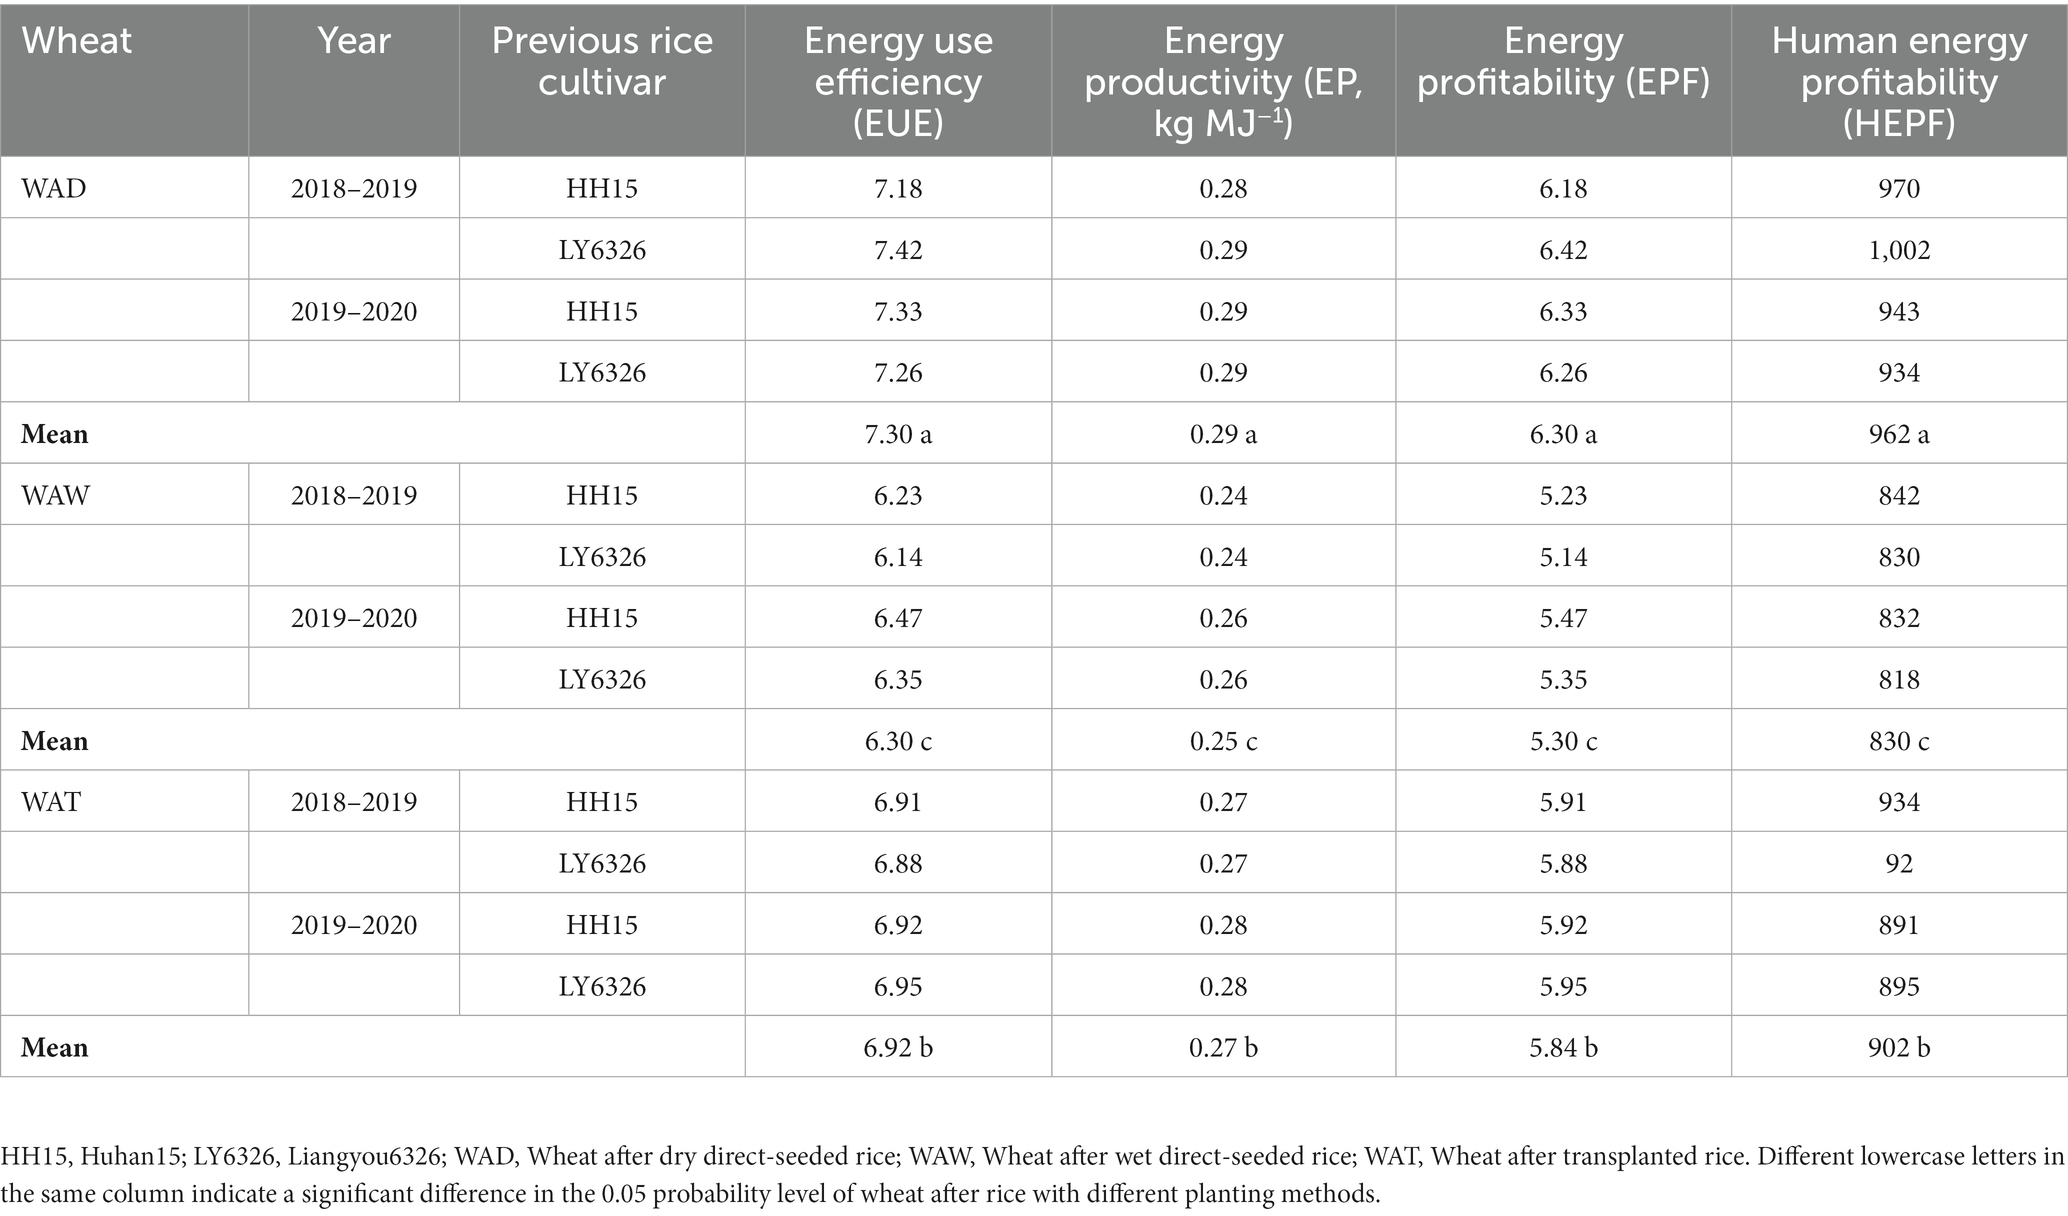
Table 5. Energy use efficiency, energy productivity, energy profitability and human energy profitability of wheat after dry direct-seeded, wet direct-seeded and transplanted rice.
The CF of WAW was higher than that after DSR and TPR (Figure 6). The average CF of WAW for 2 years was 0.47 kg CO2-eq kg−1, which was 14.87 and 9.62% higher than that after DSR and TPR, respectively (Figure 6). The GHGs emitted during wheat production are mainly from the mean inputs of production, accounting for 68.03% of total GHG emissions, and soil emissions account for less than one-third of total GHG emissions (Figure 7). N fertilizer, diesel and wheat seeds are the three components of production that emit the most GHGs, accounting for 37.56, 34.09, and 13.93% of the total GHG emissions of the means of production, respectively, while the remaining means of production emit less than 15% of the total GHG emissions of the means of production (Figure 7).
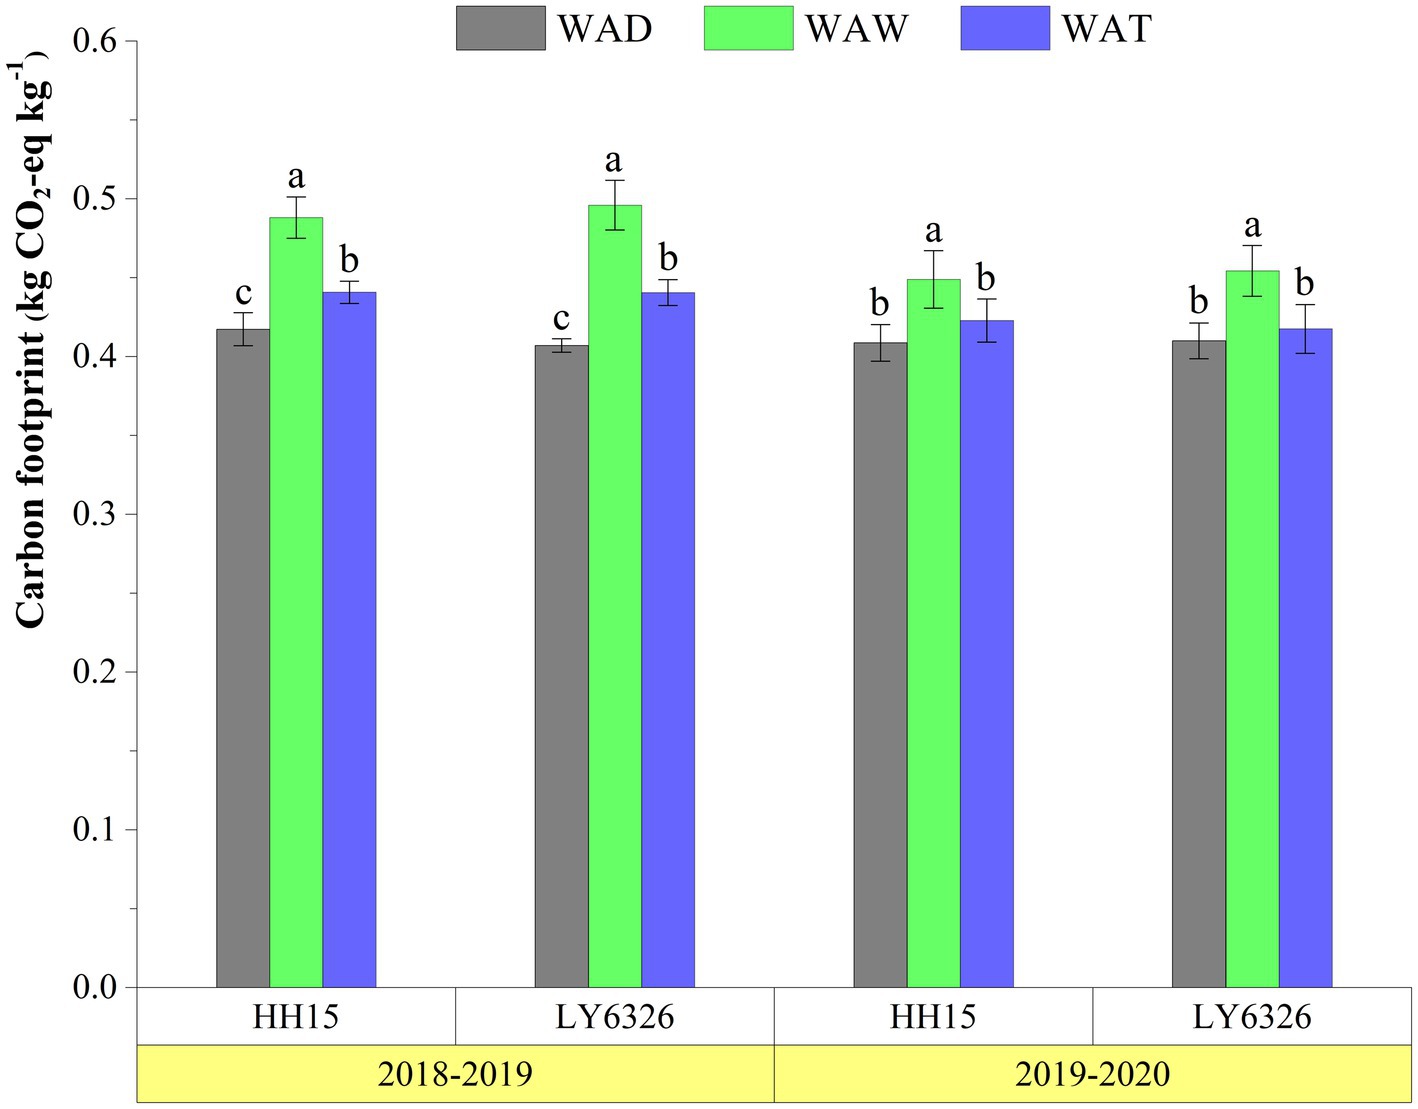
Figure 6. The carbon footprint of wheat after dry direct-seeded, wet direct-seeded and transplanted rice. HH15, Huhan15; LY6326, Liangyou6326; WAD, Wheat after dry direct-seeded rice; WAW, Wheat after wet direct-seeded rice; WAT, Wheat after transplanted rice. Data are the mean ± standard deviation. Different lowercase letters on the columns indicate significant differences at the 0.05 level for subsequent wheat of the same rice variety in different planting methods in the same year.
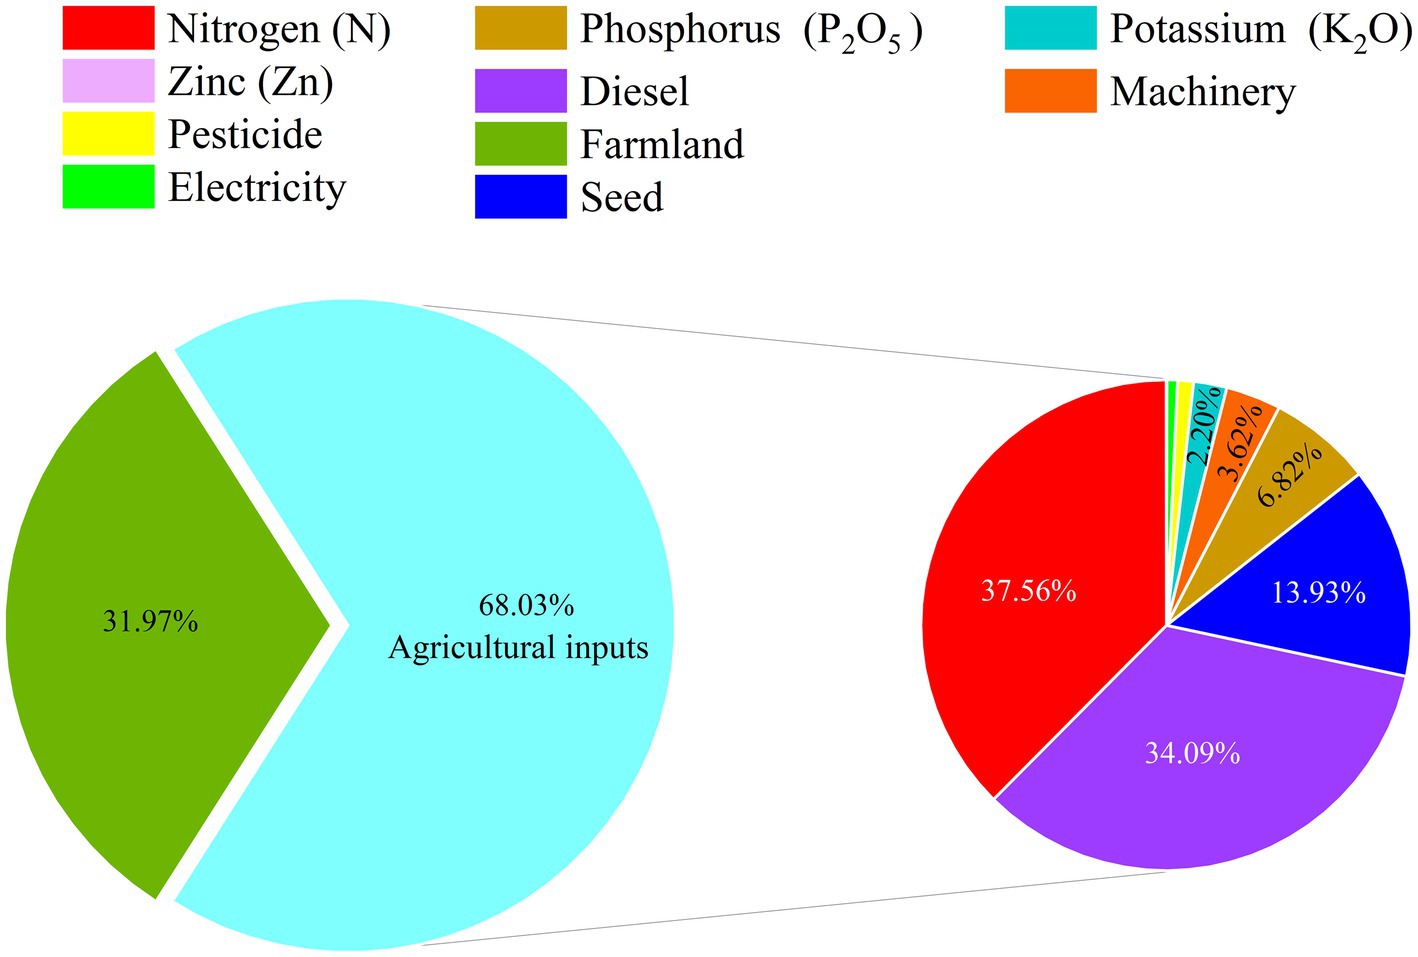
Figure 7. Distribution of greenhouse gas emissions from different sources of wheat production.
Among the wheat after the three rice planting methods, the Co, CE, CSI, and CER were, in descending order, WAD, WAT, and WAW (Table 6). The 2-year average Co, CE, CSI, and CER of WAD were 7,377 kg C ha−1, 11.29, 10.29, and 3.58, respectively, which were 15.70, 15.68, 17.47, 14.74, and 5.33%, 5.32, 5.86, 4.68% higher than those of WAW and WAT, respectively (Table 6).
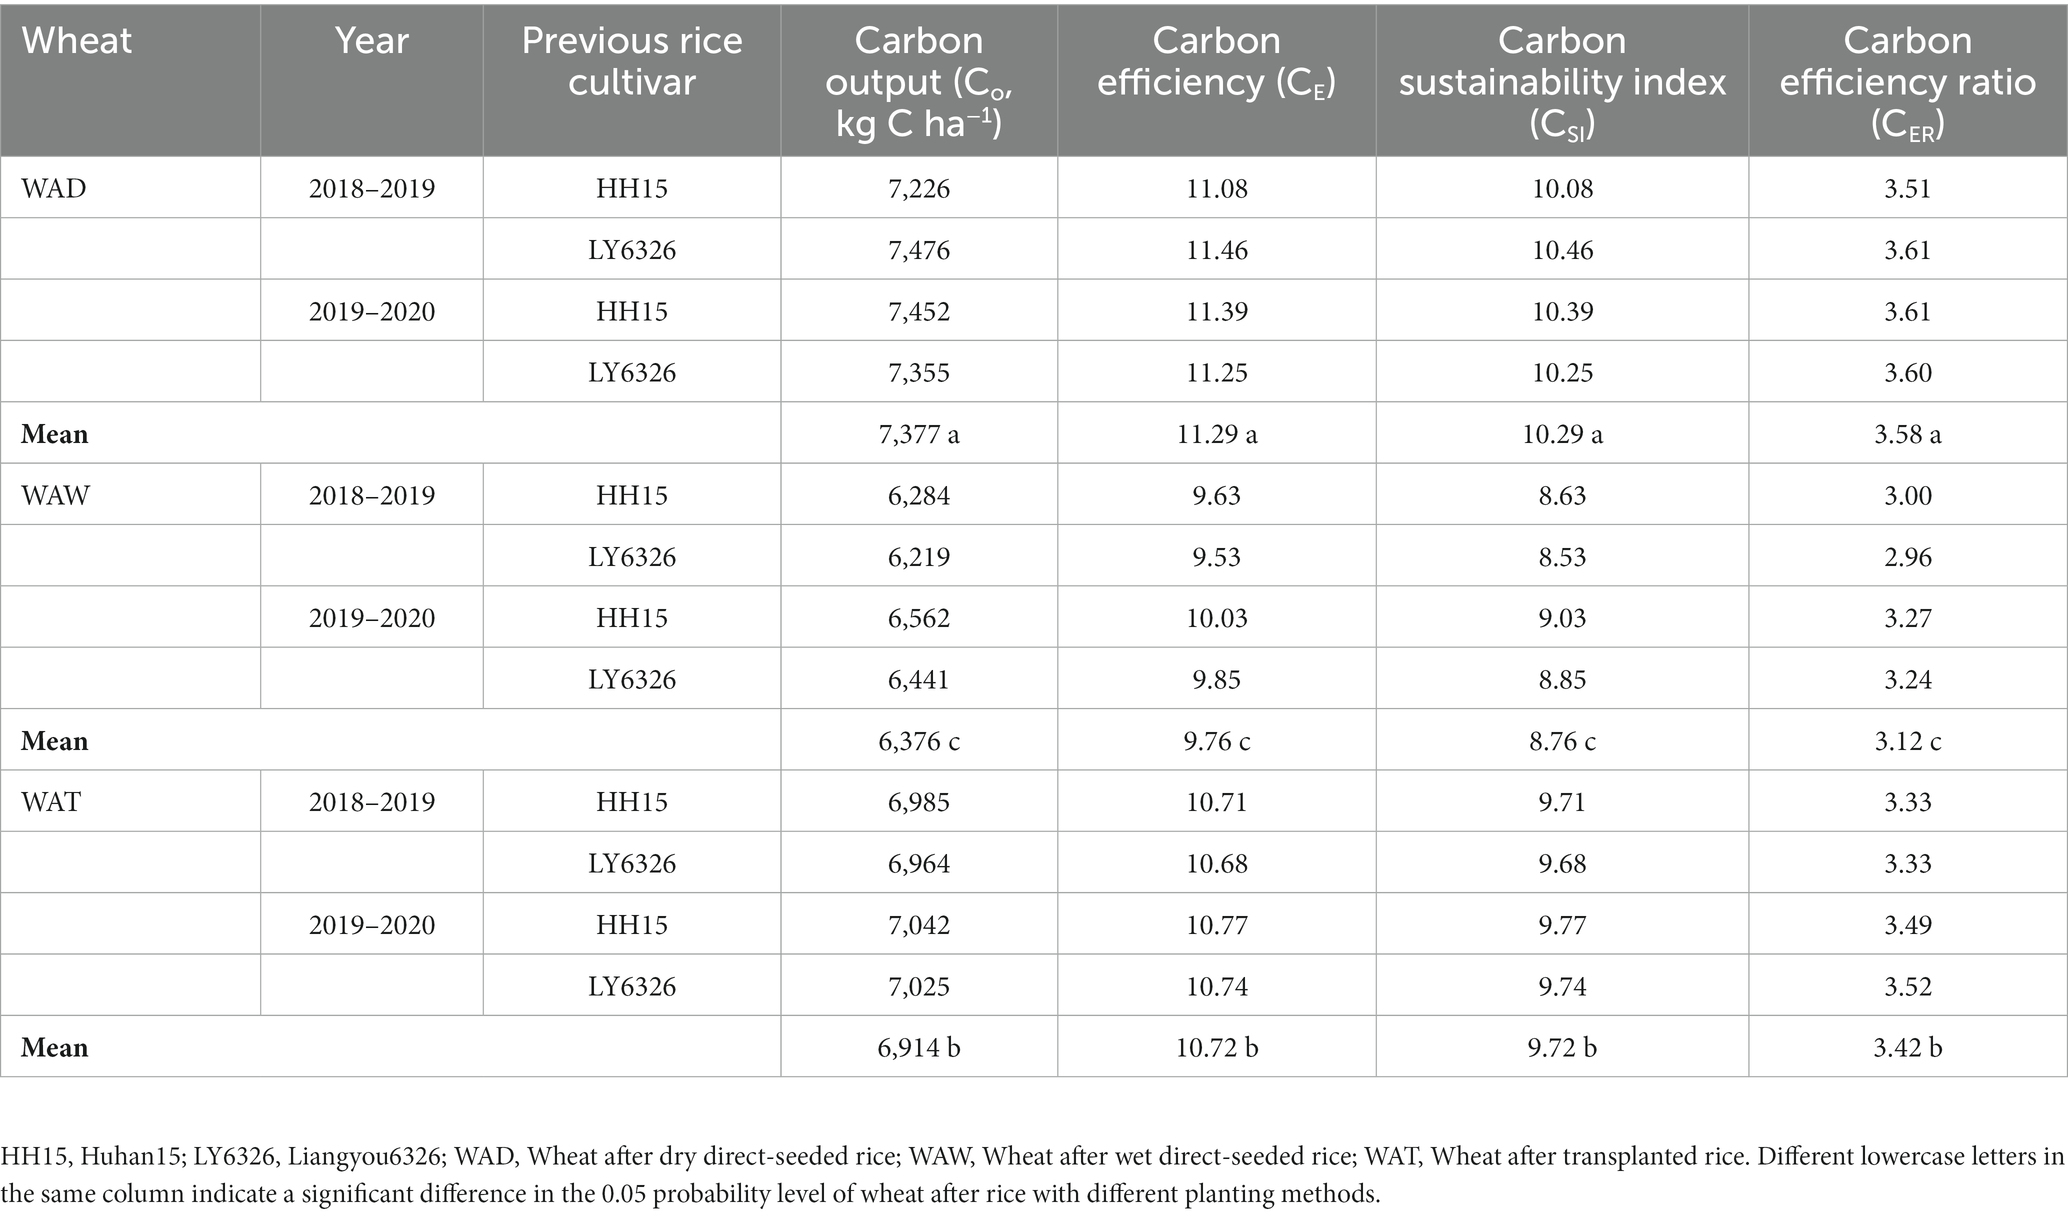
Table 6. Carbon output, carbon efficiency, carbon sustainability index and carbon efficiency ratio of wheat after dry direct-seeded, wet direct-seeded and transplanted rice.
The NEEB of WAD was higher than that after WSR and TPR (Figure 8). The average NEEB of WAD for 2 years was 7,944 CNY ha−1, which was 41.52 and 11.61% higher than that after WSR and TPR, respectively (Figure 8). The NEEB of WAT in both years showed inconsistent performance. The difference in NEEB between WAD and WAT reached a significant level in 2018–2019, while there was no significant difference in NEEB between WAD and WAT in 2019–2020 (Figure 8).

Figure 8. Net ecosystem economic benefits of wheat after dry direct-seeded, wet direct-seeded and transplanted rice. HH15, Huhan15; LY6326, Liangyou6326; WAD, Wheat after dry direct-seeded rice; WAW, Wheat after wet direct-seeded rice; WAT, Wheat after transplanted rice. Data are mean ± standard deviation. Different lowercase letters on the columns indicate significant differences in annual yields at the 0.05 level between different rice-wheat rotation systems containing the same rice variety in the same year.
The yield of WAD was higher than that after WSR and TPR (Figure 1). The long-term flooding during the rice season damaged the soil structure, causing the clay particles in the tillage layer to settle at the bottom of the layer, forming a subsurface compaction layer (Sharma et al., 2003). This layer is detrimental to the growth of wheat roots. At the same time, tillage before planting WSR and TPR destroyed soil aggregates in paddy fields, leading to surface crusting after wheat season rains (Aggarwal et al., 1995). All these factors have negative impacts on the establishment and growth of subsequent wheat, which in turn limit the uptake of water and nutrients by wheat. In addition, rice dry planting promoted the decomposition of soil organic matter and increased the effectiveness of soil nutrients (Patrick et al., 1985). In our study, the grain yield of WAD was 1,090 and 386 kg ha−1 higher than that after WSR and TPR, respectively (Figure 1). In contrast, the tillage intensity was lower in TPR fields was lower than that of WSR fields, and the subsurface compaction layer and the surface crust had less effect on the establishment and growth of wheat. Meanwhile, the residual amount of soil nutrients in TPR fields was bigger than that of direct-seeded rice fields (unpublished). This may have compensated, to some degree, for the negative effects of the subsurface compaction layer and surface crust on wheat growth.
The WF of WAD was lower than that after WSR and TPR (Figure 2). Improving wheat yield and reducing freshwater consumption are two basic ways to reduce the WF of wheat (Zhang et al., 2022). In our study, the WF of WAD was 36 m3 t−1 and 12 m3 t−1 lower than that after WSR and TPR, respectively, just because of its higher yield (Figures 1, 2). However, the yield per unit area of wheat in China currently appears to be near the threshold of yield potential, and it is difficult to reduce the WF of wheat by increasing production (Lobell et al., 2009). Therefore, the key to reducing the WF of rice production in our country in the future is to reduce the consumption of freshwater in wheat production. Studies have found that WFgreen was the most critical component of WFtotal (Han et al., 2018), consistent with our results. Therefore, to decrease freshwater consumption during wheat production, the focus should be on improving the utilization efficiency of green water while reducing the consumption of blue water. It has been reported that straw return reduced water evaporation and surface runoff caused by direct sunlight, and facilitated the improvement of water use efficiency in agricultural production (Jin et al., 2020). Studies have shown that limited irrigation saved 50–75% of irrigation water (Wang et al., 2022), but water expiration at the critical growth stage of wheat caused lower wheat yields (Zhang K. et al., 2016; Zhang X. et al., 2016). Therefore, the effect of irrigation on wheat yield at different growth periods should be focused on in future research to explore water management methods without reducing wheat yield. The WFgray was also an essential component of the WFtotal of wheat, which increased with increasing fertilizer application (Zhuo et al., 2016). Liu et al. (2013) reported that increasing N fertilizer application had diminishing returns on crop yield, and N fertilizer application above the tolerance level of the crop actually resulted in lower yields. In summary, improving water and fertilizer use efficiency to reduce water and fertilizer use are effective ways to reduce the WF of wheat and should be focused on in future research.
The average Ei for wheat production in both years was 29,846 MJ ha−1, higher than the 25,600 MJ ha−1 reported by Safa et al. (2011) (Table 4), which may be influenced by the degree of mechanization in local wheat production. The higher the degree of mechanization is, the higher the fossil fuel consumption and the greater the Ei (Quilty et al., 2014). Fertilizer is a vital component of wheat production with the highest energy consumption, contributing to approximately 48% of the total Ei (Figure 3). N fertilizer is the fertilizer with the highest Ei, accounting for approximately 82.57% of the total Ei of fertilizer used in wheat production (Figure 3), which is consistent with the results obtained by Kazemi et al. (2015). Diesel is the second-highest Ei in wheat production (Figure 3), primarily attributed to the substantial diesel consumption during wheat harvest and tillage (Rabiee et al., 2021). Indirect energy inputs accounted for more than 66% of the total energy inputs in wheat production, significantly higher than the 48% reported by Singh et al. (2019b), mainly attributed to the higher application of N fertilizer in our study. The findings of Safe et al. (2011) were similar to ours. Optimizing the N fertilizer production and management methods is vital to improving energy production efficiency (EPE) in wheat production. Non-renewable energy inputs play a significant role in current agricultural production (Esengun et al., 2007). The average renewable Ei for two years of wheat production was 3,196 MJ ha−1, only 10.71% of the total Ei (Figure 3). N fertilizer and diesel were the two largest non-renewable energy inputs in wheat production, comprising over 79% of the total non-renewable Ei (Figure 4). Therefore, promoting agricultural production technology innovation and increasing the proportion of renewable energy inputs are essential to enhance the long-term sustainability of wheat production.
The total Eo and NE of WAD and WAT were higher than that after WSR (Figure 5). The Eo of wheat production depended on its yield and biomass. In contrast, the NE of wheat depended on its yield and biomass and the Ei in the production process (Arvidsson, 2010). In our study, the highest Eo and NE were found in WAD, 214626 MJ ha−1 and 184,780 MJ ha−1, respectively (Figure 5). Zhao et al. (2007) found that drought rice may achieve higher yields than paddy rice, as long as reasonable water management practices were employed. Therefore, it is feasible to promote DSR-wheat rotation in rice-wheat rotation areas with poor irrigation conditions.
The EPE of WAD was higher than that after WSR and TPR (Table 5). Improving wheat production’s EPE involves lowering the Ei and increasing Eo (Unakıtan and Aydın, 2018). As previously mentioned, N fertilizer and diesel were the two most energy-intensive inputs in wheat production. Currently, N fertilizer is excessively applied in wheat production in China, and the utilization efficiency is about 30% lower than that of developed countries (Yan et al., 2015). Reducing N fertilizer usage is a feasible approach to improve wheat production’s EPE in China. Fossil energy consumption is closely related to the degree of mechanization in agricultural production. Quilty et al. (2014) found that increased mechanization results in higher Ei. As a result, a challenge for agricultural researchers is improving EPE while increasing wheat production mechanization. Overall, reducing N fertilizer use by innovating fertilizer management practices in wheat production is an effective approach for enhancing EPE, which is critical to the long-term sustainability of wheat production.
The CF of WAD was lower and the carbon production efficiency (CPE) was higher than that after WSR and TPR (Figures 6, 7). In our study, the carbon footprints of WAD, WAW, and WAT were 0.41, 0.47, and 0.43 kg CO2-eq kg−1, respectively (Figure 6). Our study found that the carbon footprints of wheat were higher than those reported by Brock et al. (2012) and Biswas et al. (2008), primarily due to the more inputs required in wheat production. However, Kashyap and Agarwal (2021) found that the CF of wheat was 0.83 kg CO2-eq kg−1, which was higher than our findings. This may be attributed to the higher inputs required and the lower wheat production reported in their study. Our study suggests that reducing production inputs and increasing wheat production may decrease the CF of wheat. As previously mentioned, increasing wheat production in China is increasingly difficult (Lobell et al., 2009). Reducing inputs in wheat production is the most realistic and effective way to reduce wheat’s CF. Therefore, reducing inputs in wheat production is the best way to lessen wheat’s CF. N fertilizer and fossil fuel applications are the primary factors affecting GHG emissions from crop production (Robertson et al., 2000). According to Cheng et al. (2014), N fertilizer application accounts for more than 50% of the total GHG emissions from wheat production. Our study found that the production and use of N fertilizer contributed to over 57% of the total GHG emissions from wheat production (Figure 7). As stated earlier, the N fertilizer rate in Chinese wheat production greatly exceeds the requirements, resulting in low N fertilizer use efficiency. Therefore, it is feasible to lower the CF of wheat in China by maintaining the current wheat yield with reduced N fertilizer application. Moreover, China mainly relies on coal as the energy source for N fertilizer production (Zhang et al., 2013), resulting in higher GHG emissions than those of developed countries. Therefore, reducing GHG emissions by improving the N fertilizer production process is an effective way to lower the CF of wheat in China. In summary, improved N fertilizer production and management practices both improve the CPE of wheat while reducing its CF.
The assessment of NEEB is a valuable tool for the integrated evaluation of the economic and ecological benefits of agricultural production, which is mainly affected by agronomic management measures (Liu et al., 2020). The assessment is based on the measurement of yield returns, agricultural inputs, and GWP (Cai et al., 2018). All increasing crop yields and reducing production and GWP costs have been shown to improve NEEB in agricultural production (Zhang et al., 2018). Our results showed that WAD had higher NEEB compared to WAW and WAT (Figure 8). However, currently, Chinese farmers usually prioritize economic benefits over environmental benefits in agricultural production. Many studies have revealed that rain-fed rice yields less compared to flood-irrigated rice (Soni and Soe, 2016; Weller et al., 2016). Therefore, the government could endorse DSR-wheat rotation in rice-wheat rotation production areas by setting up agricultural ecological compensation incentives, thus ensuring food security in China while alleviating negative effects on the ecological environment.
The economic and biological yields of the subsequent wheat were influenced by the planting methods of the previous rice, which in turn affected the WF, CF, EPE, CPE, and NEEB of wheat. The yield of WAD was 14.61 and 4.72% higher than that after WSR and TPR, respectively. In comparison, the water and carbon footprints were 12.93, 12.95 and 4.56%, 4.57% lower than those after WSR and TPR, and its EPE, CPE, and NEEB were higher than those after WSR and TPR. Fertilizer and diesel are the two major contributors to the high Ei and GHG emissions during wheat production. Therefore, improving water and fertilizer use efficiency is critical to reducing water and carbon footprints while increasing energy and carbon production efficiencies in wheat production. Furthermore, current wheat production mainly depends on indirect energy and non-renewable energy inputs. We believe that reducing the use of N fertilizer in wheat production through improved N fertilizer management practices as a means of mitigating the negative impacts of wheat production on the environment. In summary, compared to other planting methods, WAD has higher yields and eco-economic benefits, while emitting fewer negative effects on the environment which make it a more sustainable and productive option. Therefore, we recommend that dry direct-seeded be promoted as the primary rice planting method in rice-wheat rotation production areas. In general, high yields in current Chinese rice-wheat rotation production are achieved through heavy inputs of water and fertilizer, which have adverse effects on the environment. This situation will likely worsen with increasing demand for food. As a result, it is crucial to develop innovative fertilizer production techniques and efficient water and fertilizer management strategies to enhance the sustainability of rice-wheat rotation production, and research in this area should be strengthened in the future.
The raw data supporting the conclusions of this article will be made available by the authors, without undue reservation.
ZJ and LN planned and designed the research. ZJ performed the experiments and wrote the manuscript. LN supervised this work. ZJ, YM, YL, and LN reviewed the manuscript. All authors contributed to the article and approved the submitted version.
This work was supported by the National Natural Science Foundation of China (project nos. 32060430 and 31971840) and the Research Initiation Fund of Hainan University (project no. 944 KYQD(ZR)19104).
The authors declare that the research was conducted in the absence of any commercial or financial relationships that could be construed as a potential conflict of interest.
All claims expressed in this article are solely those of the authors and do not necessarily represent those of their affiliated organizations, or those of the publisher, the editors and the reviewers. Any product that may be evaluated in this article, or claim that may be made by its manufacturer, is not guaranteed or endorsed by the publisher.
Aggarwal, G. C., Sidhu, A. S., Sekhon, N. K., Sandhu, K. S., and Sur, H. S. (1995). Puddling and N management effects on crop response in a rice-wheat cropping system. Soil. Till. Res. 36, 129–139. doi: 10.1016/0167-1987(95)00504-8
AghaAlikhani, M., Kazemi-Poshtmasari, H., and Habibzadeh, F. (2013). Energy use pattern in rice production: a case study from Mazandaran province. Iran. Energ. Convers. Manage. 69, 157–162. doi: 10.1016/j.enconman.2013.01.034
Arvidsson, J. (2010). Energy use efficiency in different tillage systems for winter wheat on a clay and silt loam in Sweden. Eur. J. Agron. 33, 250–256. doi: 10.1016/j.eja.2010.06.003
Biswas, W. K., Barton, L., and Carter, D. (2008). Global warming potential of wheat production in Western Australia: a life cycle assessment. Water. Environ. J. 22, 206–216. doi: 10.1111/j.1747-6593.2008.00127.x
Braun, H. J. , Atlin, G., and Payne, T. (2010). “Multi-location testing as a tool to identify plant response to global climate change,” in Climate change and crop production. ed. M. P. Reynolds (Wallingford: CABI), 1157–138.
Brock, P., Madden, P., Schwenke, G., and Herridge, D. (2012). Greenhouse gas emissions profile for 1 tonne of wheat produced in central zone (east) New South Wales: a life cycle assessment approach. Crop Pasture Sci. 63, 319–329. doi: 10.1071/CP11191
Cai, S., Pittelkow, C. M., Zhao, X., and Wang, S. (2018). Winter legume-rice rotations can reduce nitrogen pollution and carbon footprint while maintaining net ecosystem economic benefits. J. Clean. Prod. 195, 289–300. doi: 10.1016/j.jclepro.2018.05.115
Carbonnews . (2020). Available at: http://www.carbonnews.co.nz/default.asp [Accessed October 1, 2022].
Castellanos, M. T., Cartagena, M. C., Requejo, M. I., Arce, A., Cabello, M. J., Ribas, F., et al. (2016). Agronomic concepts in water footprint assessment: a case of study in a fertirrigated melon crop under semiarid conditions. Agr. Water. Manage. 170, 81–90. doi: 10.1016/j.agwat.2016.01.014
Chaudhary, V. P., Singh, K. K., Pratibha, G., Bhattacharyya, R., Shamim, M., Srinivas, I., et al. (2017). Energy conservation and greenhouse gas mitigation under different production systems in rice cultivation. Energy 130, 307–317. doi: 10.1016/j.energy.2017.04.131
Cha-un, N., Chidthaisong, A., Yagi, K., Sudo, S., and Towprayoon, S. (2017). Greenhouse gas emissions, soil carbon sequestration and crop yields in a rain-fed rice field with crop rotation management. Agric. Ecosyst. Environ. 237, 109–120. doi: 10.1016/j.agee.2016.12.025
Chen, Z., Xu, C., Ji, L., Feng, J., Li, F., Zhou, X., et al. (2020). Effects of multi-cropping system on temporal and spatial distribution of carbon and nitrogen footprint of major crops in China. Glob. Ecol. Conserv. 22:e00895. doi: 10.1016/j.gecco.2019.e00895
Cheng, K., Ogle, S. M., Parton, W. J., and Pan, G. (2014). Simulating greenhouse gas mitigation potentials for Chinese croplands using the DAYCENT ecosystem model. Glob. Chang. Biol. 20, 948–962. doi: 10.1111/gcb.12368
China’s Electricity Yearbook Committee . China’s electricity yearbook. (2015). Available at: https://data.cnki.net/trade/Yearbook/Single/N2016060076?z=Z025
Choudhary, M., Panday, S. C., Meena, V. S., Singh, S., Yadav, R. P., Pattanayak, A., et al. (2020). Long-term tillage and irrigation management practices: strategies to enhance crop and water productivity under rice-wheat rotation of Indian mid-Himalayan region. Agr. Water. Manage. 232:106067. doi: 10.1016/j.agwat.2020.106067
Eskandari, H., and Attar, S. (2015). Energy comparison of two rice cultivation systems. Renew. Sust. Energ. Rev. 42, 666–671. doi: 10.1016/j.rser.2014.10.050
Esengun, K., Gündüz, O., and Erdal, G. (2007). Input-output energy analysis in dry apricot production of Turkey. Energ. Convers. Manage. 48, 592–598. doi: 10.1016/j.enconman.2006.06.006
Ghorbani, R., Mondani, F., Amirmoradi, S., Feizi, H., Khorramdel, S., Teimouri, M., et al. (2011). A case study of energy use and economical analysis of irrigated and dryland wheat production systems. Appl. Energ. 88, 283–288. doi: 10.1016/j.apenergy.2010.04.028
Gunady, M. G. A., Biswas, W., Solah, V. A., and James, A. P. (2012). Evaluating the global warming potential of the fresh produce supply chain for strawberries, romaine/cos lettuces (Lactuca sativa), and button mushrooms (Agaricus bisporus) in Western Australia using life cycle assessment (LCA). J. Clean. Prod. 28, 81–87. doi: 10.1016/j.jclepro.2011.12.031
Han, Y., Jia, D., Zhuo, L., Sauvage, S., Sánchez-Pérez, J. M., Huang, H., et al. (2018). Assessing the water footprint of wheat and maize in Haihe River basin, northern China (1956-2015). Water 10:867. doi: 10.3390/w10070867
Harrison, M. T., Cullen, B. R., Mayberry, D. E., Cowie, A. L., Bilotto, F., Badgery, W. B., et al. (2021). Carbon myopia: the urgent need for integrated social, economic and environmental action in the livestock sector. Glob. Chang. Biol. 27, 5726–5761. doi: 10.1111/gcb.15816
Hoekstra, A.Y., Chapagain, A.K., Aldaya, M.M., and Mekonnen, M. (2011). The water footprint assessment manual: Setting the global standard, 1, Water Footprint Network. Earthscan. London.
Huang, X., Chen, C., Qian, H., Chen, M., Deng, A., Zhang, J., et al. (2017). Quantification for carbon footprint of agricultural inputs of grains cultivation in China since 1978. J. Clean. Prod. 142, 1629–1637. doi: 10.1016/j.jclepro.2016.11.131
IPCC . (2006).Guidelines for National Greenhouse Gas Inventories. Japan:Institute for Global Environmental Strategies.
Jat, S. L., Parihar, C. M., Singh, A. K., Kumar, B., Choudhary, M., Nayak, H. S., et al. (2019). Energy auditing and carbon footprint under long-term conservation agriculture-based intensive maize systems with diverse inorganic nitrogen management options. Sci. Total Environ. 664, 659–668. doi: 10.1016/j.scitotenv.2019.01.425
Jin, Z., Liao, W., Mu, Y., Li, Y., and Nie, L. (2023). Integrated assessment of water footprint and energy production efficiency in different rice-rape rotation systems. Energy 266:126535. doi: 10.1016/j.energy.2022.126535
Jin, Z., Shah, T., Zhang, L., Liu, H., Peng, S., and Nie, L. (2020). Effect of straw returning on soil organic carbon in rice-wheat rotation system: a review. Food. Energy. Secur. 9:e200. doi: 10.1002/fes3.200
Jin, Z., Zhang, L., Liu, H., and Nie, L. (2021). Energy assessment of different rice-wheat rotation systems. Food. Energy. Secur. 10:e284. doi: 10.1002/fes3.284
Kashyap, D., and Agarwal, T. (2021). Carbon footprint and water footprint of rice and wheat production in Punjab India. Agric. Syst. 186:102959. doi: 10.1016/j.agsy.2020.102959
Kazemi, H., Kamkar, B., Lakzaei, S., Badsar, M., and Shahbyki, M. (2015). Energy flow analysis for rice production in different geographical regions of Iran. Energy 84, 390–396. doi: 10.1016/j.energy.2015.03.005
Lal, R. (2004). Carbon emission from farm operations. Environ. Int. 30, 981–990. doi: 10.1016/j.envint.2004.03.005
Li, Y., Ai, Z., Mu, Y., Zhao, T., Zhang, Y., Li, L., et al. (2023). Rice yield penalty and quality deterioration is associated with failure of nitrogen uptake from regreening to panicle initiation stage under salinity. Front. Plant Sci. 14:1120755. doi: 10.3389/fpls.2023.1120755
Li, S., Guo, L., Cao, C., and Li, C. (2021). Effects of straw returning levels on carbon footprint and net ecosystem economic benefits from rice-wheat rotation in Central China. Environ. Sci. Pollut. R. 28, 5742–5754. doi: 10.1007/s11356-020-10914-w
Li, H., Qin, L., and He, H. (2018). Characteristics of the water footprint of rice production under different rainfall years in Jilin Province, China. J. Sci. Food Agr. 98, 3001–3013. doi: 10.1002/jsfa.8799
Liu, T. Q., Li, S. H., Guo, L. G., Cao, C. G., Li, C. F., Zhai, Z. B., et al. (2020). Advantages of nitrogen fertilizer deep placement in greenhouse gas emissions and net ecosystem economic benefits from no-tillage paddy fields. J. Clean. Prod. 263:121322. doi: 10.1016/j.jclepro.2020.121322
Liu, X., Zhang, Y., Han, W., Tang, A., Shen, J., Cui, Z., et al. (2013). Enhanced nitrogen deposition over China. Nature 494, 459–462. doi: 10.1038/nature11917
Lobell, D. B., Cassman, K. G., and Field, C. B. (2009). Crop yield gaps: their importance, magnitudes, and causes. Annu. Rev. Environ. Resour. 34, 179–204. doi: 10.1146/annurev.environ.041008.093740
Mobtaker, H. G., Keyhani, A., Mohammadi, A., Rafiee, S., and Akram, A. (2010). Sensitivity analysis of energy inputs for barley production in Hamedan Province of Iran. Agric. Ecosyst. Environ. 137, 367–372. doi: 10.1016/j.agee.2010.03.011
Mohammadi, A., Tabatabaeefar, A., Shahin, S., Rafiee, S., and Keyhani, A. (2008). Energy use and economical analysis of potato production in Iran a case study: Ardabil province. Energ. Convers. Manage. 49, 3566–3570. doi: 10.1016/j.enconman.2008.07.003
Mullick, M. R. A., and Das, N. (2021). Estimation of the spatial and temporal water footprint of rice production in Bangladesh. Sustain. Prod. Consump. 25, 511–524. doi: 10.1016/j.spc.2020.12.002
Nguyen, V. H., Sander, B. O., Quilty, J., Balingbing, C. A., Castalone, A. G., Romasanta, R., et al. (2019). An assessment of irrigated rice production energy efficiency and environmental footprint with in-field and off-field rice straw management practices. Sci. Rep. 9:16887. doi: 10.1038/s41598-019-53072-x
Nishimura, S., Yonemura, S., Sawamoto, T., Shirato, Y., Akiyama, H., Sudo, S., et al. (2008). Effect of land use change from paddy rice cultivation to upland crop cultivation on soil carbon budget of a cropland in Japan. Agr. Ecosyst. Environ. 125, 9–20. doi: 10.1016/j.agee.2007.11.003
Pathak, B. S., and Bining, A. S. (1985). Energy use pattern and potential for energy saving in rice-wheat cultivation. Energ. Agr. 4, 271–278. doi: 10.1016/0167-5826(85)90022-1
Patrick, W. H., Mikkelsen, D. S., and Wells, B. R. (1985). “Plant nutrient behavior in flooded soil” in Fertilizer technology and use. ed. O. P. Engelstad (Madison: Soil Science Society of America), 197–228.
Pirdashti, H., Pirdashti, M., Mohammadi, M., Baigi, M. G., and Movagharnejad, K. (2015). Efficient use of energy through organic rice-duck mutualism system. Agron. Sustain. Dev. 35, 1489–1497. doi: 10.1007/s13593-015-0311-4
Qi, J. Y., Yang, S. T., Xue, J., Liu, C. X., Du, T. Q., Hao, J. P., et al. (2018). Response of carbon footprint of spring maize production to cultivation patterns in the loess plateau, China. J. Clean. Prod. 187, 525–536. doi: 10.1016/j.jclepro.2018.02.184
Quilty, J. R., McKinley, J., Pede, V. O., Buresh, R. J., Correa, T. Q. Jr., and Sandro, J. M. (2014). Energy efficiency of rice production in farmers’ fields and intensively cropped research fields in the Philippines. Field Crop Res. 168, 8–18. doi: 10.1016/j.fcr.2014.08.001
Rabiee, M., Majidian, M., Alizadeh, M. R., and Kavoosi, M. (2021). Evaluation of energy use efficiency and greenhouse gas emission in rapeseed (Brassica napus L.) production in paddy fields of Guilan province of Iran. Energy 217:119411. doi: 10.1016/j.energy.2020.119411
Rahman, S., and Hasan, M. K. (2014). Energy productivity and efficiency of wheat farming in Bangladesh. Energy 66, 107–114. doi: 10.1016/j.energy.2013.12.070
Robertson, G. P., Paul, E. A., and Harwood, R. R. (2000). Greenhouse gases in intensive agriculture: contributions of individual gases to the radiative forcing of the atmosphere. Science 289, 1922–1925. doi: 10.1126/science.289.5486.1922
Royan, M., Khojastehpour, M., Emadi, B., and Mobtaker, H. G. (2012). Investigation of energy inputs for peach production using sensitivity analysis in Iran. Energ. Convers. Manage. 64, 441–446. doi: 10.1016/j.enconman.2012.07.002
Safa, M., Samarasinghe, S., and Mohssen, M. (2011). A field study of energy consumption in wheat production in Canterbury, New Zealand. Energ. Convers. Manage. 52, 2526–2532. doi: 10.1016/j.enconman.2011.01.004
Sharma, P. K., Ladha, J. K., and Bhushan, L. (2003). “Soil physical effects of puddling in rice-wheat cropping systems” in Improving the productivity and sustainability of rice-wheat systems: Issues and impacts. eds. J. K. Ladha, J. E. Hill, J. M. Duxbury, R. K. Gupta, and R. J. Buresh (Madison: ASA special publication), 97–113.
Singh, K., Prakash, V., Srinivas, K., and Srivastva, A. (2008). Effect of tillage management on energy-use efficiency and economics of soybean (Glycine max) based cropping systems under the rainfed conditions in north-West Himalayan region. Soil. Till. Res. 100, 78–82. doi: 10.1016/j.still.2008.04.011
Singh, H., Singh, A. K., Kushwaha, H. L., and Singh, A. (2007). Energy consumption pattern of wheat production in India. Energy 32, 1848–1854. doi: 10.1016/j.energy.2007.03.001
Singh, P., Singh, G., and Sodhi, G. P. S. (2019a). Energy auditing and optimization approach for improving energy efficiency of rice cultivation in South-Western Punjab, India. Energy 174, 269–279. doi: 10.1016/j.energy.2019.02.169
Singh, P., Singh, G., and Sodhi, G. P. S. (2019b). Applying DEA optimization approach for energy auditing in wheat cultivation under rice-wheat and cotton-wheat cropping systems in North-Western India. Energy 181, 18–28. doi: 10.1016/j.energy.2019.05.147
Song, K., Zhang, G., Yu, H., Huang, Q., Zhu, X., Wang, T., et al. (2021). Evaluation of methane and nitrous oxide emissions in a three-year case study on single rice and ratoon rice paddy fields. J. Clean. Prod. 297:126650. doi: 10.1016/j.jclepro.2021.126650
Soni, P., and Soe, M. N. (2016). Energy balance and energy economic analyses of rice production systems in Ayeyarwaddy region of Myanmar. Energ. Effic. 9, 223–237. doi: 10.1007/s12053-015-9359-x
Strapatsa, A. V., Nanos, G. D., and Tsatsarelis, C. A. (2006). Energy flow for integrated apple production in Greece. Agric. Ecosyst. Environ. 116, 176–180. doi: 10.1016/j.agee.2006.02.003
Sun, M., Zhan, M., Zhao, M., Tang, L. L., Qin, M. G., Cao, C. G., et al. (2019). Maize and rice double cropping benefits carbon footprint and soil carbon budget in paddy field. Field Crop Res. 243:107620. doi: 10.1016/j.fcr.2019.107620
Unakıtan, G., and Aydın, B. (2018). A comparison of energy use efficiency and economic analysis of wheat and sunflower production in Turkey: a case study in Thrace region. Energy 149, 279–285. doi: 10.1016/j.energy.2018.02.033
Wang, X., Jia, R., Zhao, J., Yang, Y., Zang, H., Zeng, Z., et al. (2022). Quantifying water footprint of winter wheat-summer maize cropping system under manure application and limited irrigation: An integrated approach. Resour. Conserv. Recy. 183:106375. doi: 10.1016/j.resconrec.2022.106375
Weller, S., Janz, B., Jörg, L., Kraus, D., Racela, H. S. U., Wassmann, R., et al. (2016). Greenhouse gas emissions and global warming potential of traditional and diversified tropical rice rotation systems. Glob. Chang. Biol. 22, 432–448. doi: 10.1111/gcb.13099
West, T. O., and Marland, G. (2002). A synthesis of carbon sequestration, carbon emissions, and net carbon flux in agriculture: comparing tillage practices in the United States. Agric. Ecosyst. Environ. 91, 217–232. doi: 10.1016/S0167-8809(01)00233-X
Yan, M., Cheng, K., Luo, T., Yan, Y., Pan, G., and Rees, R. M. (2015). Carbon footprint of grain crop production in China-based on farm survey data. J. Clean. Prod. 104, 130–138. doi: 10.1016/j.jclepro.2015.05.058
Yuan, S., and Peng, S. (2017). Input-output energy analysis of rice production in different crop management practices in Central China. Energy 141, 1124–1132. doi: 10.1016/j.energy.2017.10.007
Yuan, S., Peng, S., Wang, D., and Man, J. (2018). Evaluation of the energy budget and energy use efficiency in wheat production under various crop management practices in China. Energy 160, 184–191. doi: 10.1016/j.energy.2018.07.006
Zhai, Y., Tan, X., Ma, X., An, M., Zhao, Q., Shen, X., et al. (2019). Water footprint analysis of wheat production. Ecol. Indic. 102, 95–102. doi: 10.1016/j.ecolind.2019.02.036
Zhang, W., Dou, Z., He, P., Ju, X. T., Powlson, D., Chadwick, D., et al. (2013). New technologies reduce greenhouse gas emissions from nitrogenous fertilizer in China. Proc. Natl. Acad. Sci. U. S. A. 110, 8375–8380. doi: 10.1073/pnas.1210447110
Zhang, Z. S., Guo, L. J., Liu, T. Q., Li, C. F., and Cao, C. G. (2015). Effects of tillage practices and straw returning methods on greenhouse gas emissions and net ecosystem economic budget in rice-wheat cropping systems in Central China. Atmos. Environ. 122, 636–644. doi: 10.1016/j.atmosenv.2015.09.065
Zhang, D., Li, D., Li, H., Wang, H., Liu, J., Ju, H., et al. (2022). Strategies to reduce crop water footprint in intensive wheat-maize rotations in North China plain. Agron. J. 12:357. doi: 10.3390/agronomy12020357
Zhang, G., Ma, J., Yang, Y., Yu, H., Song, K., Dong, Y., et al. (2018). Achieving low methane and nitrous oxide emissions with high economic incomes in a rice-based cropping system. Agric. For. Meteorol. 259, 95–106. doi: 10.1016/j.agrformet.2018.04.011
Zhang, X., Xu, X., Liu, Y., Wang, J., and Xiong, Z. (2016). Global warming potential and greenhouse gas intensity in rice agriculture driven by high yields and nitrogen use efficiency. Biogeosciences 13, 2701–2714. doi: 10.5194/bg-13-2701-2016
Zhang, K., Zeng, Z., Zhao, J., Wang, X., Zhou, J., Xu, H., et al. (2016). Impact analysis of reduce the extraction of groundwater on wheat production in North China plain. J. Agric. Sci. Technol. 18, 111–117. doi: 10.13304/j.nykjdb.2016.054
Zhao, C., Jiang, H., Ren, C., Yin, Y., and Li, Y. (2007). Studies on key techniques of sowing rice directly on dry land for high yield and high efficiency. J. Jilin. Agr. Sci. 32, 9–11. doi: 10.16423/j.cnki.1003-8701.2007.04.008
Keywords: direct-seeded rice, wheat, footprint, energy, production efficiency, net ecosystem economic benefits
Citation: Jin Z, Mu Y, Li Y and Nie L (2023) Effect of different rice planting methods on the water, energy and carbon footprints of subsequent wheat. Front. Sustain. Food Syst. 7:1173916. doi: 10.3389/fsufs.2023.1173916
Edited by:
Dipayan Sarkar, United States Department of Agriculture, United StatesReviewed by:
Amritbir Riar, Research Institute of Organic Agriculture (FiBL), SwitzerlandCopyright © 2023 Jin, Mu, Li and Nie. This is an open-access article distributed under the terms of the Creative Commons Attribution License (CC BY). The use, distribution or reproduction in other forums is permitted, provided the original author(s) and the copyright owner(s) are credited and that the original publication in this journal is cited, in accordance with accepted academic practice. No use, distribution or reproduction is permitted which does not comply with these terms.
*Correspondence: Lixiao Nie, bHhuaWVAaGFpbmFudS5lZHUuY24=
Disclaimer: All claims expressed in this article are solely those of the authors and do not necessarily represent those of their affiliated organizations, or those of the publisher, the editors and the reviewers. Any product that may be evaluated in this article or claim that may be made by its manufacturer is not guaranteed or endorsed by the publisher.
Research integrity at Frontiers
Learn more about the work of our research integrity team to safeguard the quality of each article we publish.