 Jing Wang
 Mingfei Liu*
95% of researchers rate our articles as excellent or good
Learn more about the work of our research integrity team to safeguard the quality of each article we publish.
Find out more
ORIGINAL RESEARCH article
Front. Sustain. Food Syst. , 07 September 2023
Sec. Nutrition and Sustainable Diets
Volume 7 - 2023 | https://doi.org/10.3389/fsufs.2023.1166395
This article is part of the Research Topic Agri-food Innovations in the Quest for Food and Environmental Security View all 6 articles
Introduction: Natural disasters and the COVID-19 epidemic have caused serious consequences such as long-term disruption and chain reaction to the global supply chain. Global warming caused by a large number of greenhouse gases has accelerated the attention of society to environmental sustainability. Therefore, identifying the transmission path of the factors that affect the green supply chain resilience of agricultural products is the primary task to accelerate the construction of a modern circulation system of agricultural products, ensure market supply and protect the environment.
Methods: Based on the stakeholder theory, this study uses the literature research method to identify 15 factors that affect the green supply chain resilience of agricultural products. Through improving DEMATEL and ISM to study the internal relationship between the influencing factors, build a multi-level hierarchical structure model, and identify the basic transmission process and path of the influencing factors.
Results: The results show that the government’s issuance of environmental policies and the provision of financial subsidies are important driving forces to strengthen the green supply chain resilience of agricultural products; The collaboration capability and business sustainability goals directly affect the green supply chain resilience of agricultural products; Agility, digital infrastructure construction, sustainability beliefs of top managers, public opinion with environment information disclosure and other factors indirectly affect the green supply chain resilience of agricultural products.
Discussion: The conclusion shows that the most important way to guide the green supply chain of agricultural products to develop towards standardization, normalization and sustainability is to guide the organization to set business sustainable goals and strengthen the collaborative cooperation ability of all stakeholders in the supply chain, with the government issuing environmental policies and providing financial subsidies as the driving factors. This study can provide theoretical basis for the government and enterprises to strengthen the green supply chain resilience of agricultural products.
Since 2022, climate change has led to the increase of extreme weather, the shortage of nitrogen, phosphorus and potassium fertilizers caused by the conflict between Russia and Ukraine, and the supply chain disruption caused by the COVID-19, warning the vulnerability of the global food supply system. According to State Information Center (In China), China's supply chain breaking accidents cause about 12 million tons of fruit and 130 million tons of vegetables to be wasted every year, resulting in economic losses of more than 100 billion yuan.1 Behind this is the problem of the resilience of the agricultural product supply chain. The perishable and difficult to store characteristics of agricultural products not only bring huge economic losses to the agricultural industry, but also cause great pollution and damage to the air and ecological environment by methane and other gasses generated by decay. In the face of the deteriorating ecological environment, the public has expressed strong concern about it (Xia et al., 2022). Consumers, governments and enterprises have formed green thinking in the supply chain (Ayyildiz, 2021). Organizations are facing increasing pressure from stakeholders and are incorporating environmental sustainability measures into their supply chain management practices (Fahimnia et al., 2018). Therefore, it is necessary to study the green supply chain resilience of agricultural products (APGSCR) in this paper.
Green practice is a basic component of green supply chain management (Sarkis, 2003) but due to organizational objectives, resilience must be considered when formulating environmental sustainability strategies (Mohammed, 2020), because resilience will improve the stability of the supply chain (Rajesh, 2021). Scholars often use resilience to measure the sustainable state of the supply chain after being impacted. Christopher (2012) defined supply chain resilience (SCR) as “the ability of the supply chain system to recover to its original state or better state after interruption” (Sarkis, 2003). Cabral et al. (2012) proposed the Lean, Agile, Resilient and Green (LARG) paradigm as early as 2012. The existing literature extensively discussed the visibility (Kochan and Nowicki, 2018), inter-organizational knowledge sharing ability (Zhao et al., 2017), supply chain collaboration (Christopher, 2012), supply chain risk management culture (Zhao and Huchzermeier, 2018) and flexibility (Smith et al., 2015). However, many scholars are limited to selecting several secondary influencing factors to analyze SCR. Few scholars systematically summarize these influencing factors into a complete system to explore which are the key factors and whether there is a causal relationship between the factors. Globalization and the increase of environmental standards and regulations of governments and non-governmental organizations require that suppliers must have strong technical capabilities to ensure quality standards and reduce risks (Malek et al., 2017). However, the high cost of adopting green technologies has hindered the process of enterprises to develop green supply chains. Although some scholars have studied that government subsidies for green products with environmental attributes can promote enterprises' adoption of green technologies and their consumption in the end market (Cohen et al., 2016), they have not put forward a clear evaluation dimension, so the research on the factors affecting APGSCR is still an outstanding issue.
In the past few years, the author found that most of the evaluation indicators of SCR by domestic and foreign scholars are based on the time sequence before, during and after the supply chain interruption, and discussed around the four dimensions of “prediction, response, adaptation and recovery”. Based on this, this paper expands the new dimension of sustainability and summarizes a complete set of evaluation index system on the basis of the proposed evaluation index system of supply chain resilience factors. Integrate the “DEMATEL-ISM” model, use Gray to process first-hand data, use DEMATEL to analyze the importance and causal relationship of various influencing factors, build a multi-level hierarchical structure model by ISM, analyze the hierarchical relationship between various factors, and deeply explore the impact mechanism of the factors affecting APGSCR, so as to provide an important theoretical basis for the sustainable development of the green supply chain of agricultural products.
In the past few years, many scholars have studied the resilience of the supply chain to formulate supply chain management strategies. The authors find that most of the evaluation indicators of the influencing factors of SCR by domestic and foreign scholars are based on the time sequence before, during and after the interruption of the supply chain, focusing on the four dimensions of “prediction, response, adaptation and recovery,” so as to build a more resilient supply chain. Therefore, based on the improvement of the existing indicator system of “prediction, response, adaptation and recovery,” this study expanded the dimension of “sustainability.” A total of 188 articles were retrieved from Bing Academic, Google Academic, Web of Science and other databases. After screening these articles using the framework of “prediction, response, adaptation, recovery and sustainability,” with only 48 articles remained, among which 15 influencing factors were identified. In this section, a brief overview will be given.
Today, supply chains are becoming more complex, as well as more vulnerable to disruption, as they operate at high speeds in the global marketplace and as markets continue to change, increasing demand volatility (Cardoso et al., 2015). Therefore, in today's unstable business environment, an organization's awareness of risk perception is very important (Zhao et al., 2017). Agricultural products are easy to corruption, difficult to store and strong cyclical products. The higher the accuracy of enterprises in predicting demand and risk, the more conducive to improving the resilience of agricultural supply chain (Zhao et al., 2017). And through creating a risk management culture in the organization, the resilience of the supply chain will be enhanced, which has an important impact on organizational survival in supply chain disruptions (Christopher and Peck, 2004). In the era of globalization where organizations are vulnerable, information processing capabilities play an important role in reducing risk to address supply chain disruptions (Fan et al., 2016), and the level of information technology in enterprises, cooperatives and farmers plays a key role in the accuracy, timeliness and effectiveness of forecasts, which can be assessed in terms of both the efficiency of organizational information exchange and the construction of exchange platforms. Therefore, improving the level of organizational informationize, grasping and controlling information connectivity, resource availability and traceability (Dubey et al., 2019) can largely avoid and reduce the impact on the supply chain when risks occur, and improve the resilience of the supply chain. Therefore, under the predictive capability dimension, the organization's risk awareness and information technology level are conducive to improving APGSCR.
The characteristics of agricultural products requires that the quality of the product is maintained at all times throughout the entire process from where it is produced to the end customer. A high level of collaboration between agricultural supply chain entities is therefore necessary (Rajesh and Ravi, 2015), and collaboration can reduce uncertainty by allocating risk, such as IKEA's requirement that its suppliers maintain an environmentally friendly attitude, integrated with IKEA's environmental strategy (Bian, 2011). Thus information sharing, collaborative communication, mutually created knowledge play an important role in improving the APGSCR (Thomas and Mahanty, 2018). When risk occurs, Soni et al. (2014) identified agility as one of the most important factors of SCR. Agility in terms of supply chains can be defined as the ability of supply chain managers to quickly and efficiently reconfigure their internal supply chains to adapt to changing demand and supply market conditions (Dubey et al., 2019). Sullivan-Taylor and Branicki (2011) used organizational theory to explore the SME resilience factors and found that agility was considered an important capability and received significant support from decision makers in 11 SMEs.
The ability to respond quickly to market demand in critical situations is an important determinant of SCR, and excess inventory and capacity are often considered wasteful and undesirable when designing supply chains, yet strategic excess inventory and product substitutable capacity are important to create SCR in the face of bottlenecks (Gani et al., 2022). Creating buffer stocks through excess capacity and precautionary inventories at all supply chain stages is not recommended, but they must be used strategically and selectively to create SCR (Azevedo et al., 2013). In the era of green supply chains, big data analysis and supply chain analysis provide a competitive advantage in describing organizational capabilities, where organizations collect, store and process data (Hazen et al., 2016; Acharya et al., 2018), thus enabling managers to make efficient and effective decisions related to the business and its related operations (Dubey et al., 2019). However, in order to reduce information lead times and improve the reliability of information, organizations need to support infrastructure development and process management that enables them to quickly access, process and analyze Big Data (Hazen et al., 2014). Therefore organizations implementing strategic inventory redundancy, ensuring product substitutability and enhancing digital infrastructure will achieve sustainability and innovation at the paradigm, ecological and social levels and enhance APGSCR.
Restore ability refers to the ability of the supply chain to absorb and adapt to interference, maintain its normal performance level, and take a series of measures to quickly restore the desired state of the supply chain (Li et al., 2017). The three specific indicators include financial reserves, learning capacity and resilient resources. Financial reserve refers to a company's market share and economic strength, which plays a crucial role in whether the supply chain can return to its original state or better. Companies with financial advantages can substitute other resources needed to restore the supply chain in a shorter period of time, and also motivate participants in the supply chain to complete their tasks more effectively (Lu et al., 2022), enabling the supply chain to return to normal levels as soon as possible. Learning ability is another effective tool to improve the SCR. Effective learning will improve the corrective ability of the organization, because learning is very important for dealing with fuzzy problems in dynamic systems (Dolgui et al., 2017). It can be expanded in terms of learning ability and joint ability of individuals and organizations to cope with risks (Hosseini et al., 2019). Also, resilient resources determine the timing and efficiency of recovery, that is, the speed at which firms can drive recovery by building reliable social capital (Folke et al., 2010). It can be extended in terms of the amount of experience accumulated in response to risk, the capital of actively accumulated social relationships and the ability to apply risk experience (Kochan and Nowicki, 2018). For example, in the midst of a crisis, a good relationship between the firm and the government can allow the government to open up green lanes for the firm in terms of transport and communication systems.
The concept of green supply chain management is to eliminate or minimize the losses (energy, greenhouse gasses, solid wastes, etc.) in the supply chain (Shibin et al., 2018). Green technology refers to the processes and technologies that reduce the consumption of materials and energy. Only by adopting new technologies can suppliers maintain quality standards and reduce risks (Malek et al., 2017). Therefore, adopting green technology can enhance the sustainability of green supply chain (Xia et al., 2022). The adoption of green technology is affected by external factors including environmental policies, suppliers, consumers, competitors, non-governmental organizations, etc. (Mancheri et al., 2019), as well as internal factors including enterprise characteristics, organizations, technology and environmental strategies (Ahi and Searcy, 2013; Jayaram and Avittathur, 2015).
Extremely dispersed individuals in the society may gather quickly because of their common interests or values. They force governments, businesses, and social organizations to listen to their “voices” by expressing opinions or taking action (Askari Sichani and Jalili, 2017). Therefore, through public opinion to oppress enterprises to accelerate the adoption of green technology and pay attention to enterprise environmental benefits can enhance the sustainability of enterprises. At the same time, the government adheres to the environmental policy and encourage enterprises to adopt green technologies for a long time (Shen et al., 2020). The financial subsidies for green development will help enterprises achieve sustainable operation (Wang et al., 2017), overcome the price disadvantage and improve the green enthusiasm of consumers (Nie and Yang, 2016). Therefore, the government's environmental policies and financial subsidies are powerful factors for enterprises to adopt green technologies and develop sustainable supply chains.
Certainly, as decision makers in an organization, the psychological state and values of top management are a key influence on the sustainability strategy of the business (Dubey et al., 2016), and their beliefs and commitments are the main drivers of organizational decision making and strategy (Xia et al., 2022). Studies have shown that the psychology and behavior of decision makers and technical staff are significantly related to the characteristics and style of the technology adopted (Li et al., 2019). Therefore, the sustainability beliefs of top management should be an important factor in enhancing the sustainability of the supply chain. In addition, in recent studies, some scholars have proposed that the sustainability index included in business operation is a signal for enterprises to adopt green technology. One of the most compelling “business case” reasons for adopting a green supply chain is the issue of maintaining business continuity. For example, Wal-Mart uses green and sustainable supply chain practices to maintain a continuous seafood supply (Fahimnia et al., 2018). So in the face of growing public concern, companies can develop sustainability indicators within business performance management to facilitate the implementation of sustainable business.
In the research on the influencing factors of supply chain, AHP, DEMATEL, ISM, and TOPSIS have been widely used. The main principle of DEMATEL is to build a direct impact matrix and a comprehensive impact matrix by analyzing the causal relationship between various influencing factors in the system, determine the centrality and cause degree, and simplify the complex relationship (Gani et al., 2022). ISM is a structural modeling algorithm that studies the relationship between the influence and the affected of various elements in a complex system, clearly reflects the internal structure of the system, and uses directed graphs and matrices to discover the main factors and their internal relations (Peng et al., 2022). These two algorithms can complement each other. DEMATEL is used to define the hierarchy and structure of influencing factors, ISM is used to determine the internal logical structure of each element of the system.
For example, Roostaie and Nawari (2021) used DEMATEL to discover whether and to what extent the integration of resilience into sustainability assessment tools contributes or competes against the overall sustainability of buildings, and found that Efficient Operation and Maintenance, and Energy Efficiency are the factors that contribute the most to the sustainability of buildings. Jafari-Sadeghi et al. (2021) identified specific factors affecting the internationalization of small and medium-sized enterprises in emerging markets through ISM, and studied the problem of insufficient micro-basic research in specific environments.
Generally speaking, the data required by DEMATEL-ISM are obtained through expert interviews, but these data are subjective. Therefore, some scholars add fuzzy data method to reduce the subjectivity of the original data. Gray number refers to a number that only knows its value range but does not know its exact value. Its value range can be an interval or a general number set. Academics often use the Gray number fuzzy concept in the gray number system theory to solve uncertain attribute decision-making problems. Its main advantage is to use the Gray interval rather than an exact value when making decisions, so that the decision results are closer to reality.
Therefore, this paper will integrate the advantages of the three algorithms, and use gray number to process the data fuzziness to reduce the subjectivity of the data. The integrated interpretability algorithm model is constructed by DEMATEL-ISM, which not only clarifies the importance of the factors of the APGSCR, but also forms a hierarchical and structured multi-level hierarchical explanation structure model, and explores the diffusion behavior path of the resilience influencing factors (Table 1).
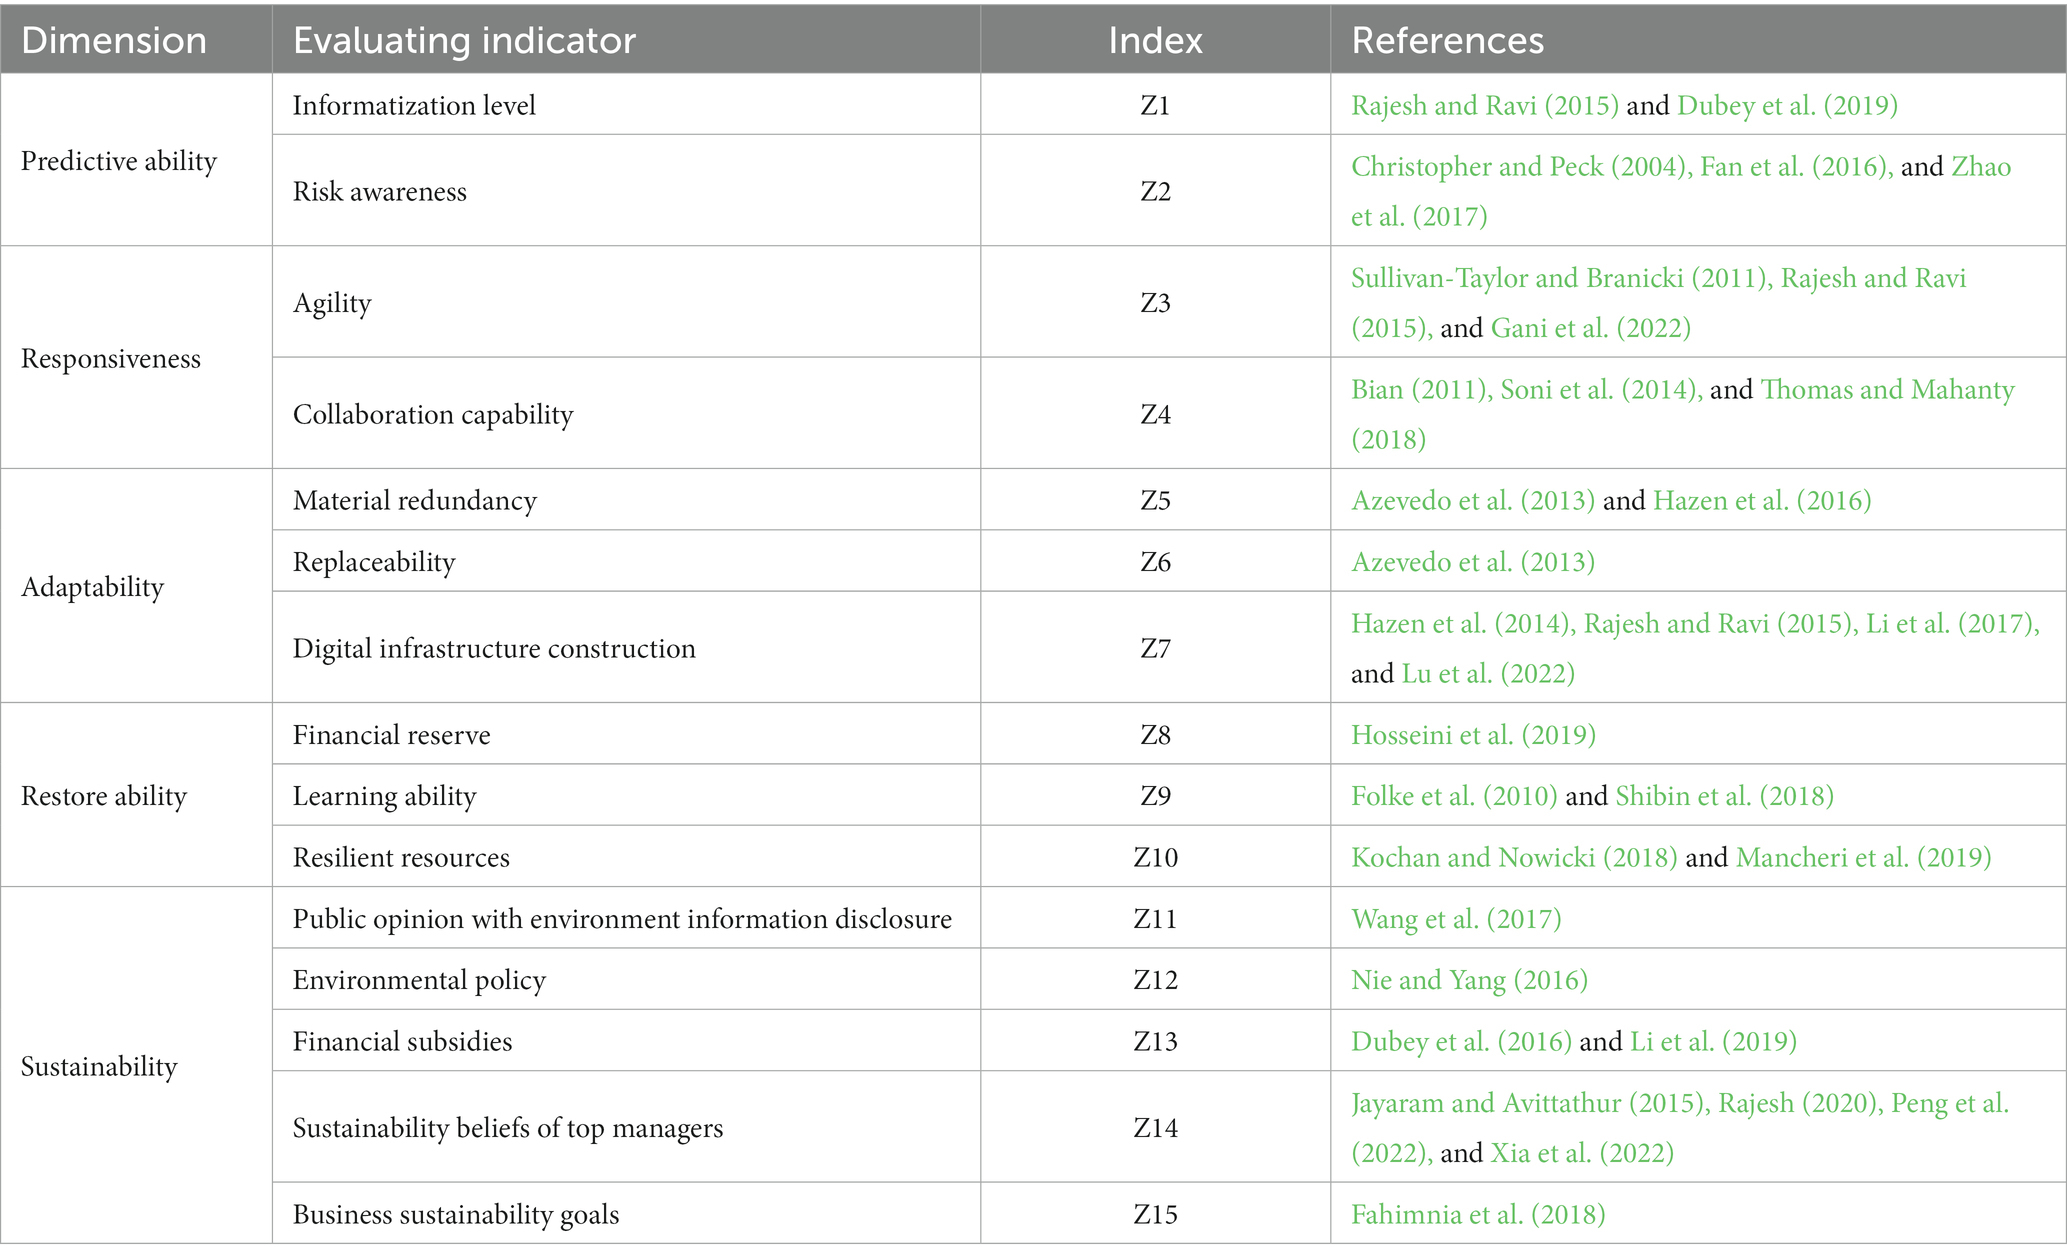
Table 1. The evaluating indicators in green supply chain resilience of agricultural products.
This study adopts a combination of qualitative and quantitative methods. First of all, a series of key influencing factors are determined by literature review qualitative method. Secondly, the gray number method is used to process the data, and DEMATEL calculates the causality and centrality of the influencing factors. Finally, a hierarchical model of influencing factors of urban elasticity is established using ISM method. The overarching framework of this study is presented in Figure 1.
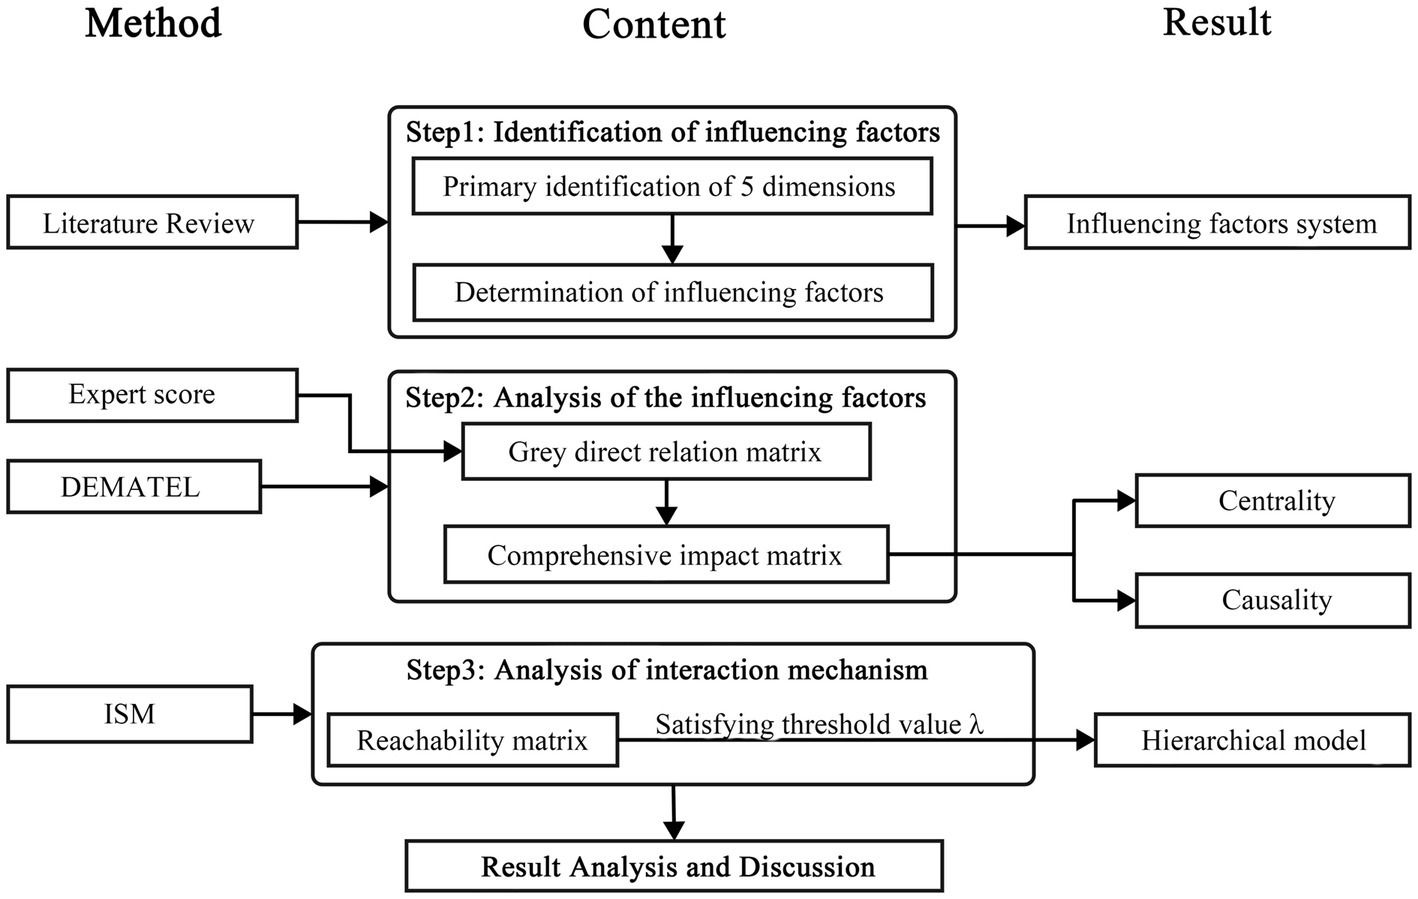
Figure 1. The overarching framework of this study.
1. Stakeholder theory holds that the decisions and goals of an organization are highly influenced by the perceptions of multiple stakeholders, whereas stakeholders refer to any group or individual affected by the achievement of the organization's goals. Therefore, this study invited experts in the field of logistics and cold chain to score the influencing factors identified this time, a total of 20 people, representing different stakeholders, scoring the relationship between factors, forming twenty 15 × 15 initial matrix. According to the reference to the existing literature (Si et al., 2018; Rajesh, 2020), the five level gray semantic scale is determined as shown in Table 2. If the expert thinks that factor i has no impact on factor j, the expert will score 0, and the corresponding interval gray number is [0, 0]. If factor i has a light impact on factor j, the expert will score it as 1 point, and the corresponding interval gray number is [0, 0.25] and so on. According to the gray number theory, the twenty initial matrices scored by experts are transformed into six interval gray number matrices X1, X2,…, X20. If expert 1 scores x12 as 3 points, then in the corresponding gray number matrix X1, x12 = [0.5, 0.75], and note that the interval gray numbers on the diagonal are all [0, 0].
2. Based on the comprehensive consideration of the different research fields and research levels of experts, the different degrees of mastery of the research fields, reference resources (Peng et al., 2022) gives each expert fuzzy interval gray weight according to the importance of experts, and the weight semantic scale is shown in Table 3. Among them, experts 1-5 are given [0.7, 1.0], experts 6-10 are given [0.5, 0.9], experts 11-15 are given [0.4, 0.7], and experts 16–20 are given [0.3, 0.5].
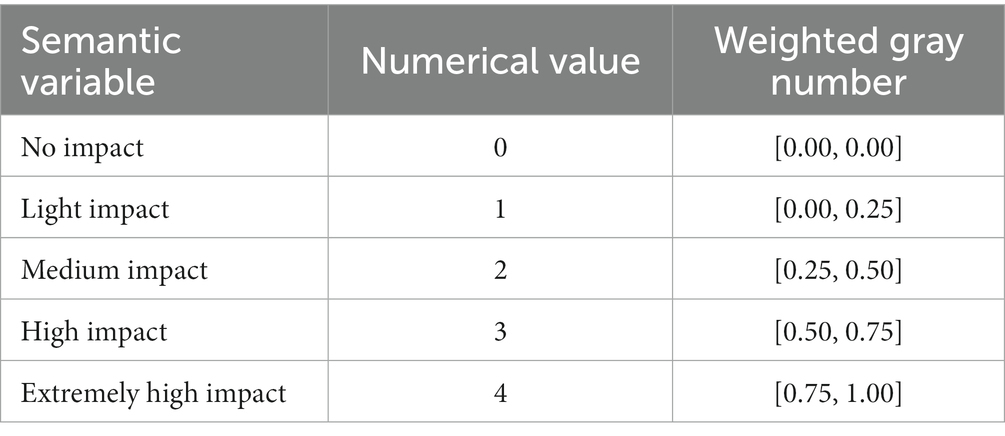
Table 2. Expert semantic variables.
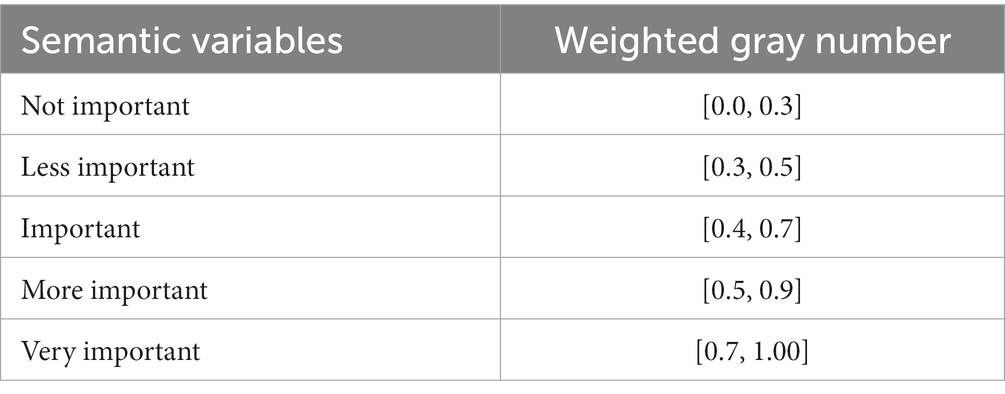
Table 3. Semantic variables of expert weights.
Standardize and clarify the 20 gray number matrices. The method of CFCS (Converting Fuzzy data into Crisp Scores) is used to translate the fuzzy data (interval gray numbers) into clear values (specific values), and the gray number matrix is standardized and clarified.
Use formula (1) to calculate the upper and lower limits of the standardized gray number.
And then use formula (2) to convert the standardized gray number into the clear value, and obtain the direct influence matrix Zk (k = 1, ···, 20) of each expert's clear value (a total of 20 clear matrices, for example, Z1 represents the direct influence matrix of expert 1's clear value).
In the formula, the symbol ⨂ represents the gray number, is the upper limit of the standardized gray number in row i and column j of the k-th gray number matrix; is the lower limit of the standardized gray number of the j column in the i row of the k-th gray number matrix; is the upper limit of expert k original score converted into interval gray number; is the lower limit of expert k original score converted into interval gray number. is the maximum value of the upper limit of the interval gray number scored by k different experts on the influencing factors in row i and column j, is the minimum value of the upper limit of the interval gray number scored by k different experts on the influencing factors in row i and column j. is the clear value after clarification, and is the final clear value.
Standardize and clarify the interval gray weight of each expert by using formula (1) and formula (2) to obtain the clear value of expert weight. And calculate the direct influence matrix Z after considering the weight by using formula (3), as shown in Table 4.
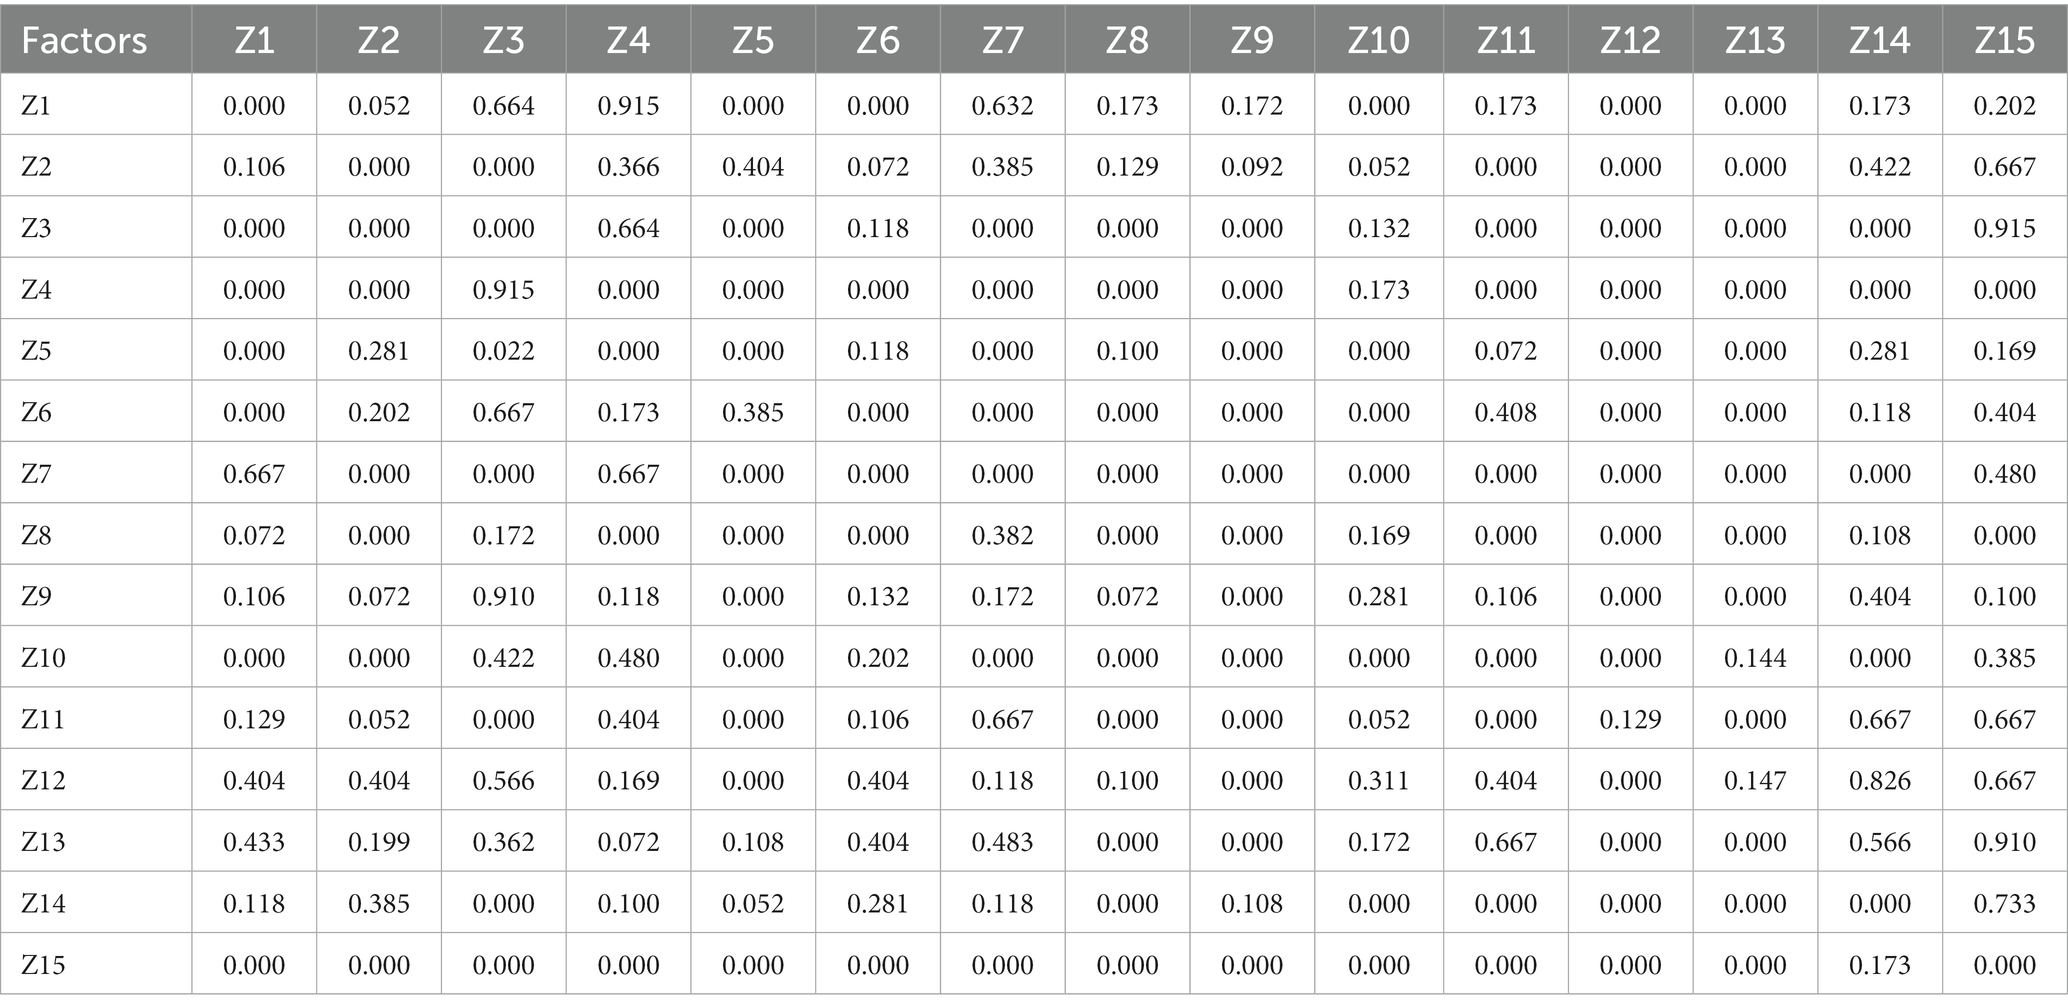
Table 4. The direct influence matrix Z.
In order to obtain the comprehensive influence matrix of the resilience influencing factors of the green supply chain of agricultural products, the standardized matrix A can be obtained by calculating the direct influence matrix Z according to the following formula (4):
On the basis of the normalized matrix A, the comprehensive influence matrix B of the influencing factors of APGSCR is obtained through the following formula (5), B = (b ij) 15 × 15 (Table 5):
I is the 15 × 15 identity matrix.
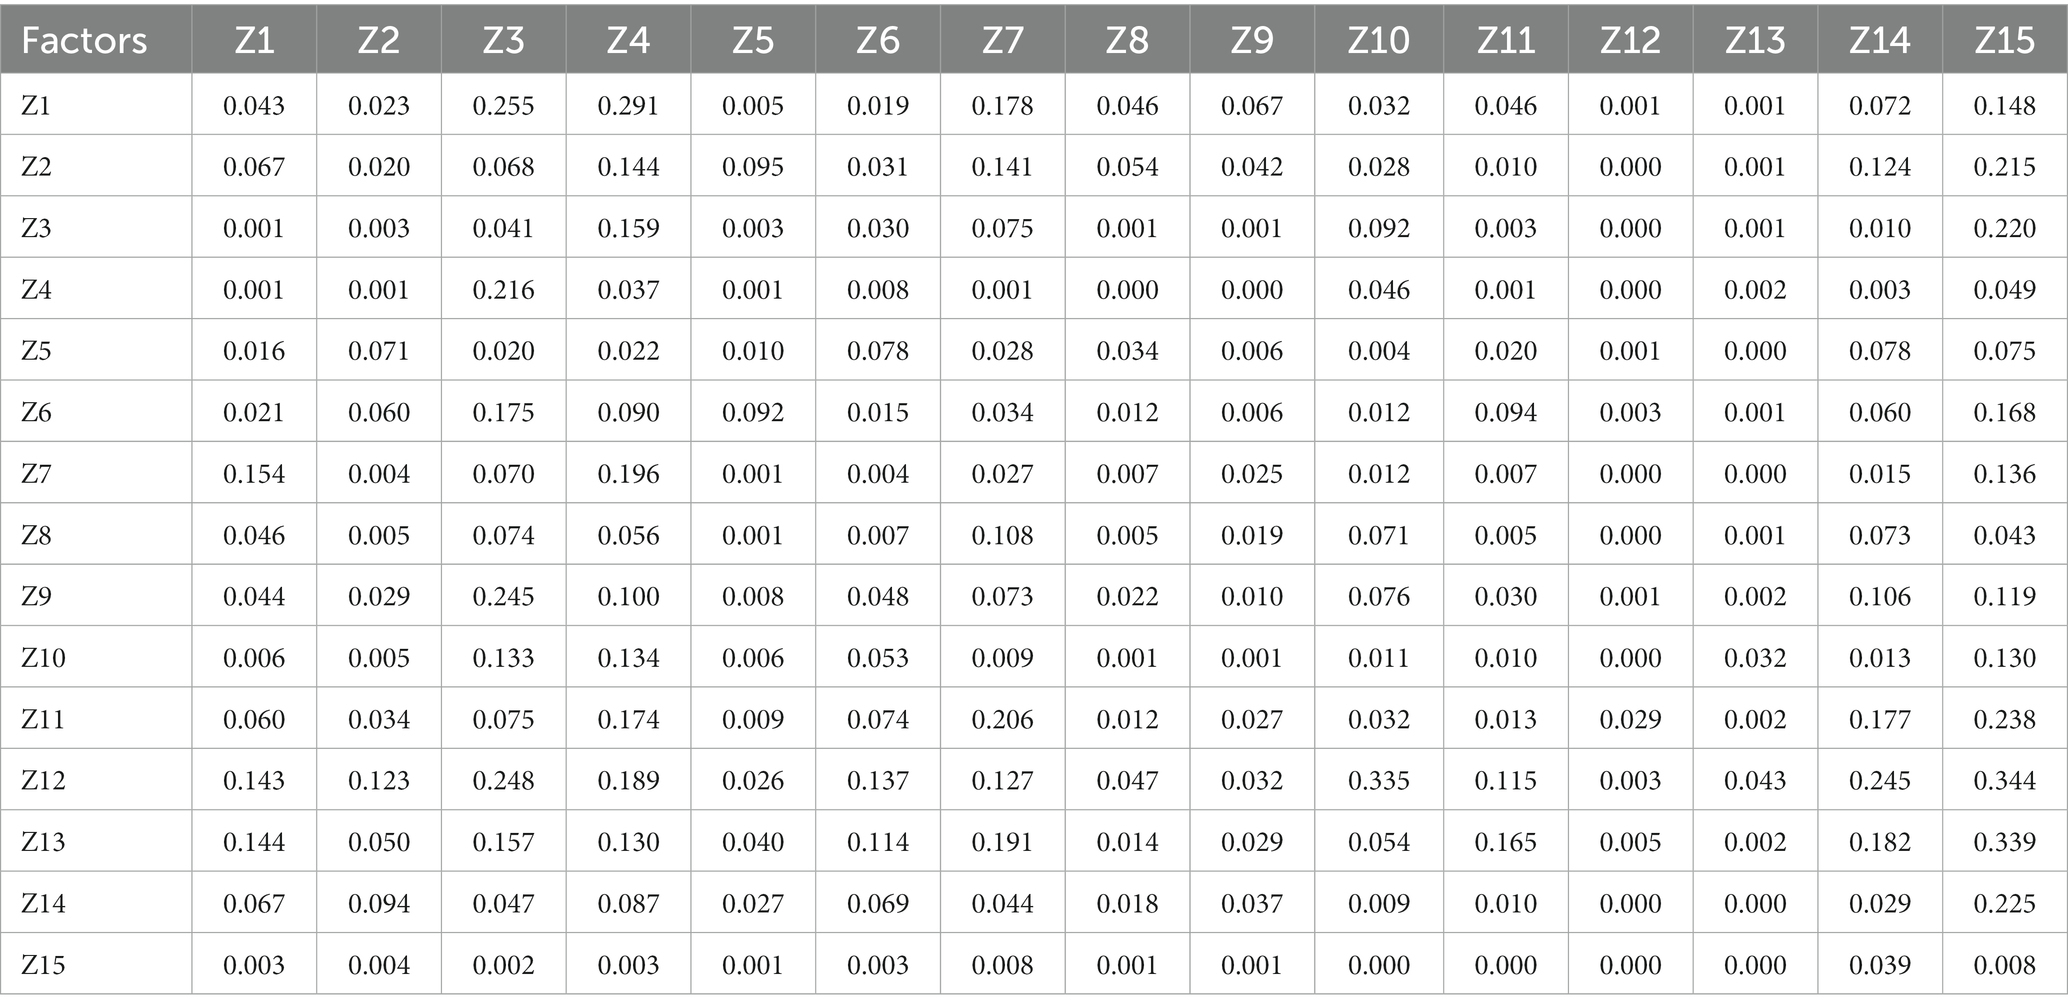
Table 5. The comprehensive impact matrix B.
The influence degree fi refers to the influence of each influencing factor on other factors in the system. Affected degree m j refers to the influence of other factors in the system. The centrality zi indicates the importance of each influencing factor in the system. The cause degree yi indicates the degree of interaction between various influencing factors in the system (if the cause degree is positive, it indicates that the influencing factor mainly affects other factors, which is a reason factor; if the cause degree is negative, it indicates that the influencing factor is mainly affected by other factors, which is a result factor). Add the elements in each row of the comprehensive influence matrix B to obtain the influence degree f i. Add the elements in each column of the comprehensive influence matrix B to get the affected degree mi, and the difference between the affected degree and the affected degree is the cause degree yi. The sum of the two is the centrality zi, and the specific calculation formula is as follows formula (6):
The influence degree, affected degree, centrality and cause degree are calculated according to the above formula (6), and the results are shown in Table 6. Figure 2 presents the “centrality cause degree” curve of each influencing factor in Cartesian coordinate system.
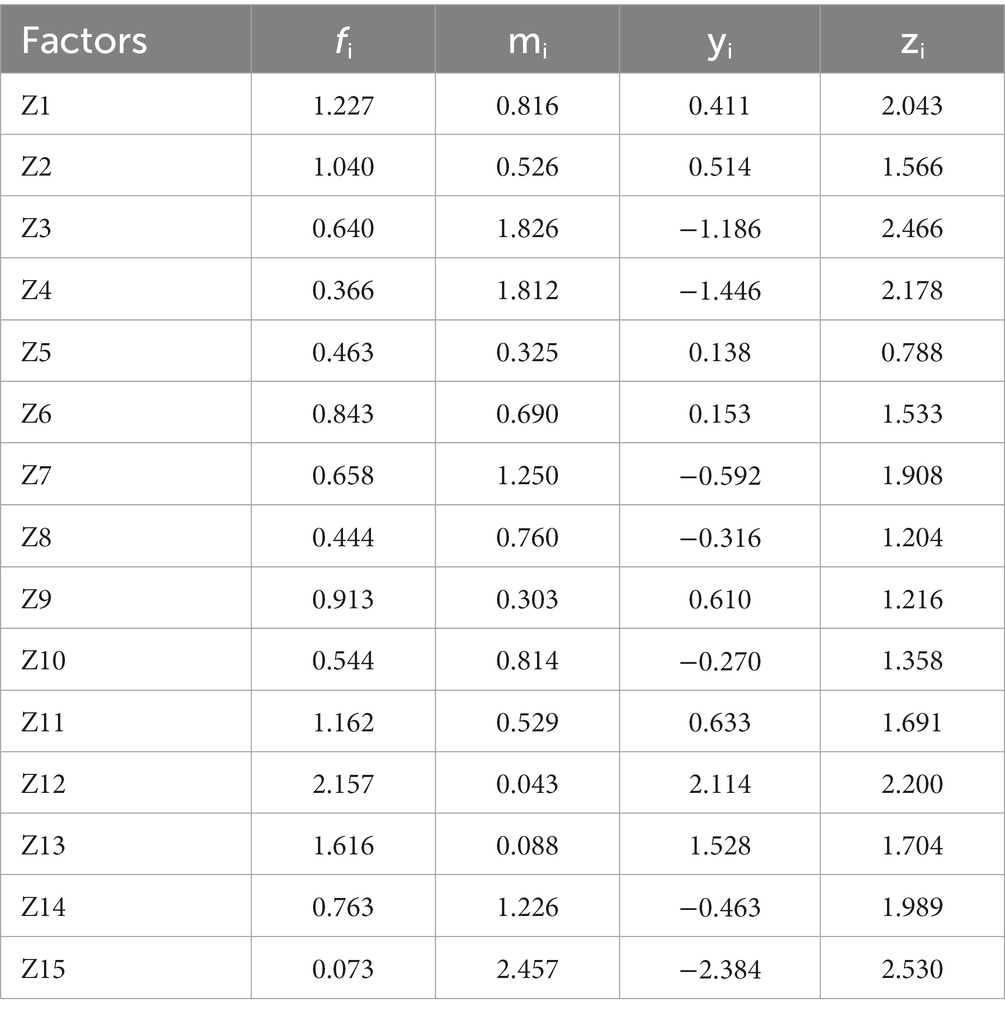
Table 6. Influence degree, affected degree, cause degree and centrality.
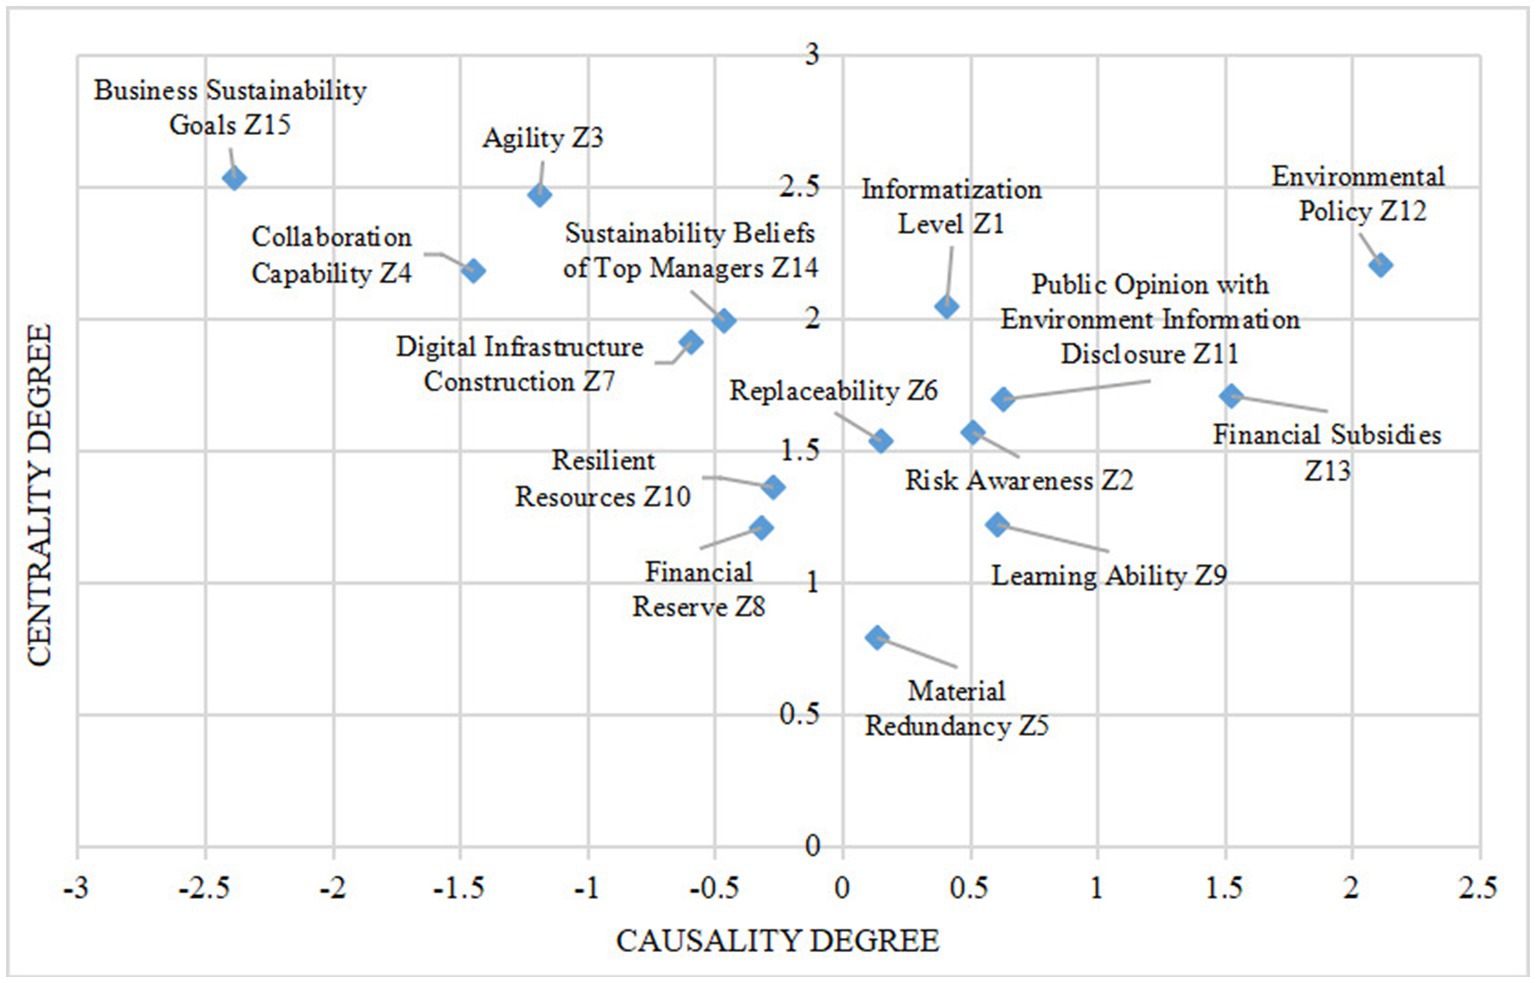
Figure 2. The Cartesian coordinate system of centrality cause degree.
Due to the lack of consideration of factors on their own influence in the comprehensive influence matrix, it is necessary to obtain the overall influence matrix C of the system by the following formula (7), C=(cij) 15× 15:
I is 15 ×15 identity matrix.
Set the threshold value λ according to the overall influence matrix C of the system, small influencing factors can be discarded to simplify the system structure. However, if the threshold value λ is too large, the system structure is too simplified, and the influence relationship between factors is difficult to measure. But if the threshold value λ is too small, the system structure is so complex, and the influence relationship between factors is too complicated. Therefore, the threshold value λ set to respectively λ = 0.05, λ = 0.07, λ = 0.10, and λ = 0.15, calculate the sum of the values of the row and column of each factor in the reachability matrix, that is the node degree of the factor, as shown in Table 7. The node degree decay line graph is obtained from the descending order of the node degree under the four values of λ, as shown in Figure 3. The analysis results show that when λ is 0.10 and 0.05, the node degree of the influencing factors changes shortly. When λ is 0.15, the variation range is relatively small. After screening, this paper selects λ is 0.07.

Table 7. The node degree of the factor.
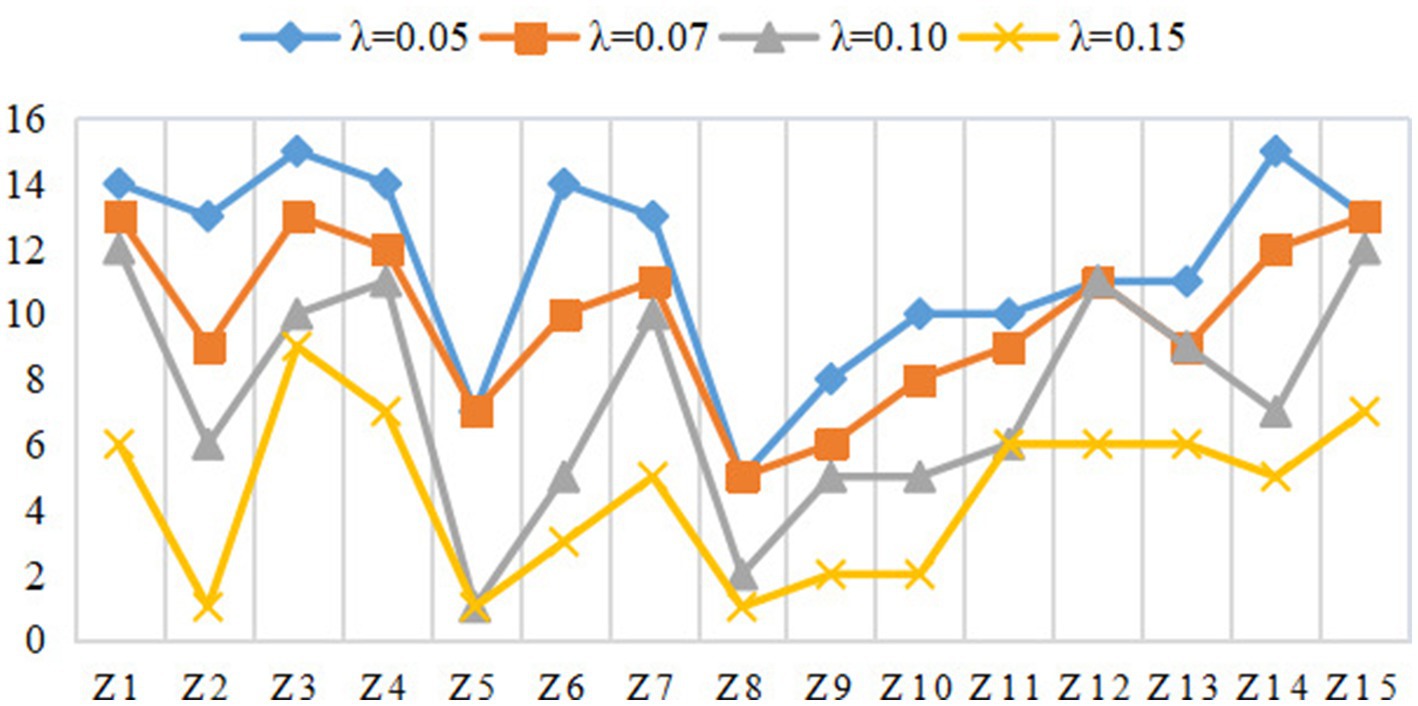
Figure 3. Node degree attenuation scatter plot.
The reachability matrix D of influencing factors of APGSCR is calculated according to the following formula (8), as shown in Table 8.
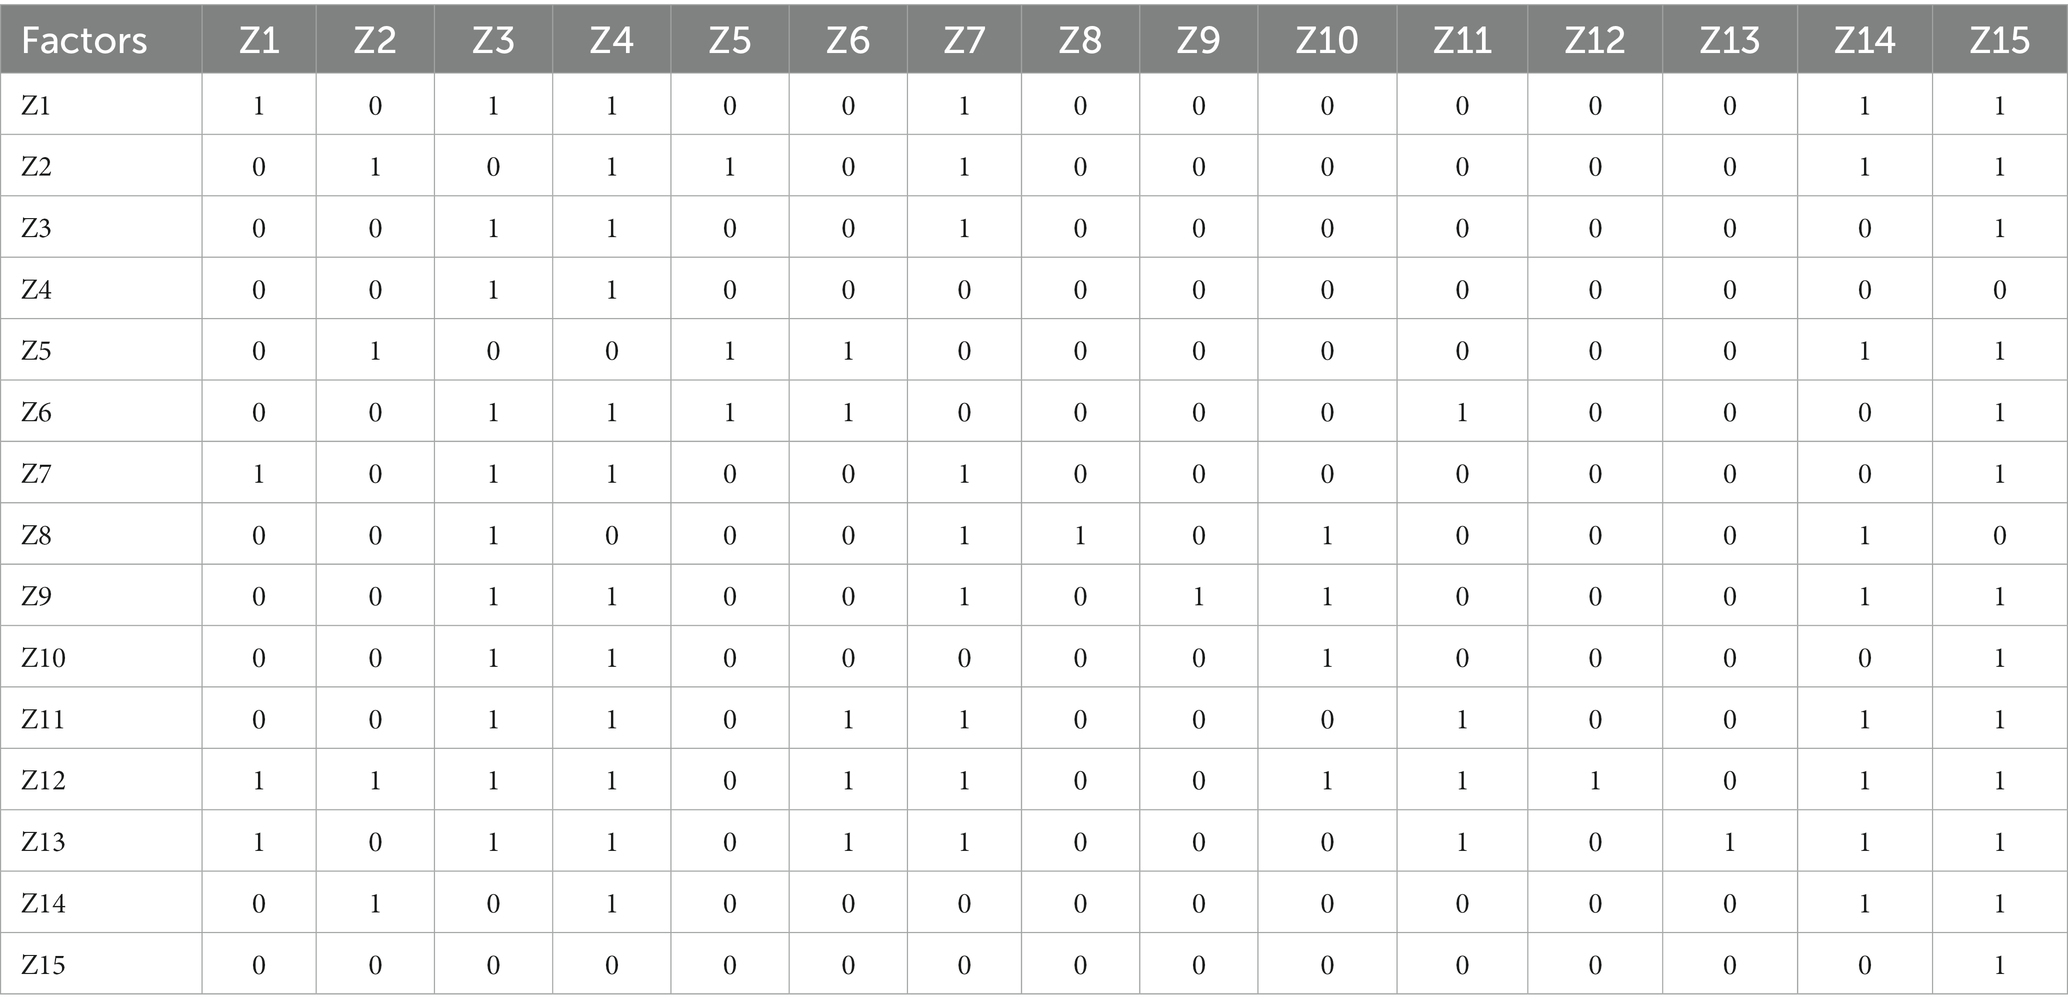
Table 8. The reachability matrix D.
From the reachability matrix D, the reachability set M (Zi), the antecedent set N (Zi) and the common set O (Zi) of the influencing factors of APGSCR can be obtained according to the following formula (9):
Among them, the reachable set is a set of all influencing factors that can be reached by the influencing factor Zi in the reachable matrix D. The antecedent set is a set of all influencing factors that can reach Zi in the reachability matrix D. Common set is the intersection of reachable set and antecedent set. Li is used to refer to the influencing factors of layer i. The following formula (10) can be used to divide each influencing factor in the reachability matrix D into different levels. The specific division process is shown in Tables 9–11.
According to the above division results, the multi-level hierarchical structure model diagram of influencing factors of APGSCR is obtained, as shown in Figure 4.
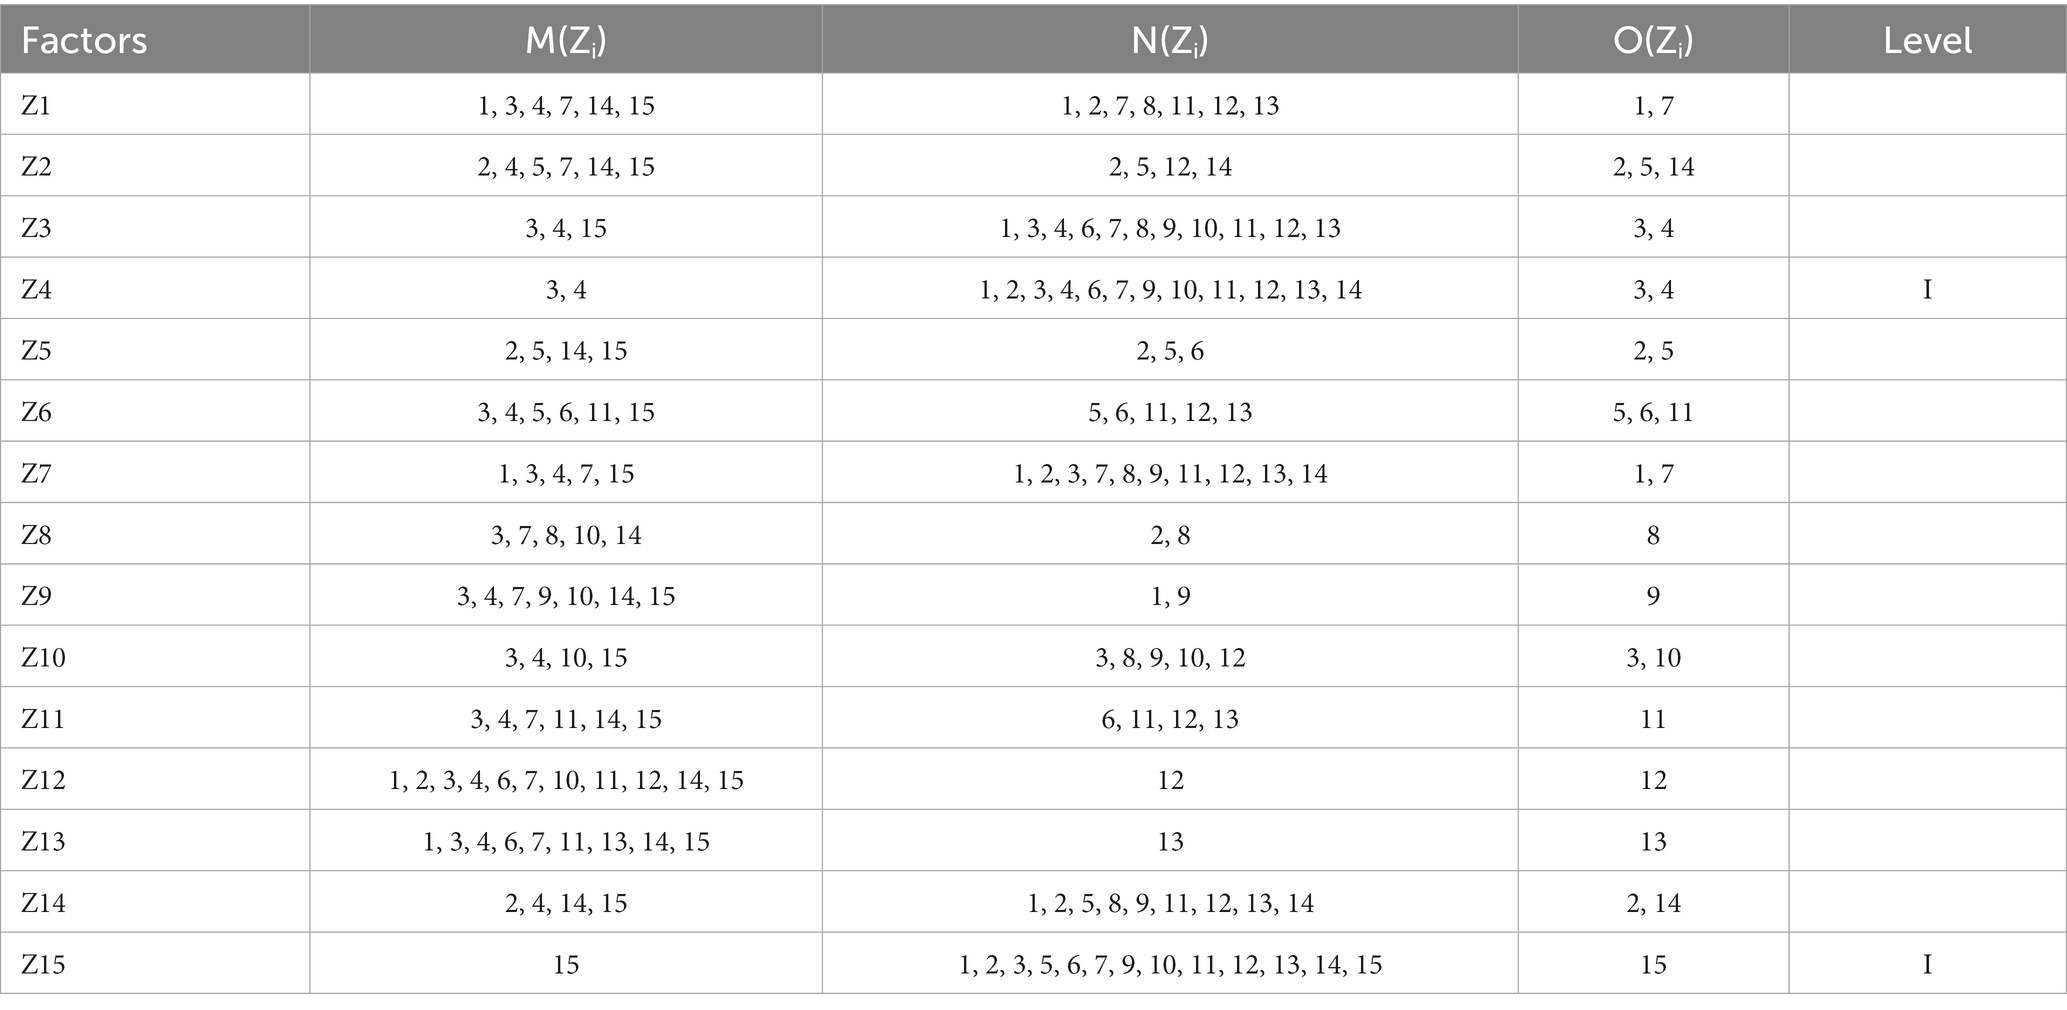
Table 9. The first level division.
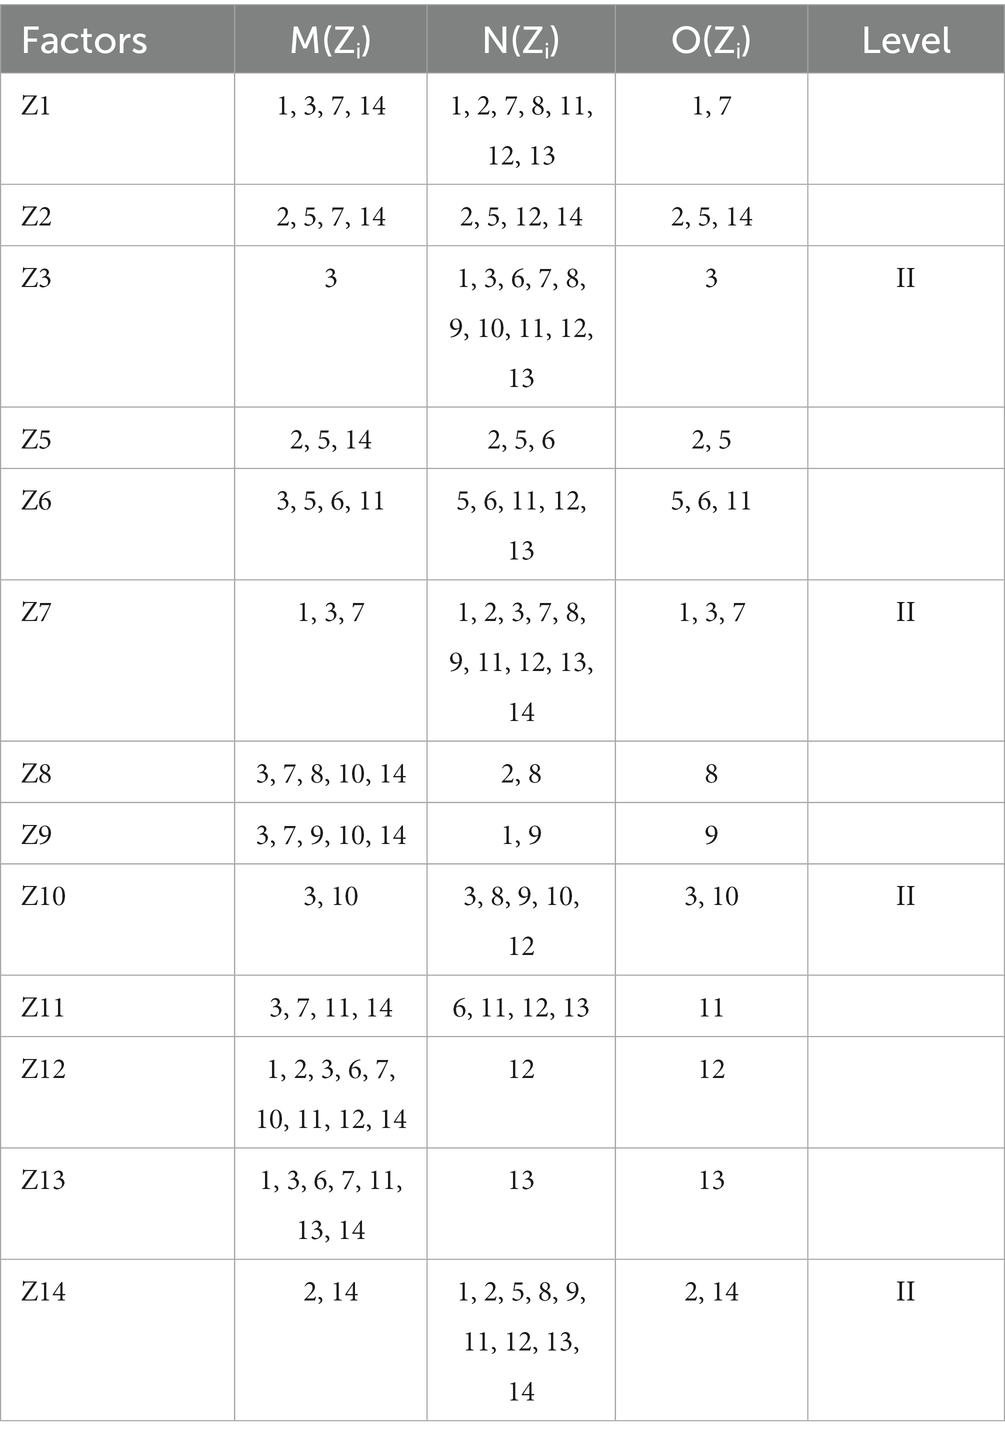
Table 10. The second level division.
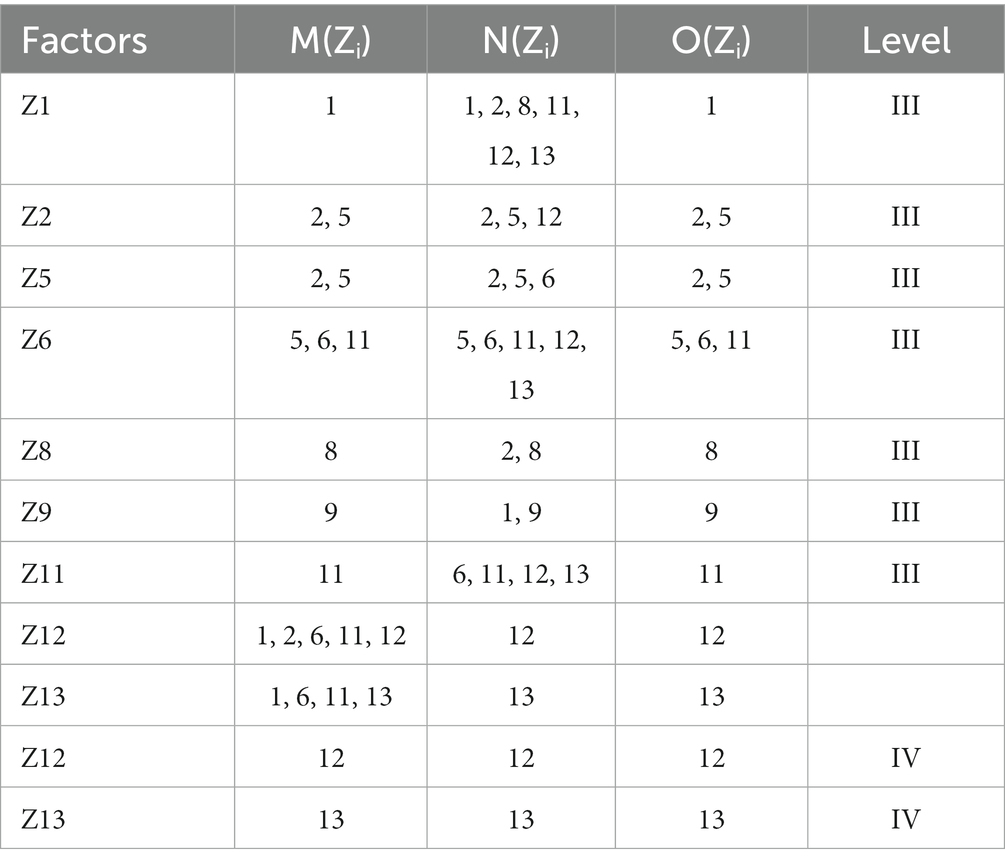
Table 11. The third and fourth level division.
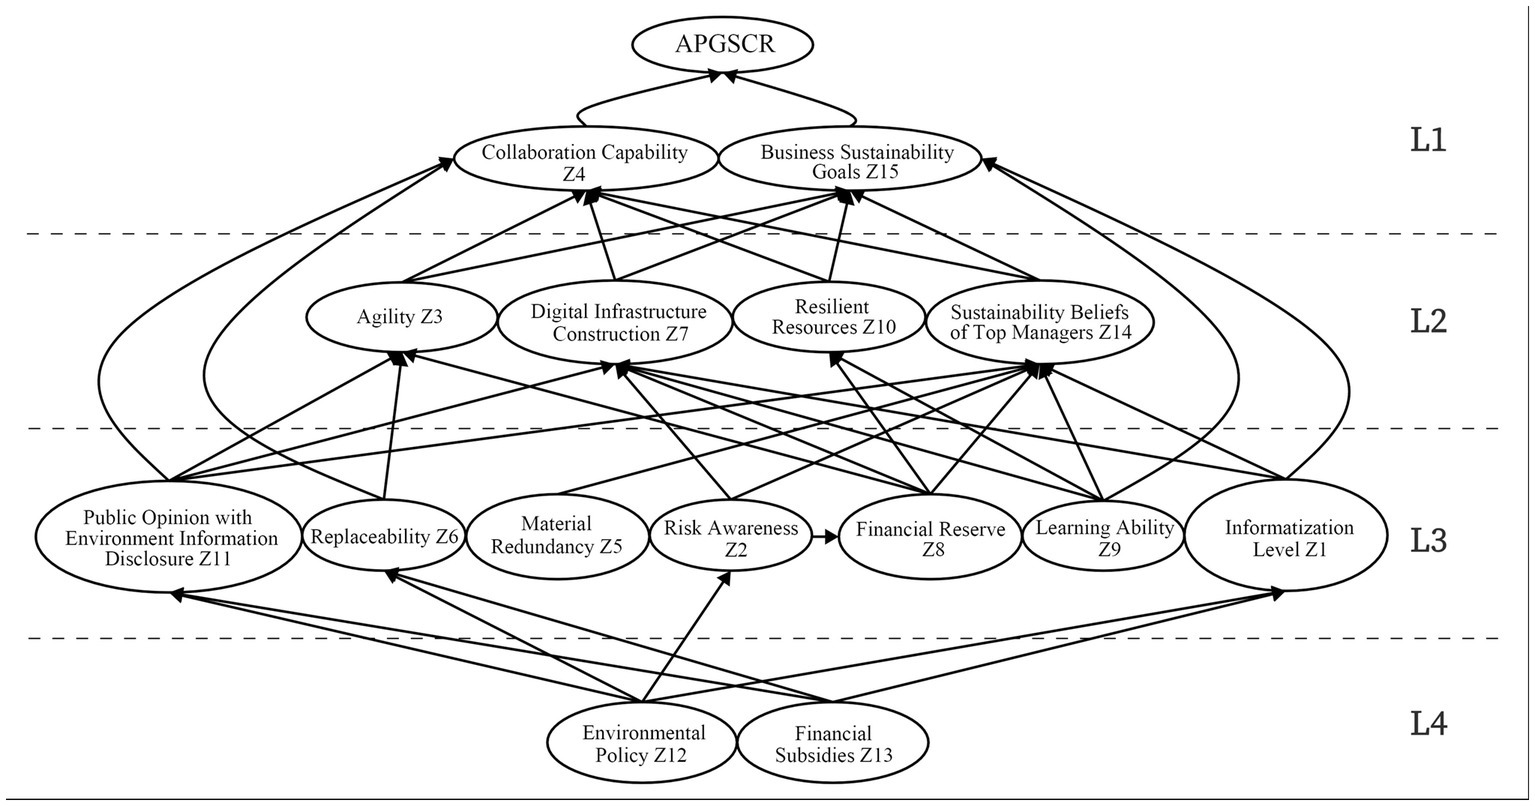
Figure 4. The diffusion network of the influencing factors of green supply chain resilience of agricultural products.
If the cause degree is greater than 0, it indicates that the factor has a great influence on other factors, which is called the cause factor. It can be seen from Figure 1, that informationize Level Z1, Risk Awareness Z2, Material Redundancy Z5, Substitutability Z6, Learning Ability Z9, Public Opinion with Environment Information Disclosure Z11, Environmental Policy Z12, and Financial Subsidies Z13 are the cause indicators in the influencing factor system of APGSCR, which are ranked in descending order as Z12>Z13>Z11>Z9>Z2>Z1>Z6>Z5. We can find that Environmental Policy and Financial Subsidies have a high degree of cause, that is, these two factors will have a greater impact on other factors and are the main cause factors. At the same time, these two factors are related to the government, indicating that local government behavior is the key to enhance the resilience of the green supply chain of agriculture products.
From the perspective of cause factors, if the government issues a series of environmental policies, it will urge enterprises to take relevant green activities to complete the indicators and improve the attention of enterprises to the environment. At the same time, if the government gives corresponding financial subsidies to ease the financial difficulties of enterprises in adopting green technologies, reduce the price of green products purchased by the public, it will stimulate their consumption, it will ultimately promote the resilient development of the entire green supply chain (Nie and Yang, 2016).
If the cause degree is less than 0, it indicates that other factors have a great influence on the factor, which is called the result factor. It can be seen from Figure 1, that Agility Z3, Collaboration Capability Z4, Digital Infrastructure Construction Z7, Financial Reserve Z8, Resilient Resources Z10, Sustainability Beliefs of Top Managers Z14, and Business Sustainability Goals Z15 are the result indicators in the influencing factor system of APGSCR, and their absolute values are in the order of Z15>Z4>Z3>Z7>Z14>Z8>Z10 from large to small. Among them, Business Sustainability Goals and Collaboration Capability are the most vulnerable factors to be affected by other factors, which are the main result factors affecting the APGSCR.
From the perspective of result factors, when enterprises set business sustainability goals, they will be prompted to adopt green technologies to ensure the green development of the supply chain, so as to meet government requirements and public appeals, thus directly enhancing the APGSCR. In addition, the whole process of agriculture products from the place of production to consumers involves too many uncertain factors and uncontrolled personnel, so strengthening the cooperation ability between various entities of the supply chain plays a key role in enhancing APGSCR (Kamalahmadi and Parast, 2016).
The centrality indicates the position and role of this factor in the influencing factor system of APGSCR. The greater the centrality value, the greater the restriction of this factor on decision-making. The order of factors' centrality from large to small is Z15>Z3>Z12>Z1>Z4>Z14>Z7>Z13>Z11>Z2>Z6>Z10>Z9>Z8>Z5. Among them, Business Sustainability Goals Z15, Agility Z3, Environmental Policy Z12, Informationize Level Z1, Collaboration Ability Z4, and Sustainability Beliefs of Top Managers Z14 are the most important six factors affecting the APGSCR. In order to promote the green development of enterprises, the government will often introduce a series of environmental policies, which may promote the top managers of enterprises to establish a sustainable belief, so as to establish sustainable business objectives for the company. Therefore, enterprises will strengthen their informationize level and green technology investment (Del Río González, 2005), so as to improve the collaborative ability and agility of each stakeholder in the supply chain.
It can be seen from the multi-level hierarchical structure model of influencing factors of APGSCR (Figure 3), that the influencing factors of they are divided into four levels: L1 is the top level of the hierarchical hierarchy model, and the top level indicators include Collaboration Capability Z4 and Business Sustainability Goals Z15, which are the direct level to form and enhance the APGSCR. As the middle layer of the hierarchical model, L2 and L3 are the transitional layers to improve the APGSCR. They play a connecting role in the whole system. The middle layer indicators affect the whole system through the top-level indicators, and are directly affected by the lower layer indicators. Among them, L2 indicators include Agility Z3, Digital Infrastructure Construction Z7, Resilient Resources Z10 and Sustainability Beliefs of Top Managers Z14. L3 indicators include Informationize Level Z1, Risk Awareness Z2, Material Redundancy Z5, Substitutability Z6, Financial Reserve Z8, Learning Ability Z9, and Public Opinion with Environment Information Disclosure Z11. The L4 layer is at the bottom of the hierarchical model, which is the basic layer to form the APGSCR. The bottom indicators include Environmental Policy Z12 and Financial Subsidies Z13, which play a fundamental role in affecting the APGSCR in the whole system, and affect the middle and top indicators in various ways, thereby affecting the entire system.
There are multiple influence mechanisms in the multi-level hierarchical structure model. According to the influence level of ISM model, it can be divided into three mechanisms: dominant mechanisms, other deep level factor influence mechanisms and non-deep level factor influence mechanisms.
The dominant mechanisms is the influence mechanisms starting from the fundamental influencing factors. For example, Z12-Z11-Z14-Z15 or Z13-Z1-Z7-Z4, the government issues environmental policies to attract public's attention to the environment (Kardooni et al., 2018), generate public opinion and stimulate the risk awareness of enterprises, thus stimulating top managers to establish sustainable beliefs and business sustainability goals (Li et al., 2017), and ultimately strengthening the enterprise's APGSCR, which is the main mechanisms to achieve APGSCR. However, some outcome indicators that cannot be affected by the basic factors can be indirectly affected by the peer cause indicators, and then affect the higher factors, thus affecting higher level factors, such as Z12-Z2-Z8-Z3-Z4. The government releases environmental policies to improve the risk awareness of enterprises, and enterprises will leave more surplus funds in the annual after tax profits to provide security for enterprises to recover quickly and quickly in crisis events, and enhance the resilience of the supply chain to deal with crisis events.
There are also many influence mechanisms of other deep level factors, which refer to the influence mechanisms starting from the sub bottom level factors, such as Z8-Z7-Z4. Through independent learning, enterprises strengthen the construction of digital infrastructure, ensure the transparency, security and traceability of the entire supply chain through 5G, artificial intelligence, block-chain and other technologies, reduce the deterioration of the supply chain caused by blocked information or malignant behavior (Hazen et al., 2014), and let all stakeholders take the green supply chain approach to production and service activities in a way that causes minimal damage to nature, high level cooperation can improve SCR.
The influence mechanisms of non-deep level factors mainly refers to the influence mechanisms of other level factors, such as Z14-Z15 or Z3-Z4. However, this mechanisms has high requirements for enterprises. First of all, top managers of enterprises need to independently establish business sustainability goals without any stimulation, so that all relevant departments of enterprises can adopt green technologies to ensure the green development of the enterprise's supply chain. Secondly, enterprises are also required to establish risk awareness in their daily life and strengthen the APGSCR by integrating green suppliers (Jüttner and Maklan, 2011).
To sum up, in order to improve the APGSCR more quickly and efficiently, the government should take the lead in issuing policies and measures such as environmental policies or financial subsidies, guide the green supply chain of agriculture products to the direction of standardization, normalization and sustainability, and improve its resilience to deal with risks, which is the most effective mechanisms. At the same time, top managers of enterprises should strengthen their belief in sustainability and establish their business sustainability goals, improve the level of supply chain informationize and strengthen the construction of digital infrastructure, so as to enhance the coordination and cooperation ability among various entities of the supply chain. Finally, enterprises should have a certain amount of capital reserves to ensure that they can have a certain amount of inventory or alternative products in critical moments (Ahmadi-Javid and Hoseinpour, 2018), so that the agricultural product supply chain can maintain a high degree of agility in the crisis, so as to achieve the healthy development and high APGSCR.
Based on the stakeholder theory, this study innovatively introduces the “sustainability” evaluation dimension through the literature research method, and summarizes a complete “5-15” APGSCR evaluation index system, enriches the literature in the field of sustainable development of agricultural product supply chain. Gray improved DEMATEL-ISM to reduce the subjectivity of data, studied the correlation between various influencing factors, and established a multi-level hierarchical structure model of influencing factors of APGSCR, providing theoretical basis for agricultural logistics enterprises to improve the APGSCR.
This study also analyzed the mechanisms of influencing toughness through the relationship between the influencing factors of APGSCR, explained the basic transfer mechanism with hierarchy, and explored the influence diffusion mechanisms between elements with hierarchical network. Here, by analyzing the dominant mechanisms, other deep level factor influence mechanisms and non-deep level factor influence mechanisms, the impact diffusion mechanism of APGSCR and its application in operation management are theoretically promoted. The influence diffusion mechanisms involving stakeholders will help senior managers to formulate a green supply chain strategy in the enterprise. For government organizations, we can promote them to formulate reasonable and effective green laws and regulations to promote sustainable development.
However, this study still has several limitations. First, although a systematic framework has been constructed in this article, there is still a possibility of missing attributes, which needs to be further explored in future research. Second, the research is based on the questionnaire data from experts. Although Gray theory is used to address linguistic preferences of experts, there are still some errors that are difficult to eliminate, which may have a certain impact on the results. Third, the study on the influence path is only a further discussion after this paper based on factor analysis. The specific most important influence path still needs to be proved by future data. Finally, the results of this paper have yet to be verified and supplemented in practice. Future research should focus on solving the above problems and constantly improve the thinking of entrepreneurship education.
The original contributions presented in the study are included in the article/supplementary material, further inquiries can be directed to the corresponding author.
ML and JW: conceptualization and investigation. JW: methodology, software, formal analysis, and writing—original draft preparation. JW and MY: resources, data curation, and visualization. ML: validation, writing—review and editing, supervision, project administration, and funding acquisition. YC: investigation, software, analyze data, funding acquisition, and approved for publication. All authors contributed to the article and approved the submitted version.
This research was supported by the Institute of Distribution Research, Dongbei University of Finance and Economics (No. IDR2021YB004), National Social Science Foundation of China (No. 17BGL230), Research on the Introduction of Excellent Performance Management Model in Hubei Province (No. 113-4515-2271), and Open Project of Hubei Provincial Collaborative Innovation Center for Security Early Warning and Emergency Linkage Technology (No. JD20160215). National Innovation and Entrepreneurship Training Program for College Students (No. S202310497095).
The authors would like to express our deep appreciation for the insightful comments from the Editor and Referees.
The authors declare that the research was conducted in the absence of any commercial or financial relationships that could be construed as a potential conflict of interest.
All claims expressed in this article are solely those of the authors and do not necessarily represent those of their affiliated organizations, or those of the publisher, the editors and the reviewers. Any product that may be evaluated in this article, or claim that may be made by its manufacturer, is not guaranteed or endorsed by the publisher.
Acharya, A., Singh, S. K., Pereira, V., and Singh, P. (2018). Big data, knowledge co-creation and decision making in fashion industry. Int. J. Inform. Manag. 42, 90–101. doi: 10.1016/j.ijinfomgt.2018.06.008
Ahi, P., and Searcy, C. (2013). A comparative literature analysis of definitions for green and sustainable supply chain management. J. Clean. Prod. 52, 329–341. doi: 10.1016/j.jclepro.2013.02.018
Ahmadi-Javid, A., and Hoseinpour, P. (2018). Service system design for managing interruption risks: a backup-service risk-mitigation strategy. Eur. J. Operat. Res. 274, 417–431. doi: 10.1016/j.ejor.2018.03.028
Askari Sichani, O., and Jalili, M. (2017). Inference of hidden social power through opinion formation in complex networks. IEEE Trans. Netw. Sci. Eng. 4, 154–164. doi: 10.1109/tnse.2017.2691405
Ayyildiz, E. (2021). Interval valued intuitionistic fuzzy analytic hierarchy process-based green supply chain resilience evaluation methodology in post COVID-19 era. Environ. Sci. Pollut. Res. 30, 42476–42494. doi: 10.1007/s11356-021-16972-y
Azevedo, S. G., Govindan, K., Carvalho, H., and Cruz-Machado, V. (2013). Ecosilient Index to assess the greenness and resilience of the upstream automotive supply chain. J. Clean. Prod. 56, 131–146. doi: 10.1016/j.jclepro.2012.04.011
Bian, Z. (2011). Value-based services for sustainable business: a case study of IKEA. J. Circ. Manag. Assoc. 14, 147–166. doi: 10.17961/jdmr.14.3.201108.147
Cabral, I., Grilo, A., and Cruz-Machado, V. (2012). A decision-making model for Lean, Agile, Resilient and Green supply chain management. Int. J. Prod. Res. 50, 4830–4845. doi: 10.1080/00207543.2012.657970
Cardoso, S. R., Paula Barbosa-Póvoa, A., Relvas, S., and Novais, A. Q. (2015). Resilience metrics in the assessment of complex supply-chains performance operating under demand uncertainty. Omega 56, 53–73. doi: 10.1016/j.omega.2015.03.008
Christopher, M. (2012). Managing supply chain complexity: identifying the requisite skills. Supply Chain Forum 13, 4–9. doi: 10.1080/16258312.2012.11517288
Christopher, M., and Peck, H. (2004). Building the resilient supply chain. Int. J. Logist. Manag. 15, 1–14. doi: 10.1108/09574090410700275
Cohen, M. C., Lobel, R., and Perakis, G. (2016). The impact of demand uncertainty on consumer subsidies for green technology adoption. Manag. Sci. 62, 1235–1258. doi: 10.1287/mnsc.2015.2173
Del Río González, P. (2005). Analysing the factors influencing clean technology adoption: a study of the Spanish pulp and paper industry. Bus. Strat. Environ. 14, 20–37. doi: 10.1002/bse.426
Dolgui, A., Ivanov, D., and Sokolov, B. (2017). Ripple effect in the supply chain: an analysis and recent literature. Int. J. Prod. Res. 56, 414–430. doi: 10.1080/00207543.2017.1387680
Dubey, R., Gunasekaran, A., Childe, S. J., Fosso Wamba, S., Roubaud, D., and Foropon, C. (2019). Empirical investigation of data analytics capability and organizational flexibility as complements to supply chain resilience. Int. J. Prod. Res. 59, 1–19. doi: 10.1080/00207543.2019.1582820
Dubey, R., Gunasekaran, A., Childe, S. J., Papadopoulos, T., Wamba, S. F., and Song, M. (2016). Towards a theory of sustainable consumption and production: constructs and measurement. Resourc. Conserv. Recycl. 106, 78–89. doi: 10.1016/j.resconrec.2015.11.008
Fahimnia, B., Jabbarzadeh, A., and Sarkis, J. (2018). Greening versus resilience: a supply chain design perspective. Transport. Res. E 119, 129–148. doi: 10.1016/j.tre.2018.09.005
Fan, H., Cheng, T. C. E., Li, G., and Lee, P. K. C. (2016). The effectiveness of supply chain risk information processing capability: an information processing perspective. IEEE Trans. Eng. Manag. 63, 414–425. doi: 10.1109/tem.2016.2598814
Folke, C., Carpenter, S. R., Walker, B., Scheffer, M., Chapin, T., and Rockström, J. (2010). Resilience thinking: integrating resilience, adaptability and transformability. Ecol. Soc. 15: 20. doi: 10.5751/es-03610-150420
Gani, A., Bhanot, N., Talib, F., et al. (2022). An integrated DEMATEL-MMDE-ISM approach for analyzing environmental sustainability indicators in MSMEs. Environ Sci Pollut Res 29, 2035–2051. doi: 10.1007/s11356-021-15194-6
Hazen, B. T., Boone, C. A., Ezell, J. D., and Jones-Farmer, L. A. (2014). Data quality for data science, predictive analytics, and big data in supply chain management: an introduction to the problem and suggestions for research and applications. Int. J. Prod. Econ. 154, 72–80. doi: 10.1016/j.ijpe.2014.04.018
Hazen, B. T., Skipper, J. B., Boone, C. A., and Hill, R. R. (2016). Back in business: operations research in support of big data analytics for operations and supply chain management. Anna. Operat. Res. 270, 201–211. doi: 10.1007/s10479-016-2226-0
Hosseini, S., Ivanov, D., and Dolgui, A. (2019). Review of quantitative methods for supply chain resilience analysis. Transport. Res. E 125, 285–307. doi: 10.1016/j.tre.2019.03.001
Jafari-Sadeghi, V., Mahdiraji, H. A., Bresciani, S., and Pellicelli, A. C. (2021). Contextspecific micro-foundations and successful SME internationalisation in emerging markets: a mixed-method analysis of managerial resources and dynamic capabilities. J. Bus. Res. 134, 352–364. doi: 10.1016/j.jbusres.2021.05.027
Jayaram, J., and Avittathur, B. (2015). Green supply chains: a perspective from an emerging economy. Int. J. Prod. Econ. 164, 234–244. doi: 10.1016/j.ijpe.2014.12.003
Jüttner, U., and Maklan, S. (2011). Supply chain resilience in the global financial crisis: an empirical study. Supply Chain Manag. 16, 246–259. doi: 10.1108/13598541111139062
Kamalahmadi, M., and Parast, M. M. (2016). A review of the literature on the principles of enterprise and supply chain resilience: major findings and directions for future research. Int. J. Prod. Econ. 171, 116–133. doi: 10.1016/j.ijpe.2015.10.023
Kardooni, R., Yusoff, S. B., Kari, F. B., and Moeenizadeh, L. (2018). Public opinion on renewable energy technologies and climate change in Peninsular Malaysia. Renew. Energy 116, 659–668. doi: 10.1016/j.renene.2017.09.073
Kochan, C. G., and Nowicki, D. R. (2018). Supply chain resilience: a systematic literature review and typological framework. Int. J. Phys. Distrib. Logist. Manag. 48, 842–865. doi: 10.1108/ijpdlm-02-2017-0099
Li, R., Dong, Q., Jin, C., and Kang, R. (2017). A new resilience measure for supply chain networks. Sustainability 9:144. doi: 10.3390/su9010144
Li, Y., Ye, F., Dai, J., Zhao, X., and Sheu, C. (2019). The adoption of green practices by Chinese firms: assessing the determinants and effects of top management championship. Int. J. Operat. Prod. Manag. 39, 550–572. doi: 10.1108/ijopm-12-2017-0753
Lu, J., Wang, J., Song, Y., Yuan, C., He, J., and Chen, Z. (2022). Influencing factors analysis of supply chain resilience of prefabricated buildings based on PF-DEMATEL-ISM. Buildings 12:1595. doi: 10.3390/buildings12101595
Malek, A., Ebrahimnejad, S., and Tavakkoli-Moghaddam, R. (2017). An improved hybrid grey relational analysis approach for green resilient supply chain network assessment. Sustainability 9:1433. doi: 10.3390/su9081433
Mancheri, N. A., Sprecher, B., Bailey, G., Ge, J., and Tukker, A. (2019). Effect of Chinese policies on rare earth supply chain resilience. Resour. Conserv. Recycl. 142, 101–112. doi: 10.1016/j.resconrec.2018.11.017
Mohammed, A. (2020). Towards “gresilient” supply chain management: a quantitative study. Resour. Conserv. Recycl. 155:104641. doi: 10.1016/j.resconrec.2019.104641
Nie, P., and Yang, Y. (2016). Effects of energy price fluctuations on industries with energy inputs: an application to China. Appl. Energy 165, 329–334. doi: 10.1016/j.apenergy.2015.12.076
Peng, J., Peng, C., Wang, M., Hu, K., and Wu, D. (2022). Research on the factors of extremely short construction period under the sufficient resources based on grey-DEMATEL-ISM. PLoS One 17:e0265087. doi: 10.1371/journal.pone.0265087
Rajesh, R. (2020). A novel advanced grey incidence analysis for investigating the level of resilience in supply chains. Ann. Operat. Res. 308, 441–490. doi: 10.1007/s10479-020-03641-5
Rajesh, R. (2021). Optimal trade-offs in decision-making for sustainability and resilience in manufacturing supply chains. J. Clean. Prod. 313:127596. doi: 10.1016/j.jclepro.2021.127596
Rajesh, R., and Ravi, V. (2015). Modeling enablers of supply chain risk mitigation in electronic supply chains: a grey–DEMATEL approach. Comput. Indust. Eng. 87, 126–139. doi: 10.1016/j.cie.2015.04.028
Roostaie, S., and Nawari, N. (2021). The DEMATEL approach for integrating resilience indicators into building sustainability assessment frameworks. Build. Environ. 207:108113. doi: 10.1016/j.buildenv.2021.108113
Sarkis, J. (2003). A strategic decision framework for green supply chain management. J. Clean. Prod. 11, 397–409. doi: 10.1016/S0959-6526(02)00062-8
Shen, C., Li, S., Wang, X., and Liao, Z. (2020). The effect of environmental policy tools on regional green innovation: evidence from China. J. Clean. Prod. 254:120122. doi: 10.1016/j.jclepro.2020.120122
Shibin, K. T., Dubey, R., Gunasekaran, A., Luo, Z., Papadopoulos, T., and Roubaud, D. (2018). Frugal innovation for supply chain sustainability in SMEs: multi-method research design. Prod. Plann. Control 29, 908–927. doi: 10.1080/09537287.2018.1493139
Si, S.-L., You, X.-Y., Liu, H.-C., and Zhang, P. (2018). DEMATEL technique: a systematic review of the state-of-the-art literature on methodologies and applications. Math. Prob. Eng. 2018, 1–33. doi: 10.1155/2018/3696457
Smith, K., Lawrence, G., MacMahon, A., Muller, J., and Brady, M. (2015). The resilience of long and short food chains: a case study of flooding in Queensland, Australia. Agric. Hum. Values 33, 45–60. doi: 10.1007/s10460-015-9603-1
Soni, U., Jain, V., and Kumar, S. (2014). Measuring supply chain resilience using a deterministic modeling approach. Comput. Indust. Eng. 74, 11–25. doi: 10.1016/j.cie.2014.04.019
Sullivan-Taylor, B., and Branicki, L. (2011). Creating resilient SMEs: why one size might not fit all. Int. J. Prod. Res. 49, 5565–5579. doi: 10.1080/00207543.2011.563837
Thomas, A. V., and Mahanty, B. (2018). Dynamic assessment of control system designs of information shared supply chain network experiencing supplier disruption. Operat. Res. 21, 425–451. doi: 10.1007/s12351-018-0435-9
Wang, C., Nie, P., Peng, D., and Li, Z. (2017). Green insurance subsidy for promoting clean production innovation. J. Clean. Prod. 148, 111–117. doi: 10.1016/j.jclepro.2017.01.145
Xia, D., Xia, N., Zhang, Y., Xiong, J., and Zhu, R. (2022). Diffusion path identification of public opinion involving enterprise green technology adoption: an interpretive-structural-modeling based approach. Int. J. Environ. Res. Public Health 19:2817. doi: 10.3390/ijerph19052817
Zhao, L., and Huchzermeier, A. (2018). Supply chain risk management. Supply Chain Fin., 39–55. doi: 10.1007/978-3-319-76663-8_3
Keywords: the green supply chain resilience of agricultural products, sustainability, DEMATEL-ISM, gray, supply chain resilience
Citation: Wang J, Liu M, Chen Y and Yu M (2023) Influencing factors on green supply chain resilience of agricultural products: an improved gray-DEMATEL-ISM approach. Front. Sustain. Food Syst. 7:1166395. doi: 10.3389/fsufs.2023.1166395
Edited by:
Miguel Angel Prieto Lage, University of Vigo, SpainCopyright © 2023 Wang, Liu, Chen and Yu. This is an open-access article distributed under the terms of the Creative Commons Attribution License (CC BY). The use, distribution or reproduction in other forums is permitted, provided the original author(s) and the copyright owner(s) are credited and that the original publication in this journal is cited, in accordance with accepted academic practice. No use, distribution or reproduction is permitted which does not comply with these terms.
*Correspondence: Mingfei Liu, MzA5MTk3QHdodXQuZWR1LmNu
Disclaimer: All claims expressed in this article are solely those of the authors and do not necessarily represent those of their affiliated organizations, or those of the publisher, the editors and the reviewers. Any product that may be evaluated in this article or claim that may be made by its manufacturer is not guaranteed or endorsed by the publisher.
Research integrity at Frontiers
Learn more about the work of our research integrity team to safeguard the quality of each article we publish.