 Sika Gbegbelegbe
 David Chikoye
 Arega Alene
 Stephen Kyei-Boahen
 Godfree Chigeza
94% of researchers rate our articles as excellent or good
Learn more about the work of our research integrity team to safeguard the quality of each article we publish.
Find out more
ORIGINAL RESEARCH article
Front. Sustain. Food Syst., 14 February 2024
Sec. Climate-Smart Food Systems
Volume 7 - 2023 | https://doi.org/10.3389/fsufs.2023.1159901
This article is part of the Research TopicIncreasing Resilience and Adaptability to Climate Change of Vulnerable Groups in AgricultureView all 12 articles
Southern Africa has been experiencing long-term changes in its climate and future projections imply that droughts should last longer and become more intense in southern Africa. Already, the region has been experiencing an increase in consecutive drought years. This study contributes to the literature by using bio-economic modeling to simulate the impact of future droughts on food security in southern Africa and identify plausible pathways for enhancing regional food security under drought. Food production and food security in southern Africa were projected under drought using an adjusted version of a multi-market and multi-commodity global model, the International Model for the Policy Analysis of Agricultural Commodities and Trade (IMPACT), version 3.2. The results suggest that with moderate economic growth and no drought, southern Africa would not become wealthy enough to mitigate food insecurity by 2040. In this context, recurrent droughts would worsen food security by severely affecting the production of maize, the key staple food in the region. With consecutive two-year regional droughts, like what was experienced in 2014/15 and 2015/16, most countries would experience an increase of at least 10% in the number of people at risk of hunger within a single year. Key measures which could help enhance food security under droughts include (1) breeding for stress-resilient maize (resistance to both heat and drought stresses); (2) promote crop and diet diversification, especially in countries highly dependent on maize as a staple food crop; and (3) invest in rainwater harvesting.
Africa in general and Southern Africa in particular has been experiencing long-term changes in climate. More specifically, the observed mean surface air temperature has been increasing across Africa since 1980 and this is consistent with global warming trends (Hulme et al., 2001; Nicholson et al., 2013). In southern Africa, rising temperatures have also been observed (Sheffield and Wood, 2008; Jury, 2013). In addition, studies have shown that droughts are lasting longer and have also become more intense across the region whereas their frequency has increased in the northern part of the region (Fauchereau et al., 2003). In South Africa, the frequency of two-year consecutive drought has increased (Rouault and Richard, 2005).
Projections suggest that average precipitation would decrease in southern Africa, although heavy precipitation events are projected to increase. Consecutive dry days are also projected to increase across the region compared to today (Kitoh and Endo, 2016). In terms of weather extremes, an increase in the duration and intensity of droughts is projected for southern Africa (Seneviratne et al., 2012).
As a key staple food in the region, maize is a priority crop which receives considerable national attention. In Zambia, the bulk of the agricultural subsidies is directed toward maize (Culas and Hanjra, 2011). In Malawi, where the bulk of the maize is produced for own home consumption, the government operates a price band system to support maize production and control consumer prices (FAO, 2015). In Lesotho, Zimbabwe, Eswatini and Mozambique, maize also plays a central role in national food security policies (Mphale et al., 2003; Mudimu, 2003; Manyatsi and Mhazo, 2014; FAO, 2016).
However, maize is sensitive to soil moisture stress especially at flowering stage (Cairns et al., 2012). Jayanthi et al. (2014) used past weather data to estimate drought risk for maize production in the sub-regions of Malawi and Mozambique. The southern region of Malawi was found to be more prone to drought compared to the northern region. They made a similar conclusion for Mozambique where the southern region is expected to have drought return periods of 1 to 4 years which is lower than that of the northern region. Kamali et al. (2018) used biophysical and social indicators to assess drought vulnerability for maize in sub-Saharan Africa. They showed that southern Africa is more vulnerable to physical drought for maize. However, societal factors including national drought policy responses significantly influence maize vulnerability to drought across sub-Saharan Africa.
Given the future drought projections, it might be prudent to consider alternative crops as staple food in southern Africa. This foresight study contributes to the current literature by quantifying the bio-economic impact of future droughts in southern Africa; the results from this study should support disaster policies in southern Africa. The objectives of the study are:
• Simulation of the impact of future droughts on food security in southern Africa
• Identification of plausible pathways for enhancing regional food security under drought
The next section of the paper provides some background information on the importance of maize in the food diet and on the impact of past droughts on maize and agricultural production in southern Africa. The conceptual framework used in this study is described in section 3; results are presented in section 4 and they are followed by discussion in section 5. Section 6 concludes.
This section analyzes current food consumption patterns in southern Africa to highlight the role of maize in the average diet. The section also describes the impact of past droughts on agricultural production in southern Africa. The crops considered in the analysis include maize, the key staple food crop, and major cash crops such as soybean, groundnut, cotton and tobacco. Cassava and cowpea which are drought-tolerant are also considered for contrast.
Cereals provide 49% of the average per capita daily caloric intake in southern Africa followed by starchy roots; vegetable oils; meat, fish and eggs; and sugar & sweeteners (Figure 1). Across all countries in southern Africa, except Angola, cereals have the highest share among all food items, in terms of caloric intake. In Angola, starchy roots account for the highest share of daily caloric intake followed by cereals (Figure 1).
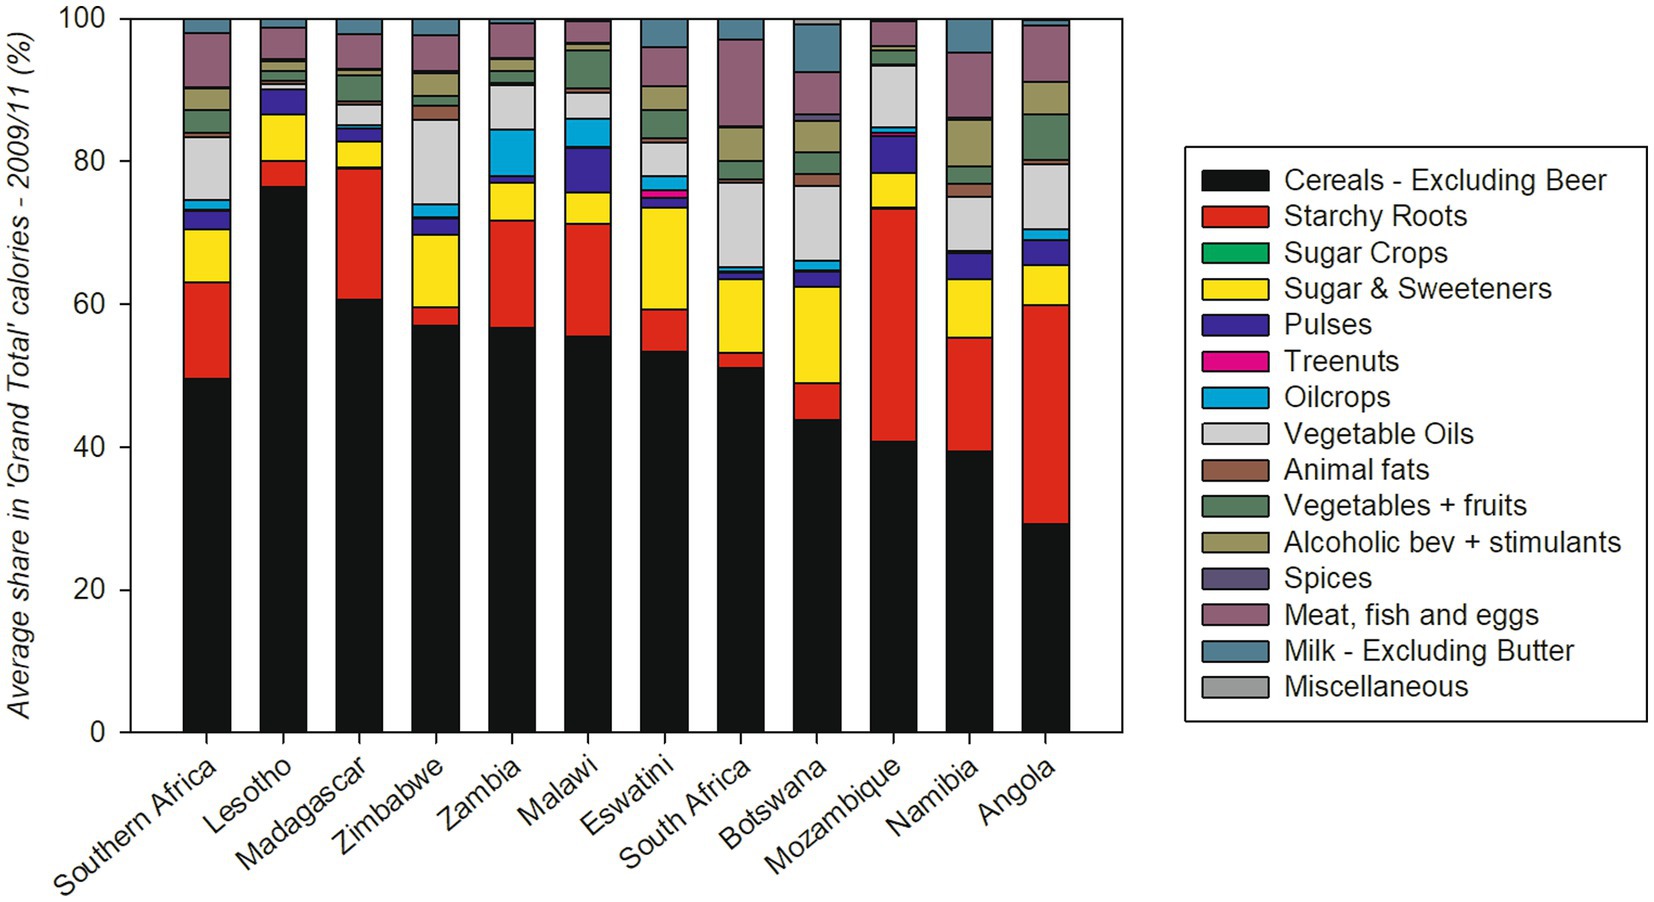
Figure 1. Contribution of staple food groups to daily caloric intake in southern Africa – average of 2009 to 2011). Source: authors’ computations using data from FAOSTAT (2018).
Cereal (wheat, maize, rice, oats, barley, rye, millet, and sorghum) consumption in southern Africa is 203 kg/person. However, maize accounts for 61% of cereal consumption. Compared to the world average, maize food consumption per capita in southern Africa is four times higher. It’s only in Madagascar that rice dominates cereal consumption (Table 1).
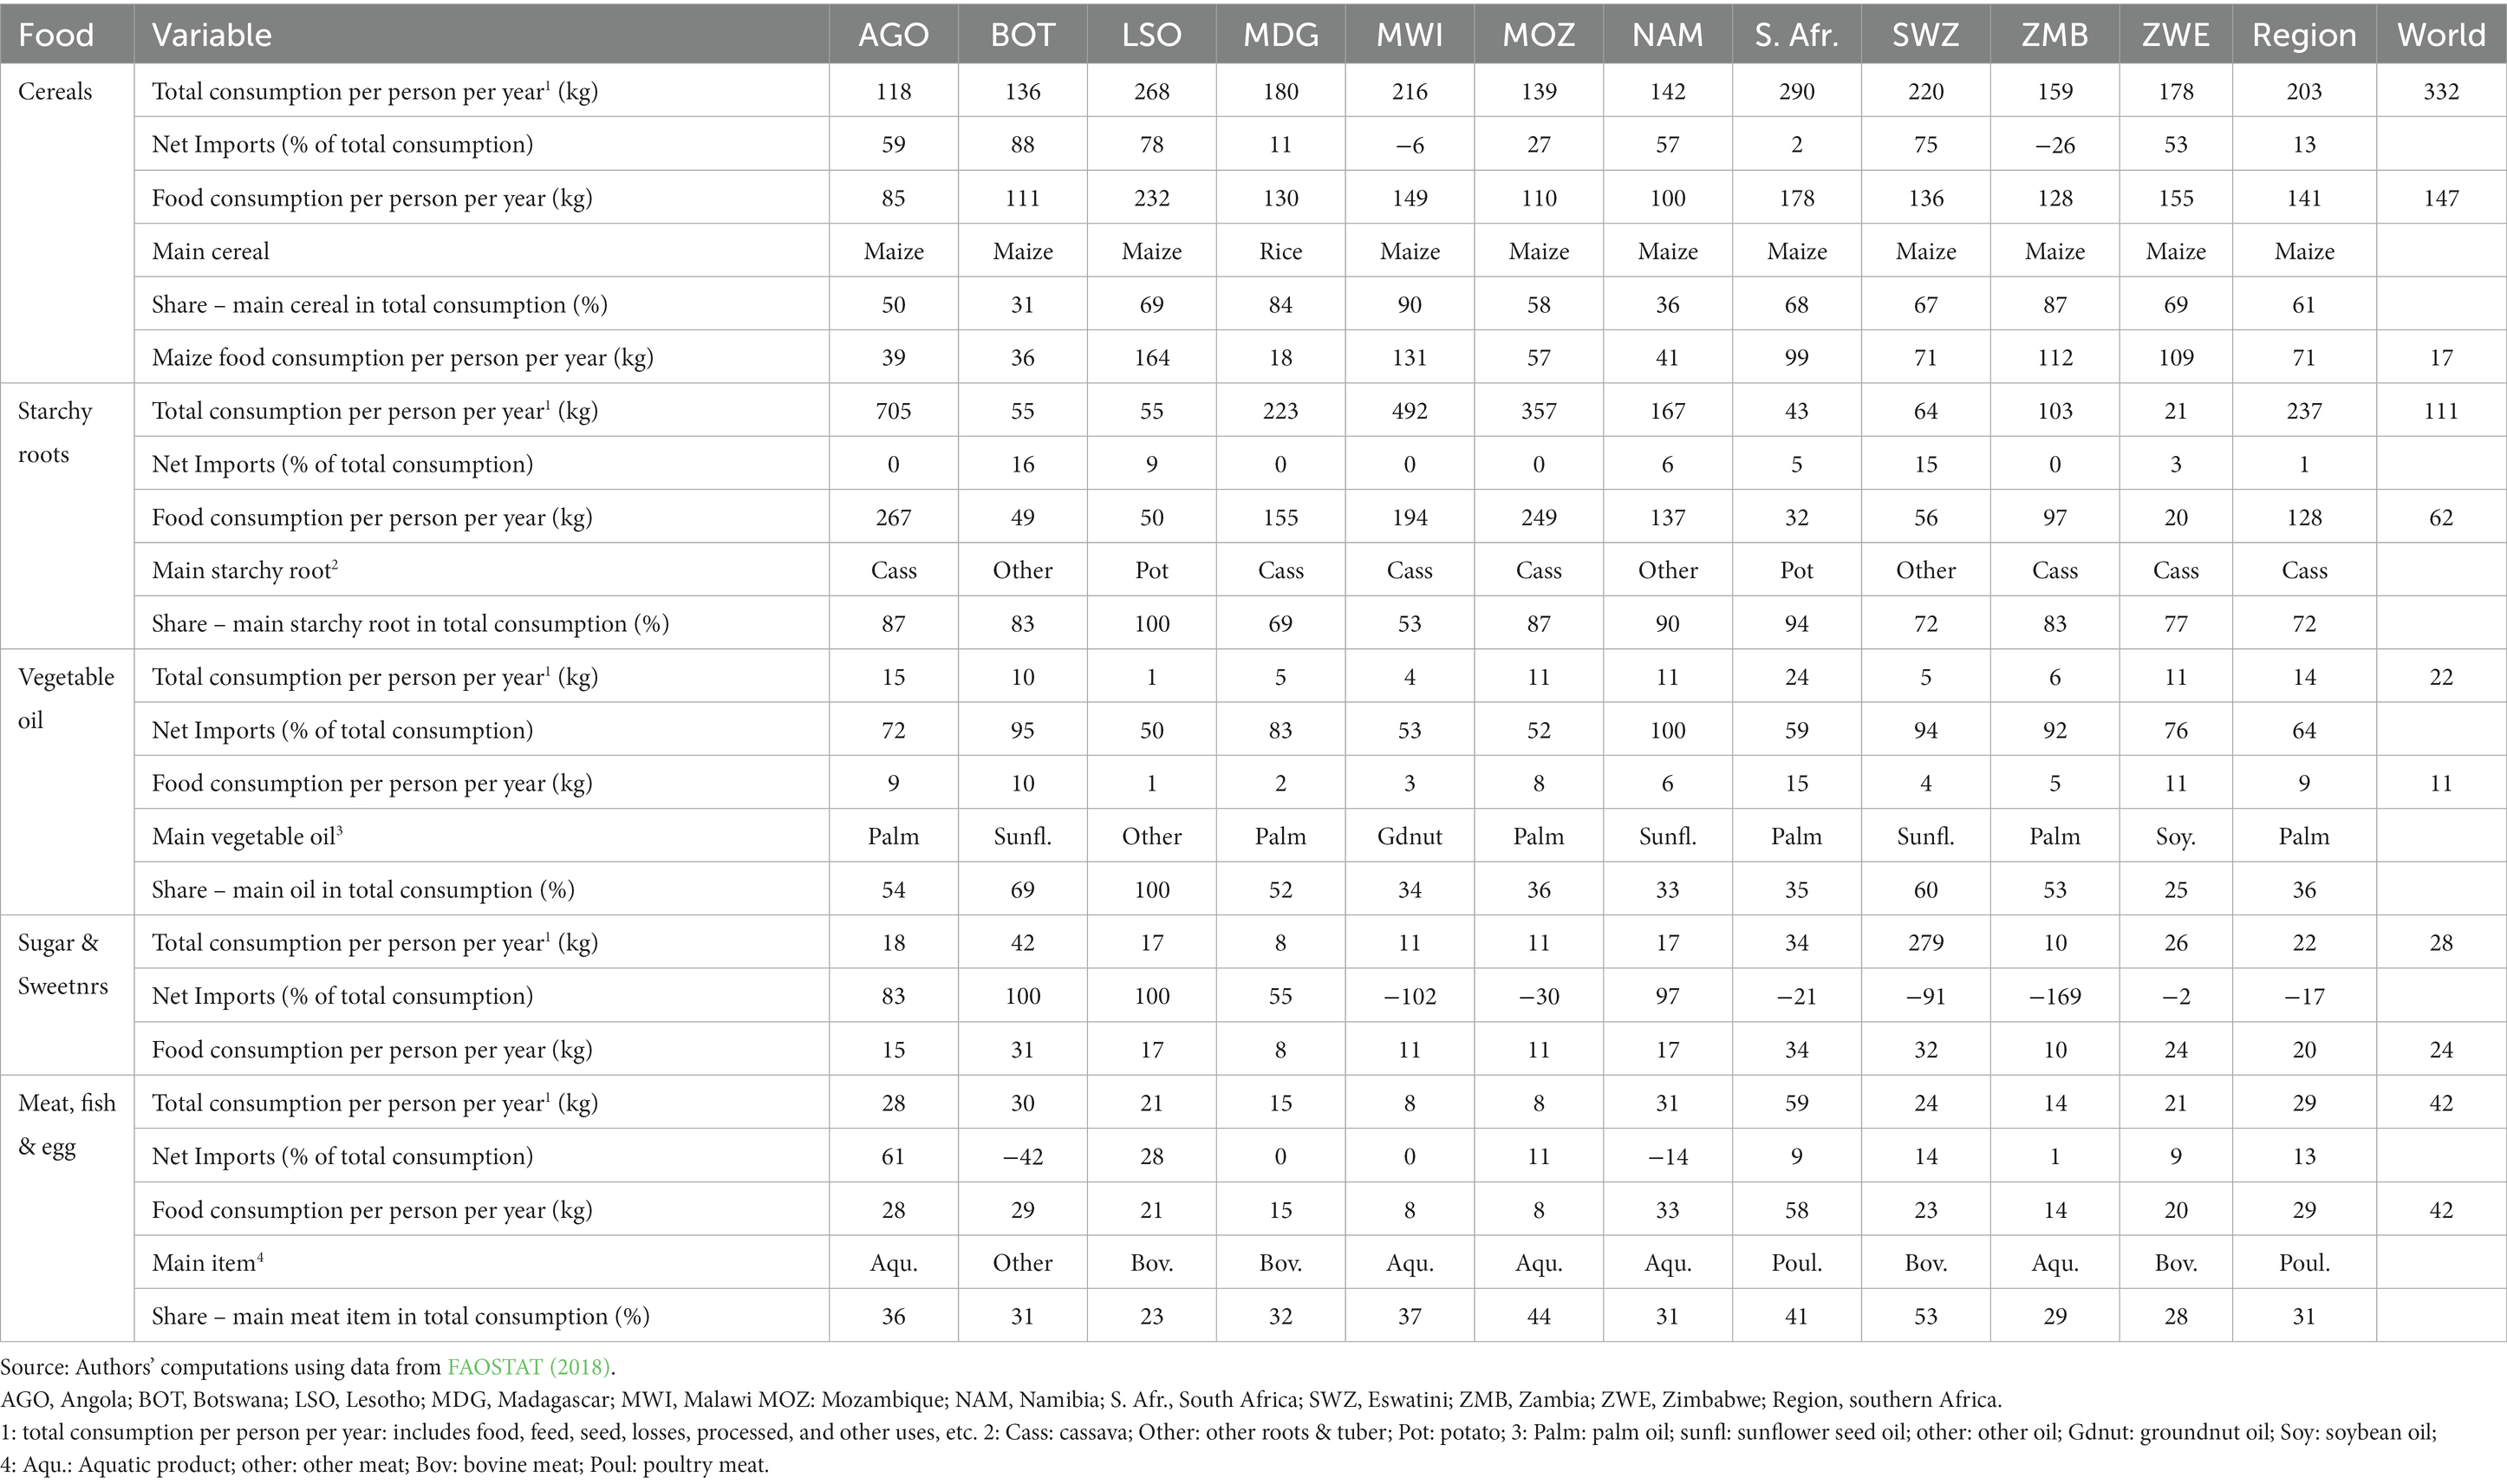
Table 1. Consumption of staple food items in southern Africa – average between 2009 and 2011.
The consumption of starchy roots as food in southern Africa stands at around 128 kg per person per year which is more than twice the world average. There are six countries in southern Africa where per capita food consumption of starchy roots is much higher than the world average; these countries also account for 58% of the total population in southern Africa. They include Angola, Malawi, Mozambique, Madagascar, Namibia, and Zambia. Across the region, cassava dominates consumption of starchy roots (Table 1).
Per capita consumption of vegetable oils in southern Africa is two-thirds that of the world average. It’s only in South Africa that per capita consumption of vegetable oils is 1.11 times higher than that of the world average. In all other countries in southern Africa, except Angola, per capita consumption is half that of the world average or less. In addition, southern Africa is heavily dependent on imports to meet its vegetable oils requirements with approximately 64% of the consumed vegetable oils being imported. For some countries, namely, Zambia, Eswatini, Namibia and Botswana, imports account for 90% of total vegetable oil consumption. Palm oil tops vegetable oil consumption in southern Africa (Table 1).
Per capita consumption of meat, eggs & aquatic products in southern Africa is below that of the world average. The region is also a net importer, although it currently imports about 5% of its total consumption requirement. Poultry dominates regional meat consumption (Table 1).
Southern Africa is a net exporter of sugar and sweeteners: the region’s exports amount to 17% of its total consumption (Table 1). Per capita consumption of sugar and sweeteners is close to that of the world average, although in Eswatini, consumption is 10 times higher than that of the world average. In Eswatini, most of the sugar consumed is allocated to other uses apart from food. For southern Africa, the consumption of sugar and sweeteners as food was 20 kg/capita/year on average between 2009 and 2011, which is slightly below than the world average, 24 kg/capita/year (Table 1).
Between 2000 and 2016, all countries experienced incidences of drought: Botswana and Zimbabwe experienced the highest number of drought events with 5 and 7 years out of 16, respectively. On the other hand, with only 2 drought reports, Zambia and Angola experienced the least number of droughts (Table 2).
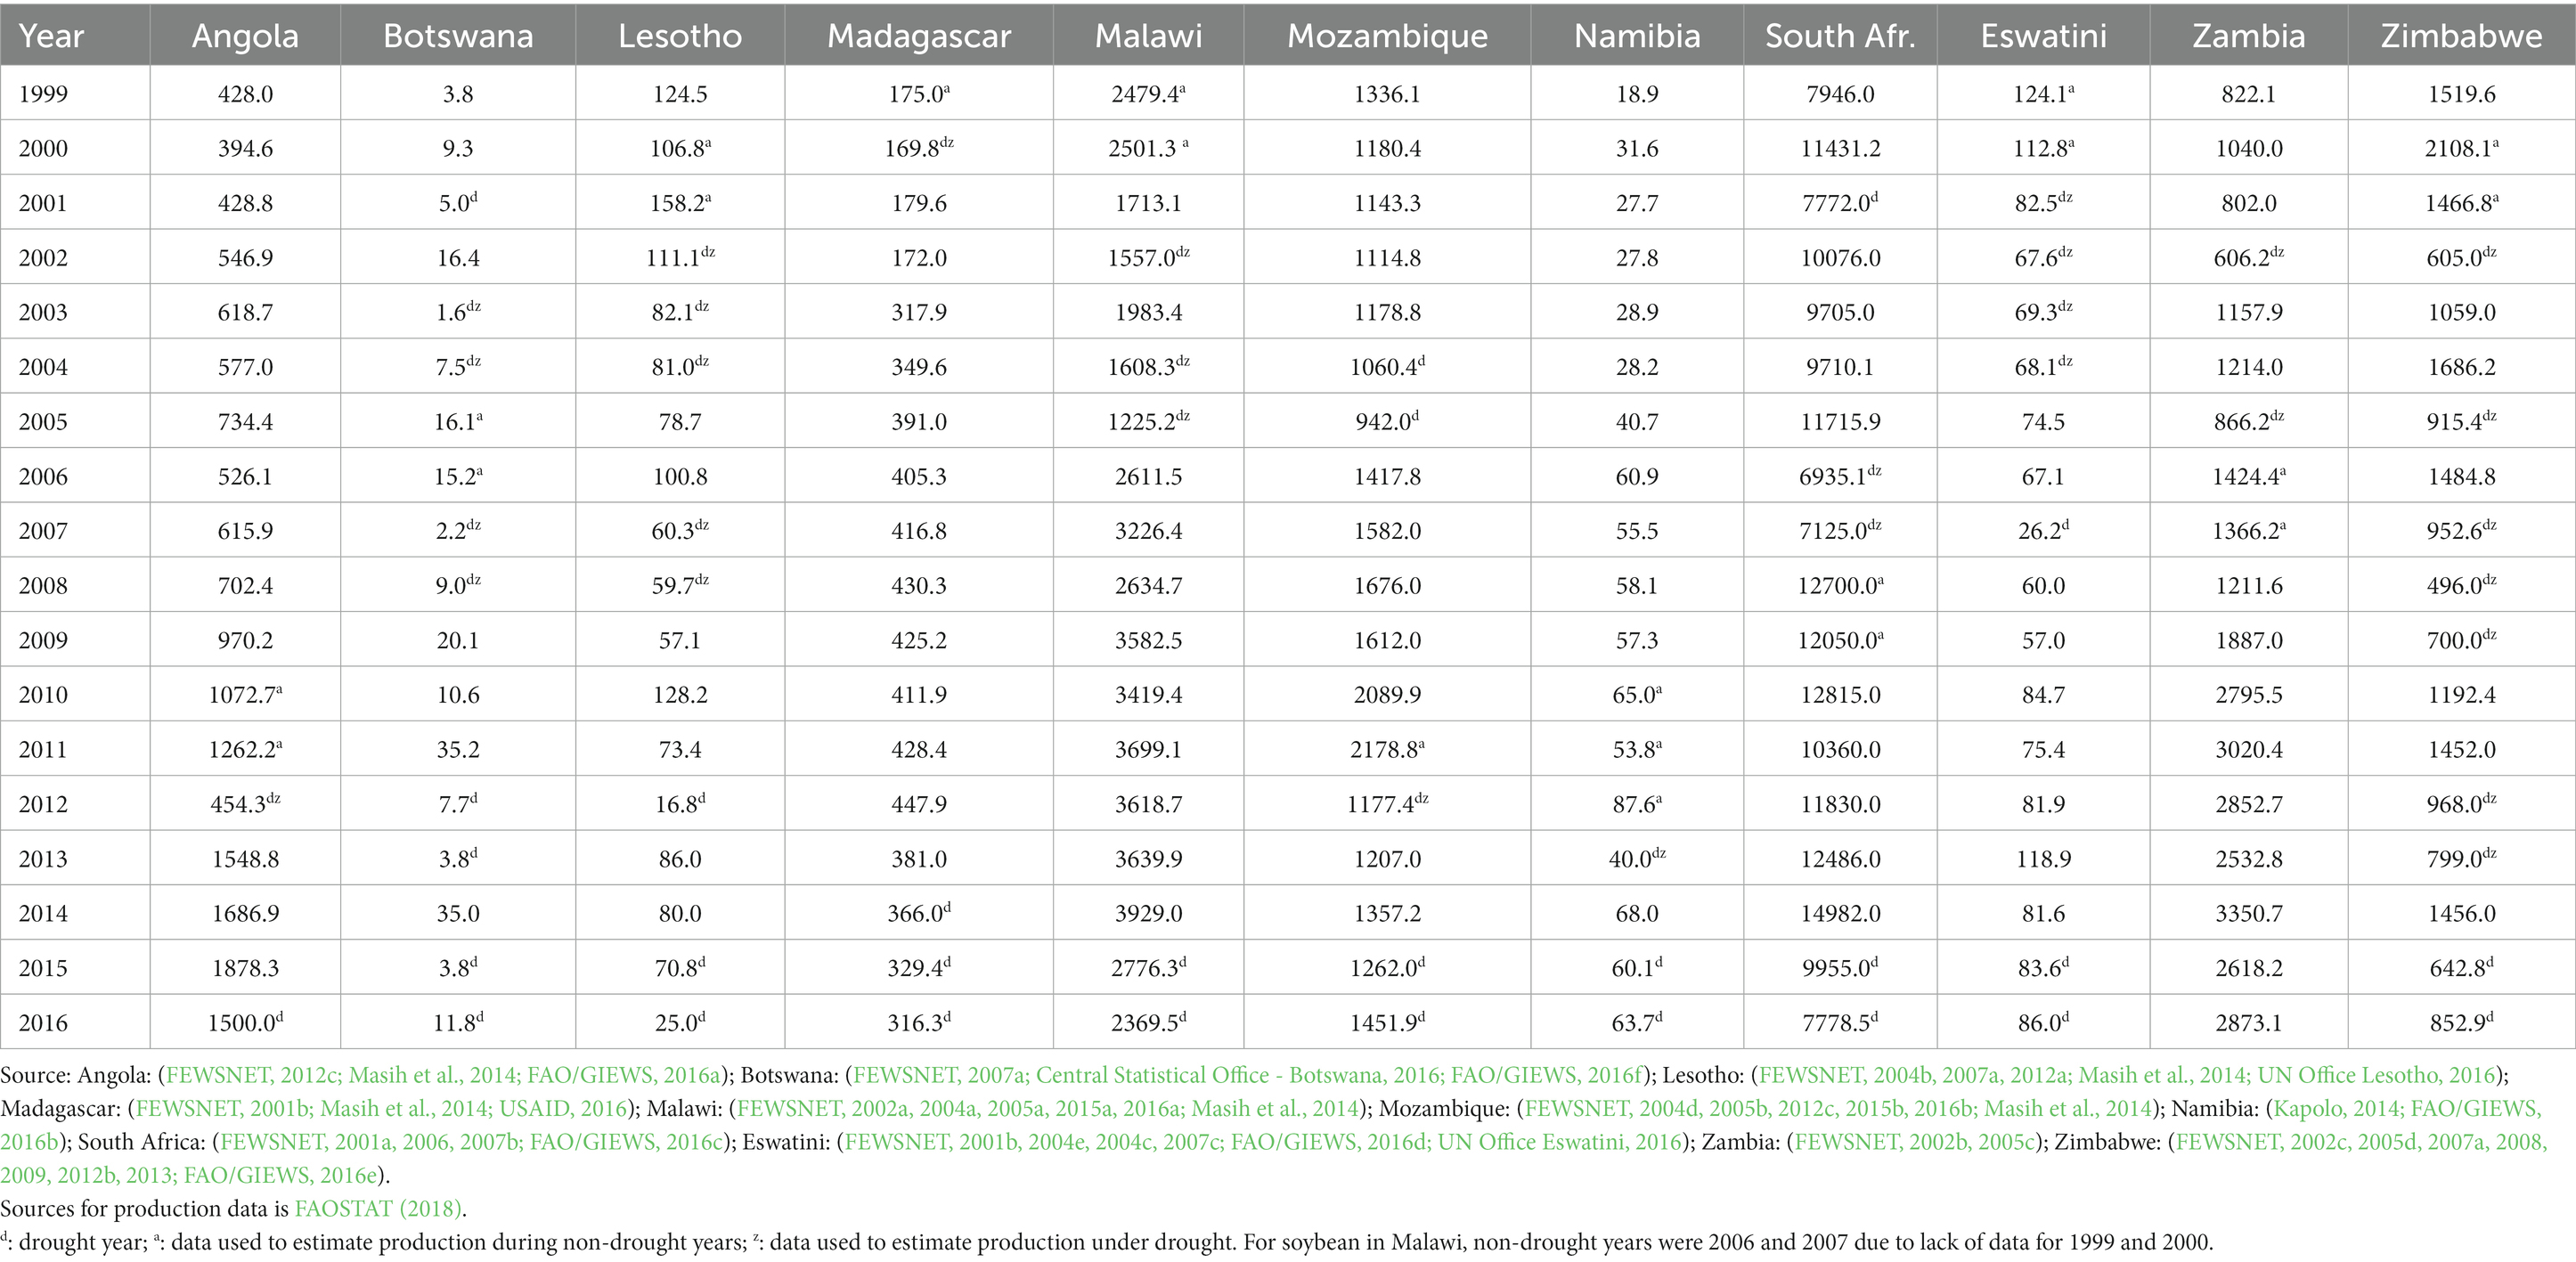
Table 2. Past drought years (marked with “d”) and corresponding maize production (000 MT) in 11 countries in southern Africa.
Drought reduces maize production by 3 to 67.7%, rice production by 3.5 to 62.4%, soybean production by 5.7 to 46.9%, groundnut production by 3.6 to 51.8%, and cotton production by 12.9 to 67.4% across countries in southern Africa (Table 3). In two countries, namely Zambia and Zimbabwe, cotton, tobacco and groundnut production decrease substantially due to drought. For maize, all countries except Angola experience a reduction in yields due to drought. In Mozambique, Namibia, South Africa, Eswatini, Zambia and Zimbabwe, reduced area under maize also occurs. Production changes due to drought are a result of effects on yield (kg/ha) and/or area (ha) and these effects vary across countries and crops. For example, in Madagascar, groundnut production increases by 1.5% under drought (Table 3). However, the yield effect from the drought is 1.1% whereas the area effect is about 0.40%.1 On the other hand, groundnut production in Malawi increases by 18.8% under drought. However, the analysis of this change reveals that groundnut yield decreases by 9.9% under drought whereas acreage increases by 32%.2 Malawian farmers are known to replace maize with groundnut when faced with drought (Okori, 2018).
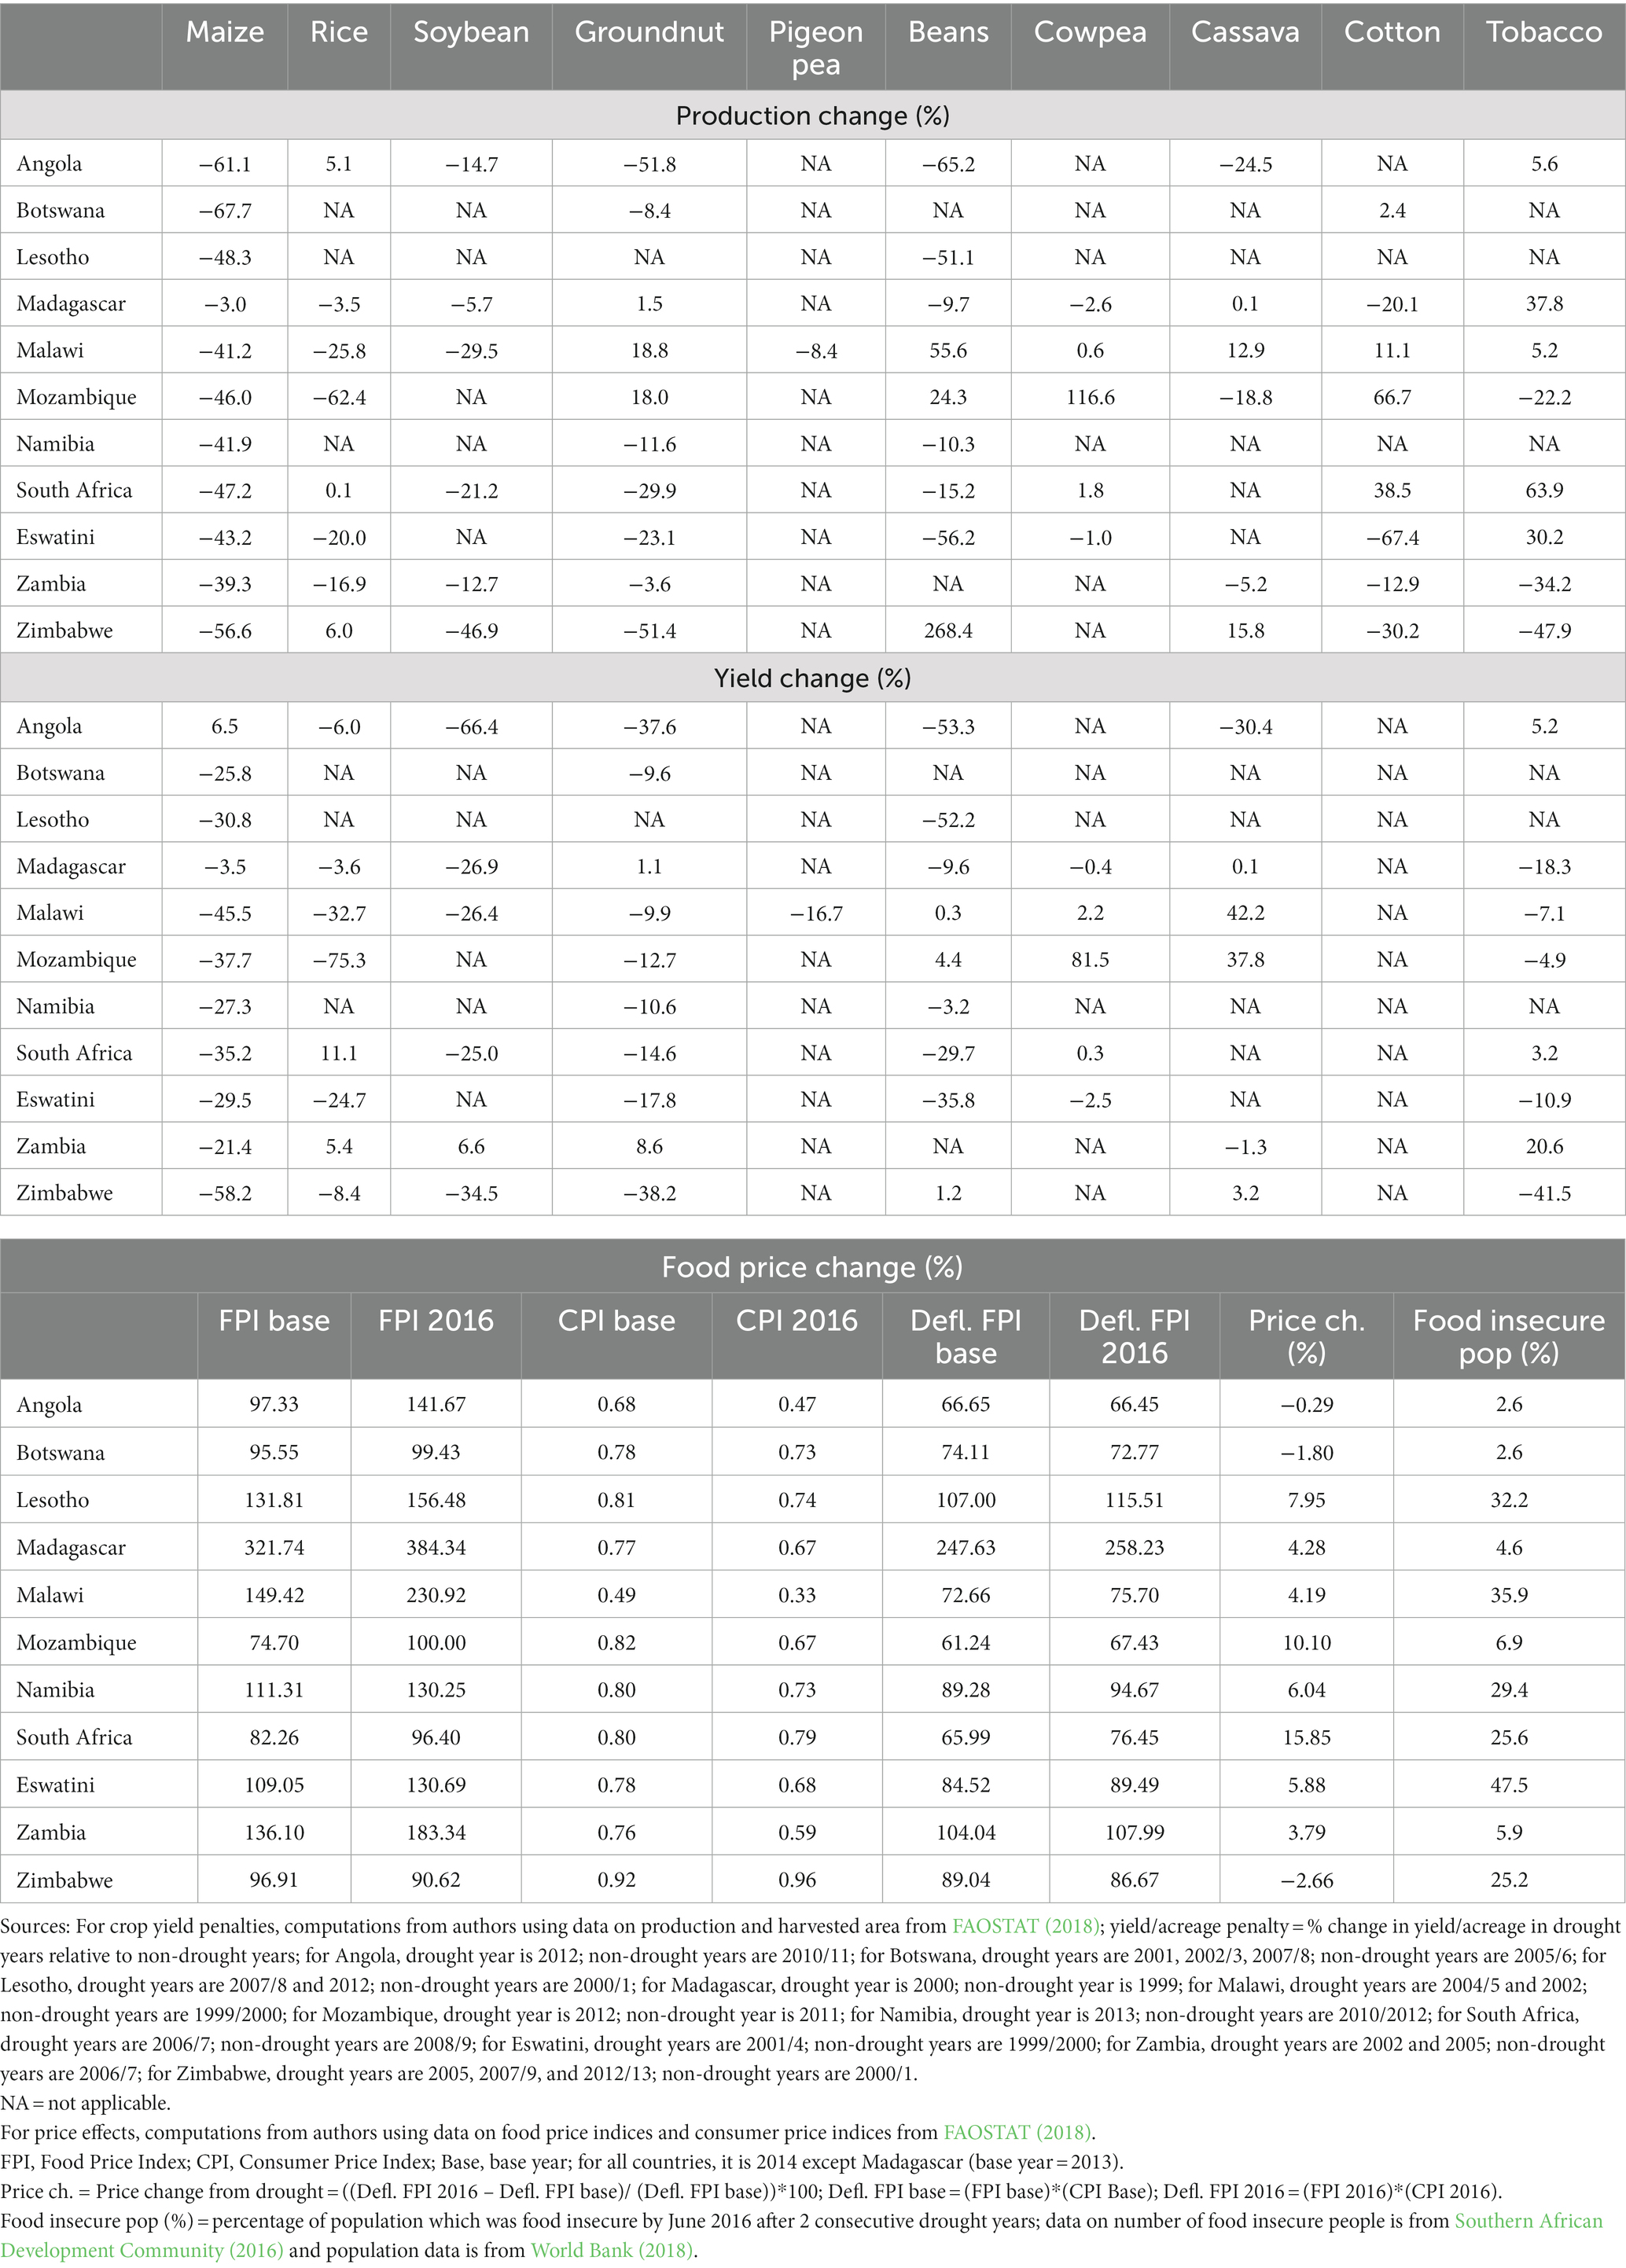
Table 3. Estimated effects of droughts on crop production, yield, and acreage.
Drought reduces available food supply and drives up food prices. In addition, drought erodes consumers’ income, especially for smallholder farmers who experience a reduction in agricultural production and hence income. These farmers find it difficult to purchase imported food, which has become more expensive. Here, the two-year droughts of 2014/15 and 2015/16 cropping seasons are used to analyze the impact of drought on food prices in southern Africa. In 2016, after two years of consecutive droughts, total maize production across southern Africa was 34% lower compared to that for 2014, a year characterized by no drought in the region except in Madagascar (Table 3). Real food prices were substantially higher in 2016 compared to 2014 across the region except in Angola, Botswana, and Zimbabwe (Table 3). In Angola, nominal food prices were substantially higher in 2016 compared to that for 2014. However, the Consumer Price Index (CPI) decreased substantially between the two years such that real food prices did not change much. For Botswana and Zimbabwe, there were small changes in the nominal Food Price Index (FPI) and CPI; hence, real food prices did not change much in 2016 compared to 2014. These results are consistent with reports on food insecurity which imply that less than 3% of the population in Angola and Botswana was food insecure in 2016 after a two-year drought. Zimbabwe is a peculiar case where more than 25% of the population was food insecure in 2016, after two consecutive drought years but real food prices were smaller in 2016 compared to 2014. Here, it might be that droughts affected food security by primarily reducing incomes and hence food purchasing power (Table 3).
Projections on food production and food security under drought scenarios in southern Africa were estimated using a process-based structural framework which combines crop, climate, hydrology, and economic models to globally project production, consumption, and food security under alternative scenarios of population and income growth (Islam et al., 2016).
The framework involves gridded crop modeling which is used to simulate pixel-level rainfed and irrigated crop yields under various climate change models (Figure 2). The simulated yields are inputted into an economic model, the International Model for the Policy Analysis of Agricultural Commodities and Trade (IMPACT), version 3.2 (Robinson et al., 2015). Within IMPACT, the simulated crop yields are adjusted over time by intrinsic productivity growth rates (IPRs) to reflect technological advancement in agriculture. IPRs are measured by combining expert knowledge with past trends in Total Factor Productivity (Robinson et al., 2013). Other inputs in IMPACT include exogenous trends on global population and income growth; these trends are derived from the Shared Socio-economic Pathways (SSP) (O’Neill et al., 2014). For this study, SSP4 is used; it involves moderate but unequal economic and population growth across all countries (Robinson et al., 2013). IMPACT uses input data on crop yields, irrigated water availability, population and income growth to project agricultural production, consumption, and trade. These results are further analyzed to project food and nutrition security outcomes (Figure 2).
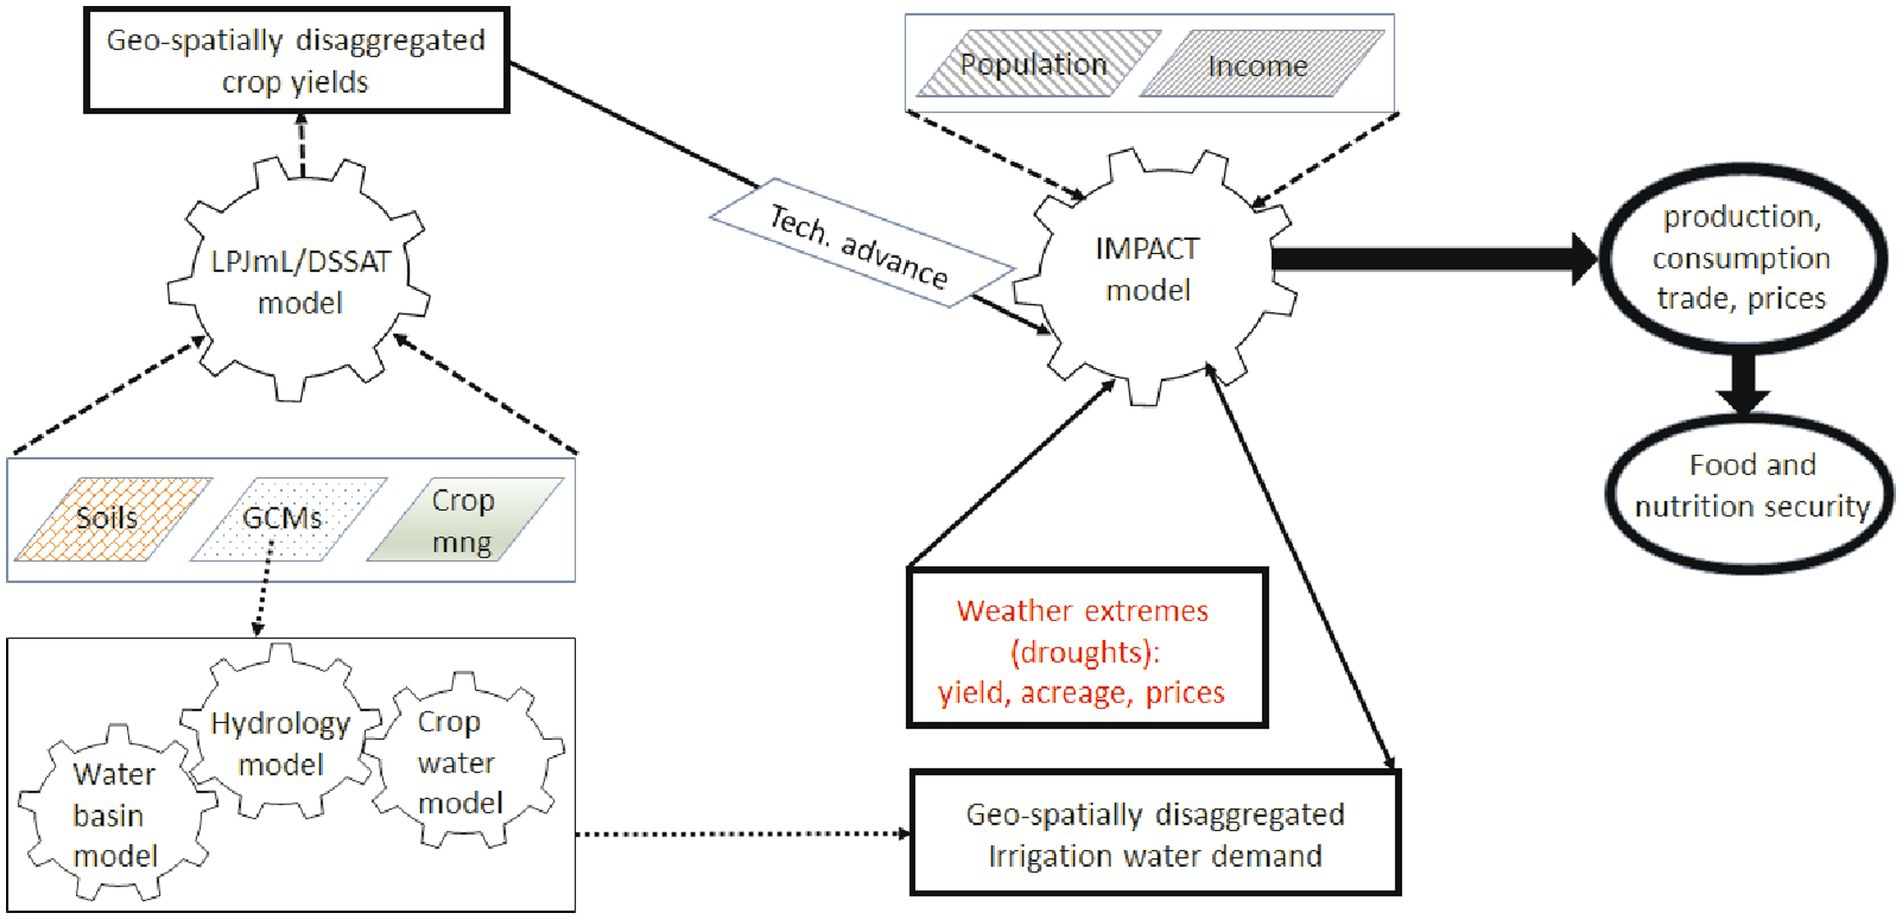
Figure 2. Structural framework used to project drought effects. Source: authors’ illustration using Robinson et al. (2015) and Islam et al. (2016).
In IMPACT, legumes such as soybean and groundnut are classified between traded and non-traded. Traded legumes can be exported and their prices vary with global markets. Non-traded legumes are entirely allocated to domestic processing and are priced based on national supply and demand. The pricing system for non-traded legumes can be considered as that of a contract farming system where prices are delinked from world markets. For this study, exogenous databases in IMPACT 3.2 were adjusted to reflect the increase of 25% in maize and soybean production in SSA between 2005 and 2011.
The yield and acreage penalties from drought were incorporated into the IMPACT model as exogenous shocks to crop yields and/or acreage for drought years (Figure 2). For each country, crop acreage would be reduced by an exogenous rate, “ ” under drought. Then, the following year, crop acreage would be returned to trend using Equation (1):
= area recovery rate which brings crop acreage back to trend for commodity “c” in country “cty” at year “t” plus the number of drought years “n”; “n” = 1, 2…, “n” consecutive drought years.
= acreage loss brought by drought for commodity “c” in country “cty” during year “t”.
The same approach is used for incorporating yield loss from drought into the IMPACT model. After the drought year, crop yield is brought back to trend using Equation (2):
= recovery rate which brings yield back to trend for commodity “c” in country “cty” at year “t” plus the number of drought years “n”; “n” = 1, 2…, “n” consecutive drought years.
= yield loss from drought for commodity “c” in country “cty” during year “t”.
In IMPACT, only the yield and acreage losses (Table 1) from drought were used. For example, the positive yield increase for Angola was not inputted as an exogenous shock in the model; similarly, the positive acreage changes for Malawi and Madagascar were not inputted into the model (Table 1). It can be safely assumed that the yield and acreage losses are mainly caused by drought, an external physical event. However, positive yield and acreage losses are mainly influenced by socio-economic factors, including relative price changes; hence, they can be considered as an indirect effect of drought. An optimization model such as IMPACT should be able to capture the indirect effects of droughts. In IMPACT, food production units for each country are defined relative to water basins and it is assumed that farmers in each food production units allocate land and other inputs across agricultural commodities depending on relative output prices. In the model, consumer demand for food is dependent on population growth and preferences which vary and change over time based on income changes. IMPACT solves for long-run optimal international trade through the following Equation (3) expression (Robinson et al., 2015):
= net exports in thousand metric tonnes for country “cty” and commodity “c” for year “t”.
The annual solution on international trade generates world and national price signals which are used to project long-run agricultural production and food consumption. Net exports defined as a function of production, demand, and stocks is written in Equation (4):
= annual production of commodity “c”: by country “cty” for year “t”.
= annual consumption of commodity “c” by country “cty” for year “t”.
= annual stock of commodity “c” by country “cty” for year “t”.
The projections on national food production and consumption are then used to estimate food security using the equations and coefficients derived from Fischer et al. (2005). More specifically, the share of people at risk of hunger is defined through Equation (5):
= share of the population which is at risk of hunger for country “cty” and for year “t”.
= relative kilocaloric consumption in country “cty” in year “t”.
And where relative caloric consumption is in Equation (6):
= average caloric consumption in country “cty” for year “t”.
= minimum caloric consumption in country “cty” for year “t”.
As a process-based modeling framework which assess long-run trends for “what if” scenarios, IMPACT cannot be used to estimate multiple solutions for a single scenario. Hence confidence intervals on projected estimates cannot defined with IMPACT, unlike what could be done with purely statistical models.
In IMPACT, the price effect caused by drought is inputted as an additional markup on national food prices (Figure 2). In a drought year, the marketing margin for national food prices were adjusted upward by a coefficient, “ ”, reflecting the change in food prices brought by drought as estimated in Table 3. For Angola and Botswana, where food prices slightly decrease under drought, no price shock was inputted into IMPACT. For Zimbabwe, the drought price effect used is the same as that of its major food trade partner, South Africa. For each country, the food price effect brought by drought was applied to all food commodities irrespectively. Given that yearly prices are endogenously estimated in IMPACT, no recovery rate is applied to prices in non-drought years unlike what is done for crop yields and acreage. When a country is faced with consecutive droughts, the price effect from drought is multiplied by two for the second consecutive year and by ‘n’ for the nth consecutive drought year. In addition, when drought decreases regional maize production by more than 21%, the price increase from drought is also applied to all countries in IMPACT to reflect regional food scarcity. The 21% threshold reflects the regional production difference in 2015 and 2016 (2-year consecutive drought) compared to 2010 and 2011 which are also two years characterized by no drought across the whole region (Table 2).
The frequency of reported droughts per country (Table 2) between 2000 and 2016 was used to project future occurrences of drought. For example, if there were two reported droughts in any given country between 2000 and 2016, the drought frequency would be 11.8%; this frequency was then multiplied by 16, the number of years between 2020 and 2035, to project the number of future incidences of drought. Drought years were then randomly selected to match the projected number of droughts between 2020 and 2035 (Table 4). Based on the projected drought events, all countries except South Africa and Angola would experience at least two consecutive drought events between 2025 and 2040. For each drought year in a country, the corresponding price increase was also estimated. For example, Mozambique is projected to experience drought in 2027 (Table 4); that year, food prices across the country would increase by 10%. The next year, droughts would reduce regional production by at least 25%. Hence, Mozambique would again experience an increase in food prices even if the country itself would not experience drought (Table 4).
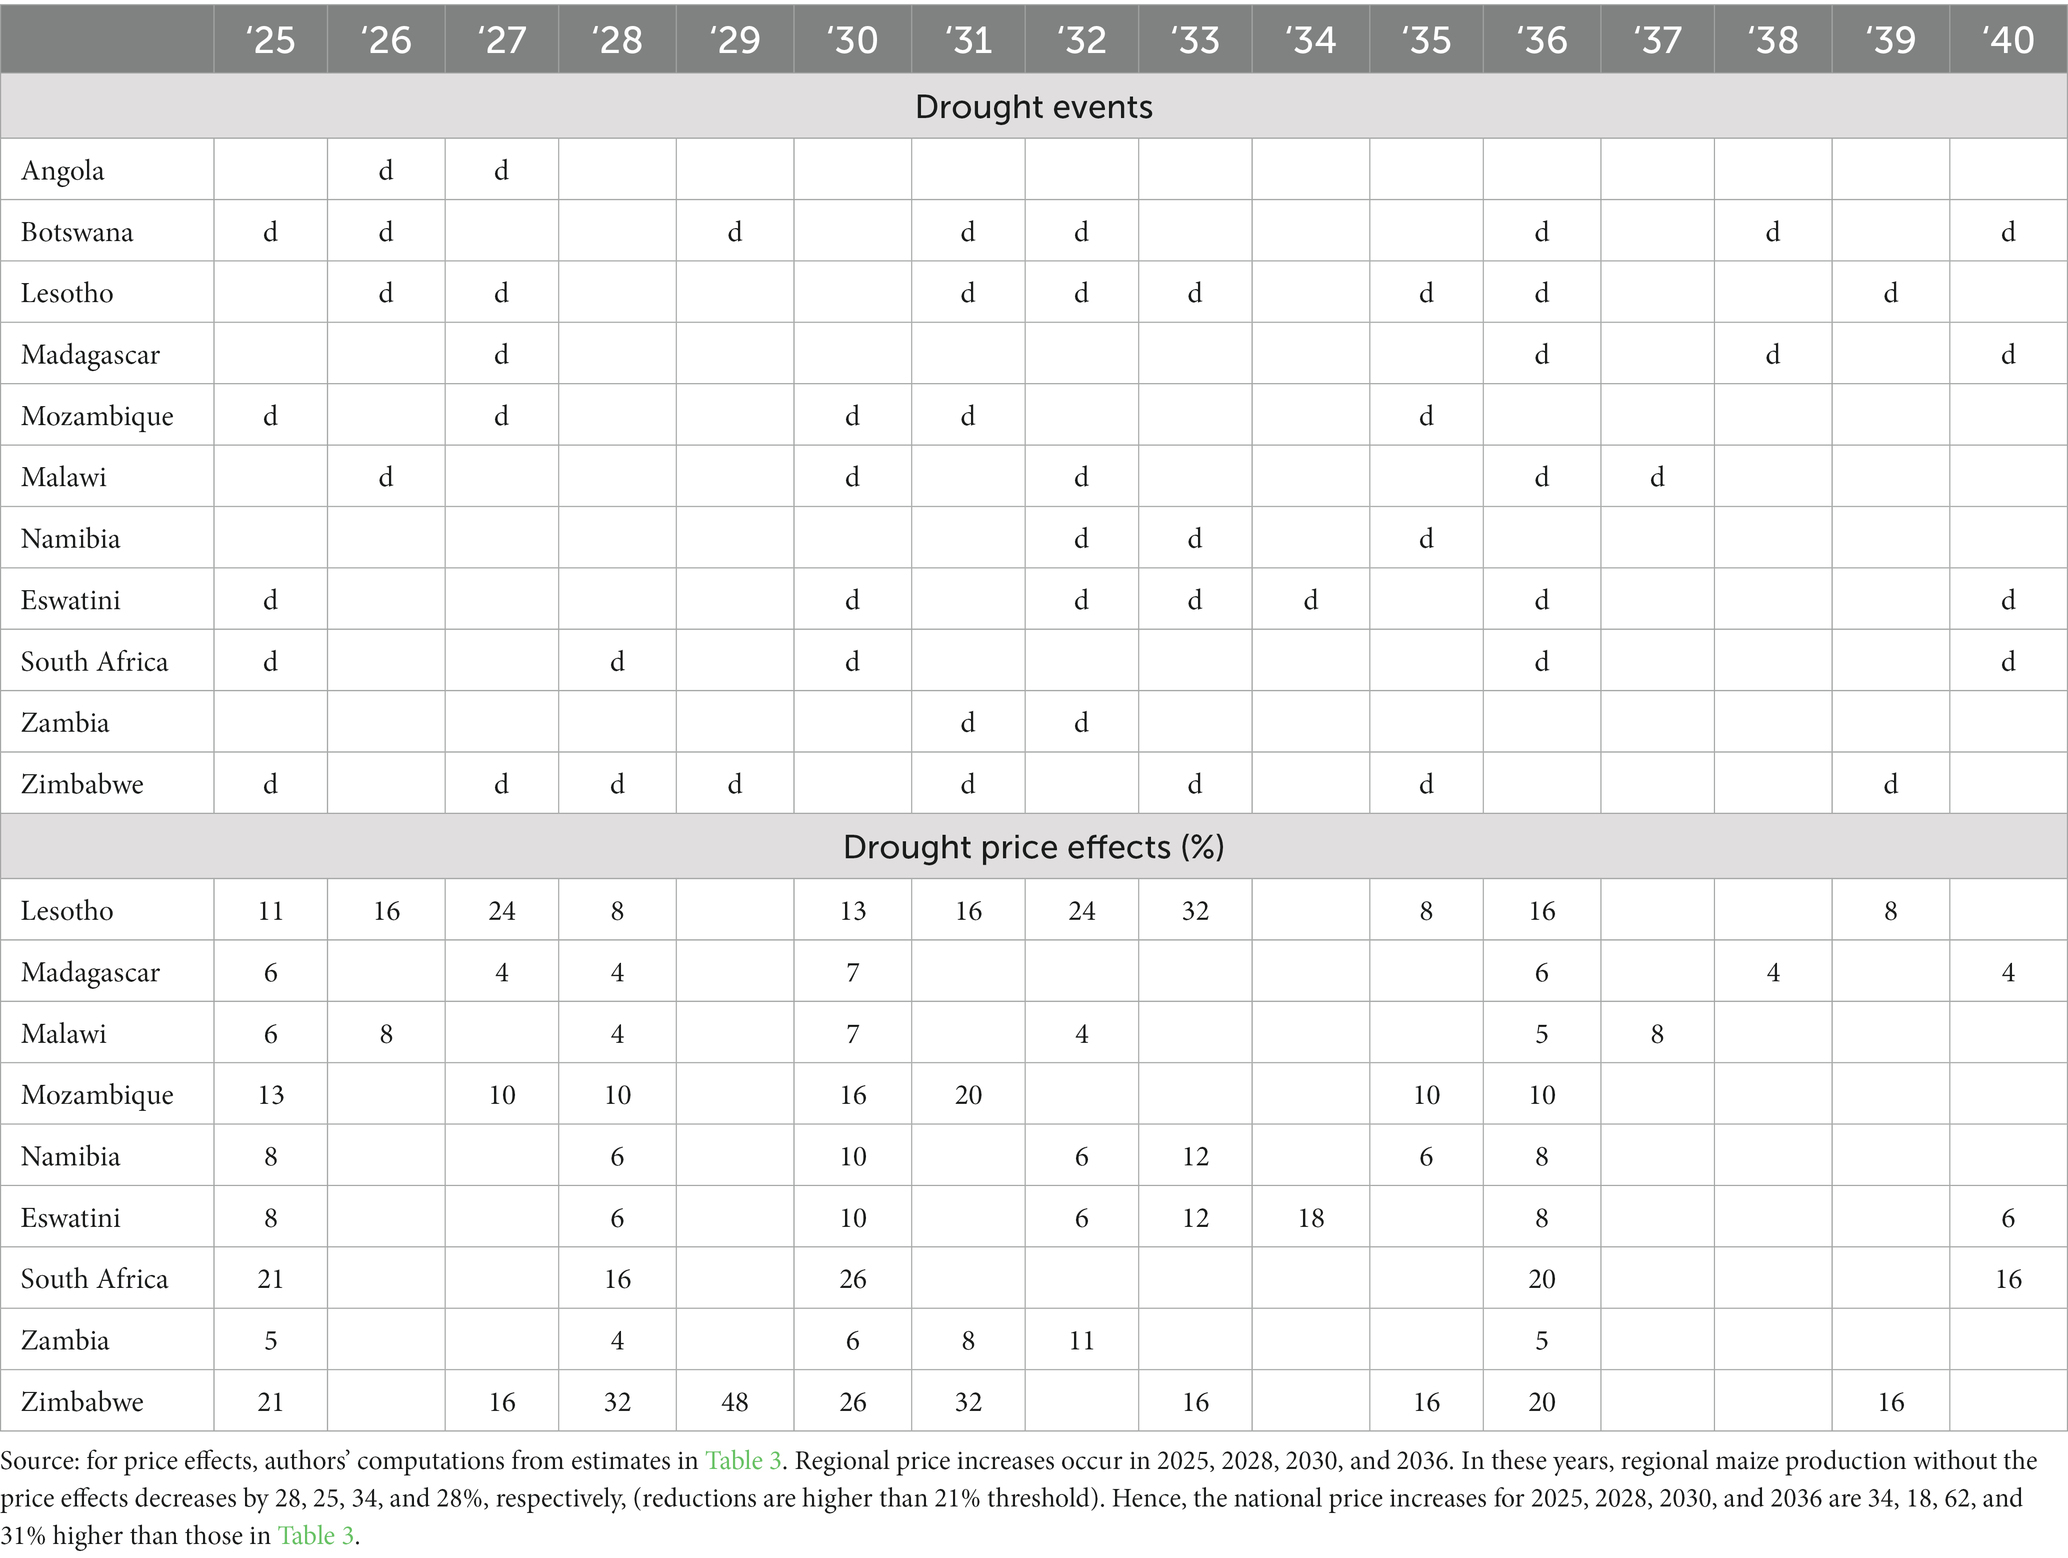
Table 4. Projected drought events and drought price effects across southern Africa between 2025 and 2040.
In IMPACT, tobacco is bundled with “other crops” for all countries. However, for Malawi, Zimbabwe and Zambia, tobacco dominates “other crops” in the IMPACT model. For these countries, production values for ‘other crops’ in the base year (three-year moving average for 2005) in the model are very similar to the three-year moving average tobacco production for 2005, based on FAOSTAT: the difference is less than 15%. Hence, in this study, it is assumed that drought affects tobacco production in Malawi, Zimbabwe, and Zambia; these three countries accounted for 73% of tobacco production in southern Africa between 2004 and 2006.
One limitation of the methodology is that IMPACT, as a partial equilibrium model, does not capture the indirect effects of droughts on the industrial and service sectors; it only focuses on the agricultural sector. For countries which depend heavily on agriculture, droughts are likely to negatively affect the industrial and service sectors. The compounding effects of drought on these sectors should further worsen food insecurity; some of these effects are captured through the observed price effects used in this study (Table 4). However, these observed price effects are also reflecting the impact of policy measures which were deployed in each country toward disaster management. As such, the simulated results from IMPACT on the effect of droughts on the number of people at risk of hunger is likely to be underestimated for some countries.
This section shows how changes in population and income will influence production and food security in southern Africa by 2040. The section highlights the importance of non-climate drivers, such as population and income changes, in influencing food security in the region. The results in this section also serve as a baseline to assess the impact of droughts in southern Africa over the same time frame (2010 to 2040).
Per capital food consumption is projected to increase across southern Africa by 2035, assuming moderate but unequal growth in per capita incomes. Across the region, stimulant consumption would experience the highest increase followed by meat, fruits, pulses, vegetables, and cereals (Figure 3A). The rise in meat consumption would be reflecting the impact of rising incomes as per capita consumption of all meat products including pork, poultry, lamb, and beef would substantially rise (Figures 3A,B).
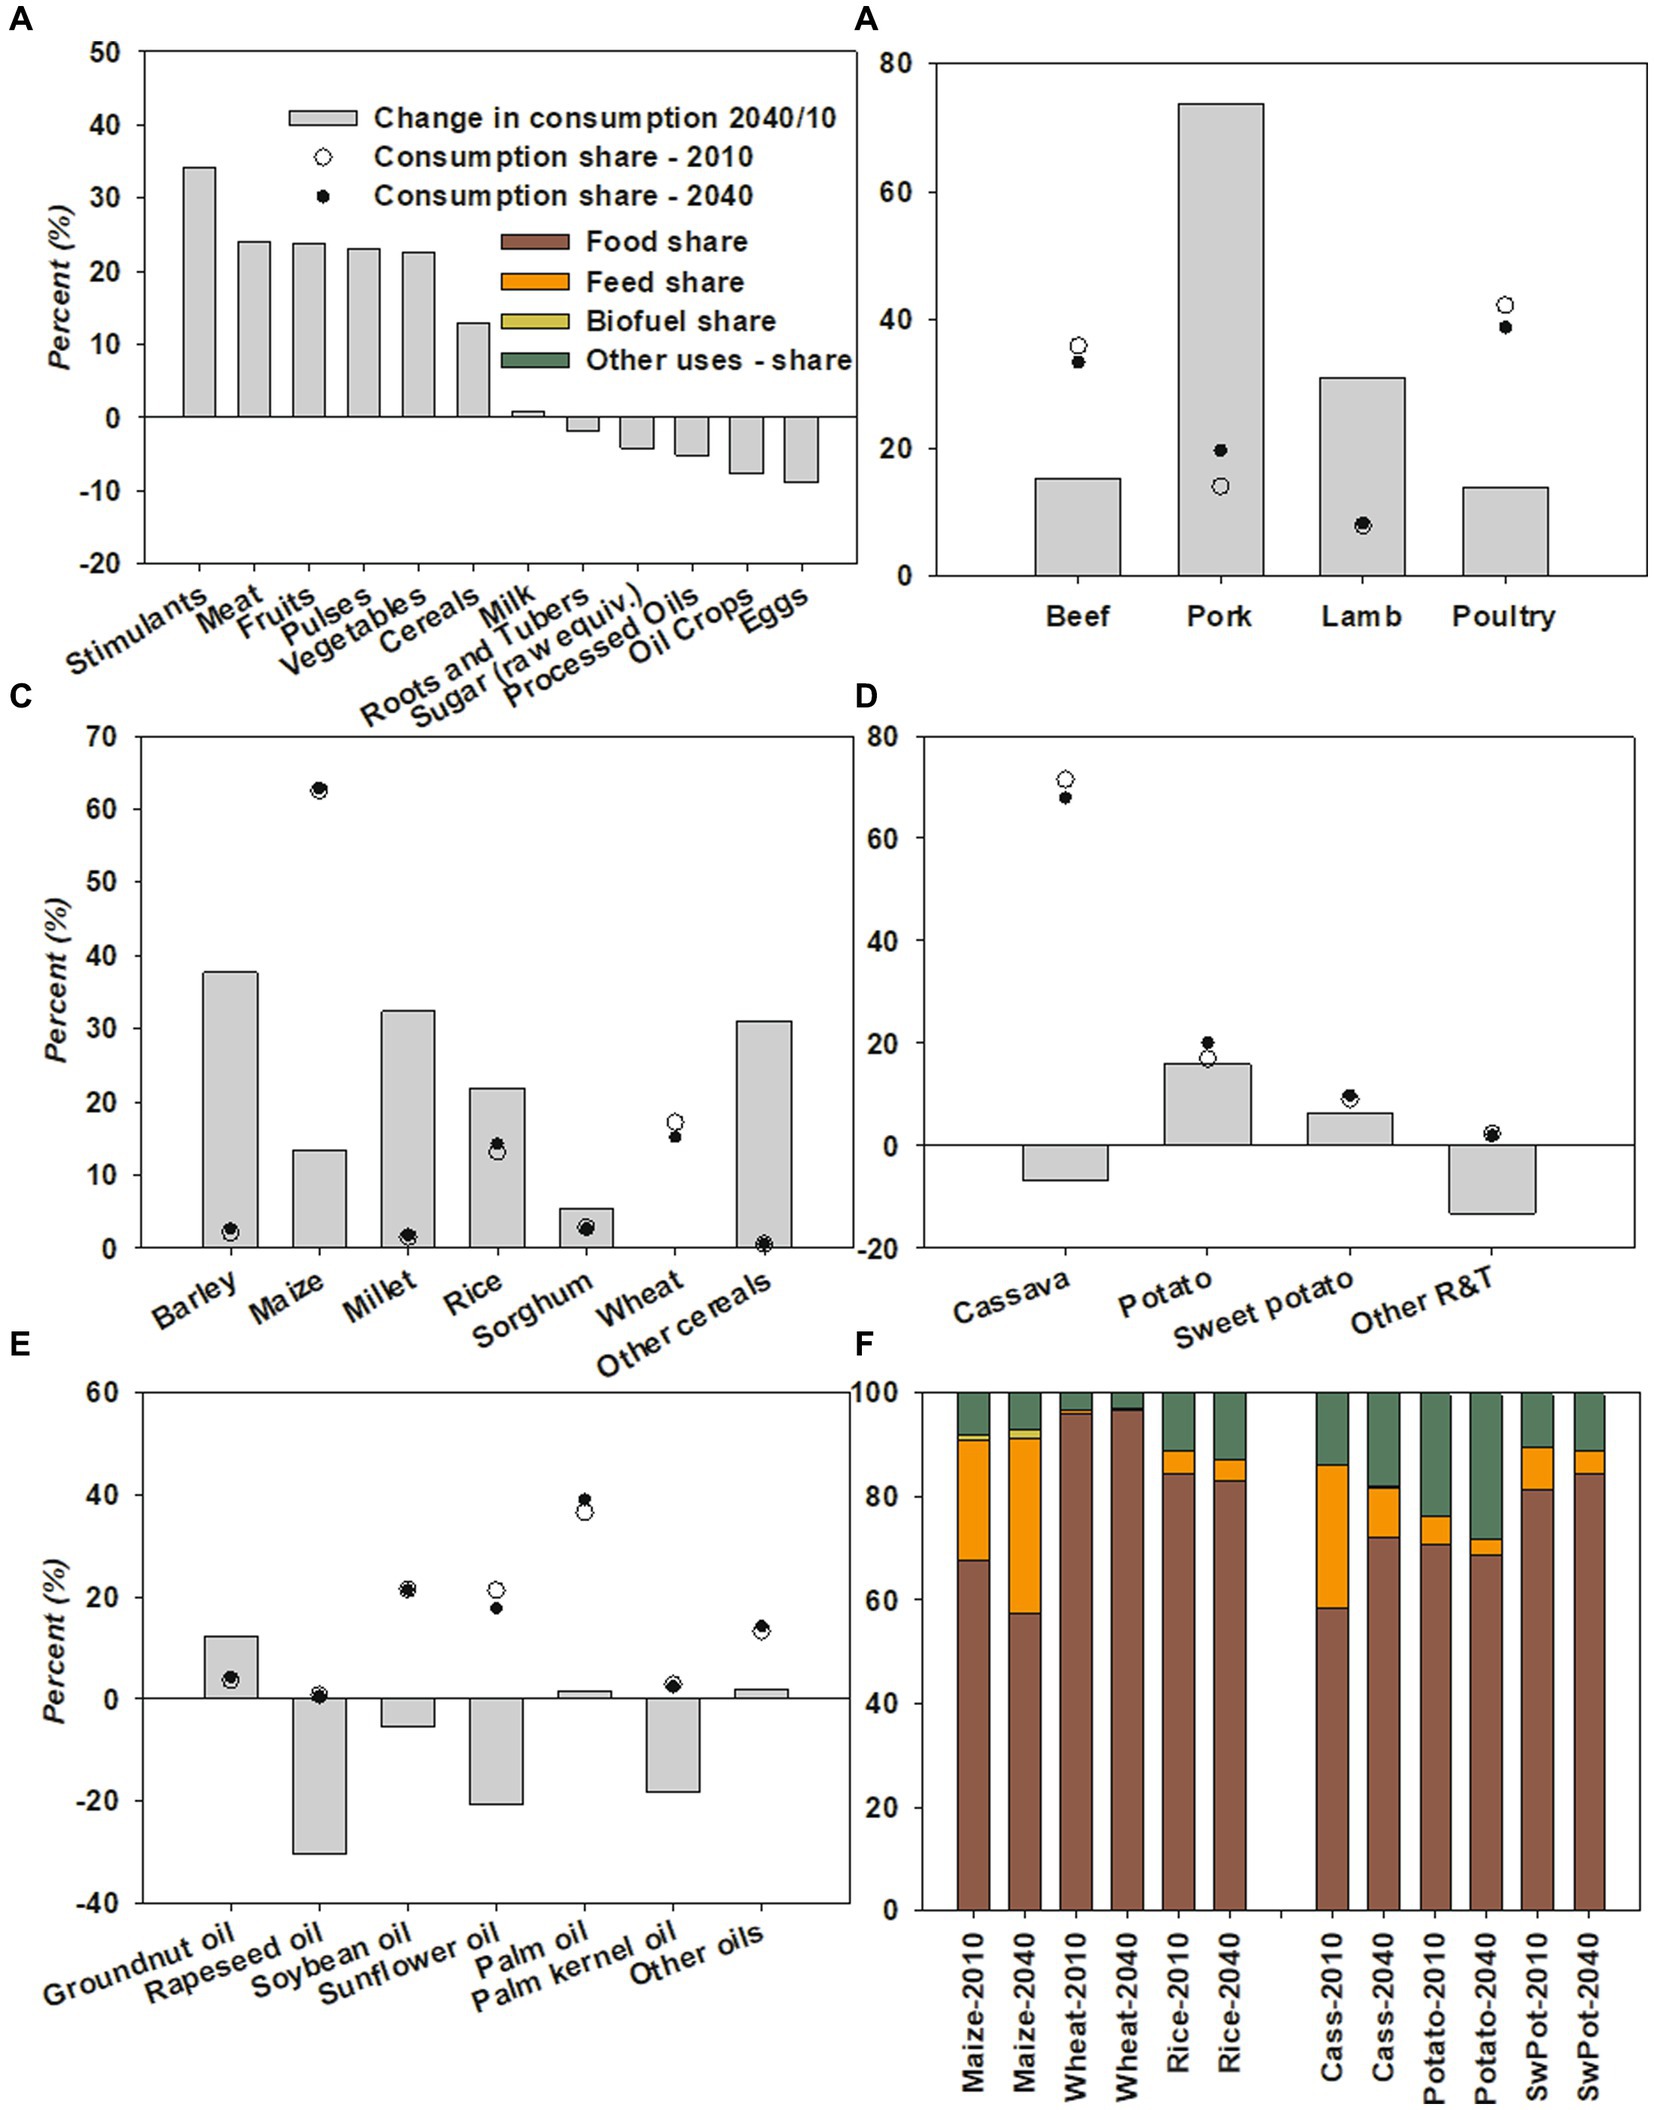
Figure 3. Projected changes in consumption patterns in southern Africa under the ‘no drought’ scenario - 2040 versus 2010 (%); (A) Food groups; (B) Meat; (C) Cereals; (D) Starchy roots; (E) vegetable oils; (F) use shares for selected cereals, roots and tubers Source: authors’ computations using results from IMPACT3.2.
Per capita consumption of cereals would increase by a little more than 10% between 2010 and 2040. Maize would still dominate cereal consumption by 2035 followed by wheat and rice each of which would still account for more than 10% of cereal consumption (Figure 3C). Per capita consumption of wheat would not change between 2010 and 2035; for maize and rice, consumption would increase by about 15 and 20%, respectively (Figure 3C). Among these three cereals, only maize would experience substantial changes in utilization. In 2010, the share of maize consumed as food was about 70% whereas 25% of all consumed maize was allocated to animal feed (Figure 3F). By 2035, these values would change to about 60% for food and 35% for animal feed, reflecting the positive impact of rising incomes on the demand for livestock-based products. For rice and wheat, utilization patterns would not change substantially between 2010 and 2035, as these two cereals would still be primarily consumed as food in 2040 (Figure 3F).
For root and tubers, per capita consumption in southern Africa would not change much between 2010 and 2040. In 2010, cassava and potato dominated the consumption of roots and tubers, each accounting for more than 10% of consumption. In 2040, the same two products would still dominate consumption. Cassava alone would still be accounting for more than 60% of the consumption of roots and tubers, but its utilization would change between 2010 and 2040, with a reduction in the share allocated to animal feed and an increase in the shares allocated to food and other uses. This would partly stem from the rising income inequalities between countries which would push the poorer countries toward increasing their consumption of cassava as food. A similar trend would be observed for sweet potato (Figures 3A,D,F).
By 2040, the consumption of vegetable oils would still be dominated by palm oil, soybean oil, sunflower oil, and other oils (Figure 3E). Palm oil would experience an increase of about 1.5% in per capita consumption whereas the consumption of soybean and sunflower oils would decrease by about 5 and 20%, respectively (Figure 3E). Overall, per capita consumption of vegetable oils (processed oils) would decrease by 5% (Figure 3A). For sugar, regional per capita consumption would decrease by about 5% also (Figure 3A). For pulses, regional per capita consumption would increase by about 25% between 2010 and 2040 (Figure 3A); such increase would be associated with an increase in per capita consumption in all countries although for some countries the increase would be less than 5% whereas in others, it would be much higher (Figure 3A).
At a regional level, meat consumption would increase by about 110% between 2010 and 2040. This commodity along with vegetables, fruits and pulses would experience the highest consumption change over time after stimulants. Cereals would follow with an increase of about 90%. Egg consumption would experience the smallest consumption change with a value of 55% (Figure 4A).
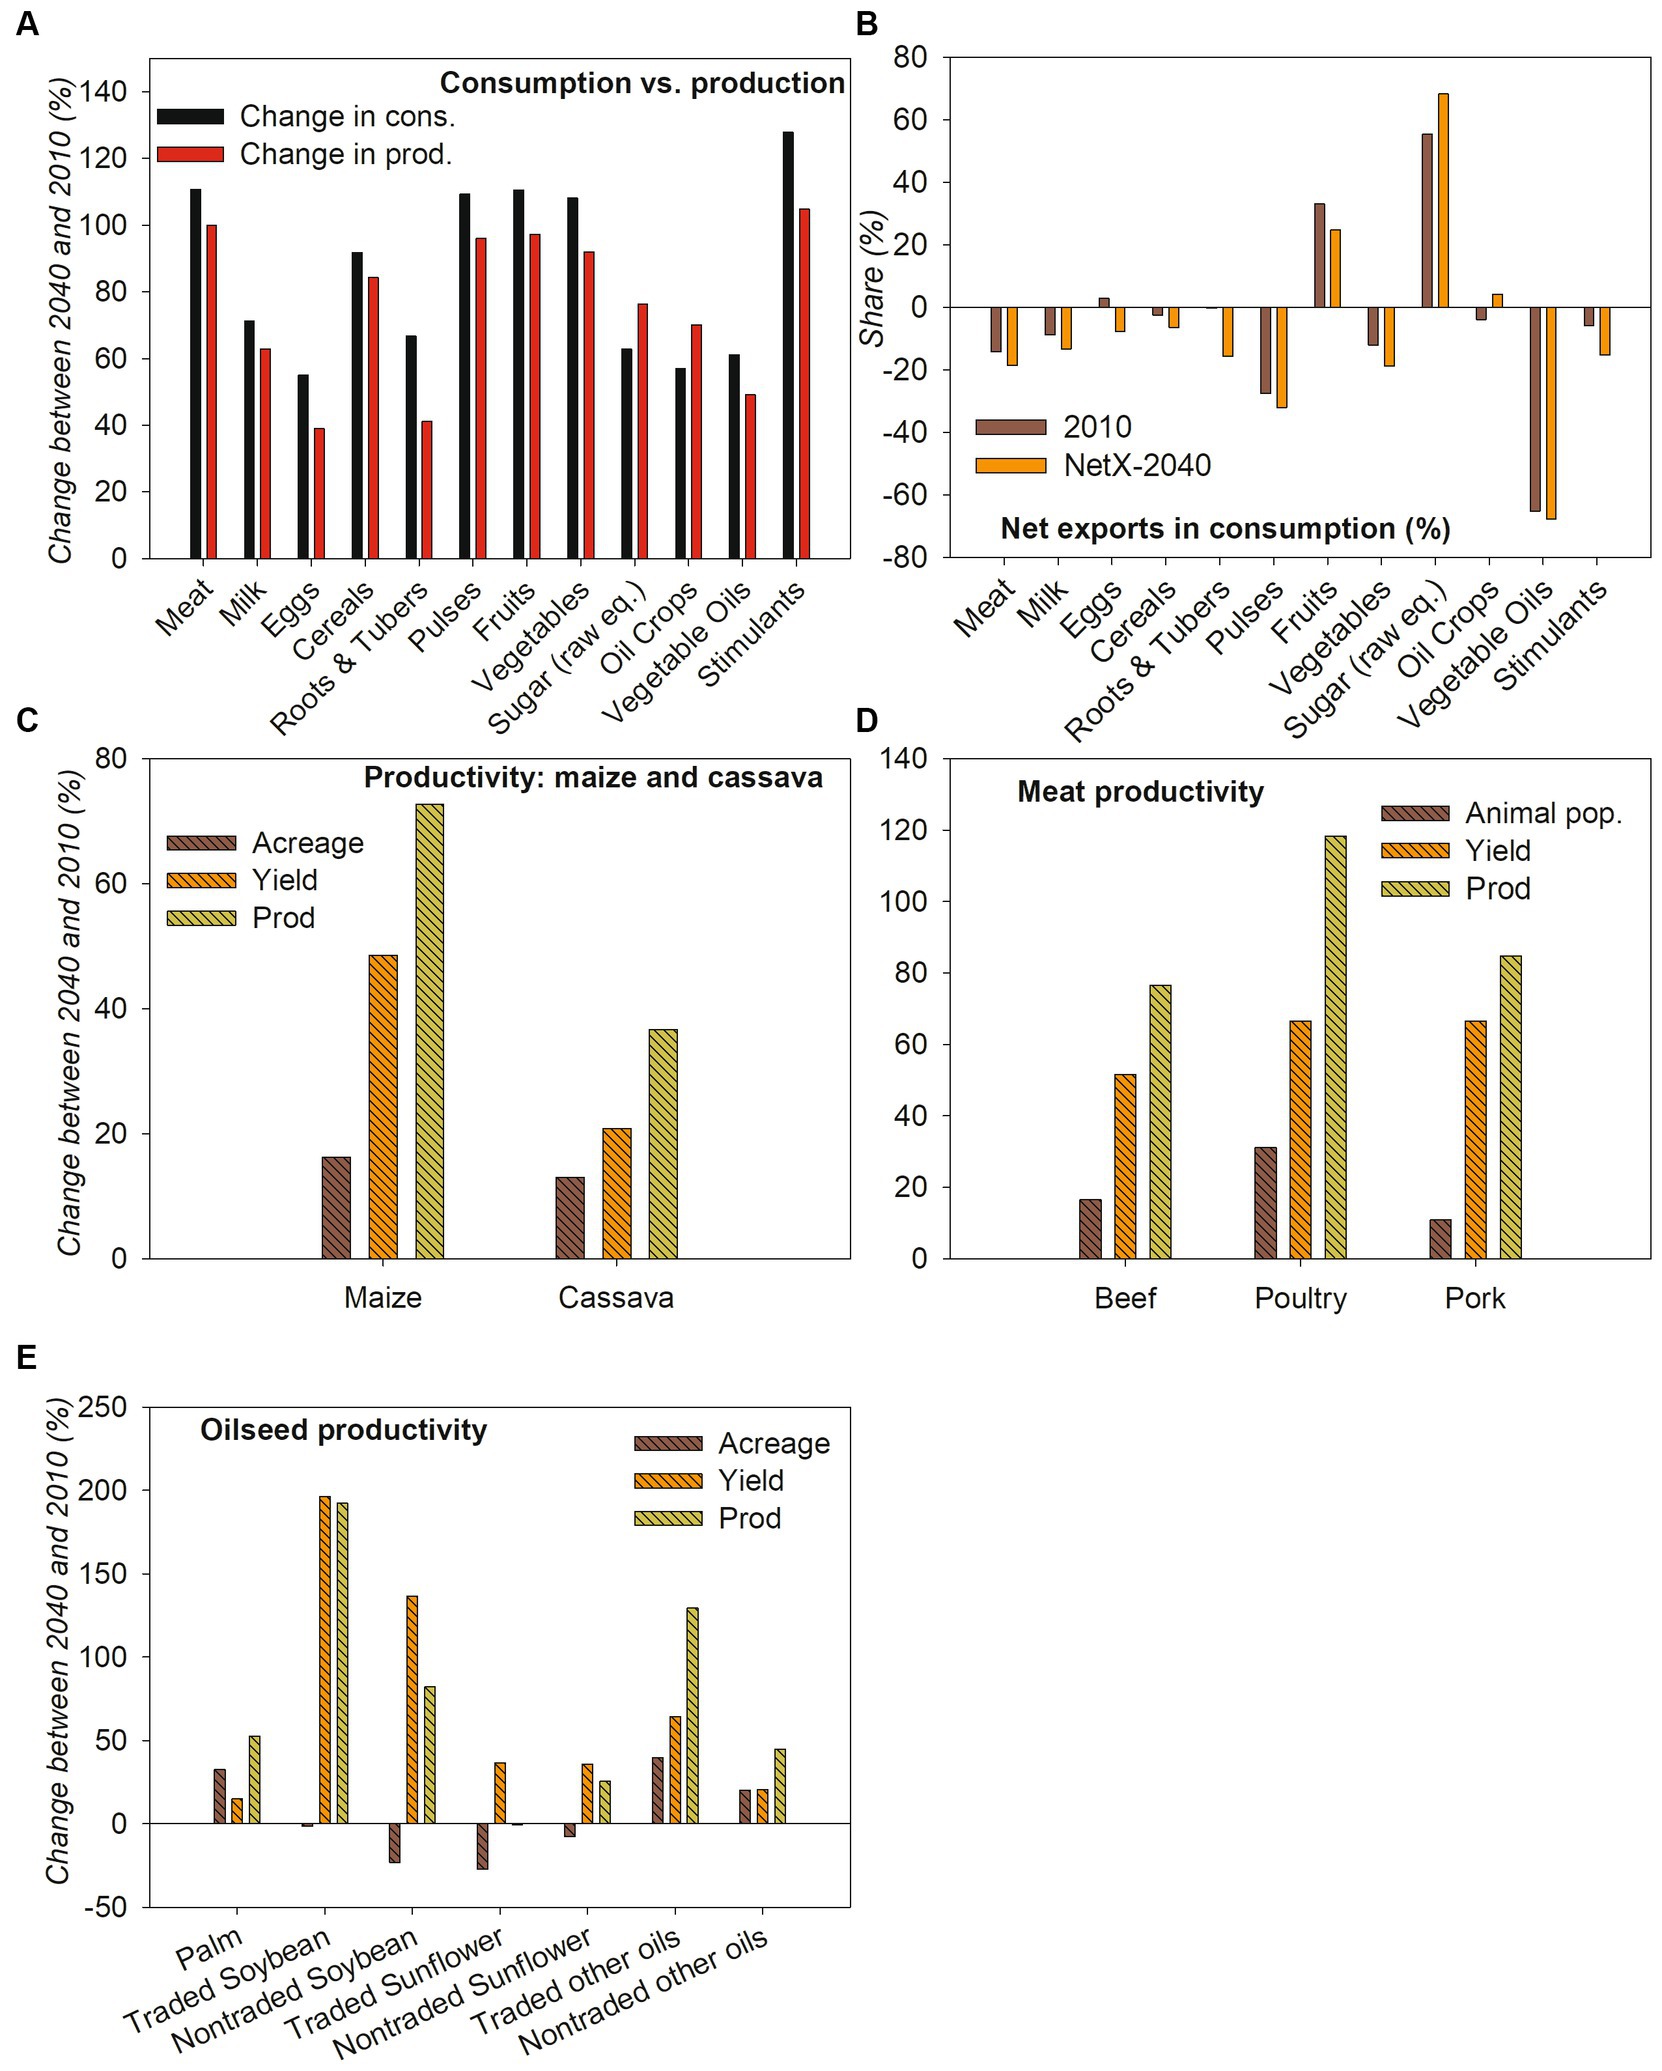
Figure 4. Projected production and consumption changes in southern Africa under the ‘no drought’ 928 scenario - 2040 versus 2010; (A) consumption versus production changes; (B) changes in the share of net exports in consumption; (C) changes in maize and cassava productivity; (D) changes in meat productivity; (E) changes in oilseeds productivity Source: authors’ computations using results from IMPACT 3.2.
By 2040, food production too would have increased in the region thanks to technological advancement in agriculture. However, such growth would be slower compared to the growth in food demand (Figure 4A). The production of meat, stimulants, pulses, and fruits would change by about 100%, each. The region would become more import-dependent for its key staple food groups, namely cereals, roots & tubers, vegetable oils and meat. The region which was self-sufficient for roots & tubers in 2010 would be importing about 15% of its consumption requirements by 2040 (Figure 4B). For fruits and sugar, the region would remain a net exporter by 2040.
The higher reliance on food imports would be partially caused by low crop productivity coupled with small changes in crop area in southern Africa. For example, maize is currently grown in all countries in southern Africa whereas cassava, which is consumed in all countries, is only grown in 6 countries, namely Angola, Madagascar, Malawi, Mozambique, Zambia, and Zimbabwe. The maize and cassava acreages are projected to increase by 16 and 13% respectively, between 2010 and 2040. Similarly, cassava yield would increase by 21% whereas maize yield would increase by 49%. The growth in acreage and yield would not be enough to ensure that production keeps pace with demand (Figure 4C).
For vegetable oils, the picture is mixed. Acreage for sunflower would decrease over time and yields would increase by less than 50%. Hence, total production would increase by 25% for nontraded sunflower; it would reduce by −1% for traded sunflower. Acreage would decrease for non-traded soybean and would barely change the same for traded soybean. However, yields would improve substantially and especially in South Africa and Zambia. Hence, regional soybean grain production would increase substantially between 2010 and 2040 (Figure 4C).
All countries would be producing beef, poultry, and pork by 2040. The animal population would increase for beef, poultry, and pork, although it would increase more for poultry. Yields would also increase for all three meat commodities, although the increase would be smaller for beef compared to poultry and pork. Poultry production would more than double, but this would not be the case for the other meat-based commodities. Hence, total meat production would less than double compared to demand (Figures 4A,C).
At the regional level, the number of people at risk of hunger would increase by about 30% between 2010 and 2040 to reach about 53 million people in 2035 (Figure 5A). All countries would experience an increase in the number of people at risk of hunger except for the wealthier countries like Botswana, South Africa, and Namibia which would experience a reduction in the number of people at risk. In relative terms, food security would improve slightly, as the regional share of the population at risk would decrease slightly from 23% in 2010 to 20% in 2040 (Figure 5B). The share of people at risk would decrease for all countries except Eswatini which would experience an increase of about 2 percentage points. Poorer countries which would register slight reductions (less than 5 percentage points) in the share of their population at risk consist of Malawi, Lesotho, and Angola.
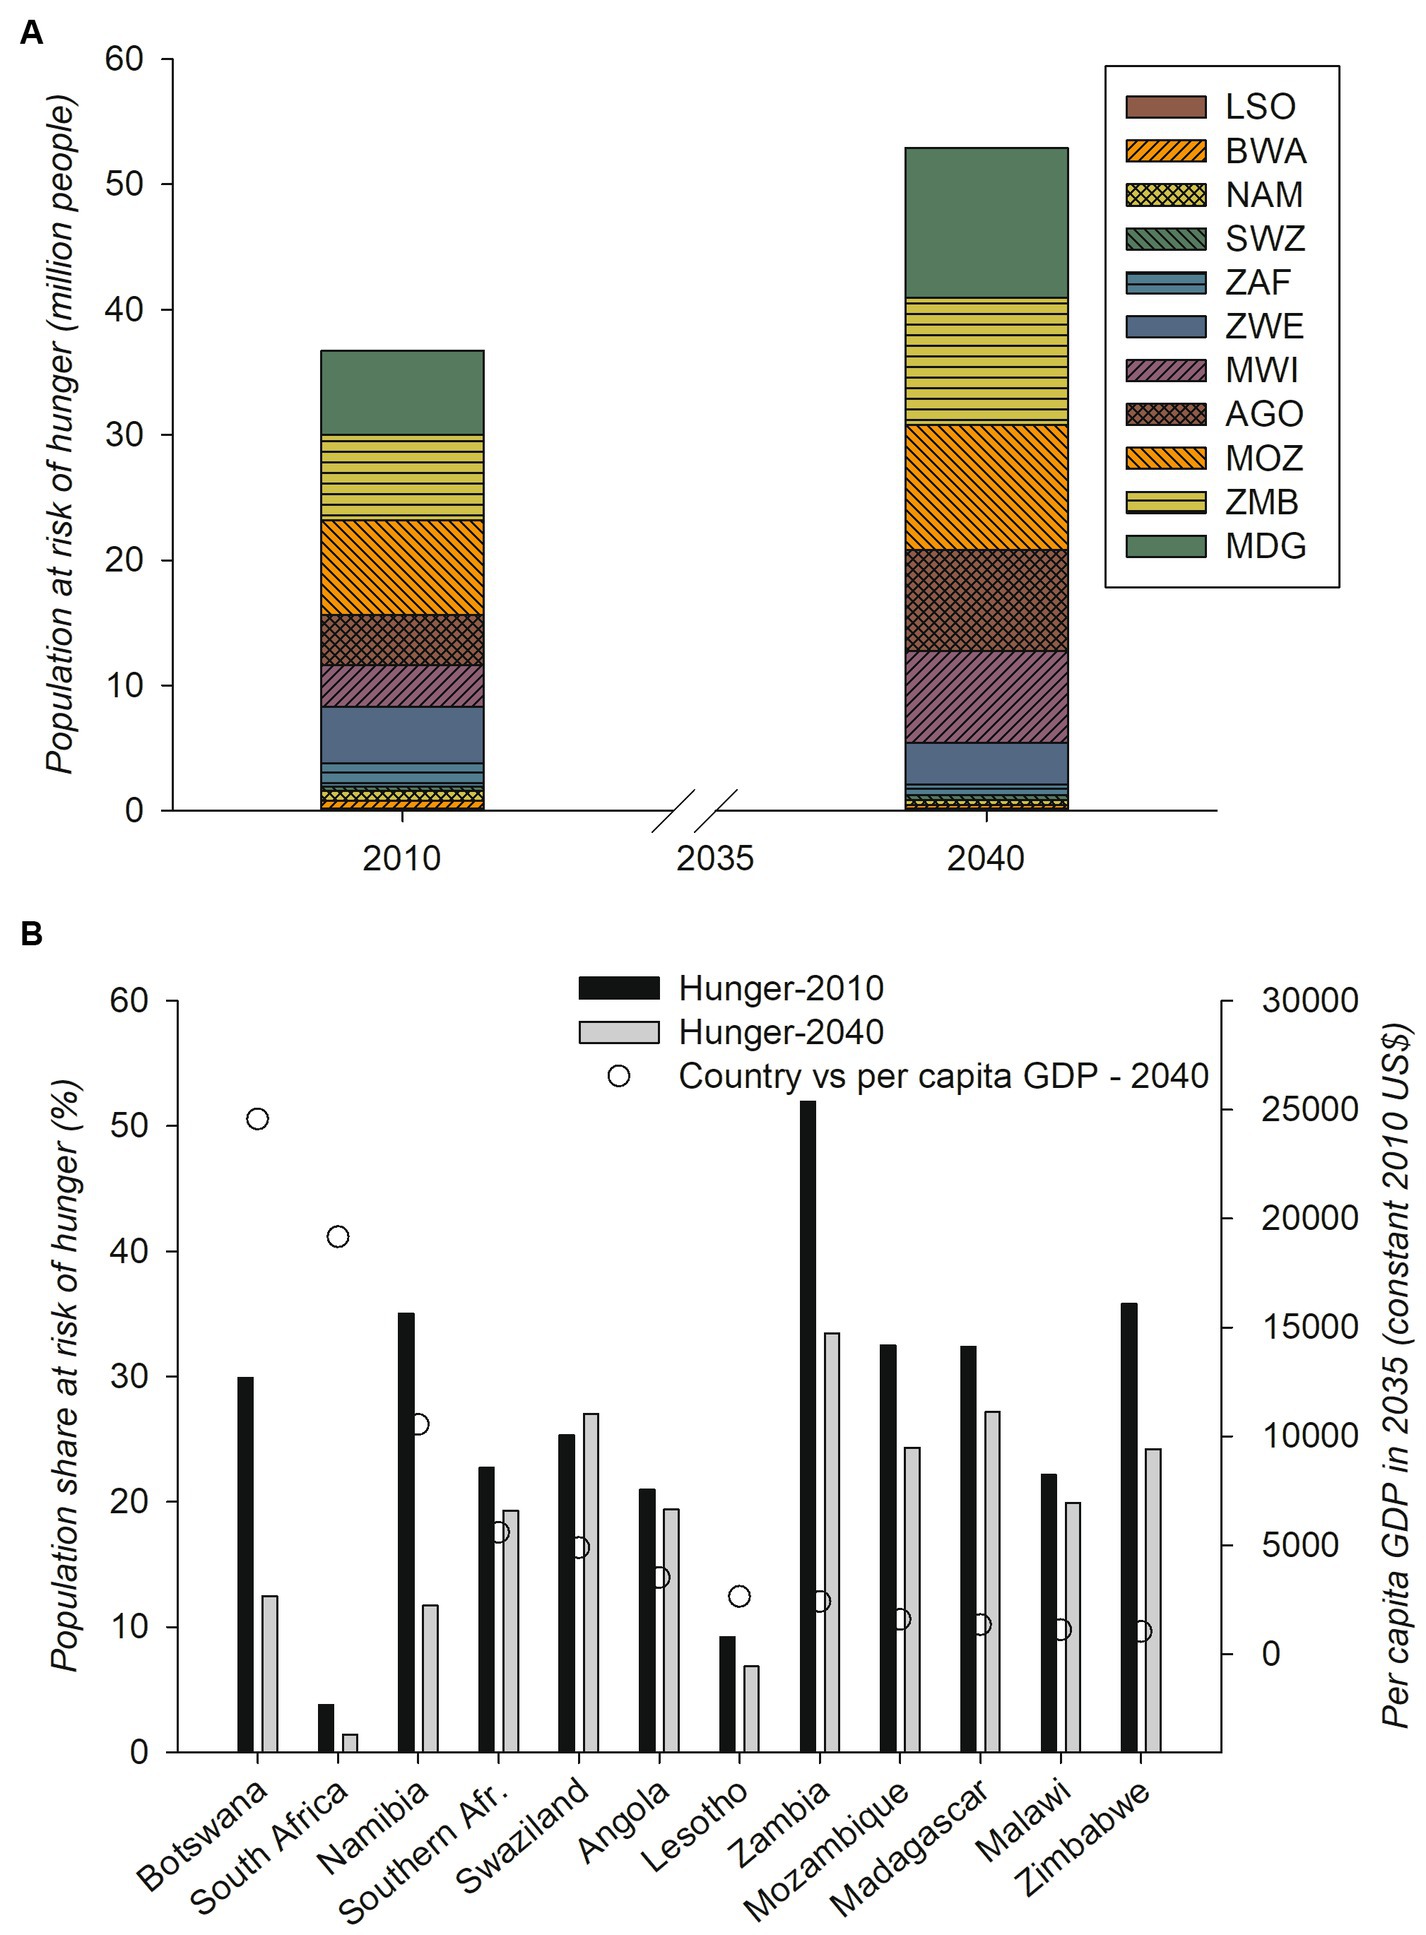
Figure 5. Projected change in the number of people at risk of hunger in southern Africa under the ‘no drought’ scenario – 2040 versus 2010; (A) Population at risk of hunger (million people) (B) Share of the population at risk of hunger (%) AGO: Angola; BOT: Botswana; LSO: Lesotho; MDG: Madagascar; MWI: Malawi MOZ: Mozambique; NAM: Namibia; S. Afr.: South Africa; SWZ: Eswatini; ZMB: Zambia; ZWE: Zimbabwe Source: authors’ computations using results from IMPACT 3.2.
The recurrent droughts would affect agricultural production which would become much more erratic (Figures 6A–J). Maize would experience the largest reduction in production under drought when compared to other food crops. For example, with the projected drought in 2025, regional maize production would decrease by about 25% compared to a scenario involving no drought (Figure 6A). For all other crops, the change in production in 2025 would range between −8 and 5% (Figures 6B–J). Across all years, cowpea, a drought-tolerant pulse, would experience the largest increase in production under the scenario involving recurrent droughts. More specifically, regional cowpea production would rise by close to 20% in the years when Malawi, a major cowpea producer, would be affected by drought (Figure 6).
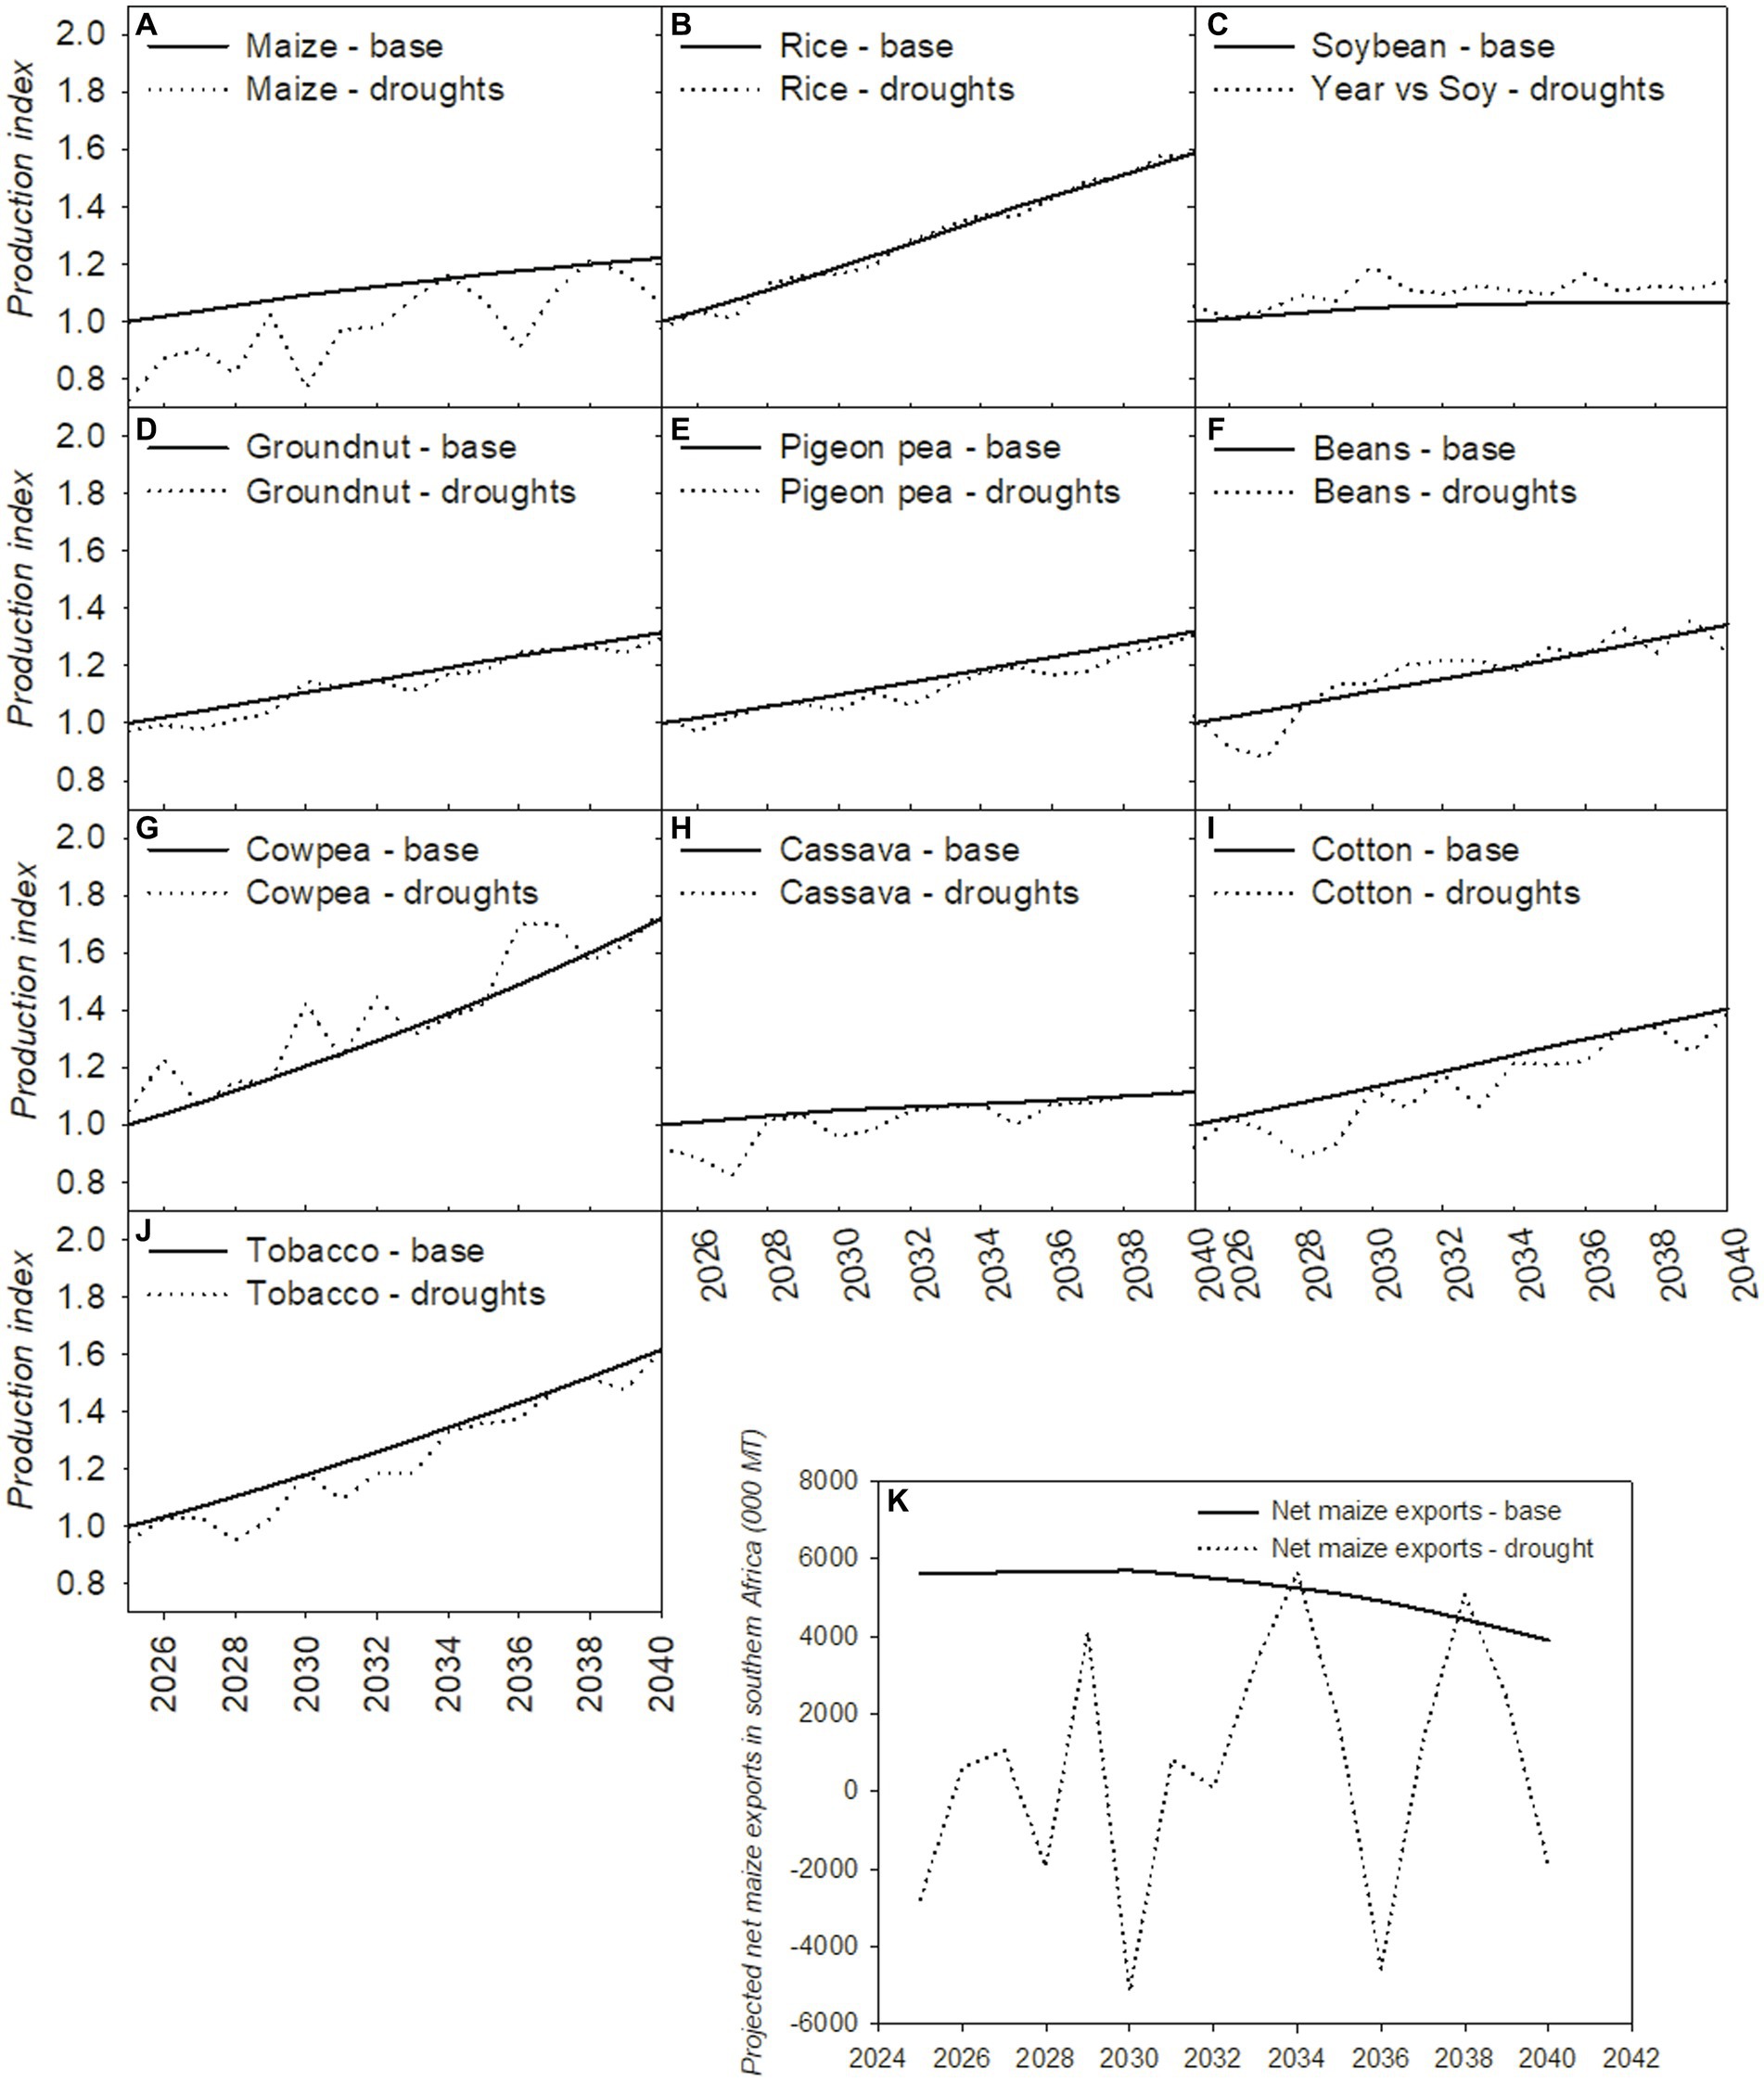
Figure 6. Projected impact of droughts on agricultural production and net maize exports for southern Africa; (A) maize; (B) rice; (C) soybean; (D) groundnut; (E) pigeon pea; (F) beans; (G) cowpea; (H) cassava; (I) cotton; (J) tobacco; (K) net maize exports Source: authors’ computations using results from IMPACT 3.2.
For oilseeds, an interesting scenario would develop that would highlight the effect of local prices being delinked from world markets; such situation can happen through contract farming when farmers’ prices are fixed earlier in the season. In the model, Madagascar, Malawi, South Africa, Zambia, and Zimbabwe produce traded soybeans which can be exported. In addition, South Africa, Zambia, and Zimbabwe produce non-traded soybean which is entirely allocated to domestic uses and for which prices are only defined through local supply and demand. Traded groundnut is produced in all countries except Lesotho; for nontraded groundnuts, non-producing countries are Lesotho, Namibia and Eswatini. In 2030, three of the largest maize producers in the region would experience a drought: South Africa, Malawi, and Mozambique. This would lead to the highest regional food price hike experienced in the region due to drought between 2025 and 2040. In South Africa, maize production would decrease by 46% in 2030 under the scenario involving droughts compared to the scenario involving no drought (Table 5). This reduction in production would be linked to a reduction of about 32% in yield and 20% in acreage for maize. The freed acreage would be allocated to more profitable crops less affected by the drought. In this case, such crops would turn out to be pulses and nontraded oilseeds. Nontraded soybean and groundnut would experience the largest increase in producer price under drought, reflecting that the demand response to shocks is usually more inelastic for nontraded compared to traded commodities. In addition, the producer price increase for nontraded oilseeds would be higher for soybean than that for groundnut; this would be caused partly by soybean becoming scarcer due to the higher negative impact of drought on soybean compared to groundnut yields in South Africa. The higher increase in the producer price for nontraded soybean would translate into the highest increase in the acreage allocated to this commodity. Nontraded groundnut would follow with an acreage increase of 36%. Hence, nontraded soybean and groundnut production would increase by 58 and 22%, respectively (Table 5). This would translate into an increase of about 21% in total soybean production in South Africa and an increase of about 15% at the regional level (Figure 6).
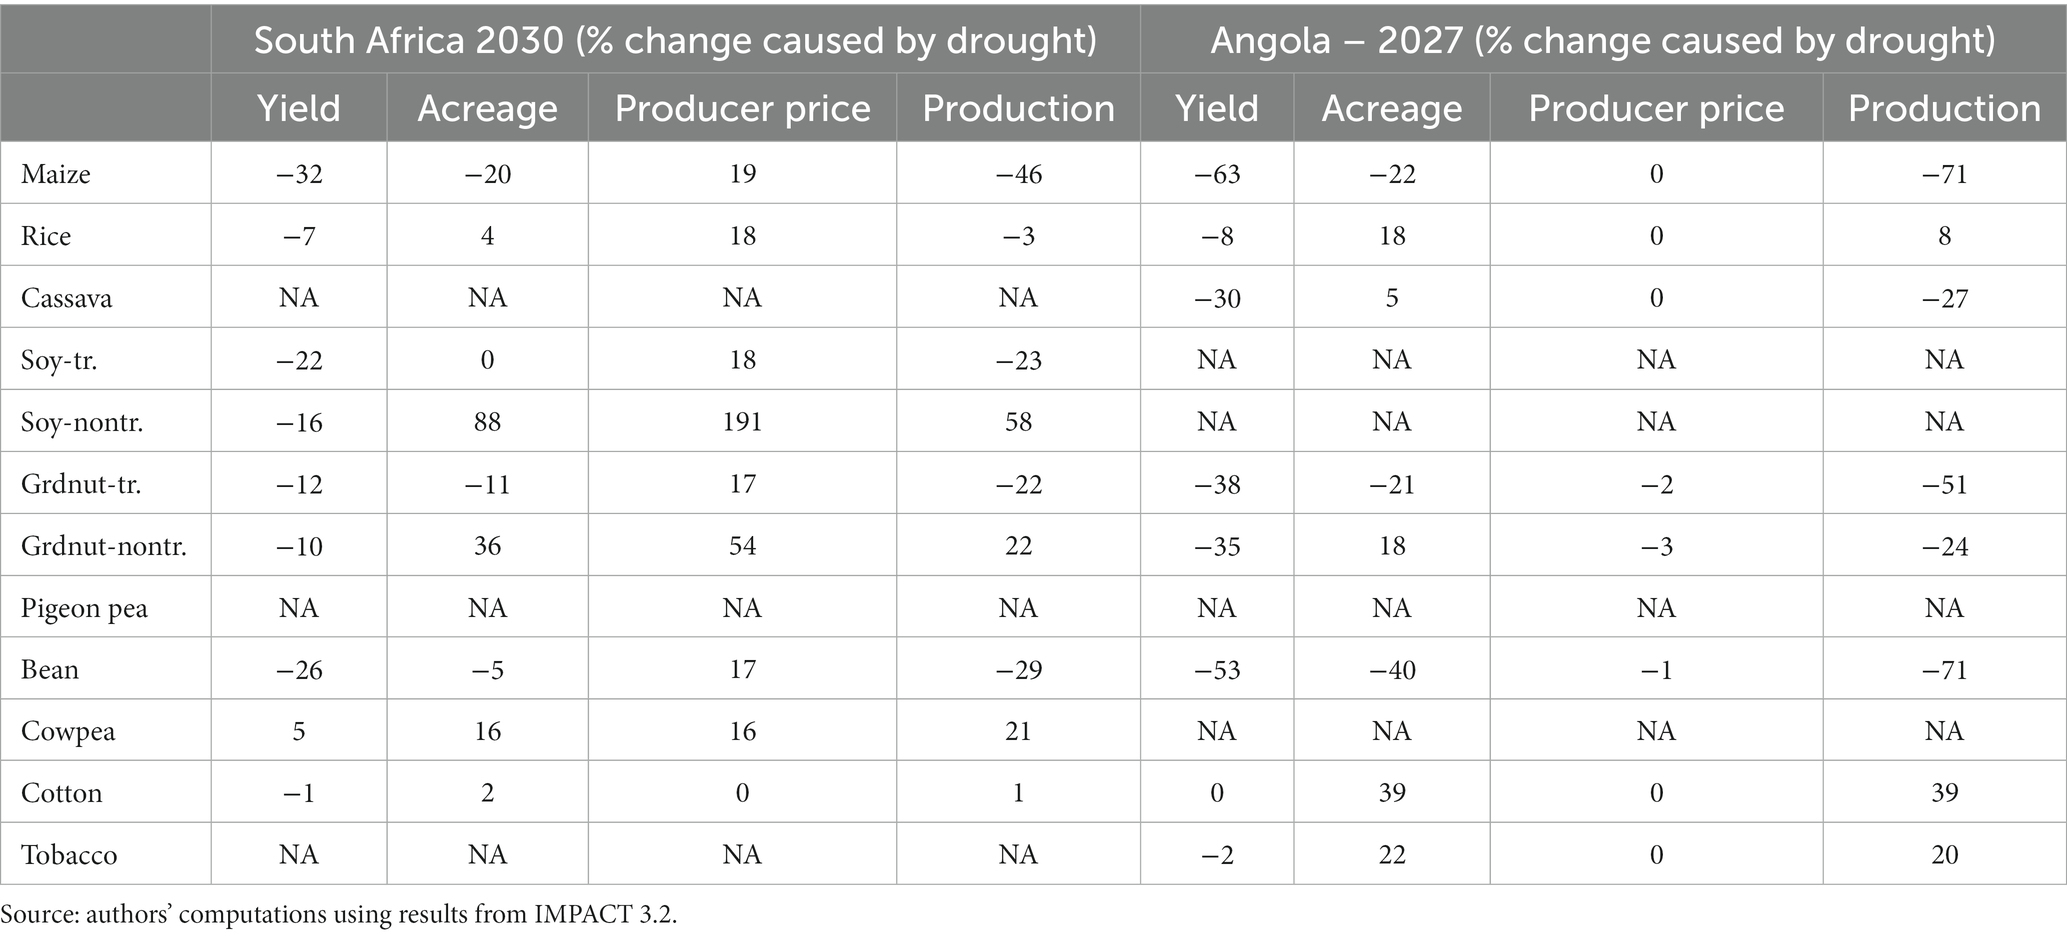
Table 5. Bio-economic impact of drought on crop production in South Africa (year 2030) and Angola (year 2027).
Another interesting development relates to cassava production which would not increase when there is drought. This result reflects that cassava is not a preferred food in the region nor is it considered a cash crop unlike oilseeds and selected pulses. The highest reduction in cassava production would occur in 2026 and 2027 when Angola, the largest cassava producer in the region, would be experiencing two consecutive droughts. By 2027, maize production in Angola would decrease by 71% with an associated acreage reduction of 22% (Table 5). Here too, the freed acreage would be allocated to more profitable crops less affected by drought. In this case, cotton would experience the highest increase in acreage, followed by tobacco, rice (18%), and nontraded groundnuts (18%). Cassava’s yield would be negatively affected by drought in Angola, although less severely compared to maize. More specifically, cassava’s yield would decrease by 30% in 2027 compared to a reduction of 63% for maize (Table 5). Some of the land freed from maize and other crops would be allocated to cassava which would experience an increase of about 5% in acreage. All in all, cassava production would decrease by 27% in 2027, after two years of consecutive droughts. In 2027, other cassava-producing countries would also experience drought, namely Madagascar, Mozambique, and Zimbabwe. Mozambique would reduce its cassava production by 32% whereas Madagascar and Zimbabwe would increase their cassava production by 3 and 19%, respectively. Hence, regional cassava production would decrease by 20% (Figure 6).
Apart from cowpea and soybean, another crop which would experience an increase in production under drought is bean although, for some years, regional bean production would be smaller under the scenario involving recurrent droughts compared to the scenario involving no drought. For example, with the scenario involving recurrent droughts, bean production would be lowest in 2027, a year when drought would affect two key bean producers (Angola and Madagascar) accounting for 50% of regional production. Angola would experience a reduction of 71% in bean production (Table 5) whereas for Madagascar, the reduction would be smaller (around 14%), since bean is less affected by drought in this country (Table 3). Regional bean production under drought would be highest in 2031, 2032, and 2037 when production would be around 7% higher under the scenario involving recurrent droughts compared to the one involving no drought. In 2031, none of the key bean producers, namely Angola, Madagascar, Malawi, and South Africa would experience a drought. However, Zimbabwe which accounts for 10% of regional bean production, would experience a drought which would lead to reduction in national maize production (−59%) and an increase in bean production (96%). The bean production increase in Zimbabwe would translate into an increase in regional bean production for 2031.
Under a scenario involving no drought, the volume of net maize exports out of southern Africa is projected to slightly decrease between 2025 and 2040. However, recurrent droughts would introduce more volatility in maize trade and make it difficult for policy-makers to adequately respond to droughts. Drought would also reduce regional maize consumption by eroding the purchasing power for maize through higher consumer prices and/or reduced incomes. As a result, net maize exports would in general be smaller in volume compared to a scenario involving no drought (Figure 6K). In addition, the region would find itself importing maize whenever South Africa, the largest maize producer and exporter in the region, would be hit by a drought (Figure 6K; Table 4).
By reducing food availability and consumption, droughts would worsen food insecurity across southern Africa. The highest increase in the number of people at risk would occur in 2030 (Figure 7A), the year characterized by the highest decrease in regional maize production. Across all years, the countries which would experience the highest increase in the number of at-risk people would be Mozambique and Zimbabwe. In 2031, Mozambique would experience a second consecutive drought year and the number of people at risk of hunger would reach 1.9 million people. In Zimbabwe, following three consecutive drought years, the number of people at risk of hunger would be highest in 2029 with 1.7 million people (Figure 7A).
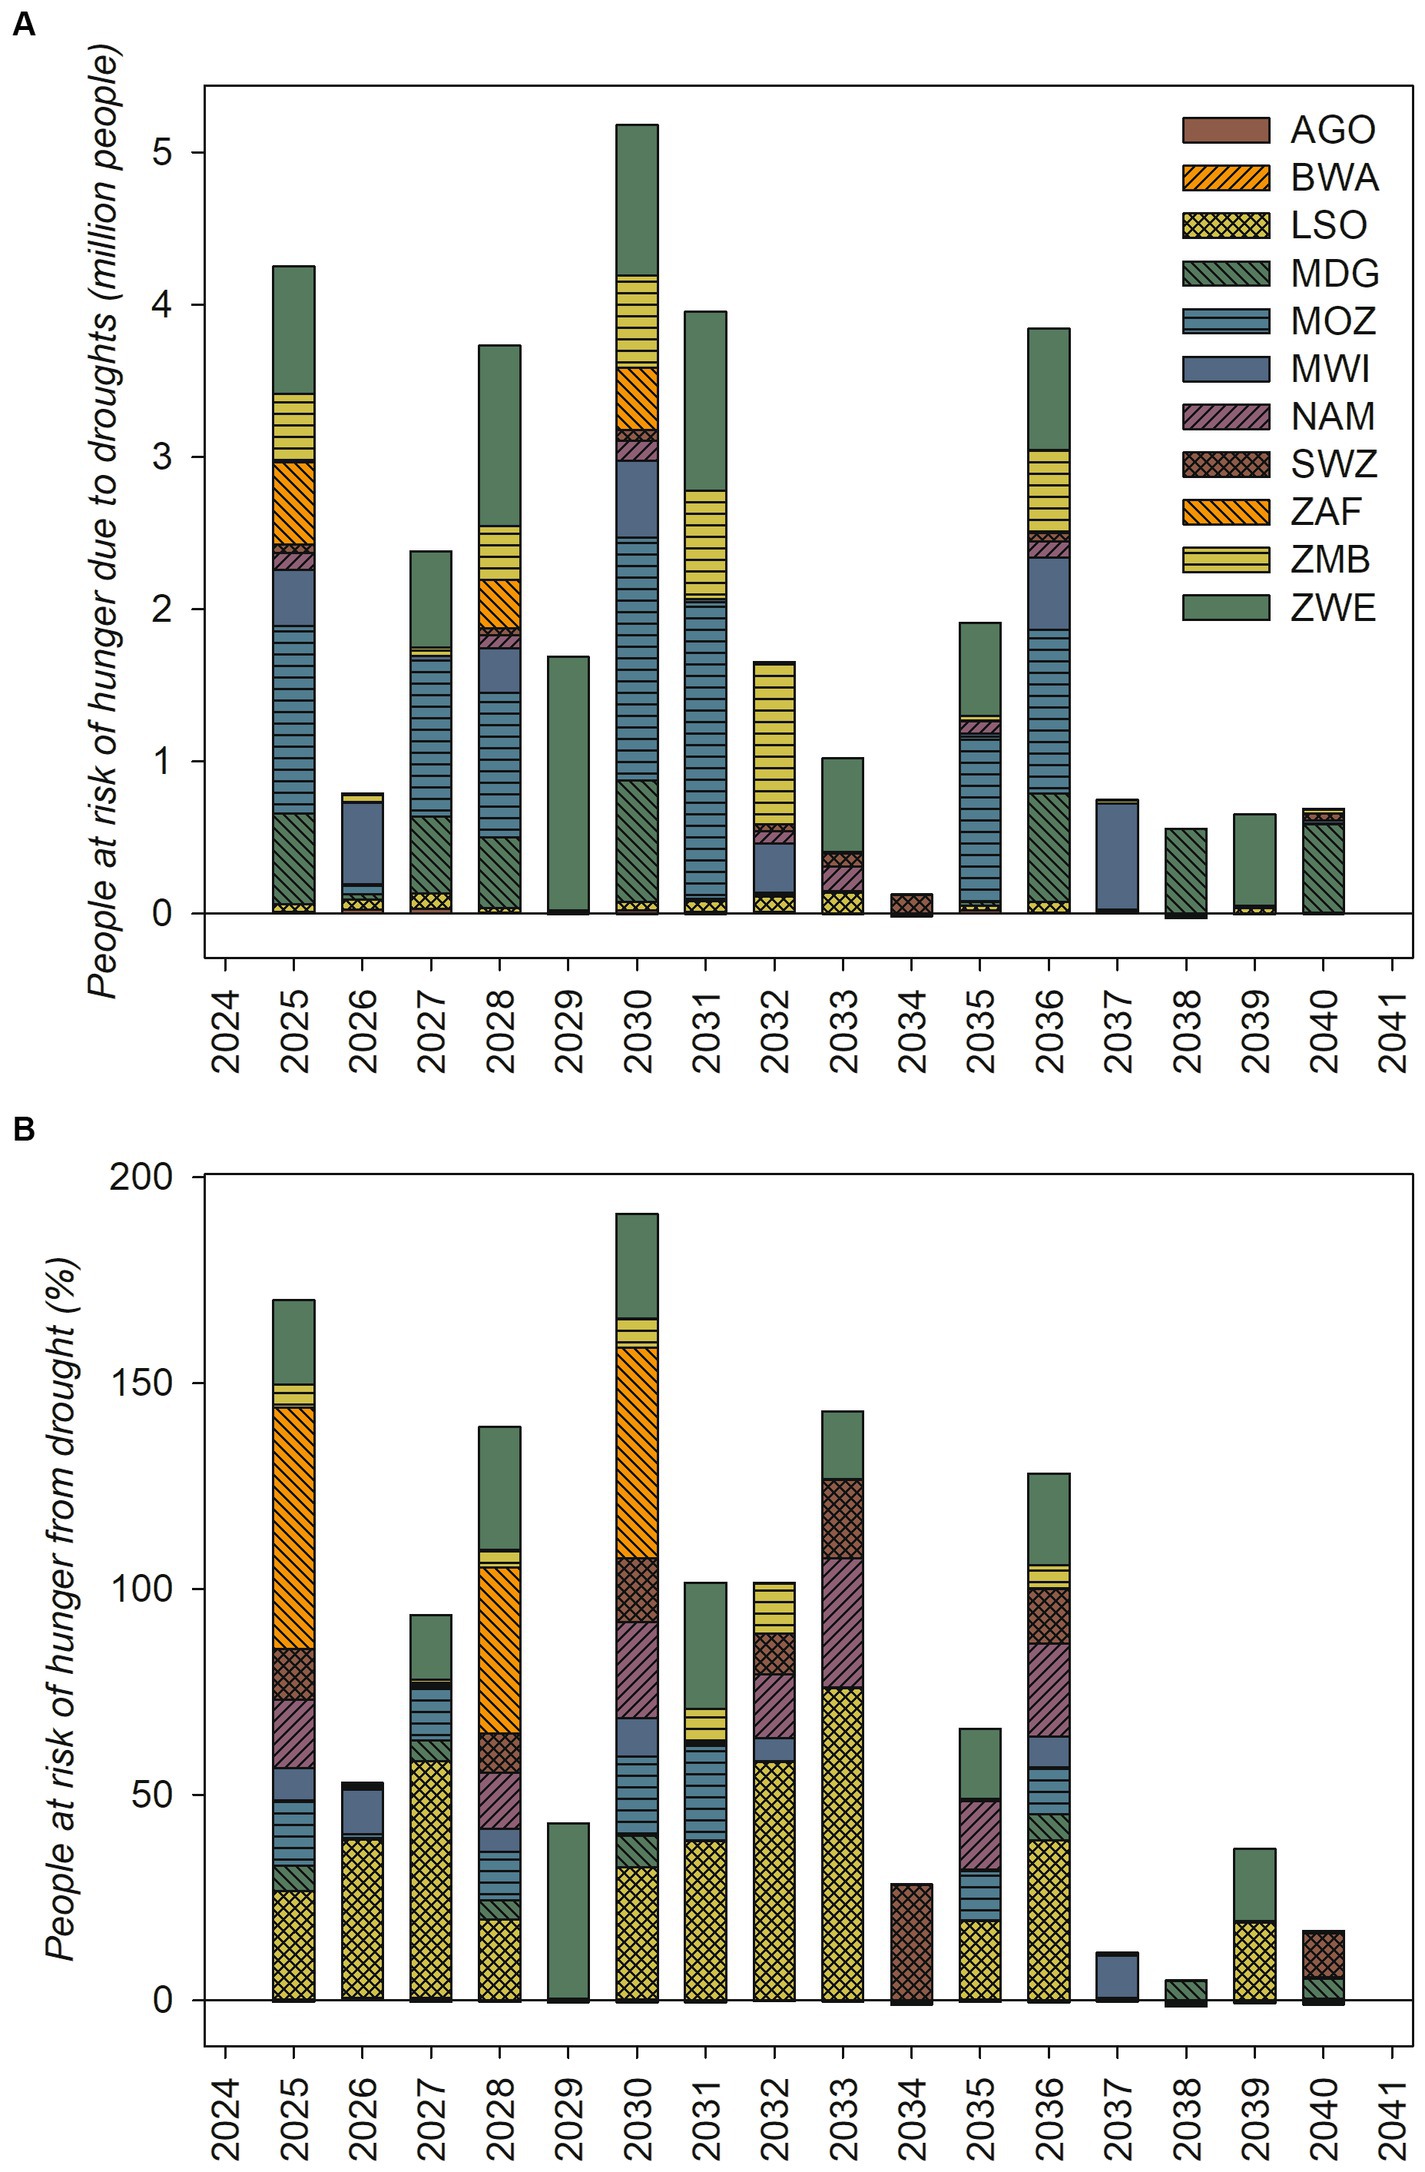
Figure 7. Projected impact of droughts on food security in southern Africa; (A) Population at risk of hunger (million people) (B) Share of the population at risk of hunger (%) AGO: Angola; BOT: Botswana; LSO: Lesotho; MDG: Madagascar; MWI: Malawi MOZ: Mozambique; NAM: Namibia; S. Afr.: South Africa; SWZ: Eswatini; ZMB: Zambia; ZWE: Zimbabwe Source: authors’ computations using results from IMPACT 3.2.
In terms of percentage change, Lesotho, a country with a small population, would experience the largest increase in the number of people at risk under droughts. In 2030, the regional maize shortage would lead to an increase of 26% in the number of people at risk in this country (Figure 7B). However, from 2031, three consecutive drought years would follow in the country such that by 2033, there would be an increase of 76% in the number of people at risk compared to a scenario involving no droughts. Other countries which would experience substantial relative increases in the number of people at risk include South Africa, Zimbabwe, Namibia, Mozambique, and Eswatini. South Africa would experience the largest proportional increase in the number of people at risk of hunger in 2025 when the country would experience an increase of about 60% in the number of people at risk of hunger compared to a scenario involving no droughts Figure 7B).
In this section, an analysis is done on the impact of droughts with a longer duration given that such droughts are projected to increase in the future in southern Africa. More specifically, projected future drought occurrences are re-arranged to generate regional two-year droughts like the ones experienced in 2014/15 and 2015/16 in southern Africa. In this case, maize would experience extremely large reductions compared to other crops. For example, maize production would decrease by more than 40% in 2027. With Zambia among the countries that would experience consecutive droughts in 2026, regional maize production would decrease by 38 and 42% in 2026 and 2027, respectively. By contrast, tobacco’s maximum production loss would reach about 15% and would occur in 2028, 2029, 2031, and 2032. For cotton, the maximum production loss caused by drought would occur in 2029 with a value of about 20%. Crops which would experience significant increases in production during the regional consecutive drought years are cowpea, soybean and, to a lesser extent, bean (Figure 8).
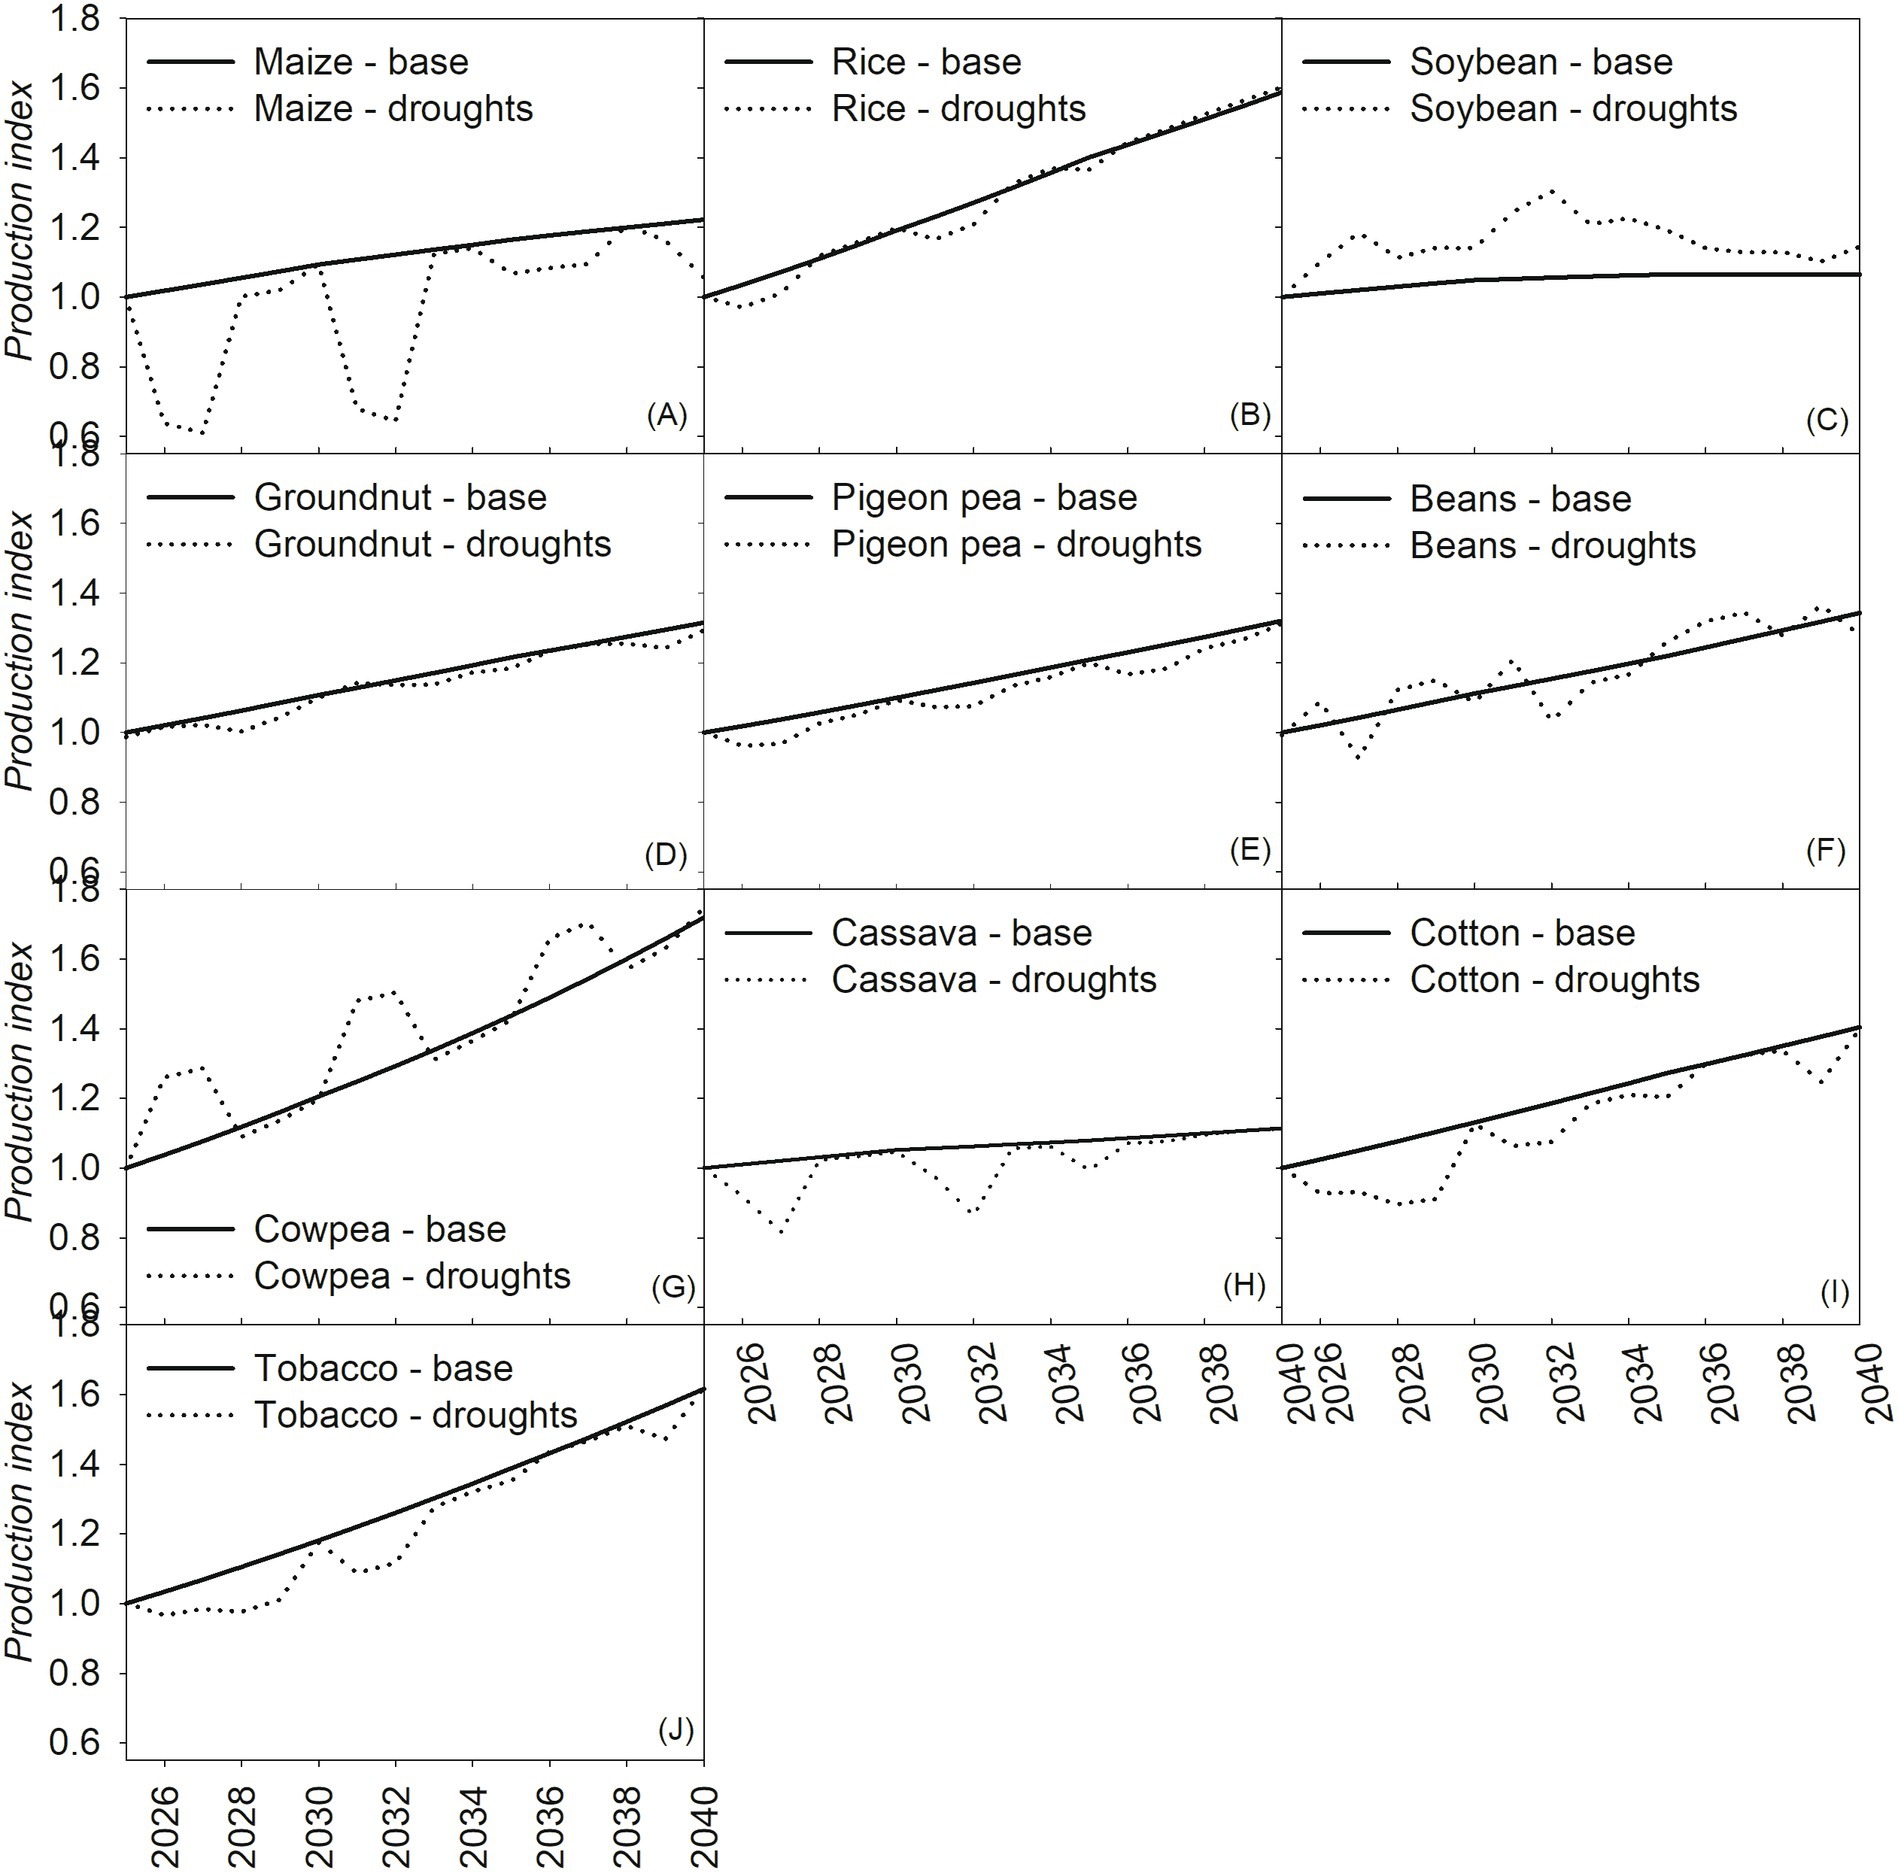
Figure 8. Projected impact of regional two-year droughts on agricultural production in southern Africa; (A) maize; (B) rice; (C) soybean; (D) groundnut; (E) pigeon pea; (F) beans; (G) cowpea; (H) cassava; (I) cotton; (J) tobacco Source: authors’ computations using results from IMPACT 3.2.
The impact of the regional consecutive droughts on food security would be substantial. The minimal number of people at risk due to the regional recurrent droughts would be more than 6 million in 2027. Countries which would experience substantial increases in the number of people at risk would consist of Zimbabwe, followed by Mozambique, Malawi, South Africa, Madagascar, and Zambia (Figure 9A).
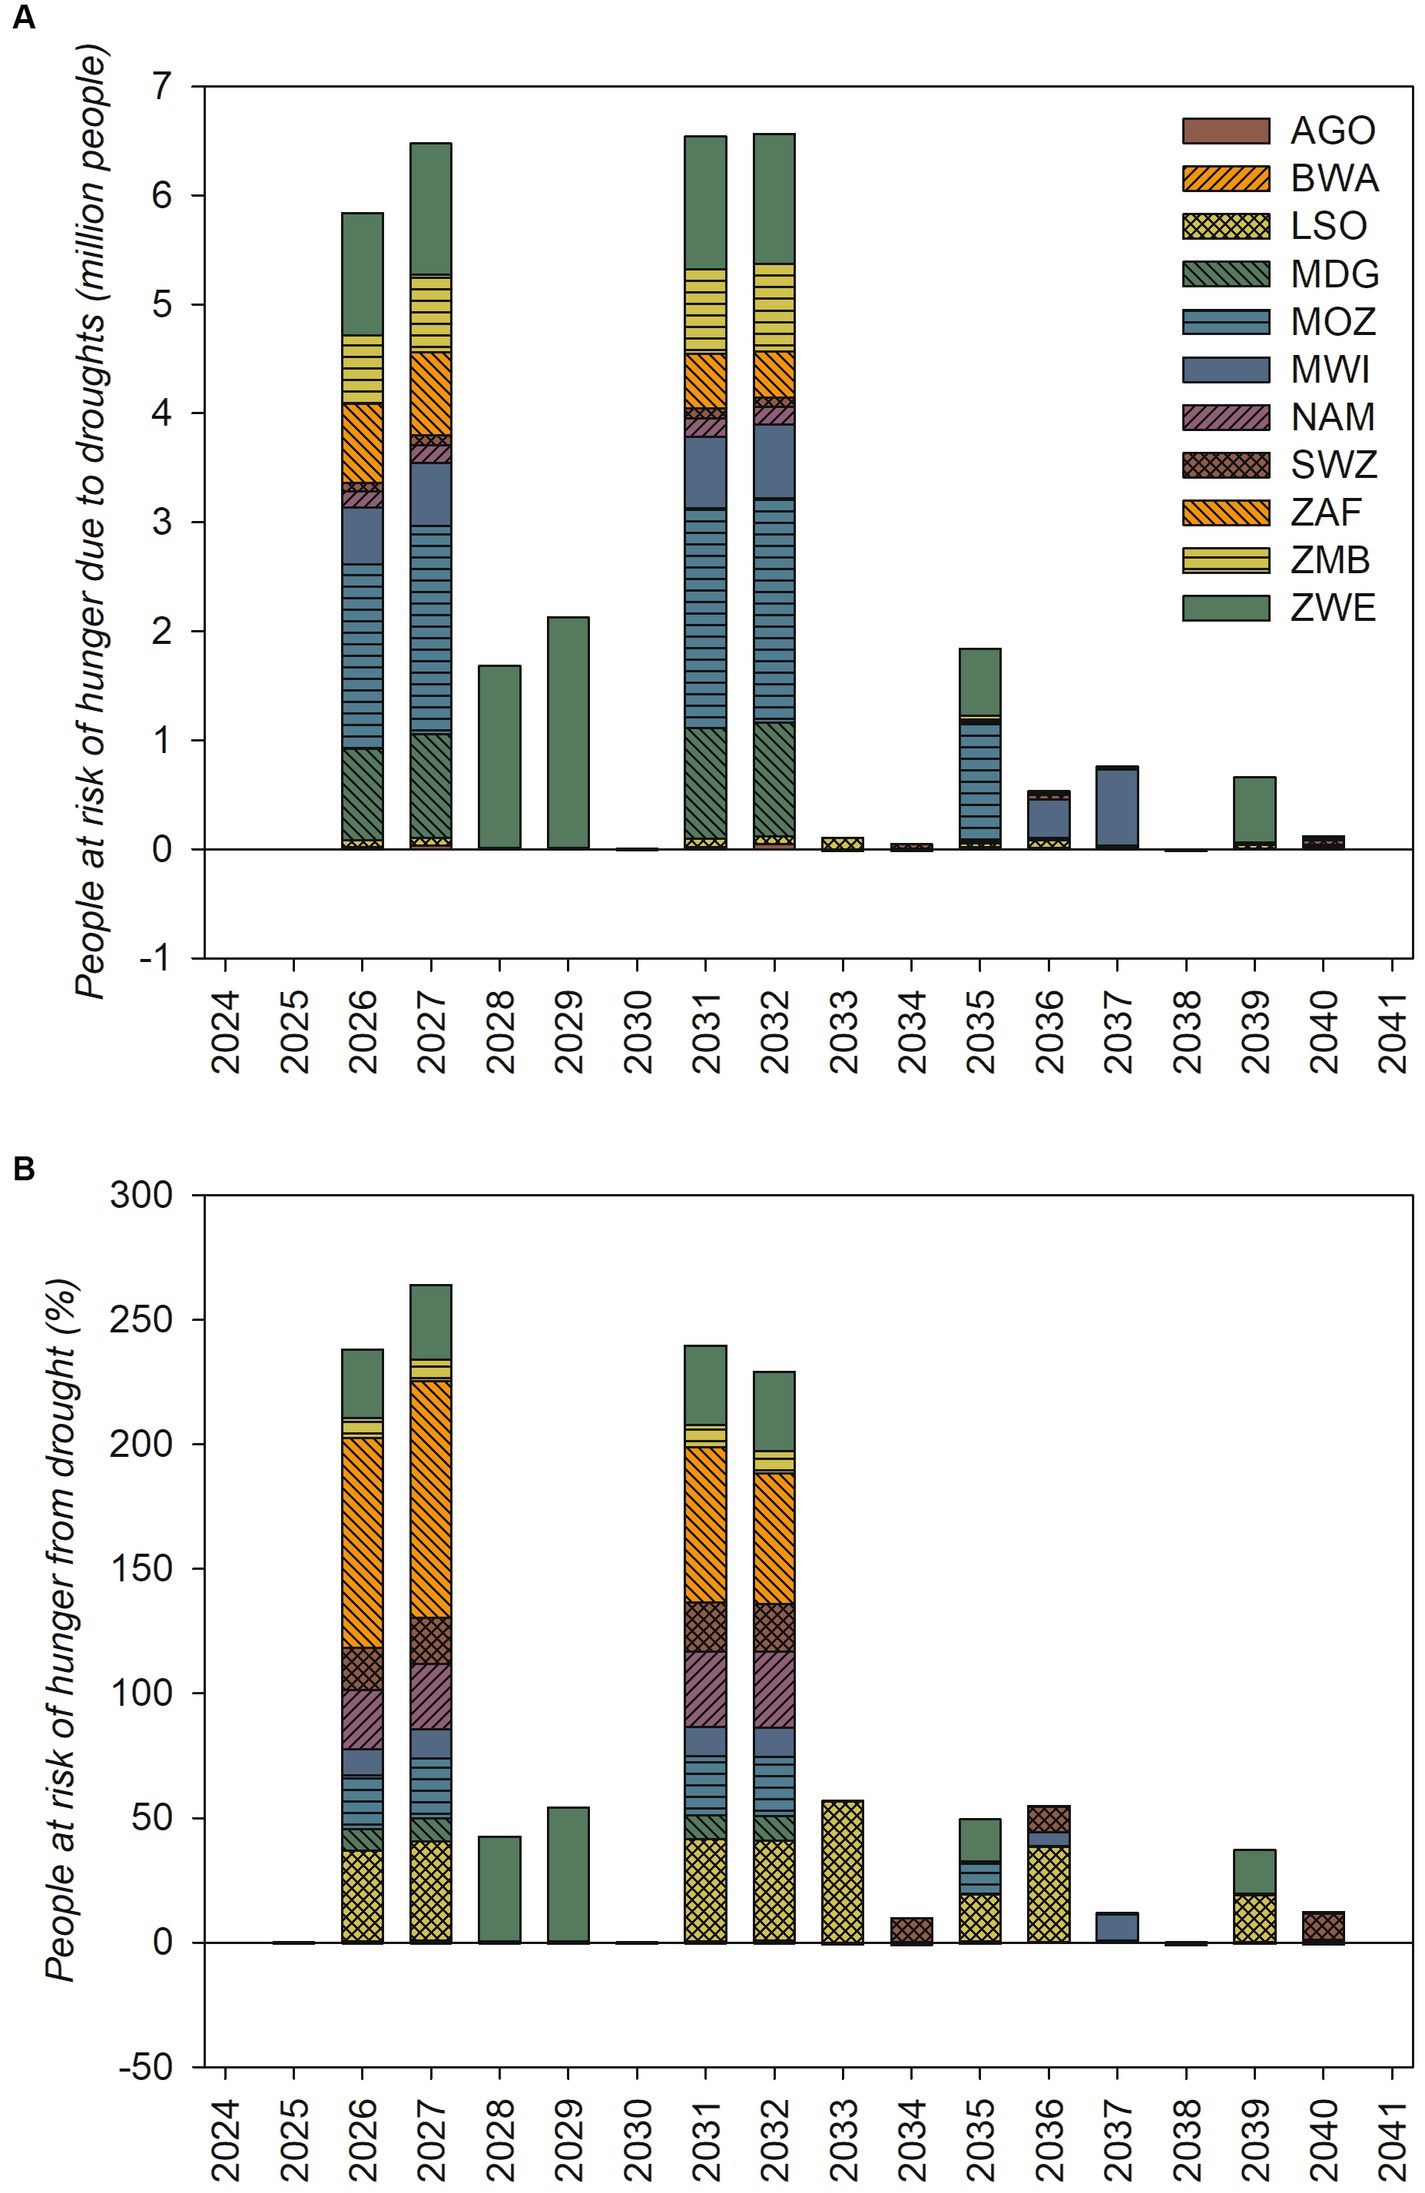
Figure 9. Projected impact of two-year droughts on food security in southern Africa; (A) Population at 957 risk of hunger (million people) (B) Share of the population at risk of hunger (%) AGO: Angola; BOT: Botswana; LSO: Lesotho; MDG: Madagascar; MWI: Malawi MOZ: Mozambique; NAM: Namibia; S. Afr.: South Africa; SWZ: Eswatini; ZMB: Zambia; ZWE: Zimbabwe Source: authors’ computations using results from IMPACT 3.2.
In relative terms, among all countries, South Africa would experience the highest proportional increase in the number of people at risk; indeed, in 2027 the number of people at risk would nearly double in South Africa due to the recurrent drought. Apart from South Africa, all other countries except Angola, Botswana, Madagascar, and Zambia would experience an increase of at least 10% in the number of people at risk during the regional consecutive droughts in 2021/22 and 2026/27 (Figure 9B).
To validate the model, simulated results on the impact of droughts on crop production are compared with reported data from FAOSTAT; such an approach is used to assess the ability of IMPACT at making reliable projections. In general, production changes due to drought are similar between the reported and simulated results for all countries and across all crops (Table 6). Also, the magnitudes of the changes are similar between the simulated and reported values (Table 6). Some of the discrepancies can be explained by the assumptions in IMPACT not fully reflecting the socio-economic environment affecting crop production under drought. For example, the reported values on production changes under drought suggest that farmers in Malawi do reallocate maize acreage to other crops in a drought year and also tend better to these crops such that the country even experiences an increase in the production of beans, followed by groundnuts, cassava, cotton and tobacco (Table 3). However, the same does not happen in neighboring Zambia where a different land tenure system does not provide farmers with the incentives to quickly adjust acreage under drought (Okori, 2018). Hence, the reported values suggest a reduction in the Zambian production of all crops in a drought year (Table 3). In the optimization model, IMPACT, it is assumed that farmers can reallocate crop acreage when faced with a drought and can also re-adjust input (labor, fertilizer, supplemental irrigation, etc.) allocation across crops. Here, IMPACT is able to simulate the behavior of Malawian farmers and implies a national increase in the production of beans, cowpea, cotton, groundnuts and tobacco in a drought year. For Zambia, the simulated results imply that the country should maintain its rice production levels in a drought year and should increase its production of cassava, cotton, and groundnuts.
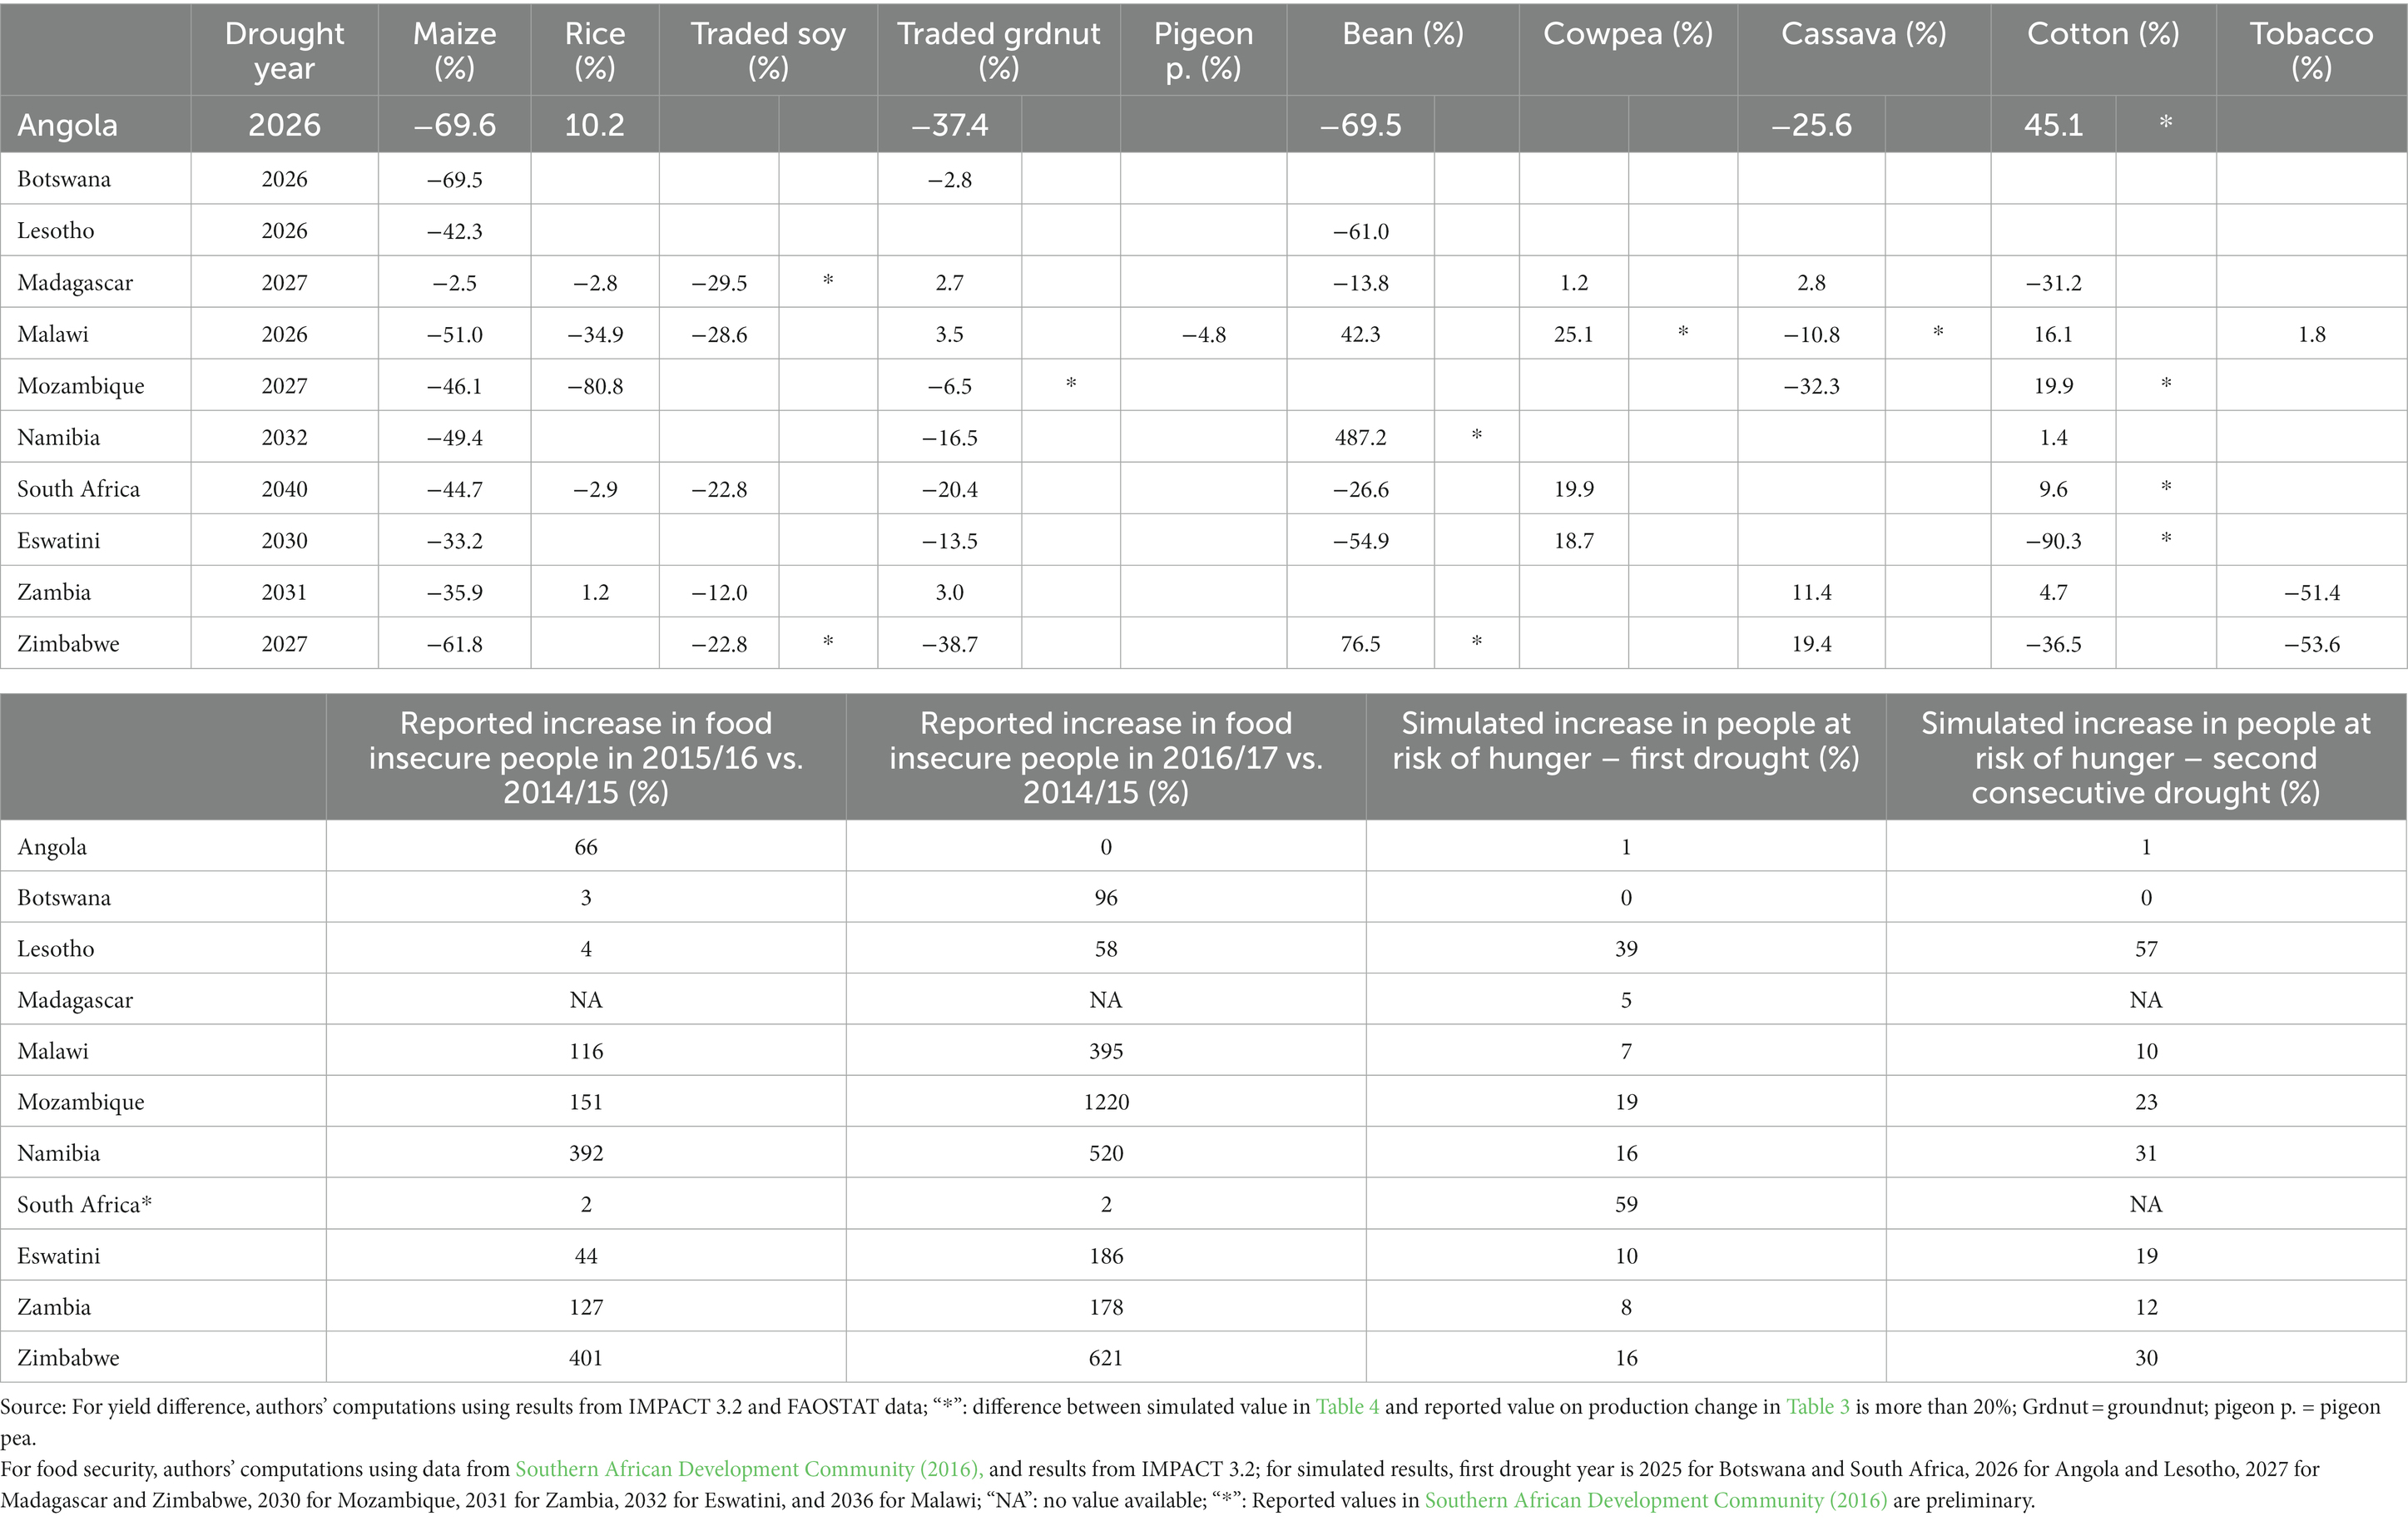
Table 6. Reported versus simulated effect of drought on crop production and food security in southern Africa (%).
As a process-based model, IMPACT should also be well calibrated. In this study, the share of net imports in consumption for all food groups in southern Africa can be used to assess whether IMPACT is well calibrated. The observed moving average value of the share of net imports in southern Africa for different food groups in 2010 is shown in Table 1 and is derived from FAOSTAT. The simulated moving average value from IMPACT for 2010 is shown in Figure 4B. Observed and simulated 2010 values are similar, and this suggests that IMPACT is well calibrated.
Simulated results on the impact of droughts on food insecurity are also compared with past reported data across southern Africa for the purposes of assessing the quality of the projected results from IMPACT. The simulated results on droughts effects on food insecurity are generally smaller than those reported across southern Africa in 2015 and 2016. For example, reported values suggest that the number of food insecure people in Malawi increased by 116% in 2015 a drought year compared to 2014 a non-drought year (Southern African Development Community, 2016). In 2016, a second consecutive drought year, the number of food insecure people increased by 395% compared to 2014 (Southern African Development Community, 2016). However, the simulated results imply that the number of people at risk of hunger in Malawi would increase by 7% in a first drought year in 2031; for a second consecutive drought year in 2032, the number of people at risk would increase by 10%. Similar results are found for Mozambique, Namibia, Zambia, and Zimbabwe. The higher reported values from SADC (2016) include people who are food insecure for reasons other than drought. In addition, droughts usually negatively affect rural incomes and most likely reduce purchasing power by a higher value than what has been used in this study. Hence, the simulated results can be considered as the lower limit on the impact of droughts on food security (Table 6).
The simulated results imply a higher increase in the number of people at risk in a second consecutive drought year compared to a first drought year. This is also the case in the reported results from SADC (2016) for most countries. In addition, the reported share of the population which was food insecure in 2016 was less than 5% in Angola and Botswana (Table 3). Such result is consistent with the results from the food price analysis which implied no food price increase in 2016 in real terms. The simulated results also imply no change in the number of people at risk due to droughts in these two countries (Table 6).
The study results have illustrated how drought would jeopardize future food security in southern Africa given that for its food security, the region strongly depends on maize, a crop which is very sensitive to drought. More specifically, the study has shown that with moderate economic growth and no future droughts, food security would only slightly improve in southern Africa by 2040. In other words, the region would not become wealthy enough to produce or import enough food to eliminate food insecurity. In this context, recurrent droughts would worsen food security by severely affecting the production of maize which would remain a staple food by 2040. Indeed, compared to other food and cash crops, maize would experience the largest reduction in production under drought. With consecutive two-year regional droughts, most countries would experience an increase of at least 10% in the number of people at risk of hunger within one single year and this would have serious implications for humanitarian aid. Not much has been documented on the effectiveness of humanitarian aid in southern Africa. Most countries in southern Africa have a government department dedicated to disaster management; but they face various challenges including budgetary and technical constraints to support disaster management (Republic of Botswana, 1996; Parliament of Lesotho, 1997; Government of Zimbabwe, 2001; Parliament of the Republic of South Africa, 2002; National Assembly (Angola), 2003; King and Parliament of Swaziland, 2006; Government of Zambia, 2010; Republic of Namibia, 2012; Parliament of Malawi, 2014; Assemblee Nationale (Madagascar), 2015; Matos and Ndapassoa, 2020; Republic of Mozambique, 2020). Based on the World Bank, an effective “response and reconstruction” strategy after disaster should include three components: initial response; assessment and policy making; and reconstruction (Jha et al., 2010). The initial response should last about 2 weeks after the disaster and should entail conducting a rapid needs assessment and launching an emergency response. The “assessment and policy making” component should last about 2 months after the disaster and should be closely linked to the reconstruction component. Detailed assessment needs should be conducted within the 2-month period; in addition, a reconstruction plan should be defined and approved by the government over that period. The reconstruction component should kick in at the same time as component two, but it should last longer: 2 years and above. That component should include an institutional and financial strategy; it should also include community participation in designing and implementing a reconstruction strategy. The reconstruction component should also include a risk management strategy. All activities linked to the ‘response and reconstruction’ strategy should also be monitored and evaluated to assess their effectiveness and inform future activities (Jha et al., 2010).
As noted in the literature, drought vulnerability is influenced by both physical and socio-economic factors (Shiferaw et al., 2014; Kamali et al., 2018). Socio-economic factors are linked to governance, demography, technological advancement, and economic development (Shiferaw et al., 2014). Some policy measures which could be used to reduce drought vulnerability in southern Africa are related to breeding for stress-resilient maize, crop diversification, and rainwater harvesting.
Enhancing food security in southern Africa under drought would call for breeding and deploying maize that is tolerant to both drought and heat stresses. International breeding efforts have led to the development of drought-tolerant maize varieties and ex post studies on have shown that these varieties perform quite well under mild or moderate drought conditions in Uganda and Nigeria (Wossen et al., 2017; Simtowe et al., 2019). However, additional efforts are required to develop improved maize varieties which are early-maturing and have some tolerance to both heat and drought stresses. Early maturity provides an effective drought avoidance strategy by completing flowering, the most sensitive stage to moisture deficit, before the onset of drought thus escaping terminal drought (Badu-Apraku and Fakorede, 2013).
In addition, some countries should diversify away from maize as a staple food to enhance food security under drought. In countries such as Lesotho, Malawi, Mozambique, South Africa, Eswatini, Zambia, and Zimbabwe, maize provides at least 20% of daily caloric intake. In these countries, measures should be undertaken to promote the consumption of drought-tolerant crops such as cowpea and cassava. In Angola where cassava dominates consumption and maize contributes to 14% of daily caloric intake, the recurrent drought of 2014/15 and 2015/16 did not significantly affect food security (Southern African Development Community, 2016). Various studies have also shown the potential for drought-tolerant secondary crops to enhance food security in southern Africa. For example, cassava was identified as a food commodity which could enhance food security in Zambia during drought years (Dorosh et al., 2009). The crop was also found to have the ability to substantially enhance food security in Madagascar during the lean months when rice, the staple food, becomes scarce (Dostie et al., 2002). In Mozambique, cassava consumption varies across urban and rural landscapes. Rural households tend to use cassava to enhance food security during lean months; however, urban consumers, who are less poor, tend to prefer cereals to roots and tubers (Handa and Mlay, 2006). In Malawi, cassava products were shown to have enhanced food security for Malawian households exposed to cassava-based food from some projects in the 1990s (Rusike et al., 2010); in addition, Mango et al. (2018) find that higher crop diversification for selected famers in 4 districts in central Malawi was associated with enhanced food security for rural farm households (Mango et al., 2018). They recommended that the government in Malawi intensifies its policy drive on crop diversification within the country.
Some of the measures which could be used to enhance crop diversification are related to strategic food reserves which are operated in few countries: Malawi, Zambia, and Zimbabwe (Grain Marketing Board (Zimbabwe), 2021; Food Reserve Agency (Zambia), 2022; National Food Reserve Agency (Malawi), 2022). Every year, at harvest time, governments in these countries purchase food produce (mainly maize) from farmers within the country. Policies on strategic food reserves could be adjusted to increase the share of drought-tolerant crops such as dried cassava chips and cowpea purchased annually by governments. In addition, government policy measures in southern Africa could be implemented to ensure that public organizations and parastatals, such as prisons, hospitals, and schools which provide daily meals to a multitude, increase the proportion of drought-tolerant crops in human diets. For rural areas, targeted interventions with awareness campaigns could be conducted to ensure long-lasting adoption of crop diversification by smallholder farmers (Low et al., 2007).
Given that mean annual rainfall is projected to decrease with an increase in heavy precipitation events during the rainy season, it would be imperative for countries in southern Africa to invest in rainwater harvesting techniques that can substantially improve food security during drought years. Indeed, more than 50% of the rainwater which falls across rainfed agricultural systems of sub-Saharan Africa is lost through evaporation, percolation or runoff (Biazin et al., 2012). In addition, enhanced rainwater management alone could double crop yields whereas integrated water and soil fertility management could triple yields across the dryland regions of sub-Saharan Africa (Rockström et al., 2002; Dile et al., 2013). Rainwater can be harvested through ex and in situ systems. The ex situ systems involve collection of rainwater through macro-catchment systems, whereas the in situ systems include micro-catchment rainwater harvesting and techniques to increase water infiltration and reduce soil evaporation (Biazin et al., 2012; Dile et al., 2013). In southern Africa, rainwater harvesting for agriculture occurs at a very small scale. Recent statistics show that only 1.7% of agricultural land receives any form of irrigation in South Africa; in Botswana, the proportion is still less than 0.5%.3 In Botswana and Zimbabwe, rainwater macro-catchment systems are used and both countries use earthen water dams; Botswana also uses cisterns (Biazin et al., 2012). Micro-catchment rainwater systems are used in Zimbabwe and South Africa; the two countries use pitting and South Africa also uses contouring (Biazin et al., 2012). Capturing rainwater to enhance water and crop productivity across southern Africa would increase food production and enhance community resilience during drought years. Indeed, ex situ rainwater harvesting techniques could be used to store water and avail it for food production in drought years. In addition, in situ rainwater harvesting techniques could be used in combination with soil fertility techniques to enhance food production during drought years. Hindrances to the adoption of rainwater harvesting techniques among African farming communities, including those in southern Africa, include high investment costs, high labour requirement, high complexity of techniques and inappropriate fit of the techniques with local practices (Mutekwa and Kusangaya, 2006; Backeberg et al., 2009; Biazin et al., 2012). As such, feasibility studies need to be conducted for targeted regions in southern Africa to ensure the promotion of tailored and well adapted rainwater harvesting techniques.
This study uses an integrated system modeling to quantify the bio-economic impact of future droughts in southern Africa. Results suggest that under moderate economic growth and no drought, food security in southern Africa would only slightly improve by 2040 and the region would not be able to produce or import enough food to substantially mitigate food insecurity. In this context, simulated future droughts would lead to much more erratic agricultural production in the region. Maize, the key staple food, would experience the largest reduction in production under drought when compared to other food and cash crops. Hence, drought would worsen regional food security. Countries which would experience the highest increase in the number of people at risk of hunger due to droughts would be Lesotho, Malawi, Mozambique, Namibia, Eswatini, South Africa, Zimbabwe, and Zambia. Sensitivity analysis on drought frequency suggests that consecutive two-year regional droughts similar to what happened between 2014 and 2015 would substantially affect maize production compared to other crops. Here, maize production would decrease by more than 50% in the consecutive drought year and most countries would experience an increase of at least 10% in the number of people at risk of hunger within a single year. Enhancing regional food security under drought would call for an integrated approach that includes breeding improved maize varieties with enhanced tolerance to the abiotic stresses brought about by drought; diversifying the diet to incorporate more drought-tolerant food crops such as cassava and cowpea; and investing in rainwater harvesting technologies.
Publicly available datasets were analyzed in this study, as shown in the citations (FAOSTAT, SADC, etc.). The data for the IMPACT model can be found in GitHub (https://github.com/IFPRI/IMPACT/tree/master/DriverAssumptions); in addition, the model code for IMPACT can be found in Robinson et al. (2015) which is also cited in the paper.
DC and SG: initial conceptualization. DC, AA, and SG: contribution to conceptualization and research design. SG: writing manuscript. DC, AA, SK-B, and GC: editing manuscript. All authors contributed to the article and approved the submitted version.
This work was partially supported through the Global Futures and Strategic Foresight (GFSF) project which is supported by the CGIAR Program on Policies, Institutions, and Markets (PIM), led by IFPRI.
The authors declare that the research was conducted in the absence of any commercial or financial relationships that could be construed as a potential conflict of interest.
All claims expressed in this article are solely those of the authors and do not necessarily represent those of their affiliated organizations, or those of the publisher, the editors and the reviewers. Any product that may be evaluated in this article, or claim that may be made by its manufacturer, is not guaranteed or endorsed by the publisher.
1. ^0.40 = ((1 + 1.5/100)/(1 + 1.1/100) – 1).
2. ^32 = ((1 + 18.8/100)/(1–9.9/100) – 1).
3. ^Data from World Bank, 2018
Assemblee Nationale (Madagascar) (2015). LOI n° 2015–031 relative à la Politique Nationale de Gestion des Risques et des Catastrophes.
Backeberg, G.R., Behl, R.K., Merbach, W., Meliczek, H., and Kaetsch, C. (2009). Improving rural livelihoods with rainwater harvesting and conservation on communal croplands in South Africa: opportunities and obstacles. Proc. 2nd International seminar of the International Foundation for sustainable Development in Africa and Asia, 14. Available at: https://es.ircwash.org/sites/default/files/Backeberg-2009-Improving.pdf (accessed: 9 November 2023).
Badu-Apraku, B., and Fakorede, M. A. B. (2013). “Breeding early and extra-early maize for resistance to biotic and abiotic stresses in sub-Saharan Africa” in Plant Breeding Reviews. ed. J. Janick (New York, NY: Wiley Online Library) 123–205.
Biazin, B., Sterk, G., Temesgen, M., Abdulkedir, A., and Stroosnijder, L. (2012). Rainwater harvesting and management in rainfed agricultural systems in sub-Saharan Africa - a review. Phys. Chem. Earth 47–48, 139–151. doi: 10.1016/j.pce.2011.08.015
Cairns, J. E., Sonder, K., Zaidi, P. H., Verhulst, N., Mahuku, G., Babu, R., et al. (2012). “Chapter one – maize production in a changing climate: impacts, adaptation, and mitigation strategies” in Advances in agronomy, 1–58.
Central Statistical Office - Botswana (2016) Botswana Environment Statistics: natural disasters digest 2015. Gaborone: Central Statistical Office.
Culas, R. J., and Hanjra, M. A. (2011). “Some explorations into Zambia’s post-independence policies for food security and poverty reduction” in Agricultural policies: New developments. ed. L. M. Contreras (New York, NY: Nova Science Publishers, Inc). 17–142.
Dile, Y. T., Karlberg, L., Temesgen, M., and Rockström, J. (2013). The role of water harvesting to achieve sustainable agricultural intensification and resilience against water related shocks in sub-Saharan Africa. Agric. Ecosyst. Environ. 181, 69–79. doi: 10.1016/j.agee.2013.09.014
Dorosh, P. A., Dradri, S., and Haggblade, S. (2009). Regional trade, government policy and food security: recent evidence from Zambia. Food Policy 34, 350–366. doi: 10.1016/j.foodpol.2009.02.001
Dostie, B., Haggblade, S., and Randriamamonjy, J. (2002). Seasonal poverty in Madagascar: magnitude and solutions. Food Policy 27, 493–518. doi: 10.1016/S0306-9192(02)00063-5
FAOSTAT (2018) Crop production and harvested area; food balance sheets; and food and consumer Price indices Rome: FAOSTAT.
Fauchereau, N., Trzaska, S., Rouault, M., and Richard, Y. (2003). Rainfall variability and changes in southern Africa during the 20th century in the global warming context. Nat. Hazards 29, 139–154. doi: 10.1023/A:1023630924100
FEWSNET (2002a) Malawi: Monthly food security report - mid-December to mid-January, 2002 Washington: FEWSNET.
FEWSNET (2004c). Southern Africa food security brief December 2003 – January 2004 Washington: FEWSNET.
Fischer, G., Shah, M., Tubiello, F. N., and Van Velhuizen, H. (2005). Socio-economic and climate change impacts on agriculture: an integrated assessment, 1990-2080. Philos. Trans. R. Soc. B Biol. Sci. 360, 2067–2083. doi: 10.1098/rstb.2005.1744
Food Reserve Agency (Zambia) (2022) Food reserve agency. Available at: https://fra.org.zm/ (Accessed: 15 October 2023).
Grain Marketing Board (Zimbabwe) (2021). Grain marketing board, grain marketing board. Available at: http://www.gmbdura.co.zw/ (accessed: 18 October 2023).
Handa, S., and Mlay, G. (2006). Food consumption patterns, seasonality and market access in Mozambique. Dev. South. Afr. 23, 541–560. doi: 10.1080/03768350600929249
Hulme, M., Doherty, R., and Ngara, T. (2001). African climate change: 1900-2100. Clim. Res. 17, 145–168. doi: 10.3354/cr017145
Islam, S., Cenacchi, N., Sulser, T. B., Gbegbelegbe, S., Hareau, G., Kleinwechter, U., et al. (2016). Structural approaches to modeling the impact of climate change and adaptation technologies on crop yields and food security. Glob. Food Sec. 10:63–70. doi: 10.1016/j.gfs.2016.08.003
Jayanthi, H., Husak, G. J., Funk, C., Magadzire, T., Adoum, A., and Verdin, J. P. (2014). A probabilistic approach to assess agricultural drought risk to maize in southern Africa and millet in Western Sahel using satellite estimated rainfall. Int. J. Disast. Risk Reduct. 10, 490–502. doi: 10.1016/j.ijdrr.2014.04.002
Jha, A., Barenstein, J., Phelps, P., Pittet, D., and Sena, S. (2010) Safer homes, stronger communities, Citeseer. Washington DC. Available at: https://citeseerx.ist.psu.edu/document?repid=rep1&type=pdf&doi=c4166e48cac94150aaaf75252050a1cdf097c3d6 (accessed: 9 November 2023).
Jury, M. (2013). Climate trends in southern Africa (with erratum). South Afric. Sci. Suid-Afrikaanse wetenskap 109, 1–11. doi: 10.1590/sajs.2013/980
Kamali, B., Abbaspour, K. C., Wehrli, B., and Yang, H. (2018). Drought vulnerability assessment of maize in sub-Saharan Africa: insights from physical and social perspectives. Glob. Planet. Chang. 162, 266–274. doi: 10.1016/j.gloplacha.2018.01.011
King and Parliament of Swaziland (2006). Disaster Management Act, 2006. Lobamba: The King and Parliament of Swaziland.
Kitoh, A., and Endo, H. (2016). Changes in precipitation extremes projected by a 20-km mesh global atmospheric model. Weather Clim. Extrem. 11, 41–52. doi: 10.1016/j.wace.2015.09.001
Low, J. W., Arimond, M., Osman, N., Cunguara, B., Zano, F., and Tschirley, D. (2007). Ensuring the supply of and creating demand for a biofortified crop with a visible trait: lessons learned from the introduction of orange-fleshed sweet potato in drought-prone areas of Mozambique. Food Nutr. Bull. 28, S258–S270. doi: 10.1177/15648265070282S205
Mango, N., Makate, C., Mapemba, L., and Sopo, M. (2018). The role of crop diversification in improving household food security in Central Malawi. Agric. Food Secur. 7, 1–10. doi: 10.1186/S40066-018-0160-X/TABLES/4
Manyatsi, A.M., and Mhazo, N. (2014) ‘A comprehensive scoping and assessment study of climate smart agriculture policies in Swaziland ’.
Masih, I., Maskey, S., Mussá, F. E. F., and Trambauer, P. (2014). A review of droughts on the African continent: a geospatial and long-term perspective. Hydrol. Earth Syst. Sci. 18, 3635–3649. doi: 10.5194/hess-18-3635-2014
Matos, P., and Ndapassoa, A. (2020) ‘Cyclone Idai and the humanitarian aid challenges in Mozambique’, Veredas do Direito [preprint]. Available at: https://heinonline.org/hol-cgi-bin/get_pdf.cgi?handle=hein.journals/rveredire17§ion=28 (accessed: 9 November 2023).
Mutekwa, V., and Kusangaya, S. (2006). Contribution of rainwater harvesting technologies to rural livelihoods in Zimbabwe: the case of Ngundu ward in Chivi District. Water SA 32, 437–444. doi: 10.4314/wsa.v32i3.5270
National Assembly (Angola) (2003) Law No 28/03 of 7 November, Basic Law on Civil Protection. National Assembly (Angola).
National Food Reserve Agency (Malawi) (2022) National Food Reserve Agency. Available at: https://www.nframw.com/ (accessed: 17 October 2023).
Nicholson, S. E., Nash, D. J., Chase, B. M., Grab, S. W., Shanahan, T. M., Verschuren, D., et al. (2013). Temperature variability over Africa during the last 2000 years. The Holocene 23, 1085–1094. doi: 10.1177/0959683613483618
O’Neill, B. C., Kriegler, E., Riahi, K., Ebi, K. L., Hallegatte, S., Carter, T. R., et al. (2014). A new scenario framework for climate change research: the concept of shared socioeconomic pathways. Clim. Chang. 122, 387–400. doi: 10.1007/s10584-013-0905-2
Parliament of the Republic of South Africa (2002). Disaster management act 57 of 2002. Cape Town: Parliament of the Republic of South Africa.
Republic of Botswana (1996). National Policy on disaster management. Gaborone: Republic of Botswana.
Republic of Mozambique (2020). Law no. 10/2020 approving the disaster risk management act. Maputo: Republic of Mozambique.
Robinson, S., Mason d’Croz, D., Islam, S., Sulser, T.B., Robertson, R.D., Zhu, T., et al. (2015) The international model for policy analysis of agricultural commodities and trade (IMPACT): Model description for version 3. Washington DC: IFPRI.
Robinson, S., Mason-D’Croz, D., Palazzo, A., Leroy, L., and Sulser, T. (2013) ‘Version 3 of the IFPRI IMPACT multi-market global agricultural production and trade model.’ Washington DC: IFPRI.
Rockström, J., Barron, J., and Fox, P. (2002). Rainwater management for increased productivity among small-holder farmers in drought prone environments. Phys. Chem. Earth Parts A/B/C 27, 949–959. doi: 10.1016/S1474-7065(02)00098-0
Rouault, M., and Richard, Y. (2005). Intensity and spatial extent of droughts in southern Africa. Geophys. Res. Lett. 32, 1–4. doi: 10.1029/2005GL022436
Rusike, J., Mahungu, N. M., Jumbo, S., Sandifolo, V. S., and Malindi, G. (2010). Estimating impact of cassava research for development approach on productivity, uptake and food security in Malawi. Food Policy 35, 98–111. doi: 10.1016/j.foodpol.2009.10.004
Seneviratne, S. I., Nicholls, N., Easterling, D., Goodess, C. M., Kanae, S., Kossin, J., et al. (2012). “Changes in climate extremes and their impacts on the natural physical environment” in Managing the risks of extreme events and disasters to advance climate change adaptation. eds. S. K. A. Field, C. B. V. Barros, T. F. Stocker, D. Qin, D. J. Dokken, K. L. Ebi, and M. D. Mastrandrea (Cambridge, UK; New York, NY, USA: Cambridge University Press).
Sheffield, J., and Wood, E. F. (2008). Global trends and variability in soil moisture and drought characteristics, 1950–2000, from observation-driven simulations of the terrestrial hydrologic cycle. J. Clim. 21, 432–458. doi: 10.1175/2007JCLI1822.1
Shiferaw, B., Tesfaye, K., Kassie, M., Abate, T., Prasanna, B. M., and Menkir, A. (2014). Managing vulnerability to drought and enhancing livelihood resilience in sub-Saharan Africa: technological, institutional and policy options. Weather Clim. Extrem. 3, 67–79. doi: 10.1016/j.wace.2014.04.004
Simtowe, F., Amondo, E., Marenya, P., Sonder, K., and Erenstein, O. (2019). Impacts of drought-tolerant maize varieties on productivity, risk, and resource use: evidence from Uganda. Land Use Policy 88
Southern African Development Community (2016) SADC: Regional humanitarian appeal, June 2016. Gaborone: Southern African Development Community.
UN Office Eswatini (2016) Swaziland/Eswatini: drought. Available at: http://reliefweb.int/sites/reliefweb.int/files/resources/Swaziland_Drought_RC_Situation_Report_Feb_2016-RC_Final.pdf.
World Bank (2018). Total population. Available at: https://data.worldbank.org/indicator/sp.pop.totl (Accessed: 10 May 2018).
Wossen, T., Abdoulaye, T., and Alene, A. (2017). Measuring the impacts of adaptation strategies to drought stress: the case of drought tolerant maize varieties. Available at: https://www.sciencedirect.com/science/article/pii/S0301479717306497 (accessed: 9 November 2023).
Keywords: southern Africa, drought, bio-economic modeling, food security, strategic foresight
Citation: Gbegbelegbe S, Chikoye D, Alene A, Kyei-Boahen S and Chigeza G (2024) Strategic Foresight analysis of droughts in southern Africa and implications for food security. Front. Sustain. Food Syst. 7:1159901. doi: 10.3389/fsufs.2023.1159901
Edited by:
Seth Etuah, Kwame Nkrumah University of Science and Technology, GhanaReviewed by:
Liboster Mwadzingeni, University of KwaZulu-Natal, South AfricaCopyright © 2024 Gbegbelegbe, Chikoye, Alene, Kyei-Boahen and Chigeza. This is an open-access article distributed under the terms of the Creative Commons Attribution License (CC BY). The use, distribution or reproduction in other forums is permitted, provided the original author(s) and the copyright owner(s) are credited and that the original publication in this journal is cited, in accordance with accepted academic practice. No use, distribution or reproduction is permitted which does not comply with these terms.
*Correspondence: Sika Gbegbelegbe, Uy5HYmVnYmVsZWdiZUBjZ2lhci5vcmc=
Disclaimer: All claims expressed in this article are solely those of the authors and do not necessarily represent those of their affiliated organizations, or those of the publisher, the editors and the reviewers. Any product that may be evaluated in this article or claim that may be made by its manufacturer is not guaranteed or endorsed by the publisher.
Research integrity at Frontiers
Learn more about the work of our research integrity team to safeguard the quality of each article we publish.