 John Allar1
 Rachel Mallinger
 Gabriel Maltais-Landry
- 1Department of Soil, Water, and Ecosystem Sciences, University of Florida, Gainesville, FL, United States
- 2Entomology and Nematology Department, University of Florida, Gainesville, FL, United States
Cover crops are typically grown during the summer in Florida’s organic vegetable systems, where they can affect nutrient cycling, soil health, and pests/pollinators. We compared the effects of five summer cover crops and a weedy fallow on marketable yields and the cycling of phosphorus, potassium, and carbon. Weed, nematode, and insect pollinator abundance were also monitored to measure any secondary impacts of cover cropping. Cover crops included monocultures of sunn hemp or sorghum sudangrass, a sunn hemp and sorghum sudangrass biculture, a three species mixture (biculture plus buckwheat), and a five species mixture (three species mixture plus cowpea and sunflower). In both 2018 and 2019, cover crops were planted in June and terminated in August, and bell peppers were grown from August until December. Marketable yields were greater with the tree and five species mixtures relative to the biculture in 2018, with no effects of cover crops on yields in 2019. Phosphorus and potassium accumulation was typically greater with cover crops than in the weedy fallow, but cover crops did not affect pepper nutrient accumulation or soil concentrations. Similarly, differences in carbon accumulation (lowest in sorghum sudangrass monoculture and weedy fallow) did not affect soil organic matter, soil total carbon or permanganate-oxidizable carbon. When analyzed as part of a radar plot analysis, cover crops helped manage summer weeds and root-knot nematodes in 2019, but the sorghum sudangrass monoculture increased sting nematodes; only the three and five species mixtures benefitted pollinators as buckwheat was the only cover crop that flowered in this study. Overall, cover crops had a limited effect on marketable yields and biogeochemical cycling but had more important secondary effects on pests and pollinators.
1. Introduction
Cover crops can replace fallow periods in both organic and conventional crop rotations to provide a single or multiple ecosystem service (s) or function (s). For example, cover crops can prevent soil erosion and retain residual soil nutrients (Cherr et al., 2006a) and they can also affect soil physical and chemical properties, such as soil organic carbon (SOC) and soil aggregates (Ruis and Blanco-Canqui, 2017). Cover crops can help with weed management by controlling weeds through competition and shading (Baraibar et al., 2017), allelopathy (Reberg-Horton et al., 2005), and/or physical suppression when residues are left on the surface as a mulch (Linares et al., 2008). Cover crops can also affect the abundance of pests such as nematodes (Barker and Koenning, 1998; Crow et al., 2001), and beneficial organisms such as pollinators (Wilson et al., 2017; Mallinger et al., 2019). In contrast, cover crops have more modest effects on yields, with benefits often restricted to systems where nutrient inputs are below recommendations (Cherr et al., 2006b) or benefits observed only for early season marketable yields (Li et al., 2021). Ultimately, as cover crops affect agroecosystems in several ways, it is critical to evaluate multiple indicators simultaneously to understand their overall impact (Schipanski et al., 2014).
Cover crops affect nutrient cycling by taking up significant amounts of essential nutrients from the soil, including phosphorus (P) and potassium (K) that cannot be supplied from atmospheric sources like nitrogen. Cover crops can increase soil nutrient availability by promoting the conversion of soil P and K into forms that are more readily available for plant uptake, and by reducing losses through uptake before nutrients are lost via erosion, runoff and/or leaching (Maltais-Landry et al., 2014; Gao et al., 2022). Thus, cover crops can improve P retention (Maltais-Landry et al., 2015), and they can also decrease K losses and increase internal K cycling (Rosolem and Calonego, 2013). In order to maximize nutrient cycling benefits, cover crop residues must be mineralized prior to nutrient uptake by subsequent cash crops. However, synchronizing nutrient release from residues with cash crop uptake is complex and affected by several factors, including residue quality and soil type (Damon et al., 2014; Maltais-Landry and Frossard, 2015). Residue decomposition is also affected by the specific cover crop used, e.g., greater P benefits when using legumes in low P soils (Hallama et al., 2019), emphasizing the context-specificity of cover crop effects on nutrient cycling.
Cover crops also affect soil carbon cycling, including impacts on soil organic matter (SOM) and SOC that are critical components of soil health/quality, nutrient cycling, and soil structure (Kibblewhite et al., 2008). As several intensive and widespread agricultural practices (e.g., tillage, fertilization) can significantly reduce SOM (Guo and Gifford, 2002; Jensen et al., 2020), cover crops can help maintain and/or increase SOM in depleted soils by increasing carbon inputs (Blanco-Canqui et al., 2015), with greater increases associated with longer-term cover crop use (Poeplau and Don, 2015). Beyond their impact on soil total C, cover crops may also affect soil C pools that are more labile, such as permanganate-oxidizable C (POXC), a soil health indicator often referred to as “active C.” In previous research, POXC has been associated with C accumulation and stabilization compared to other soil C pools (Hurisso et al., 2016), although the exact nature of what POXC truly measures in soils remains debated. Ultimately, cover crops could be used to increase soil C, which is key to sustain proper soil function in agroecosystems (Kibblewhite et al., 2008), although their impact will likely be influenced by study duration, soil texture, and/or local climatic conditions (Johnson et al., 2021).
While cover crops affect biogeochemical cycling, they can also impact beneficial organisms (Schipanski et al., 2014), including pollinators that will benefit from the inclusion of flowering plants that provide nectar, pollen, and other resources. The benefits of different cover crop mixtures will depend on the timing and density of flowering; as most cover crops are typically terminated before flowering to avoid potential weed and nutrient translocation issues, careful cover crop selection is necessary if the cover crop is to provide beneficial floral resources. Additionally, given the diversity of pollinators, including bees, other insects, and other pollinating taxa (e.g., birds), the optimal cover crop mixture will vary based on the pollinator taxa of economic and ecological importance in each system (Ellis and Barbercheck, 2015; Mallinger et al., 2019). Providing floral resources to pollinators in the form of flowering cover crops can enhance pollinator abundance and diversity at the landscape scale, with positive, cascading effects on the pollination of numerous fruit, vegetable, and oilseed crops (Eberle et al., 2015; Ellis and Barbercheck, 2015).
Similarly, cover crops can promote beneficial organisms such as free-living nematode populations (Chauvin et al., 2015) that are beneficial to soil nutrient cycling and soil health (Neher, 2010; Ferris et al., 2012). However, ensuring that cover crops effectively suppress plant-parasitic nematodes is often a more important concern in several agroecosystems. Some cover crops such as sunn hemp (Crotalaria juncea L.) can reduce root-knot (Meloidogyne spp.) nematode populations in vegetable and row crop production systems of Florida (Wang et al., 2002, 2008), thereby reducing pest pressure. Conversely, selecting a cover crop that can be a host for the main plant-parasitic nematodes of a given system will be counter-productive for nematode management. For example, cash crops that are sensitive to sting nematodes (Belonolaimus longicaudatus Rau) may be negatively affected by grass cover crops (Crow et al., 2001).
Cover cropping will only be adopted by growers if it does not interfere with cash cropping periods. In Florida vegetable production, the ideal period for cover cropping is between June and August (i.e., the warmest and wettest months). Growers will often plant monocultures of either a legume to supply N through fixation – e.g., sunn hemp or cowpea [Vigna unguiculata (L.) Walp] – or a grass to add biomass and scavenge residual nutrients from the previous crop – e.g., sorghum sudangrass [Sorghum bicolor (L.) Moench x Sorghum bicolor var. sudanese]. Combining cover crop species into mixtures may provide a wider range of benefits than using monocultures, as mixtures increase the diversity of functional groups and could combine the benefits of multiple species. Diverse cover crop mixtures can produce more biomass (Ranaldo et al., 2019; Allar and Maltais-Landry, 2022) and be more resilient to the failure of a single species in the mixture, and biomass production correlates with several cover crop benefits such as greater organic residue inputs, enhanced weed control (Linares et al., 2008; Osipitan et al., 2018), and improved retention of residual nutrients (Finney et al., 2016). However, as diverse mixtures can be more complex to manage (e.g., more difficult to seed mechanically when seed size differs, greater attention necessary to crop rotation of subsequent crops) and more expensive to seed, evaluating the benefits and limitations of monocultures and mixtures of increasing diversity can help identify which cover crop is the best fit for a given system.
The main objective of this study was to determine the effects of cover crop monocultures and mixtures on marketable yields, biogeochemical cycling and the abundance of weeds, nematode pests, and insect pollinators in a Florida organic vegetable agroecosystem. To do so, we conducted an experiment from May 2018 to December 2019 to assess the effects of two monocultures (a legume and a grass), a legume-grass biculture, and two diversified mixtures (three or five species) on marketable yields, phosphorus, potassium, and carbon cycling, in addition to the abundance of summer weeds, root-knot and sting nematodes, and flower density and insect pollinators. Our main hypothesis was that the most diversified mixture would provide the most benefits across indicators, with monocultures being less beneficial than mixtures while still outcompeting a weedy fallow control.
2. Materials and methods
2.1. Experimental design
We established an experiment in June 2018 at the Field and Fork farm located at the University of Florida (UF) in Gainesville, FL, USA, to measure how five cover crop treatments affect organic vegetable production. The field site experiences a humid subtropical climate, is located on a sandy soil (mapped as a Hyperthermic, Coated Typic Quartzisamments), and had relatively high SOM (>4%) for mineral soils of Florida (i.e., non Histosols).
Summer cover crop treatments were established on 34 m2 plots (width of 4.11 m and length of 8.23 m) arranged in three randomized blocks; therefore, there were three plots per summer cover crop treatment in this experiment. Cover crop seeds were uniformly broadcast by hand across all plots and incorporated through disking. In contrast, cash crops were planted on beds of 1.37 m width (three beds per plot). Cover crops included sunn hemp (cv. not specified), sorghum sudangrass (cv. BMR Sweet Forever), buckwheat (Fagopyrum esculentum Moench, cv. not specified), cowpea (cv. Iron and Clay), and sunflower (Helianthus annuus L., cv. Black Oil Seed) to establish the following six treatments:
• Sunn hemp monoculture
• Sorghum sudangrass monoculture
• Two species mixture: mixture of S. hemp and S. sudangrass
• Three species mixture: mixture of S. hemp, S. sudangrass, and buckwheat
• Five species mixture: mixture of S. hemp, S. sudangrass, buckwheat, cowpea, and sunflower (although we observed no germination/growth of sunflower for both 2018 and 2019)
• Weedy fallow control with no planted cover crops.
We combined SARE (Sustainable Agriculture Research and Education) recommendations (Clark, 2012), Penn State recommendations (Borrelli, 2020), and local farmer knowledge to determine seeding rates. Cover crops were seeded at:
• Sunn hemp: 56 kg ha−1 (1,850,000 seeds ha−1) in monoculture and 28 kg ha−1 (925,000 seeds ha−1) in mixtures
• Sorghum sudangrass: 56 kg ha−1 (2,220,000 seeds ha−1) in monoculture and 39 kg ha−1 (1,540,000 seeds ha−1) in mixtures
• Buckwheat: 22 kg ha−1 (870,000 seeds ha−1)
• Cowpea: 95 kg ha−1 (860,000 seeds ha−1)
• Sunflower: 17 kg ha−1 (300,000 seeds ha−1).
Seeding rates were identical among mixtures for a given cover crop, regardless of the number of species. In the case of sunflower in the five species mixture, high seeding rates for cowpea and buckwheat could be the driving force behind its lack of germination.
2.2. Cropping sequence and management
In May 2018, a bahiagrass (Paspalum notatum Flüggé) and wildflower meadow was converted to agricultural research fields through regular disking for 4 weeks, prior to planting summer cover crops on June 25th, 2018; termination occurred on August 20th, 2018 by flail mowing. Bell peppers (Capsicum annuum L., cv. Revolution) were transplanted in hay-mulched beds on September 6th and 7th, 2018, and terminated on December 6th, 2018. A winter rye (Secale cereale L., cv. Wrens Abruzzi) cover crop was seeded on December 13th, 2018 and terminated on March 1st, 2019. Acorn squash (Cucurbita pepo L. var. turbinata, cv. Taybelle PM) was planted on March 21st and 22nd, 2019 and terminated on May 27th, 2019. Summer cover crops (i.e., those resulting in cover crop treatments) were planted again on June 28th, 2019 and terminated on August 26th, 2019. Bell peppers (cultivar Aristotle) were transplanted on September 16th and 17th and terminated on December 16th, 2019.
Fields were rototilled before summer cover crop planting to generate a uniform seedbed, and cover crop seeds were broadcast by hand and subsequently incorporated through light aggression disking. Legume seeds were inoculated prior to planting (Guard-N, Verdesian Life Sciences, Cary, NC), no fertilizers were applied prior to cover crop establishment, and summer cover crops were not irrigated. In both 2018 and 2019, weed biomass was not controlled in the weedy fallow control during the summer (i.e., no mowing or tillage) and weeds were terminated by mowing at the same time as the other cover crop treatments.
Certified organic bell pepper transplants were used for both years: cultivar Revolution was used in 2018 and replaced with cultivar Aristotle in 2019 due to the poor quality of Revolution seeds obtained by the greenhouse providing transplants (Banner greenhouses, Nebo, NC). Because of weather delays due to Hurricanes Dorian and Humberto in September 2019, pepper transplants remained in the greenhouse for 3 weeks after optimal transplant quality was achieved, resulting in poor pepper transplant quality in 2019 compared to 2018.
Crops were fertilized for N using 13-0-0 fertilizer derived from feather meal, meat meal, and blood meal (Nature Safe, Irving, TX). Peppers were fertilized at 149 kg N ha−1, 67% of the UF IFAS (Institute of Food and Agricultural Sciences) recommended rate for peppers grown in conventional conditions in Florida (Liu et al., 2021). Based on soil tests, no other nutrients (including P and K) were required. Fertilizer was banded in the middle of each bed in a 0.3-m wide band and incorporated using a scuffle hoe within 4 days of planting each crop. We chose a lower N input rate to increase the likelihood of seeing an effect of cover crops on N cycling; details on the rationale for using 67% of the N recommendation and on N management can be found in Allar and Maltais-Landry (2022).
Pepper was irrigated using drip irrigation, and preventative applications of BT (Bacillus thuringiensis) were used to control insect pest populations, most importantly armyworms on pepper. Weeds were controlled with a combination of locally sourced hay mulch, hand cultivation using a scuffle hoe, and hand weeding. Cover cropped and weedy fallow plots were managed with the same approach during the pepper growing season, with no notable differences in weed pressure among treatments during cash crop growing seasons.
Between the two cycles of summer cover crops followed by pepper, a winter rye cover crop was planted in all plots in December 2018, including in weedy fallow control plots, followed by a squash crop in spring 2019, with identical weed, pest and irrigation management as pepper. These crops are not discussed in detail in this study.
2.3. Plant sampling and analysis
Summer cover crops were sampled prior to termination for aboveground biomass on August 20th, 2018 and August 23rd – 25th, 2019, using two 0.49 m2 quadrats per plot and separated by species. Any plant that could not be identified as a species planted in a given treatment was considered to be a weed, and all the biomass collected in weedy fallow plots was considered as weeds. Total fresh mass was recorded for each species in each sample and subsamples were weighed and oven-dried at 60°C for 48 h to determine water content. Dried samples were ground using a Wiley Mill and total C was measured by combustion. Cover crop samples were sent to an external lab (UF IFAS Analytical Services Laboratories, Gainesville, FL) for P and K analysis, which was conducted with digestion followed by quantification via ICP-OES (EPA method 200.7).
Pepper yields were quantified through five weekly harvests in 2018 and 2019. In 2018, harvest started on October 31 and ended on November 27, whereas harvest started on November 6 and ended on December 4 in 2019. Pepper fruits were separated between marketable (i.e., non-damaged fruits above a minimum size) and non-marketable fruit culls based primarily on insect damage and rot/decay that would prevent these fruits from being brought to market. The ratio between marketable and non-marketable yields was also computed, with marketable fruits accounting for 89% (range: 80–95%) and 73% (range: 59–92%) of total yields in 2018 and 2019, respectively. Additional details on yield measurements can be found in Allar and Maltais-Landry (2022).
We subsampled one representative marketable pepper per plot (three per treatment) on each harvest date, which was frozen within 48 h of collection, freeze-dried, and ground using a Wiley Mill. Only marketable fruits were sampled and analyzed for nutrient concentrations, given that they always accounted for the majority of harvested biomass, although we recognize that nutrient concentrations in non-marketable fruits could differ from marketable fruits and affect nutrient balances. Prior to pepper plant termination in both years, three representative plants per row were sampled for non-fruit aboveground biomass to quantify plant P and K uptake. Results were scaled back to kg ha−1 based on total plant population per hectare. Subsamples were dried at 60°C and ground using a Wiley Mill. All vegetable samples were sent to the same external lab as for cover crops (UF IFAS Analytical Services Laboratories, Gainesville, FL) for P and K analysis.
2.4. Soil sampling and analysis
Soil sampling frequency was variable and consisted in taking 4–10 soil cores (diameter = 2.5 cm), depending on the mass of soil needed for analyses, from the top 15 cm of soil in the center of the middle row in each plot. Soil sampling occurred before cover crop seeding (June 12th, 2018; June 11th, 2019), directly after disking cover crop residues (August 28th, 2018; March 6th, 2019; September 6th, 2019), and after pepper harvest (December 10th, 2018; December 16th, 2019). Samples were mixed and stored at 4°C until analyzed for resin-extractable P. A subsample was dried at 105°C for 48 h to determine moisture content, whereas a third subsample was air-dried and sieved prior to other analyses.
Within 48 h of sampling, resin-extractable P concentrations were quantified by shaking 3.5 g of field-moist soils with 35 mL of DDI water and one 12.5 cm2 anion exchange resin strip for 16 h on a reciprocal shaker. Resin strips were then rinsed with DDI, P adsorbed to the resins was eluted using 35 mL of 0.5 M HCl, and inorganic P was analyzed by colorimetry using the molybdate blue method (Tiessen and Moir, 2007) and an Epoch 2 microplate reader (Biotek, Winooski, VT).
Air-dried soils were used to quantify total C via combustion on a CN analyzer (Thermo Flash EA) and SOM by loss on ignition. Permanganate oxidizable carbon (POXC) was quantified using the method of Weil et al. (2003), where 2.5 g of air-dried soil was combined with 20 mL of 0.02 mol L−1 KMnO4, shook for 2 min and incubated in the dark for 10 min, and quantified by colorimetry at 550 nm after dilution. A subsample of air-dried soil was analyzed by Waters Agricultural Laboratories (Camilla, Georgia, USA) for soil pH (1:1 soil-to-water ratio) and soil potassium, using Mehlich III extraction (Mehlich, 1984) and quantification by ICP-OES.
2.5. Flower density and pollinator abundance
To determine flower density per plot, plots were visited weekly after planting and sampling began at the first sign of flowering across all plant species and plots. The first and only plant to flower was buckwheat in mid-July of 2018. Sampling occurred once every 2 weeks following the first sign of flowering and through cover crop termination. To quantify flower density, one 2.25 m2 quadrat was randomly thrown in each plot on each sampling day, and all inflorescences were counted within the quadrat. A single inflorescence was defined as a cluster of flowers when arranged in umbels (e.g., buckwheat) and as an individual flower for simple flowers (e.g., sunn hemp and cowpea). As only buckwheat flowered in 2018 across all plots, flowers were only recorded on the first two sampling dates of July 19th and August 2nd, 2018. After buckwheat ceased flowering in early August, no flowering cover crops were observed across all plots.
On the same days in which flower density was quantified, pollinator activity was recorded by conducting 5-min observation periods per plot, as detailed in Mallinger et al. (2019). During each 5-min observation period, a trained observer recorded all insect visits to flowering cover crops within each plot. Insects were identified to the following morphogroups: honey bees (Apis mellifera L.), bumble bees (Bombus spp.), green sweat bees (Augochlorella, Augochlora, and Agapostemon spp.), large solitary bees (primarily Eucerini), small sweat bees (primarily Lasioglossum spp.), butterflies, wasps, and flies. Timed observations were conducted between 9:30 and 11:30 under sunny conditions. Following timed observations, opportunistic captures of insects on flowers was conducted for approximately 1 h to identify members of the above morphogroups to species. Pollinators were grouped into the following categories for analysis given the low activity across individual morphogroups: bees, butterflies, flies, wasps, and all pollinators.
Inflorescence and pollinator sampling was not repeated in 2019 given the limited flowering and pollinator activity observed in 2018. However, buckwheat did flower in 2019 and was the only species that flowered during the 2019 summer cover cropping season, similar to 2018.
2.6. Nematode abundance
Sting and root-knot nematode soil abundances following cover crop termination in 2019 were used in this study as part of a radar chart assessing the overall impacts of cover crop treatments on multiple indicators, as described further in section 2.7. This represents a subset of the nematode data collected for this project. We restricted our analysis to 2019 data to avoid any short-term carry over effects from bahiagrass on nematodes, as bahiagrass is known to suppress root-knot nematodes in Florida (Andersen et al., 2016).
Soil samples for nematode abundances were collected on 26 August 2019. Twelve soil cores (diameter = 2 cm) per plot were collected (0–25 cm) and homogenized by gentle mixing; no sieving was done. Nematodes were extracted by sucrose-centrifugation (Jenkins, 1964) from a 100 cm3 soil subsample (equivalent to 230 g), and identified to genera using an inverted light microscope. For this study, sting nematode and root-knot nematode abundances per 100 cm3 soil were calculated, according to standard practices in studies of nematodes (e.g., Wang et al., 2008).
2.7. Data analysis
Although pepper fruits were collected from all five harvests per season, we only analyzed the fruits from the first, third and fifth harvest dates for P and K concentrations in 2018 and 2019 due to financial constraints and low variability among sampling dates for N concentrations, as reported in Allar and Maltais-Landry (2022). Phosphorus and K concentration did not vary considerably among the 1st, 3rd and 5th harvest dates, with median coefficients of variation among sampling dates for a given plot equal to 7% (P) and 8% (K) in 2018 and 13% (P) and 12% (K) in 2019. Using the P and K concentrations measured for those three analysis dates, we computed the average P and K concentration for each plot, and used these averages to estimate P and K concentrations for the second and fourth harvest. This allowed us to compute crop P and K accumulation by plot, using the sum of nutrients in marketable fruits and non-fruit aboveground biomass; this represents a slight underestimation of nutrient accumulation given that non-marketable fruits were not included in nutrient accumulation computations.
All statistical analyses were performed in R Version 3.5.3 (R Core Team, 2019). We analyzed the data collected during this experiment using ANOVAs followed by Tukey HSD tests, which were considered significant at the p < 0.05 level, and “marginally significant” at the p < 0.1 level. Data were analyzed using a mixed model, repeated measures ANOVA with cover crop treatment and time (individual sampling dates or years, depending on the variable) as fixed effects, and the interaction between block and treatment included as a random effect. When the treatment x time interaction was significant, the effects of one factor at different levels of the other factor were tested within the same model (e.g., with a Treatment|Time term). These mixed models were analyzed using functions lmer (package: lme4), cld (packages: multcomp, emmeans) and emmeans (package: emmeans). For all analyses, we verified that residuals were normal (Shapiro–Wilk test via function shapiro.test in package stats), and variances were homogeneous (Levene test via function leveneTest in package car). When these conditions were not met, we transformed data using a log transformation first, followed by a rank transformation if a log transformation was not sufficient.
Radar charts were computed to visualize the overall impacts of cover crop treatments on multiple indicators. Total pollinator abundance was averaged among plots and sampling dates of a given treatment in 2018 whereas cover crop accumulation of C, P, K (expressed as kg ha−1) and marketable yields were averaged over both years among the three plots for each treatment. Weeds and post cover crop soil N were processed in the same way as cover crop accumulation and marketable yields, using data published in Allar and Maltais-Landry (2022). The abundance of root-knot and sting nematodes following cover crop termination in 2019 was plotted as the average of the three plots for each treatment, using the data described in section 2.6.
3. Results
3.1. Pepper yields
Given the large difference in pepper marketable yields, which were substantially higher in 2018 than in 2019 for all cover crop treatments at all individual harvest dates (Table 1), we analyzed changes in pepper yields among individual harvest dates separately for each year. In 2018, there was no effect of cover crop treatments (p = 0.78) or the date x treatment interaction (p = 0.60), but marketable yield varied among dates (p < 0.001), being highest on November 14 (7,318 kg ha−1) and November 27 (6,147 kg ha−1), intermediate on October 31 (4,036 kg ha−1) and November 20 (2,746 kg ha−1), and lowest on November 7 (2,368 kg ha−1). In 2019, there was no effect of cover crop treatment (p = 0.63), sampling date (p = 0.31), or the date x treatment interaction (p = 0.99).
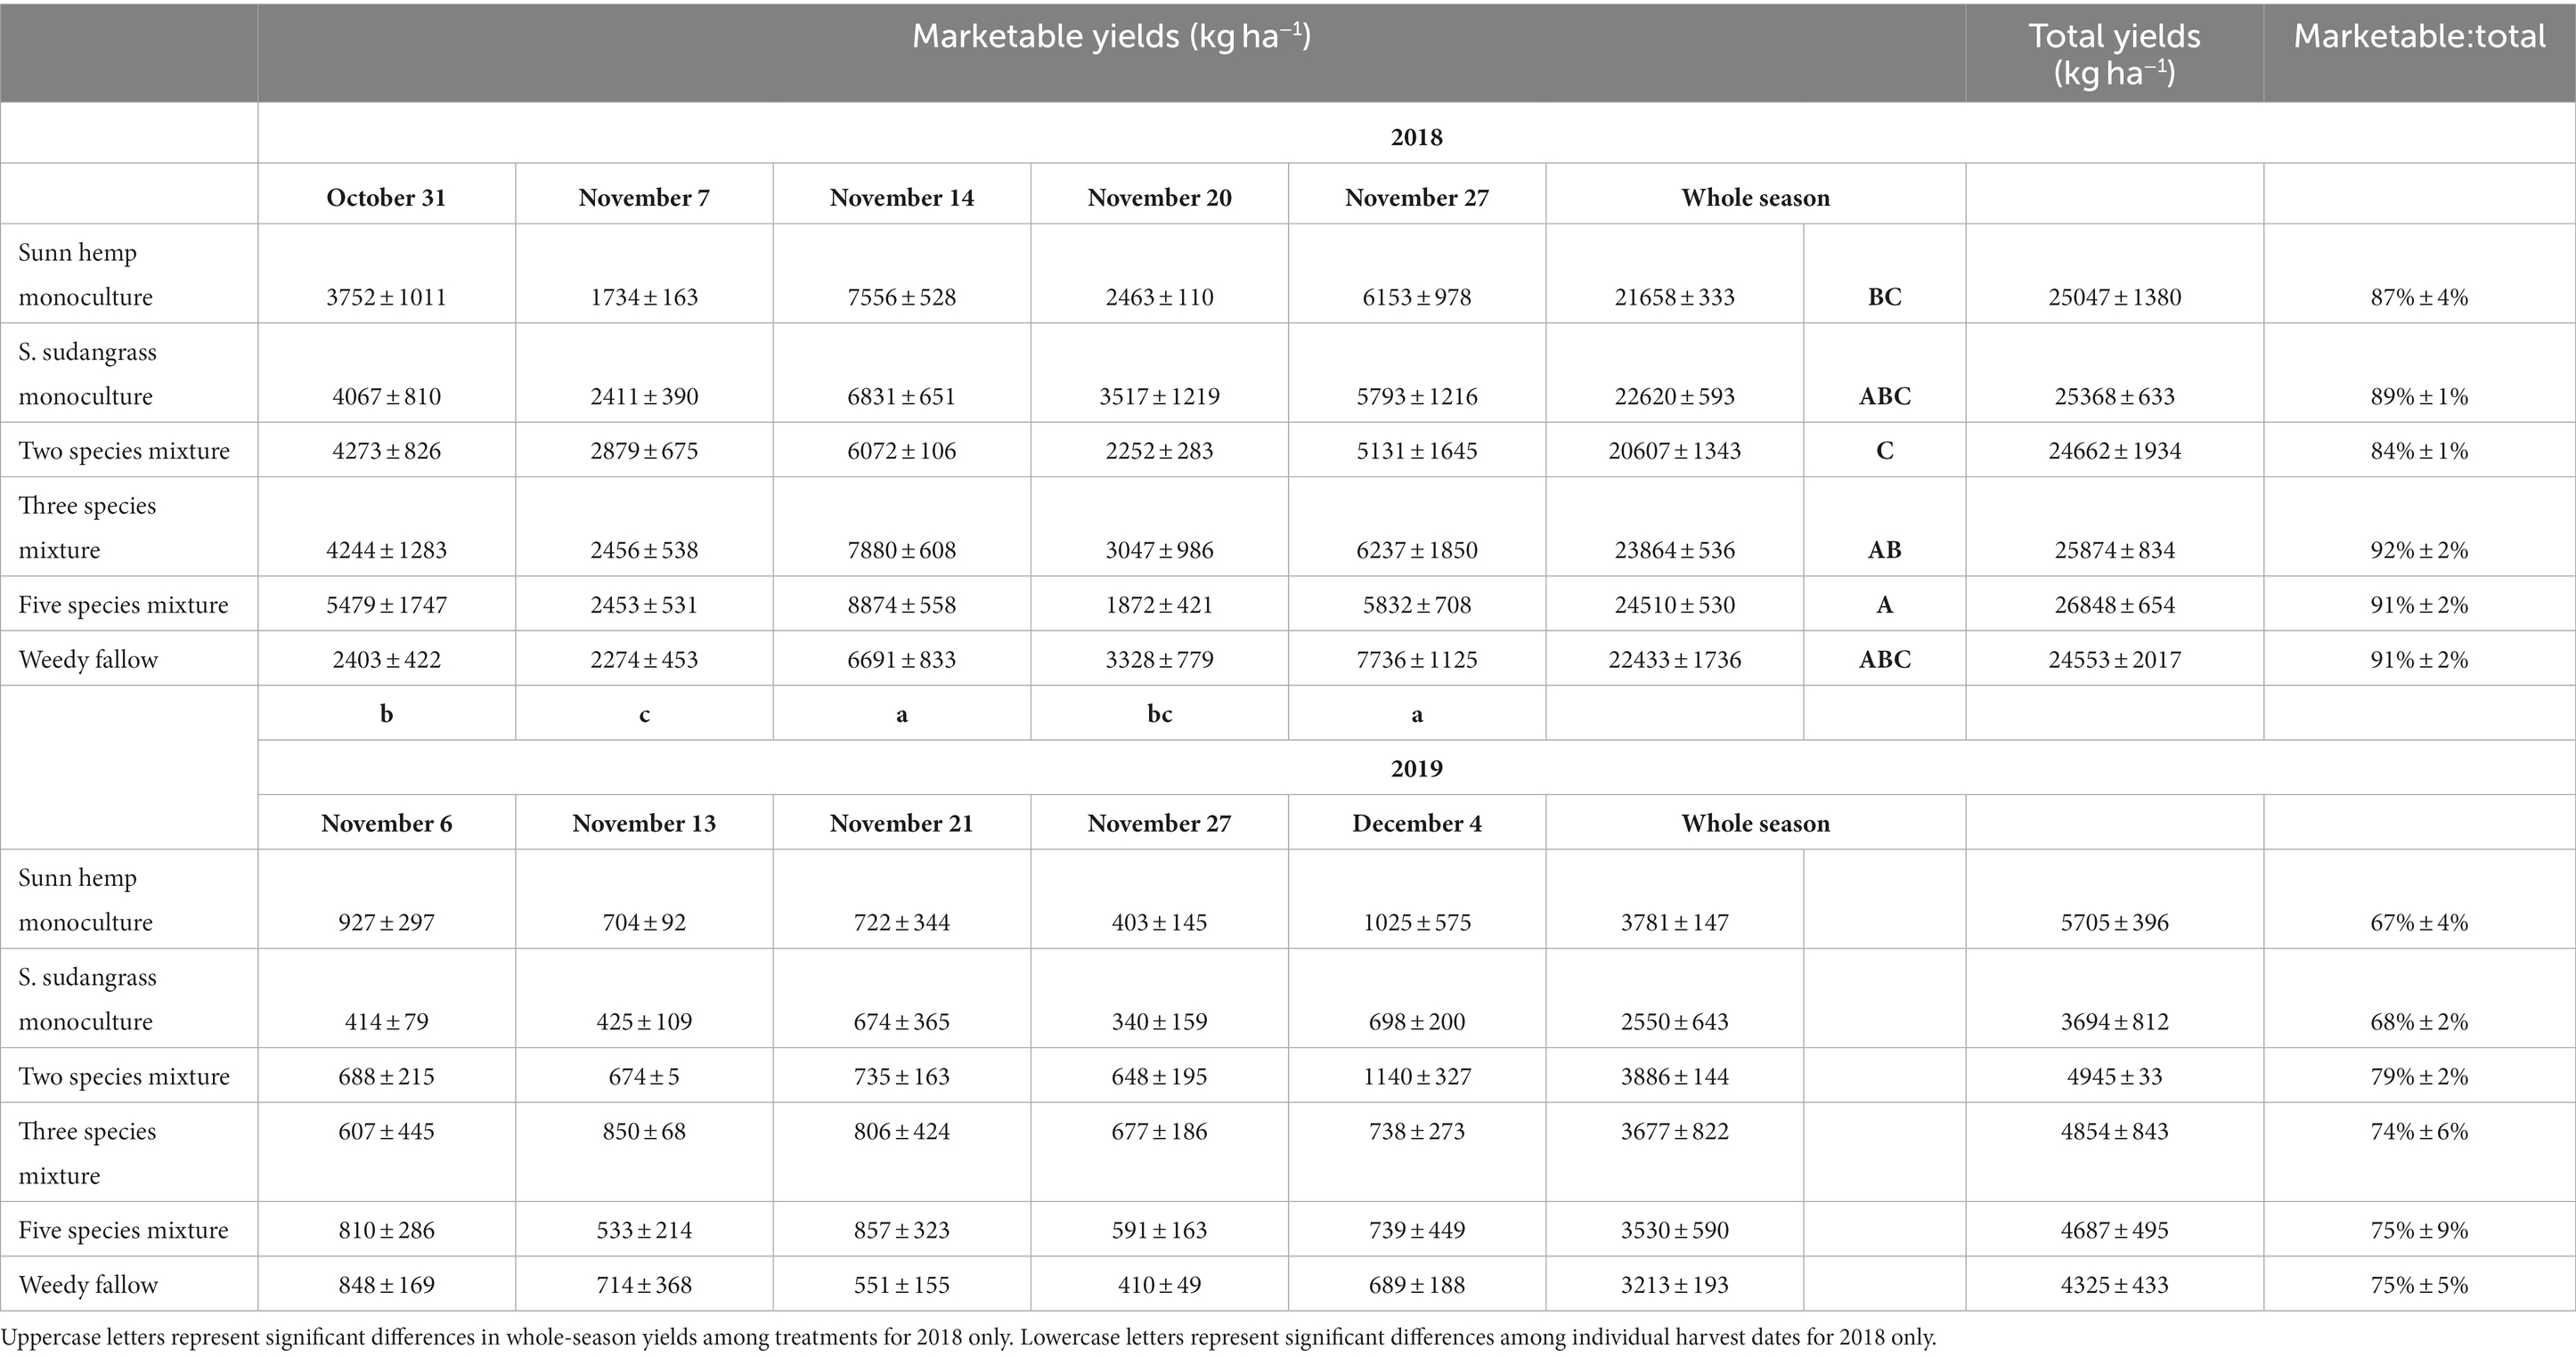
Table 1. Mean (± standard error) pepper marketable yields for individual harvest dates and the whole-season sum, total yields, and the ratio of marketable to total yields for the 2018 and 2019 growing seasons.
When summed over the whole season, total marketable yield was significantly affected by a year x treatment interaction (p < 0.05), being highest in the five species mixture and lowest in the two species mixture in 2018, with no difference among treatments in 2019 (Table 1). Total yields and the ratio of marketable to total yields were not affected by cover crop treatments (p = 0.53 for total yields, p = 0.36 for the ratio) or the year x treatment interaction (p = 0.48 for total yields, p = 0.33 for the ratio). Total yields (p < 0.001) were highest in 2018 (25,392 kg ha−1) vs. 2019 (4,702 kg ha−1) and the marketable to total yield ratio (p < 0.001) was also higher in 2018 (89%) vs. 2019 (73%).
3.2. Effects on P cycling
Phosphorus accumulation in cover crop aboveground biomass was affected by treatment (p < 0.001) but not by year (p = 0.59) or the year x treatment interaction (p = 0.45, Figure 1). Cover crop P accumulation was greatest in the two species (22 kg P ha−1), five species (21 kg P ha−1) and three species (19 kg P ha−1) mixtures, intermediate in the sorghum sudangrass (17 kg P ha−1) and sunn hemp (15 kg P ha−1) monocultures, and lowest in the weedy fallow (7 kg P ha−1). Cover crop P concentration was affected by a significant year x treatment interaction (p < 0.01), being greatest in the weedy fallow and lowest in the sunn hemp monoculture in both 2018 and 2019, while the sorghum sudangrass monoculture and three species mixture also had a greater P concentration than the sunn hemp monoculture in 2018 (Supplementary Table S1).
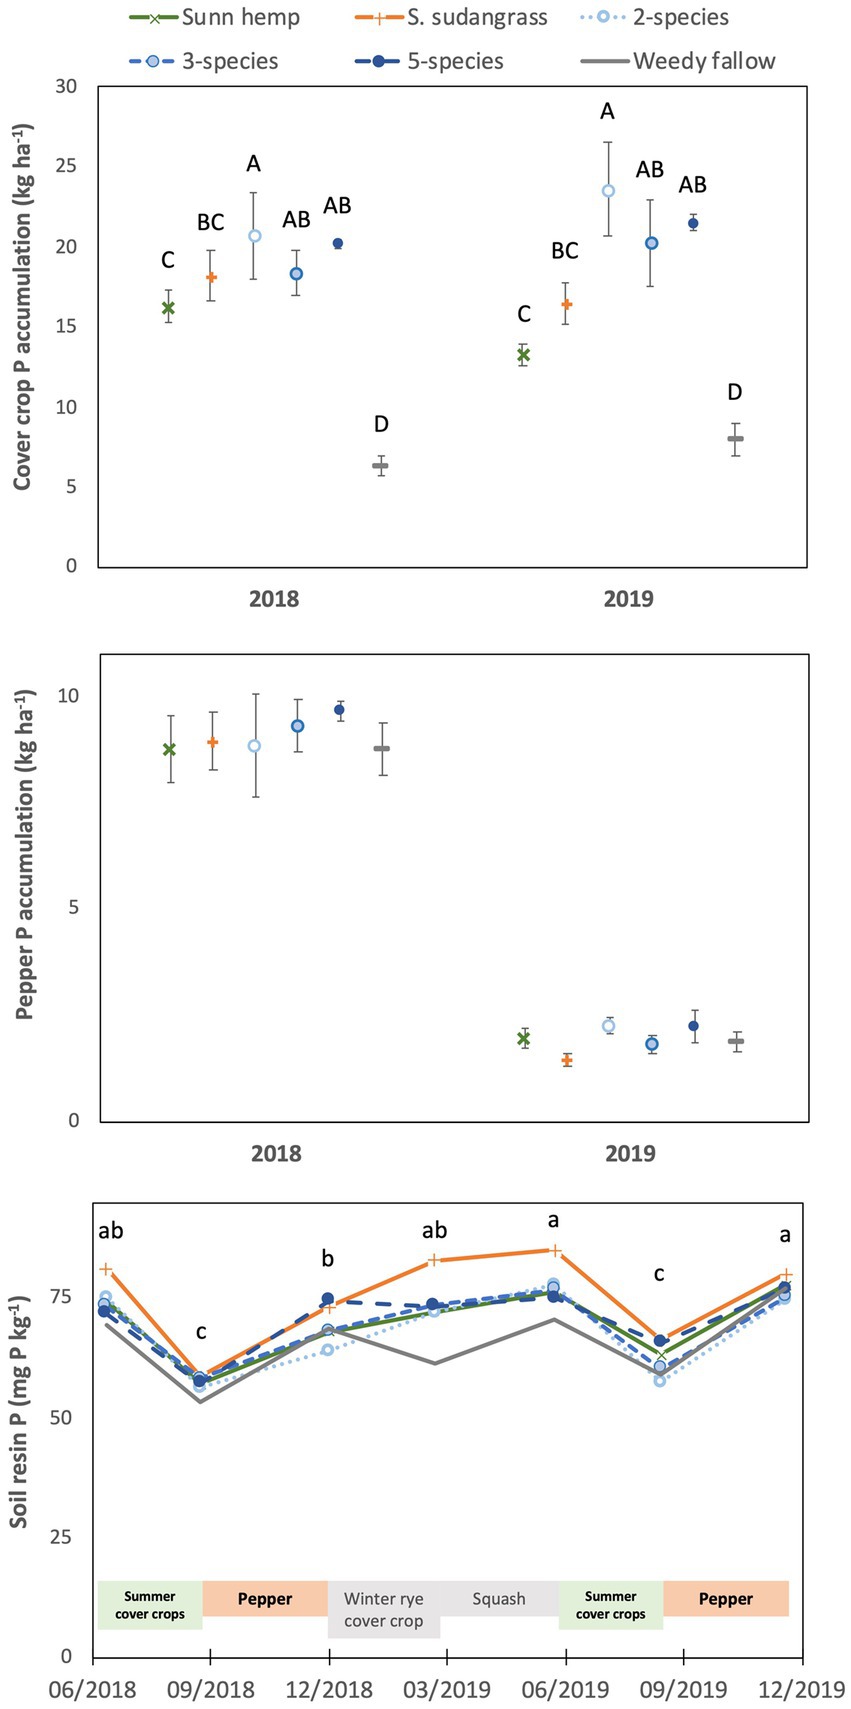
Figure 1. Mean (± standard error) accumulation of phosphorus in cover crop aboveground biomass (top) or pepper fruit and non-fruit aboveground biomass (middle), and mean soil resin-extractable phosphorus concentrations (bottom) among cover crop treatments. For the top graph, letters represent significant differences among cover crop treatment means averaged over years (see text for values) at p < 0.05, based on a Tukey HSD test (year x treatment interaction not significant). For the bottom graph, letters represent significant differences among cover crop treatment means averaged over years (see text for values) at p < 0.05 (date x treatment interaction not significant).
Phosphorus accumulation in pepper at harvest (i.e., the sum of harvested marketable fruits and non-fruit aboveground biomass) was not affected by cover crop treatments (p = 0.73) or the year x treatment interaction (p = 0.89), although P accumulation was substantially lower in 2019 (2 kg P ha−1) compared to 2018 (9 kg P ha−1, p < 0.001, Figure 1). Phosphorus concentrations in harvested fruits were not affected by the year x treatment interaction (p = 0.52), there was a marginally significant effect of cover crop treatments (p = 0.08), and concentrations were higher in 2018 (0.34% P) than in 2019 (0.26% P; p < 0.001; Supplementary Table S2). Similarly, P concentrations in non-fruit aboveground biomass were greater in 2018 (0.29% P) than in 2019 (0.26% P, p < 0.01), with no effect of cover crop treatments (p = 0.39) or the year x treatment interaction (p = 0.11).
Soil resin-extractable P varied based on sampling date (p < 0.001), but there was no significant effect of cover crop treatment (p = 0.60) or the date x treatment interaction (p = 0.94; Figure 1). Soil resin-extractable P varied based on cropping cycles, with low values after summer cover cropping (57 mg P kg−1 in 2018 and 62 mg P kg−1 in 2019) compared to other sampling dates, when resin P ranged from 70 to 77 mg P kg−1.
3.3. Effects on K cycling
Cover crop K accumulation was affected by cover crop treatment (p < 0.05), being highest in the five species (128 kg K ha−1) and two species (124 kg K ha−1) mixtures in addition to the sunn hemp monoculture (119 kg K ha−1), intermediate in the three species mixture (103 kg K ha−1) and sorghum sudangrass monoculture (80 kg K ha−1), and lowest in the weedy fallow (43 kg K ha−1, Figure 2). Cover crop K accumulation was not affected by year (p = 0.29) or the year x treatment interaction (p = 0.26). There was a significant year x treatment interaction for cover crop K concentrations (p < 0.001), which were greater in the weedy fallow biomass than in all other treatments in 2018, with no difference among treatments in 2019 (Supplementary Table S1).
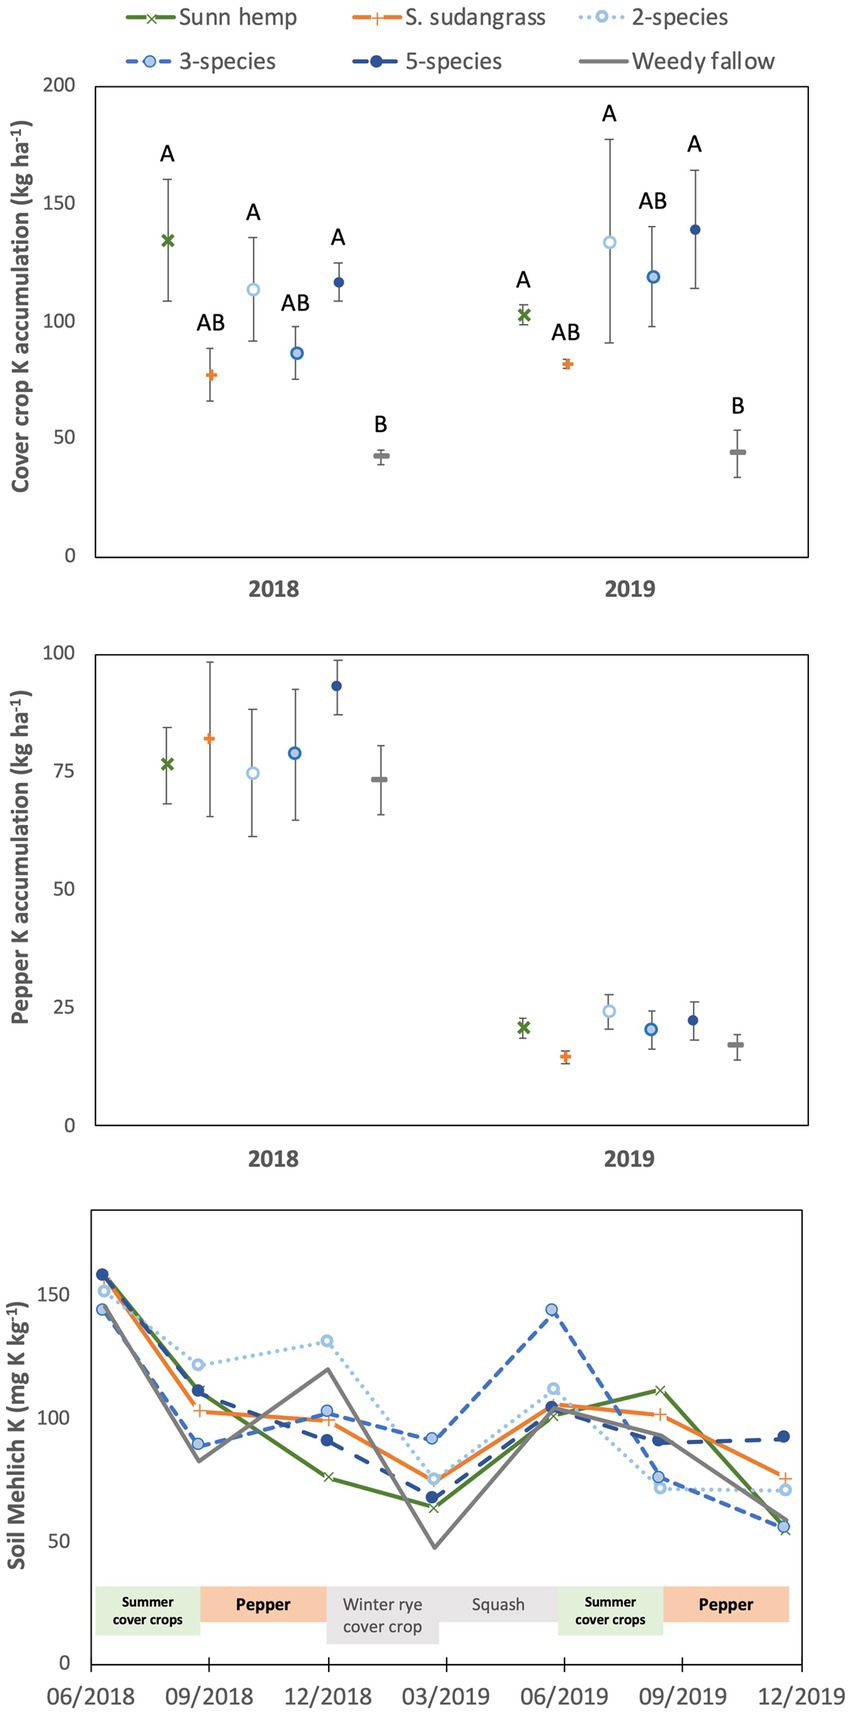
Figure 2. Mean (± standard error) accumulation of potassium in cover crop aboveground biomass (top) or pepper fruit and non-fruit aboveground biomass (middle), and mean soil Mehlich-extractable potassium (bottom) among cover crop treatments. For the top graph, letters represent significant differences among cover crop treatment means averaged over years (see text for values) at p < 0.05, based on a Tukey HSD test (year x treatment interaction not significant).
Cover crop treatments (p = 0.68) and the year x treatment interaction (p = 0.76) did not affect K accumulation in pepper at harvest, although pepper K accumulation was substantially lower in 2019 (20 kg K ha−1) compared to 2018 (80 kg K ha−1, p < 0.001; Figure 2). Potassium concentrations in pepper fruit and aboveground biomass were also not affected by cover crop treatments (p = 0.48 for fruit, p = 0.30 for aboveground biomass) or the year x treatment interaction (p = 0.56 for fruits, p = 0.45 for aboveground biomass), although K concentrations were higher in 2018 (2.5% K) than in 2019 (2.0% K) for fruit (p < 0.001) but not aboveground biomass (p = 0.16; Supplementary Table S2).
Soil Mehlich-extractable K was affected by the sampling date x treatment interaction (p < 0.01), but there was no significant effect of treatment on any individual sampling date (Figure 2). In contrast, there was a variable effect of sampling date depending on the cover crop treatment, with the only consistent temporal pattern among treatments being higher soil Mehlich-extractable K in June 2018 than in March and December 2019 (detailed interaction results not shown). Soil pH was greatest at the beginning of the experiment (pH = 5.8), declined after the harvest of each cash crop and was lowest in June and December 2019 (pH = 5.3; p < 0.001, Supplementary Figure S1). Soil pH was not affected by cover crop treatment (p = 0.30) or the sampling date x treatment interaction (p = 0.99).
3.4. Effects on C cycling
There was a significant year x treatment interaction for cover crop C accumulation (p < 0.05). In 2018, cover crop C accumulation by the two species mixture, five species mixture, and sunn hemp monoculture was greater than the sorghum sudangrass monoculture, and all cover crop treatments had greater C accumulation than the weedy fallow (Figure 3). In 2019, C accumulation was highest in the two species mixture, the mixtures had greater C accumulation than the sorghum sudangrass monoculture, and all cover crop treatments accumulated more C than the weedy fallow. Carbon concentrations were affected by a year x treatment interaction (p < 0.05) and they were greater in the weedy fallow than in all the five species mixture and sorghum sudangrass monoculture in 2018, although they did not differ among treatments in 2019 (Supplementary Table S1).
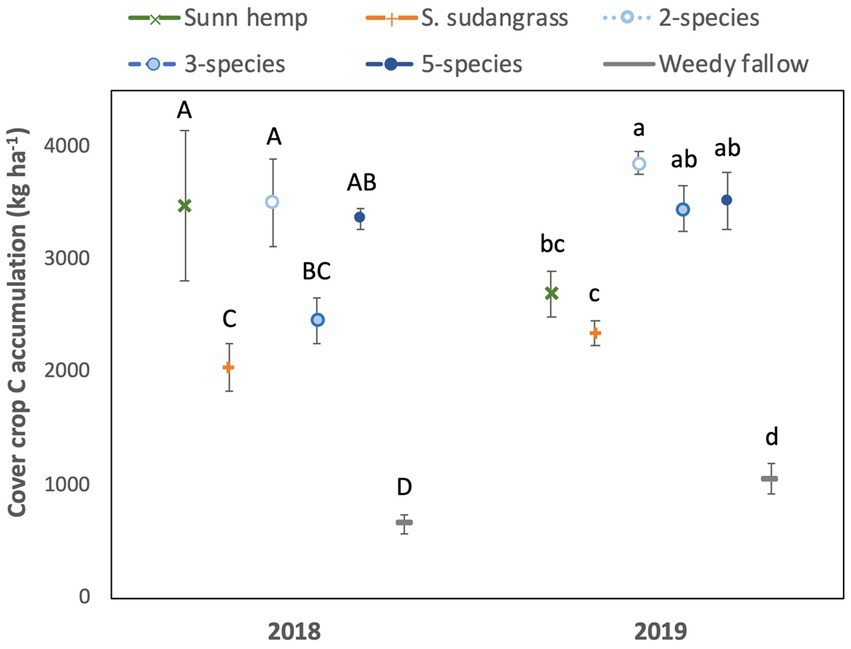
Figure 3. Mean (± standard error) accumulation of carbon in cover crop aboveground biomass. Letters represent significant differences among cover crop treatments within a given year at p < 0.05, based on a Tukey HSD test (i.e., year x treatment interaction significant).
Soil C pools (SOM, total C, and POXC) did not differ among cover crop treatments (p ≥ 0.36 for all three indicators) and they were not affected by the sampling date x treatment interaction (p ≥ 0.16 for all three indicators; Table 2). SOM decreased during the experiment, with SOM decreasing 1.5% (i.e., 15,000 mg SOM kg−1) between June 2018 (4.5% SOM) and final harvest in December 2019 (3.0% SOM, p < 0.001). Similarly, total soil C decreased 0.3% (i.e., 3,000 mg C kg−1) in all treatments between June 2018 (1.4% C) and December 2019 (1.1% C, p < 0.001). Finally, soil POXC decreased from 502 to 424 mg POXC kg−1 between June 2018 and December 2019 (p = 0.01).
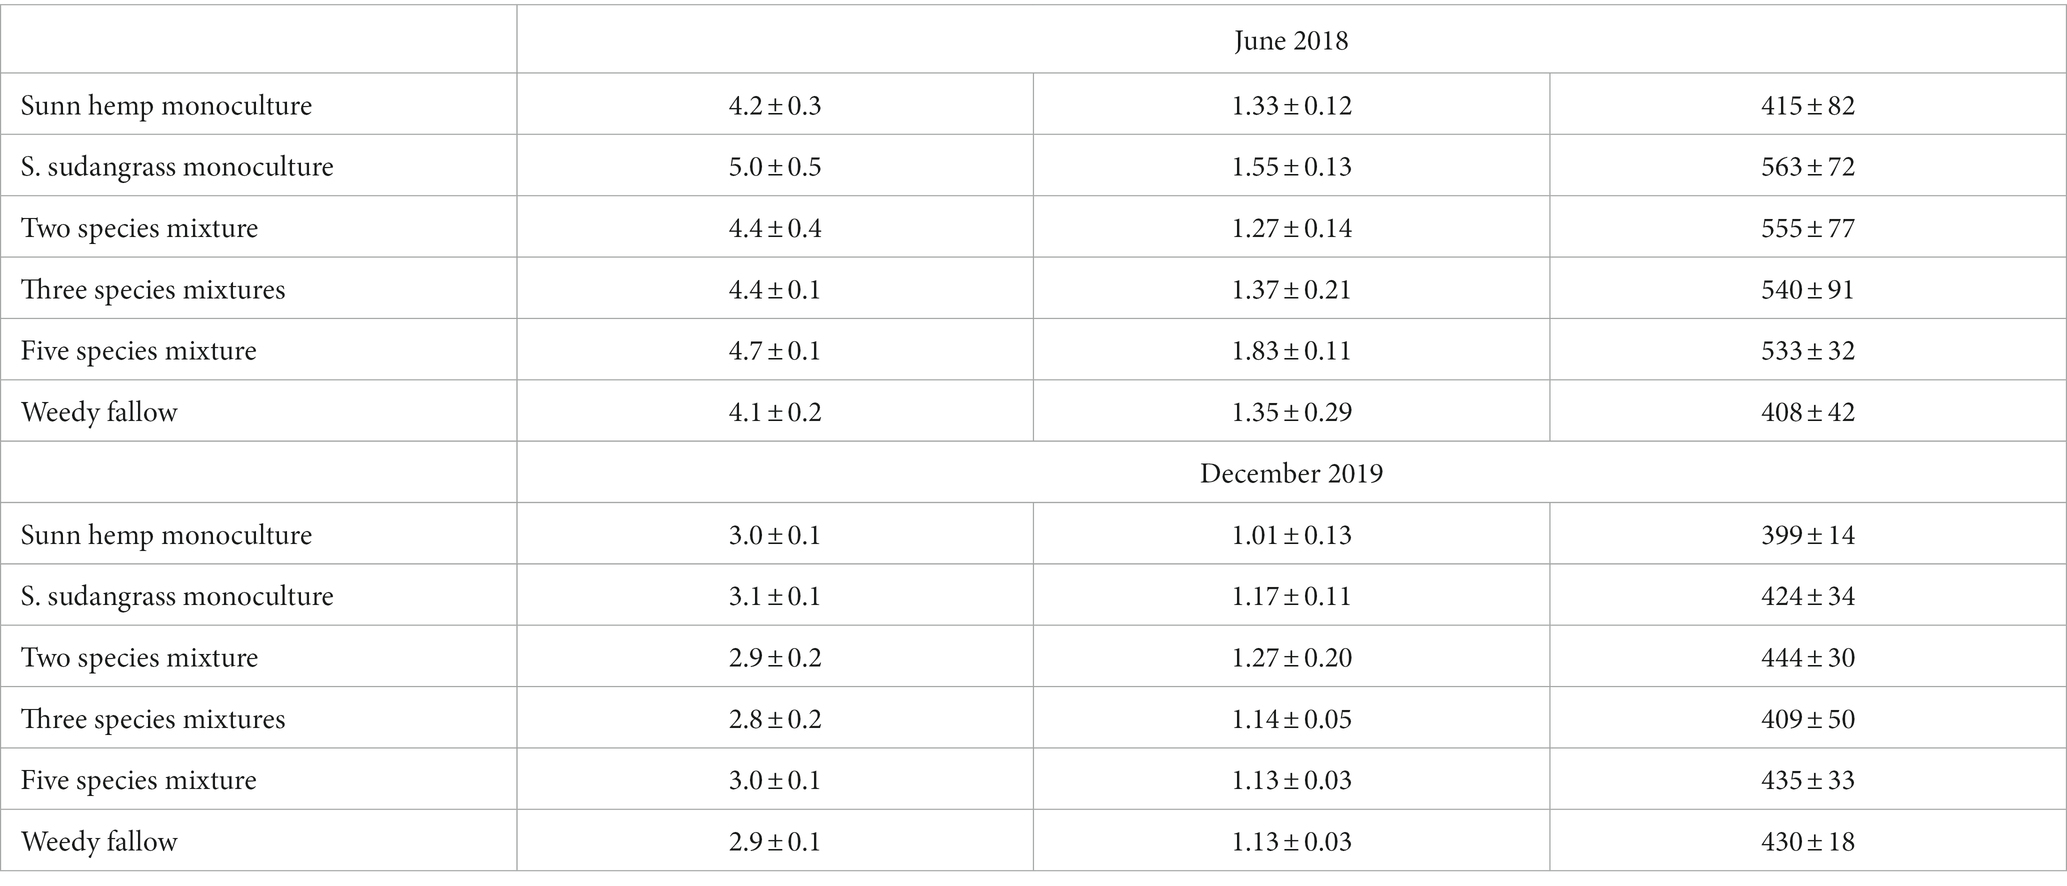
Table 2. Mean (± standard error) soil organic matter (SOM), total soil carbon, and permanganate-oxidizable carbon (POXC) before the experiment started (June 2018) and after the final harvest (December 2019).
3.5. Evaluation of overall effects
Cover crop treatments affected flower production and pollinator activity, where only the treatments with buckwheat (three species and five species mixtures) had flowers and pollinator visits (Table 3). The three species mixture had a greater flower density (14.7 flowers m−2) than the five species mixture (3.8 flowers m−2). Visits from flies were marginally greater (p = 0.07) in the five species mixture (3.8 visits plot−1) relative to the three species mixture (2.5 visits plot−1). There were higher values in July relative to August for flower density (11.9 flowers m−2 vs. 6.6 flowers m−2) and visits from butterflies (5.5 visits plot−1 vs. 0.2 visits plot−1), flies (4.5 visits plot−1 vs. 1.8 visits plot−1) and total pollinators (18.0 visits plot−1 vs. 7.8 visits plot−1). There was no significant treatment x time interaction for any response variable.
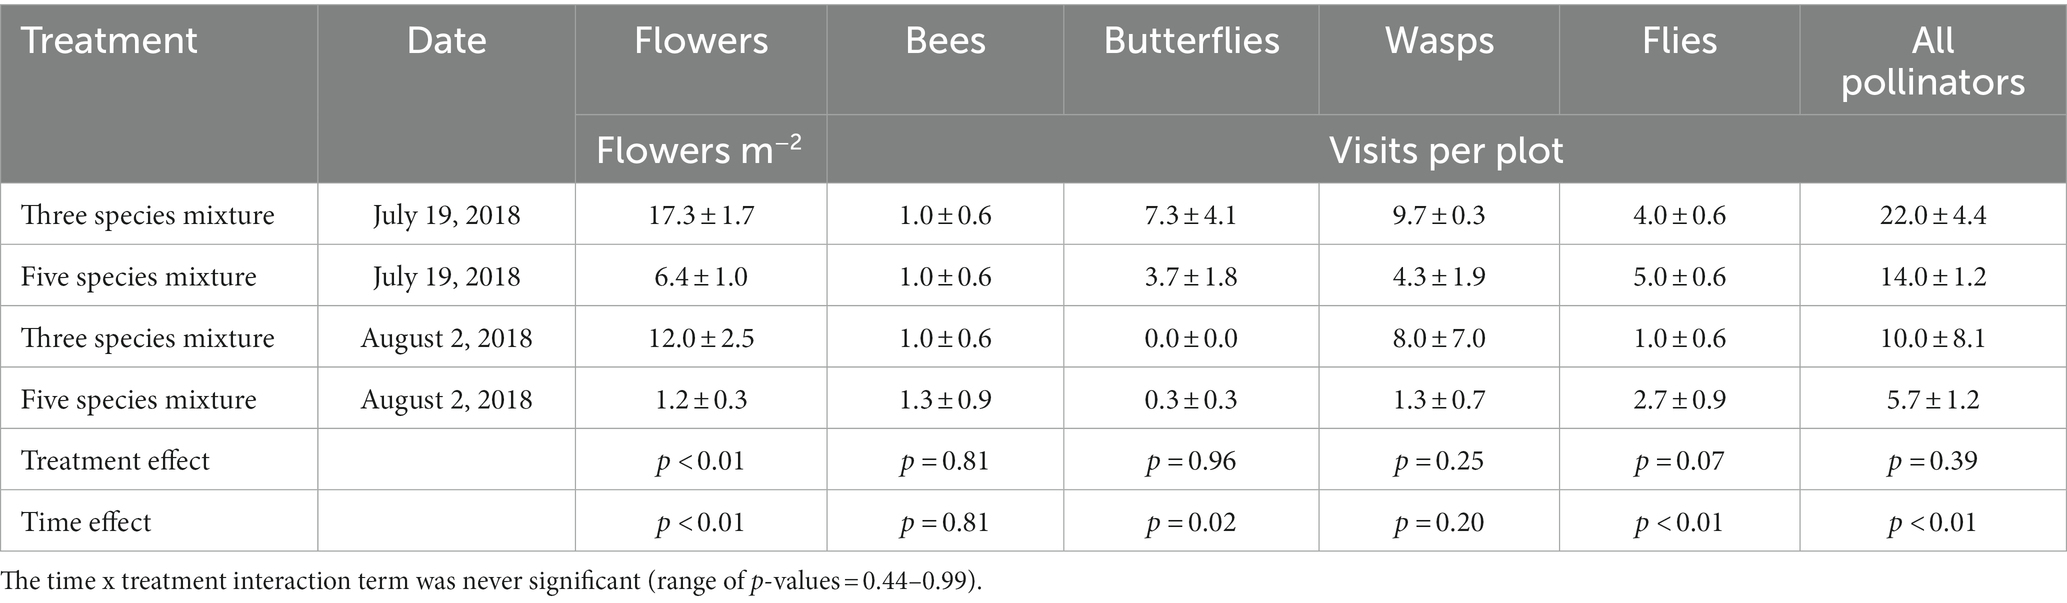
Table 3. Mean (± standard error) of buckwheat flower density and pollinator visits during buckwheat flowering in 2018.
The radar plot analysis highlights that legume-containing cover crop treatments increased soil N after cover crop termination [detailed soil N data can be found in Allar and Maltais-Landry (2022)] in addition to increasing cover crop C and K accumulation relative to sorghum sudangrass and weedy fallow (Figure 4). All cover crop treatments increased cover crop P accumulation and reduced summer weed and root-knot nematode pressure relative to the weedy fallow. The mixtures containing buckwheat were the only ones that benefitted pollinators, whereas the 3-species mixture and the sorghum sudangrass treatments increased sting nematode pressure. Overall, there was a limited effect of cover crop treatments on yields.
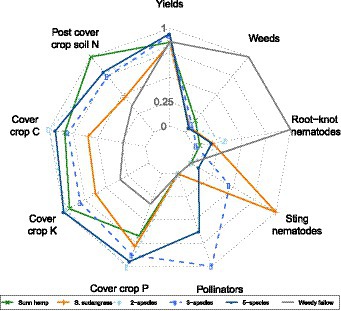
Figure 4. Radar plot representing key variables affected by cover crop treatments. Each variable is scaled to the maximum observed in the study.
4. Discussion
Similar to previous studies focusing on yields of horticultural crops in Florida – e.g., sweet corn (Cherr et al., 2006b) or strawberry (Li et al., 2021) – we found relatively limited effects of cover crop treatments on pepper yields. Marketable yields were highest for the most diverse cover crop mixture (five species) for the whole season sum in 2018, with no significant effect for other harvest dates, total yield, and the ratio of marketable to total yield. Overall, there was small separation of different cover crop mixtures on the radar chart, suggesting that results from 2018 on the effects of these cover crop mixtures on organic vegetable marketable yields must be interpreted cautiously.
Cover crops accumulated important quantities of P and K in their aboveground biomass, with differences among treatments being driven less by nutrient concentrations than biomass production. This is consistent with Allar and Maltais-Landry (2022) who observed similar patterns for N concentrations and N uptake in the same system, and Maltais-Landry et al. (2014) for P concentrations and P uptake in different cover crop mixtures of grasses, legumes, and/or mustards. Phosphorus (up to 24 kg P ha−1) and potassium (up to 140 kg K ha−1) accumulation in these systems were large, and several fold larger than values reported for P in winter cover crops of California and British Columbia (Maltais-Landry et al., 2014, 2019) and K in spring cover crops in Brazil (Rosolem and Calonego, 2013). Given this nutrient accumulation in biomass, which was of a magnitude comparable to fertilizer or amendment inputs, substantial effects on soil availability and/or subsequent cash crop uptake could be expected for both P (Damon et al., 2014) and K (Gao et al., 2022).
However, cover crop treatments did not affect soil P or K in this study, which could be due to low nutrient accumulation in cover crops relative to soil background concentrations. This would be consistent with the small short-term effects reported by Rosolem and Calonego (2013) for soil P, although the effects of cover crops on soil P may not be detectable even in longer-term studies (Maltais-Landry et al., 2015). Although the transient effect of lower resin P concentrations observed after summer cover cropping could be due to crop uptake by cover crops, this was observed in weedy fallow plots as well, suggesting that another factor was driving these temporal differences (e.g., tillage before cash crop planting). In contrast to P, important changes in soil K were previously reported in cover-cropped treatments relative to fallows (Gao et al., 2022), which was attributed to deep K uptake by cover crops in some studies (Rosolem and Calonego, 2013), an effect that may not be possible in the very coarse-textured soils of Florida. Given that there were no inputs of K or liming in this study, the decrease in K availability we observed between the beginning and end of the experiment was expected, as K export in harvested vegetables, despite being a small quantity of K, will slowly deplete soil K reserves while the trend of decreasing soil pH will reduce cation-exchange capacity and K availability.
As cover crops did not affect soil P and K availability, it was expected that P and K accumulation in pepper would not differ among cover crop treatments, similar to what was observed for N in the same system (Allar and Maltais-Landry, 2022). As the P concentration and accumulation in cover crop residues were above levels where a contribution of residue P to soil labile pools and subsequent cash crops is expected, i.e., 0.3% P and 14 kg P ha−1 according to the review of Damon et al. (2014), it is likely that P was not limiting to cash crop production, consistent with soil testing. Similarly, given the lack of K input recommendation based on soil testing results, K was most likely not limiting in this study, which can explain why cover crops did not affect cash crop K accumulation or yield, unlike what was reported by Gao et al. (2022), where a wheat cover crop increased subsequent cucumber yield and K concentrations in China.
Cover crop C accumulation was up to five-fold greater than in the weedy fallow, but we found no evidence of an increase in SOC or SOM with summer cover cropping. Cover cropping can increase SOC, but the effects of cover crops on SOC depend on several factors, including initial soil C and time since cover cropping started (Blanco-Canqui et al., 2015). The range of potential outcomes reported is large, spanning from SOC depletion to large SOC accumulation, with larger variability reported in the early years of cover cropping and in tropical climates (Poeplau and Don, 2015). Given the specific conditions of this study (coarse-textured soil, subtropical climate, recent conversion to cropland, frequent tillage and soil disturbance), it is likely that the effects of cover crops were too small to be detected after less than 2 years of cover cropping. Johnson et al. (2021) reported increases of 1.3–1.7 g SOC kg−1 with three out of seven winter cover crops (i.e., increases observed with crimson clover, and mixtures of rye with clover or radish) at only one of two sites in the Southeastern US after 2 years, and they attributed the lack of response to cover cropping in their other site to its coarser texture and warmer climate. Johnson et al. (2021) found similar results for POXC, with no effect of cover cropping in their warmer and coarser-textured soil, consistent with the lack of cover crop effect we observed for POXC in this study. Overall, cover crops did not increase soil C in this system despite their potential to do so based on large C accumulation in aboveground biomass, which could be driven by local soil properties, land-use history (i.e., recent cultivation of a previously uncultivated grassland), climate conditions, and/or short study duration.
Cover crops affected biogeochemical cycling primarily through biomass production, and their ability to suppress summer weeds [see detailed data in Allar and Maltais-Landry (2022)] was also a function of biomass production, consistent with Finney et al. (2016) who found that weed suppression and N accumulation in cover crops increased with higher cover crop biomass. In contrast, the effects of cover crop treatments on pollinators were entirely driven by the presence of buckwheat in the mixtures, which accounted for less than 1.5% of total biomass at termination (Allar and Maltais-Landry, 2022). Thus, buckwheat played a unique role in this study as the only cover crop to provide floral resources for pollinators (flowering occurred in both 2018 and 2019, although pollinators were only quantified in 2018). This is the result of management used in this study, where other cover crops were terminated prior to flowering to maximize potential nutrient cycling benefits and avoid weed issues in future seasons, consistent with typical grower practices in the area. In this study, buckwheat attracted a diversity of insects including sweat bees, other bees, butterflies, wasps, and flies, consistent with other studies in Florida that found a large diversity of insects foraging from buckwheat flowers (Campbell et al., 2016). While buckwheat only flowered for a brief period of time, this timing aligns with a dearth of wildflowers in Florida’s hot, humid, summer weather (Weaver et al., 2022). Buckwheat can thus fill an important resource gap for wild and managed pollinators in this system, where most cover crops are terminated prior to flowering. As buckwheat flower density was generally higher in the three species mixture as compared to the 5-species mixture, pollinator activity was also generally higher in the three species mixture. Ultimately, these results emphasize the importance of maximizing the density of key species such as buckwheat to support beneficial insects, including pollinators.
Because cover crop treatments had a limited impact on yields in this system, including for spring squash (Allar and Maltais-Landry, 2022), using other indicators in an analysis of overall effects can guide the choice of a given cover crop mixture, similar to the multi-indicator approach used by Schipanski et al. (2014) in the Northeast US. Although there was no change in soil C, P and K due to cover crops, the large C, P and K accumulation measured in aboveground biomass for all cover cropped treatments relative to the weedy fallow suggests that potential long-term impacts on soil biogeochemistry could be more important than what is reported in this short-term study. All cover crop treatments reduced summer weeds [see detailed data in Allar and Maltais-Landry (2022)] although impacts on nematodes were contrasted, with more sting nematodes observed with the sorghum monoculture [consistent with Crow et al. (2001)] and the three species mixture. As the three species mixture had the highest flower density and pollinator abundance, there could be a trade-off between reducing sting nematodes and supporting pollinators for this treatment. However, this could potentially be alleviated by adding buckwheat to a mixture that does not contain sorghum sudangrass (e.g., a biculture with sunn hemp, or replacing sorghum sudangrass by another grass like millet), assuming sorghum sudangrass was the cause of greater sting nematodes in the three species mixture. Overall, while the biculture of sunn hemp and sorghum sudangrass showed more benefits than monocultures for several indicators, it’s unclear if more diverse mixtures provided additional benefits beyond pollinator support in this system. Based on the greater marketable yields observed in 2018 with the five species mixture relative to the biculture, it is possible that more diverse cover crop mixtures could benefit yields in organic vegetable systems of Florida. However, the lack of cover crop effects on marketable yields in 2019 indicates that the relationship between cover crop diversity and yield should be further investigated and confirmed in future studies.
5. Conclusion
Cover crops accumulated more C, P and K in their aboveground biomass relative to a weedy fallow control, but they did not affect soil concentrations or pepper nutrient accumulation, indicating modest short-term impacts on biogeochemical cycling. In contrast, all cover crop treatments reduced summer weed biomass and root-knot nematodes, although the sorghum monoculture and the 3-species mixtures increased sting nematodes. Mixtures containing buckwheat benefitted pollinators, highlighting the impact of buckwheat on pollinators despite its low biomass production, and they increased marketable yields for one out of two seasons, indicating the potential to provide yield benefits relative to monocultures and bicultures. Given the mixed results observed for cover crop treatments on marketable yields in this system, a multi-indicator approach such as the one used in this study can inform the selection of a cover crop by evaluating its overall impacts.
Data availability statement
The raw data supporting the conclusions of this article will be made available by the authors, without undue reservation.
Author contributions
JA and GM-L designed the experiment and wrote the original draft. All authors contributed to sample collection and processing, data validation and analysis, and manuscript revision.
Funding
This work was supported by the UF/IFAS College of Agricultural and Life Sciences Field and Fork Program (assistantship to JA, supplies), the University of Florida’s Department of Soil, Water, and Ecosystem Sciences, and USDA NIFA (Hatch project FLA-SWS-005733).
Acknowledgments
We thank the UF/IFAS College of Agricultural and Life Sciences Field and Fork Program (Anna Prizzia, James Longanecker, Dina Liebowitz, and Claudie Babineaux) for logistical support, including interns and volunteers that helped with field maintenance. Mia Acker, Kayci Anderson, Madelene Clark, Sean Coughlin, Jennifer Cumbie, Adnan Fatehi, Emma Goldberg, Mica James, Dawn Lucas, Kaitlyn Tucker, and Ethan Weinrich assisted with field and lab work. Diane Rowland and Sarah Strauss helped advising and mentoring JA. Julia Barra Netto Ferreira provided guidance on statistical analyses, and three reviewers provided constructive feedback that greatly improved this manuscript.
Conflict of interest
The authors declare that the research was conducted in the absence of any commercial or financial relationships that could be construed as a potential conflict of interest.
Publisher’s note
All claims expressed in this article are solely those of the authors and do not necessarily represent those of their affiliated organizations, or those of the publisher, the editors and the reviewers. Any product that may be evaluated in this article, or claim that may be made by its manufacturer, is not guaranteed or endorsed by the publisher.
Supplementary material
The Supplementary material for this article can be found online at: https://www.frontiersin.org/articles/10.3389/fsufs.2023.1148866/full#supplementary-material
References
Allar, J., and Maltais-Landry, G. (2022). Limited benefits of summer cover crop monocultures and mixtures on nitrogen cycling in organic vegetable production. Nutr. Cycl. Agroecosyst. 122, 119–138. doi: 10.1007/s10705-021-10189-8
Andersen, P. C., Brodbeck, B. V., Bliss, C. M., and McSorley, R. (2016). Influence of crop rotation and years in bahiagrass on plant-parasitic nematode density in an organic vegetable production system. Nematropica 46, 60–70.
Baraibar, B., Hunter, M. C., Schipanski, M. E., Hamilton, A., and Mortensen, D. A. (2017). Weed suppression in cover crop monocultures and mixtures. Weed Sci. 66, 121–133. doi: 10.1017/wsc.2017.59
Barker, K. R., and Koenning, S. R. (1998). Developing sustainable systems for nematode management. Annu. Rev. Phytopathol. 36, 165–205. doi: 10.1146/annurev.phyto.36.1.165
Blanco-Canqui, H., Shaver, T. M., Lindquist, J. L., Shapiro, C. A., Elmore, R. W., Francis, C. A., et al. (2015). Cover crops and ecosystem services: insights from studies in temperate soils. Agron. J. 107, 2449–2474. doi: 10.2134/agronj15.0086
Borrelli, K. (2020) Cover crop mixtures: calculating seeding rates. United States of America: Penn State Extension.
Campbell, J. W., Irvin, A., Irvin, H., Stanley-Stahr, C., and Ellis, J. D. (2016). Insect visitors to flowering buckwheat, Fagopyrum esculentum (Polygonales: Polygonaceae), in North-Central Florida. Florida Entomol. 99, 264–268. doi: 10.1653/024.099.0216
Chauvin, C., Dorel, M., Villenave, C., Roger-Estrade, J., Thuries, L., and Risède, J. M. (2015). Biochemical characteristics of cover crop litter affect the soil food web, organic matter decomposition, and regulation of plant-parasitic nematodes in a banana field soil. Appl. Soil Ecol. 96, 131–140. doi: 10.1016/j.apsoil.2015.07.013
Cherr, C. M., Scholberg, J. M. S., and McSorley, R. (2006a). Green manure approaches to crop production: a synthesis. Agron. J. 98, 302–319. doi: 10.2134/agronj2005.0035
Cherr, C. M., Scholberg, J. M. S., and McSorley, R. (2006b). Green manure as nitrogen source for sweet corn in a warm-temperate environment. Agron. J. 98, 1173–1180. doi: 10.2134/agronj2005.0036
Clark, A. (Ed.) (2012) Managing cover crops profitably. 3rd. College Park, MD: Sustainable Agriculture Research and Education.
Crow, W. T., Weingartner, D. P., Dickson, D. W., and McSorley, R. (2001). Effect of sorghum-sudangrass and velvetbean cover crops on plant-parasitic nematodes associated with potato production in Florida. J. Nematol. 33, 285–288.
Damon, P. M., Bowden, B., Rose, T., and Rengel, Z. (2014). Crop residue contributions to phosphorus pools in agricultural soils: a review. Soil Biol. Biochem. 74, 127–137. doi: 10.1016/j.soilbio.2014.03.003
Eberle, C. A., Thom, M. D., Nemec, K. T., Forcella, F., Lundgren, J. G., Gesch, R. W., et al. (2015). Using pennycress, camelina, and canola cash cover crops to provision pollinators. Ind. Crop. Prod. 75, 20–25. doi: 10.1016/j.indcrop.2015.06.026
Ellis, K. E., and Barbercheck, M. E. (2015). Management of overwintering cover crops influences floral resources and visitation by native bees. Environ. Entomol. 44, 999–1010. doi: 10.1093/ee/nvv086
Ferris, H., Griffiths, B. S., Porazinska, D. L., Powers, T. O., Wang, K. H., and Tenuta, M. (2012). Reflections on plant and soil nematode ecology: past, present and future. J. Nematol. 44, 115–126.
Finney, D. M., White, C. M., and Kaye, J. P. (2016). Biomass production and carbon/nitrogen ratio influence ecosystem services from cover crop mixtures. Agron. J. 108, 39–52. doi: 10.2134/agronj15.0182
Gao, D., An, D., Liu, J., Shi, J., Zhou, X., and Wu, F. (2022). Wheat cover crop alters soil microbial community and increases cucumber yield under different potassium regimes. Eur. J. Agron. 139:126567. doi: 10.1016/j.eja.2022.126567
Guo, L. B., and Gifford, R. M. (2002). Soil carbon stocks and land use change: a meta analysis. Glob. Chang. Biol. 8, 345–360. doi: 10.1046/j.1354-1013.2002.00486.x
Hallama, M., Pekrun, C., Lambers, H., and Kandeler, E. (2019). Hidden miners – the roles of cover crops and soil microorganisms in phosphorus cycling through agroecosystems. Plant Soil 434, 7–45. doi: 10.1007/s11104-018-3810-7
Hurisso, T. T., Culman, S. W., Horwath, W. R., Wade, J., Cass, D., Beniston, J. W., et al. (2016). Comparison of permanganate-oxidizable carbon and mineralizable carbon for assessment of organic matter stabilization and mineralization. Soil Sci. Soc. Am. J. 80, 1352–1364. doi: 10.2136/sssaj2016.04.0106
Jenkins, W. R. (1964). A rapid centrifugal-flotation technique for separating nematodes from soil. Plant Dis. Rep. 48:692.
Jensen, J. L., Schjønning, P., Watts, C. W., Christensen, B. T., Obour, P. B., and Munkholm, L. J. (2020). Soil degradation and recovery – changes in organic matter fractions and structural stability. Geoderma 364:114181. doi: 10.1016/j.geoderma.2020.114181
Johnson, A. M., Gamble, A. V., Balkcom, K. S., and Hull, N. R. (2021). Influence of cover crop mixtures on soil health in southeastern crop production systems. Agrosyst. Geosci. Environ. 4:e20202. doi: 10.1002/agg2.20202
Kibblewhite, M. G., Ritz, K., and Swift, M. J. (2008). Soil health in agricultural systems. Philos. Trans. R. Soc B Biol. Sci. 363, 685–701. doi: 10.1098/rstb.2007.2178
Li, J., Zhao, X., Maltais-Landry, G., and Paudel, B. R. (2021). Dynamics of soil nitrogen availability following Sunn hemp residue incorporation in organic strawberry production systems. Hort Sci. Horts 56, 138–146. doi: 10.21273/HORTSCI15374-20
Linares, J., Scholberg, J., Boote, K., Chase, C. A., Ferguson, J. J., and McSorley, R. (2008). Use of the cover crop weed index to evaluate weed suppression by cover crops in organic citrus orchards. HortScience 43, 27–34. doi: 10.21273/HORTSCI.43.1.27
Liu, G., Simonne, E. H., Morgan, K. T., Hochmuth, G. J., Agehara, S., Mylavarapu, R., et al. (2021). “Chapter 2. Fertilizer management for vegetable production in florida” in Vegetable handbook of Florida, 2021–2022. eds. P. J. Dittmar, S. Agehara, and N. S. Dufault (F/IFAS Extension).
Mallinger, R. E., Franco, J. G., Prischmann-Voldseth, D. A., and Prasifka, J. R. (2019). Annual cover crops for managed and wild bees: optimal plant mixtures depend on pollinator enhancement goals. Agric. Ecosyst. Environ. 273, 107–116. doi: 10.1016/j.agee.2018.12.006
Maltais-Landry, G., and Frossard, E. (2015). Similar phosphorus transfer from cover crop residues and water-soluble mineral fertilizer to soils and a subsequent crop. Plant Soil 393, 193–205. doi: 10.1007/s11104-015-2477-6
Maltais-Landry, G., Nesic, Z., Grant, N., Godinez, M., Thompson, B., Hsu, L. Y., et al. (2019). Quantifying trade-offs among on-farm and off-farm fertility sources to make vegetable organic farming systems more sustainable. Agric. Ecosyst. Environ. 286:106657. doi: 10.1016/j.agee.2019.106657
Maltais-Landry, G., Scow, K., and Brennan, E. (2014). Soil phosphorus mobilization in the rhizosphere of cover crops has little effect on phosphorus cycling in California agricultural soils. Soil Biol. Biochem. 78, 255–262. doi: 10.1016/j.soilbio.2014.08.013
Maltais-Landry, G., Scow, K., Brennan, E., and Vitousek, P. (2015). Long-term effects of compost and cover crops on soil phosphorus in two California agroecosystems. Soil Sci. Soc. Am. J. 79, 688–697. doi: 10.2136/sssaj2014.09.0369
Mehlich, A. (1984). Mehlich 3 soil test extractant. A modification of the mehlich 2 extractant. Commun. Soil Sci. Plant Anal. 15, 1409–1416.
Neher, D. A. (2010). Ecology of plant and free-living nematodes in natural and agricultural soil. Annu. Rev. Phytopathol. 48, 371–394. doi: 10.1146/annurev-phyto-073009-114439
Osipitan, O. A., Dille, J. A., Assefa, Y., and Knezevic, S. Z. (2018). Cover crop for early season weed suppression in crops: systematic review and meta-analysis. Agron. J. 110, 2211–2221. doi: 10.2134/agronj2017.12.0752
Poeplau, C., and Don, A. (2015). Carbon sequestration in agricultural soils via cultivation of cover crops - a meta-analysis. Agric. Ecosyst. Environ. 200, 33–41. doi: 10.1016/j.agee.2014.10.024
R Core Team (2019). R: A language and environment for statistical computing. Vienna, Austria: R Foundation for Statistical Computing.
Ranaldo, M., Carlesi, S., Costanzo, A., and Bàrberi, P. (2019). Functional diversity of cover crop mixtures enhances biomass yield and weed suppression in a Mediterranean agroecosystem. Weed Res. 60, 96–108. doi: 10.1111/wre.12388
Reberg-Horton, S. C., Burton, J. D., Danehower, D. A., Ma, G., Monks, D. W., Murphy, J. P., et al. (2005). Changes over time in the allelochemical content of ten cultivars of Rye (Secale cereale L.). J. Chem. Ecol. 31, 179–193. doi: 10.1007/s10886-005-0983-3
Rosolem, C. A., and Calonego, J. C. (2013). Phosphorus and potassium budget in the soil–plant system in crop rotations under no-till. Soil Tillage Res. 126, 127–133. doi: 10.1016/j.still.2012.08.003
Ruis, S. J., and Blanco-Canqui, H. (2017). Cover crops could offset crop residue removal effects on soil carbon and other properties: a review. Agron. J. 109, 1785–1805. doi: 10.2134/agronj2016.12.0735
Schipanski, M. E., Barbercheck, M., Douglas, M. R., Finney, D. M., Haider, K., Kaye, J. P., et al. (2014). A framework for evaluating ecosystem services provided by cover crops in agroecosystems. Agric. Syst. 125, 12–22. doi: 10.1016/j.agsy.2013.11.004
Tiessen, H., and Moir, J. O. (2017). Characterization of Available P by Sequential Extraction, in M. R. Carter and E. G. Gregorich (eds) Soil Sampling and Methods of Analysis. 2nd edn. Boca Raton: CRC Press, 293–306.
Wang, K. H., McSorley, R., Gallaher, R., and Kokalis-Burelle, N. (2008). Cover crops and organic mulches for nematode, weed and plant health management. Nematology 10, 231–242. doi: 10.1163/156854108783476412
Wang, K., Sipes, B. S., and Schmitt, D. P. (2002). Crotalaria as a cover crop for nematode management: a review. Nematropica 32, 35–57.
Weaver, J. R., Ascher, J. S., and Mallinger, R. E. (2022). Effects of short-term managed honey bee deployment in a native ecosystem on wild bee foraging and plant–pollinator networks. Ins. Con. Div. 15, 634–644. doi: 10.1111/icad.12594
Weil, R. R., Islam, K. R., Stine, M. A., Gruver, J. B., and Samson-Liebig, S. E. (2003). Estimating active carbon for soil quality assessment: A simplified method for laboratory and field use. AJAA. 32, 3–17.
Keywords: phosphorus, potassium, legume, grass, buckwheat
Citation: Allar J, Mallinger R, Liu C, Grabau Z and Maltais-Landry G (2023) Different cover crops have a limited impact on marketable yields and biogeochemical cycling but secondary effects on pollinators and plant-parasitic nematodes in Florida organic vegetable systems. Front. Sustain. Food Syst. 7:1148866. doi: 10.3389/fsufs.2023.1148866
Edited by:
Johann G. Zaller, University of Natural Resources and Life Sciences, AustriaReviewed by:
Sharon Weyers, Agricultural Research Service (USDA), United StatesGabor L. Lovei, Aarhus University, Denmark
Copyright © Allar, Mallinger, Liu, Grabau and Maltais-Landry. This is an open-access article distributed under the terms of the Creative Commons Attribution License (CC BY). The use, distribution or reproduction in other forums is permitted, provided the original author(s) and the copyright owner(s) are credited and that the original publication in this journal is cited, in accordance with accepted academic practice. No use, distribution or reproduction is permitted which does not comply with these terms.
*Correspondence: Gabriel Maltais-Landry, bWFsdGFpc2xhbmRyeWdAdWZsLmVkdQ==