 Hajrial Aswidinnoor1
 Risky Listiyanto1
 Syaifullah Rahim1
 Holidin1
 Heny Setiyowati2Anggi Nindita1Arya Widura Ritonga1
 Siti Marwiyah1
 Willy Bayuardi Suwarno1*
- 1Department of Agronomy and Horticulture, Faculty of Agriculture, IPB University, Bogor, Indonesia
- 2Directorate General of Food Crops, Ministry of Agriculture, Jakarta, Indonesia
Rice is a major world staple food crop, and therefore breeding improved varieties is of ultimate importance. Genotype-by-environment analyses are essential to understand the potential performance of the lines over environments. This study aimed to elucidate the stability, agronomic performance, and grain quality of elite new plant type (NPT) rice lines developed for tropical lowland areas. Elite NPT rice lines were evaluated in eight locations along with national varieties as checks. Combined analysis across environments and several stability analyses were performed. The results revealed the possibility of breeding high-yielding NPT rice varieties with different stability profiles, namely broad adaptation (IPB189-F-13-1-1 (G5), bi = 0.91), suited for favorable environments (IPB187-F-37-1-2 (G1), bi = 1.47), and adapted to marginal environments (IPB193-F-30-2-1 (G9), bi = 0.54). G1 and G5 belonged to different groups of grain characteristics, each with low and high amylose content, respectively. The highest yielding line (IPB189-F-23-2-2 (G6), 8.68 ton ha−1) had an advantage of 19.39% over the highest yielding check, i.e., Inpari 32 (7.27 ton ha−1). This increase in yield was contributed by the success of breeding with a greater 1000-grain weight (11.91%) and number of filled grains per panicle (42.37%) than Inpari 32; meanwhile, the plant height also increased by 19 %. In addition, the rank correlations among three stability parameters, , , and were positive and highly significant. This study enlightens the prospect of breeding NPT rice varieties with different adaptations in tropical lowland areas.
1. Introduction
Rice is a world staple food with an incredible story. It has been a model monocot with the smallest genome of major cereals which is cultivated throughout the world, except Antarctica (International Rice Genome Sequencing Project and Sasaki, 2005; Muthayya et al., 2014). The average world rice productivity reaches about 4.61 tons per hectare (FAO, 2019). This has further declined during the first decade of 21′s century (Powell et al., 2012). In order to meet the challenges of the ever-increasing world population and climate change, rice production must be increased through breeding programs that have major goals to achieve high yielding cultivars.
The total area of rice production is ~167 million hectares, of which 15 dan 25% are irrigated and rainfed lowland fields (Dogara and Jumare, 2014). Hence, these two types of rice fields have a great diversity of environmental conditions. Yield is an example of quantitative traits whose expressions are strongly influenced by environments (Wang et al., 2008; Li et al., 2019). For that reason, multi-environment trials (METs) are needed to identify a superior genotype with stable and high yield potential, and as part of the final stages to release a variety.
Genotype-by-environment interaction (GEI) is inevitable in plant breeding and crop production (Yan, 2016). The presence of GEI refers to the differential response of genotypes among a range of environments (Kang, 1997). Considering GEI through stability analysis models could facilitate the accurate cultivar recommendation for the target environment (Huang et al., 2021). Stability analyses through univariate stability models have been developed by Roemer (1917), Francis and Kannenberg (1978), Finlay and Wilkinson (1963), Eberhart and Russell (1966), Wricke (1962), Shukla (1972), Perkins and Jinks (1968), Tai (1971), Plaisted and Peterson (1959), Plaisted (1960), Lin and Binns (1988).
Rice is a crop suitable for tropical climates. Most of the annual rice production comes from tropical climate areas including India, Bangladesh, and all Southeast Asian countries such as Indonesia. However, the intervention of the green revolution in Asia has changed the status of biotic stresses from low to high. Other constraints on rice production in the tropical environment were drought, flooding, and lack of fertile soil. Meanwhile, the genetic potential of the green revolution rice architecture has become stagnant (Peng and Khush, 2003). It is therefore challenging to increase the production per hectare from the variety standpoint. From the latest research information on rice ideotypes (Dingkhun et al., 1991; Khush, 1995; Peng et al., 2008), the new plant type (NPT) architecture can leverage the trend of increasing production per hectare, pushing the limit of rice yield upwards. The development of new NPT rice varieties with higher yield potential has been conducted by Donald (1968), Rasmusson (1991), Laza et al. (2003), Yan et al. (2007), Uddin et al. (2016), and Tomita and Fukuta (2019). The NPT ideotype has unique agronomic traits such as fewer tiller numbers and heavy panicle architecture.
Consumer preferences for grain quality vary from region to region (Custodio et al., 2019). The ratio of amylose and amylopectin in rice is an important indicator of cooking and consumption quality. In the Philippines and Indonesia, there is a preference for medium amylose grains that are not as hard as in India, but not as sticky as favored in Japan. Grain quality will become more important in the future when the demand for higher quality increases due to the improved economic situation. The objective of this study was to elucidate the stability, agronomic performance, and grain quality of elite NPT rice lines developed for tropical lowland areas. We hypothesized that there is an NPT rice line having a significantly greater yield than the check varieties and stability across diverse environments.
2. Materials and methods
2.1. Genetic materials and experimental sites
The genetic material evaluated were 12 elite NPT rice lines and two national varieties as checks, namely Ciherang and Inpari 32 (Table 1). The elite lines were derived from a modified bulk breeding method conducted in the NPT rice breeding program at IPB University, Bogor, Indonesia. The “Ciherang” and “Inpari 32” varieties have similar characteristics to the IR64 variety (Mackill and Khush, 2018), as they are the progeny of it. These standard checks become a popular variety in Indonesia for their excellent grain quality, i.e., intermediate amylose content. The mature plant height is ~100–115 cm, with a relatively short growth duration of about 116–125 days after sowing. Compared to the NPT rice ideotype proposed by Khush (1995), these checks have greater grain filling dan higher tillering capacity. All genotypes were evaluated in 8 environments in Indonesia in 2020 and 2021 (Table 2 and Figure 1). Experimental design and crop management.
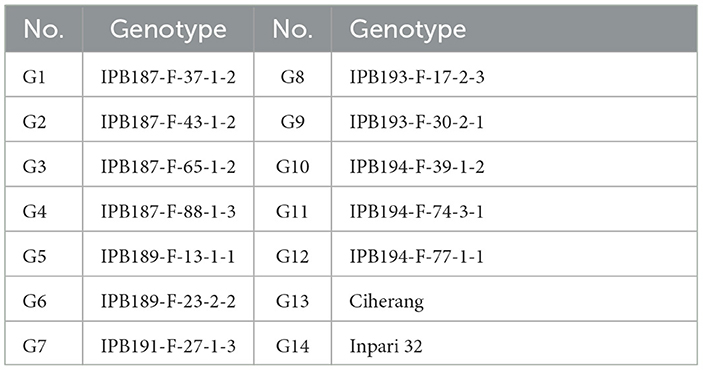
Table 1. Rice genotypes evaluated in the multi-environment trial.
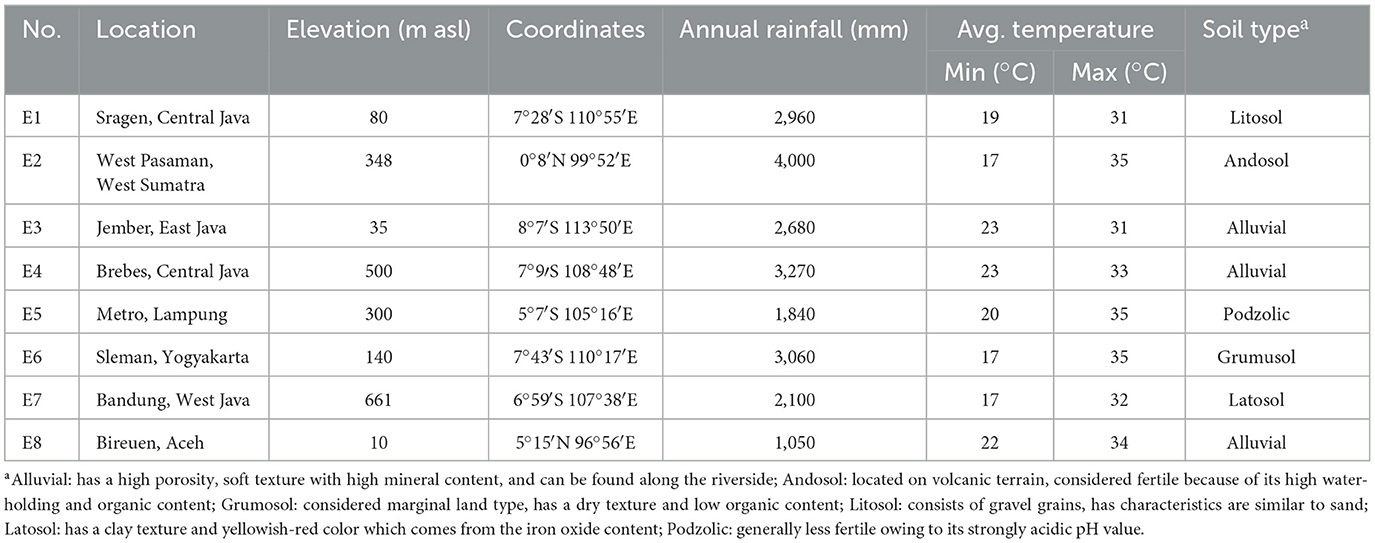
Table 2. Characteristics of 8 environments used for evaluation of rice genotypes.
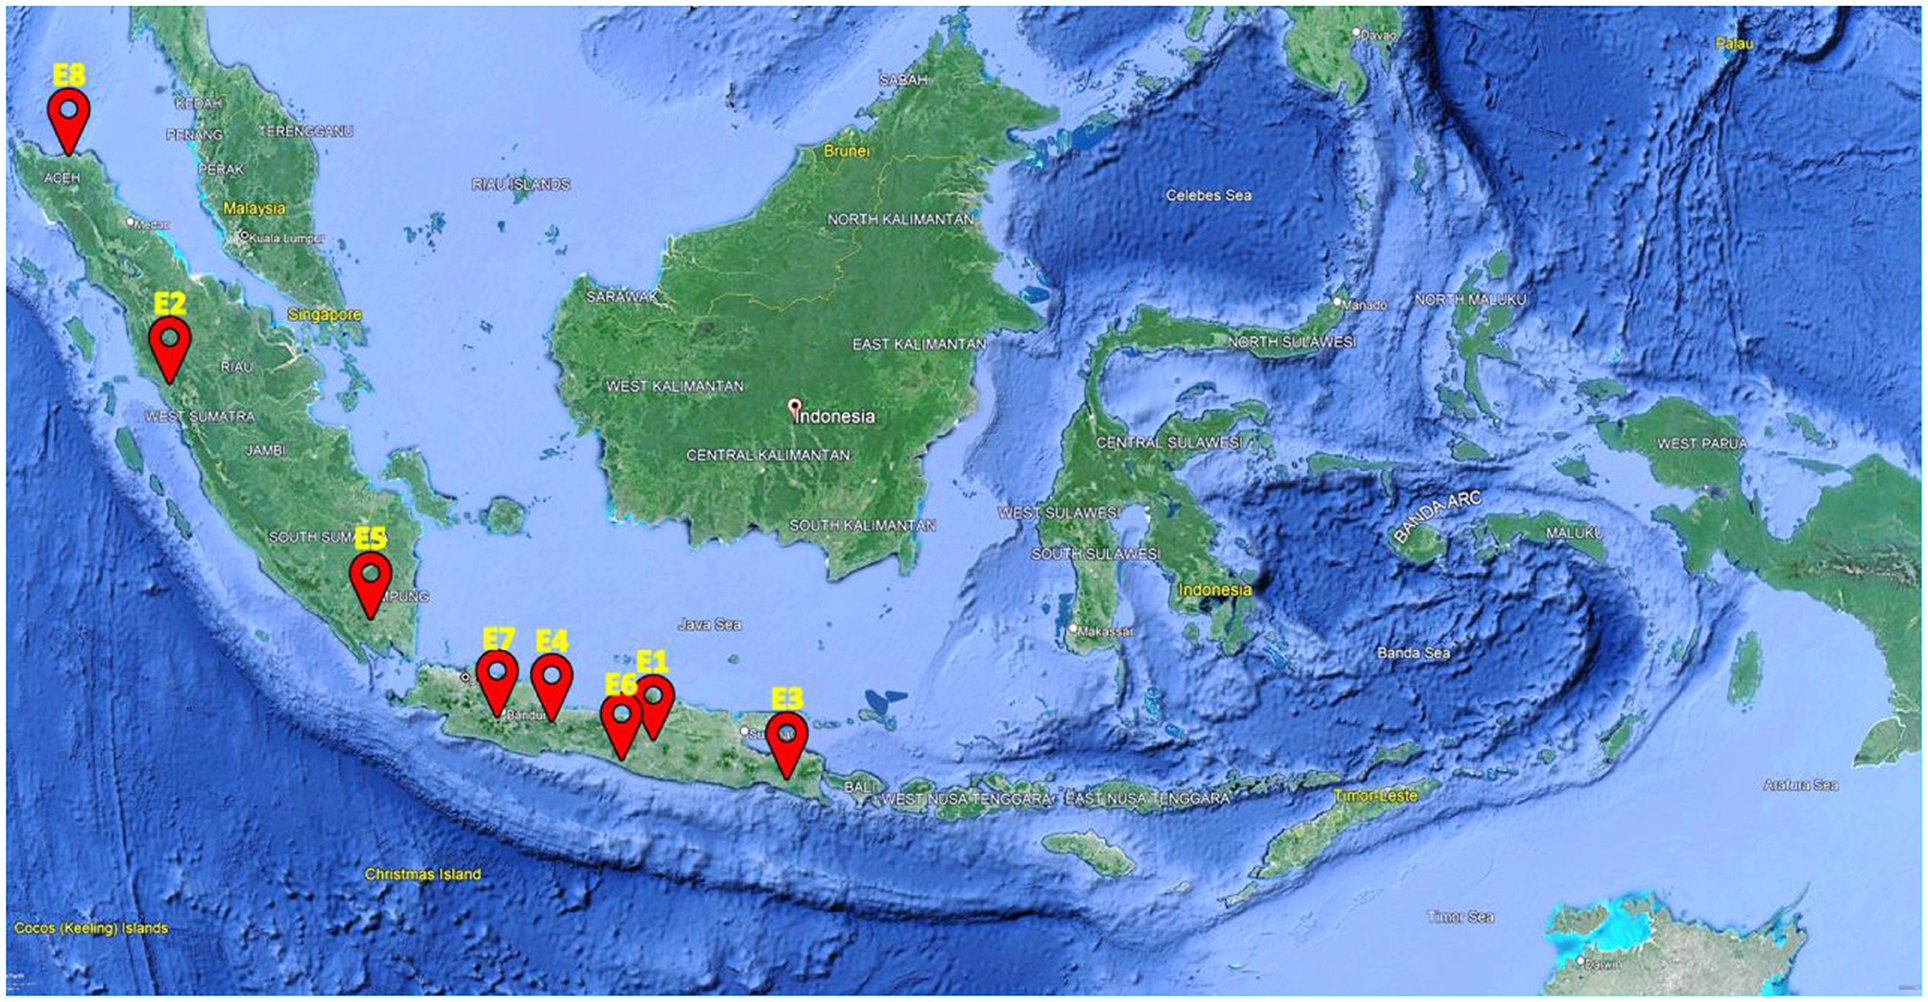
Figure 1. Locations of the multi-environment trial of rice genotypes in Indonesia. See Table 2 for the description of E1–E8.
The field experiment was arranged in a randomized complete block design with three replications in each environment. Seedlings aged 16–18 days were transplanted to a plot of 4 m x 5 m with a plant spacing of 20 cm x 20 cm, with three to four seedlings per hill. Fertilizers of urea (45% N), Phonska (15% N, 10% P2O5, 12% K, 10% S), and KCl (60% K2O) were applied. Dosages of 60 kg ha−1 N, 30 kg ha−1 K, 10.9 kg ha−1 P and 25 kg ha−1 S were applied at transplanting, 82.5 kg ha−1 N, 12 kg ha−1 K, 4.4 kg ha−1 P at 3 weeks after planting (WAP), and 24.9 kg ha−1 K at 7 WAP. Pests, diseases, and weeds were carefully managed, and optimum water management was performed.
2.2. Phenotypic observations
Agronomic traits observed were plant height (PH), number of productive tillers (NPT), days to harvest (DTH), number of filled grains per panicle (NFG), percentages of unfilled grains (PUG), and thousand grains weight (TGW). These traits were measured from five randomly selected plants in each plot. PH was measured from the soil surface to the tip of the tallest panicle. NPT was counted as the number of tillers that produce panicles. DTH was recorded as the number of days when 95% of plants in each plot were ready for harvest. NFG was calculated as the sum of filled grains per panicle. PUG was calculated by dividing the number of unfilled grains by the total number of grains, and multiplying by 100%. TGW was measured as the weight of 1,000 filled grains at 14% moisture content. Grain yield per plot was measured by weighing harvested grain from each plot excluding border rows and then converted to ton ha−1 at 14% moisture content.
Grain quality analysis was carried out in the quality laboratory at Indonesian Center for Rice Research (ICRR), Subang, Indonesia. The analysis and classification mainly followed the IRRI standard evaluation systems (IRRI, 2013). Head rice is a rice grain that is 60–100% intact in length. The head rice percentage was calculated on 100 g of polished milled rice, using the following equation: Head rice (%) = (Weight of head rice/Weight of milled rice) x 100%. Analysis of amylose content was carried out using the standard colorimetric iodide method (Juliano, 1971). Based on amylose content, rice texture could be classified as waxy (0–2%), very low (3–9%), low (10–19%), intermediate (20–25%) and high (>25%) (Dela-Cruz and Khush, 2000). Ten milled grains of each genotype were taken for measuring the length and shape traits. Length was measured using a dial caliper, and could be classified as: very long (> 7.50 mm), long (6.61–7.50 mm), medium (5.51–6.60 mm), and short (< 5.51 mm) (IBPGR-IRRI Rice Advisory Committee, 1980). Grain shape is determined by the length:width ratio of the grain. A ratio > 3.0 was classified as slender, 2.1–3.0 medium, and 1.0–2.0 bold. Grain chalkiness was calculated as the average percentage of the amount of chalkiness on rice grain in each genotype, and could be classified as: > 20% large, 11–20% medium, < 10% small, 0% clear.
2.3. Statistical analyses
The combined analysis of variance over environments was conducted to elucidate the main effects of the genotype, environment, and genotype by environment interaction. The genotype was considered a fixed effect and the environment was random. The linear model is as follows:
where i is the genotype (i = 1,2,3,…,14), j is the environment (j = 1,2,...,8), k is the block (k = 1,2,3); Yijk is the observed response value; μ is the grand mean; Gi is the effect of genotype; Ej is the effect of environment; (GE)ij is the interaction effect of genotype and environment; Bk/j is the effect of block nested in environment; Eijk is the experimental error.
The LSD test at the.05 level was performed to compare the means of test genotypes with the check varieties. A principal coordinate analysis (PCoA) was conducted for grouping the genotypes based on grain characteristics. The modified Gower dissimilarity coefficients were calculated, and then the PCoA biplot was drawn based on the dissimilarity matrix. Furthermore, an independent t-test between PCoA groups was conducted to reveal the distinguishing traits. The analysis of variance, LSD, and t-tests were conducted using SAS On-Demand for Academics (welcome.oda.sas.com). Stability analyses and Spearman rank correlations among stability parameters were performed using PBSTAT-GE 3.0.3, and the PCoA was carried out using PBSTAT-CL 2.1.1 (www.pbstat.com).
3. Results
3.1. Yield and stability
The mean grain yield of genotypes ranged from 6.75 ton ha−1 (G11) to 8.68 ton ha−1 (G6) across diverse environments. Six NPT rice lines, namely G1, G3, G5, G6, G8, and G9 had a higher yield (Yi) and yield-stability index (YSi) than the two widely grown lowland rice varieties in Indonesia, Ciherang and Inpari 32 (Table 3). Among these lines, G3, G5, and G8 had a regression coefficient (bi) not significantly different from one, indicating that these lines had average stability. G1 and G6, on the other hand, may be adapted to a high-yielding environment as their bi (1.47 and 1.22) were significantly greater than one. Conversely, G9 had a bi significantly lower than one (0.54), indicating that this genotype may be adapted in a marginal environment. This genotype also had a small coefficient of variation (13.58%), indicating the possession of static stability (Table 3).
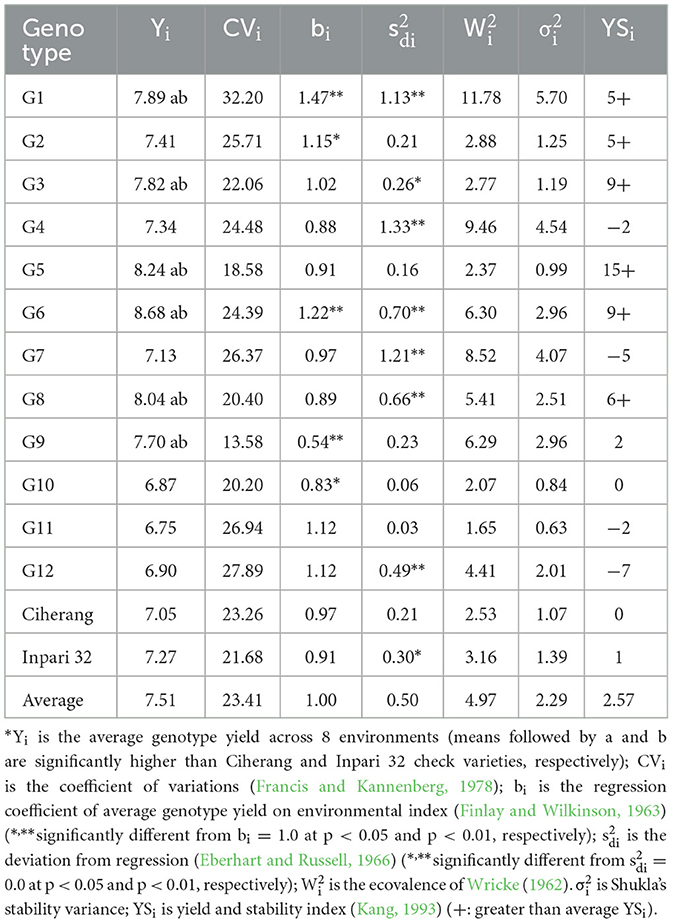
Table 3. Average yield and stability parameters of 14 rice genotypes evaluated in 8 environments.
The genotype rank correlations among average yield and stability parameters are shown in Table 4. The average yield had a positive and highly significant correlation with the yield-stability index, YSi (r = 0.86, p < 0.01). This is understandable because the yield rank is one of the two main components in building the YSi. Additionally, Wricke's ecovalence and Shukla's stability variance had a rank correlation of 1.00 (p < 0.01). Both and were significantly correlated with Eberhart-Russell's squared deviation from regression . These results indicated that one parameter could be an alternative to the other for the case of stability analysis in a multilocation trial with a similar setting to the present study.
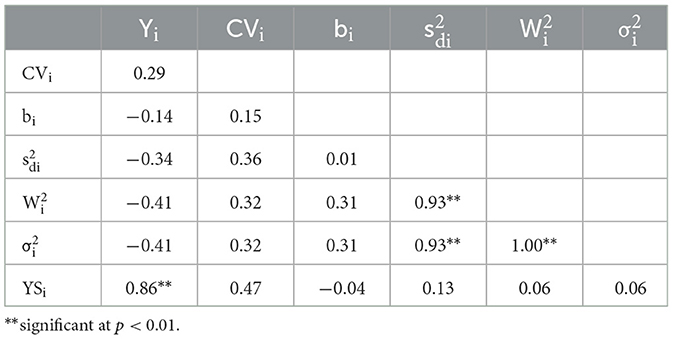
Table 4. Spearman's rank correlations among stability parameters of 14 genotypes evaluated in 8 environments.
From the genotype and genotype by environment (GGE) analysis, the first two principal component axes (PC1 and PC2) explained 68.3% of the total G+GE variances in yield (Figure 2). This indicates some complexity in the GE interaction, but still, a considerable amount of variance could be captured and visualized by a two-dimensional biplot. The biplot is divided into nine sectors, but only two sectors have at least one environment in them. A sector with environments within may be considered a ‘mega-environment’, and a genotype located in the vertex is the best genotype for such a mega-environment. Figure 2 indicated that genotypes G5 and G6 were well adapted to their respective groups of environments. Additionally, E7 and E8 had a more ability to discriminate the genotypes compared to the others, as they were located farther away from the center of the biplot.
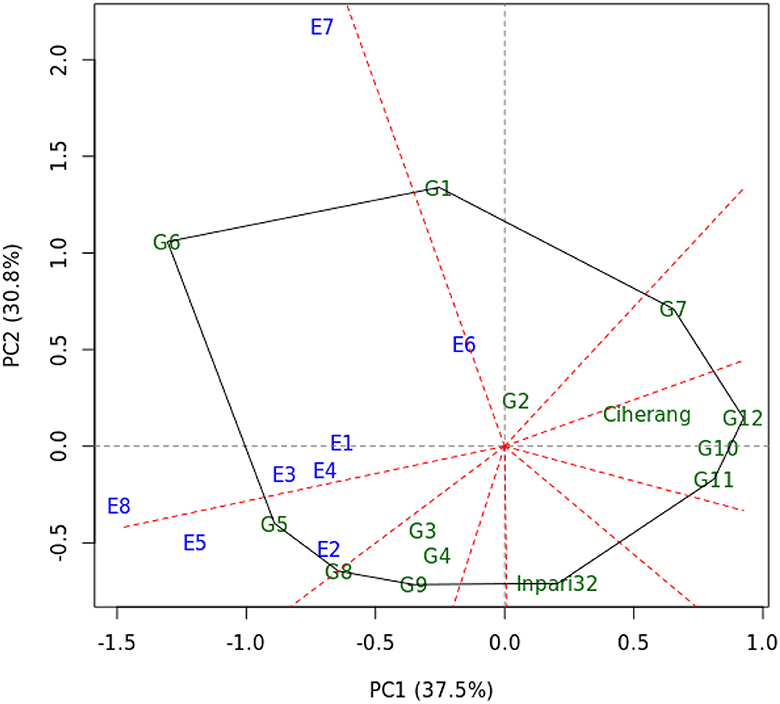
Figure 2. The “which-won-where” view of GGE biplot based on yield of 14 rice genotypes evaluated in 8 environments. The genotypes were labeled as G1–G14 and the environments were labeled as E1–E8.
3.2. Growth and yield components
The average agronomic traits and yield components of each genotype across eight environments are shown in Table 5. Large phenotypic variations were recorded for all traits, except the number of productive tillers (NPT) and days to harvest (DTH). Plant height (PH) ranged from 100 cm to 121 cm, and number of filled grains (NFG) varied from 118 to 190 (Figure 3A). All NPT lines (G1–G12) had significantly higher NFG than Ciherang and Inpari 32 varieties, even though their percentage of unfilled grain (PUG) is generally also higher. Regarding the plant architecture, the NPT lines had a significantly higher PH and lower number of productive tillers than both checks. Moreover, all NPT lines except G10 seemed to have a similar or larger grain size than both checks as indicated by their weight of 1,000 grains (TGW) (Figure 3B).
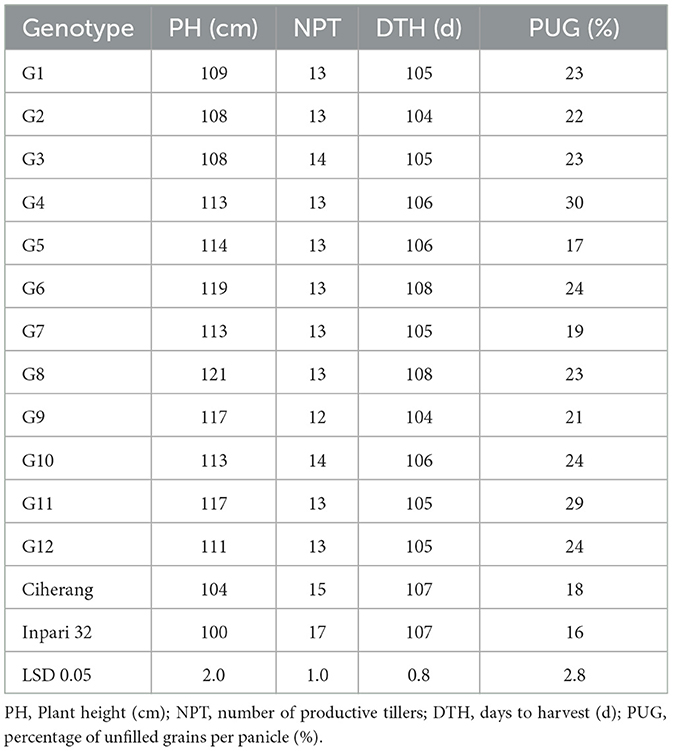
Table 5. Means of agronomic traits of rice genotypes across 8 environments.
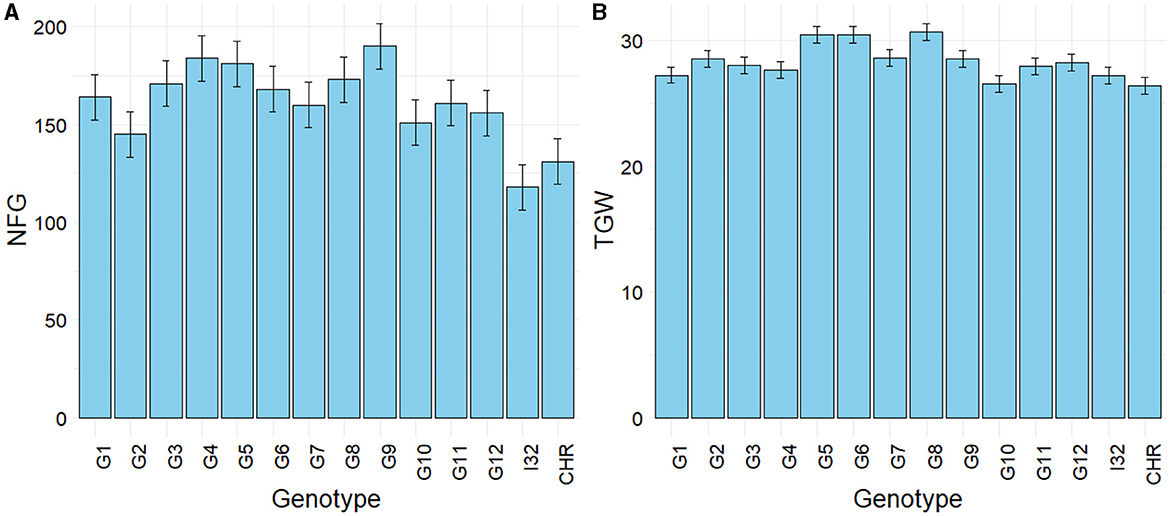
Figure 3. Mean of number of filled grains per panicle (A) and thousand-grains weight (B) of 12 elite NPT rice lines and two checks across 8 environments. I32, Inpari 32; CHR, Ciherang. Error bars are ± LSD 0.05.
3.3. Grain quality
There are six traits of grain quality used in this present study. The length, shape, and percentage of head rice and chalky grain were classified as physical properties. The chemical properties used were amylose content and texture. The results showed that grain length ranged from 6.29 mm to 7.57 mm. All genotypes were classified as long grain, except G8 was identified as extra long grain. The percentage of head rice ranged from 64.7 to 96.3% and the percentage of chalky rice ranged from 0.04% to 1.01%. Amylose content varied from 11.6 to 23.5%. A lower amylose content will make the texture of the rice fluffier, and nine lines had a fluffy texture. Details are presented in Table 6.

Table 6. Characteristics of the grain and cooked rice of rice genotypes.
The principal coordinate biplot revealed two groups based on the first axis, which were annotated with green and orange colors (Figure 4). The orange group consisted of G5, G7, G9, Ciherang, and Inpari 32, whereas the green group consisted of the other genotypes. The main differentiating traits among those groups were amylose content and texture, which were related to each other. The green group had a highly significantly lower average amylose content (12.8%) than the orange group (22.1%) (p < 0.01) which lead to a different texture, fluffy vs. medium. Additionally, the percentage of head rice also tended to be different among the green group (88.5%) and the orange group (77.8%) (p = 0.11). Two high-yielding genotypes, G5 and G9, had similar grain characteristics to the Ciherang variety which has been widely favored for its grain quality.
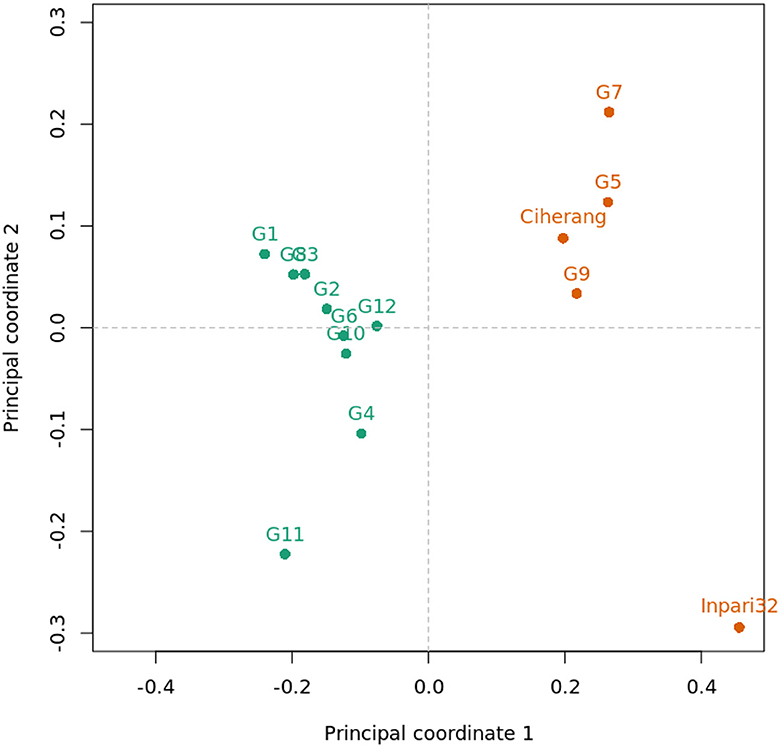
Figure 4. Principal coordinate analysis (PCoA) biplot of 14 rice genotypes based on grain quality traits.
4. Discussion
In the present study, a total of 14 genotypes were evaluated across eight locations in the tropical lowland ecosystem. Even though these locations belong to the same ecosystem, the environmental conditions, including elevation, annual rainfall, temperature, and soil type varied substantially among the locations (Table 2). Hence, these conditions allow for studying the adaptations of different genotypes across the test environments.
The NPT rice ideotype approach has been used in a rice breeding program at IPB University for over the last 20 years. Nine varieties having the NPT rice architecture have been released from this program. One of these varieties that has been cultivated relatively widely, IPB 3S, has an average of 7–11 tillers per hill, ± 118 cm plant height, 220 grains per panicle, and 11.2 ton ha−1 yield potential. Most of these characteristics meet the initial NPT rice ideotype described by Peng et al. (1994) and Khush (1995), i.e., the plants have 8–10 tillers, 90–100 cm plant height, 200–250 grains per panicle, 100–130 days to harvest, and 11–13 ton ha−1 yield potential. The features of all elite rice lines in this study represented the ideotype of improved new plant type (NPT) rice. These NPT ideotype had a greater average number of productive tillers than the previously released NPT varieties. Productive tillers which formed on the unelongated basal internode are essential to yield components because the grain yield is mostly determined by the number of panicles per unit area (Yan et al., 1998; Li et al., 2003).
Plant height is an important growth trait since it alters yield contributing traits. The average plant height of 12 NPT rice lines was 114 cm, indicating that the plant statures of those genotypes are taller than Ciherang (104 cm) and Inpari 32 (100 cm) check varieties (Table 5). This slightly tall stature may contribute to higher yield, however, very tall plant stature with insufficient strength is not desirable because it is prone to lodging (Corbin et al., 2016). Even if lodging is closely related to many external factors, increasing the culm diameter and shortening the internode could be a promising approach.
Grain filling is influenced by genetics, through a physiological mechanism called auxin apical dominance (Parida et al., 2022). High apical dominance can limit rice yield potential through poorer grain filling, especially among new plant type rice (Chang et al., 2020). On the other hand, environmental factors also play a role in grain filling. A high percentage of unfilled grain could be associated with low light capture and high moisture status (Zhu et al., 2007). A higher net photosynthesis per unit thermal time will result in higher yield potential, through the increase of sink capacity (Jing et al., 2010).
The stability of a genotype can be studied through parametric and non-parametric approaches. There are two concepts of stability in the parametric approach, namely biological stability and agronomic stability (Becker and Leon, 1988). A genotype was assumed to be biologically stable when the coefficient of variation is small (Francis and Kannenberg, 1978). Simultaneous consideration of both biological stability and average yield is needed because a biologically stable genotype does not necessarily have a high yield. In the present study, G9 seemed to have biological stability (CV = 13.58%) and a higher yield than the two check varieties.
Analysis models in agronomic stability were divided into two types depending on the definition of stable genotypes (Lin et al., 1986). A genotype is considered to have average stability when the regression coefficient (bi) is equal to one (Finlay and Wilkinson, 1963). Based on this criteria, G3, G4, G5, G7, G8, G11, and G12 were classified as stable genotypes. However, according to Eberhart and Russell (1966), a stable genotype is a genotype that not only has the values of bi = 1 but also the squared deviations from regression () equal to zero. Therefore, only G5 and G11 meet these criteria. Considering their mean yield, it seemed that G5 was widely adapted to all environments, whereas G11 was the opposite.
Wricke (1962) suggested the ecovalence parameter as a measure of stability. Ecovalence measures the contribution of genotype to the sum of squares of genotype by environment interaction (GEI). Genotypes with the lowest ecovalence were considered stable, contributing the least to GEI variance. Shukla (1972) modified the ecovalence in order to give an unbiased estimation of GEI variance for each genotype through stability variance (). A significant indicates that a genotype's performance was unstable. Conversely, genotypes with small stability variance were considered stable. Moreover, Kang (1993) uses the yield-stability index (YSi) method based on the average yield and stability variance (). Finally, there are seven NPT rice lines had a YSi greater than both check varieties (Table 3), indicating the potential of NPT ideotype for increasing yield without neglecting stability.
Genotype and GEI are important in determining the best-performing genotypes in different environments (Yan et al., 2000). Correspondingly, these factors were graphically shown through a GGE biplot (Figure 2). The markers of the farthest genotypes from the biplot origin served as corners of the polygon. The polygon was divided into nine sectors by perpendicular-broken lines, namely equality lines. Genotypes located at the vertex of the polygon were identified as the winning or poorest genotypes (Yan, 2002; Yan and Tinker, 2006; Yang et al., 2007). G6 was the winning genotype in a mega-environment that consisted of E1, E3, E4, E6, E7, and E8, while G5 performed best in a mega-environment that consisted of E2 and E5. Interestingly, G5 was located closely at the boundary of two mega-environments, indicating that it has stable performance across environments. G2 located closely at the biplot origin would rank the same in all environments since it was not responsive to the environments.
The grain quality is determined by physical and chemical properties which are highly influenced by genetics, aside from environmental factors (Fitzgerald et al., 2009; Han et al., 2021). Grain size is a key breeding target as it influences yield and quality (Wang et al., 2012). The grain length-width ratio fundamentally determines the grain shape. According to Juliano (1985), grain shape is classified as bold, medium, and slender. Most genotypes had the grain shape slender which is the preferred shape by consumers from Southeast Asian countries, such as Indonesia, Thailand, and the Philippines (Hairmansis et al., 2013; Diaz et al., 2014; Velasco et al., 2015).
Chalky is an opaque area in the grains, resulting in a lower eating quality (Chun et al., 2009). All genotypes have a percentage of chalky grain below 2%. It is interesting because the chalky grain proportion that is higher than 2% is not accepted in markets (Lisle et al., 2000). The amylose content of rice grain is directly related to the preference of consumers, as it determines the texture of cooked rice. The texture of rice is influenced by several factors, but amylose content has the most one (Yu et al., 2009). Amylose is hydrophobic due to its straight molecular shape. This indicated that genotypes with low amylose content had higher water uptake (Choi et al., 1999; Shivani et al., 2007). As a result, the lower amylose content makes the texture fluffier, as it easier to leach out during cooking time. In the present study, we are able to identify 3 genotypes with a medium texture. Such grain texture has been widely accepted by consumers in South and Southeast Asia (Mackill and Khush, 2018). In countries where rice is widely consumed, grain quality has a central role in the adoption of new varieties (Nirmaladevi et al., 2015).
5. Conclusion
We revealed the possibility of breeding a high-yielding new plant type (NPT) rice variety with agronomical stability and good grain quality. Genotypes IPB189-F-13-1-1 (G5), IPB187-F-37-1-2 (G1), and IPB193-F-30-2-1 (G9) had a higher yield (Yi) and yield-stability index (YSi) than the two check varieties but with different stability profiles. G5 had an average stability (bi = 0.91), whereas G1 might be suited for favorable environments (bi = 1.47), and G9 could be adapted to marginal environments (bi = 0.54). In terms of grain characteristics, G1 and G5 belonged to different groups, each with low and high amylose content, respectively. These three genotypes may therefore be used as genetic materials for NPT rice breeding programs. In addition, we confirmed that the rank correlations among three stability parameters, , and were positive and highly significant, and therefore one may be chosen for a similar design of the multi-environment trial.
Data availability statement
The original contributions presented in the study are included in the article/supplementary material, further inquiries can be directed to the corresponding author.
Author contributions
All authors listed have made a substantial contribution to the work and approved it for publication.
Funding
This study was supported by the Ministry of Research and Technology–National Research and Innovation Agency of the Republic of Indonesia (Grant Number 1/AMD/E1.KP.PTNBH/2020), Directorate General of Food Crops, Ministry of Agriculture of the Republic of Indonesia, and IPB Internal Funding through IPB Action Research Grant 2022 (Grant Number 10287/IT3.L1/PT.01.03/P.B/2022).
Acknowledgments
The authors wish to thank Mr. Ghufron, Mr. Istiyoso, the late Mr. Tugimin, Mrs. Endang Nur Bintari, Mr. Miftah, Mrs. Rahmayanti, and Mr. Syofrinaldi for technical support.
Conflict of interest
The authors declare that the research was conducted in the absence of any commercial or financial relationships that could be construed as a potential conflict of interest.
Publisher's note
All claims expressed in this article are solely those of the authors and do not necessarily represent those of their affiliated organizations, or those of the publisher, the editors and the reviewers. Any product that may be evaluated in this article, or claim that may be made by its manufacturer, is not guaranteed or endorsed by the publisher.
Abbreviations
NPT, new plant type or number of productive tillers; PH, plant height; DTH, days to harvest; NFG, number of filled grains per panicle; PUG, percentages of unfilled grains; TGW, thousand grains weight; LSD, least significant difference; ICRR, Indonesian Center for Rice Research; IRRI, International Rice Research Institute; PCoA, principal coordinate analysis; GGE, genotype + genotype by environment; GEI, genotype by environment interaction.
References
Becker, H. C., and Leon, J. (1988). Stability analysis in plant breeding. Plant Breed. 101, 1–23. doi: 10.1111/j.1439-0523.1988.tb00261.x
Chang, S., Chen, Y., Jia, S., Li, Y., Liu, K., Lin, Z., et al. (2020). Auxin apical dominance governed by the OsAsp1-OsTIF1 complex determines distinctive rice caryopses development on different branches. PLoS Genet. 16, e1009157. doi: 10.1371/journal.pgen.1009157
Choi, H., Cho, J., and Chi, S. Y. (1999). Varietal difference in water absorption characteristics of milled rice and its relation to the other grain quality components. Kor. J. Crop Sci. 44, 288–295.
Chun, A., Song, J., Kim, K. J., and Lee, H. O. (2009). Quality of head and chalky rice and deterioration of eating quality by chalky rice. J. Crop Sci. Biotech. 12, 239–244. doi: 10.1007/s12892-009-0142-4
Corbin, J. L., Walker, T. W., Orlowski, J. M., Krutz, L. J., Gore, J., Cox, M. S., et al. (2016). Evaluation of trinexapac-ethyl and nitrogen management to minimize lodging in rice. Agron. J. 108, 2365–2370. doi: 10.2134/agronj2016.04.0185
Custodio, M. C., Cuevas, R. P., Ynion, J., Laborte, A. G., Velasco, M. L., and Demont, M. (2019). Rice quality: how is it defined by consumers, industry, food scientists, and geneticists? Trends Food Sci. Technol. 92, 122–137. doi: 10.1016/j.tifs.2019.07.039
Dela-Cruz, N. M., and Khush, G. S. (2000). Rice grain quality evaluation procedures. In: Singh, R. K., Singh, U. S., Khush, G. S., editors. Aromatic Rice. Mohan Primlani. New Delhi: Oxford and IBH Publishing Co Pvt. Ltd. 15–28.
Diaz, C., Laborte, A. G., Custodio, M. C., Velasco, L., and Paguirigan, N. C. (2014). Rice preferences of farmers and other rice value chain actors in The Philippines. In: Proceedings of the 4th International Rice Congress. Bangkok, Thailand, 27 October – 1 November 2014. 522.
Dingkhun, M., de Vries, F. W. T. P., De Datta, S. K., and van Laar, H. H. (1991). Concepts of a new plant type for direct seeded flooded tropical rice. In: Direct Seeded Flooded Rice in the Tropics. Los Banos: IRRI. 17–38.
Dogara, A. M., and Jumare, A. I. (2014). Origin, distribution and heading date in cultivated rice. Int. J. Plant Biol. Res. 2, 1008.
Eberhart, S. A., and Russell, W. A. (1966). Stability parameters for comparing varieties. Crop. Sci. 6, 36. doi: 10.2135/cropsci1966.0011183X000600010011x
Finlay, K. W., and Wilkinson, G. N. (1963). The analysis of adaptation in a plant breeding programme. Aust. J. Agric. Res. 14, 742–754. doi: 10.1071/AR9630742
Fitzgerald, M. A., McCouch, S. R., and Hall, R. D. (2009). Not just a grain of rice: the quest for quality. Trends Plant Sci. 14, 133–139. doi: 10.1016/j.tplants.2008.12.004
Francis, T. R., and Kannenberg, L. Y. (1978). Yield stability studies in short-season maize. I. A descriptive method for grouping genotypes. Can. J. Plant Sci. 58, 1029–1034. doi: 10.4141/cjps78-157
Hairmansis, A., Aswidinnoor, H., Supartopo, Suwarno, W. B., Suprihatno, B., and Suwarno. (2013). Yield and grain quality of ten promising rice breeding lines for tidal swamp areas. Indonesian J. Agron. 41, 1–8. doi: 10.24831/jai.v41i1.7069
Han, C. M., Shin, J. H., Kwon, J. B., Kim, J. S., Won, J. G., and Kim, J. S. (2021). Comparison of morphological and physiochemical properties of a floury rice variety upon pre-harvested sprouting. Foods 10, 746. doi: 10.3390/foods10040746
Huang, X., Jang, S., Kim, B., Piao, Z., Redona, E., and Koh, H. J. (2021). Evaluating genotype x environment interactions of yield traits and adaptability in rice cultivars grown under temperate, subtropical and tropical environment. Agriculture 10, 746. doi: 10.3390/agriculture11060558
IBPGR-IRRI Rice Advisory Committee (1980). Descriptor for rice (Oryza sativa L.). Manila: International Rice Research Institute.
International Rice Genome Sequencing Project, and Sasaki, T. (2005). The map-based sequence of the rice genome. Nature 436, 793–800. doi: 10.1038/nature03895
IRRI. (2013). Standard Evaluation System for Rice. 5th ed. Manila: International Rice Research Institute. 44–46.
Jing, Q., Spiertz, J. H. J., Hengsdijk, H., van Keulen, H., Cao, W., and Dai, T. (2010). Adaptation and performance of rice genotypes in tropical and subtropical environment. NJAS – Wageningen J. Life Sci. 57, 149–157. doi: 10.1016/j.njas.2010.04.002
Juliano, B. O. (1985). Criteria and tests for rice grain qualities. In: Juliano, B. O., editors. Rice Chemistry and Technology. 2nd ed. American Association of Cereal Chemists, Inc. 43–52.
Kang, M. S. (1993). Simultaneous selection for yield and stability in crop performance trials: consequences for growers. Agron. J. 85, 754–757. doi: 10.2134/agronj1993.00021962008500030042x
Kang, M. S. (1997). Using genotype-by-environment interaction for crop cultivar development. Adv. Agron. 62, 199–252. doi: 10.1016/S0065-2113(08)60569-6
Khush, G. S. (1995). Breaking the yield frontier of rice. GeoJournal 35, 329–332. doi: 10.1007/BF00989140
Laza, M. R., Peng, S., Akita, S., and Saka, H. (2003). Contribution of biomass partitioning and translocation to grain yield under sub-optimum growing conditions in irrigated rice. Plant Prod. Sci. 6, 28–35. doi: 10.1626/pps.6.28
Li, R., Li, M., Ashraf, U., Liu, S., and Zhang, J. (2019). Exploring the relationships between yield and yield-related traits for rice varieties released in China from 1978 to 2017. Front. Plant Sci. 10, 543. doi: 10.3389/fpls.2019.00543
Li, X., Qian, Q., Fu, Z., Wang, Y., Xiong, G., Zeng, D., et al. (2003). Control of tillering in rice. Nature 422, 618–621. doi: 10.1038/nature01518
Lin, C. S., and Binns, M. R. (1988). A superiority measure of cultivar performance for cultivar x location data. Can. J. Plant Sci. 68, 193–198. doi: 10.4141/cjps88-018
Lin, C. S., Binns, M. R., and Lefkovitch, L. P. (1986). Stability analysis: where do we stand?. Crop Sci. 26, 894–900. doi: 10.2135/cropsci1986.0011183X002600050012x
Lisle, A. J., Martin, M., and Fitzgerald, M. A. (2000). Chalky and translucent rice grains differ in starch composition and structure and cooking properties. Cereal Chem. 77, 627–632. doi: 10.1094/CCHEM.2000.77.5.627
Mackill, D. J., and Khush, G. M. (2018). IR64: a high-quality and high-yielding mega variety. Rice. 11, 18. doi: 10.1186/s12284-018-0208-3
Muthayya, S., Sugimoto, J. D., Montgomery, S., and Maberly, G. F. (2014). An overview of global rice production, supply, trade, and consumption. Ann. N.Y. Acad. Sci. 1324, 7–14. doi: 10.1111/nyas.12540
Nirmaladevi, G., Padmavathi, G., Kota, S., and Babu, V. R. (2015). Genetic variability, heritability and correlation coefficients of grain quality characters in rice (Oryza sativa L.). SABRAO J. Breed. Genet. 47, 424–433.
Parida, A. K., Sekhar, S., Panda, B. B., Sahu, G., and Shaw, B. P. (2022). Effect of panicle morphology on grain filling and rice yield: genetic control and molecular regulation. Front. Genet. 13, 876198. doi: 10.3389/fgene.2022.876198
Peng, S., and Khush, G. S. (2003). Four decades of breeding for varietal improvement of irrigated lowland rice in the International Rice Research Institute. Plant Prod. Sci. 6, 157–164. doi: 10.1626/pps.6.157
Peng, S., Khush, G. S., and Cassman, K. G. (1994). Evolution of the new plant ideotype for increased yield potential. In: Proceedings of Breaking The Yield Barrier: Proceedings of a Workshop on Rice Yield Potential in Favorable Environments. Manila: 29. 5–20.
Peng, S., Khush, G. S., Virk, P., Tang, Q., and Zou, Y. (2008). Progress in ideotype breeding to increase rice yield potential. Field Crops Res. 108, 32–38. doi: 10.1016/j.fcr.2008.04.001
Perkins, J. M., and Jinks, J. L. (1968). Environmental and genotype x environmental components of variability. Heredity 23, 339–356. doi: 10.1038/hdy.1968.48
Plaisted, R. L. (1960). A shorter method of evaluating the ability of selection to yield consistently over seasons. Am. Potato J. 37, 166–172. doi: 10.1007/BF02855271
Plaisted, R. L., and Peterson, L. C. A. (1959). Technique for evaluating the ability of selections and yield consistency in different locations or seasons. Am. Potato J. 36, 381–385. doi: 10.1007/BF02852735
Powell, N., Ji, X., Ravash, R., Edlington, J., and Dolferus, R. (2012). Yield stability for cereals in a changing climate. Funct. Plant Biol. 39, 539–552. doi: 10.1071/FP12078
Rasmusson, D. C. (1991). A plant breeder's experience with ideotype breeding. Field Crops Res. 26, 191–200. doi: 10.1016/0378-4290(91)90035-T
Shivani, D., Viraktamath, B. C., and Shobha Rani, N. (2007). Correlation among various grain quality characteristics in rice. Oryza. 44, 212–215.
Shukla, G. K. (1972). Some statistical aspects of partitioning genotype-environmental components of variability. Heredity 29, 237–245. doi: 10.1038/hdy.1972.87
Tai, G. C. C. (1971). Genotypic stability analysis and its application to potato regional trials. Crop Sci. 11, 184–190. doi: 10.2135/cropsci1971.0011183X001100020006x
Tomita, A., and Fukuta, Y. (2019). QTL analysis for soil-surface roots originating from a New Plant Type rice (Oryza sativa). Plant Breed. 138, 154–162. doi: 10.1111/pbr.12680
Uddin, M. N., Tomita, A., Obara, M., Yanagihara, S., and Fukuta, Y. (2016). Identification of a low tiller gene from a new plant type cultivar in rice (Oryza sativa L.). Breeding Sci. 66, 790. doi: 10.1270/jsbbs.16143
Velasco, L., Custodio, M. C., Laborte, A. G., and Suphanchaimat, N. (2015). Rapid Value Chain Assessment and Rice Preferences of Consumers, Farmers and Other Rice Value Chain Actors in Thailand. Los Banos: International Rice Research Institute.
Wang, E., Wang, J., Zhu, X., Hao, W., Wang, L., Li, Q., et al. (2008). Control of rice grain-filling and yield by a gene with a potential signature of domestification. Nat. Genet. 40, 1370–1374. doi: 10.1038/ng.220
Wang, S., Wu, K., Yuan, Q., Liu, X., Liu, Z., Lin, X., et al. (2012). Control of grain size, shape, and quality by OsSPL16 in rice. Nat. Genet. 44, 950–954. doi: 10.1038/ng.2327
Wricke, G. (1962). On a method of understanding the biological diversity in field research. Z. Planzenzuchtg 47, 92–126.
Yan, J. Q., Zhu, J., He, C. X., Benmoussa, M., and Wu, P. (1998). Quantitative trait loci analysis for developmental behavior of tiller number in rice (Oryza sativa L.). Theor. Appl. Genet. 97, 267–274. doi: 10.1007/s001220050895
Yan, W. (2002). Singular-value partitioning in biplot analysis of multienvironment trial data. Agron. J. 94, 990–996. doi: 10.2134/agronj2002.9900
Yan, W. (2016). Analysis and handling of GxE in a practical breeding program. Crop Sci. 56, 2106. doi: 10.2135/cropsci2015.06.0336
Yan, W., Hunt, L. A., Sheng, Q., and Szlavnics, Z. (2000). Cultivar evaluation and mega-environment investigation based on the GGE biplot. Crop Sci. 40, 597. doi: 10.2135/cropsci2000.403597x
Yan, W., Kang, M. S., Ma, B., Woods, S., and Cornelius, P. L. (2007). GGE biplot vs AMMI analysis of genotype-by-environment data. Crop Sci. 47, 643–653. doi: 10.2135/cropsci2006.06.0374
Yan, W., and Tinker, N. A. (2006). Biplot analysis of multi-environment trial data: principles and applications. Can. J. Plant Sci. 86, 623–645. doi: 10.4141/P05-169
Yang, W., Peng, S., Laza, R. C., Visperas, R. M., and Dionisio-Sese, M. L. (2007). Grain yield and yield attributes of new plant type and hybrid rice. Crop Sci. 47, 1393–1400. doi: 10.2135/cropsci2006.07.0457
Yu, S., Ma, Y., and Sun, D. (2009). Impact of amylose content on strach retrogradation and texture of cooked milled rice during storage. J. Cereal Sci. 50, 139–144. doi: 10.1016/j.jcs.2009.04.003
Keywords: genotype by environment interaction, multi-environment trial, rice breeding, yield potential, amylose content
Citation: Aswidinnoor H, Listiyanto R, Rahim S, Holidin, Setiyowati H, Nindita A, Ritonga AW, Marwiyah S and Suwarno WB (2023) Stability analysis, agronomic performance, and grain quality of elite new plant type rice lines (Oryza sativa L.) developed for tropical lowland ecosystem. Front. Sustain. Food Syst. 7:1147611. doi: 10.3389/fsufs.2023.1147611
Received: 18 January 2023; Accepted: 01 August 2023;
Published: 17 August 2023.
Edited by:
Silvia Tavarini, University of Pisa, ItalyReviewed by:
Marina Mefleh, University of Bari Aldo Moro, ItalySanjeev Kumar, National Dairy Research Institute (ICAR), India
Copyright © 2023 Aswidinnoor, Listiyanto, Rahim, Holidin, Setiyowati, Nindita, Ritonga, Marwiyah and Suwarno. This is an open-access article distributed under the terms of the Creative Commons Attribution License (CC BY). The use, distribution or reproduction in other forums is permitted, provided the original author(s) and the copyright owner(s) are credited and that the original publication in this journal is cited, in accordance with accepted academic practice. No use, distribution or reproduction is permitted which does not comply with these terms.
*Correspondence: Willy Bayuardi Suwarno, d2lsbHlAYXBwcy5pcGIuYWMuaWQ=