 Yixiao Xie1†
 Wen Liu2†
 Ping Li1Shiqie Bai3,4Daxu Li4Lixia Zhang4Hong Sun1
 Yulong Zheng1
 Qiming Cheng1Chunmei Wang1Ermei Du1Wenlong Gou3,4*
- 1College of Animal Science, Guizhou University, Guiyang, Guizhou, China
- 2State Key Laboratory of Animal Nutrition, Institute of Animal Sciences, Chinese Academy of Agricultural Sciences, Beijing, China
- 3College of Life Sciences, Southwest University of Science and Technology, Mianyang, China
- 4Sichuan Academy of Grassland Sciences, Chengdu, China
Introduction: To infer changes in soil function and thus determine appropriate agronomic management practices, this study evaluated the effects of plant maturity stage on root characteristics, soil chemical and enzymatic properties, and soil bacterial community composition in an annual grass–legume production system.
Methods: Annual ryegrass or rye was sown in combination with one of three legume species at a legume ratio of 50%. Eighteen plots (six plant combinations, three replicates per combination, 20 m × 25 m plots) were tilled to a depth of 20 cm after mowing. Soil samples from each plot were collected on four dates as the plants matured: January 4 (H1), March 14 (H2), April 21 (H3), and May 19 (H4). Bacterial community structures were characterized via 16S rRNA high-throught sequencing and the bio-informatics methods were used to evaluate the structural characteristics of soil bacteria.
Results: The most abundant root growth was observed at the H3 stage. No significant differences in organic matter, alkali-hydrolyzable nitrogen, available phosphorus, and available potassium contents (p > 0.05) were observed on any sampling date. Soil collected at the H3 stage exhibited lower acid protease and urease activities (p < 0.05) and higher nitrate reductase activity (p < 0.05). The structure of the microbial community at stage H3 differed markedly from that at other stages, as evidenced by a higher abundance of Proteobacteria, Bacteroidetes, Acidobacteria, and Verrucomicrobia (p < 0.05) and a lower abundance of Actinobacteria, Cyanobacteria, and Planctomycetes (p < 0.05). At the class level, the relative abundances of Sphingobacteria, Betaproteobacteria, and Gammaproteobacteria in soil was higher at H3 stage than those of other stages (p < 0.05). The order level for Sphingomonadales, Sphingobacteriales, and Burkholderiales and at the family level for Chitinophagaceae and Sphingomonadaceae showed the same trend toward higher.
Conclusion: Nutrient cycling in the soil was slowed at the H3 stage, and the loss of nitrogen would also be greater. Measures may need to be taken to improve the nitrogen fertilizer utilization efficiency to reduce denitrification and nitrous oxide production at this stage (the booting stage of grasses and budding stage of legumes).
1. Introduction
In many agricultural systems, decades of intensive farming have reduced soil organic matter content, thereby reducing soil fertility and biodiversity (Gardi et al., 2013). As a consequence, important soil ecosystem services such as nutrient cycling are often impaired. Organic agriculture, including legume-based forage systems, is believed to be more environmentally sound than traditional agriculture and may enhance soil quality and plant diversity (Lu et al., 2017) through incorporation of large amounts of carbon into the soil via organic rather than mineral fertilizers (Lal, 2009).
There is a synergistic relationship between the microbial community and agricultural practices. For example, the inclusion of legumes has been shown to shape soil microbial community structure in the short term (Chávez-Romero et al., 2016; Lupwayi et al., 2018). The presence of legumes in the plant mixture enhanced soil bacterial biomass compared with grasses grown in monoculture, thereby changing the soil microbial community (Chen et al., 2008). Plant growth stage can also influence soil chemical and physical properties through its effects on root growth, which determines the quality and quantity of root exudates, thereby exerting selection on root-associated microorganisms (Baudoin et al., 2003; Ziegler et al., 2013; Li et al., 2014). The inclusion of legumes in organic agriculture can help to sustain soil fertility through biological nitrogen fixation, reducing greenhouse gas emissions from ruminants and soil in fertilized agricultural systems (Yadav et al., 2018).
In turn, microbial communities can enhance nutrient cycling, helping to maintain soil function (Lemanceau et al., 2016). Bacteria, the most abundant and diverse group of soil microbes, influence soil structure, organic matter decomposition, inorganic compound transformation, and nitrogen fixation in agricultural ecosystems (Gans et al., 2005; Sengupta and Dick, 2015). However, soil bacterial communities are particularly sensitive to changes in environmental factors such as soil status (Fierer et al., 2007), vegetation type (Leloup et al., 2018), and land use (Yergeau et al., 2006).
Recently, researchers have become interested in the effects of legume species on carbon and nitrogen cycling in grass production systems. Previous research has shown that seasonal variations in the activity and relative abundance of soil bacterial communities are plant dependent (Li et al., 2014). However, we still lack a comprehensive understanding of how soil microbial communities change during different stages of root growth. In addition, soil enzymes are also a small but vital component to shape soil organic matter since every biochemical action is dependent on or related to enzymes (Szajdak and Gaca, 2010). Since enzyme activity and nutrient characteristics of soils are closely related, it is critical to investigate the dynamics of enzyme activity in soil. In a recent study, we found that root characteristics of plants in an annual grass–legume field did not change linearly throughout plant growth and development. We inferred that the soil bacterial community structure and soil enzyme activity were also likely to evolve non-linearly as plants matured. By documenting key changes in soil bacterial community structure at different plant maturity stages, it may be possible to infer changes in soil function and thus determine appropriate agronomic management practices. In the present work, we collected soils from an annual grass–legume forage production system to determine the common features of the soil bacterial community at a site in southern China and analyze how these bacterial communities change at different stages of root growth.
2. Materials and methods
2.1. Site description and experimental design
The study was performed at the experimental station (E103°45′, N30°25′; 475 m altitude) of Sichuan Academy of Grassland Sciences, in Chengdu, P. R. China. The experimental site experiences a continental tropical humid monsoon climate with a mean annual temperature of 15°C and mean annual precipitation of about 1,300 mm. The soil type is a yellow clay soil (according to Chinese soil classification system) with a pH of 6.74 (Gong, 1992), organic matter content of 32.2 g kg−1, alkali-hydrolyzable nitrogen (AN) of 185 mg kg−1, available phosphorus (AP) of 41.8 mg kg−1, and available potassium (AK) of 127.3 mg kg−1. The annual sunshine duration is 1033.8 h, and the annual average frost-free period is 284 days.
The experiment was set up using a completely randomized block design. Annual ryegrass (Lolium multiflorum L.) or rye (Secale cereale L.) was sown together with one of the legume species milk vetch (Astragalus sinicus L.), bur clover (Medicago polymorpha L.), or common vetch (Vicia sativa L.) at a legume ratio of 50%. A total of 18 plots (six plant combinations, three replicates per combination, each 20 m × 25 m) were tilled to depth of 20 cm after mowing, and a pre-planting NPK fertilizer (1-1-1) was applied at a rate of 150 kg hm−2. All mixtures were sown on 10–15 September, 2017. Seeding density was 18 kg hm−2 for the legume species and 22.5 kg hm−2 for the annual ryegrass and rye. To prevent weeds, atrazine was sprayed at 2.5 L hm−2 before tillage, and 2,4-dichlorophenoxyacetic acid was applied at 0.6 L hm−2 1 week after germination.
2.2. Soil sampling and preparation
After each mowing in 2017, five 20-cm-deep soil cores were randomly collected using an 8 cm diameter soil auger from each plot on January 4 (H1, tiller stage of grasses and branching stage of legumes), March 14 (H2, jointing stage of grasses and branching stage of legumes), April 21 (H3, booting stage of grasses and budding stage of legumes), and May 19 (H4, milky stage of grasses and flowering stage of legumes). Roots were separated from the five soil cores and mixed as a composite sample. The root sample was washed with distilled water and characterized using a root analysis system (LC-4800, WinFOLIA, American). Sampling sites for subsequent samplings were selected near the previous locations to minimize the effects of spatial variation in soil properties on the bacterial community (Li et al., 2014). Adequate distance (> 0.5 m) should also be left for each sampling to avoid soil compaction. Samples from each plot were mixed and homogenized by passing through a 2-mm sieve to remove aboveground roots, visible residues, and stones, ultimately producing a composite soil sample. Each soil sample was divided into two subsamples: one was stored at 4°C for determination of soil physical and chemical properties, and the other was stored at −80°C for DNA extraction and microbial analysis.
2.3. Soil chemical and enzymatic properties
Soil acid protease activity (APA), urease activity (UA), and solid-nitrate reductase activity (NA) were measured by the method of Zhou (1987). Soil pH was determined with a glass electrode. Soil AN was determined by the alkaline hydrolyzable diffusion method (Lu, 1999). Contents of organic matter (OM), AK, and AP were determined as described in Kong et al. (2006).
2.4. DNA extraction and PCR amplification
DNA extraction and PCR amplification were performed according to the method of Zeng et al. (2017). In brief, total genomic DNA was extracted from samples using the CTAB/SDS method. DNA concentration and purity were monitored on 1% agarose gels, and DNA was diluted to 1 ng μL−1 using sterile water. The primers 515F (5′-CCTACGGGAGGCAGCAG-3′) and 806R (5′-GGACTACHVGGGTWTCTAAT-3′) were used to amplify the V4 hypervariable region of the 16S rRNA gene with a barcode. All PCR reactions were carried out with Phusion High-Fidelity PCR Master Mix (New England Biolabs) and the PCR reaction volume was supplemented with distilled water to 20 μL. The PCR was performed using a thermal cycler Model (ABI GeneAmp 9700, Applied Biosystems Inc., San Diego, CA, United States) with the thermal cycling conditions: initial denaturation of 2 min at 95°C, 30 cycles of denaturation at 95°C for 30 s, annealing at 56°C for 30 s, extension at 72°C for 30 s, final extension at 72°C for 5 min and hold at 10°C. An equal volume of 1× loading buffer (containing SYB green) was mixed with the PCR products, and products were detected following electrophoresis on a 2% agarose gel. Samples with a bright main band between 400 and 450 bp were chosen for further experiments. PCR products were mixed in equidensity ratios and purified with the Qiagen Gel Extraction Kit (Qiagen, Germany).
2.5. Library preparation and sequencing
Sequencing libraries were generated using the TruSeq DNA PCR-Free Sample Preparation Kit (Illumina, USA) following the manufacturer’s recommendations, and index codes were added. Library quality was assessed on a Qubit 2.0 Fluorometer (Thermo Scientific) and an Agilent Bioanalyzer 2100 system, and libraries were sequenced on the Illumina HiSeq 2500 platform to produce 250-bp paired-end reads.
Paired-end reads were merged using FLASH (V1.2.7; Magoč and Salzberg, 2011), then filtered to obtain high-quality clean tags according to the quality control process of QIIME (V1.7.0), which allowed for a two-nucleotide mismatch during primer matching (Bokulich et al., 2013). The tags were compared with the Gold database using the UCHIME algorithm to detect chimeric sequences, which were then removed.
Sequence analysis was performed with Uparse software (Uparse v7.0.1001; Edgar, 2013). Sequences with ≥97% similarity were assigned to the same OTU. Each representative sequence was annotated with taxonomic information using the GreenGene Database based on the RDP 3 classifier (Version 2.2) algorithm (DeSantis et al., 2006). To study phylogenetic relationships among different OTUs and characterize differences in the dominant species among different samples (groups), multiple sequence alignment was performed using MUSCLE software (Version 3.8.31; Edgar, 2004).
2.6. Data analysis
Before further analysis of alpha diversity, the sequences were normalized according to the lowest number of sequences for a single soil sample. Alpha diversity was calculated with QIIME (Version 1.7.0) and visualized using R software (Version 2.15.3). Principal coordinate analysis (PCoA) was performed and the results visualized using the R packages WGCNA, stat, and ggplot2 (R version 2.15.3) based on the Bray–Curtis dissimilarity. The non-strict version of linear discriminant analysis effect size (LEfSe; Segata et al., 2011) was applied to discover biomarkers for different root growth stages. The analysis was constructed in the Novogene platform using online interactive tools. The tools were used with default parameters.
ANOVA was performed to evaluate the effects of root growth stage on root characteristics, soil chemical properties, alpha diversity metrics, and relative abundances of dominant bacterial phyla. Duncan’s multiple range test was used to identify statistically significant differences among the means. For all analyses, statistical significance was defined as p < 0.05.
3. Results
3.1. Root characteristics
Values of root characteristics did not increase linearly with growth time (Table 1). Although the differences were not statistically significant, the values of most root characteristics, including dry weight, length, surface area, volume, and number, initially tended to increase from H1 to H3 and then decrease at H4. The most abundant root growth was observed at the H3 stage. However, the above-ground biomass production of the H1–H4 stages was 4,566, 5,512, 4,237, and 3,936 kg hm−2 (dry matter, DM), respectively. The maximum above-ground biomass production occurred in H2 stage.
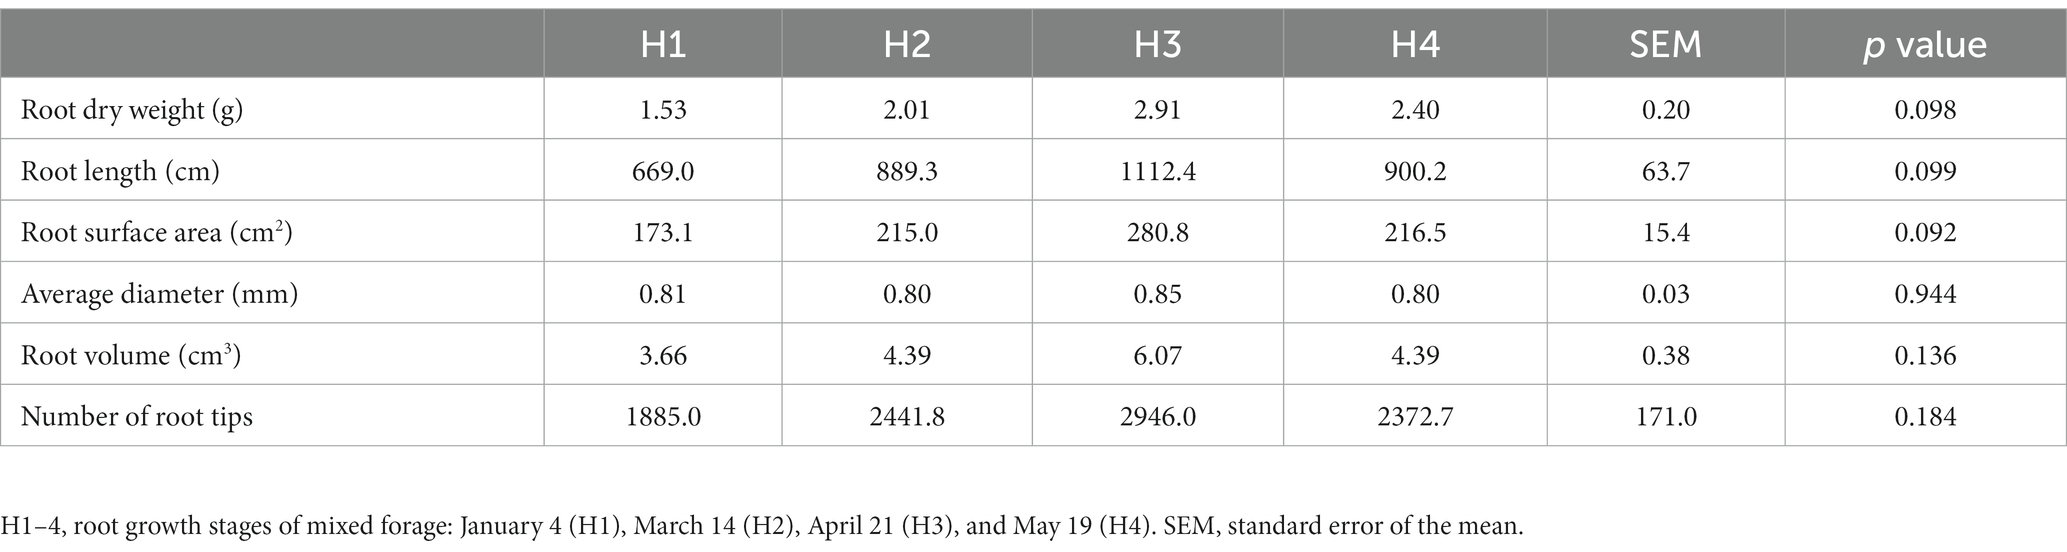
Table 1. Root characteristics (mean/6.4 cm2) in an annual legume–grass forage production system.
3.2. Soil chemical and enzymatic properties
Soil APA decreased from 22.99 mg day−1 g−1 (DM) to 3.43 mg day−1 g−1 (DM) over the course of the season (Figure 1). Soil pH and NA reached their maximum values in the H2 and H3 phases, respectively (p < 0.05). No significant differences (p > 0.05) were observed in the contents of OM, AN, AP, and AK between any of the plant maturity stages, H1–H4.
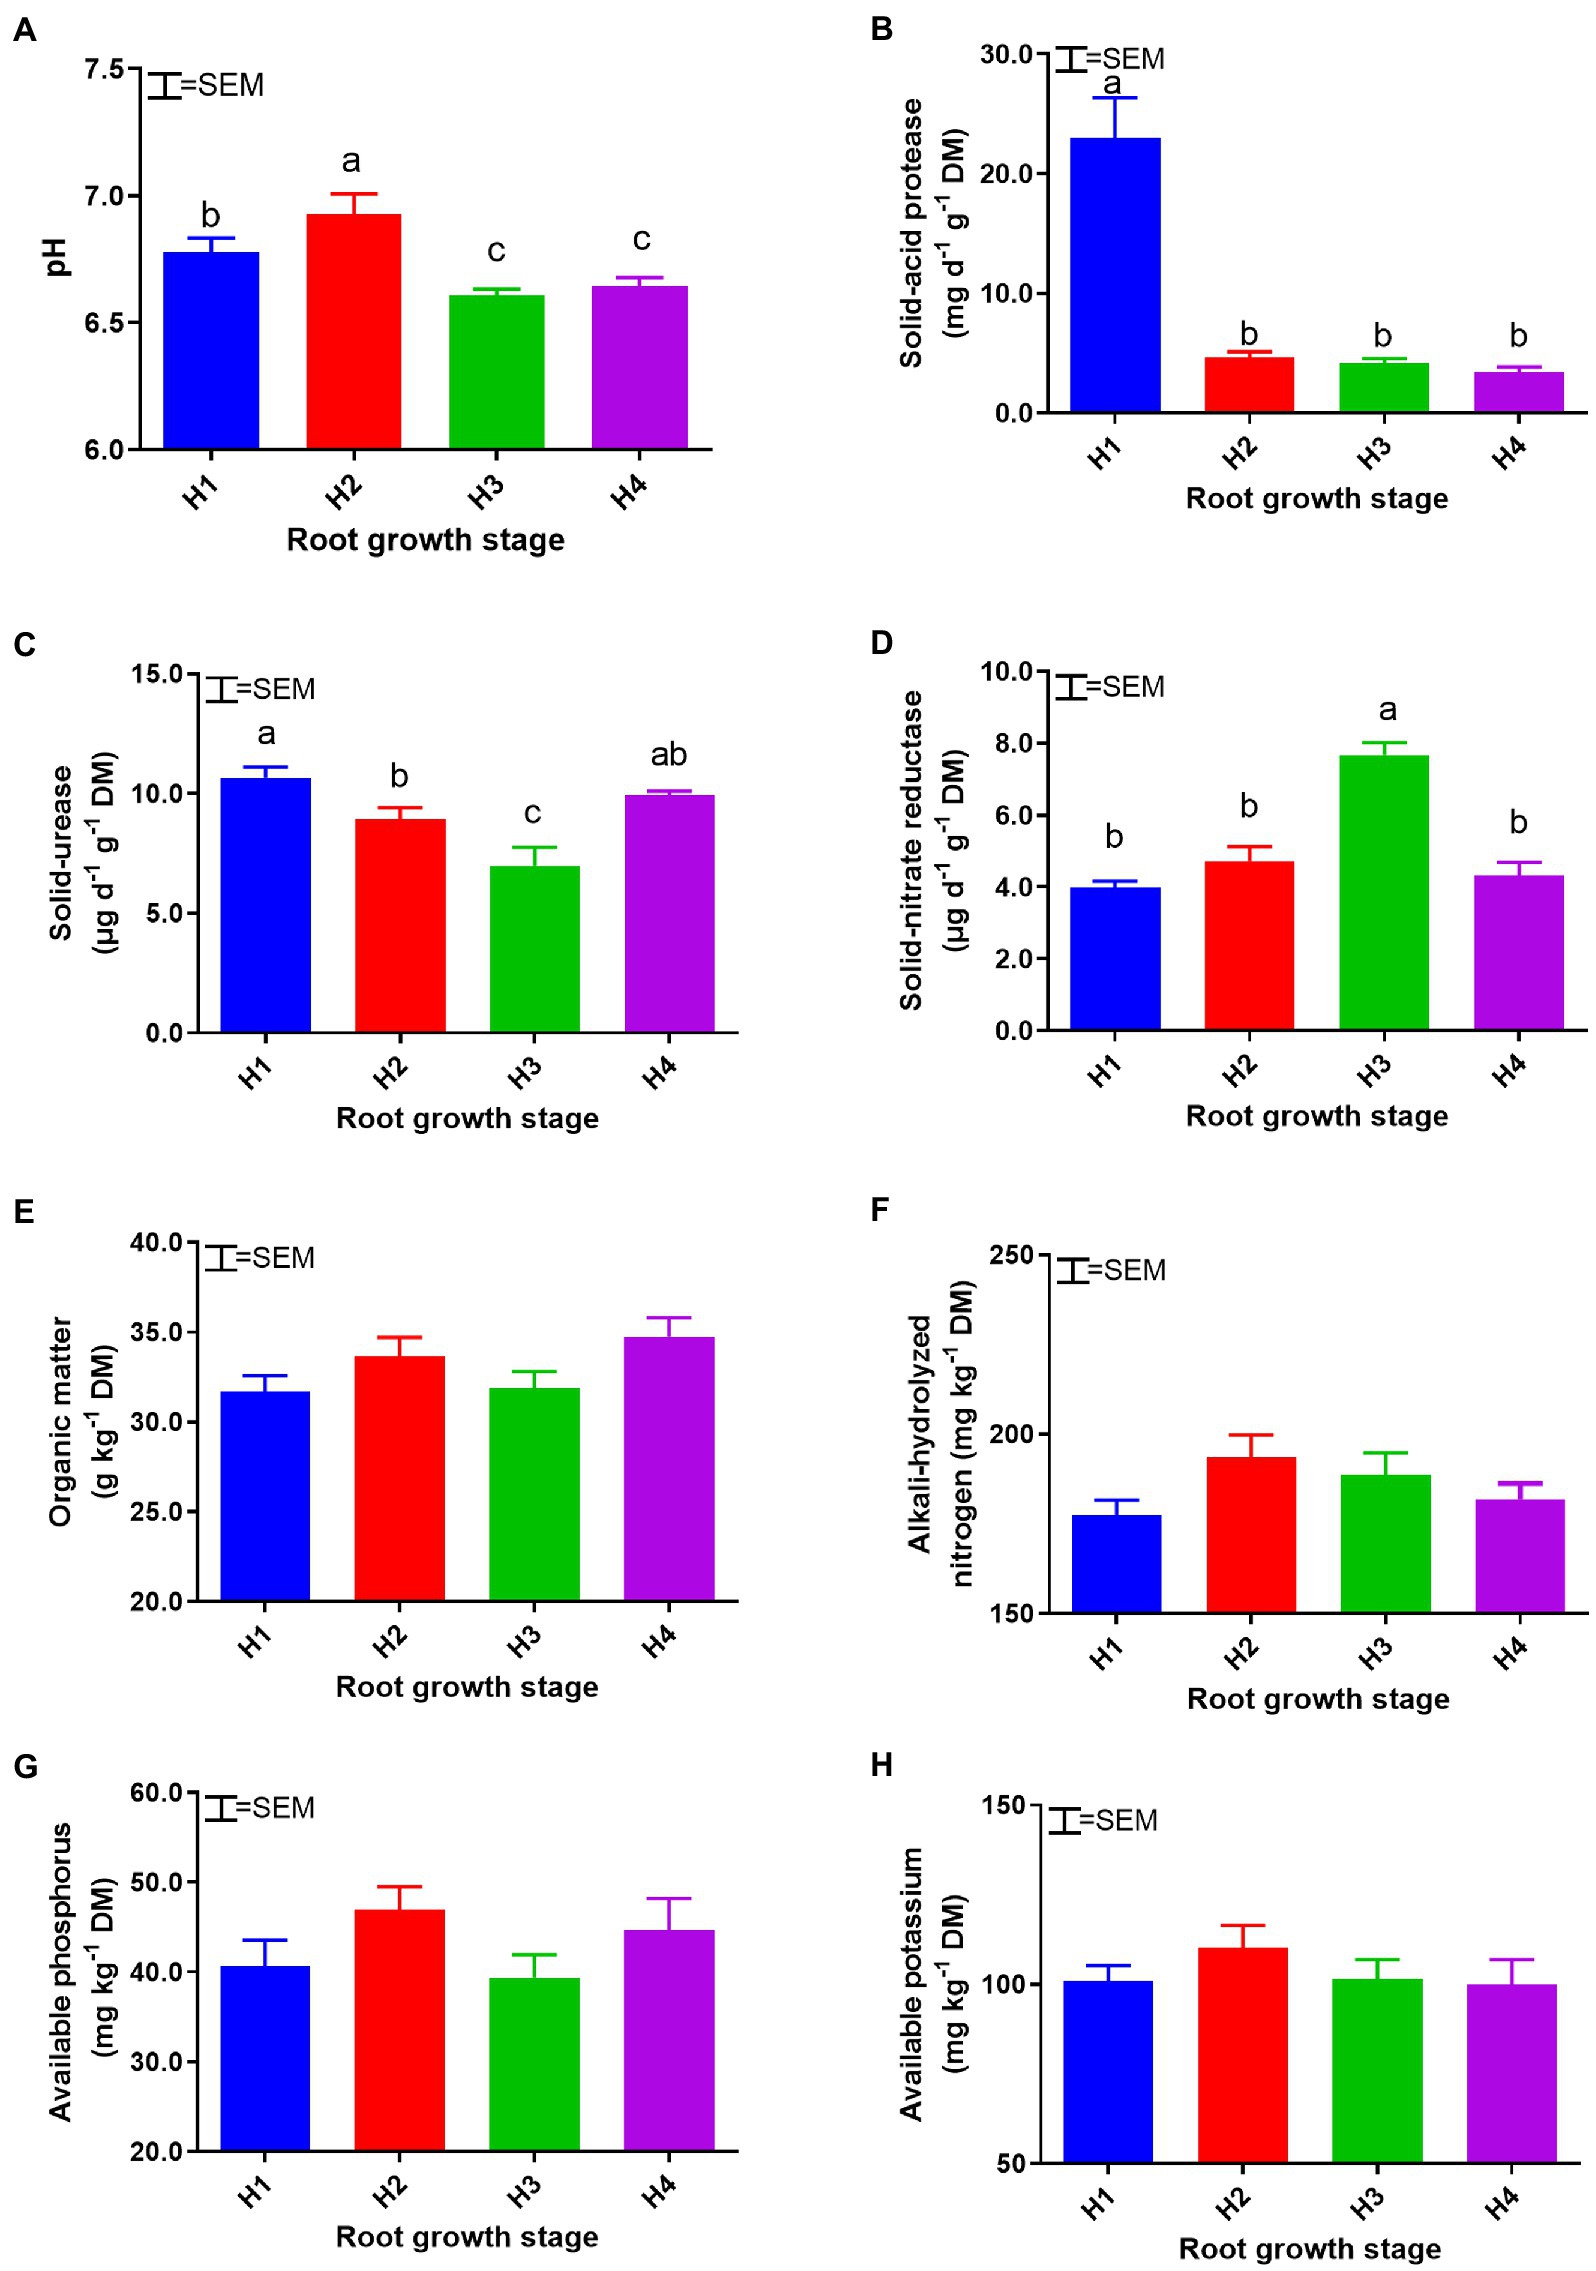
Figure 1. Soil chemical and enzymatic properties: pH (A), solid-acid protease (B), solid-urease (C), solid-nitrate reductase (D), organic matter (E), alkali-hydrolyzable nitrogen (F), available phosphorus (G), and available potassium (H) at root growth stages H1–4. DM, dry matter. H1–4, root growth stages of mixed forage: January 4 (H1), March 14 (H2), April 21 (H3), and May 19 (H4). SEM, standard error of the mean (n = 18). Means with different superscripts differ significantly (p < 0.05).
3.3. Soil bacterial community composition
Changes in bacterial alpha diversity during the season are shown in Figure 2. A total of 201,095 OTUs were obtained (on the basis of 97% sequence similarity), and the lowest number of OTUs (2594) occurred at H2. The Chao 1 and ACE diversity indices showed that bacterial community richness was highest at the H4 stage (p < 0.05). By contrast, whole-tree phylogenetic diversity (PD) decreased after H1 and then remained stable.
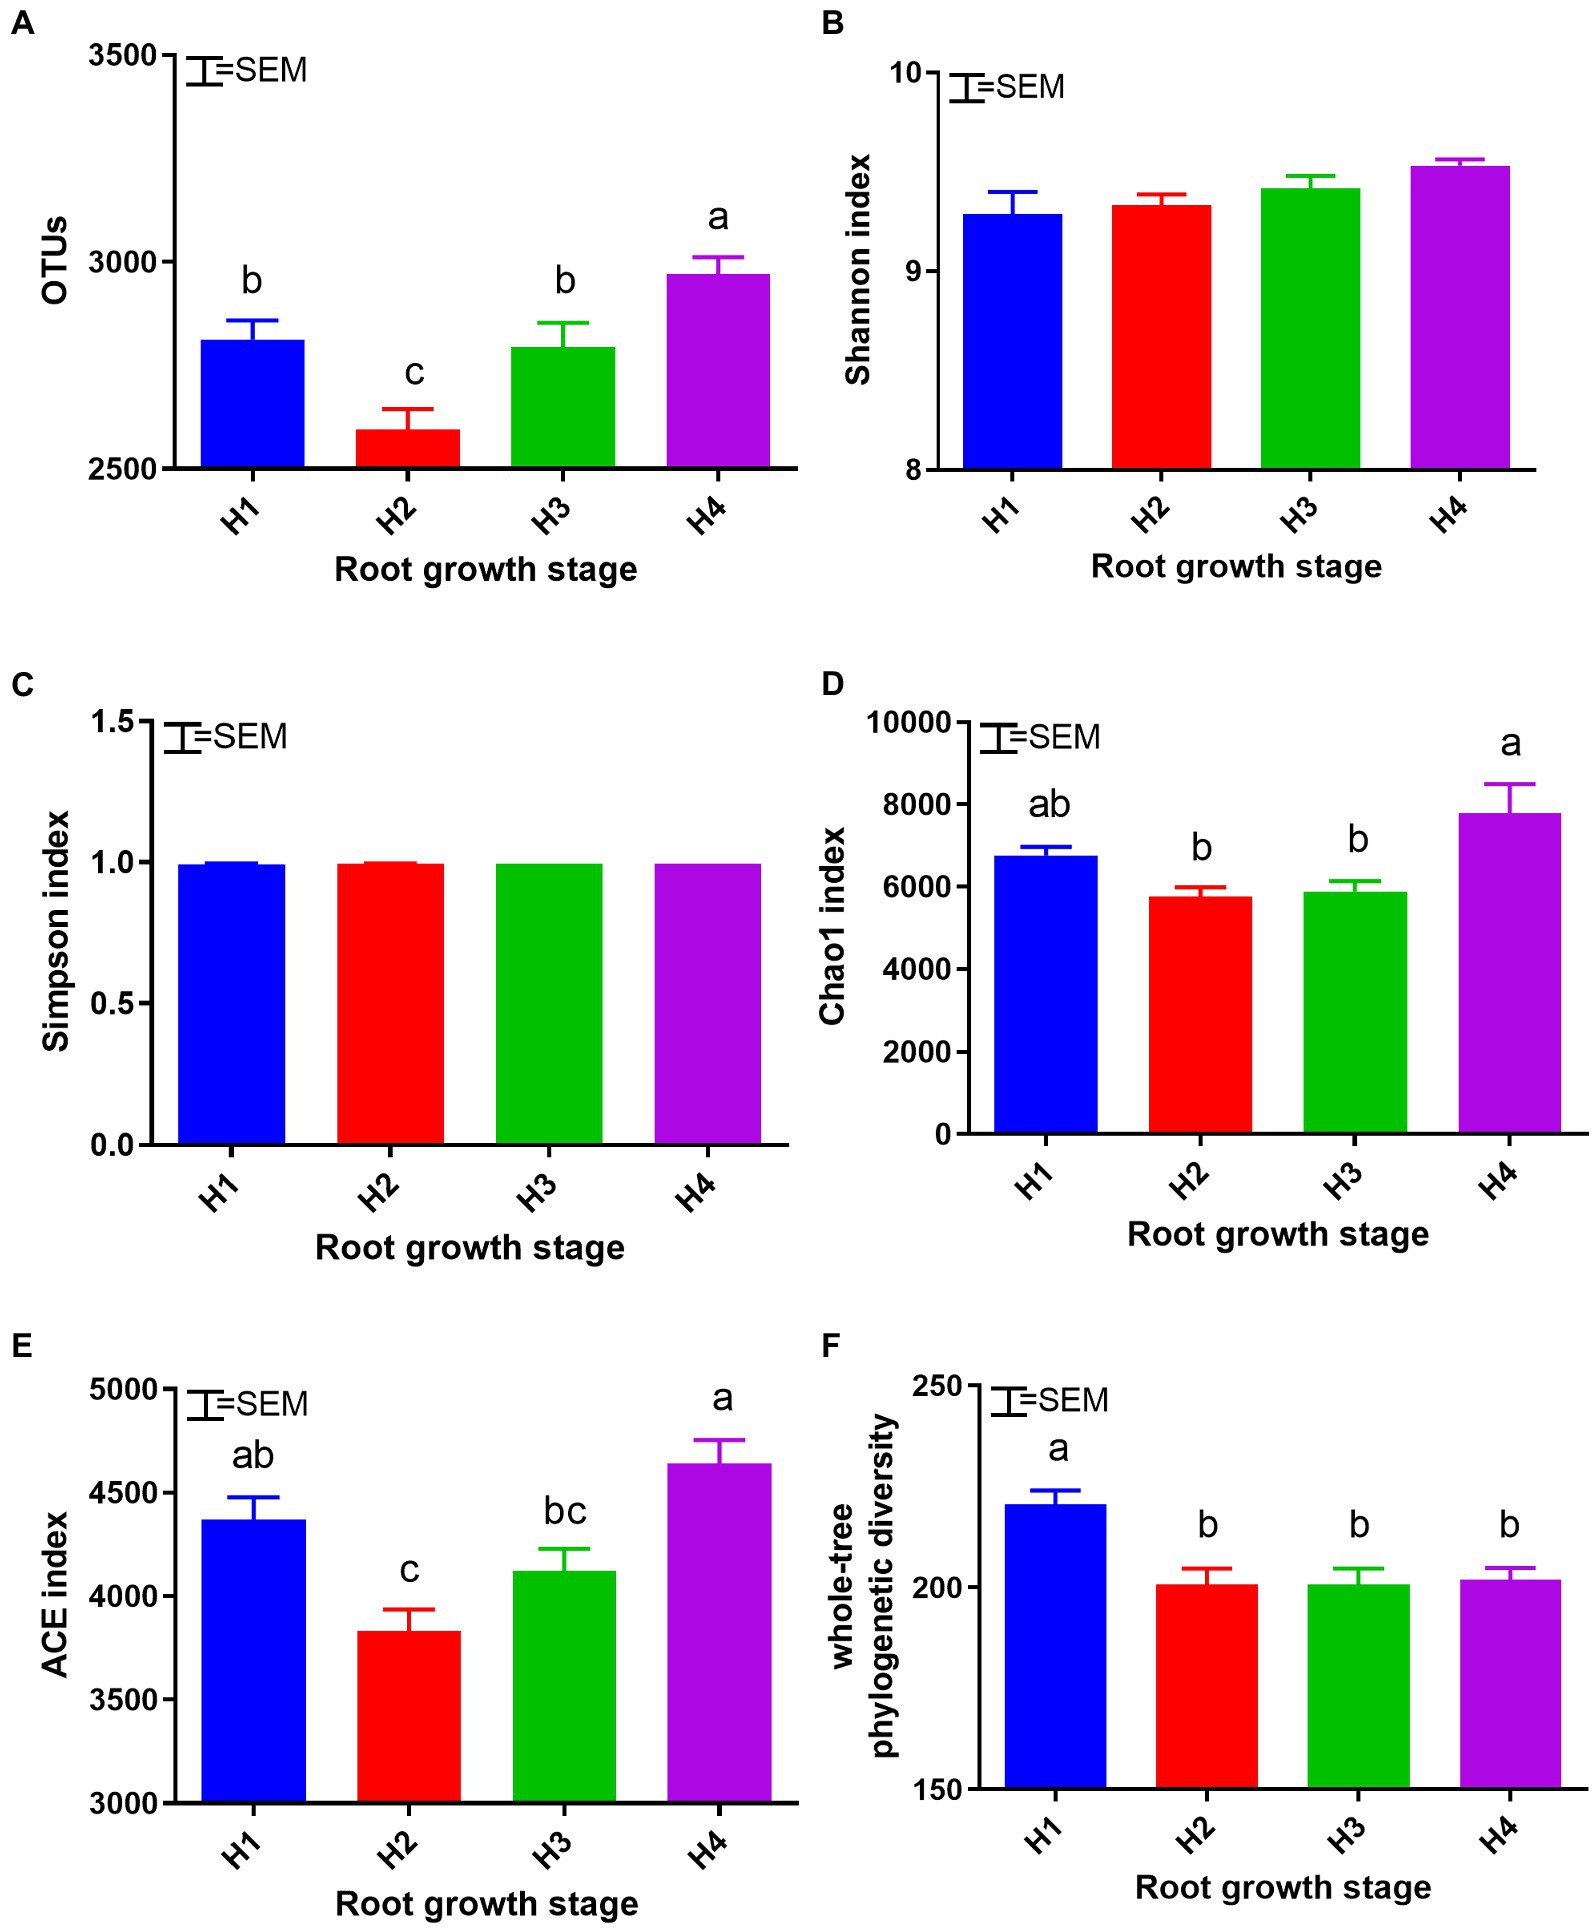
Figure 2. Soil bacterial alpha diversity: OTUs (A), Shannon (B), Simpson (C), Chao 1 (D), ACE (E), and whole-tree PD (F) at root growth stages H1–4. H1–4, root growth stages of mixed forage: January 4 (H1), March 14 (H2), April 21 (H3), and May 19 (H4). SEM, standard error of the mean (n = 18). Means with difference superscripts differ significantly (p < 0.05).
Bacterial community structure and relative abundance over the course of the experiment are shown in Figure 3. The dominant groups at the phylum level were Proteobacteria, Actinobacteria, Firmicutes, Bacteroidetes, Acidobacteria, Gemmatimonadetes, Cyanobacteria, Planctomycetes, Chloroflexi, and Verrucomicrobia, with a combined relative abundance of >93%. The identifiable dominant groups at the genus level were Pseudomonas, Haliangium, Gemmatimonas, and Sphingomonas, with a combined relative abundance of about 10%. Changes in the relative abundance of dominant bacterial phyla are shown in Figure 4. The relative abundances of Actinobacteria, Cyanobacteria, and Planctomycetes were lower in H3 soil samples than in the others (p < 0.05), whereas relative abundances of Proteobacteria, Bacteroidetes, Acidobacteria, and Verrucomicrobia were higher than those of others (p < 0.05). The relative abundance of Firmicutes increased over the course of the season (p < 0.05), whereas that of Gemmatimonadetes decreased (p < 0.05).
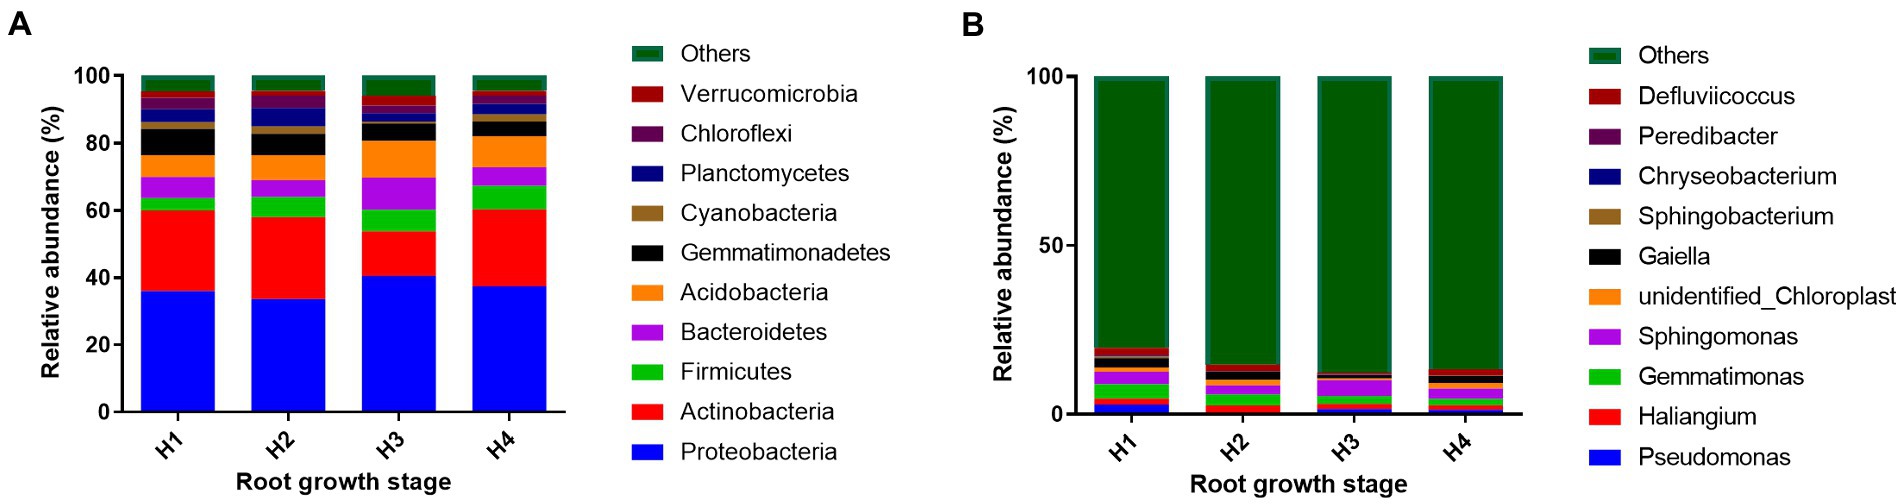
Figure 3. Soil bacterial community structure and relative abundance of taxa at the phylum (A) and genus (B) levels at root growth stages H1–4. H1–4, root growth stages of mixed forage: January 4 (H1), March 14 (H2), April 21 (H3), and May 19 (H4).
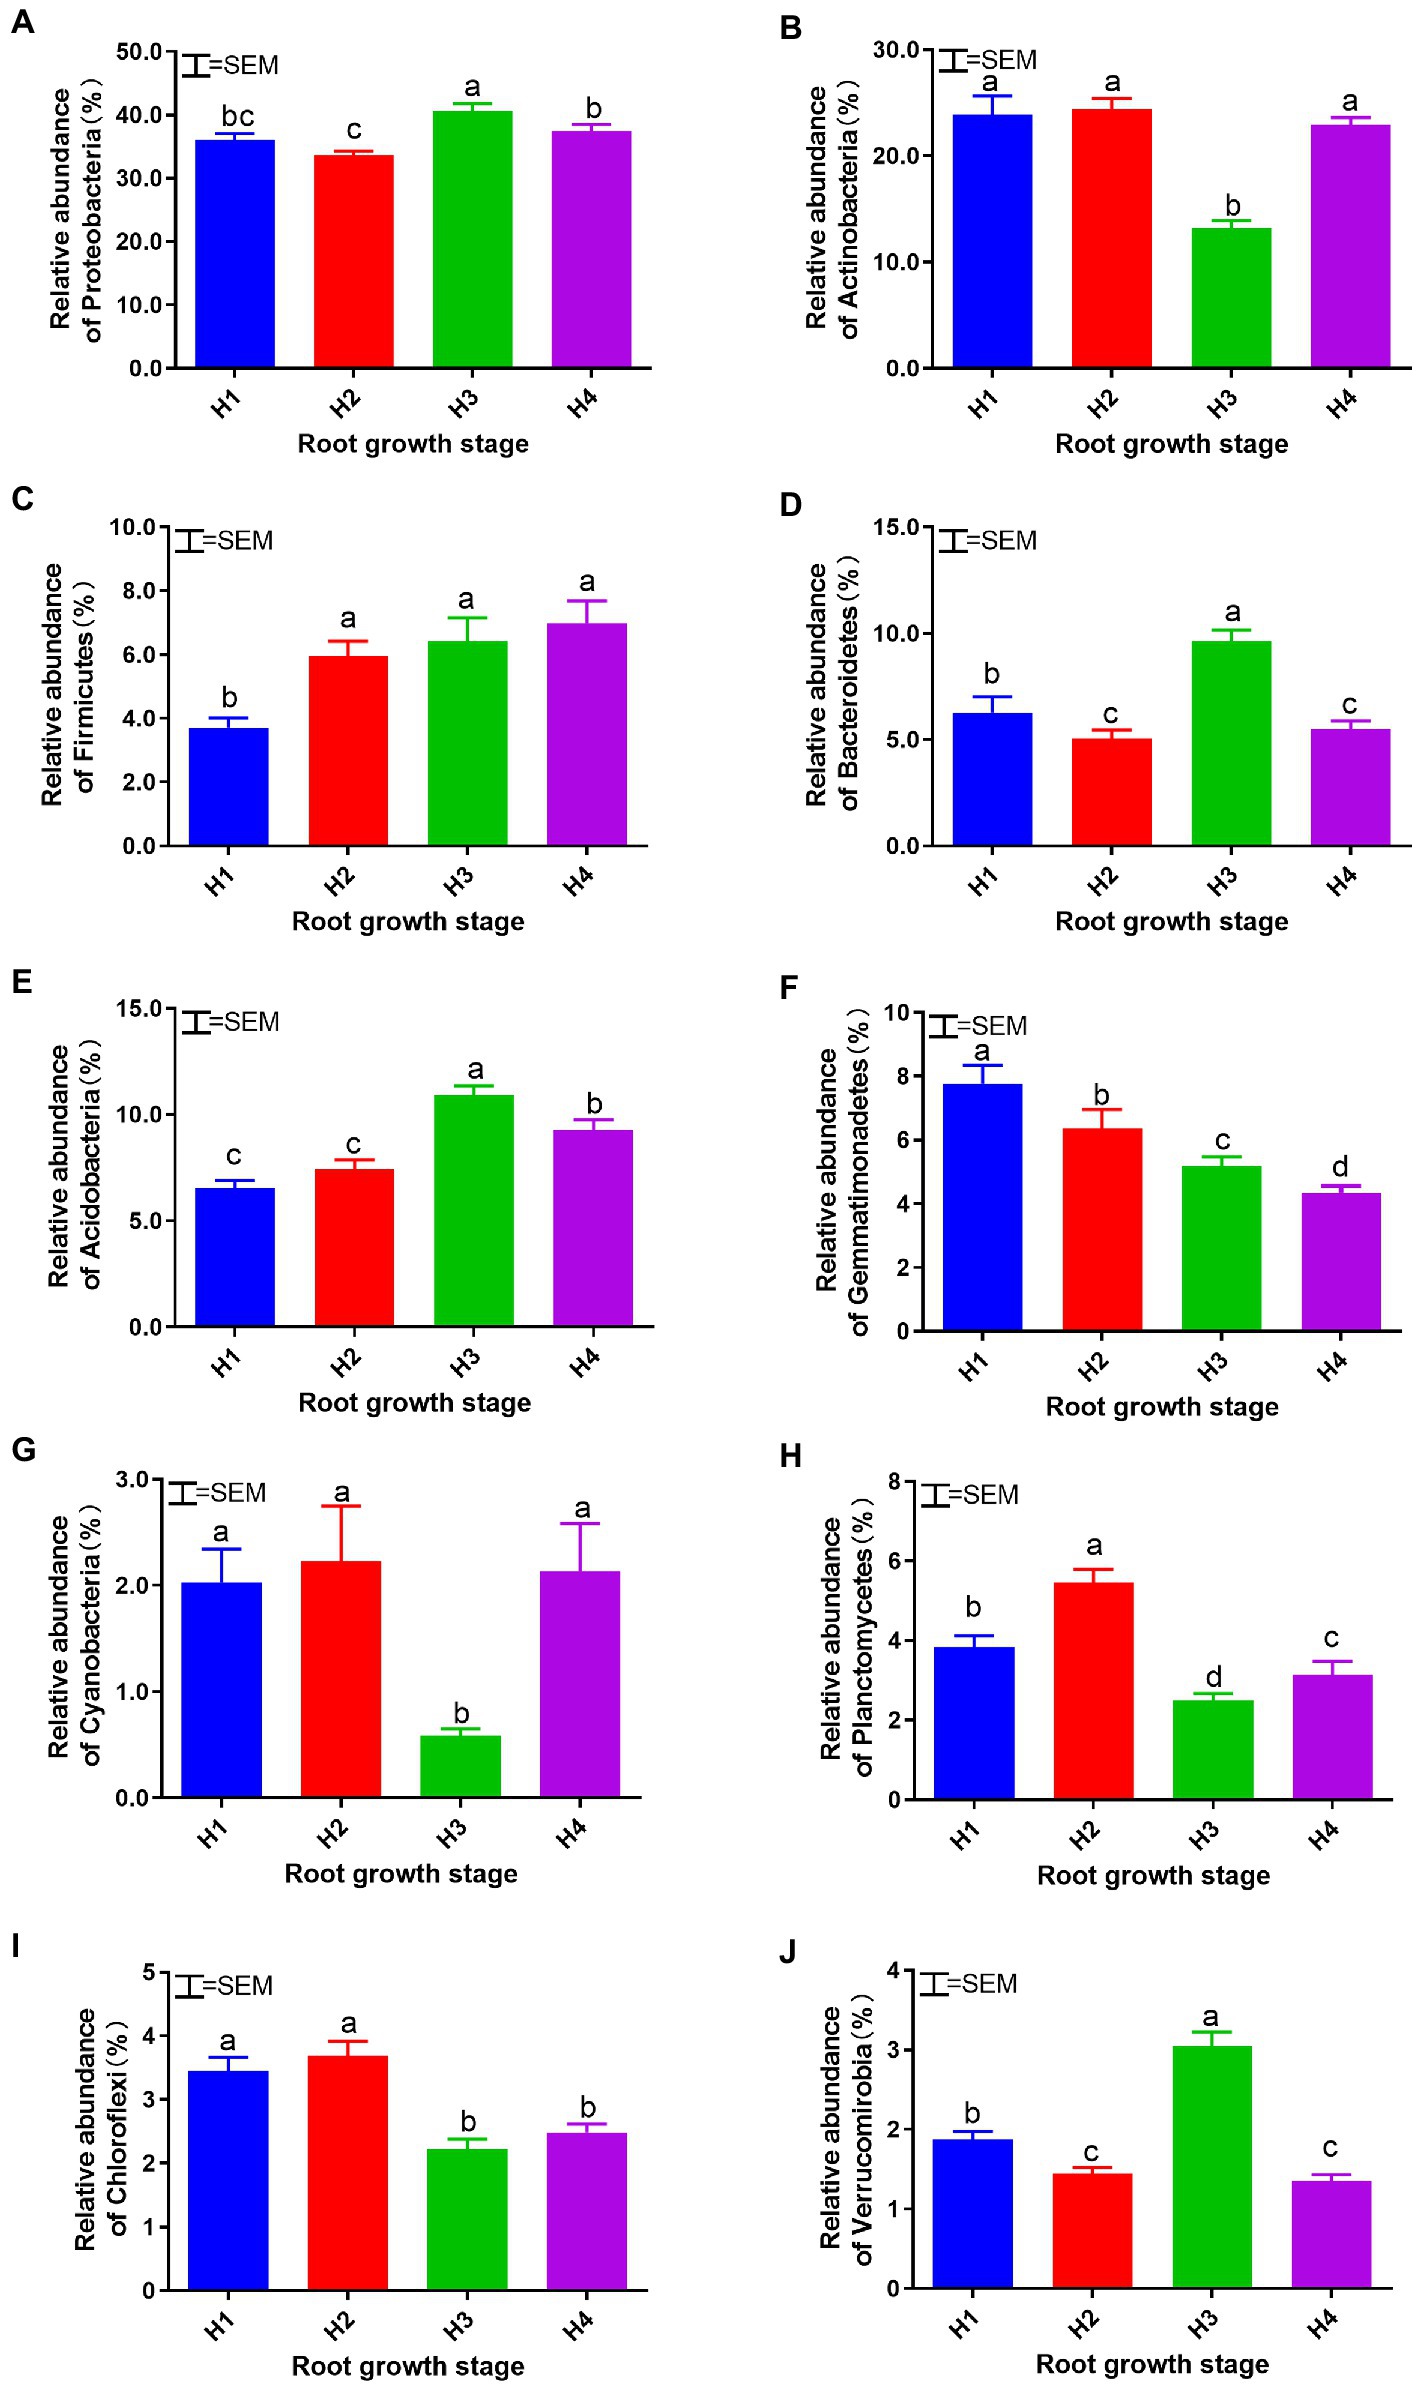
Figure 4. Relative abundance of dominant soil bacterial phyla: Proteobacteria (A), Actinobacteria (B), Firmicutes (C), Bacteroidetes (D), Acidobacteria (E), Gemmatimonadetes (F), Cyanobacteria (G), Planctomycetes (H), Chloroflexi (I), and Verrucomicrobia (J) at root growth stages H1–4. H1–4, root growth stages of mixed forage: January 4 (H1), March 14 (H2), April 21 (H3), and May 19 (H4). SEM, standard error of the mean (n = 18). Means with difference superscripts differ significantly (p < 0.05).
Linear discriminant analysis effect size and PCoA analyses are shown in Figure 5. A total of 29 biomarkers were identified to distinguish the four root growth stages. The PCoA analysis showed that soil samples from H1, H2, and H4 were clustered together but were significantly separated from the H3 samples; the bacterial diversity of H3 therefore differed significantly from that at other stages. At the class level, the relative abundances of Sphingobacteria, Betaproteobacteria, and Gammaproteobacteria in soil was higher at H3 stage than those of other stages. The order level for Sphingomonadales, Sphingobacteriales, and Burkholderiales and at the family level for Chitinophagaceae and Sphingomonadaceae showed the same trend toward higher.
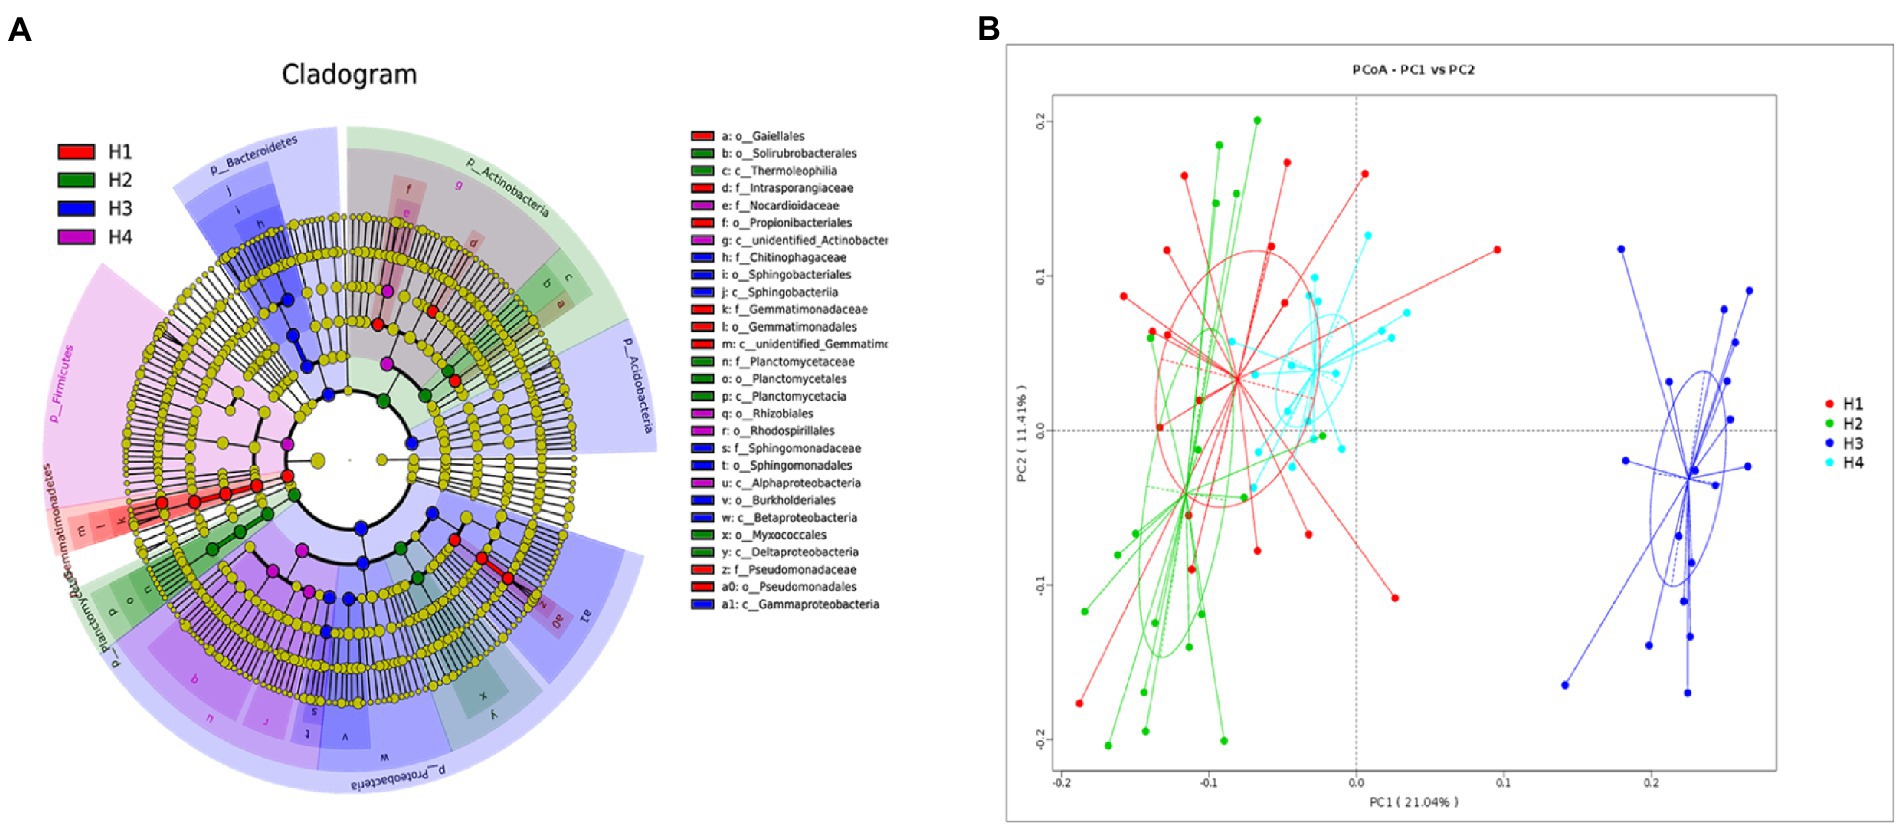
Figure 5. Evolutionary branch diagram of various soil bacterial species (A) and principal coordinate analysis (PCoA) of soil bacterial community structure (B). H1–4, root growth stages of mixed forage: January 4 (H1), March 14 (H2), April 21 (H3), and May 19 (H4).
4. Discussion
Inclusion of legume forage is a potential strategy for enhancing carbon and nitrogen resources while sustaining soil health in the annual grass–legume forage systems of southern China (Lu et al., 2017, 2018). Here, we demonstrate that this practice can affect soil properties and the composition of the soil bacterial community. The two most abundant phyla detected in the present study were Proteobacteria (relative abundance 0.29–0.54) and Actinobacteria (0.08–0.36). Similar results were obtained by Ding et al. (2016), who reported that Proteobacteria (0.29–0.33) was the predominant phylum in agricultural soils of northeast China, followed by Acidobacteria (0.12–0.16) and Actinobacteria (0.09–0.11). Proteobacteria and Actinobacteria are considered to be the dominant bacterial taxa that influence grass–legume intercropping systems, and they have important roles in maintaining soil ecosystem function (Zhao, 2020). Many of these microbes have roles in nutrient cycling: Xanthobacteraceae in carbon cycling; Sphingomonadaceae, Rhizobiales, and Myxococcales in nitrogen cycling; and Actinomycetales in phosphorus utilization. Proteobacteria, including many nitrogen-fixing bacteria, can grow rapidly when labile substrates are available, and their abundance is generally positively correlated with soil carbon and nitrogen contents (Spain et al., 2009; Goldfarb et al., 2011; Zhang et al., 2016). Actinobacteria constitute the predominant phylum in many soil bacterial communities; they are generally considered to be remarkable decomposers of plant biomass and can survive under stress by secondary metabolism of filamentous mycelial growth (Priyadharsini and Dhanasekaran, 2015).
In the present study, changes in root characteristics as plants matured might have affected bacterial community composition and structure in the annual grass–legume production system. The Chao 1 and ACE richness indices were lower at the H2 and H3 stages, suggesting that an increase in harvesting frequency might disturb the evenness of the bacterial community. As expected, PCoA demonstrated that H3 samples tended to cluster together with high similarity, whereas samples from H1, H2, and H4 all grouped together. Correspondingly, more abundant root growth and marked changes in the dominant bacterial phyla were also observed at the H3 stage. These changes may be explained by changes in soil enzymatic properties and root characteristics over the course of the experimental period. Input of organic matter via roots and aboveground litter leads to accumulation of soil organic carbon and changes in available nitrogen and phosphorus contents that can shift aspects of the soil bacterial community (Mikkonen et al., 2011). In return, the soil bacterial community itself can serve as a dynamic indicator of soil quality, as it is sensitive to changes in soil function and aboveground plant composition (Hedlund, 2002).
The available soil nutrient contents did not vary significantly among different maturity stages in this study. However, it is not sufficient to assess soil fertility based on physical and chemical properties alone. Measurement of microbial and enzymatic indicators in the soil can provide a more complete understanding of the transformations that are taking place and affecting soil fertility and nutrient capacity (Wolna-Maruwka et al., 2018). In the present study, soil enzyme activities varied markedly among plant maturity stages, especially for enzymes associated with the nitrogen cycle. Protease and urease activities have been shown to be the most sensitive indicators of nitrogen transformation in soil (Wolna-Maruwka et al., 2018). Both urease and protease activities decreased at the H3 stage, implying that nutrient cycling in the soil was slowed. This may have been due to more vigorous root growth during the H3 stage and the increase in root nutrient uptake, as roots can compete with microorganisms for inorganic and small organic nitrogen forms, resulting in a decrease in soil urease and protease activity (Yang et al., 2021). At the same time, nitrate reductase activity was significantly higher at the H3 stage than at other stages, which accelerates the reduction of nitrate to nitrite. Nitrite ions are reduced to nitrous oxide by nitrite reductase, and this process leads to loss of nitrogen from the soil. Zhao (2020) found that the abundance of Actinobacteria was positively correlated with soil health. By contrast, the greater the abundance of Acidobacteria and Verrucomicrobia, the more severe the soil nutrient loss. In our study, marked changes in microbial community structure and enzyme activity were observed together at the H3 stage, suggesting that the lower abundance of Actinobacteria, and higher abundance of Acidobacteria and Verrucomicrobia may be closely related to soil enzyme activity and nutrient conversion capacity. Furthermore, due to the higher abundance of Sphingobacteria, Betaproteobacteria, and Gammaproteobacteria at the class level, higher abundance of Sphingomonadales, Sphingobacteriales and Burkholderiales at the order level, and higher abundance of Chitinophagaceae and Sphingomonadaceae at the family level, the indicator species at H3 stage all have the potential to become the marker of changes in soil enzyme activity and nutrient conversion capacity.
Additional application of nitrogen fertilizer can be an effective means of providing nutrients for soil microorganisms and enhancing soil enzyme activity, microbial biomass and diversity (Yang et al., 2021), but it can also further aggravate nitrate pollution (Szajdak and Gaca, 2010). In terms of sustainable management and agroecology principles for grasslands, the application of nitrogen fertilizer will increase the accumulation of nitrogen in the soil, which might further increase nitrous oxide emissions and exacerbate the greenhouse effect. Therefore, to reduce soil nitrous oxide emissions, it is necessary to optimize fertilization practices and improve nitrogen fertilizer utilization efficiency (Canfield et al., 2010). Studies have shown that nitrous oxide emissions from ammonium sulfate applications are lower than those from urea (Bouwman et al., 2002). The application of polymer-coated nitrogen fertilizer could also significantly reduce soil nitrous oxide emissions (Hyatt et al., 2010). In addition, nitrification inhibitors such as dicyandiamide, 3,4-dimethylpyrazol phosphate and acetylene, which inhibit the production of nitrous oxide during nitrification and denitrification by soil microorganisms, can also be considered to be applicated in the H3 stage (Menéndez et al., 2012; Akiyama et al., 2013).
5. Conclusion
The structure of the microbial community at stage H3 (booting stage of grasses and budding stage of legumes) was dramatically different from that at other stages. Nutrient cycling in the soil appeared to slow at the H3 stage, and increased nitrate reductase activity suggested that the loss of nitrogen would be greater. Measures need to be taken to improve the nitrogen fertilizer utilization efficiency to reduce denitrification and nitrous oxide production at this stage.
Data availability statement
The raw data supporting the conclusions of this article will be made available by the authors, without undue reservation.
Author contributions
WG and SB designed the study. YX, WL, and PL wrote and revised the manuscript. YX, PL, and ED carried out the data analysis. WG, DL, LZ, HS, YZ, QC, and CW performed the experiments. All authors contributed to the article and approved the submitted version.
Funding
This work was supported by the Jiuzhaigou Lake Marshification and River Ecological Restoration Research Project (N5132112022000246) and the National Key R&D Program of China (2021YFD1300300).
Conflict of interest
The authors declare that the research was conducted in the absence of any commercial or financial relationships that could be construed as a potential conflict of interest.
Publisher’s note
All claims expressed in this article are solely those of the authors and do not necessarily represent those of their affiliated organizations, or those of the publisher, the editors and the reviewers. Any product that may be evaluated in this article, or claim that may be made by its manufacturer, is not guaranteed or endorsed by the publisher.
References
Akiyama, H., Morimoto, S., Hayatsu, M., Hayakawa, A., Sudo, S., and Yagi, K. (2013). Nitrification, ammonia-oxidizing communities, and N2O and CH4 fluxes in an imperfectly drained agricultural field fertilized with coated urea with and without dicyandiamide. Biol. Fertil. Soils 49, 213–223. doi: 10.1007/s00374-012-0713-2
Baudoin, E., Benizri, E., and Guckert, A. (2003). Impact of artificial root exudates on the bacterial community structure in bulk soil and maize rhizosphere. Soil Biol. Biochem. 35, 1183–1192. doi: 10.1016/S0038-0717(03)00179-2
Bokulich, N. A., Subramanian, S., Faith, J. J., Gevers, D., Gordon, J. I., Knight, R., et al. (2013). Quality-filtering vastly improves diversity estimates from Illumina amplicon sequencing. Nat. Methods 10, 57–59. doi: 10.1038/nmeth.2276
Bouwman, A. F., Boumans, L. J. M., and Batjes, N. H. (2002). Emissions of N2O and NO from fertilized fields: summary of available measurement data. Glob. Biogeochem. Cycles 16, 6–13. doi: 10.1029/2001gb001811
Canfield, D. E., Glazer, A. N., and Falkowski, P. G. (2010). The evolution and future of earth’s nitrogen cycle. Science 330, 192–196. doi: 10.1126/science.1186120
Chávez-Romero, Y., Navarro-Noya, Y. E., Reynoso-Martínez, S. C., Sarria-Guzmán, Y., Govaerts, B., Verhulst, N., et al. (2016). 16S metagenomics reveals changes in the soil bacterial community driven by soil organic C, N-fertilizer and tillage-crop residue management. Soil Tillage Res. 159, 1–8. doi: 10.1016/j.still.2016.01.007
Chen, M., Chen, B., and Marschner, P. (2008). Plant growth and soil microbial community structure of legumes and grasses grown in monoculture or mixture. J. Environ. Sci. 20, 1231–1237. doi: 10.1016/S1001-0742(08)62214-7
DeSantis, T. Z., Hugenholtz, P., Larsen, N., Rojas, M., Brodie, E. L., Keller, K., et al. (2006). Greengenes, a chimera-checked 16S rRNA gene database and workbench compatible with ARB. Appl. Environ. Microbiol. 72, 5069–5072. doi: 10.1128/AEM.03006-05
Ding, J., Jiang, X., Ma, M., Zhou, B., Guan, D., Zhao, B., et al. (2016). Effect of 35 years inorganic fertilizer and manure amendment on structure of bacterial and archaeal communities in black soil of Northeast China. Appl. Soil Ecol. 105, 187–195. doi: 10.1016/j.apsoil.2016.04.010
Edgar, R. C. (2004). MUSCLE: multiple sequence alignment with high accuracy and high throughput. Nucleic Acids Res. 32, 1792–1797. doi: 10.1093/nar/gkh340
Edgar, R. C. (2013). UPARSE: highly accurate OTU sequences from microbial amplicon reads. Nat. Methods 10, 996–998. doi: 10.1038/nmeth.2604
Fierer, N., Bradford, M. A., and Jackson, R. B. (2007). Toward an ecological classification of soil bacteria. Ecology 88, 1354–1364. doi: 10.1890/05-1839
Gans, J., Wolinsky, M., and Dunbar, J. (2005). Computational improvements reveal great bacterial diversity and high metal toxicity in soil. Science 309, 1387–1390. doi: 10.1126/science.1112665
Gardi, C., Jeffery, S., and Saltelli, A. (2013). An estimate of potential threats levels to soil biodiversity in EU. Glob. Chang. Biol. 19, 1538–1548. doi: 10.1111/gcb.12159
Goldfarb, K. C., Karaoz, U., Hanson, C. A., Santee, C. A., Bradford, M. A., Treseder, K. K., et al. (2011). Differential growth responses of soil bacterial taxa to carbon substrates of varying chemical recalcitrance. Front. Microbiol. 2:94. doi: 10.3389/fmicb.2011.00094
Hedlund, K. (2002). Soil microbial community structure in relation to vegetation management on former agricultural land. Soil Biol. Biochem. 34, 1299–1307. doi: 10.1016/S0038-0717(02)00073-1
Hyatt, C. R., Venterea, R. T., Rosen, C. J., McNearney, M., Wilson, M. L., and Dolan, M. S. (2010). Polymer-coated urea maintains potato yields and reduces nitrous oxide emissions in a Minnesota loamy sand. Soil Sci. Soc. Am. J. 74, 419–428. doi: 10.2136/sssaj2009.0126
Kong, X., Zhang, F., Wei, Q., Xu, Y., and Hui, J. (2006). Influence of land use change on soil nutrients in an intensive agricultural region of North China. Soil Tillage Res. 88, 85–94. doi: 10.1016/j.still.2005.04.010
Lal, R. (2009). Soils and world food security. Soil Tillage Res. 102, 1–4. doi: 10.1016/j.still.2008.08.001
Leloup, J., Baude, M., Nunan, N., Meriguet, J., Dajoz, I., le Roux, X., et al. (2018). Unravelling the effects of plant species diversity and aboveground litter input on soil bacterial communities. Geoderma 317, 1–7. doi: 10.1016/j.geoderma.2017.12.018
Lemanceau, P., Creamer, R., and Griffiths, B. S. (2016). Soil biodiversity and ecosystem functions across Europe: a transect covering variations in bio-geographical zones, land use and soil properties. Appl. Soil Ecol. 97, 1–2. doi: 10.1016/j.apsoil.2015.07.017
Li, X., Rui, J., Mao, Y., Yannarell, A., and Mackie, R. (2014). Dynamics of the bacterial community structure in the rhizosphere of a maize cultivar. Soil Biol. Biochem. 68, 392–401. doi: 10.1016/j.soilbio.2013.10.017
Lu, R. (1999). Soil Agricultural Chemical Analysis Method. Beijing: Chinese Agriculture and Sciences Press.
Lu, X., Ji, S., Hou, C., Qu, H., Li, P., and Shen, Y. (2018). Impact of root C and N reserves on shoot regrowth of defoliated alfalfa cultivars differing in fall dormancy. Grassl. Sci. 64, 83–90. doi: 10.1111/grs.12190
Lu, X., Ji, S., Hou, C., and Shen, Y. (2017). Morphological development and dry weight distribution of alfalfa cultivars varying in fall dormancy under a short-term cultivation system. Grassl. Sci. 63, 23–28. doi: 10.1111/grs.12139
Lupwayi, N. Z., May, W. E., Kanashiro, D. A., and Petri, R. M. (2018). Soil bacterial community responses to black medic cover crop and fertilizer N under no-till. Appl. Soil Ecol. 124, 95–103. doi: 10.1016/j.apsoil.2017.11.003
Magoč, T., and Salzberg, S. L. (2011). FLASH: fast length adjustment of short reads to improve genome assemblies. Bioinformatics 27, 2957–2963. doi: 10.1093/bioinformatics/btr507
Menéndez, S., Barrena, I., Setien, I., González-Murua, C., and Estavillo, J. M. (2012). Efficiency of nitrification inhibitor DMPP to reduce nitrous oxide emissions under different temperature and moisture conditions. Soil Biol. Biochem. 53, 82–89. doi: 10.1016/j.soilbio.2012.04.026
Mikkonen, A., Kondo, E., Lappi, K., Wallenius, K., Lindström, K., Hartikainen, H., et al. (2011). Contaminant and plant-derived changes in soil chemical and microbiological indicators during fuel oil rhizoremediation with Galega orientalis. Geoderma 160, 336–346. doi: 10.1016/j.geoderma.2010.10.001
Priyadharsini, P., and Dhanasekaran, D. (2015). Diversity of soil Allelopathic Actinobacteria in Tiruchirappalli district, Tamilnadu. J. Saudi Soc. Agric. Sci. 14, 54–60. doi: 10.1016/j.jssas.2013.07.001
Segata, N., Izard, J., Waldron, L., Gevers, D., Miropolsky, L., Garrett, W., et al. (2011). Metagenomic biomarker discovery and explanation. Genome Biol. 12:R60. doi: 10.1186/gb-2011-12-6-r60
Sengupta, A., and Dick, W. A. (2015). Bacterial community diversity in soil under two tillage practices as determined by pyrosequencing. Microb. Ecol. 70, 853–859. doi: 10.1007/s00248-015-0609-4
Spain, A. M., Krumholz, L. R., and Elshahed, M. S. (2009). Abundance, composition, diversity and novelty of soil Proteobacteria. ISME J. 3, 992–1000. doi: 10.1038/ismej.2009.43
Szajdak, L. W., and Gaca, W. (2010). Nitrate reductase activity in soil under shelterbelt and an adjoining cultivated field. Chem. Ecol. 26, 123–134. doi: 10.1080/02757540.2010.501028
Wolna-Maruwka, A., Sulewska, H., Niewiadomska, A., Panasiewicz, K., Borowiak, K., and Ratajczak, K. (2018). The influence of sewage sludge and a consortium of aerobic microorganisms added to the soil under a willow plantation on the biological indicators of transformation of organic nitrogen compounds. Pol. J. Environ. Stud. 27, 403–412. doi: 10.15244/pjoes/74184
Yadav, G. S., Mitran, T., and Meena, B. L. (2018). Legumes for Soil Health and Sustainable Management. Singapore: Springer Singapore
Yang, J., Guo, W., Wang, F., Wang, F., Zhang, L., Zhou, B., et al. (2021). Dynamics and influencing factors of soluble organic nitrogen in paddy soil under different long-term fertilization treatments. Soil Tillage Res. 212:105077. doi: 10.1016/j.still.2021.105077
Yergeau, E., Bokhorst, S., Huiskes, A. H. L., Boschker, H. T. S., Aerts, R., and Kowalchuk, G. A. (2006). Size and structure of bacterial, fungal and nematode communities along an Antarctic environmental gradient. FEMS Microbiol. Ecol. 59, 436–451. doi: 10.1111/j.1574-6941.2006.00200.x
Zeng, Q., An, S., and Liu, Y. (2017). Soil bacterial community response to vegetation succession after fencing in the grassland of China. Sci. Total Environ. 609, 2–10. doi: 10.1016/j.scitotenv.2017.07.102
Zhang, C., Liu, G., Xue, S., and Wang, G. (2016). Soil bacterial community dynamics reflect changes in plant community and soil properties during the secondary succession of abandoned farmland in the loess plateau. Soil Biol. Biochem. 97, 40–49. doi: 10.1016/j.soilbio.2016.02.013
Zhao, Y. (2020). Study on advantage of alfalfa/ gramineae forage intercropping and mechanism of nitrogen efficiency and effect of soil microecological. Dissertation/Doctor’s thesis. Gansu Agricultural University, Lanzhou.
Keywords: soil bacterial community, maturity stage, grass–legume field, root characteristics, enzymatic properties
Citation: Xie Y, Liu W, Li P, Bai S, Li D, Zhang L, Sun H, Zheng Y, Cheng Q, Wang C, Du E and Gou W (2023) Soil bacterial community structure at different plant maturity stages in an annual grass–legume production system. Front. Sustain. Food Syst. 7:1145488. doi: 10.3389/fsufs.2023.1145488
Edited by:
Carmen Carmona, University of Stirling, United KingdomReviewed by:
Xuekai Wang, China Agricultural University, ChinaLinna Guo, Henan University of Technology, China
Copyright © 2023 Xie, Liu, Li, Bai, Li, Zhang, Sun, Zheng, Cheng, Wang, Du and Gou. This is an open-access article distributed under the terms of the Creative Commons Attribution License (CC BY). The use, distribution or reproduction in other forums is permitted, provided the original author(s) and the copyright owner(s) are credited and that the original publication in this journal is cited, in accordance with accepted academic practice. No use, distribution or reproduction is permitted which does not comply with these terms.
*Correspondence: Wenlong Gou, Z3N6MDgwMTE1QDE2My5jb20=
†These authors have contributed equally to this work and share first authorship