 Haoyu Kang
 Dan Dai
 Jian Zheng2,3*
- 1School of Mathematics and Computer Science, Zhejiang Agriculture and Forestry University, Hangzhou, China
- 2College of Food and Health, Zhejiang Agriculture and Forestry University, Hangzhou, China
- 3Key Laboratory of Forestry Perception Technology and Intelligent Equipment of the State Forestry Administration, Hangzhou, China
- 4Zhejiang Key Laboratory of Forestry Intelligent Monitoring and Information Technology Research, Hangzhou, China
- 5Lin'an District Agricultural and Forestry Technology Extension Centre, Hangzhou, China
The hickory (Carya cathayensis) nuts are considered as a traditional nut in Asia due to nutritional components such as phenols and steroids, amino acids and minerals, and especially high levels of unsaturated fatty acids. However, the edible quality of hickory nuts is rapidly deteriorated by oxidative rancidity. Deeper Masked autoencoders (DEEPMAE) with a unique structure for automatically extracting some features that could be scaleable from local to global for image classification, has been considered to be a state-of-the-art computer vision technique for grading tasks. This paper aims to present a novel and accurate method for grading hickory nuts with different oxidation levels. Owing to the use of self-supervised and supervised processes, this method is able to predict images of hickory nuts with different oxidation levels effectively, i.e., DEEPMAE can predict the oxidation level of nuts. The proposed DEEPMAE model was constructed from Vision Transformer (VIT) architecture which was followed by Masked autoencoders(MAE). This model was trained and tested on image datasets containing four classes, and the differences between these classes were mainly caused by varying levels of oxidation over time. The DEEPMAE model was able to achieve an overall classification accuracy of 96.14% on the validation set and 96.42% on the test set. The results on the suggested model demonstrated that the application of the DEEPMAE model might be a promising method for grading hickory nuts with different levels of oxidation.
1. Introduction
There are more than 20 different varieties of walnut. According to FAO (2019), China produces more than half of the world's walnuts. From 2009 to 2019, China's walnut production increased by 11.3% year-on-year to 2,521,504 tons. The Hickory(Carya cathayensis Sarg.) is found mainly in Lin'an District, China. Because of the mountainous and high-altitude climate, hickory thrives in the area naturally. In Lin'an, the hickory plantation covers an area of 40,000 km2, with an annual production of 15,000 tons of hickory nuts. The output value of the whole hickory nuts industry is about 5 billion yuan.
There are a total of 544 kinds of lipids in mature hickory nuts (Huang et al., 2022). Furthermore, a mature hickory nut kernel contains more than 90% unsaturated fatty acids and 70% oil, which is in the top place in all oil-bearing crops (Kurt, 2018; Narayanankutty et al., 2018; Zhenggang et al., 2021). The oxidation of hickory nuts is an inescapable problem and a major contributor to a decline in the quality of the nuts. It is generally accepted that the process of lipid oxidation of nuts proceeds by way of a free radical mechanism called autoxidation (Kubow, 1992; López-Uriarte et al., 2009).
With the oxidation of hickory nuts, a series of changes in color, odor, taste, and other conditions occur. Significantly the kernels of hickory nuts change from light yellow to yellow-brown or brown, the taste gradually becomes lighter and lighter, and a strong rancid smell from the nuts (Jiang et al., 2012). Traditional methods of identifying hickory nuts are mainly manual and electronic nose screening (Pang et al., 2011). On the other hand, the former relies mainly on subjective human experience, which complicates the accuracy of screening and slows down the screening speed. In addition, electronic nose technology can detect the substance content of hickory nuts according to the degree of oxidation and acidity in different storage years (Pang et al., 2019), i.e., hickory nuts with different degrees of oxidation will produce different odors. However, electronic nose technology has a slow response time and requires special equipment, making it difficult to promote in the marketplace. Therefore, accurate identification and fine classification of hickory nuts based on color appearance could contribute to factory production and processing to safeguard consumers' food safety.
In classifying certain agricultural products, shape and color are the two fundamental characteristics. It is common knowledge that the most important distinguishing feature between naturally grown agricultural products is their appearance (Fernández-Vázquez et al., 2011; Rodŕıguez-Pulido et al., 2021). For instance, varied sizes, roundness, lengths, and widths distinguish walnut varieties. These characteristics are the core foundation for classification. In studies about walnuts, it is crucial to use their morphological properties for classification (Ercisli et al., 2012; Chen et al., 2014; Solak and Altinişik, 2018). Various color characteristics on the surfaces of objects are crucial for classification, and they primarily leverage RGB and hyperspectral images to generate. For example, color information in RGB images could generate a one-dimensional signal (Antonelli et al., 2004) or a matrix of signals, yielding excellent classification results for hazelnuts (Giraudo et al., 2018) and maize (Orlandi et al., 2018).
In addition, hyperspectral imaging technology can achieve the same higher level of classification accuracy (Alamprese et al., 2021; Bonifazi et al., 2021). There is also a significant distinction between RGB and hyperspectral data. RGB data contains less information than hyperspectral data. Nevertheless, the former is easier to gain and also widely popular. Although these studies above have delivered successful results in specific applications, mostly, experts manually extracted or specified features. In each of these extracted features, there are both strong and weak features, and if it is difficult to figure out the strong features of a target, it is challenging to produce very successful results.
Deep learning (LeCun et al., 2015) is a field of machine learning that has gained tremendous recognition in computer vision over the past decade. The pervasiveness of deep learning is relatively more advantageous than the above methods. Deep learning methods are mainly multi-layer artificial neural networks (ANN; like high-dimensional abstract functions) constructed by computers. In ANNs, image features can generate feedback signals that help models adjust their parameters. It is until the final ANN model contains critical features that can distinguish differences between images.
Deep learning technology has been used extensively for the classification of agricultural product quality (Ashtiani et al., 2021; Javanmardi et al., 2021; Bernardes et al., 2022; Mukasa et al., 2022). A Convolutional Neural Network (CNN) with a shallow depth was set up to classify four classes of tobacco with a 95% accuracy (Li et al., 2021). Nasiri et al. (2019) employed a modified version of VGG16 to identify dates, achieving an accuracy of 96.98%. Various models were created to classify the maturity of agricultural products from different perspectives (Zhang et al., 2018; Garillos-Manliguez and Chiang, 2021). Moreover, Saranya et al. (2022) was able to differentiate between four different maturity levels of bananas with an accuracy of 96.14%. Because of their shallow architecture, the networks used in the aforementioned applications may not possess the necessary generalization capabilities. Chen et al. (2022b) developed a high-performance classification model based on a 152-layer deep ResNet to identify different types of walnuts. Additionally, due to the capability of deep learning algorithms to automatically extract robust advanced features (Zhang et al., 2019), most studies have not explicitly specified what characteristics those algorithms have learned. In this way, manual feature extraction is more conducive to explanation, such as grading based on the shape, color, and size of strawberries (Liming and Yanchao, 2010). However, Su et al. (2021) was able to successfully utilize the ResNet algorithm to effectively assess the ripeness and quality of strawberries, and noted that pigment-related information is essential for accurate ripeness recognition. Such explanations provide greater insight into the potential of deep learning algorithms. In addition to CNNs, deep learning is also based on VIT is developing rapidly for a variety of applications like the classification of weeds from drone images (Bi et al., 2022; Li X. et al., 2022; Reedha et al., 2022). With the ever-growing number of emerging technologies, applied research in agricultural products is becoming increasingly feasible.
Deep learning algorithm is utilized in this paper to automatically extract the appearance features of hickory nuts, thereby avoiding the shortcomings of traditional methods while achieving more effective results. In addition, deep learning-based classification models are able to process an image in milliseconds (Lu et al., 2022), which is conducive to enhancing the automation of factory production and processing and thus improving the ability to ensure food safety. In this paper, DEEPMAE, a model algorithm based on deep self-supervised (He et al., 2022) and supervised learning is constructed, enabling the identification and distinction between various levels of oxidation and sourness of hickory nuts kernels. The primary contributions of this paper are enumerated as follows:
1. It was demonstrated that the hickory nuts kernels shelled exhibited significant differences in appearance corresponding to different oxidation levels.
2. DEEPMAE combines self-supervised and supervised learning, which are usually considered two different approaches, into a single unified model. And DEEPMAE outperformed the base MAE model in classifying hickory nuts kernels. Furthermore, the DEEPMAE model is lighter. It uses fewer parameters to achieve better results.
3. It was verified that the features learned by DEEPMAE are indeed the color and brightness of the hickory nuts' appearance, which is consistent with changes in the oxidation of nuts at different times, thus demonstrating the practical significance of DEEPMAE. This study can provide some reference value for hickory nuts production and processing.
2. Materials and methods
2.1. Samples
The hickory nuts were harvested from the well-growing and ten-year-old hickory trees in Daoshi Town, China (Lin' an, 118°58'11” E, 30°16'50" N, elevation: 120 m) in September 2021. After harvesting, the nuts were transported to the laboratory and dried in an oven at 40°C for 72 h to maintain their moisture content below 8%.
2.2. Experimental details and preparation
There are several steps in the experiments of this study, and we will describe the preparation and experimental details.
2.2.1. To control experimental conditions
The hickory nuts are physically protected by the intact woody shell, and the lipids oxidize more slowly than they would without the shell. Generally, the nuts were preserved with their shells intact. We stored the nuts with the shells intact but sought to speed up the nuts' lipids' oxidation to reduce the experiment's duration. Prior to this formal experiment, we determined through pre-experiments on small samples that the oxidation rate of hickory nuts at 35°C was within the tolerable range for this experiment, so we decided to place the nuts in a constant temperature and humidity chamber at 35°C and 35% to accelerate the oxidation process. Through time, the lipids within hickory nuts kernels undergo continuous oxidation. In addition, we sampled for the experiment every 30 days.
2.2.2. To acquire RGB images of nuts kernels
Samples of 280 hickory nuts per experiment were taken in this study, and the nuts kernels were separated after the shells were broken by hand. After this, RGB images of the kernels were acquired.
The image acquisition system is composed by placing a smartphone connected to a computer on an experimental stand. The smartphone is mounted horizontally on the experimental stand while keeping the vertical height constant. In addition, we use the computer to control the phone to avoid changes in the angle and position of the phone. In addition, there are two symmetrical 4W lamps to fill in the light. More specifically, the phone was a Xiaomi 6X with LineageOS, the camera software was OpenCamera, the camera parameters were 20 megapixels, the lens aperture was f/1.75, the focal length was 4.07 mm, and the ISO was set to 100.
2.2.3. To measure the physicochemical properties of hickory nuts
Immediately after completing image acquisition, we physically pressed the hickory nuts kernels to obtain the nut oil. Then we measured the oil's peroxide value (POV) and acid value (AV). POVs were determined according to the Chinese standard method GB 5009.227-2016. The peroxide test indicates the rancidity of unsaturated oils, and the POV is the most commonly used value. It measures the extent to which the oil sample has undergone primary oxidation. In addition, the AV is one of the most sensitive indicators of nut spoilage. In this study, AV was measured using the method of the Chinese standard GB 5009.229-2016. Approximately 80 mL of oil was extracted in each experiment. Of this, 36 mL was divided into three replicate experiments for POV measurement, and the remaining oil was divided into three replicate experiments for AV measurement.
2.2.4. Summary of preparations
This experiment took four samples with different oxidation times in this paper, resulting in four sets A, B, C, and D, containing 1,090 good hickory nuts. Additionally, 13,000 RGB images of their kernels were also taken. All of them were cropped to 512 × 512 pixels. Then, we randomly chose 9,000 images as the training set, 2,800 as the validation set and the remaining 1,200 as the test set.
2.3. An algorithm for aggregating image values
The CIELAB color space is expressed as three values: in human vision, the L-value from low to high indicates perceived brightness from black to white, the a-value from negative to positive represents green to red, and the b-value from negative to positive represents from blue to yellow. To investigate the relationship between the features produced by the deep learning model and the visual properties of hickory nut kernels, we did targeted processing of the kernels' RGB images in the CIELAB color space.
The original image I and the image Ig generated (Equation 1) by fully convolutional networks (FCNN) which were almost smoothed are first transformed from RGB to CIELAB (Figure 1). The CIELAB images are split according to the three values. The corresponding values in the CIELAB color space are combined in an “enhancement” operation to convert the CIELAB images back into RGB images. The entire process is almost identical to EdgeFool (Shamsabadi et al., 2020), except for the “enhancement.”
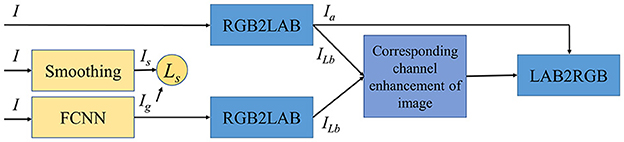
Figure 1. The process of aggregating an image.
Our enhancement method, corresponding channel enhancement of image, is an aggregation algorithm aggregating a set of data closer to a specified value β (Equation 2). In general, the β falls within that range of the set. In addition, the L-value, a-value, and b-value can each be assigned beta values separately. There is the aggregation of L-values(AL*), aggregation of b-values(Ab*), and co-aggregation of L-values and b-values(AL*b*), but no aggregation at the a-value (Figure 2).
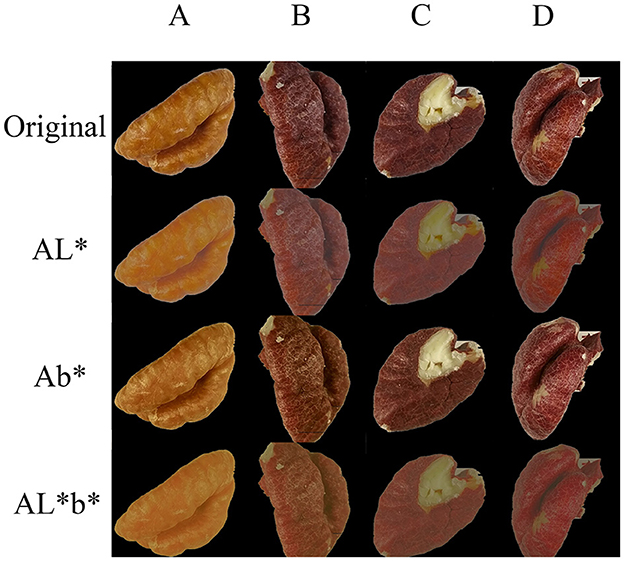
Figure 2. Datasets. The four columns are the four sets of experimental images of hickory nuts kernels, A, B, C, and D; the “Original” row is the acquired original images, AL* is aggregated images from the L* channel, Ab* is aggregated images from the b* channel, and AL*b* is aggregated images from both the L* and b* channels.
2.4. Classification methods
Our final work relies on a deep-learning model for classification. Based on existing research, this study proposes a more effective and improved model, and this section describes the detailed construction of our model.
2.4.1. VIT and MAE
The workflow of Vision Transformer (VIT; Dosovitskiy et al., 2020) firstly requires dividing the original image into several regular non-overlapping blocks and spreading the divided blocks into a sequence, after which the sequence is transmitted into the Transformer Encoder. Finally, the output features of the Transformer Encoder are handed over to the fully connected layer for classification.
Masked autoencoders (MAE; He et al., 2022) is a self-supervised learning method that infers the original image from local features strongly correlated with global information. MAE's Decoder can reconstruct the same number of features as the original image blocks, thereby reconstructing a complete image from a partial image. When applied to downstream classification tasks, the MAE can split the trained Encoder and Decoder and use only the features extracted by the Encoder for classification. That is similar to the process of a standard VIT for image classification. Compared to VIT, MAE uses only part of the image data for the classification task, which can significantly reduce computational effort. In addition, MAE's Decoder can reconstruct the original image from partial features, which also can represent feature information in the association.
2.4.2. Re-attention
The MAE is mainly stacked by the Multi-Head Self-Attention (MHSA; Equation 3) module in the vanilla VIT. However, the structure based on the Transformer does not obtain better results by simply stacking it like the convolutional networks (CNN) structure. Instead, it quickly sinks into saturation at deeper levels. That is called attention collapse (Zhou et al., 2021). Re-attention (Equation 4) could replace the MHSA module in the VIT and regenerate the attention maps to establish cross-head communication in a learnable way. Θ is multiplied by the self-attention map along the head dimension. Re-attention exploits the interactions between the different attention heads to collect complementary information, regenerating the attention graph at a small computational cost but better enhancing the features' diversity between the layers. It stands to reason that the proposed DeepVIT (Zhou et al., 2021) model using the Re-attention mechanism also achieves excellent performance on classification tasks.
2.4.3. DEEPMAE
This paper proposes the DEEPMAE model with MAE and DeepVIT as the backbone (Figure 3). Firstly, unlike VIT, MAE and DeepVIT, the blocks sequence input to DEEPMAE is not from the original image but is composed of low-level features extracted from the original image by convolutional operations. Secondly, we introduce Re-attention into MAE, reduce the MAE model width, and increase its depth to achieve a deeper stacking of the Transformer to obtain a more vigorous representation of some of the blocks, which can reduce the computational effort while avoiding attention collapse. In addition, unlike MAE, which uses only the trained parameters of the Encoder when processing classification tasks, our DEEPMAE always retains both Encoder and Decoder and combines the reconstruction of image features and classification into one complete model. The reconstruction is a self-supervised learning. It is done by comparing the output features of the Decoder with the original features and trying to make them as similar as possible. The classification is a supervised learning. Eventually, the complete structure of DEEPMAE contains both self-supervised and supervised processes.
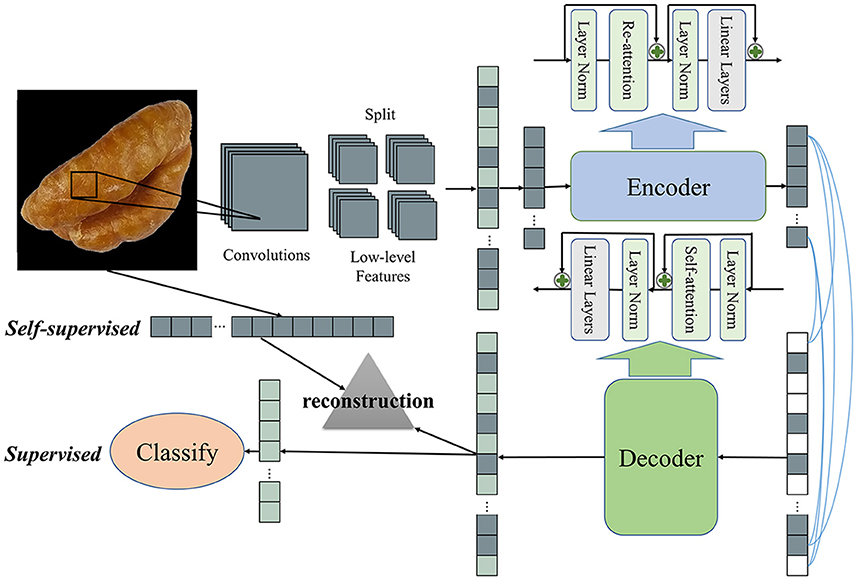
Figure 3. The architecture of DEEPMAE.
The blocks sequences for MAE, VIT, and DeepVIT are derived from the original images. This approach starts by slicing an original image horizontally and vertically and spreading blocks sliced sequentially into a patch embedding blocks sequence. By default, a patch, also a block, is 16 × 16 pixels, implemented by a convolutional kernel and a step size of 16. That results in many convolutional parameters and a high degree of randomness. The process of slicing also results in large random matrices, which somehow affects the stability of the patch embedding and, thus, the instability of the Transformer (Xiao et al., 2021). Before that, VGG (Simonyan and Zisserman, 2014) compared the perceptual fields of small kernels of CNNs with big kernels. They found that multi-layers successive small kernels and single-layer big kernels were similar. So VGG replaced the large convolutional kernels by stacking multiple layers of 3 × 3 small convolutional operations, and 3 × 3 small convolutional kernels also dominated the CNNs after that (Simonyan and Zisserman, 2014; Iandola et al., 2016; Howard et al., 2019; Tan and Le QV, 2020). In addition to stability, the Transformer model has properties for global attention computation. However, it lacks some inductive biases inherent to CNNs, such as translation equivariance and locality (Han et al., 2020). The Transformer model, therefore, lacks some local features from earlier layers compared to the CNNs. Therefore, we change the patch embedding of DEEPMAE to an operation with multiple small convolutional kernels and convert the low-level features of the acquired images into patches, similar to the Image-to-Tokens module (Yuan et al., 2021). In MAE, the input to the Encoder is a subset of patches, and our DEEPMAE does the same thing, using only a subset of patches composed of low-level image features as input to the Encoder. Finally, because images are inherently strong positional relativities, DEEPMAE uses a two-dimensional fixed sine-cosine to encode the position of the spreading patches.
DEEPMAE as a whole also consists mainly of two parts, an Encoder and a Decoder, but the classifier is added after the Decoder to make up the whole. The Encoder part is composed of Transformer blocks composed of Re-attention (RTB). Decoder consists of self-attention Transformer blocks (STB). It is clear that Encoder and Decoder are asymmetrical in terms of both width and depth. In addition, the classifier does not use all the information from Decoder's output; it relies only on some of the features reconstructed by the Decoder to make its classification decisions.
2.5. Performance evaluation
A confusion matrix (Karl Pearson, 1904) is a performance measurement technique for classification problems. It's a contingency table which contains True Positives (TP), True Negatives (TN), False Positives (FP), and False Negatives (FN) of a model's predictions. DEEPMAE's primary responsibility is classification. The classification indicators used are accuracy (Equation 5), kappa coefficient (Equation 6; Cohen, 1960), precision (Equation 7), recall (Equation 8), specificity (Equation 9), and F1 Score (Equation 10) (Labatut and Cherifi, 2012; Giraudo et al., 2018; Alamprese et al., 2021; Chen et al., 2022a; Saranya et al., 2022) in this paper.
In addition, the reconstruction of image features by Decoder is a critical component of DEEPMAE. We use the Multi-scale Structural Similarity Index (MS-SSIM; Wang et al., 2003), the Erreur Relative Globale Adimensionnelle de Synthèse (ERGAS; Wald, 2000), and Visual Information Fidelity (VIF; Sheikh and Bovik, 2004) to measure the goodness of the reconstructed features. MS-SSIM is a multi-scale structural similarity method that considers the variation in observation conditions and provides a reliable approximation of perceived image quality. VIF is an image information metric that quantifies the fidelity of image information.
3. Results
3.1. Lipid oxidation analysis for four samples
The quality of the oil extracted from hickory nuts was used to assess the physiological quality of the samples. The samples showed different POVs and AVs after different times of oxidation (Figure 4).
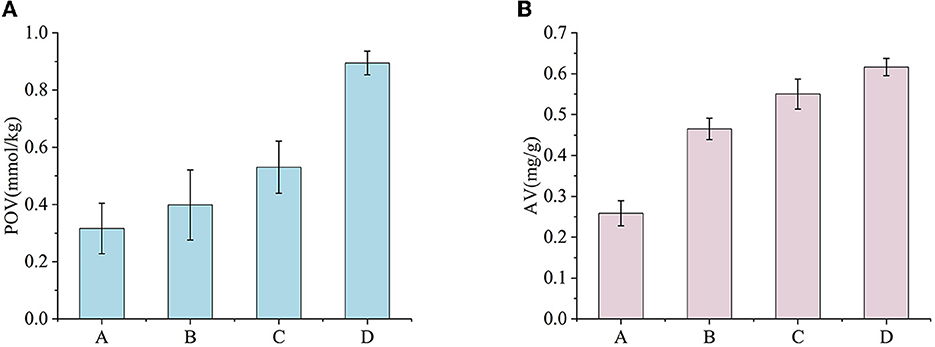
Figure 4. POVs and AVs for four experiments. (A) POVs. (B) AVs.
POV is an indicative indicator of the quality of oils and fats (Beyhan et al., 2017). At 35°C and 35% relative humidity, the POVs measured in four samples, A, B, C, and D, increased gradually with storage time. Samples A and B showed a slow increase in POVs, while experiment C exhibited a faster increment. Over the course of the four samples, the POVs consistently increased, demonstrating that the hickory nut oil was undergoing continuous oxidation.
The AV reflects the degree of fat hydrolysis and rancidity by indicating the oil's dissociative fat mass concentration level (Chatrabnous et al., 2018). The results of the four samples, measured based on differences in the time dimension of the hickory nuts, showed a significant upward trend. In samples A and B, the AVs of samples accumulated more rapidly, while in the later experiments, the AVs accumulated more slowly. Eventually, the AV in samples D exceeded 0.6 mg/g, doubling the value of samples A. The increase in AVs during the storage of hickory nuts is due to the enzymatic hydrolysis of lipids, which can adversely affect the hickory nuts.
The POVs and AVs of the hickory nut oils in the four samples suggest that the degree of oxidative deterioration of the samples was increasing in a sequential manner. This provides an objective basis for further distinguishing between samples with different levels of oxidative degradation.
3.2. Differences of kernels' images for four samples
The data distribution was analyzed after the RGB images were converted to CIELAB images. More importantly, this paper analyzed the relationship between changes in the exterior of hickory nuts kernels and their internal lipid oxidation and rancidity. Ortiz (Ortiz et al., 2019) expressed the L-value as the response to the browning of walnut kernels' exterior. They analyzed the correlation between changes in the exterior of walnut kernels and the rancidity and oxidation process. It is evident that the distribution of L-values and b-values on the appearance of hickory nuts kernels from four samples showed variability (Figure 5). There is a large concentration of L-values around 47 in experiment A, and around 37, 38, and 31 in experiments B, C, and D, respectively. First, looking at the distribution of L-values (Figure 5A), there is much crossover between experiments B and C. Even the mean brightness of C is slightly higher than B. However, the changes in L-values of the four experiments show an overall trend of gradual decrease. Four experiments also scored around 40, 24, 20 and 18 for the b-value.
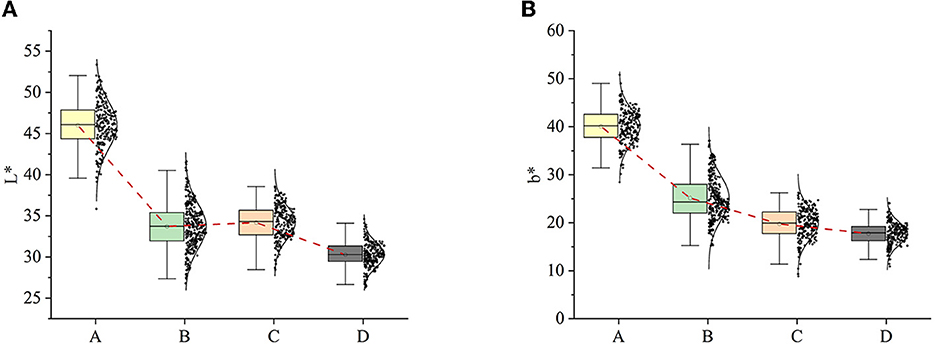
Figure 5. L-values and b-values distribution of original images. (A) L-value distribution; (B) b-value distribution.
Taking experiment A as the benchmark, by observing the distribution of the L-value and b-value, it can be found that the changes in the brightness and chromaticity of the appearance of hickory nuts kernels show an uneven state of being larger first and then smaller. In the latter part of the samples, the human eye's differentiation advantage is significantly weakened. That means it will not even be possible to directly distinguish the differences between the appearance of kernels with the naked eye. This unevenness of variation is explained by Yang et al. (2022). The leading causes of pecans browning are membrane peroxidation and enzymatic browning catalyzed by polyphenol oxidase. Throughout the post-harvest storage period, hickory nuts maintained their antioxidant capacity, and the rate of browning was fastest in the early stages of storage, after which the rate of browning changed gradually and gently.
The results above indicate that there was some extent of correlation between the changes in the intrinsic oxidative rancidity of the hickory nuts and the changes in the appearance of kernels. For the same batch of hickory nuts, as the oxidation of their internal oils proceeded, the intrinsic quality of nuts would change, manifested in kernels' appearance as a decrease in L-value and a deviation from yellow in b-value. That also effectively supported the subsequent differentiation of different oxidized and acidified kernels by image features.
3.3. Classification results
Based on the above Analysis, we also need to classify the images of hickory nuts kernels to infer the internal quality from the appearance of kernels.
3.3.1. General configuration
In this paper, the main optimization points of DEEPMAE based on its backbone model were previously mentioned. Ablation experiments are then conducted in order to evaluate the efficacy of the model at the three points specified.
1. A sequence consisting of blocks of low-level features extracted by a convolution operation to replace the original 16 × 16-pixel-sized image blocks sequence in the backbone.
2. The most critical point in MAE is using partial images to extract features, reducing the application's computational effort. DEEPMAE also retains this feature, but because the low-level features of the images are not as redundant as the original images, DEEPMAE will have a different input scale for the Encoder than MAE, and we compare three mask ratios.
3. DEEPMAE incorporates both self-supervised and supervised learning and has an Encoder and Decoder. The Decoder, a self-supervised operation, could reconstruct the image features. That is very different from the inference process in MAE, so we want to verify the role of the Decoder in the classification process.
After establishing the core structure of DEEPMAE, some CNN models were introduced and compared to Transformer models and DEEPMAE model, and their classification effects were evaluated. The common CNNs are AlexNet (Krizhevsky et al., 2017), VGG19 (Simonyan and Zisserman, 2014), SequeezeNet (Iandola et al., 2016), MobileNetV3 (Howard et al., 2019), and EfficientNet (Tan and Le QV, 2020), respectively, and the Transformer modes are the backbones of DEEPMAE, mainly VIT (Dosovitskiy et al., 2020) and MAE (He et al., 2022). CNNs are all implemented by calling PyTorch's torchvision official interface to implement. In addition, the learning rate, optimizer, data augmentation, and other controllable hyperparameters are kept consistent across models. Training is done in the same environment for each model (Table 1).
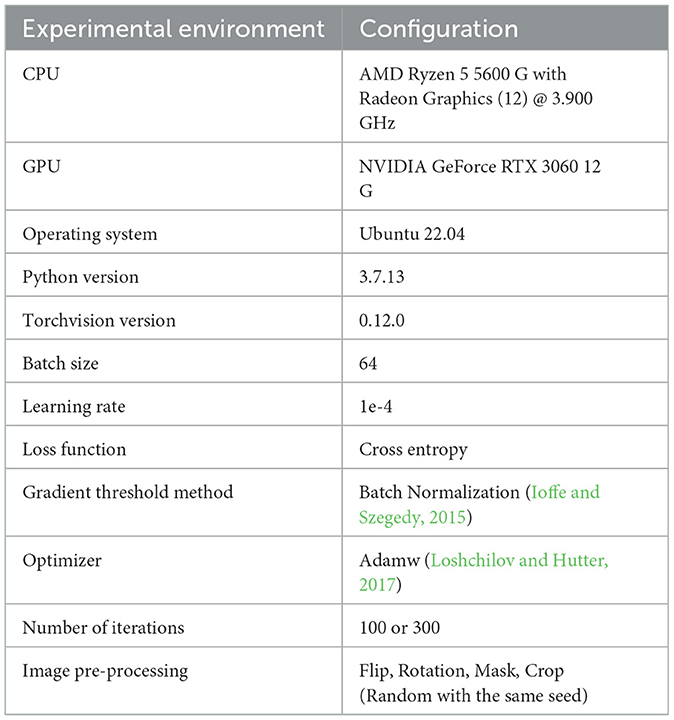
Table 1. Experimental environment configuration.
3.3.2. DEEPMAE: Low-level features and RGB images data
Many researchers are combining convolution blocks and transformer blocks (Guo et al., 2022; Li J. et al., 2022; Liu et al., 2022), not least with changes to the input data. Due to the redundancy of the RGB image, MAE uses the original image blocks as input, but DEEPMAE extracts the low-level features of the image as input. Therefore, this paper will compare the patch embedding composed of the original RGB images with the patch embedding composed of low-level features. Additionally, the size of low-level features is much smaller than that of the original RGB image, which is a characteristic of the convolution operation. In comparison, the MHSA used by the Encoder and Decoder in DEEPMAE does not have to shrink the feature map, and the patterns of the layers are similar, making DEEPMAE easily scalable. Subsequently, four practical structures based on DEEPMAE are constructed for comparison (Table 2).
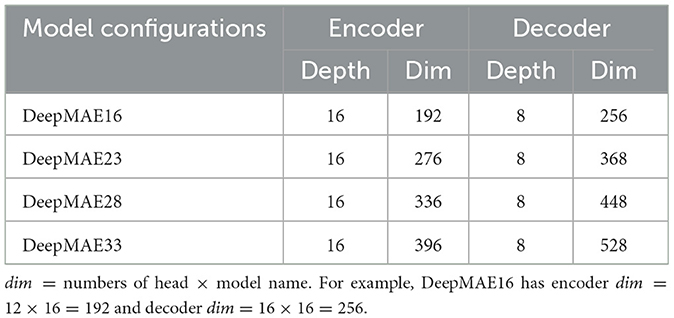
Table 2. Four configurations of the DEEPMAEs.
The number of parameters and classification accuracy of the two types of patches embedding from four different sizes of DEEPMAEs were compared in Table 3. The accuracy improvement was 1.14–1.17% on the validation set and 1.67–2.67% on the test set. For classification, the improvement of low-level features is significant, showing that the Transformer model is very effective after adding the low-level features extracted by convolutional operations.
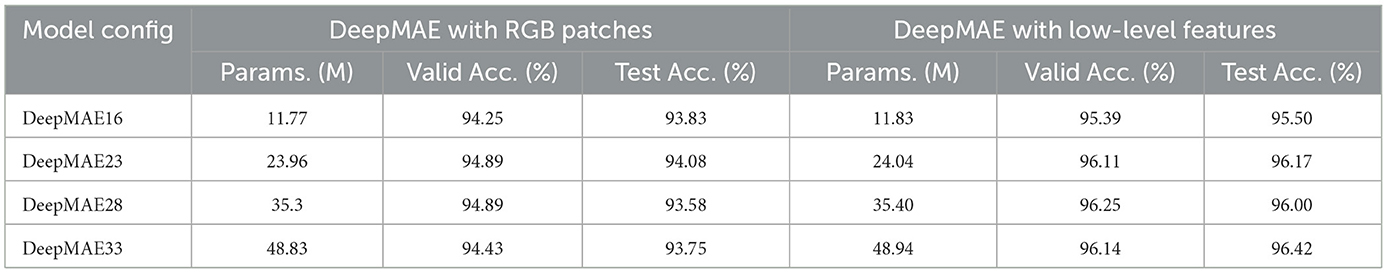
Table 3. Comparison of RGB patches and low-level feature patches on four DEEPMAEs.
3.3.3. DEEPMAE: Mask ratios of input patches
It was mentioned that the original MAE masks a certain percentage of the input patches, which reduces the number of operations and improves the model's inference time. DEEPMAE also absorbs this advantage. However, DEEPMAE's inputs are low-level features with less redundancy than the original images. In addition, DEEPMAE combines the whole process of classification and MAE-like pre-training. DEEPMAE needs to focus on the unmasked part of the image and the masked part. Therefore, the mask ratio of DEEPMAE will be different from that of MAE. We have done further comparison experiments.
The MAE default is 75% masking, i.e., Mask ratio = 0.75. Based on this, we compared mask ratios of 0.25, 0.5, and 0.75 on the DEEPMAE model. In addition, it can also be seen that the DEEPMAE still has an increasing trend (Figure 6B), so the number of training epochs in this section is set to an upper limit of 300.
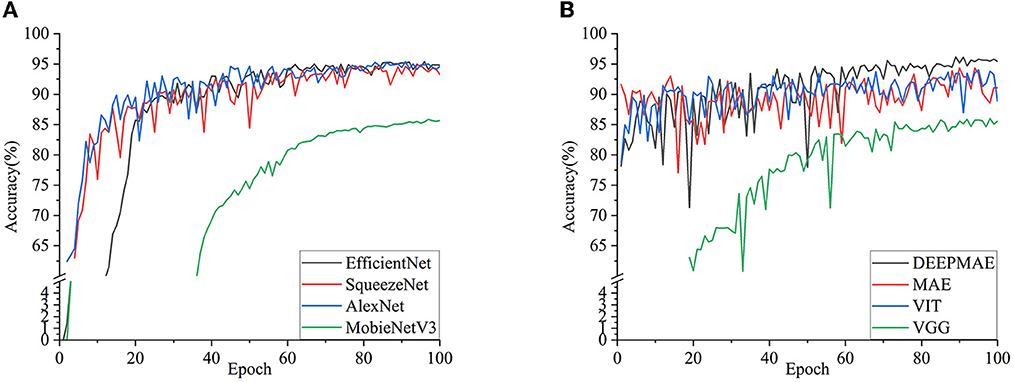
Figure 6. Accuracy of different models on the validation dataset. (A) EfficientNet, SqueezeNet, AlexNet, and MobieNetV3; (B) DEEPMAE, MAE, VIT, and VGG.
The size of the Mask Ratio correlates with the number of features visible in the model, with a larger Mask Ratio giving the model fewer features to learn. As Mask Ratio increases sequentially (Figure 7), it is evident that the overall loss is also higher for the latter than for the former. Looking at the loss of the Decoder reconstructed feature maps, the level of loss decline at approximately the 100th epoch for Mask ratio = 0.5 is equivalent to the loss decline for a total of 300 epochs for Mask ratio=0.75, i.e., the training time for Mask ratio = 0.5 is only one-third of that for Mask ratio = 0.75. That means that the training time for Mask ratio = 0.5 is only one-third of that for Mask ratio = 0.75, while that for Mask ratio = 0.25 is only one-third of 0.5. In classification loss, the loss for a larger mask ratio is significantly higher than for a smaller one. Therefore, a smaller Mask ratio can release more features for DEEPMAE training and achieve better results. Incidentally, our experiments achieved 97% accuracy in about the 240th epoch by deepening the Encoder depth to 32 while using a Mask ratio of 0.25. However, the smaller the Mask ratio, the more hardware, and computational resources are required. Although using a smaller Mask ratio, deepening the network and extending the training time of the model can further improve accuracy, the computational resources required are more than these accuracy improvements. Therefore, to balance the model's performance and effectiveness, a moderate Mask ratio facilitates the implementation of the model. Furthermore, the masking operation has a considerable impact on CNNs. The default Mask ratio for the experiments in this paper is 0.5 unless otherwise stated.
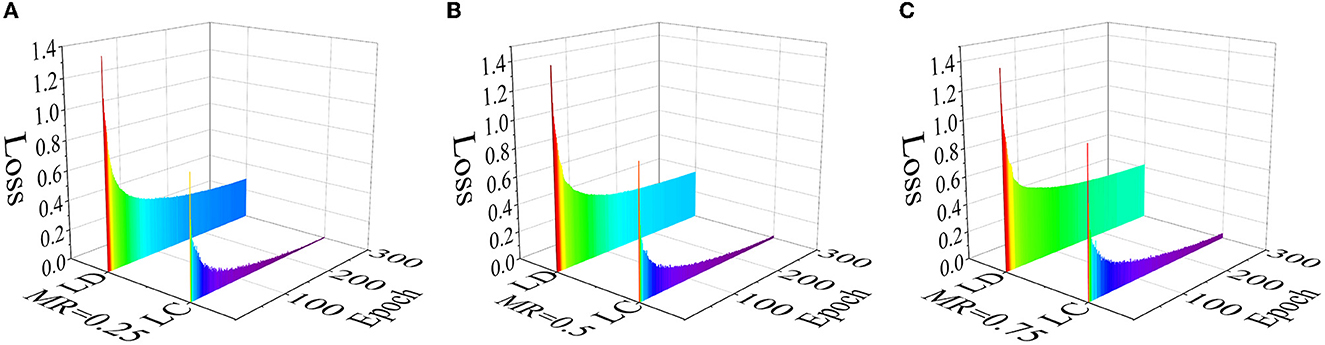
Figure 7. Losses of three mask ratios. Each subgraph contains the loss of the Decoder (LD) to reconstruct image features and the loss of the classification (LC). (A) Mask ratio (MR) = 0.25; (B) Mask ratio (MR) = 0.5; (C) Mask ratio (MR) = 0.75.
3.3.4. DEEPMAE: Decoder for classification
Our DEEPMAE combines the self-supervised approach of image reconstruction used by MAE with the supervised process of classification. However, unlike MAE, which only employs pre-trained Encoder parameters for classification, DEEPMAE also uses Decoder parameters in the classification process to reconstruct some of the features for better classification. Therefore, DEEPMAE's image reconstruction is very closely related to classification. Therefore, we still use the four different sizes DEEPMAEs in Table 2 for comparison to explore the role of the Decoder in reconstructing images. From the performance of the four DEEPMAEs (Table 4), it can be seen that the results of “classification and feature reconstruction” are higher than those of “classification only,” which indicates that the image feature reconstruction of Decoder is also a key factor in DEEPMAE.
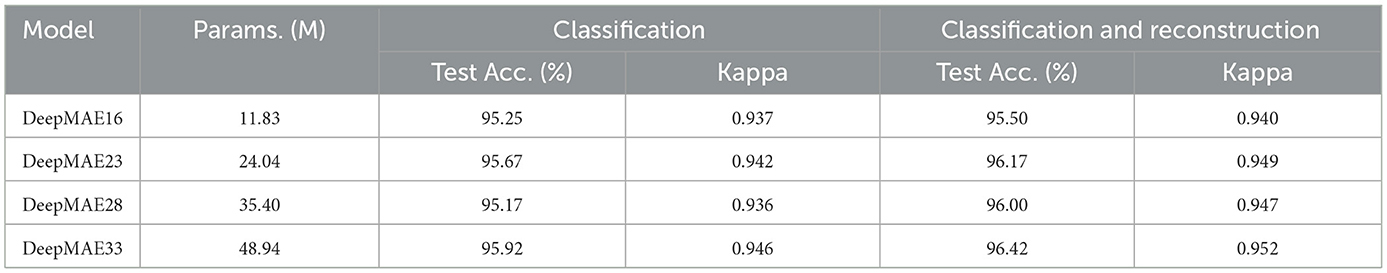
Table 4. Comparison of “classification only” and “classification and feature reconstruction” on four DEEPMAEs.
In addition to the performance on the test set, this paper also measured the Decoder's performance after the image features. From a human visual point of view, the reconstructed feature images differ significantly from the original and appear difficult to understand (Figure 8). Therefore, The quality of the reconstructed feature images is measured using the MS-SSIM, ERGAS, and VIF metrics, and a comparison of these images from the perspective of images is carried out. Comparing the three metrics (Table 5), it is clear that the image features constructed by “classification and feature reconstruction” outperform the “classification only” image features, which is an advantage of the Decoder. That means that considering both “classification” and “image reconstruction” can improve the effect of classification and ensure the effect of “image reconstruction” at the same time. If only classifying, the classification effect is slightly lower, and the quality of the final image features extracted by the Decoder is negatively affected.
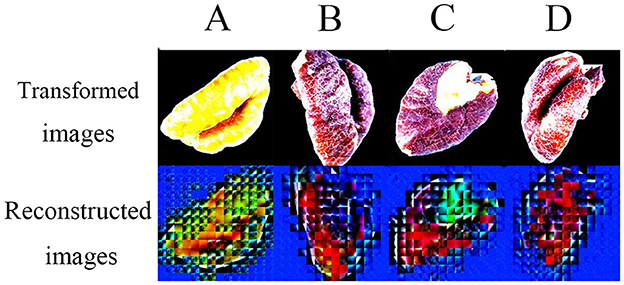
Figure 8. Examples of reconstructed feature images. In addition, image data must be transformed into tensors before being input into a model in PyTorch. The transformed images are from these tensors.
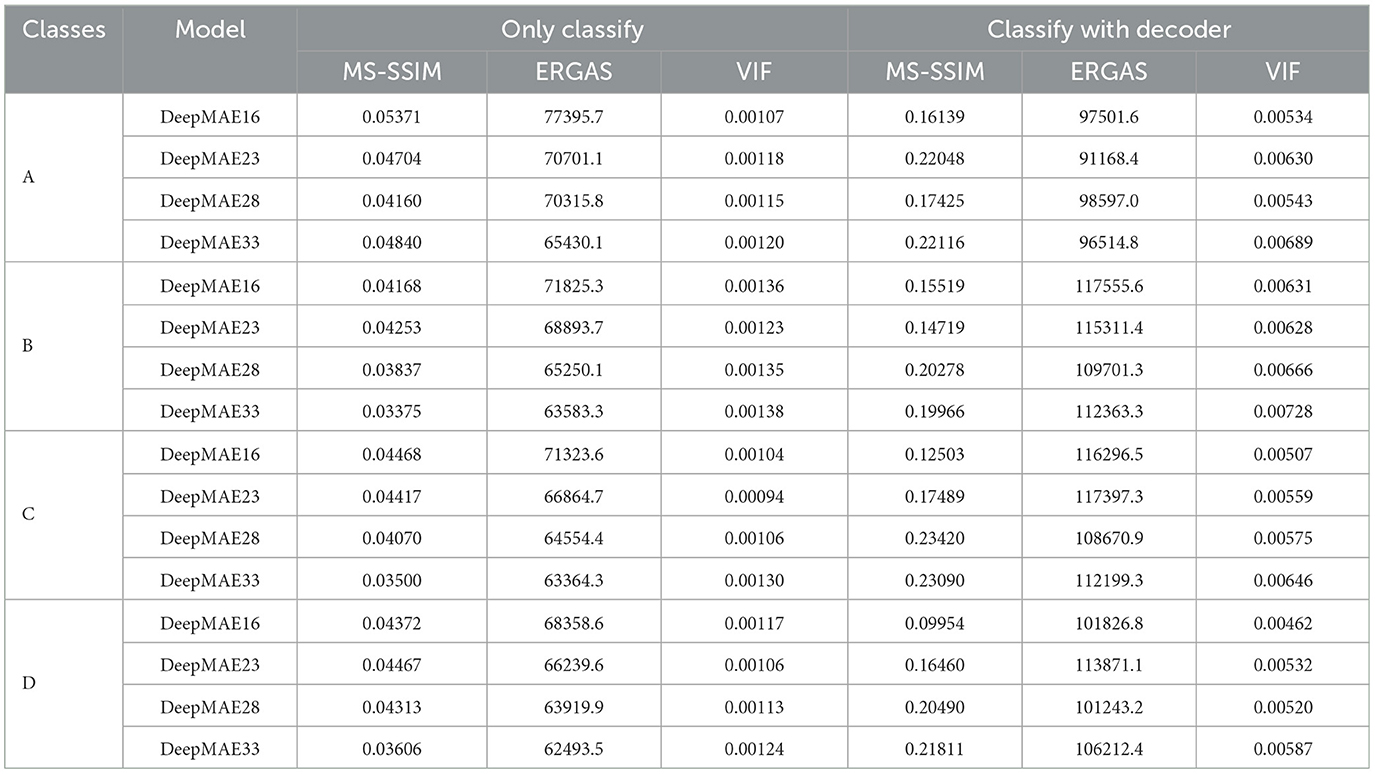
Table 5. On the comparison of “classification only” and “classification and feature reconstruction” to the quality of the reconstructed images.
3.3.5. Comparing DEEPMAE with popular models
From the accuracy performance of each model in the validation set (Figure 6), it is easy to see that the MobileNetV3 and VGG19 models performed average level. They were slow to optimize, and their final accuracy was just over 80%. The remaining models, such as Alexnet, SqueezeNet, and EfficientNet, have high recognition and stable performance and have the advantage of fast convergence of the convolution operation.
The VIT and MAE models, which are representatives of Transformer, performed smoothly, with VIT reaching a maximum accuracy of 94.04% at the 95th epoch and MAE a maximum accuracy of 94.36%, which is not too far from the recognition of CNN models such as EfficientNet. In addition, the Transformer model has high accuracy from the beginning and gradually becomes more accurate afterwards. That is because the Transformer model uses initialized parameters, whereas the CNN models have random parameters. Initialization of the Transformer models was necessary, but this did not affect comparing the results with the CNN models. The DEEPMAE model outperformed the above models, reaching a maximum accuracy of 96.14% in the 89th epoch, which was significantly higher than the other models.
Regarding the curves (Figure 6B), DEEPMAE shows relatively large amplitudes in the first 60 epochs and only slight oscillations afterwards. The curves still tend to increase and do not reach a bottleneck in the model's performance within 100 epochs. Regarding the performance of the models on the validation set, DEEPMAE outperforms the common ANNs and does not lose out on the CNN models in classification recognition. In addition, DEEPMAE is a sets of networks that can be effortlessly extended and fine-tuned both in terms of depth and width. Moreover, due to the global associate nature of MHSA, the connections between the layers are more adjustable than those of CNNs.
3.3.6. Compare DEEPMAE with the backbones of DEEPMAE
The original MAE in experiments is constructed by Encoder and Decoder, which are purely stacked STB blocks. The Encoder and Decoder are pre-trained for 300 epochs, then the trained Encoder parameters are loaded and trained for classification. Because there is no generic hickory nuts dataset at the scale of ImageNet, we use the same dataset for the pre-training and classification process, also called self pre-training by Zhou et al. (2022). So MAE migrates from more extended pre-training weights in the classification process rather than using parameter initialization (Glorot and Bengio, 2010; He et al., 2015). As a result, MAE achieves an initial accuracy of over 90% on the validation set, which is far ahead of other models. However, MAE with the self pre-training approach does not improve the results significantly on the classification task, meaning that the MAE model still relies heavily on the pre-training image reconstruction process to update model parameters. Although the comparison in Figure 6 is “unfair,” pre-training based on image reconstruction is a robust functionality of MAE, so the DEEPMAE model also retains the Decoder to reconstruct images.
The MAE has precisely the same number of parameters as the VIT with the same structure during classification training. However, because the former randomly masks a certain proportion of the input patches, the original MAE's encoder input only accounts for a quarter of the initial data volume. It is faster and more accurate than the latter. In addition, the DEEPMAE model has more feature information and less redundancy for the Encoder's input of low-level features compared to the original image. Hence, DEEPMAE sets a lower masking ratio than MAE, with a masking ratio of 50%.
The confusion matrices of MAE (Figure 9A) and VIT (Figure 9B) on the test set show that both distinguish A images nearly completely. However, the MAE model misclassifies B images as A more often. Misclassification between B, C, and D is also inevitable with MAE and VIT. However, MAE is better at distinguishing D images. Correspondingly, VIT misidentified images from C and D more than MAE. The main reason for these significant discrimination errors may be the slight differences in the data itself. In addition, there are many similarities in the brightness and color of the hickory nuts kernels images from adjacent experiments. Furthermore, the individual difference in kernels also unavoidably influences the results. That results in some flaws in the image data, so the differences are not absolute and complete and are understandable in agriculture.

Figure 9. Confusion matrices of MAE, VIT, and DEEPMAE on Test Dataset. The test set contains 300 images for each category. The number of predictions is shown in the column and the number of true labels is in the row. (A) The confusion matrix of MAE. (B) The confusion matrix of VIT. (C) The confusion matrix of DEEPMAE.
According to DEEPMAE's confusion matrix on the test set (Figure 9C), A images were correctly classified. It also had the lowest level of misclassification of the three above models. Also most noticeable was the significant enhancement in DEEPMAE's discrimination of C and D images. That is due to DEEPMAE being the most adept of the three models at distinguishing between C and D images. From the results, DEEPMAE is as good as MAE at identifying D, VIT at identifying B, and slightly better than both for A and C. Compared to the backbone model DEEPMAE learns more critical distinguishing features.
The specific results of MAE, VIT and DEEPMAE on the test set were compared quantitatively to objectively evaluate their performance without bias (Table 6). The MAE pre-trained model contains both Encoder and Decoder with ~140 M parameters. At the same time, the MAE inference process has the same number of model parameters as VIT, 114.767 M, and the DEEPMAE, which also contains both Encoder and Decoder processes, has only 35% of the parameters of MAE and 43% of VIT. The macs (Multiply-Accumulate Operations) of DEEPMAE are only one-third of those of VIT. In terms of the accuracy of the test set, DEEPMAE reached 96.4%, higher than MAE and VIT by 2.6 and 1.6%, respectively. In addition, DEEPMAE outperformed MAE and VIT in terms of average Precision, Recall, Specificity and F1 Score.
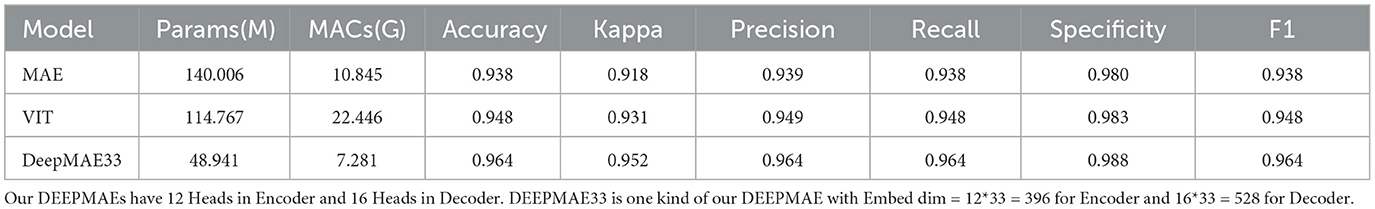
Table 6. The evaluation of three models.
3.4. What features learned by DEEPMAE
Due to the “black box” problem of the deep learning model, this paper examines whether the features extracted by our model match the changes in the image appearance. We introduce an algorithm for aggregating images. According to this algorithm, this paper performs the corresponding aggregation operations on the L-value and b-value of the original images to demonstrate that these two values are the key factors that affect the model's differentiation of the kernels' images.
The β of our aggregation function is specified separately for each experiment for L-value and b-value, e.g., the β for A images with L-value is 47, and the rest of the experiments have β corresponding to Figure 5. The chromaticity change of enhanced images is represented in the same way as in Figure 5.
After image enhancement, the L-values of the four experiments become more aggregated and distinguishable (Figures 10A, C). In addition, the L-values of the enhanced B and C images are slightly more discernible than those of the original images. Also, the b-values of the enhanced images are more aggregated (Figures 10B, D). Compared to the statistical distribution in Figure 5, the images processed by the aggregation algorithm are significantly different from the previous because of the more significant differentiation of brightness and color.
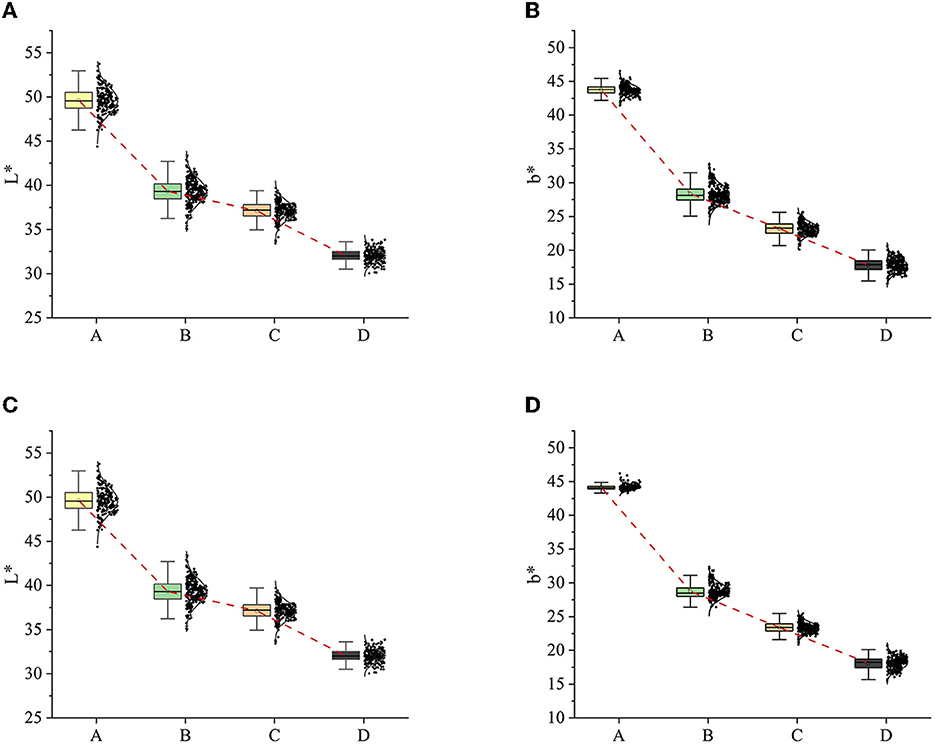
Figure 10. L-values and b-values distribution of images after aggregation. (A) L-values distribution after AL*. (B) b-values distribution after Ab*. (C) L-values distribution after AL*b*. (D) b-values distribution after AL*b*.
We trained DEEPMAE on the original dataset and tested it on the aggregated datasets AL, Ab, and ALb. Despite the discrepancies between the original and aggregated datasets, the DEEPMAE still register some effectiveness in the test datasets. The correlation between the distribution of L-values and b-values in Figure 5 and the classification results in the confusion matrix is apparent, for instance, the overlapping areas of the distribution led to poorer performance on the AL, Ab, and ALb datasets. It shows that the range of L-values of D in AL is much smaller than in Figure 5A, resulting in images of D being largely misclassified as adjacent C. The ranges of b-values of B, C, and D are closely linked, indicating that C of Figure 11 was misclassified as B and D. After adjusting the L-value or b-value of images, the results of DEEPMAE demonstrated a strong relationship between the data distribution and the classification effect, indicating that the L-value or b-value characteristics are of great importance for the classification process of DEEPMAE. These values appear to be the main features learned by DEEPMAE to distinguish walnuts, such as their appearance brightness and color. The heat map of the features learned by DEEPMAE also confirms this conclusion (Figure 12).
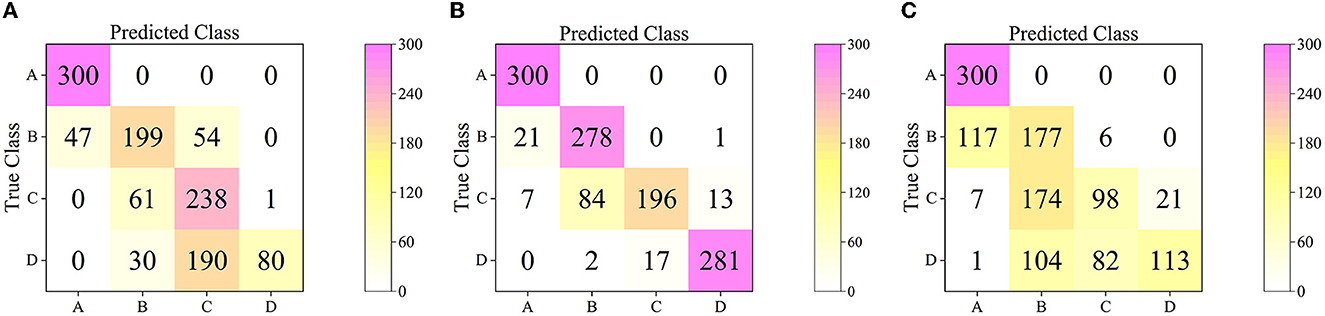
Figure 11. The confusion matrices of DEEPMAE on AL*, Ab*, and AL*b* test datasets. (A) AL*; (B) Ab*; (C) AL*b*.
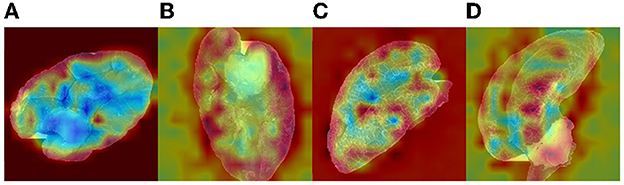
Figure 12. The heat map of the features learned by DEEPMAE.
4. Conclusions
This study explores the link between changes in the physiological quality and appearance of hickory nuts kernels. It uses hickory nuts oxidation as the starting point and verifies through literature and experiments that oxidative changes in hickory nuts during storage cause changes in the brightness and color of the kernels. The aim of this paper is to use deep learning model optimization to distinguish nuts with different levels of oxidation and rancidity. The DEEPMAE model, a lighter deep learning model based on MAE, is designed to learn more key distinguishing features to help differentiate between varying levels of oxidation in hickory nuts. In particular, the antioxidant capacity of the nuts resulted in a slight change in the rate of browning during storage. Our DEEPMAE could distinguish hickory nuts based on the essential characteristics learned.
The results indicate that DEEPMAE achieves 96.14% accuracy on the validation set for the first 100 epochs of training and still tends to increase after that. With deeper DEEPMAE and more feature learning, it can exceed 97% accuracy on both the validation and test sets at the 240th epoch. In addition, by aggregating information from image samples, we have confirmed that the critical features learned by DEEPMAE are precisely the brightness and color of the appearance of kernels. That is the same conclusion we obtained from our physiological experiments on hickory nuts. Additionally, this paper carries out ablation experiments to confirm its efficiency from three main improvement points. Furthermore, we illustrate some differences in the topology of DEEPMAE and CNNs. In comparison, DEEPMAE shows greater flexibility, effectiveness and scalability than that of CNNs.
This study provides an accurate and valid method for distinguishing the degree of oxidative rancidity in hickory nuts. In the future, we will focus our research on the applicability of the method, longer-term hickory nuts oxidation processes, and reflections on other physiological manifestations of hickory nuts.
Data availability statement
The raw data supporting the conclusions of this article will be made available by the authors, without undue reservation.
Author contributions
HK, DD, and JZ planned and designed the experiment. HK conducted the experiment. HK, DD, JZ, ZL, SC, and LD analyzed the data and drafted the manuscript with input from DD and JZ. All authors contributed to the article and approved the submitted version.
Funding
This research was funded by the National Youth Science Foundation of China (42001354), the Zhejiang Province Basic Public Welfare Research Program (LGN18C130003), the National Innovation and Entrepreneurship Training Program for College Students (202010341067), the National Innovation and Entrepreneurship Training Program for College Students (202210341031), and the Zhejiang Province Education Department Scientific Research Project (Y202250121).
Conflict of interest
The authors declare that the research was conducted in the absence of any commercial or financial relationships that could be construed as a potential conflict of interest.
Publisher's note
All claims expressed in this article are solely those of the authors and do not necessarily represent those of their affiliated organizations, or those of the publisher, the editors and the reviewers. Any product that may be evaluated in this article, or claim that may be made by its manufacturer, is not guaranteed or endorsed by the publisher.
References
Alamprese, C., Grassi, S., Tugnolo, A., and Casiraghi, E. (2021). Prediction of olive ripening degree combining image analysis and FT-NIR spectroscopy for virgin olive oil optimisation. Food Control 123:107755. doi: 10.1016/j.foodcont.2020.107755
Antonelli, A., Cocchi, M., Fava, P., Foca, G., Franchini, G. C., Manzini, D., et al. (2004). Automated evaluation of food colour by means of multivariate image analysis coupled to a wavelet-based classification algorithm. Anal. Chim. Acta 515, 3–13. doi: 10.1016/j.aca.2004.01.005
Ashtiani, S.-H. M., Javanmardi, S., Jahanbanifard, M., Martynenko, A., and Verbeek, F. J. (2021). Detection of mulberry ripeness stages using deep learning models. IEEE Access 9, 100380–100394. doi: 10.1109/ACCESS.2021.3096550
Bernardes, R. C., De Medeiros, A., da Silva, L., Cantoni, L., Martins, G. F., Mastrangelo, T., et al. (2022). Deep-learning approach for fusarium head blight detection in wheat seeds using low-cost imaging technology. Agriculture 12:1801. doi: 10.3390/agriculture12111801
Beyhan, O., Ozcan, A., Ozcan, H., Kafkas, N., Kafkas, S., Sutyemez, M., et al. (2017). Fat, fatty acids and tocopherol content of several walnut genotypes. Notulae Botan. Horti Agrobot. Cluj-Napoca 45, 437–441. doi: 10.15835/nbha45210932
Bi, C., Hu, N., Zou, Y., Zhang, S., Xu, S., and Yu, H. (2022). Development of deep learning methodology for maize seed variety recognition based on improved swin transformer. Agronomy 12:1843. doi: 10.3390/agronomy12081843
Bonifazi, G., Capobianco, G., Gasbarrone, R., and Serranti, S. (2021). Contaminant detection in pistachio nuts by different classification methods applied to short-wave infrared hyperspectral images. Food Control 130:108202. doi: 10.1016/j.foodcont.2021.108202
Chatrabnous, N., Yazdani, N., and Vahdati, K. (2018). Determination of nutritional value and oxidative stability of fresh walnut. J. Nuts 9, 11–20. doi: 10.22034/jon.2018.540862
Chen, L., Ma, Q., Chen, Y., Wang, B., and Pei, D. (2014). Identification of major walnut cultivars grown in China based on nut phenotypes and SSR markers. Sci. Hortic. 168, 240–248. doi: 10.1016/j.scienta.2014.02.004
Chen, S., Dai, D., Zheng, J., Kang, H., Wang, D., Zheng, X., et al. (2022a). Intelligent grading method for walnut kernels based on deep learning and physiological indicators. Front. Nutr. 9:1075781. doi: 10.3389/fnut.2022.1075781
Chen, S., Dai, D., Zheng, J., Zheng, X., Kang, H., Mo, J., et al. (2022b). Research on kernel grade classification of linan Carya cathayensis sarg based on improved resnet152v2 model. J. Chinese Cereals Oils Assoc. 38, 1–17.
Cohen, J. (1960). A coefficient of agreement for nominal scales. Educ. Psychol. Measure. 20, 37–46. doi: 10.1177/001316446002000104
Dosovitskiy, A., Beyer, L., Kolesnikov, A., Weissenborn, D., Zhai, X., Unterthiner, T., et al. (2020). An image is worth 16x16 words: transformers for image recognition at scale. arXiv [Preprint]. arXiv:2010.11929. doi: 10.48550/arXiv.2010.11929
Ercisli, S., Sayinci, B., Kara, M., Yildiz, C., and Ozturk, I. (2012). Determination of size and shape features of walnut (Juglans regia l.) cultivars using image processing. Sci. Hortic. 133, 47–55. doi: 10.1016/j.scienta.2011.10.014
Fernández-Vázquez, R., Stinco, C. M., Meléndez-Martínez, A. J., Heredia, F. J., and Vicario, I. M. (2011). Visual and instrumental evaluation of orange juice color: a consumers' preference study. J. Sens. Stud. 26, 436–444. doi: 10.1111/j.1745-459X.2011.00360.x
Garillos-Manliguez, C. A., and Chiang, J. Y. (2021). Multimodal deep learning and visible-light and hyperspectral imaging for fruit maturity estimation. Sensors 21:1288. doi: 10.3390/s21041288
Giraudo, A., Calvini, R., Orlandi, G., Ulrici, A., Geobaldo, F., and Savorani, F. (2018). Development of an automated method for the identification of defective hazelnuts based on rgb image analysis and colourgrams. Food Control 94, 233–240. doi: 10.1016/j.foodcont.2018.07.018
Glorot, X., and Bengio, Y. (2010). “Understanding the difficulty of training deep feedforward neural networks,” in Proceedings of the Thirteenth International Conference on Artificial Intelligence and Statistics, 249–256.
Guo, J., Han, K., Wu, H., Tang, Y., Chen, X., Wang, Y., et al. (2022). “CMT: convolutional neural networks meet vision transformers,” in Proceedings of the IEEE/CVF Conference on Computer Vision and Pattern Recognition (New Orleans, LA), 12175–12185. doi: 10.1109/CVPR52688.2022.01186
Han, K., Wang, Y., Chen, H., Chen, X., Guo, J., Liu, Z., et al. (2020). A survey on visual transformer. arXiv [Preprint]. arXiv:2012.12556. doi: 10.48550/arXiv.2012.12556
He, K., Chen, X., Xie, S., Li, Y., Dollár, P., and Girshick, R. (2022). “Masked autoencoders are scalable vision learners,” in Proceedings of the IEEE/CVF Conference on Computer Vision and Pattern Recognition (New Orleans, LA), 16000–16009. doi: 10.1109/CVPR52688.2022.01553
He, K., Zhang, X., Ren, S., and Sun, J. (2015). “Delving deep into rectifiers: surpassing human-level performance on imagenet classification,” in Proceedings of the IEEE International Conference on Computer Vision (Santiago), 1026–1034. doi: 10.1109/ICCV.2015.123
Howard, A., Sandler, M., Chu, G., Chen, L.-C., Chen, B., Tan, M., et al. (2019). “Searching for mobilenetv3,” in Proceedings of the IEEE/CVF International Conference on Computer Vision (Seoul), 1314–1324. doi: 10.1109/ICCV.2019.00140
Huang, C., Li, Y., Wang, K., Xi, J., Xu, Y., Si, X., et al. (2022). Analysis of lipidomics profile of Carya cathayensis nuts and lipid dynamic changes during embryonic development. Food Chem. 370:130975. doi: 10.1016/j.foodchem.2021.130975
Iandola, F. N., Han, S., Moskewicz, M. W., Ashraf, K., Dally, W. J., and Keutzer, K. (2016). Squeezenet: Alexnet-level accuracy with 50x fewer parameters and < 0.5 mb model size. arXiv [Preprint]. arXiv:1602.07360. doi: 10.48550/arXiv.1602.07360
Ioffe, S., and Szegedy, C. (2015). “Batch normalization: accelerating deep network training by reducing internal covariate shift,” in International Conference on Machine Learning (Lille), 448–456.
Javanmardi, S., Ashtiani, S.-H. M., Verbeek, F. J., and Martynenko, A. (2021). Computer-vision classification of corn seed varieties using deep convolutional neural network. J. Stor. Prod. Res. 92:101800. doi: 10.1016/j.jspr.2021.101800
Jiang, L., Xiao, H., Xu, H., and Zhang, W. (2012). Research progress in oxidative rancidity of walnut and delay measures. Food Sci. 33, 272–276. doi: 10.7506/spkx1002-6630-201203057
Karl Pearson, F. R. S. (1904). Mathematical Contributions to the Theory of Evolution. London: Dulau and Co.
Krizhevsky, A., Sutskever, I., and Hinton, G. E. (2017). Imagenet classification with deep convolutional neural networks. Commun. ACM 60, 84–90. doi: 10.1145/3065386
Kubow, S. (1992). Routes of formation and toxic consequences of lipid oxidation products in foods. Free Radic. Biol. Med. 12, 63–81. doi: 10.1016/0891-5849(92)90059-P
Kurt, C. (2018). Variation in oil content and fatty acid composition of sesame accessions from different origins. Grasas Aceites 69:e241. doi: 10.3989/gya.0997171
Labatut, V., and Cherifi, H. (2012). Accuracy measures for the comparison of classifiers. arXiv [Preprint]. arXiv:1207.3790. doi: 10.48550/arXiv.1207.3790
LeCun, Y., Bengio, Y., and Hinton, G. (2015). Deep learning. Nature 521, 436–444. doi: 10.1038/nature14539
Li, J., Xia, X., Li, W., Li, H., Wang, X., Xiao, X., et al. (2022). Next-VIT: next generation vision transformer for efficient deployment in realistic industrial scenarios. arXiv [Preprint]. arXiv:2207.05501. doi: 10.48550/arXiv.2207.05501
Li, J., Zhao, H., Zhu, S., Huang, H., Miao, Y., and Jiang, Z. (2021). An improved lightweight network architecture for identifying tobacco leaf maturity based on deep learning. J. Intell. Fuzzy Syst. 1–10. doi: 10.3233/JIFS-210640
Li, X., Chen, X., Yang, J., and Li, S. (2022). Transformer helps identify kiwifruit diseases in complex natural environments. Comput. Electron. Agric. 200:107258. doi: 10.1016/j.compag.2022.107258
Liming, X., and Yanchao, Z. (2010). Automated strawberry grading system based on image processing. Comput. Electron. Agric. 71, S32–S39. doi: 10.1016/j.compag.2009.09.013
Liu, Z., Mao, H., Wu, C. Y., Feichtenhofer, C., Darrell, T., and Xie, S. (2022). “A convnet for the 2020s,” in Proceedings of the IEEE/CVF Conference on Computer Vision and Pattern Recognition, 11976–11986. doi: 10.1109/CVPR52688.2022.01167
López-Uriarte, P., Bulló, M., Casas-Agustench, P., Babio, N., and Salas-Salvadó, J. (2009). Nuts and oxidation: a systematic review. Nutr. Rev. 67, 497–508. doi: 10.1111/j.1753-4887.2009.00223.x
Loshchilov, I., and Hutter, F. (2017). Decoupled weight decay regularization. arXiv [Preprint]. arXiv:1711.05101. doi: 10.48550/arXiv.1711.05101
Lu, A., Guo, R., Ma, Q., Ma, L., Cao, Y., and Liu, J. (2022). Online sorting of drilled lotus seeds using deep learning. Biosyst. Eng. 221, 118–137. doi: 10.1016/j.biosystemseng.2022.06.015
Mukasa, P., Wakholi, C., Faqeerzada, M. A., Amanah, H. Z., Kim, H., Joshi, R., et al. (2022). Nondestructive discrimination of seedless from seeded watermelon seeds by using multivariate and deep learning image analysis. Comput. Electron. Agric. 194:106799. doi: 10.1016/j.compag.2022.106799
Narayanankutty, A., Illam, S. P., and Raghavamenon, A. C. (2018). Health impacts of different edible oils prepared from coconut (Cocos nucifera): a comprehensive review. Trends Food Sci. Technol. 80, 1–7. doi: 10.1016/j.tifs.2018.07.025
Nasiri, A., Taheri-Garavand, A., and Zhang, Y.-D. (2019). Image-based deep learning automated sorting of date fruit. Postharv. Biol. Technol. 153, 133–141. doi: 10.1016/j.postharvbio.2019.04.003
Orlandi, G., Calvini, R., Foca, G., and Ulrici, A. (2018). Automated quantification of defective maize kernels by means of multivariate image analysis. Food Control 85, 259–268. doi: 10.1016/j.foodcont.2017.10.008
Ortiz, C. M., Vicente, A. R., Fields, R. P., Grilo, F., Labavitch, J. M., Donis-Gonzalez, I., et al. (2019). Walnut (Juglans regia l.) kernel postharvest deterioration as affected by pellicle integrity, cultivar and oxygen concentration. Postharv. Biol. Technol. 156:110948. doi: 10.1016/j.postharvbio.2019.110948
Pang, L., Wang, J., Lu, X., Zheng, J., Cheng, J., Zhang, Y., et al. (2019). Detection models of aging index of walnutcarya cathayensis sarg based on electronic nose technology. Chin. J. Sens. Actuat. 32, 1303–1307.
Pang, L., Wang, J., Wang, Y., Wu, C., and He, Z. (2011). Discrimination of aging time of walnut (Carya cathayensis sarg) by electronic nose. Chin. J. Sens. Actuat. 24, 928–933.
Reedha, R., Dericquebourg, E., Canals, R., and Hafiane, A. (2022). Transformer neural network for weed and crop classification of high resolution UAV images. Remote Sensing 14:592. doi: 10.3390/rs14030592
Rodríuez-Pulido, F. J., Gordillo, B., Heredia, F. J., and González-Miret, M. L. (2021). Cielab-spectral image matching: an app for merging colorimetric and spectral images for grapes and derivatives. Food Control 125:108038. doi: 10.1016/j.foodcont.2021.108038
Saranya, N., Srinivasan, K., and Kumar, S. (2022). Banana ripeness stage identification: a deep learning approach. J. Ambient Intell. Human. Comput. 13, 4033–4039. doi: 10.1007/s12652-021-03267-w
Shamsabadi, A. S., Oh, C., and Cavallaro, A. (2020). “EdgeFool: an adversarial image enhancement filter,” in ICASSP 2020-2020 IEEE International Conference on Acoustics, Speech and Signal Processing (ICASSP) (Barcelona), 1898–1902. doi: 10.1109/ICASSP40776.2020.9054368
Sheikh, H., and Bovik, A. (2004). “Image information and visual quality,” in IEEE International Conference on Acoustics, Speech, and Signal Processing, Vol. 3 (Montreal, QC), iii–709. doi: 10.1109/ICASSP.2004.1326643
Simonyan, K., and Zisserman, A. (2014). Very deep convolutional networks for large-scale image recognition. arXiv [Preprint]. arXiv:1409.1556. doi: 10.48550/arXiv.1409.1556
Solak, S., and Altinişik, U. (2018). A new method for classifying nuts using image processing and k-means++ clustering. J. Food Process Eng. 41:e12859. doi: 10.1111/jfpe.12859
Su, Z., Zhang, C., Yan, T., Zhu, J., Zeng, Y., Lu, X., et al. (2021). Application of hyperspectral imaging for maturity and soluble solids content determination of strawberry with deep learning approaches. Front. Plant Sci. 2021:1897. doi: 10.3389/fpls.2021.736334
Tan, M., and Le QV, E. (2020). Rethinking model scaling for convolutional neural networks. arXiv [Preprint]. arXiv:1905.11946. doi: 10.48550/arXiv.1905.11946
Wald, L. (2000). “Quality of high resolution synthesised images: is there a simple criterion?,” in Third Conference Fusion of Earth Data: Merging Point Measurements, Raster Maps and Remotely Sensed Images (Sophia Antipolis), 99–103.
Wang, Z., Simoncelli, E., and Bovik, A. (2003). “Multiscale structural similarity for image quality assessment,” in The Thrity-Seventh Asilomar Conference on Signals, Systems & Computers, 2003, Vol. 2 (Pacific Grove, CA), 1398–1402. doi: 10.1109/ACSSC.2003.1292216
Xiao, T., Singh, M., Mintun, E., Darrell, T., Dollár, P., and Girshick, R. (2021). Early convolutions help transformers see better. Adv. Neural Inform. Process. Syst. 34, 30392–30400. doi: 10.48550/arXiv.2106.14881
Yang, X., Jia, X., Xu, M., Mo, Z., Jia, Z., Lou, W., et al. (2022). Study on the physiological mechanism of postharvest seed coat browning of pecan. J. Fruit Sci. 39, 1701–1709. doi: 10.13925/j.cnki.gsxb.20220077
Yuan, K., Guo, S., Liu, Z., Zhou, A., Yu, F., and Wu, W. (2021). “Incorporating convolution designs into visual transformers,” in Proceedings of the IEEE/CVF International Conference on Computer Vision (Montreal, QC), 559–568. doi: 10.1109/ICCV48922.2021.00062
Zhang, L., Jia, J., Gui, G., Hao, X., Gao, W., and Wang, M. (2018). Deep learning based improved classification system for designing tomato harvesting robot. IEEE Access 6, 67940–67950. doi: 10.1109/ACCESS.2018.2879324
Zhang, S., Zhang, S., Zhang, C., Wang, X., and Shi, Y. (2019). Cucumber leaf disease identification with global pooling dilated convolutional neural network. Comput. Electron. Agric. 162, 422–430. doi: 10.1016/j.compag.2019.03.012
Zhenggang, X., Zhiru, C., Haoran, Y., Chaoyang, L., Zhao, Y., Deyi, Y., et al. (2021). The physicochemical properties and fatty acid composition of two new woody oil resources: camellia hainanica seed oil and camellia sinensis seed oil. CyTA-J. Food 19, 208–211. doi: 10.1080/19476337.2021.1879936
Zhou, D., Kang, B., Jin, X., Yang, L., Lian, X., Jiang, Z., et al. (2021). Deepvit: towards deeper vision transformer. arXiv [Preprint]. arXiv:2103.11886. doi: 10.48550/arXiv.2103.11886
Keywords: hickory nuts, oxidation levels, image classification, masked autoencoders, vision transformer, self-supervised, supervised
Citation: Kang H, Dai D, Zheng J, Liang Z, Chen S and Ding L (2023) Identification of hickory nuts with different oxidation levels by integrating self-supervised and supervised learning. Front. Sustain. Food Syst. 7:1144998. doi: 10.3389/fsufs.2023.1144998
Received: 15 January 2023; Accepted: 14 February 2023;
Published: 08 March 2023.
Edited by:
Chu Zhang, Huzhou University, ChinaReviewed by:
Seyed-Hassan Miraei Ashtiani, Ferdowsi University of Mashhad, IranSoumyajit Mandal, Brookhaven National Laboratory (DOE), United States
Copyright © 2023 Kang, Dai, Zheng, Liang, Chen and Ding. This is an open-access article distributed under the terms of the Creative Commons Attribution License (CC BY). The use, distribution or reproduction in other forums is permitted, provided the original author(s) and the copyright owner(s) are credited and that the original publication in this journal is cited, in accordance with accepted academic practice. No use, distribution or reproduction is permitted which does not comply with these terms.
*Correspondence: Dan Dai, Ym9hdGRyaXZlckAxNjMuY29t; Jian Zheng, NDAzNjcxNDE5QHFxLmNvbQ==